Embed Size (px)
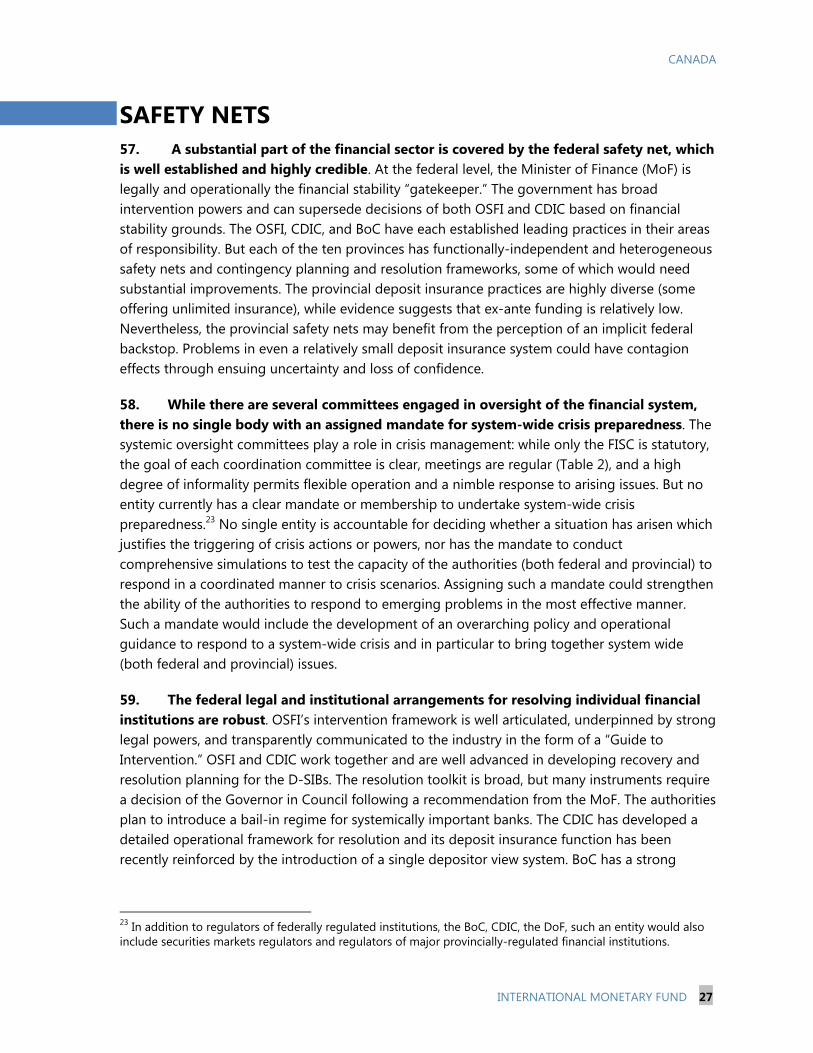
Citation preview
© 2014 International Monetary Fund
IMF Country Report No. 14/29
CANADA Financial Sector Stability Assessment This financial sector stability assessment on Canada was prepared by a staff team of the International Monetary Fund as background documentation for the periodic consultation with the member country. It is based on the information available at the time it was completed on January 10, 2014. The views expressed in this document are those of the staff team and do not necessarily reflect the views of the government of Canada or the Executive Board of the IMF. The policy of publication of staff reports and other documents by the IMF allows for the deletion of market-sensitive information.
Copies of this report are available to the public from
International Monetary Fund Publication Services
700 19th Street, N.W. Washington, D.C. 20431 Telephone: (202) 623-7430 Telefax: (202) 623-7201
E-mail: [email protected] Internet: http://www.imf.org
Price: $18.00 a copy
International Monetary Fund Washington, D.C.
February 2014
CANADA FINANCIAL SYSTEM STABILITY ASSESSMENT
Approved By Ceyla Pazarbasioglu and Gian Maria Milesi-Ferretti Prepared By Monetary and Capital Markets Department
This report is based on the work of the Financial Sector Assessment Program (FSAP) Update mission that visited Canada in June and September 2013. The FSAP findings were discussed with the authorities during the Article IV Consultation mission in November 2013.
The FSAP team was led by Aditya Narain and comprised Messrs. Simon Gray
(Deputy),Timo Broszeit, Ivo Krznar, James Morsink, Jay Surti, and Mmes. Ana Carvajal, Su Hoong Chang, Oana Nedelescu, Katharine Seal (all MCM) and Mme. Lusine Lusinyan (WHD); and Mme. Heidi Richards and Messrs. Jonathan Fiechter and Ian Tower (MCM Experts).
FSAPs assess the stability of the financial system as a whole and not that of individual institutions. They are intended to help countries identify key sources of systemic risk in the financial sector and implement policies to enhance its resilience to shocks and contagion. Certain categories of risk affecting financial institutions, such as operational or legal risk, or risk related to fraud, are not covered in FSAPs.
Canada is deemed by the Fund to have a systemically important financial sector according to SM/10/235 (9/16/2010), and the stability assessment under this FSAP is part of bilateral surveillance under Article IV of the Fund’s Articles of Agreement.
This report was prepared by Aditya Narain and Simon Gray, with contributions from the members of the FSAP mission.
January 10, 2014
CANADA
2 INTERNATIONAL MONETARY FUND
CONTENTS GLOSSARY ________________________________________________________________________________________ 4
EXECUTIVE SUMMARY AND KEY RECOMMENDATIONS ______________________________________ 6
BACKGROUND AND CONTEXT __________________________________________________________________ 9
A. Macroeconomic Developments and Outlook ___________________________________________________9
B. Overview of the Financial System ________________________________________________________________9
OVERALL STABILITY ASSESSMENT ____________________________________________________________ 11
A. Banking Sector ________________________________________________________________________________ 11
B. Insurance ______________________________________________________________________________________ 12
C. The Housing Sector ____________________________________________________________________________ 14
STRESS TESTS ___________________________________________________________________________________ 15
A. Bank Stress Tests ______________________________________________________________________________ 16
B. Life Insurance Stress Test ______________________________________________________________________ 17
C. Mortgage Insurance Stress Test _______________________________________________________________ 18
D. Next Steps _____________________________________________________________________________________ 18
FINANCIAL SECTOR OVERSIGHT _______________________________________________________________ 19
A. Banking Supervision ___________________________________________________________________________ 19
B. Insurance Supervision _________________________________________________________________________ 21
C. Securities Regulation __________________________________________________________________________ 22
D. Macroprudential Measures ____________________________________________________________________ 25
SAFETY NETS ____________________________________________________________________________________ 27 BOXES 1. Insurance Companies: The Impact of Low Interest Rates ______________________________________ 13 2. Regulatory Structure of the Financial System in Canada _______________________________________ 21 3. Supervisory Intensity and Effectiveness ________________________________________________________ 24 FIGURES 1. Contributions to GDP Growth _________________________________________________________________ 29 2. Financial Sector Structure at end 2012 ________________________________________________________ 29 3. Bank Concentration in Selected OECD Countries ______________________________________________ 30 4. Credit Intermediation and the Role of Banks __________________________________________________ 30
CANADA
INTERNATIONAL MONETARY FUND 3
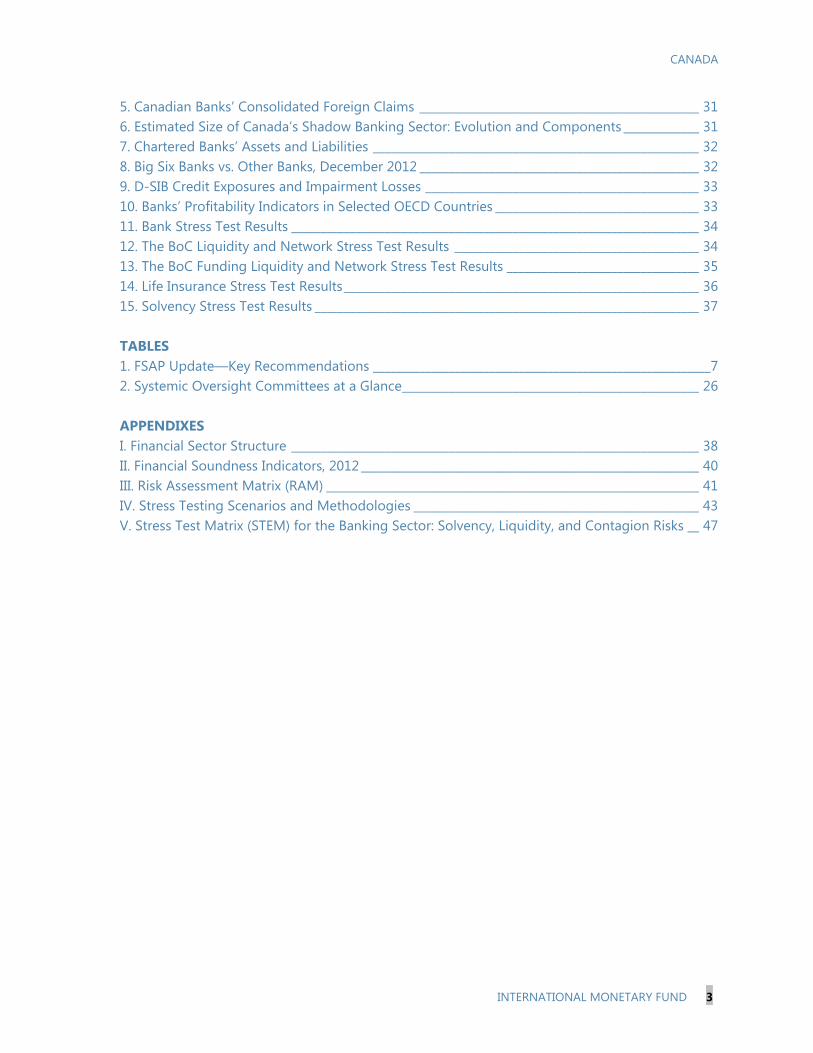
5. Canadian Banks’ Consolidated Foreign Claims ________________________________________________ 31 6. Estimated Size of Canada’s Shadow Banking Sector: Evolution and Components _____________ 31 7. Chartered Banks’ Assets and Liabilities ________________________________________________________ 32 8. Big Six Banks vs. Other Banks, December 2012 ________________________________________________ 32 9. D-SIB Credit Exposures and Impairment Losses _______________________________________________ 33 10. Banks’ Profitability Indicators in Selected OECD Countries ___________________________________ 33 11. Bank Stress Test Results ______________________________________________________________________ 34 12. The BoC Liquidity and Network Stress Test Results __________________________________________ 34 13. The BoC Funding Liquidity and Network Stress Test Results _________________________________ 35 14. Life Insurance Stress Test Results _____________________________________________________________ 36 15. Solvency Stress Test Results __________________________________________________________________ 37 TABLES 1. FSAP Update—Key Recommendations __________________________________________________________7 2. Systemic Oversight Committees at a Glance ___________________________________________________ 26 APPENDIXES I. Financial Sector Structure ______________________________________________________________________ 38 II. Financial Soundness Indicators, 2012 __________________________________________________________ 40 III. Risk Assessment Matrix (RAM) ________________________________________________________________ 41 IV. Stress Testing Scenarios and Methodologies _________________________________________________ 43 V. Stress Test Matrix (STEM) for the Banking Sector: Solvency, Liquidity, and Contagion Risks __ 47
CANADA
4 INTERNATIONAL MONETARY FUND
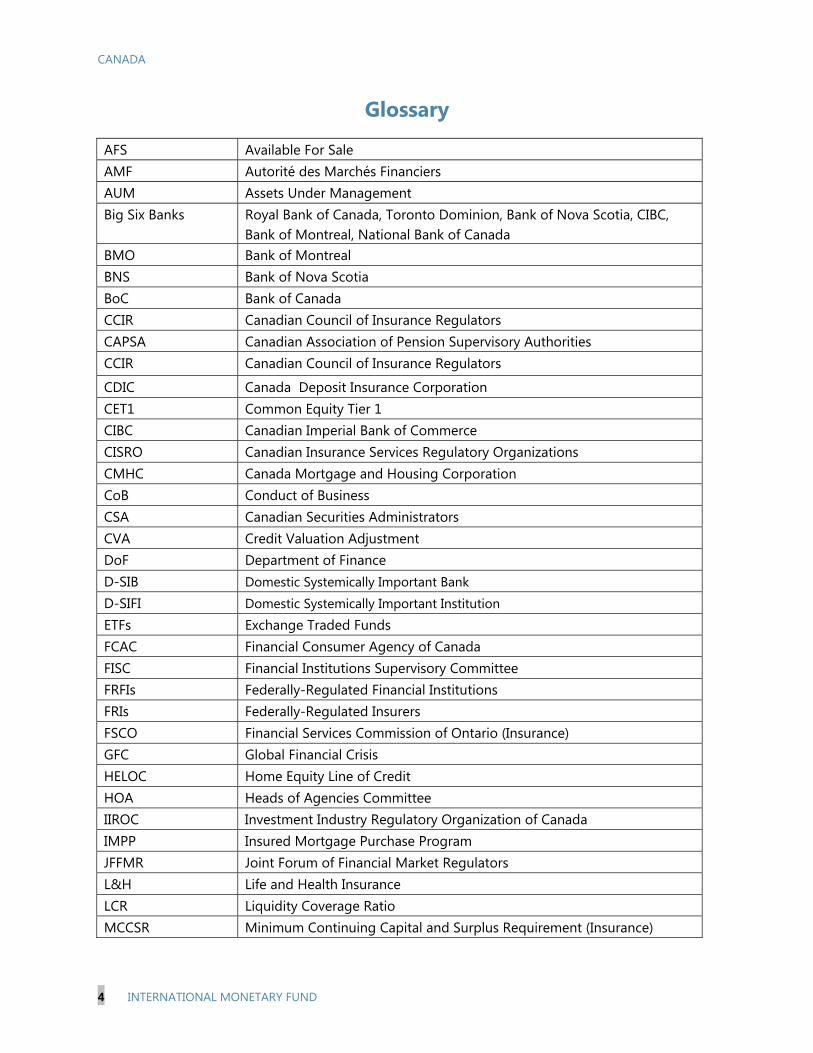
Glossary
AFS Available For Sale AMF Autorité des Marchés Financiers AUM Assets Under Management Big Six Banks Royal Bank of Canada, Toronto Dominion, Bank of Nova Scotia, CIBC,
Bank of Montreal, National Bank of Canada BMO Bank of Montreal BNS Bank of Nova Scotia BoC Bank of Canada CCIR Canadian Council of Insurance Regulators CAPSA Canadian Association of Pension Supervisory Authorities CCIR Canadian Council of Insurance Regulators
CDIC Canada Deposit Insurance Corporation CET1 Common Equity Tier 1 CIBC Canadian Imperial Bank of Commerce CISRO Canadian Insurance Services Regulatory Organizations CMHC Canada Mortgage and Housing Corporation CoB Conduct of Business CSA Canadian Securities Administrators CVA Credit Valuation Adjustment DoF Department of Finance D-SIB Domestic Systemically Important Bank D-SIFI Domestic Systemically Important Institution ETFs Exchange Traded Funds FCAC Financial Consumer Agency of Canada FISC Financial Institutions Supervisory Committee FRFIs Federally-Regulated Financial Institutions FRIs Federally-Regulated Insurers FSCO Financial Services Commission of Ontario (Insurance) GFC Global Financial Crisis HELOC Home Equity Line of Credit HOA Heads of Agencies Committee IIROC Investment Industry Regulatory Organization of Canada IMPP Insured Mortgage Purchase Program JFFMR Joint Forum of Financial Market Regulators L&H Life and Health Insurance LCR Liquidity Coverage Ratio MCCSR Minimum Continuing Capital and Surplus Requirement (Insurance)
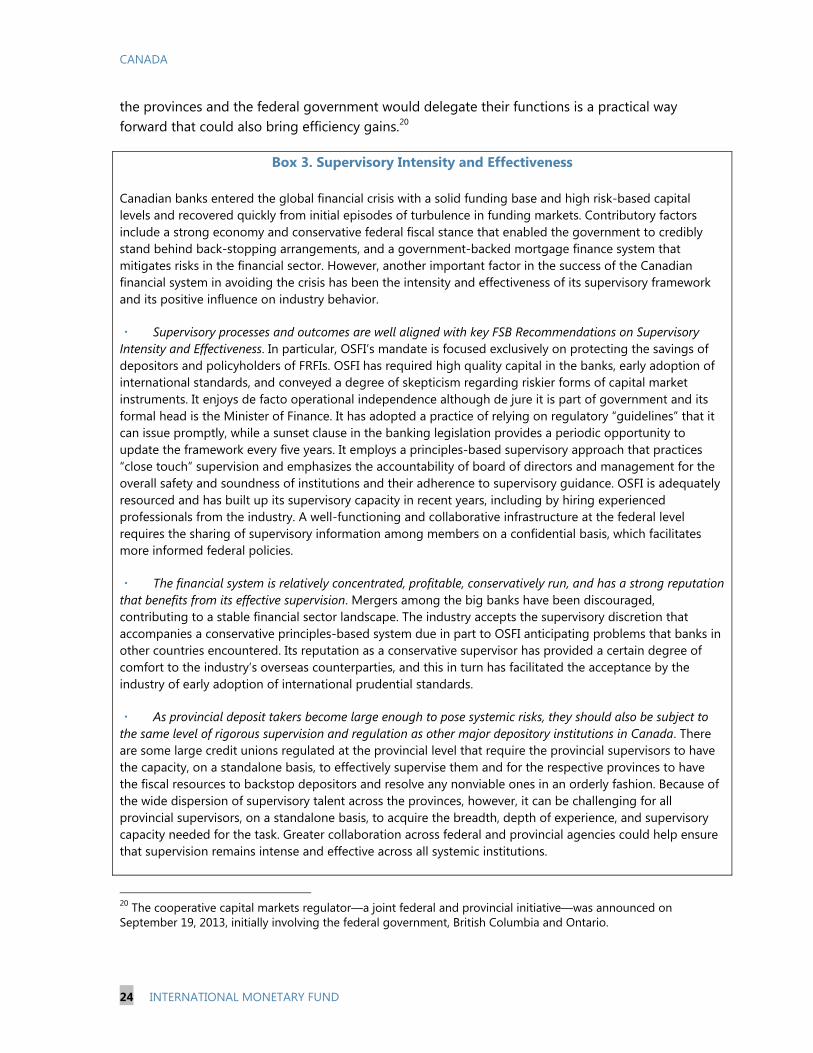
CANADA
INTERNATIONAL MONETARY FUND 5
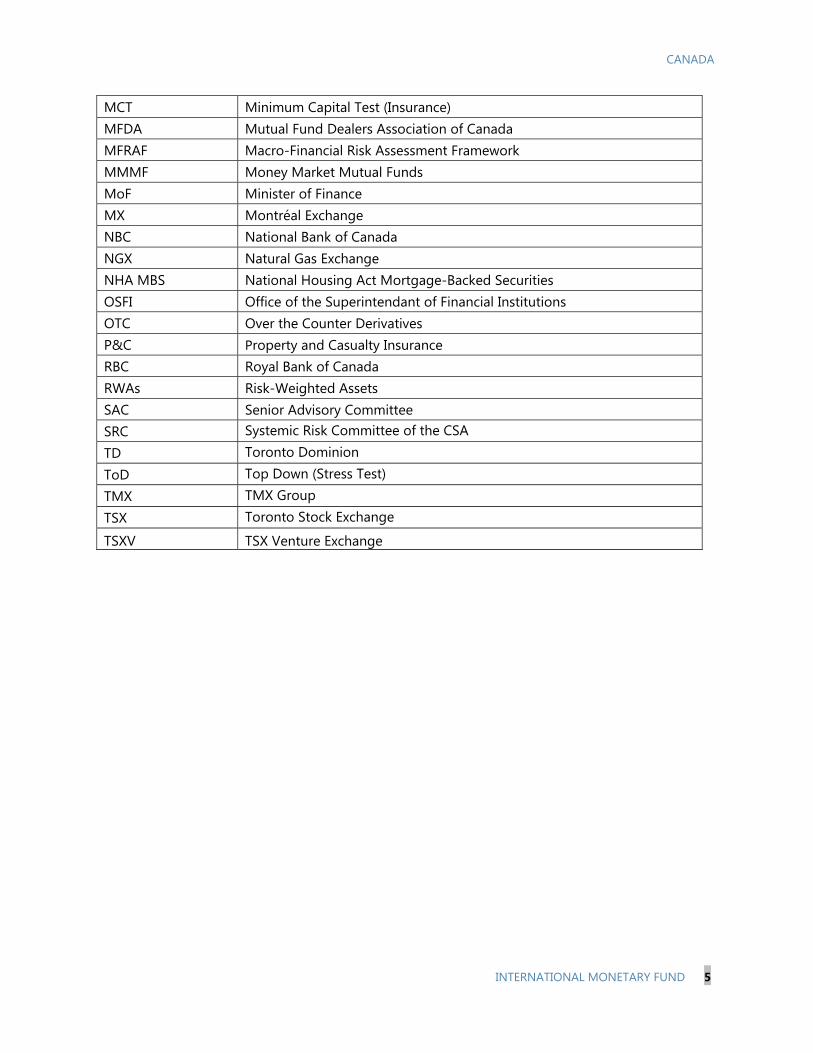
MCT Minimum Capital Test (Insurance) MFDA Mutual Fund Dealers Association of Canada MFRAF Macro-Financial Risk Assessment Framework MMMF Money Market Mutual Funds MoF Minister of Finance MX Montréal Exchange NBC National Bank of Canada NGX Natural Gas Exchange NHA MBS National Housing Act Mortgage-Backed Securities OSFI Office of the Superintendant of Financial Institutions OTC Over the Counter Derivatives P&C Property and Casualty Insurance RBC Royal Bank of Canada RWAs Risk-Weighted Assets SAC Senior Advisory Committee SRC Systemic Risk Committee of the CSA TD Toronto Dominion ToD Top Down (Stress Test) TMX TMX Group TSX Toronto Stock Exchange
TSXV TSX Venture Exchange
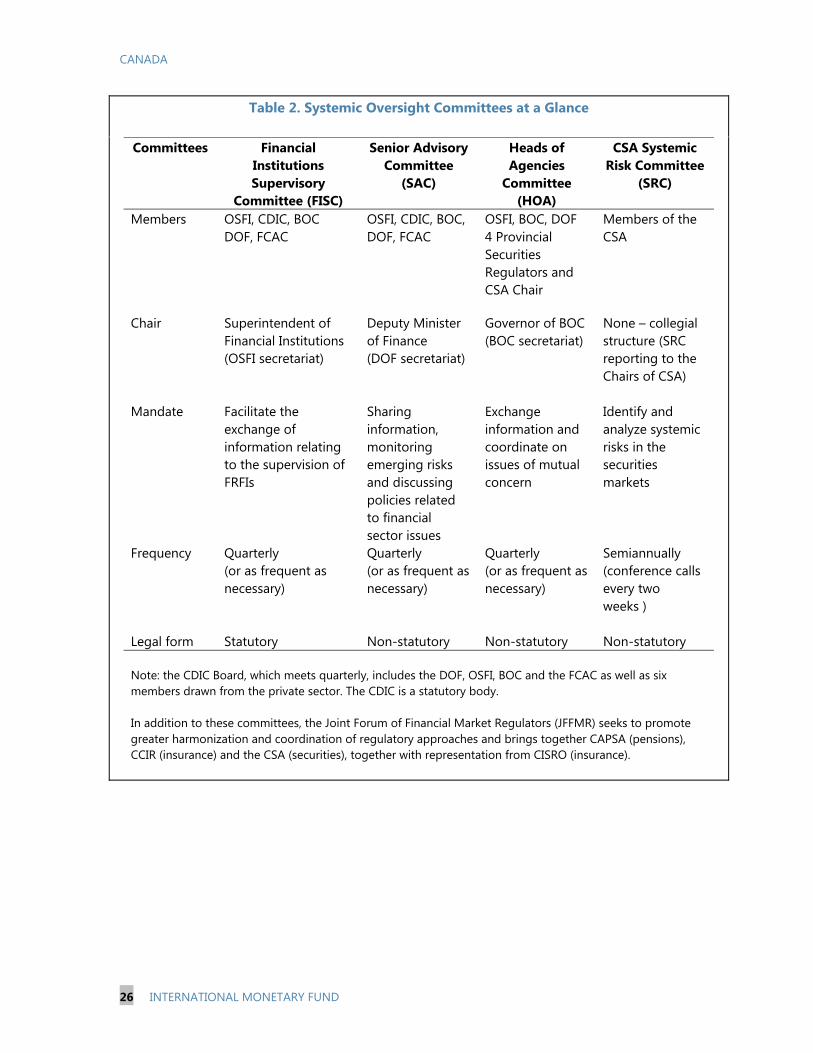
CANADA
6 INTERNATIONAL MONETARY FUND
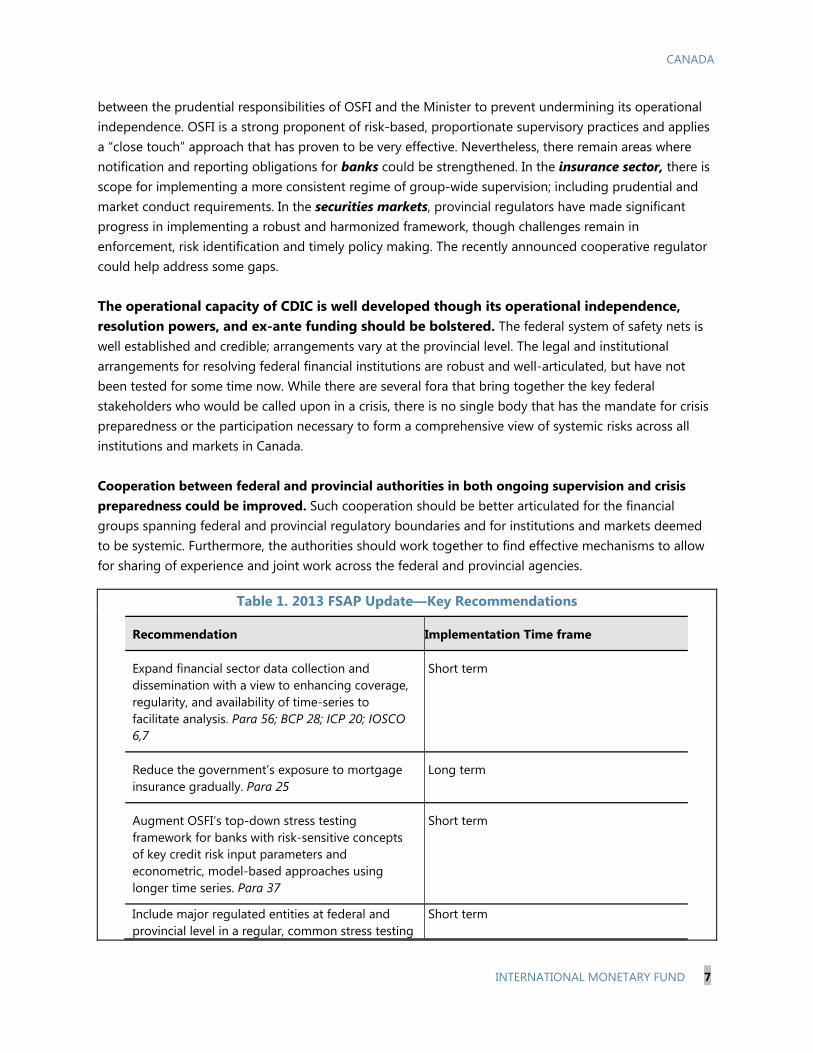
EXECUTIVE SUMMARY AND KEY RECOMMENDATIONS Canada’s financial system successfully navigated the global financial crisis, and stress tests suggest that major financial institutions would continue to be resilient to credit, liquidity, and contagion risks arising from a severe stress scenario. Elevated house prices and high household debt remain an area of concern (despite the substantial level of government-guaranteed mortgage insurance), though targeted prudential and macroprudential measures are proving to be effective. The regulatory and supervisory framework is strong, and is complemented by a credible federal system of safety nets, although there is no single body with an explicit mandate to take a comprehensive view of systemic risks or to undertake crisis preparedness. Improving cooperation between federal and provincial authorities would further reinforce system wide oversight arrangements. The financial system is large and dominated by a few players. The authorities seek to strike a balance between promoting healthy market-based incentives and leaning against pressures to weaken risk controls. While further concentration amongst the long-established banks and insurance companies has been prevented, their strength makes it difficult for newcomers to break into the market. Canadian banks have been among the better performers in their peer group since 2008. Banks are well capitalized, profitable and continue to report low non-performing loans. Foreign operations now account for more than a quarter of net income, but a higher share in loan losses. Among life insurers, solvency has somewhat eroded, mainly because of policies with guaranteed benefits in a low interest rate environment. Stress tests demonstrate the resilience of the major banks and insurance companies to credit, liquidity, and contagion risks arising from a severe stress scenario. Even in our severe stress scenario, recapitalization needs of banks remain manageable, and solvency ratios of the life insurance majors remain above the regulatory minima. Mortgages and consumer loans secured by real estate represent the single largest exposure of banks, and elevated house prices and high household indebtedness remain an area of concern. The authorities have taken a host of micro- and macro-prudential measures to stem the buildup of risks. Nevertheless, a transfer of more of the risk to the private sector to mitigate the government’s exposure to potential losses from mortgage insurance over the medium term, and additional measures to ensure appropriate incentives for risk-monitoring by financial intermediaries, should be considered. Assigning the mandate for monitoring systemic risks to a single body would facilitate macro-prudential oversight. The regulatory and supervisory framework demonstrates strong compliance with international standards and is well coordinated across the federal oversight bodies, though some gaps remain to be addressed. Canada is among the first advanced economies to adopt the Basel III capital standard and to adopt a Domestic Systemically Important Bank (D-SIB) framework. OSFI has a clear mandate and is empowered to take a range of actions in discharge of its functions, though the law could better delineate
CANADA
INTERNATIONAL MONETARY FUND 7
between the prudential responsibilities of OSFI and the Minister to prevent undermining its operational independence. OSFI is a strong proponent of risk-based, proportionate supervisory practices and applies a “close touch” approach that has proven to be very effective. Nevertheless, there remain areas where notification and reporting obligations for banks could be strengthened. In the insurance sector, there is scope for implementing a more consistent regime of group-wide supervision; including prudential and market conduct requirements. In the securities markets, provincial regulators have made significant progress in implementing a robust and harmonized framework, though challenges remain in enforcement, risk identification and timely policy making. The recently announced cooperative regulator could help address some gaps. The operational capacity of CDIC is well developed though its operational independence, resolution powers, and ex-ante funding should be bolstered. The federal system of safety nets is well established and credible; arrangements vary at the provincial level. The legal and institutional arrangements for resolving federal financial institutions are robust and well-articulated, but have not been tested for some time now. While there are several fora that bring together the key federal stakeholders who would be called upon in a crisis, there is no single body that has the mandate for crisis preparedness or the participation necessary to form a comprehensive view of systemic risks across all institutions and markets in Canada. Cooperation between federal and provincial authorities in both ongoing supervision and crisis preparedness could be improved. Such cooperation should be better articulated for the financial groups spanning federal and provincial regulatory boundaries and for institutions and markets deemed to be systemic. Furthermore, the authorities should work together to find effective mechanisms to allow for sharing of experience and joint work across the federal and provincial agencies.
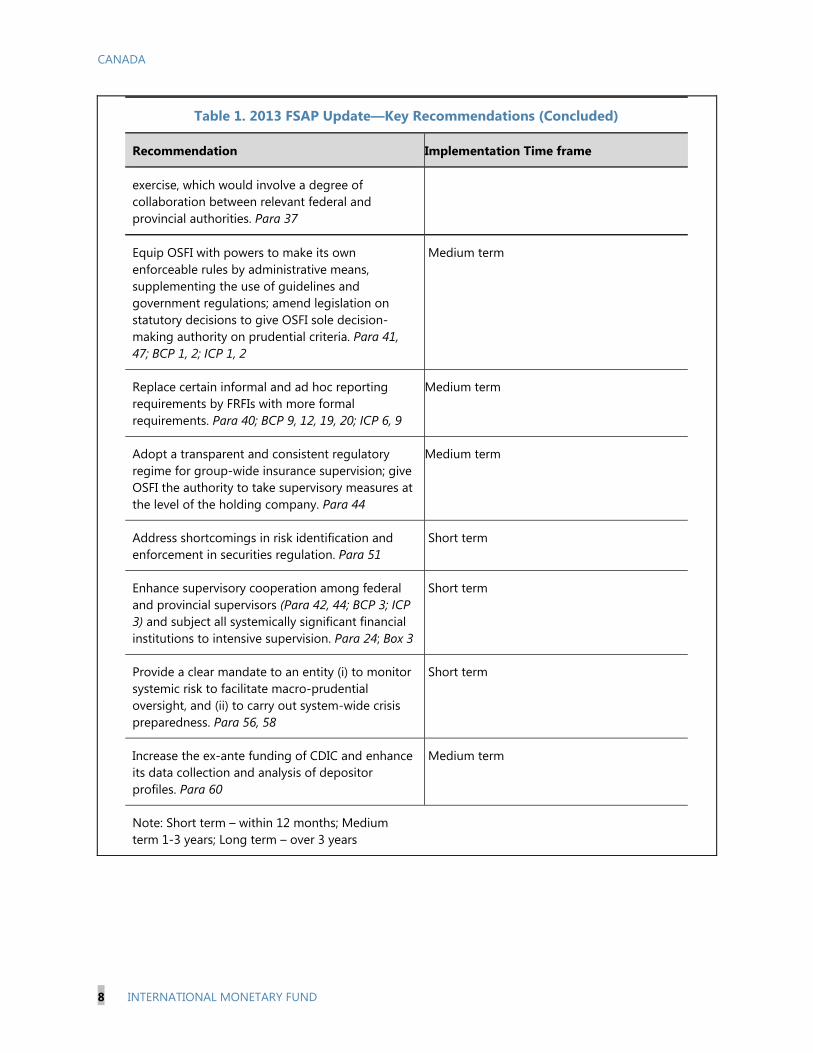
Table 1. 2013 FSAP Update—Key Recommendations
Recommendation Implementation Time frame
Expand financial sector data collection and dissemination with a view to enhancing coverage, regularity, and availability of time-series to facilitate analysis. Para 56; BCP 28; ICP 20; IOSCO 6,7
Short term
Reduce the government’s exposure to mortgage insurance gradually. Para 25
Long term
Augment OSFI’s top-down stress testing framework for banks with risk-sensitive concepts of key credit risk input parameters and econometric, model-based approaches using longer time series. Para 37
Short term
Include major regulated entities at federal and provincial level in a regular, common stress testing
Short term
CANADA
8 INTERNATIONAL MONETARY FUND
Table 1. 2013 FSAP Update—Key Recommendations (Concluded)
Recommendation Implementation Time frame
exercise, which would involve a degree of collaboration between relevant federal and provincial authorities. Para 37
Equip OSFI with powers to make its own enforceable rules by administrative means, supplementing the use of guidelines and government regulations; amend legislation on statutory decisions to give OSFI sole decision-making authority on prudential criteria. Para 41, 47; BCP 1, 2; ICP 1, 2
Medium term
Replace certain informal and ad hoc reporting requirements by FRFIs with more formal requirements. Para 40; BCP 9, 12, 19, 20; ICP 6, 9
Medium term
Adopt a transparent and consistent regulatory regime for group-wide insurance supervision; give OSFI the authority to take supervisory measures at the level of the holding company. Para 44
Medium term
Address shortcomings in risk identification and enforcement in securities regulation. Para 51
Short term
Enhance supervisory cooperation among federal and provincial supervisors (Para 42, 44; BCP 3; ICP 3) and subject all systemically significant financial institutions to intensive supervision. Para 24; Box 3
Short term
Provide a clear mandate to an entity (i) to monitor systemic risk to facilitate macro-prudential oversight, and (ii) to carry out system-wide crisis preparedness. Para 56, 58
Short term
Increase the ex-ante funding of CDIC and enhance its data collection and analysis of depositor profiles. Para 60
Medium term
Note: Short term – within 12 months; Medium term 1-3 years; Long term – over 3 years
CANADA
INTERNATIONAL MONETARY FUND 9
BACKGROUND AND CONTEXT A. Macroeconomic Developments and Outlook
1. The Canadian economy strengthened over the last year, though on the backdrop of modest underlying growth, and is expected to accelerate further in 2014 (Figure 1). Growth has averaged above-potential 2.2 percent over the first three quarters of 2013, reflecting to a large extent the unwinding of disruptions in the energy sector that had depressed production, investment, and exports in 2012. Growth is expected to accelerate to about 2¼ percent in 2014, up from 1.7 percent in 2013, while remaining spare capacity will gradually be absorbed, and the unemployment rate will converge to its natural rate (close to 6½ percent) over the medium term. Headline CPI inflation is expected to pick up in 2014, approaching the Bank of Canada’s target rate of 2 percent (y/y) by end-2015. The current account deficit is expected to remain broadly stable at about 3¼ percent of GDP in 2014, and to gradually decline to 2½ percent over the medium term. The housing market has cooled but house prices remain overvalued with important regional differences, and the household debt-to-income ratio remains high.
B. Overview of the Financial System
2. Canada’s financial system is large, with assets totaling about 500 percent of GDP, and dominated by a handful of players in most sectors (Appendix 1).1 Six federally-regulated banks (D-SIBs) hold 93 percent of bank assets—a relatively high concentration in comparison to peers (Figure 3).2 There are a few large provincially-regulated deposit takers with assets equivalent to 5 percent of banking sector assets.3 The insurance industry amounts to about 16 percent of financial sector assets. Three quarters of life and health (L&H) insurance assets are held by three domestic firms. The government owned Canada Mortgage and Housing Corporation (CMHC) and Genworth Financial Canada dominate the mortgage insurance sector, insuring over 60 percent of all outstanding mortgages by value as of March 2013.4 The majority of the financial sector is regulated at the federal level, though a significant segment is subject to provincial regulation (Box 2, Figure 2).
1 The data in Figure 1 and Appendix 1 are constructed from different sources and, in some cases, for different periods of time given data availability, and should be used with caution. 2 As of mid-2013, there were 25 domestic banks, 28 foreign bank subsidiaries and 28 foreign bank branches. 3 OSFI designated the six banks as domestic systemically-important banks (D-SIBs) in March 2013, while the AMF designated the Desjardins Group as a D-SIFI in June 2013. OSFI noted these two designations used different assessment methodologies. 4 The Federal Government stands behind 100 percent of CMHC ‘s obligations, and also backs private mortgage insurers’ obligations to lenders subject to a 10 percent deductible.
CANADA
10 INTERNATIONAL MONETARY FUND
3. Credit intermediation is dominated by federally-regulated banks (Figure 4). As of end-2012, about half of the total Can$3 trillion (165 percent of GDP) credit to households and non-financial corporations was provided by the banks, followed by equity and bond financing (15 percent and 12 percent respectively), and financing from credit unions and caisses populaires (7 percent). Businesses are financed mainly through equity and debt securities (33 percent and 27 percent of total business credit, respectively) with bank credit used largely for short-term needs.
4. The insurance sector in Canada is mature. The number of federally regulated insurers (FRIs) has fallen through consolidation from 290 in 2008 to 264 as at end-2012. The L&H industry is dominated by three large domestic firms but the P&C industry is less concentrated, with foreign-owned branches having significant market share. Provincial insurers represent about 11 percent of FRI assets as at end-2011(Québec accounted for 80 percent). The sector is served by a wide range of intermediaries, comprising approximately 154,000 insurance agents and some 45,000 brokers as at end-2012.5
5. Canadian banks and insurers have significant international operations. Canadian banks have expanded their international operations over the past decade. Foreign operations are mainly within retail banking, capital markets, and wealth management, and are concentrated in the United States, Latin America, and the Caribbean. Non-domestic operations of the six D-SIBs accounted for 28 percent of net income in 2012 (Figure 5). The three big life insurers also have significant foreign operations; their operations in the U.S. market nearly match those in the Canadian market in terms of gross insurance liabilities.
6. Financial intermediation outside the traditional banking system is estimated at 40 percent of GDP (Figure 6).6 This “shadow banking” includes government-insured mortgage securitization, private-label securitization (ABCP and ABS), repos (predominantly in government securities), money market mutual funds (MMMFs), bankers’ acceptances, and commercial paper. In all these segments, banks (and other regulated institutions) play a prominent role.7
7. The securities intermediation industry is concentrated and banks, through their subsidiaries, play a dominant role. As of December 2012, there were 1,498 active firms registered to carry out investment activities, of which 1,365 were headquartered in Canada. Bank-owned subsidiaries play a key role. For example, bank-owned asset management subsidiaries control about 60 percent of AUM of the top 10 asset management firms and 27 percent of the sector’s total AUM. In reaction to the GFC, the mutual fund industry has seen a shift from equity funds to balanced and fixed income funds. The MMMF industry is more limited in size, and experienced a decline of assets
5 The numbers do not match those in Appendix I because of different classification. 6 The Financial Stability Board (FSB) defines shadow banking as “credit intermediation involving entities and activities outside the regular banking system.” We use the Bank of Canada activity-based definition here (see, for example, Bank of Canada’s June 2013 Financial System Review). FSB’s entity-based definition would imply a much larger size. 7 For example, over 70 percent of government-insured mortgage securitization (about 60 percent of total “shadow banking”) is issued by the six largest banks, which also sponsor most of the outstanding ABS/ABCP.
CANADA
INTERNATIONAL MONETARY FUND 11
as a reaction of investors to lower yields paid by MMMFs relative to alternatives such as high-interest savings accounts.8
8. The bond market is dominated by Government of Canada bonds, Canada Mortgage Bonds, and provincial government bonds. The nominal value of outstanding debt securities at end-2012 amounted to about Can$2.1 trillion (115 percent of GDP). Corporate bonds accounted for a third of this, of which half were issued by financial corporations. Corporate bond issuance in Canada has continued to increase since 2008, while that of money market instruments, such as commercial paper and bankers’ acceptances, declined following the financial crisis. Securitization markets as a whole are beginning to recover, but the non-bank ABCP industry has not restarted following its collapse in 2007.
9. The equities market is developed, with a total market capitalization of nearly Can$2.1 trillion (115 percent of GDP), at end-2012. The Toronto Stock Exchange (TSX) and TSXV,9 owned and operated by the TMX Group, have over 3,800 listed companies, making the TMX Group the eighth largest exchange group worldwide by market capitalization. The majority of the largest listed companies operate in the financial sector or extractive industries.
10. Derivatives markets are modest in size. The over-the-counter (OTC) derivatives market is concentrated amongst the Big Six Canadian banks.
11. The occupational pension funds sector accounts for about 13 percent of total financial sector assets. Membership is about 6 million; public-sector trusteed pension plans account for 70 percent of total assets. Less than 5 percent of occupational pension plans are defined contribution (DC) plans, although a transition from defined benefit toward DC is slowly taking place. The sector’s assets are diversified across Canadian debt securities and shares (about one-third each) and the remainder across investments in private equity, real estate, and infrastructure.
OVERALL STABILITY ASSESSMENT A. Banking Sector
12. Canadian banks’ assets are well-diversified, and their composition has remained remarkably stable in recent years (Figure 7). The share of consumer loans has risen as that of business loans has declined. The sharp increase in the share of insured mortgages reflects the IFRS implementation in November 2011 (requiring most securitized mortgages to be brought back on balance sheet).
8 MMMFs in Canada are predominantly bank-owned; they use stable NAVs but have no direct link to the payment system. 9 The TSXV, with 2,257 listed companies, is the junior equities and public venture capital marketplace for emerging companies.
CANADA
12 INTERNATIONAL MONETARY FUND
13. Bank funding is dominated by individual and other deposits (Figure 8). Deposits are almost equally split between demand/notice deposits and fixed-term deposits, and include both retail and ‘other’ deposits. While ‘other deposits’ includes CDs and other negotiable fixed-term notes, around half comprises deposits from non-financial corporates which the authorities consider as stable and relationship-driven.
14. The strong capital position of banks facilitated OSFI’s early adoption of the Basel III capital standard. This has been done on an “all in” basis from January 2013, without taking advantage of the Basel transitional timetable. The average capital adequacy ratio for domestic banks was over 12 percent at end-Q1 2013. OSFI is implementing a surcharge for D-SIBs which sets an “all-in” Tier 1 common equity (CET1) target of 8 percent of risk weighted assets commencing January 1, 2016. The major banks’ publicly-reported CET1 ratios at end-Q3 2013 ranged between 8.6–10.7 percent, already meeting the additional loss-absorbency requirement.
15. Asset quality remains favorable. Canada’s banking system remains sound with relatively low and stable NPLs (0.6 percent of loans as of Q2 2013) and high provisioning ratios (93 percent of NPLs as of Q2 2013, mostly in the form of general provisions). Non-performing business loans account for around half of the NPLs, followed by non-performing mortgage loans (1/3 of the total NPLs). The relative share of impaired loans and impairment losses is higher in the U.S. and other foreign markets than in Canada (Figure 9), indicating a higher level of risk tolerance (and possibly the impact of new acquisitions); loan loss provisioning practices vary but generally appear adequate for the larger foreign entities.
16. Profitability remains strong, despite narrowing interest rate margins, as loan growth has held up particularly in the retail sector. Similar to other advanced commodity-exporting countries, Canadian banks were among the most profitable during the post-2008 period (Figure 10), especially the D-SIBs, which dominate the banking system. They have diversified business models, covering all the main geographic and business segments in Canada, though to varying degrees. Canadian personal and commercial business is the key area of their operations, although the relative importance of this sector in terms of income generation varies from about 30 to 70 percent. On average, 20 percent of banks’ earnings rely on capital markets (wholesale banking) and 13 percent on wealth management. Non-Canadian retail and commercial business has shown the largest (percentage) increase in net income, but domestic business still provides the largest dollar-increase.
17. Over the last five years, income volatility has been highest for U.S. operations. These saw negative net income at the height of the financial crisis in 2009, while income contribution from operations in the Caribbean and in Latin America has been stable on aggregate.
B. Insurance
18. The performance of the L&H industry has been dampened by the global financial crisis and the ongoing volatility in financial markets. L&H FRIs have been re-pricing products in recent years in response to the declining interest rates, and removing or weakening guarantees, while transferring more risks to policyholders. In the absence of growth, profitability has been declining.
CANADA
INTERNATIONAL MONETARY FUND 13
19. The P&C industry is much smaller and writes almost exclusively domestic risks, with motor insurance as the dominant line of business. Growth has been modest. While operating results have been strong, declining investment returns have stimulated a focus on improving underwriting discipline.
20. The solvency position of the L&H industry had eroded since 2010, while the overall solvency of the P&C industry remained stable. At the aggregate level, both sectors report solvency ratios that are well above the regulatory minimum (Box 1) while the solvency position of the L&H industry too has improved in recent quarters.
Box 1. Insurance Companies: The Impact of Low Interest Rates The nature of Canadian life insurance business creates significant exposure to low rates. Life companies have sold many permanent life insurance and other long-term policies having cash values supported by guaranteed rates. Some groups built up exposures through U.S. operations (there has since been significant retrenchment). As in other countries, P&C business, being short term with regular renewals, is generally less sensitive to rate changes Canadian accounting and regulatory standards, which apply to worldwide consolidated balance sheets, have required companies to respond to lower rates. Actuarial standards require that assumed reinvestment rates take increasing account of current market rates. As OSFI’s capital requirements are sensitive to asset and liability values, capital ratios declined as rates fell. For one group, lower rates contributed to significant overall losses and a need to raise new capital. Companies have responded by changing pricing and business mix rather than increasing risk in investment portfolios. Insurers now stand to gain significantly from gradually rising interest rates, although the longer run impact on business models remains unclear. The effect of Canadian accounting and actuarial standards is that further increases in liabilities will have to be recognized in the short term, whatever the direction of rates. However, most revaluation losses resulting from past interest rate reductions have been recognized. Demand for life insurance and annuities remains high and insurers continue to benefit from well-established brands and distribution networks. But as they shift more risk to policyholders and seek to sell more non-insurance products, insurers will face greater competition from other financial institutions, including banks. The regulatory regime has served Canada well in the adjustment to a low rate environment. Actuarial standard-setters and supervisors have resisted pressure to dampen the sensitivity of their regime to rate changes, while addressing anomalies exposed by the crisis. In the short run, key actuarial standards, including on non-fixed income investments, are undergoing timely revision. OSFI should also review its data collection to improve oversight of trends in non-fixed income investments. A key driver of the impact of rate changes in the future will be the revised IFRS4 and its relatively market-consistent approach to valuation, the anticipation of which is influencing OSFI’s current redesign of its capital regime. The development of macro-prudential tools for insurance should be considered. Canada has taken significant macro-prudential measures in the banking sector. The authorities should consider the case for tools that could similarly moderate risks in insurance. Market-wide stress tests based on economic scenarios tailored for insurance should continue to be a key input to decisions on the use of such tools, which could include limits on higher risk types of business or additional buffers such as countercyclical capital requirements.
CANADA
14 INTERNATIONAL MONETARY FUND
C. The Housing Sector
21. The housing market presents a key risk to financial stability in Canada even though first round effects on the financial system would be mitigated by government backed mortgage insurance. A number of indicators—including the house price-to-rent ratio and the house price-to-income ratio—suggest that house prices are elevated in some markets. Residential investment as a share of GDP is at a two-decade high and house completions have outpaced household formation for the past 10 years or so, while the household debt-to-income ratio has surged, making the economy more vulnerable to adverse shocks. Mortgages and consumer loans secured by real estate represent the single largest asset group for Canadian banks.
22. The authorities, and the markets more widely, expect that housing-market vulnerabilities will decline gradually over time, and this is in line with staff estimates.10 However, there remains the possibility of a severe downturn, whether resulting from an external shock or domestic factors. The impact on banks would be substantially mitigated by government-backed mortgage insurance, which covers some three-fifths of outstanding mortgage credit and all high LTV loans. But this does mean that the government’s exposure to financial system risks is material.
23. Against this background, the government’s recent initiatives to impose limits on government-backed mortgage insurance have been appropriate. The government has prohibited the use of insured mortgages in covered bonds and imposed ceilings on CMHC-sponsored securitization programs. In addition, it has announced plans to prohibit the use of insured mortgages in non-CMHC-sponsored securitization and gradually limit the insurance of low-ratio mortgages to those that will be used in CMHC securitizations.
24. To limit risk transfer to taxpayers and encourage appropriate risk retention by the private sector within the existing structure of mortgage insurance, further measures could be considered:
Prudential supervision of CMHC: OSFI’s authority is limited to examining and reporting on CMHC’s commercial operations providing insurance, and to access CMHC’s books and records. OSFI’s broader powers do not apply to CMHC, though it is an institution of systemic importance. The effectiveness of OSFI’s supervision depends not only on rigorous examinations but on the availability of a full framework of supervisory tools, processes and enforcement powers and their application on a consistent basis across the population of regulated institutions. Extending its formal powers over CMHC would make OSFI more effective in addressing supervisory issues promptly, while placing CMHC, in
10 “Canada: 2013 Article IV Consultation,” IMF Country Report.
CANADA
INTERNATIONAL MONETARY FUND 15
respect of its commercial operations, on an equal regulatory footing with other financial institutions.
Mortgage insurance guideline: OSFI’s work on developing a guideline applicable to mortgage insurers, relating to insurance underwriting practices, is welcome. One important challenge is to ensure the consistency of capital charges between mortgage lending and mortgage insurance. Given the scale of mortgage insurance, the guideline and procedures should be completed as soon as possible.
25. Over the medium-and long-term, the authorities could consider scaling back the extent of government-backed mortgage insurance. The current system has its advantages, including (i) an explicit allocation of losses and (ii) a macro-prudential tool (mortgage insurance rules). However, it transfers substantial risk to the taxpayer, does not provide a level playing field for private mortgage insurers and could distort the incentives for bank risk management. Any structural change to mortgage insurance should support financial stability and be made gradually, with the authorities being alert to any unintended consequences. One option would be to gradually increase the market share of private mortgage insurers, while keeping the government’s 10 percent deductible in the event of insolvency. Another option would be to change the mortgage insurance product to involve more risk sharing, as is done in Hong Kong SAR. Over the long run, the need for extensive government-backed mortgage insurance should be re-examined. Australia in the mid-1990s had a mortgage insurance system similar in many respects to Canada’s current system, but in 1998 decided to privatize.
STRESS TESTS 26. Stress tests covered all major banks and life insurance companies and the largest mortgage insurer. Resilience of the largest banks—constituting over 90 percent of banking assets—was assessed against credit, market, funding liquidity, and network contagion risks in the context of a tail risk scenario. Given the dominance of the banking sector by a small number of D-SIBs, the risk of exaggeration in the adverse confidence impact on other banks of problems at one or two institutions could be high. Quantitative analysis of this potential psychological/ informational contagion channel was considered important to cover in the stress tests notwithstanding the limitations of quantitative models in providing a complete resolution of the materiality of this risk factor. FSAP stress tests also covered—for the same scenario—the largest life insurance companies, with a combined 76 percent market share and the largest mortgage insurer, CMHC, with a 70 percent market share. All tests were conducted based on consolidated data as of October 2012, restated for solvency stress tests to reflect Basel III calculation.11
11 In addition to ToD and BU solvency analysis performed by the mission in collaboration with the authorities and participating firms, a ToD banking system funding liquidity and network contagion stress test was performed by the BoC based on their macro-financial risk assessment framework (MFRAF), which models credit, liquidity and contagion risks and spillover effects within a single framework.
CANADA
16 INTERNATIONAL MONETARY FUND
27. The stress tests considered two scenarios—baseline and stress—over a five-year horizon (Appendix IV).12
The baseline scenario reflects the IMF‘s World Economic Outlook projections as of February 2013.
The hypothetical stress scenario is the result of a model-driven simulation of a severe crisis outside Canada. The simulation exercise brings about a cumulative decline in real GDP over a three-year period (on an annual basis) which represents the most severe recession in a long time period spanning at least the last 35 years.13 After three years of recession, GDP growth rate gradually returns to positive levels.
A. Bank Stress Tests
28. Solvency stress test results suggest that, while all banks would fall below the supervisory threshold during severe economic distress, resulting recapitalization needs are manageable.
Solvency stress tests assessed the level of banks’ Common Equity Tier 1 (CET1) ratios, which are based on the “all-in” methodology,14 against the regulatory minimum consistent with the Basel III transition schedule, and a Canadian supervisory “all-in” threshold of 7 percent introduced by OSFI in January 2013.15
Most banks will fall below the OSFI supervisory threshold by 2015 with recapitalization needs peaking in 2016 under the IMF approach, at up to 30 percent of 2012 gross income or 150 percent of 2012 net income (corresponding to 2.5 percent of 2015 nominal GDP).16 The system-wide CET 1 ratio would fall by 2.5 percentage points in 2015 relative to the base year or 5.5 percentage points relative to the baseline scenario under the most conservative assumptions.17 Under this approach, four banks would fall below
12 Risk assumptions are based on the Risk Assessment Matrix as reported in “Canada: 2012 Article IV Consultation,” IMF Country Report No. 13/40. While most risks persisted over the past year, the nature and/or likelihood of some risks have changed (e.g. relating to Europe and to U.S. fiscal policy), and new risks have emerged, such as possibly tighter financial conditions and other risks relating to unwinding of monetary policy stimulus in the U.S. (see also Appendix III). 13 Canada has not seen negative GDP growth rate in two consecutive years since at least 1981. 14 The all-in methodology does not include Basel III phase-ins. If, for example, the Q4 2012 ratios were restated to include the Basel III phase-ins the average CET1 ratio of the Big Six would be higher by about 400 basis points. 15 The all-in CET1 threshold includes 2019 Basel III regulatory minimum (of 4.5 percent) and capital conservation buffer (of 2.5 percent). An additional surcharge of one percent, applicable to all the six banks covered in this exercise by virtue of their being D-SIBs, is assumed to be implemented from 2016. 16 Recapitalization needs to bring banks to the regulatory threshold also peak in 2016 under the IMF approach and were five times smaller. 17 While only one bank would face the same challenge in the OSFI ToD stress test, no bank would hit the regulatory minimum under the BU approach.
CANADA
INTERNATIONAL MONETARY FUND 17
the Basel regulatory minimum for the first time in 2016, mainly due to the introduction of the D-SIB surcharge.
Analysis of single factor shocks suggests that interest rate risk shocks in the banking book and market risk shocks in the trading book would not entail large losses.
29. Liquidity stress tests results suggest banks could generally withstand severe funding and market liquidity shocks.18 On aggregate, banks would be able to endure a liquidity shock as characterized by withdrawal of funds and haircuts on liquid assets similar to emerging standards without support from the central bank (the baseline liquidity scenario). Reliance on unsecured wholesale funding (operational and nonoperational deposits from non-financial corporates in particular) poses more risks for all banks in a scenario that is characterized by more severe disruptions in the unsecured wholesale markets (the adverse liquidity scenario).
30. Low interbank exposures limit possible spillovers between the Big Six banks. Interbank exposures and those to other Canadian financial institutions and non-Canadian bank counterparties are small, keeping spillover risk quite low. Therefore, any contagion effects arising outside of the major Canadian banks would be limited. To analyze network effects, the MFRAF was applied in year 2 after the first funding liquidity module was performed. The marginal impact of the network effect on CET1 is rather small and ranges between 21 and 29 basis points.
31. The MFRAF exercise illustrates that an effective framework for monitoring systemic risk requires comprehensive consideration of banks’ capital, funding profiles and financial interconnections. When funding liquidity risk and network effects are taken into account, banks face a further deterioration in their capital position (Figure 12). Comparing the system-wide CET1 between the base year and stress year 3 in the credit module and liquidity and network module, the cumulative marginal impact of funding liquidity risk and network effects on the capital position of the Big Six over the two years is around 30 basis points in the baseline scenario with one bank falling below the regulatory threshold but 230 basis points in the adverse scenario with four banks falling below the regulatory CET1 threshold. Consequently when liquidity risk and network effects are included the first mode of the loss distribution shifts to the right, meaning that the losses incurred are greater on average and there is a higher probability of higher losses (Figure 13).
B. Life Insurance Stress Test
32. The stress test for life insurers follows assumptions comparable to the bank stress test. Naturally, the relevance of financial market shocks is higher in an insurance stress test than
18 Liquidity stress tests were performed within a framework modeling interaction between solvency and funding liquidity risks, and incorporating adverse funding liquidity shocks impacting individual banks due to idiosyncratic weaknesses; groups of banks, due to information contagion; and the banking system due to contagion through the interbank network of exposures. See Appendix IV for more details.
CANADA
18 INTERNATIONAL MONETARY FUND
in a bank stress test, so the adverse scenario included mainly variations of market variables (lower equity prices, higher credit spreads and low interest rates).
33. The three large life insurance companies show quite robust results in the stress test. Even in the adverse scenario, solvency ratios of all companies remain well above the supervisory target of 150 percent, based on the Minimum Continuing Capital and Surplus Requirement (MCCSR). On aggregate, total MCCSR ratios decline from 215 percent in 2012 to 199 percent in 2015, stabilizing thereafter. The variation of results is low (Figure 14).
34. Net income remains positive under the adverse scenario in each year of the projection horizon and is expected to recover quickly from its lows in 2013. At the end of the projection horizon in 2017, net income is 15 percent higher than in 2012.
35. Share price declines and unfavorable changes in policyholders’ lapse rates add most to the overall impact on insurers’ capital and net income in the first year of the adverse scenario. Less pronounced is the effect of lower risk-free interest rates in the first years of the projection horizon, as companies have already built up substantial reserves in recent years (see Box 1). Exchange rate movements included in the adverse scenario have a negligible effect on solvency ratios and net income given the close currency matching of assets and liabilities.
C. Mortgage Insurance Stress Test
36. The capital adequacy of the largest mortgage insurance provider remains above the regulatory requirements under a stress scenario (Appendix IV) using similar assumptions as those for banks and life insurers. In the adverse scenario, capital adequacy, based on the Minimum Capital Test (MCT), drops sharply from 2012 to 2014, but remains above the minimum regulatory level of 100 percent. Starting in 2015, capital adequacy improves gradually.
D. Next Steps
37. While the authorities’ stress testing framework is well advanced, and reflects leading practice such as the MFRAF, the exercise has suggested some scope for enhancement. These include addressing data gaps by collecting longer time series of granular data on a greater range of items; using econometric, model-based approaches for forecasting income statement and balance sheet items; incorporating economic concepts in the determination of credit risk input parameters; subjecting all major federal and provincial entities to common stress testing frameworks; and establishing a liquidity stress testing framework which incorporates Basel III metrics. The MFRAF framework is a significant achievement and could be further enhanced if it were embedded in a macroeconomic model that would allow simulation of stress scenarios and calculation of their impact within one framework while at the same time taking into account feedback loops between the financial system and the real economy. In the insurance sector, it would be helpful to provide a comprehensive set of assumptions for macro stress tests to all participating insurance firms; strengthen the analytical approach in validating
CANADA
INTERNATIONAL MONETARY FUND 19
stress test results against supervisory data; and explore the potential roll out of top-down stress tests.
FINANCIAL SECTOR OVERSIGHT 38. The FSAP mission assessed the quality of the prudential supervision and regulation of the banking, insurance, and securities industries and found it to be effective and generally in compliance with international standards, though some gaps remain to be addressed.19 The Canadian financial sector was able to withstand the global financial crisis much better than financial systems in other developed countries. OSFI has often been an early adopter of new international supervisory standards and has an international reputation for being a strong and effective regulator. However, vulnerabilities were identified in some functions related to staffing, supervisory follow-up, group supervision, coordination and the potential under the various statutes for political considerations to override prudential concerns.
A. Banking Supervision
39. The supervision of the Canadian banking system by OSFI was found to be very effective with a high level of compliance with the Basel Core Principles for Effective Banking Supervision (BCPs). OSFI takes a risk-based and conservative approach to supervision that reflects the nature, size, complexity and risk profile of the institution. When an institution is found to have a material weakness, it is subject to increased and more intense supervision. Through the application of “close touch” supervision, OSFI engages on a regular basis with members of the board of directors, key management officials, and bank staff. OSFI emphasizes the accountability of the board and management of FRFIs for setting the overall risk appetite and then closely monitoring compliance. It expects the board to be fully engaged in establishing the business strategy of the FRFI and the approval of new products and acquisitions. The supervisory approach is well structured, forward looking and adaptive to changing conditions.
40. OSFI has built a strong cadre of highly trained and experienced supervisors. Communication between OSFI senior staff and the banks is frequent and open and occurs at all levels. OSFI expects to be informed by bank management whenever issues arise. However, this informal approach to information flows is vulnerable to staff turnover at the banks and OSFI, and may not work well when the system comes under stress. There remain several areas (for example, related party transactions and large exposures) where reporting and notification obligations could be made more formal or more frequent to ensure OSFI has timely and complete information to exercise its prudential powers when necessary.
19 In addition to detailed assessments at the federal level of banking and insurance regulation and supervision, the mission conducted a targeted assessment of the securities sector on the basis of meetings with, and information provided by, the four largest provincial securities regulators. While no detailed assessment of provincial bank supervisory frameworks was undertaken, observations in this report are based on discussions with some supervisory agencies and market participants.
CANADA
20 INTERNATIONAL MONETARY FUND
41. The statutory framework governing OSFI provides comprehensive powers and operational flexibility and has been interpreted to grant OSFI de-facto independence. While OSFI lacks the authority present in some other jurisdictions to issue its own legally enforceable regulations, it has effectively worked around this gap through the use of guidelines, which banks view as equivalent. However, the Bank Act (and the Insurance Act discussed in the next section), provide the Minister of Finance with the authority to override the prudential judgment of OSFI in some key areas. While this has not proved to be a problem under the current leadership, the supervisory framework would be even stronger if the legislation was amended to ensure that when OSFI rejects a transaction on prudential grounds, such a decision cannot be overridden by the Minister except under extraordinary circumstances and with full public disclosure.
42. OSFI has very good relationships with other federal agencies in Canada and with its overseas counterparts, but relationships with Canadian provincial regulators could be strengthened. OSFI is a proactive and conservative supervisor and is well-respected internationally. OSFI has a more significant role as a home supervisor than a host supervisor, and in some overseas regions the major Canadian banks are systemic for the local economy. Home and host relationships function smoothly and OSFI monitors the evolution and development of its banks in foreign territories and allocates supervisory resources accordingly. At the federal level, there are several forums that allow for effective cooperation and sharing of information. Because FRFIs may have subsidiaries and affiliates that are supervised at the provincial level, and given the importance of some large provincial institutions, it is important that OSFI and the relevant provincial regulators enhance two-way communications and protocols to share supervisory information.
CANADA
INTERNATIONAL MONETARY FUND 21
Box 2. Regulatory Structure of the Financial System in Canada
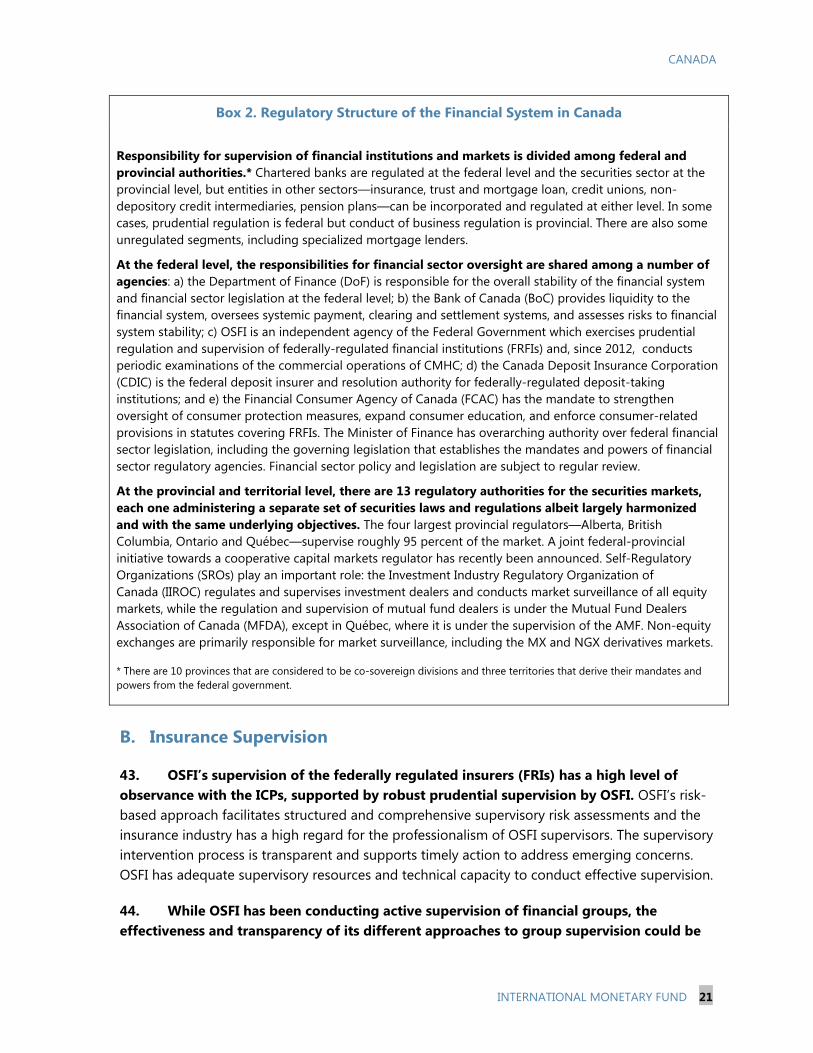
Responsibility for supervision of financial institutions and markets is divided among federal and provincial authorities.* Chartered banks are regulated at the federal level and the securities sector at the provincial level, but entities in other sectors—insurance, trust and mortgage loan, credit unions, non-depository credit intermediaries, pension plans—can be incorporated and regulated at either level. In some cases, prudential regulation is federal but conduct of business regulation is provincial. There are also some unregulated segments, including specialized mortgage lenders.
At the federal level, the responsibilities for financial sector oversight are shared among a number of agencies: a) the Department of Finance (DoF) is responsible for the overall stability of the financial system and financial sector legislation at the federal level; b) the Bank of Canada (BoC) provides liquidity to the financial system, oversees systemic payment, clearing and settlement systems, and assesses risks to financial system stability; c) OSFI is an independent agency of the Federal Government which exercises prudential regulation and supervision of federally-regulated financial institutions (FRFIs) and, since 2012, conducts periodic examinations of the commercial operations of CMHC; d) the Canada Deposit Insurance Corporation (CDIC) is the federal deposit insurer and resolution authority for federally-regulated deposit-taking institutions; and e) the Financial Consumer Agency of Canada (FCAC) has the mandate to strengthen oversight of consumer protection measures, expand consumer education, and enforce consumer-related provisions in statutes covering FRFIs. The Minister of Finance has overarching authority over federal financial sector legislation, including the governing legislation that establishes the mandates and powers of financial sector regulatory agencies. Financial sector policy and legislation are subject to regular review.
At the provincial and territorial level, there are 13 regulatory authorities for the securities markets, each one administering a separate set of securities laws and regulations albeit largely harmonized and with the same underlying objectives. The four largest provincial regulators—Alberta, British Columbia, Ontario and Québec—supervise roughly 95 percent of the market. A joint federal-provincial initiative towards a cooperative capital markets regulator has recently been announced. Self-Regulatory Organizations (SROs) play an important role: the Investment Industry Regulatory Organization of Canada (IIROC) regulates and supervises investment dealers and conducts market surveillance of all equity markets, while the regulation and supervision of mutual fund dealers is under the Mutual Fund Dealers Association of Canada (MFDA), except in Québec, where it is under the supervision of the AMF. Non-equity exchanges are primarily responsible for market surveillance, including the MX and NGX derivatives markets.
* There are 10 provinces that are considered to be co-sovereign divisions and three territories that derive their mandates and powers from the federal government.
B. Insurance Supervision
43. OSFI’s supervision of the federally regulated insurers (FRIs) has a high level of observance with the ICPs, supported by robust prudential supervision by OSFI. OSFI’s risk-based approach facilitates structured and comprehensive supervisory risk assessments and the insurance industry has a high regard for the professionalism of OSFI supervisors. The supervisory intervention process is transparent and supports timely action to address emerging concerns. OSFI has adequate supervisory resources and technical capacity to conduct effective supervision.
44. While OSFI has been conducting active supervision of financial groups, the effectiveness and transparency of its different approaches to group supervision could be
CANADA
22 INTERNATIONAL MONETARY FUND
improved. OSFI should work with the DoF, in cooperation with the Provinces, to formulate a clear and consistent regulatory regime for group-wide supervision that includes material non-regulated entities as well as prudential and market conduct requirements at the group level. It is advisable that supervisors be empowered to take necessary remedial and enforcement measures at the holding company level in line with emerging international best practices.
45. The solvency regimes for L&H and P&C businesses are generally robust, but there are gaps and inconsistencies in their application at both group and solo legal entity levels. Insurers are required to adopt a consistent economic basis for valuations across the balance sheet and to establish margins for adverse deviation. Appointed Actuaries, who establish the valuations of liabilities, are subject to a robust framework of oversight, peer review and audit requirements. OSFI allows firms to use internal models in only limited areas and applies a full model approval process and ongoing monitoring. OSFI’s approach to the application of group capital requirements varies across groups, reflecting the limitations on its powers over unregulated holding companies. There is scope for strengthening requirements on FRIs’ investments, particularly with respect to complex or less transparent forms of instruments.
46. Conduct of Business (COB) regimes across provinces are being harmonized but some augmentation of supervisory resources is needed. The COB regime adopted by AMF is in line with international best practice and it has adequate resources to conduct effective risk-based COB supervision. Constrained by limited resources, FSCO has adopted both a reactive and industry-wide targeted approach to supervising the FRIs based in Ontario (the vast majority of the total) and the large numbers of insurance intermediaries.
47. The legal capacity and operational autonomy of the supervisors should be strengthened. OSFI’s use of guidelines gives it flexibility and the guidelines are currently accepted by regulated entities as authoritative. Nonetheless, OSFI’s supervision would be even stronger if it could issue legally enforceable rules. In the case of OSFI and the AMF, relevant laws should be updated to separate the provisions governing prudential decisions of the supervisors, for example on changes of control, from the national interest issues which other authorities must take into consideration. In the case of FSCO, circumstances under which the provincial government can issue a policy statement to the regulator should be limited. There should be provisions in law requiring public disclosure of the reasons for a removal of the President and CEO of AMF and the superintendent of FSCO, in line with international standards.
C. Securities Regulation
48. The framework for the regulation and supervision of securities markets exhibits a high level of implementation of the IOSCO principles. The securities regulatory agencies have broad powers to regulate and supervise the markets. Furthermore, in a few areas such as enforcement, some provinces have legal powers that can be considered leading practices. Through the Canadian Securities Administrators (CSA), the provincial regulators have achieved a high degree of harmonization of their regulatory frameworks and significant efforts have been
CANADA
INTERNATIONAL MONETARY FUND 23
made on the supervisory front to streamline processes and procedures and to achieve convergence in supervisory practices. Robust arrangements have also been developed for the supervision of many categories of market participants, and enforcement by the largest provincial regulatory agencies has been strengthened significantly.
49. Nonetheless, challenges remain in risk identification that require additional efforts in coordination, resources, data collection and work on the ground.
Stronger coordination. Several different regulatory authorities and SROs are in charge of supervision of different components of the securities markets, which makes it challenging to have a full view of risks.
Additional capacity in specialized areas. As in many other countries, the securities regulatory agencies are in the process of staffing up to face challenges arising from the increased complexity of their markets.
More robust use of quantitative analysis. This is necessary for both the identification and monitoring of systemic risks, and also to enrich discussions on emerging risks, including at the conduct level. Currently the collection and use of quantitative data varies across the regulatory agencies.
Additional work “on the ground." On-site inspections are a key tool for early detection of poor practices and conduct problems, as well as to detect weaknesses in internal controls and risk management. While the risk based approach that is used is reasonable, it is important that the coverage be sufficiently robust for meaningful risk identification.
50. Enforcement remains another key challenge, especially in connection with criminal offenses. In spite of several efforts to improve criminal enforcement, results are mixed and are visible in only some of the larger provinces. The SROs have taken important steps to ensure that they have in place strong enforcement strategies, in particular in connection with compliance reviews. It is important that such efforts continue.
51. Finally, the securities regulators should continue to take steps to ensure timely decision making in policy formulation. However, the current governance arrangements, based on a consensus building approach across several entities, might affect timeliness of decision making.
52. Addressing these challenges requires a concerted effort by the provinces, and in light of the functions that the Supreme Court has noted, also by the federal government. In particular, coordination with the federal government would be necessary in the areas of identification of systemic risk and criminal enforcement. While different approaches are possible, the recent agreement in principle to establish a cooperative capital markets regulator to which
CANADA
24 INTERNATIONAL MONETARY FUND
the provinces and the federal government would delegate their functions is a practical way forward that could also bring efficiency gains.20
Box 3. Supervisory Intensity and Effectiveness
Canadian banks entered the global financial crisis with a solid funding base and high risk-based capital levels and recovered quickly from initial episodes of turbulence in funding markets. Contributory factors include a strong economy and conservative federal fiscal stance that enabled the government to credibly stand behind back-stopping arrangements, and a government-backed mortgage finance system that mitigates risks in the financial sector. However, another important factor in the success of the Canadian financial system in avoiding the crisis has been the intensity and effectiveness of its supervisory framework and its positive influence on industry behavior.
・ Supervisory processes and outcomes are well aligned with key FSB Recommendations on Supervisory Intensity and Effectiveness. In particular, OSFI’s mandate is focused exclusively on protecting the savings of depositors and policyholders of FRFIs. OSFI has required high quality capital in the banks, early adoption of international standards, and conveyed a degree of skepticism regarding riskier forms of capital market instruments. It enjoys de facto operational independence although de jure it is part of government and its formal head is the Minister of Finance. It has adopted a practice of relying on regulatory “guidelines” that it can issue promptly, while a sunset clause in the banking legislation provides a periodic opportunity to update the framework every five years. It employs a principles-based supervisory approach that practices “close touch” supervision and emphasizes the accountability of board of directors and management for the overall safety and soundness of institutions and their adherence to supervisory guidance. OSFI is adequately resourced and has built up its supervisory capacity in recent years, including by hiring experienced professionals from the industry. A well-functioning and collaborative infrastructure at the federal level requires the sharing of supervisory information among members on a confidential basis, which facilitates more informed federal policies.
・ The financial system is relatively concentrated, profitable, conservatively run, and has a strong reputation that benefits from its effective supervision. Mergers among the big banks have been discouraged, contributing to a stable financial sector landscape. The industry accepts the supervisory discretion that accompanies a conservative principles-based system due in part to OSFI anticipating problems that banks in other countries encountered. Its reputation as a conservative supervisor has provided a certain degree of comfort to the industry’s overseas counterparties, and this in turn has facilitated the acceptance by the industry of early adoption of international prudential standards.
・ As provincial deposit takers become large enough to pose systemic risks, they should also be subject to the same level of rigorous supervision and regulation as other major depository institutions in Canada. There are some large credit unions regulated at the provincial level that require the provincial supervisors to have the capacity, on a standalone basis, to effectively supervise them and for the respective provinces to have the fiscal resources to backstop depositors and resolve any nonviable ones in an orderly fashion. Because of the wide dispersion of supervisory talent across the provinces, however, it can be challenging for all provincial supervisors, on a standalone basis, to acquire the breadth, depth of experience, and supervisory capacity needed for the task. Greater collaboration across federal and provincial agencies could help ensure that supervision remains intense and effective across all systemic institutions.
20 The cooperative capital markets regulator—a joint federal and provincial initiative—was announced on September 19, 2013, initially involving the federal government, British Columbia and Ontario.
CANADA
INTERNATIONAL MONETARY FUND 25
D. Macroprudential Measures
53. The Canadian authorities have taken several macro-prudential measures since 2008 to support the long-term stability of the housing and mortgage markets. The federal government has undertaken four rounds of measures to tighten mortgage insurance that went beyond a reversal of the loosening of the mid-2000s. The government reduced the maximum amortization period for high LTV loans to 25 years; imposed a 5 percent minimum down payment for owner-occupied properties; introduced a maximum total debt service ratio of 44 percent; tightened LTV ratios on refinancing loans and on loans to purchase properties not occupied by the owner; and withdrew government insurance backing on lines of credit secured by homes, including non-amortizing HELOCs.
54. Macroprudential measures were accompanied by new prudential rules. OSFI issued a guideline to strengthen mortgage underwriting standards. The oversight of CMHC was enhanced. The government restricted new guarantees under the National Housing Act Mortgage-Backed Securities program and CMHC reduced access to its portfolio insurance product.
55. Econometric evidence suggests that the measures adopted since 2010 were effective.21 These measures, especially the latest round, have curbed mortgage credit growth and moderated the spike in house prices.
56. While the current informal system has worked well, it could be enhanced by clearly assigning the mandate to a single body for monitoring systemic risk to facilitate macro-prudential oversight. No single body has the mandate for macroprudential oversight nor do any of the oversight committees (Table 2) have the membership that would allow for a comprehensive view of systemic risk across all financial institutions and markets in Canada. In particular, risks in securities markets, including linkages with other parts of the financial system, are not systematically captured at a national level. Moreover, a unified approach to analyzing risks that stem both from federally and provincially regulated institutions and markets is lacking. No-one has a mandate to collect and analyze data for the financial system—federally and provincially regulated entities, unregulated entities, and markets—as a whole.22 Consequently, a complete set of information is not collected on a systematic and regular basis, and there are gaps in understanding certain segments of the markets (e.g. holding company credit intermediation, some pension fund activities, securities markets) and the interconnectedness among different areas of the financial universe.
21 See IMF Country report No. 13/41 (Selected Issues Paper for Canada). 22 Although it lacks a specific mandate for system-wide monitoring, the BOC performs regular systemic risk analyses as part of the Financial Stability Review, but does not have access to a broader range of data and information.
CANADA
26 INTERNATIONAL MONETARY FUND
Table 2. Systemic Oversight Committees at a Glance
Committees Financial Institutions Supervisory
Committee (FISC)
Senior Advisory Committee
(SAC)
Heads of Agencies
Committee (HOA)
CSA Systemic Risk Committee
(SRC)
Members OSFI, CDIC, BOC DOF, FCAC
OSFI, CDIC, BOC, DOF, FCAC
OSFI, BOC, DOF 4 Provincial Securities Regulators and CSA Chair
Members of the CSA
Chair Superintendent of Financial Institutions (OSFI secretariat)
Deputy Minister of Finance (DOF secretariat)
Governor of BOC (BOC secretariat)
None – collegial structure (SRC reporting to the Chairs of CSA)
Mandate Facilitate the exchange of information relating to the supervision of FRFIs
Sharing information, monitoring emerging risks and discussing policies related to financial sector issues
Exchange information and coordinate on issues of mutual concern
Identify and analyze systemic risks in the securities markets
Frequency Quarterly (or as frequent as necessary)
Quarterly (or as frequent as necessary)
Quarterly (or as frequent as necessary)
Semiannually (conference calls every two weeks )
Legal form Statutory Non-statutory Non-statutory Non-statutory Note: the CDIC Board, which meets quarterly, includes the DOF, OSFI, BOC and the FCAC as well as six members drawn from the private sector. The CDIC is a statutory body. In addition to these committees, the Joint Forum of Financial Market Regulators (JFFMR) seeks to promote greater harmonization and coordination of regulatory approaches and brings together CAPSA (pensions), CCIR (insurance) and the CSA (securities), together with representation from CISRO (insurance).
CANADA
INTERNATIONAL MONETARY FUND 27
SAFETY NETS 57. A substantial part of the financial sector is covered by the federal safety net, which is well established and highly credible. At the federal level, the Minister of Finance (MoF) is legally and operationally the financial stability “gatekeeper.” The government has broad intervention powers and can supersede decisions of both OSFI and CDIC based on financial stability grounds. The OSFI, CDIC, and BoC have each established leading practices in their areas of responsibility. But each of the ten provinces has functionally-independent and heterogeneous safety nets and contingency planning and resolution frameworks, some of which would need substantial improvements. The provincial deposit insurance practices are highly diverse (some offering unlimited insurance), while evidence suggests that ex-ante funding is relatively low. Nevertheless, the provincial safety nets may benefit from the perception of an implicit federal backstop. Problems in even a relatively small deposit insurance system could have contagion effects through ensuing uncertainty and loss of confidence.
58. While there are several committees engaged in oversight of the financial system, there is no single body with an assigned mandate for system-wide crisis preparedness. The systemic oversight committees play a role in crisis management: while only the FISC is statutory, the goal of each coordination committee is clear, meetings are regular (Table 2), and a high degree of informality permits flexible operation and a nimble response to arising issues. But no entity currently has a clear mandate or membership to undertake system-wide crisis preparedness.23 No single entity is accountable for deciding whether a situation has arisen which justifies the triggering of crisis actions or powers, nor has the mandate to conduct comprehensive simulations to test the capacity of the authorities (both federal and provincial) to respond in a coordinated manner to crisis scenarios. Assigning such a mandate could strengthen the ability of the authorities to respond to emerging problems in the most effective manner. Such a mandate would include the development of an overarching policy and operational guidance to respond to a system-wide crisis and in particular to bring together system wide (both federal and provincial) issues.
59. The federal legal and institutional arrangements for resolving individual financial institutions are robust. OSFI’s intervention framework is well articulated, underpinned by strong legal powers, and transparently communicated to the industry in the form of a “Guide to Intervention.” OSFI and CDIC work together and are well advanced in developing recovery and resolution planning for the D-SIBs. The resolution toolkit is broad, but many instruments require a decision of the Governor in Council following a recommendation from the MoF. The authorities plan to introduce a bail-in regime for systemically important banks. The CDIC has developed a detailed operational framework for resolution and its deposit insurance function has been recently reinforced by the introduction of a single depositor view system. BoC has a strong
23 In addition to regulators of federally regulated institutions, the BoC, CDIC, the DoF, such an entity would also include securities markets regulators and regulators of major provincially-regulated financial institutions.
CANADA
INTERNATIONAL MONETARY FUND 28
emergency liquidity framework, although removing the legal prohibition to take mortgages as collateral would ensure more flexibility in providing liquidity under stressed conditions.
60. The operational capacity of CDIC is well developed though its operational independence, resolution powers and ex-ante funding should be bolstered. The CDIC should have greater independence in applying various resolution tools and other instruments (i.e. those provided in the Financial Institution Restructuring Provisions title of the CDIC Act), while governmental approval would be maintained in situations involving public funds. The CDIC should be empowered to require companies in the same group to ensure continuity of essential services in a resolution and to terminate contracts; furthermore, the existing powers to temporarily stay the exercise of early termination rights should be extended to a broader range of resolution tools. The merits of introducing some form of depositor preference should be considered. To achieve the targeted 100 basis points minimum coverage within a reasonable timeframe, an increase of the premiums paid by financial institutions will be necessary. The proposed simplification of the rules for eligibility for deposit insurance of complex deposit products is welcome.
61. The provincial arrangements for crisis management and the cooperation with federal authorities could be enhanced. The provincial safety nets should be reinforced to ensure well-funded and prepared deposit insurance schemes; comprehensive resolution frameworks; and clear policies and operational guidance for crisis management. The longer-term objective should be to introduce more uniformity across the operating standards of the provincial safety nets and convergence towards leading practices. A more integrated communication on financial stability issues at both provincial and federal levels is recommended, while active cooperation on systemically important financial institutions should be a priority.
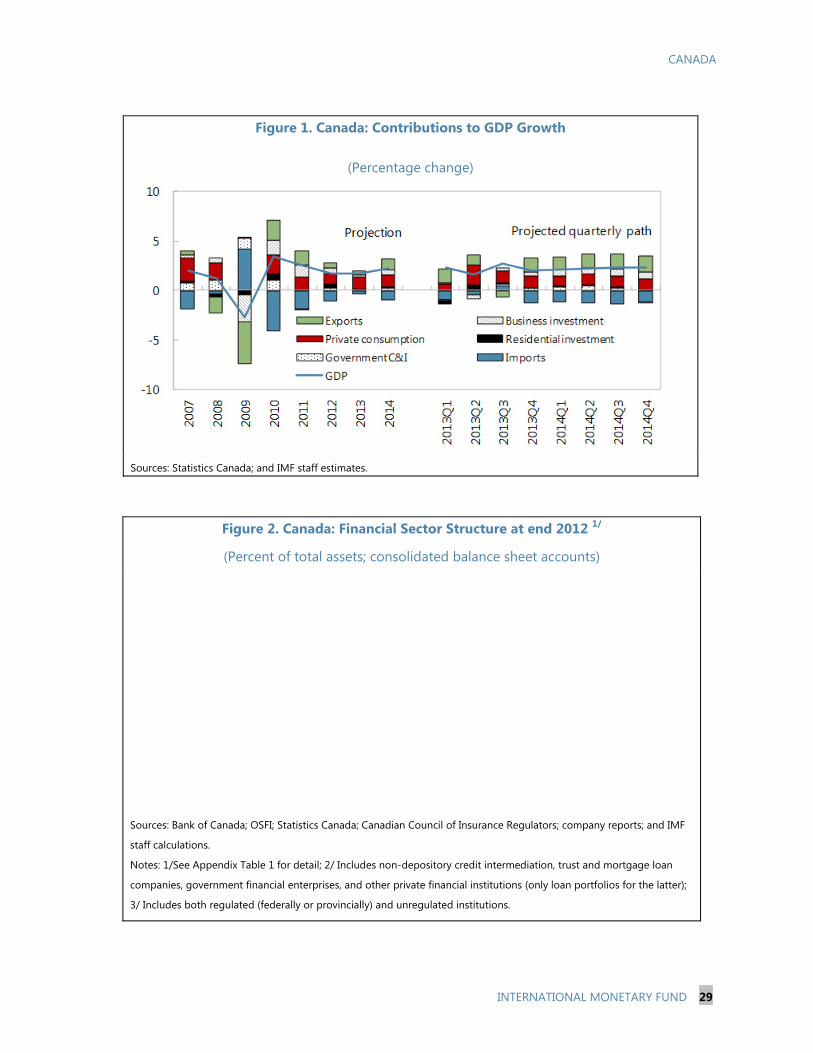
CANADA
INTERNATIONAL MONETARY FUND 29
Figure 1. Canada: Contributions to GDP Growth
(Percentage change)
Sources: Statistics Canada; and IMF staff estimates.
Figure 2. Canada: Financial Sector Structure at end 2012 1/
(Percent of total assets; consolidated balance sheet accounts)
Sources: Bank of Canada; OSFI; Statistics Canada; Canadian Council of Insurance Regulators; company reports; and IMF
staff calculations.
Notes: 1/See Appendix Table 1 for detail; 2/ Includes non-depository credit intermediation, trust and mortgage loan
companies, government financial enterprises, and other private financial institutions (only loan portfolios for the latter);
3/ Includes both regulated (federally or provincially) and unregulated institutions.
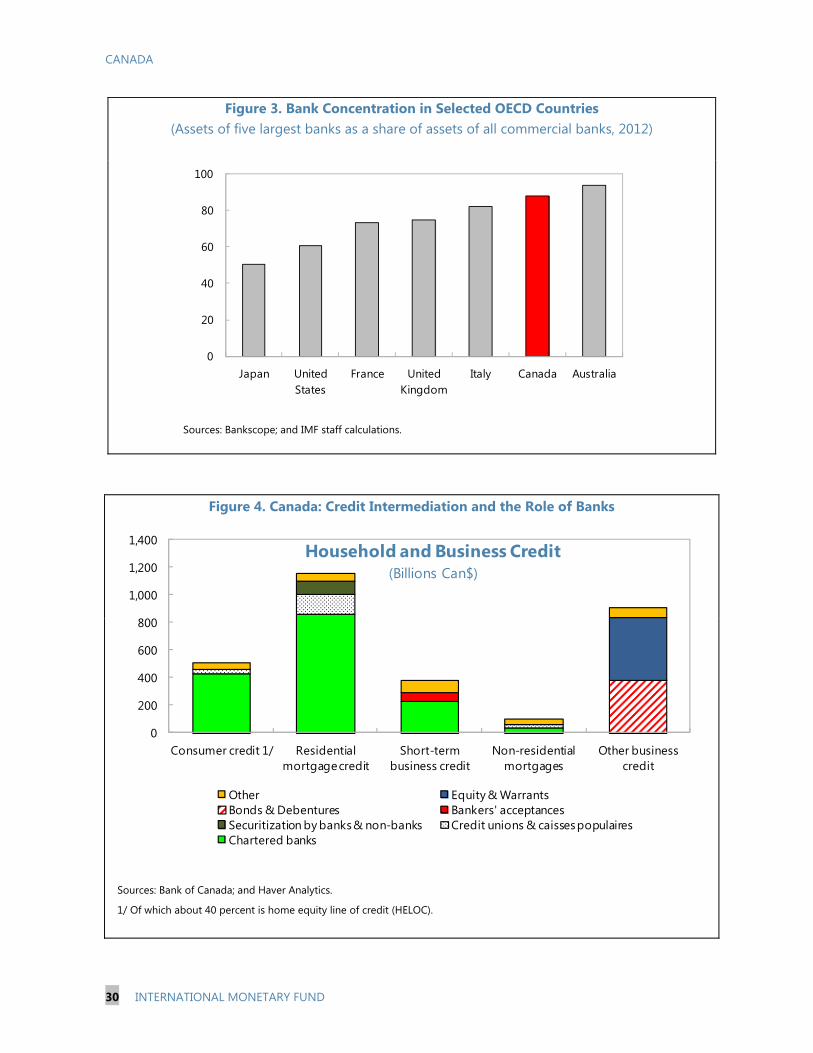
CANADA
30 INTERNATIONAL MONETARY FUND
Figure 3. Bank Concentration in Selected OECD Countries
(Assets of five largest banks as a share of assets of all commercial banks, 2012)
0
20
40
60
80
100
Japan United States
France United Kingdom
Italy Canada Australia
Sources: Bankscope; and IMF staff calculations.
Figure 4. Canada: Credit Intermediation and the Role of Banks
Sources: Bank of Canada; and Haver Analytics. 1/ Of which about 40 percent is home equity line of credit (HELOC).
0
200
400
600
800
1,000
1,200
1,400
Consumer credit 1/ Residential mortgage credit
Short-term business credit
Non-residential mortgages
Other business credit
Other Equity & WarrantsBonds & Debentures Bankers' acceptancesSecuritization by banks & non-banks Credit unions & caisses populaires Chartered banks
Household and Business Credit(Billions Can$)
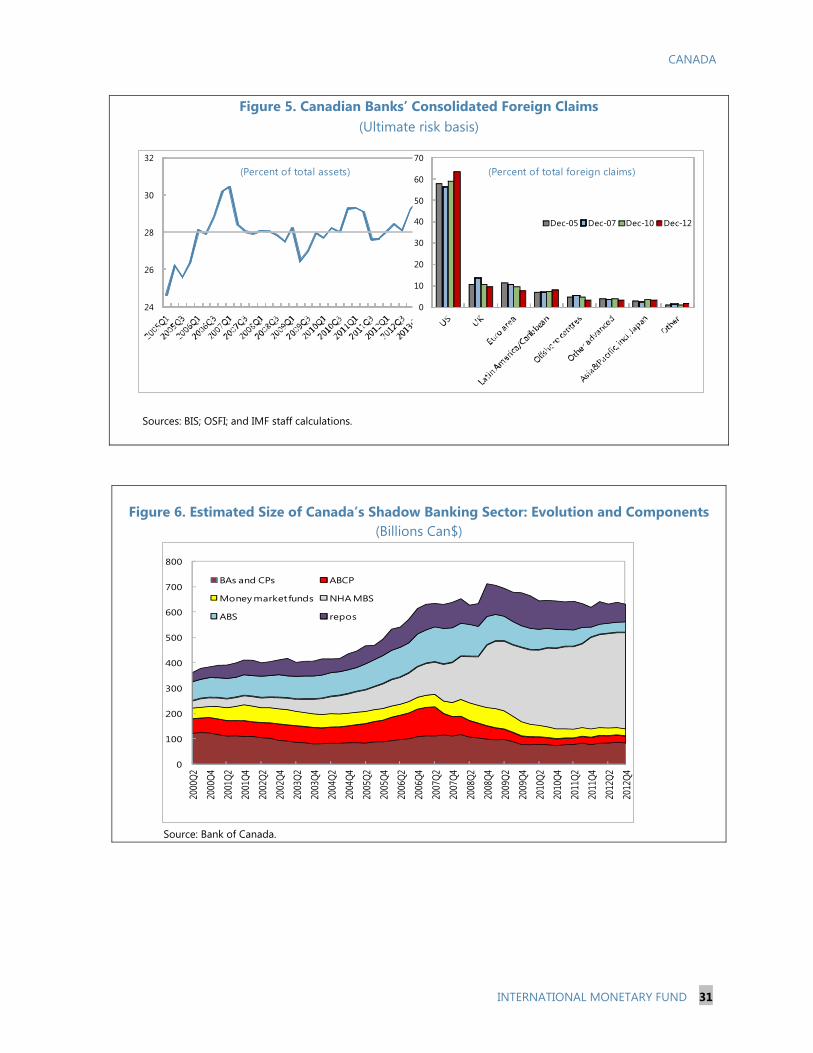
CANADA
INTERNATIONAL MONETARY FUND 31
0
100
200
300
400
500
600
700
800
2000
Q2
2000
Q4
2001
Q2
2001
Q4
2002
Q2
2002
Q4
2003
Q2
2003
Q4
2004
Q2
2004
Q4
2005
Q2
2005
Q4
2006
Q2
2006
Q4
2007
Q2
2007
Q4
2008
Q2
2008
Q4
2009
Q2
2009
Q4
2010
Q2
2010
Q4
2011
Q2
2011
Q4
2012
Q2
2012
Q4
BAs and CPs ABCP
Money market funds NHA MBS
ABS repos
Figure 5. Canadian Banks’ Consolidated Foreign Claims (Ultimate risk basis)
Sources: BIS; OSFI; and IMF staff calculations.
Figure 6. Estimated Size of Canada’s Shadow Banking Sector: Evolution and Components (Billions Can$)
Source: Bank of Canada.
24
26
28
30
32
(Percent of total assets)
0
10
20
30
40
50
60
70
Dec-05 Dec-07 Dec-10 Dec-12
(Percent of total foreign claims)
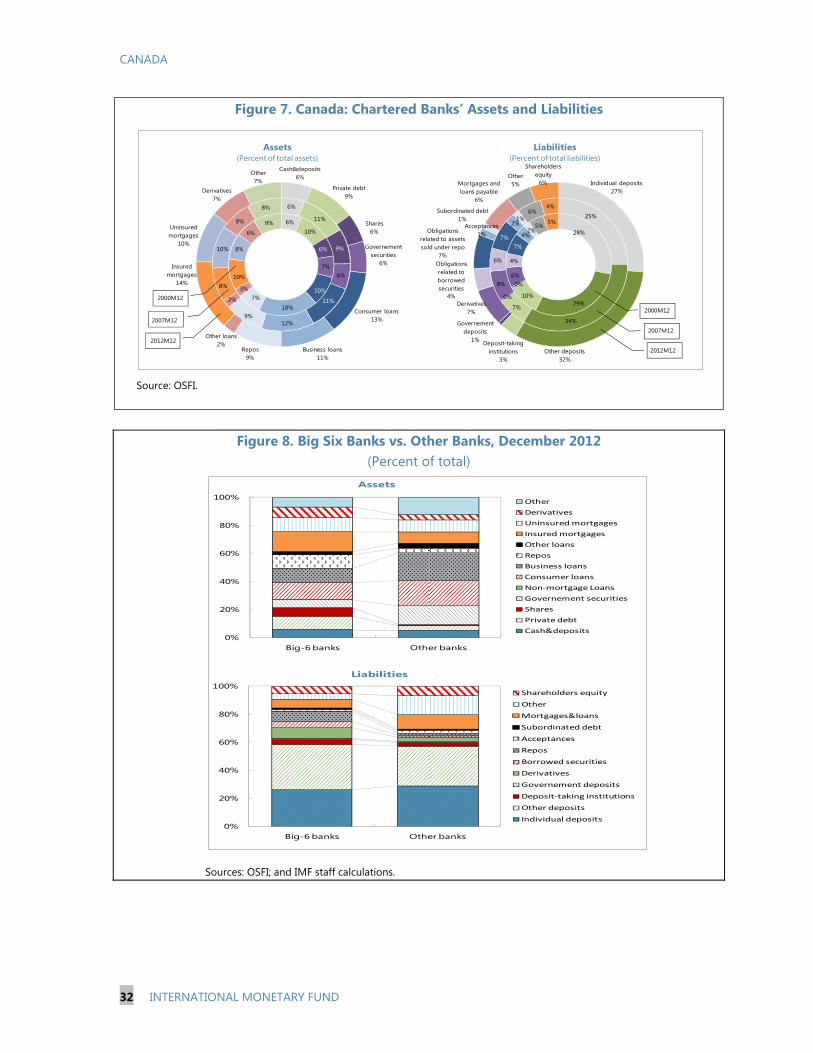
CANADA
32 INTERNATIONAL MONETARY FUND
Figure 7. Canada: Chartered Banks’ Assets and Liabilities
Source: OSFI.
Figure 8. Big Six Banks vs. Other Banks, December 2012
(Percent of total)
Sources: OSFI; and IMF staff calculations.
6%10%
6%
7%
10%
18%
7%3%
10%
8%
6%
9%
6%
11%
9%
6%
11%
12%9%
2%
8%
10%
8%
8%
Cash&deposits6%
Private debt9%
Shares6%
Governement securities
6%
Consumer loans 13%
Business loans11%
Repos9%
Other loans2%
Insured mortgages
14%
Uninsured mortgages
10%
Derivatives7%
Other7%
2000M12
2007M12
2012M12
Assets(Percent of total assets)
28%
29%10%
0%6%
4%
7%
4%2%
5% 5%25%
34%
7%
0%
8%
6%
7%
2%1%
6%4%
Individual deposits27%
Other deposits32%
Deposit-taking institutions
3%
Governement deposits
1%
Derivatives7%
Obligations related to borrowed securities
4%
Obligations related to assets sold under repo
7%
Acceptances1%
Subordinated debt1%
Mortgages and loans payable
6%
Other5%
Shareholders equity
6%
2012M12
2007M12
2000M12
Liabilities(Percent of total liabilities)
Big-6 banks Other banks0%
20%
40%
60%
80%
100%Other
Derivatives
Uninsured mortgages
Insured mortgages
Other loans
Repos
Business loans
Consumer loans
Non-mortgage Loans
Governement securities
Shares
Private debt
Cash&deposits
Assets
Big-6 banks Other banks0%
20%
40%
60%
80%
100%Shareholders equity
Other
Mortgages&loans
Subordinated debt
Acceptances
Repos
Borrowed securities
Derivatives
Governement deposits
Deposit-taking institutions
Other deposits
Individual deposits
Liabilities
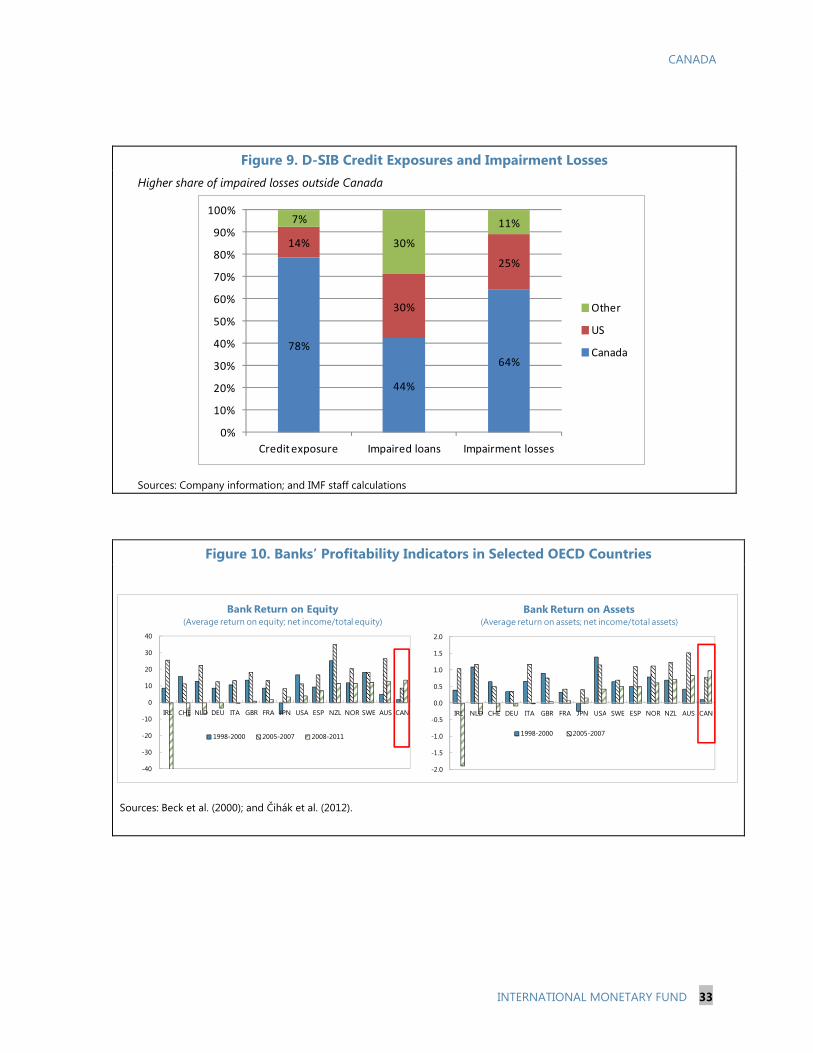
CANADA
INTERNATIONAL MONETARY FUND 33
Figure 9. D-SIB Credit Exposures and Impairment Losses Higher share of impaired losses outside Canada
Sources: Company information; and IMF staff calculations
Figure 10. Banks’ Profitability Indicators in Selected OECD Countries Sources: Beck et al. (2000); and Čihák et al. (2012).
78%
44%
64%
14%
30%
25%
7%
30%
11%
0%
10%
20%
30%
40%
50%
60%
70%
80%
90%
100%
Credit exposure Impaired loans Impairment losses
Other
US
Canada
-40
-30
-20
-10
0
10
20
30
40
IRL CHE NLD DEU ITA GBR FRA JPN USA ESP NZL NOR SWE AUS CAN
1998-2000 2005-2007 2008-2011
Bank Return on Equity(Average return on equity; net income/total equity)
-2.0
-1.5
-1.0
-0.5
0.0
0.5
1.0
1.5
2.0
IRL NLD CHE DEU ITA GBR FRA JPN USA SWE ESP NOR NZL AUS CAN
1998-2000 2005-2007
Bank Return on Assets(Average return on assets; net income/total assets)
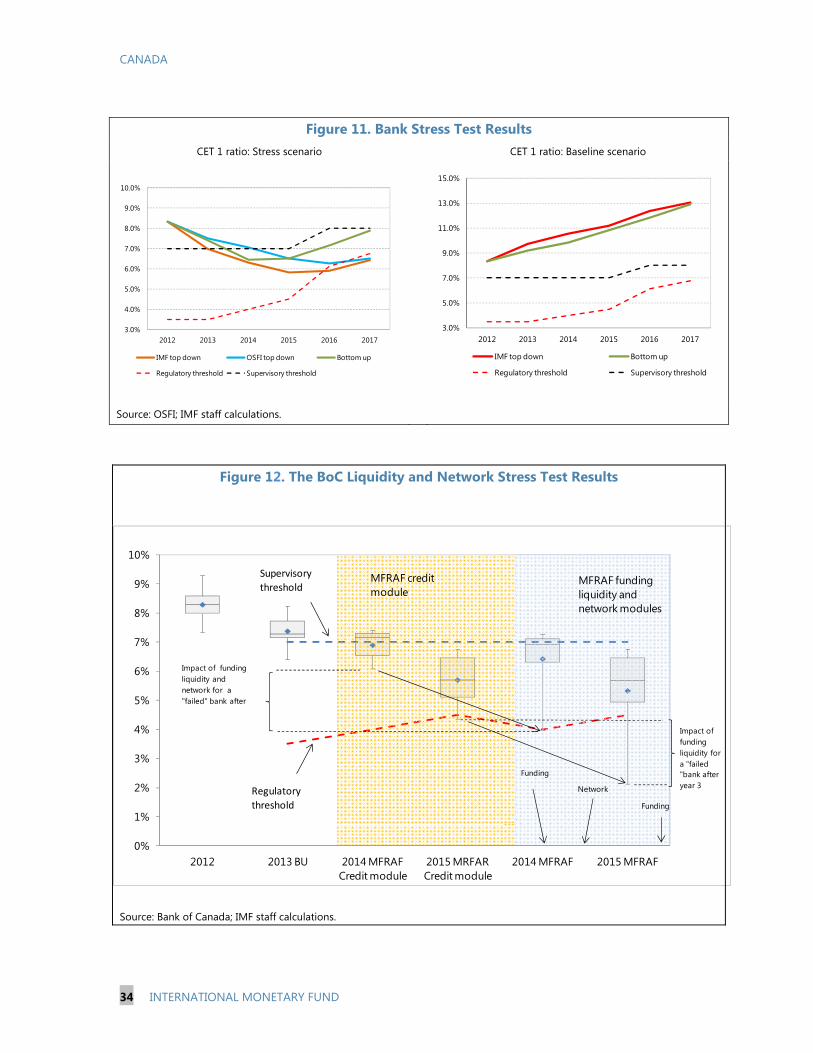
CANADA
34 INTERNATIONAL MONETARY FUND
3.0%
5.0%
7.0%
9.0%
11.0%
13.0%
15.0%
2012 2013 2014 2015 2016 2017
IMF top down Bottom up
Regulatory threshold Supervisory threshold
0%
1%
2%
3%
4%
5%
6%
7%
8%
9%
10%
2012 2013 BU 2014 MFRAF Credit module
2015 MRFAR Credit module
2014 MFRAF 2015 MFRAF
Funding
Funding
Network
MFRAF funding liquidity and network modules
Impact of funding liquidity and network for a "failed" bank after
Impact of funding liquidity for a "failed "bank after year 3
MFRAF creditmodule
Supervisory
threshold
Regulatory
threshold
Figure 11. Bank Stress Test Results CET 1 ratio: Stress scenario CET 1 ratio: Baseline scenario
Source: OSFI; IMF staff calculations.
Figure 12. The BoC Liquidity and Network Stress Test Results
Source: Bank of Canada; IMF staff calculations.
3.0%
4.0%
5.0%
6.0%
7.0%
8.0%
9.0%
10.0%
2012 2013 2014 2015 2016 2017
IMF top down OSFI top down Bottom up
Regulatory threshold Supervisory threshold
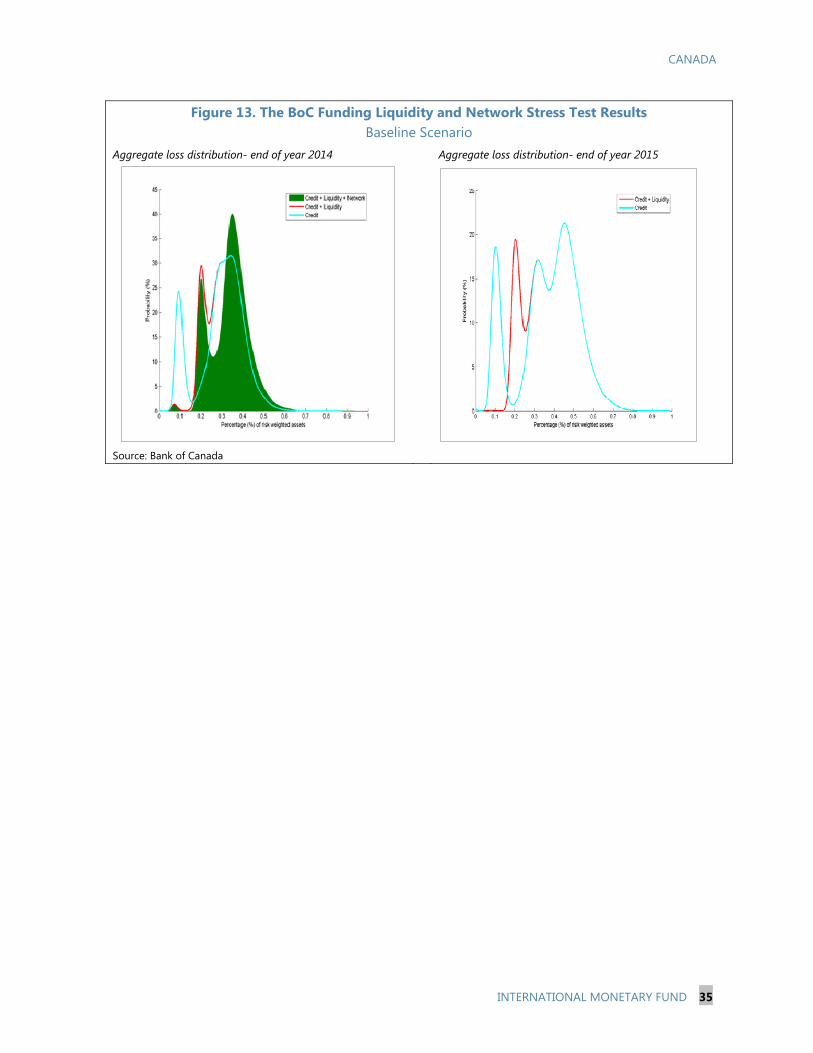
CANADA
INTERNATIONAL MONETARY FUND 35
Figure 13. The BoC Funding Liquidity and Network Stress Test Results
Baseline Scenario Aggregate loss distribution- end of year 2014 Aggregate loss distribution- end of year 2015
Source: Bank of Canada
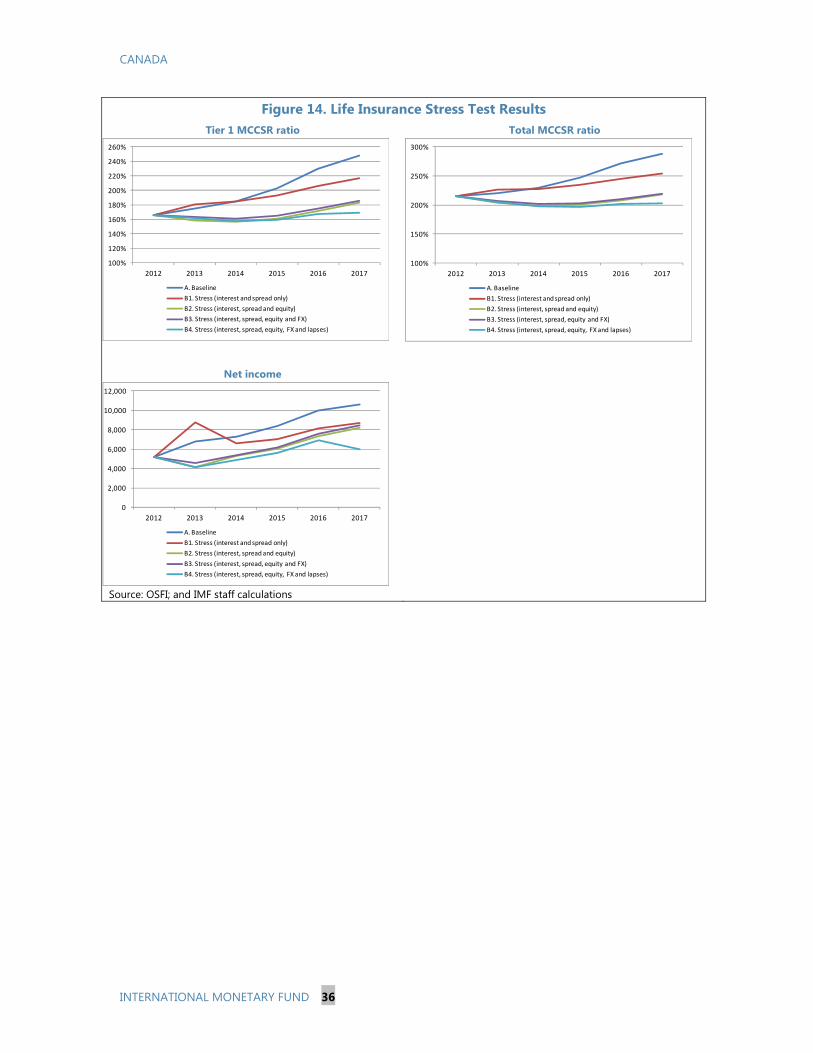
CANADA
INTERNATIONAL MONETARY FUND 36
Figure 14. Life Insurance Stress Test Results
Tier 1 MCCSR ratio Total MCCSR ratio
Net income
Source: OSFI; and IMF staff calculations
100%
120%
140%
160%
180%
200%
220%
240%
260%
2012 2013 2014 2015 2016 2017
A. Baseline
B1. Stress (interest and spread only)
B2. Stress (interest, spread and equity)
B3. Stress (interest, spread, equity and FX)
B4. Stress (interest, spread, equity, FX and lapses)
100%
150%
200%
250%
300%
2012 2013 2014 2015 2016 2017
A. Baseline
B1. Stress (interest and spread only)
B2. Stress (interest, spread and equity)
B3. Stress (interest, spread, equity and FX)
B4. Stress (interest, spread, equity, FX and lapses)
0
2,000
4,000
6,000
8,000
10,000
12,000
2012 2013 2014 2015 2016 2017
A. Baseline
B1. Stress (interest and spread only)
B2. Stress (interest, spread and equity)
B3. Stress (interest, spread, equity and FX)
B4. Stress (interest, spread, equity, FX and lapses)
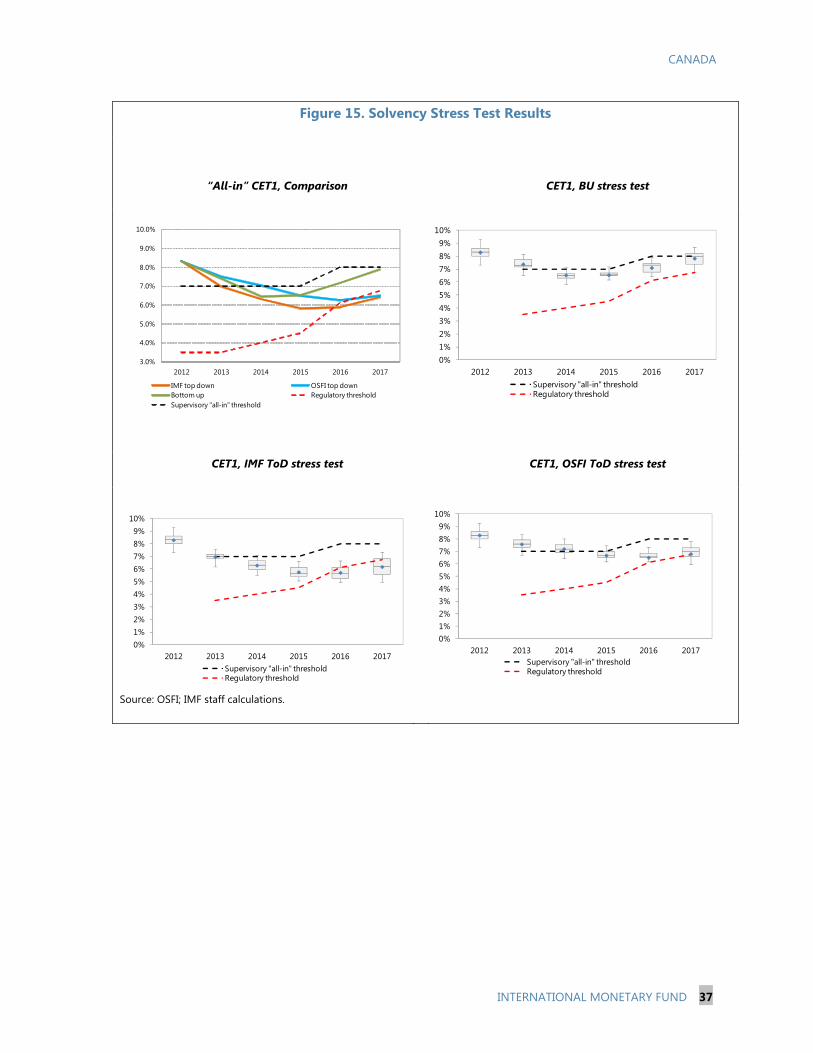
CANADA
INTERNATIONAL MONETARY FUND 37
3.0%
4.0%
5.0%
6.0%
7.0%
8.0%
9.0%
10.0%
2012 2013 2014 2015 2016 2017
IMF top down OSFI top downBottom up Regulatory thresholdSupervisory "all-in" threshold
0%1%2%3%4%5%6%7%8%9%
10%
2012 2013 2014 2015 2016 2017Supervisory "all-in" thresholdRegulatory threshold
0%1%2%3%4%5%6%7%8%9%
10%
2012 2013 2014 2015 2016 2017Supervisory "all-in" thresholdRegulatory threshold
0%1%2%3%4%5%6%7%8%9%
10%
2012 2013 2014 2015 2016 2017Supervisory "all-in" thresholdRegulatory threshold
Figure 15. Solvency Stress Test Results
“All-in” CET1, Comparison
CET1, BU stress test
CET1, IMF ToD stress test CET1, OSFI ToD stress test
Source: OSFI; IMF staff calculations.
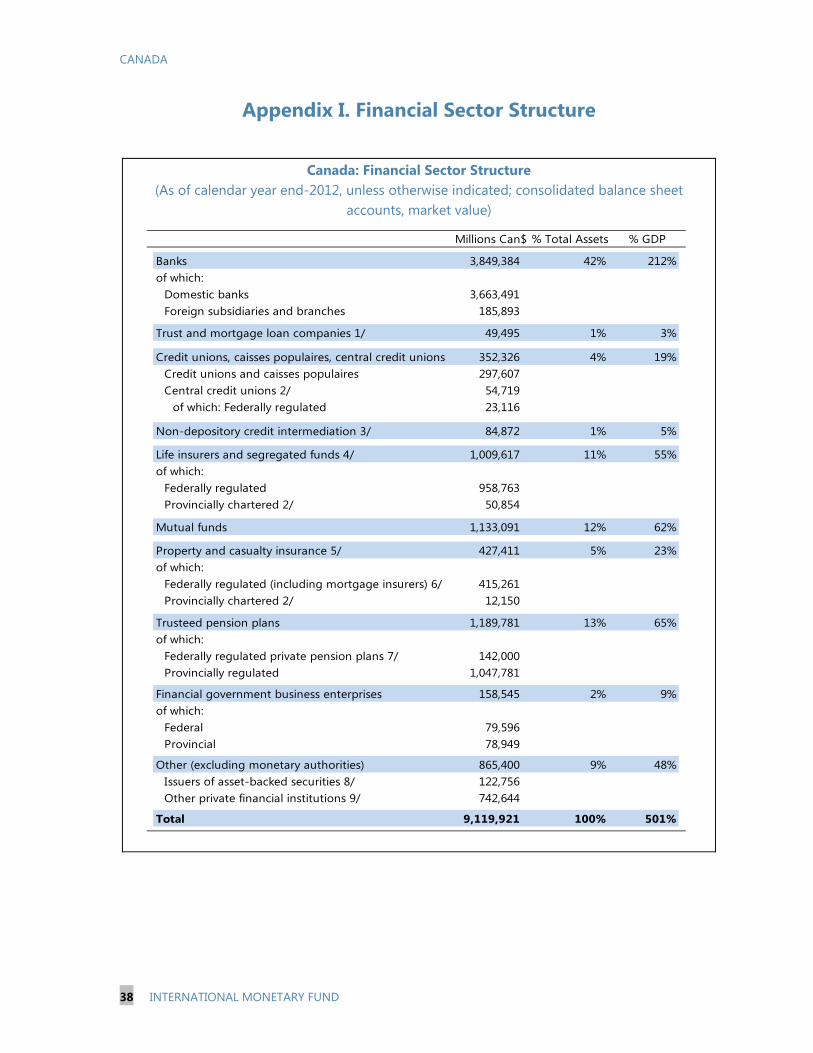
CANADA
38 INTERNATIONAL MONETARY FUND
Appendix I. Financial Sector Structure
Canada: Financial Sector Structure
(As of calendar year end-2012, unless otherwise indicated; consolidated balance sheet accounts, market value)
Millions Can$ % Total Assets % GDP
Banks 3,849,384 42% 212%of which:
Domestic banks 3,663,491Foreign subsidiaries and branches 185,893
Trust and mortgage loan companies 1/ 49,495 1% 3%
Credit unions, caisses populaires, central credit unions 352,326 4% 19%Credit unions and caisses populaires 297,607Central credit unions 2/ 54,719
of which: Federally regulated 23,116
Non-depository credit intermediation 3/ 84,872 1% 5%
Life insurers and segregated funds 4/ 1,009,617 11% 55%of which:
Federally regulated 958,763Provincially chartered 2/ 50,854
Mutual funds 1,133,091 12% 62%
Property and casualty insurance 5/ 427,411 5% 23%of which:
Federally regulated (including mortgage insurers) 6/ 415,261Provincially chartered 2/ 12,150
Trusteed pension plans 1,189,781 13% 65%of which:
Federally regulated private pension plans 7/ 142,000Provincially regulated 1,047,781
Financial government business enterprises 158,545 2% 9%of which:
Federal 79,596Provincial 78,949
Other (excluding monetary authorities) 865,400 9% 48%Issuers of asset-backed securities 8/ 122,756Other private financial institutions 9/ 742,644
Total 9,119,921 100% 501%
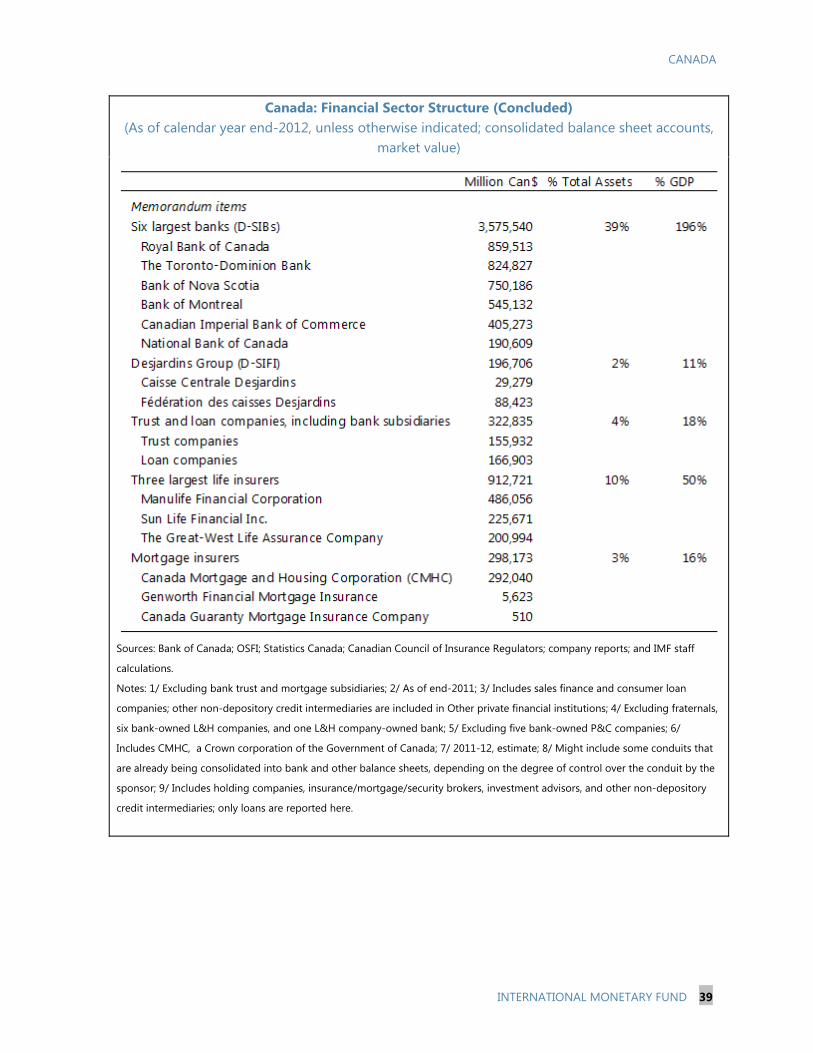
CANADA
INTERNATIONAL MONETARY FUND 39
Canada: Financial Sector Structure (Concluded) (As of calendar year end-2012, unless otherwise indicated; consolidated balance sheet accounts,
market value)
Sources: Bank of Canada; OSFI; Statistics Canada; Canadian Council of Insurance Regulators; company reports; and IMF staff
calculations.
Notes: 1/ Excluding bank trust and mortgage subsidiaries; 2/ As of end-2011; 3/ Includes sales finance and consumer loan
companies; other non-depository credit intermediaries are included in Other private financial institutions; 4/ Excluding fraternals,
six bank-owned L&H companies, and one L&H company-owned bank; 5/ Excluding five bank-owned P&C companies; 6/
Includes CMHC, a Crown corporation of the Government of Canada; 7/ 2011-12, estimate; 8/ Might include some conduits that
are already being consolidated into bank and other balance sheets, depending on the degree of control over the conduit by the
sponsor; 9/ Includes holding companies, insurance/mortgage/security brokers, investment advisors, and other non-depository
credit intermediaries; only loans are reported here.
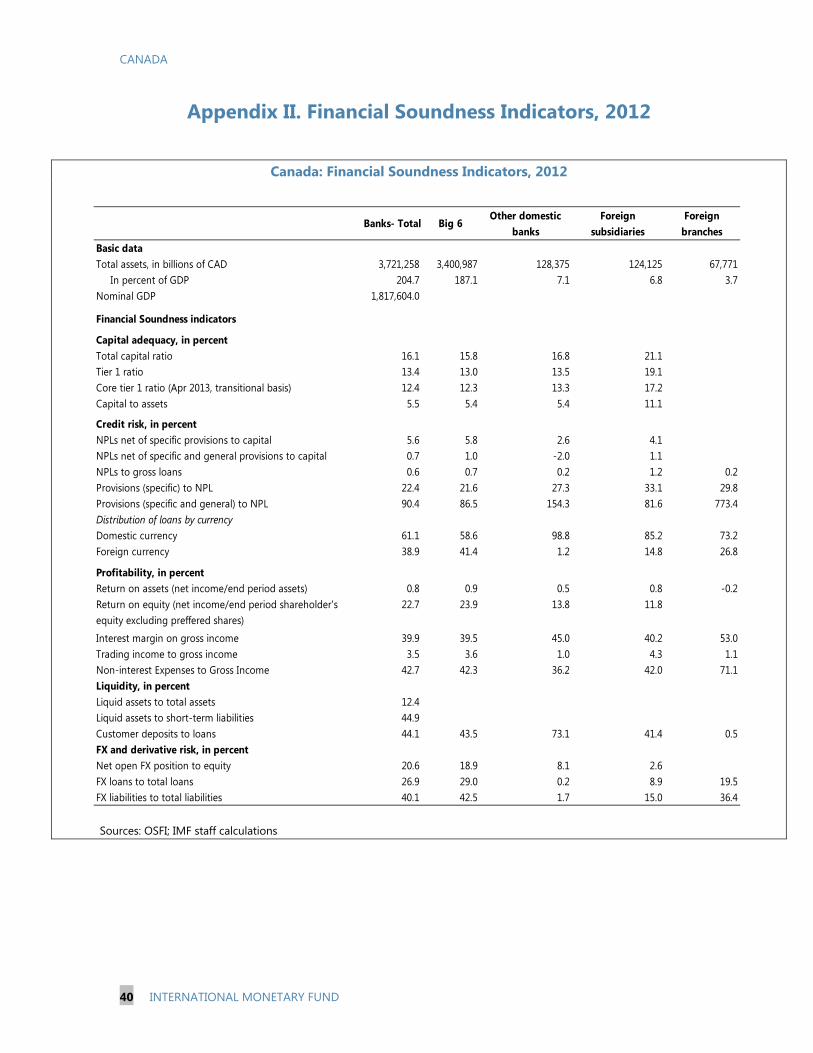
CANADA
40 INTERNATIONAL MONETARY FUND
Appendix II. Financial Soundness Indicators, 2012
Canada: Financial Soundness Indicators, 2012
Sources: OSFI; IMF staff calculations
Banks- Total Big 6Other domestic
banksForeign
subsidiariesForeign
branchesBasic dataTotal assets, in billions of CAD 3,721,258 3,400,987 128,375 124,125 67,771 In percent of GDP 204.7 187.1 7.1 6.8 3.7Nominal GDP 1,817,604.0
Financial Soundness indicators
Capital adequacy, in percentTotal capital ratio 16.1 15.8 16.8 21.1Tier 1 ratio 13.4 13.0 13.5 19.1Core tier 1 ratio (Apr 2013, transitional basis) 12.4 12.3 13.3 17.2Capital to assets 5.5 5.4 5.4 11.1
Credit risk, in percentNPLs net of specific provisions to capital 5.6 5.8 2.6 4.1NPLs net of specific and general provisions to capital 0.7 1.0 -2.0 1.1NPLs to gross loans 0.6 0.7 0.2 1.2 0.2Provisions (specific) to NPL 22.4 21.6 27.3 33.1 29.8Provisions (specific and general) to NPL 90.4 86.5 154.3 81.6 773.4Distribution of loans by currencyDomestic currency 61.1 58.6 98.8 85.2 73.2Foreign currency 38.9 41.4 1.2 14.8 26.8
Profitability, in percentReturn on assets (net income/end period assets) 0.8 0.9 0.5 0.8 -0.2Return on equity (net income/end period shareholder's equity excluding preffered shares)
22.7 23.9 13.8 11.8
Interest margin on gross income 39.9 39.5 45.0 40.2 53.0Trading income to gross income 3.5 3.6 1.0 4.3 1.1Non-interest Expenses to Gross Income 42.7 42.3 36.2 42.0 71.1Liquidity, in percentLiquid assets to total assets 12.4Liquid assets to short-term liabilities 44.9Customer deposits to loans 44.1 43.5 73.1 41.4 0.5FX and derivative risk, in percentNet open FX position to equity 20.6 18.9 8.1 2.6FX loans to total loans 26.9 29.0 0.2 8.9 19.5FX liabilities to total liabilities 40.1 42.5 1.7 15.0 36.4
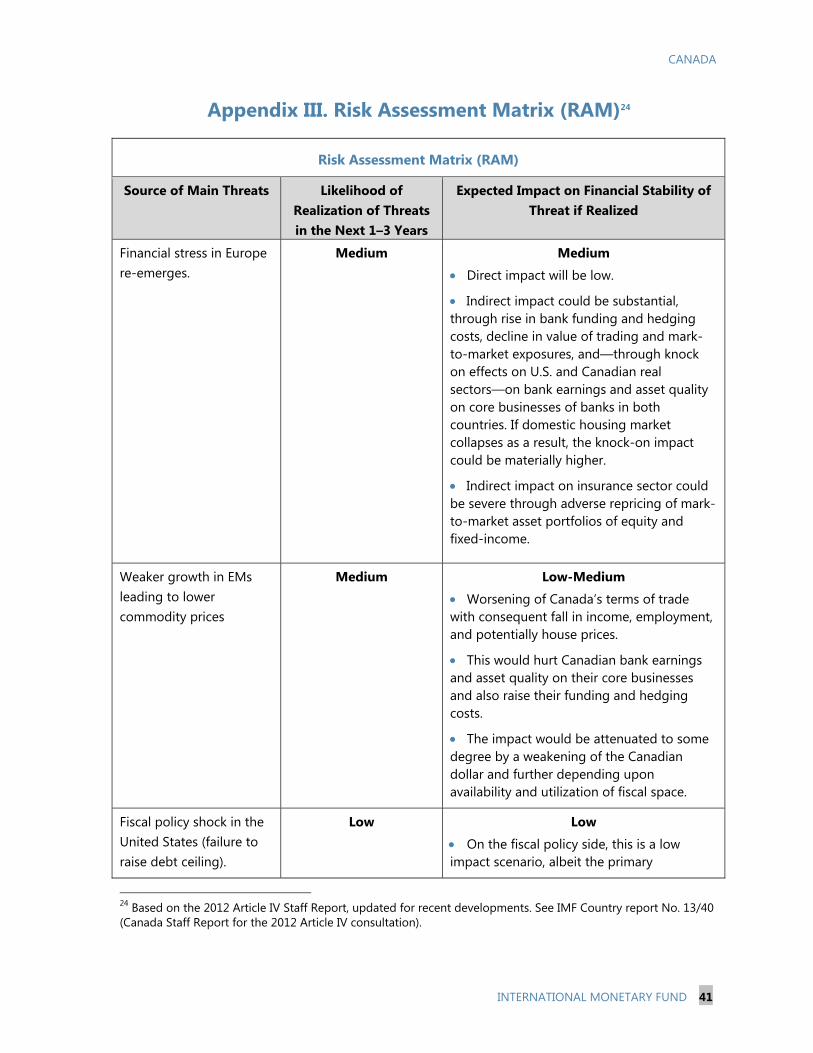
CANADA
INTERNATIONAL MONETARY FUND 41
Appendix III. Risk Assessment Matrix (RAM)24
Risk Assessment Matrix (RAM)
Source of Main Threats Likelihood of Realization of Threats in the Next 1–3 Years
Expected Impact on Financial Stability of Threat if Realized
Financial stress in Europe re-emerges.
Medium Medium
Direct impact will be low.
Indirect impact could be substantial, through rise in bank funding and hedging costs, decline in value of trading and mark-to-market exposures, and—through knock on effects on U.S. and Canadian real sectors—on bank earnings and asset quality on core businesses of banks in both countries. If domestic housing market collapses as a result, the knock-on impact could be materially higher.
Indirect impact on insurance sector could be severe through adverse repricing of mark-to-market asset portfolios of equity and fixed-income.
Weaker growth in EMs leading to lower commodity prices
Medium Low-Medium
Worsening of Canada’s terms of trade with consequent fall in income, employment, and potentially house prices.
This would hurt Canadian bank earnings and asset quality on their core businesses and also raise their funding and hedging costs.
The impact would be attenuated to some degree by a weakening of the Canadian dollar and further depending upon availability and utilization of fiscal space.
Fiscal policy shock in the United States (failure to raise debt ceiling).
Low Low
On the fiscal policy side, this is a low impact scenario, albeit the primary
24 Based on the 2012 Article IV Staff Report, updated for recent developments. See IMF Country report No. 13/40 (Canada Staff Report for the 2012 Article IV consultation).
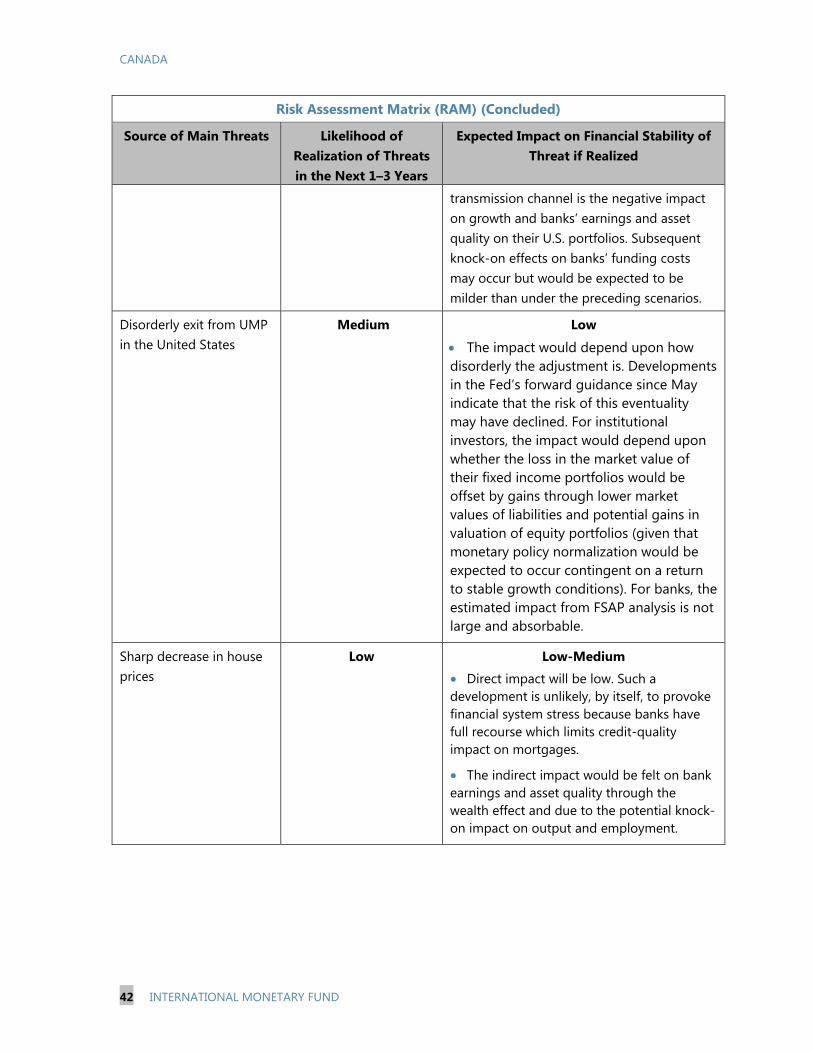
CANADA
42 INTERNATIONAL MONETARY FUND
Risk Assessment Matrix (RAM) (Concluded)
Source of Main Threats Likelihood of Realization of Threats in the Next 1–3 Years
Expected Impact on Financial Stability of Threat if Realized
transmission channel is the negative impact on growth and banks’ earnings and asset quality on their U.S. portfolios. Subsequent knock-on effects on banks’ funding costs may occur but would be expected to be milder than under the preceding scenarios.
Disorderly exit from UMP in the United States
Medium Low
The impact would depend upon how disorderly the adjustment is. Developments in the Fed’s forward guidance since May indicate that the risk of this eventuality may have declined. For institutional investors, the impact would depend upon whether the loss in the market value of their fixed income portfolios would be offset by gains through lower market values of liabilities and potential gains in valuation of equity portfolios (given that monetary policy normalization would be expected to occur contingent on a return to stable growth conditions). For banks, the estimated impact from FSAP analysis is not large and absorbable.
Sharp decrease in house prices
Low Low-Medium
Direct impact will be low. Such a development is unlikely, by itself, to provoke financial system stress because banks have full recourse which limits credit-quality impact on mortgages.
The indirect impact would be felt on bank earnings and asset quality through the wealth effect and due to the potential knock-on impact on output and employment.
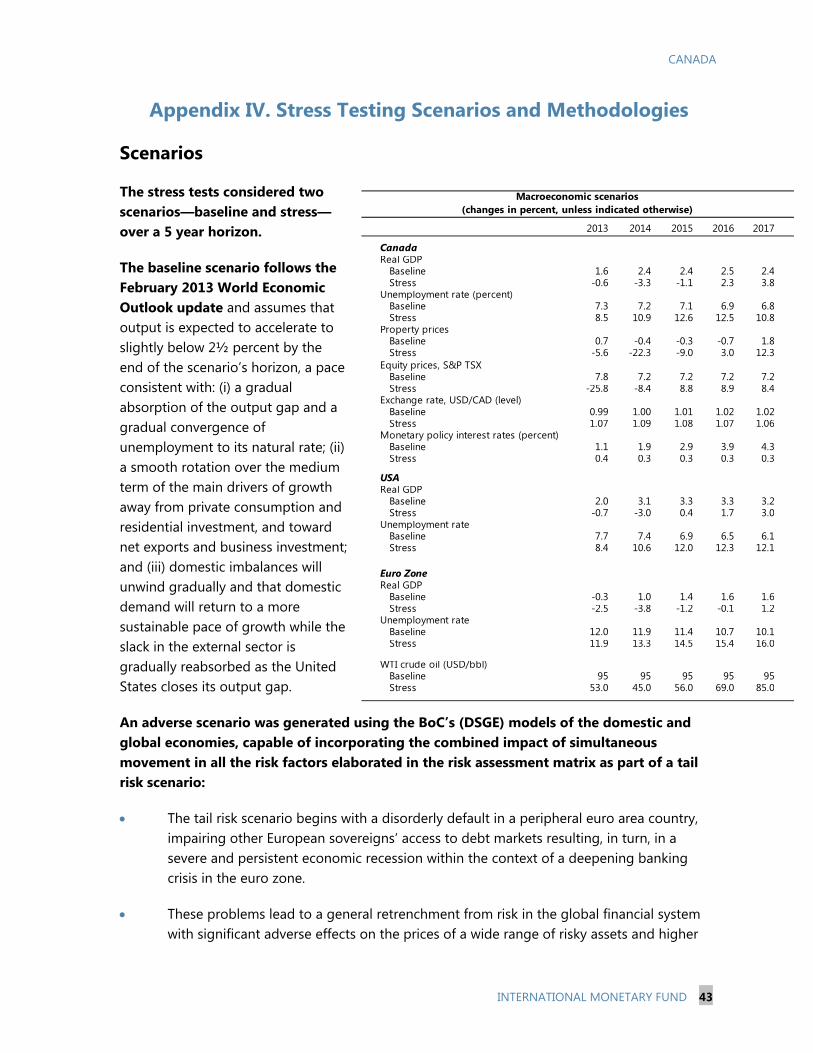
CANADA
INTERNATIONAL MONETARY FUND 43
2013 2014 2015 2016 2017
CanadaReal GDP Baseline 1.6 2.4 2.4 2.5 2.4 Stress -0.6 -3.3 -1.1 2.3 3.8
Unemployment rate (percent) Baseline 7.3 7.2 7.1 6.9 6.8 Stress 8.5 10.9 12.6 12.5 10.8
Property prices Baseline 0.7 -0.4 -0.3 -0.7 1.8 Stress -5.6 -22.3 -9.0 3.0 12.3
Equity prices, S&P TSX Baseline 7.8 7.2 7.2 7.2 7.2 Stress -25.8 -8.4 8.8 8.9 8.4
Exchange rate, USD/CAD (level) Baseline 0.99 1.00 1.01 1.02 1.02 Stress 1.07 1.09 1.08 1.07 1.06
Monetary policy interest rates (percent) Baseline 1.1 1.9 2.9 3.9 4.3 Stress 0.4 0.3 0.3 0.3 0.3
USAReal GDP Baseline 2.0 3.1 3.3 3.3 3.2 Stress -0.7 -3.0 0.4 1.7 3.0
Unemployment rate Baseline 7.7 7.4 6.9 6.5 6.1 Stress 8.4 10.6 12.0 12.3 12.1
Euro ZoneReal GDP Baseline -0.3 1.0 1.4 1.6 1.6 Stress -2.5 -3.8 -1.2 -0.1 1.2
Unemployment rate Baseline 12.0 11.9 11.4 10.7 10.1 Stress 11.9 13.3 14.5 15.4 16.0
WTI crude oil (USD/bbl) Baseline 95 95 95 95 95 Stress 53.0 45.0 56.0 69.0 85.0
(changes in percent, unless indicated otherwise)Macroeconomic scenarios
Appendix IV. Stress Testing Scenarios and Methodologies
Scenarios
The stress tests considered two scenarios—baseline and stress—over a 5 year horizon.
The baseline scenario follows the February 2013 World Economic Outlook update and assumes that output is expected to accelerate to slightly below 2½ percent by the end of the scenario’s horizon, a pace consistent with: (i) a gradual absorption of the output gap and a gradual convergence of unemployment to its natural rate; (ii) a smooth rotation over the medium term of the main drivers of growth away from private consumption and residential investment, and toward net exports and business investment; and (iii) domestic imbalances will unwind gradually and that domestic demand will return to a more sustainable pace of growth while the slack in the external sector is gradually reabsorbed as the United States closes its output gap.
An adverse scenario was generated using the BoC’s (DSGE) models of the domestic and global economies, capable of incorporating the combined impact of simultaneous movement in all the risk factors elaborated in the risk assessment matrix as part of a tail risk scenario:
The tail risk scenario begins with a disorderly default in a peripheral euro area country, impairing other European sovereigns’ access to debt markets resulting, in turn, in a severe and persistent economic recession within the context of a deepening banking crisis in the euro zone.
These problems lead to a general retrenchment from risk in the global financial system with significant adverse effects on the prices of a wide range of risky assets and higher
CANADA
44 INTERNATIONAL MONETARY FUND
costs for banks, including U.S. and Canadian banks. Simultaneously, risk premia rise everywhere, including the UK, U.S. and Canadian markets.
This adverse dynamics trigger, through confidence and wealth channels, a discrete drop in global growth, including in emerging markets, putting significant downward pressure on global demand for commodities, resulting in a marked decline in commodity prices.
In the United States, risk premium and wealth effects lead to a severe tightening of lending standards and a marked deterioration in business investment and consumption. Economic fragility is heightened by the fiscal constraint required from the positive resolution of the fiscal cliff by the U.S. Government with the aim of improving the sovereign debt situation. Overall, this leads to a protracted recession accompanied by a persistent increase in the unemployment rate.
Under this scenario, Canada faces financial headwinds, a large foreign demand shock, decreasing commodities prices, rising uncertainty and adverse confidence and wealth effects affecting both businesses and households. Besides the corresponding sharp decline in domestic demand, Canadian banks face rising funding costs and pressure on asset quality which results in significantly tighter lending standards. In this context, the Canadian economy experiences 9 quarters of negative growth and recovers very gradually over the last two and a half years of the 5-year stress horizon. House prices decline by 35 percent over the first 3 years of the stress scenario horizon. The unemployment rate rises steadily to peak at 13.2 percent in the beginning of the fourth year before decreasing very gradually
Methodologies
The three-pronged approach was used for solvency stress testing (see Technical note for more details):
Bottom up: the six largest banks used their internal models to stress-test the income statement, balance sheet, RWAs and some parameters of expected losses (e.g. LGDs) and RWAs (credit quality migration only, PD and LGDs were not stressed for credit risk RWAs) against the tail risk and baseline scenarios. All projections and assumptions should have been consistent with assumptions specified in the scenarios and instructions provided by OSFI and the BoC. The charge for impairment reflects, in addition to the impact of the assumed increase in allowances for identified impairment (which should have been greater of banks’ own projected credit losses and the expected credit losses defined as the product of the stressed PDs, provided by the BoC, stressed LGDs projected by banks and exposures), projected changes in the collective allowance for unidentified impairment. No capital actions that were designed to offset the impact of the stress scenario on the bank were allowed. Market risk RWAs were stressed by setting the VaR to Stressed VaR when GDP growth rate is negative and incremental risk charge was calculated based on stressed correlations.
CANADA
INTERNATIONAL MONETARY FUND 45
Several single-factor tests were considered in the bottom-up exercise: (i) interest rate shock in the banking book to isolate the impact of re-pricing of assets, liabilities and off-balance sheet positions, (ii) market risk shock in the trading book, AFS securities and CVA to isolate the impact of market risk shocks on the trading book, AFS securities and on CVA on the OTC derivatives, and (iii) incremental risk charge RWA. All tests used one-time shock scenarios which are somewhat more severe than the environment in first year of the stress scenario.
The IMF ToD solvency. The IMF approach followed the balance sheet-based approach somewhat similar to Schmieder et al (2011) which assesses solvency of individual banks through changes in net income and RWAs. While this approach resembles the bottom up stress test, the framework was based on “economic” measures of solvency, both capital and RWAs. Charge for impairment was assumed to be equal to expected losses, with the assumption that loan loss reserves serve as the first line of defense against credit losses. Most of the other income statement items were forecasted using panel econometrics models. Downturn LGDs used in calculation of RWAs in the bottom up exercise, point-in-time PDs provided by the BoC were used to calculate expected losses. RWAs for credit risk were calculated by Basel II asset classes using IRB formula. However, economic definition of credit risk RWAs was used-trough-the-cycle PDs were replaced by the PDs used for calculation of expected losses. In the sensitivity analysis, RWAs were calculated using regulatory parameters but were also stress-tested against positive asset correlation and stressed LGDs used in calculation of expected losses in the BU test.
The OSFI ToD solvency: OSFI’s approach followed a template similar to the bottom-up and IMF approaches. Income statement items, excluding the charge for impairment, were calculated based on corresponding balance sheet items which were projected using loans and deposit dynamics prescribed in the stress scenario. The charge for impairment was projected using an algorithm that simultaneously projects the balance sheet loan book, performing, non-performing and impaired loans and loan loss reserves using regulatory formulas. RWAs for credit risk were calculated using risk weights from the previous year’s bottom-up stress scenario.
The liquidity stress test, based on the Bank of Canada’s top-down MFRAF model, was designed to capture the dynamic interaction between solvency risk and funding pressures generated by balance-sheet mismatches. In this framework, funding illiquidity arises endogenously for a bank due to a combination of credit losses (expected loss under the stressed scenario, calculated using PDs, LGDs and EADs from the bottom-up analysis), the bank’s starting capital position, and its balance-sheet maturity mismatches that changes market expectations about the bank’s prospects sufficiently in an adverse manner. Besides the ability to capture such “second-round effects” in a parsimonious fashion, an added advantage of the model is its ability to incorporate information contagion; i.e., the risk that a bank faces funding liquidity risk not as a result of its own creditors focusing on its own solvency and liquidity profiles, but as a result of its creditors observing another bank defaulting. The funding pressures and illiquidity are translated
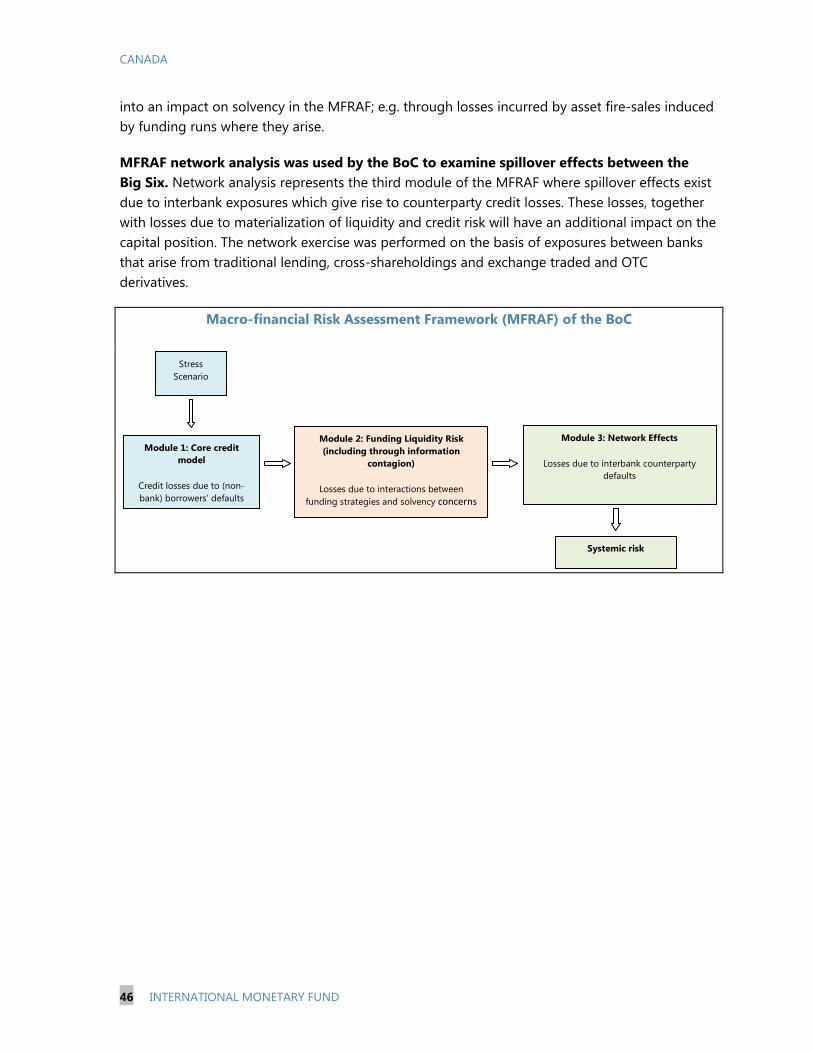
CANADA
46 INTERNATIONAL MONETARY FUND
into an impact on solvency in the MFRAF; e.g. through losses incurred by asset fire-sales induced by funding runs where they arise.
MFRAF network analysis was used by the BoC to examine spillover effects between the Big Six. Network analysis represents the third module of the MFRAF where spillover effects exist due to interbank exposures which give rise to counterparty credit losses. These losses, together with losses due to materialization of liquidity and credit risk will have an additional impact on the capital position. The network exercise was performed on the basis of exposures between banks that arise from traditional lending, cross-shareholdings and exchange traded and OTC derivatives.
Macro-financial Risk Assessment Framework (MFRAF) of the BoC
Stress Scenario
Systemic risk
Module 2: Funding Liquidity Risk (including through information
contagion)
Losses due to interactions between funding strategies and solvency concerns
Module 1: Core credit model
Credit losses due to (non-bank) borrowers’ defaults
Module 3: Network Effects
Losses due to interbank counterparty defaults
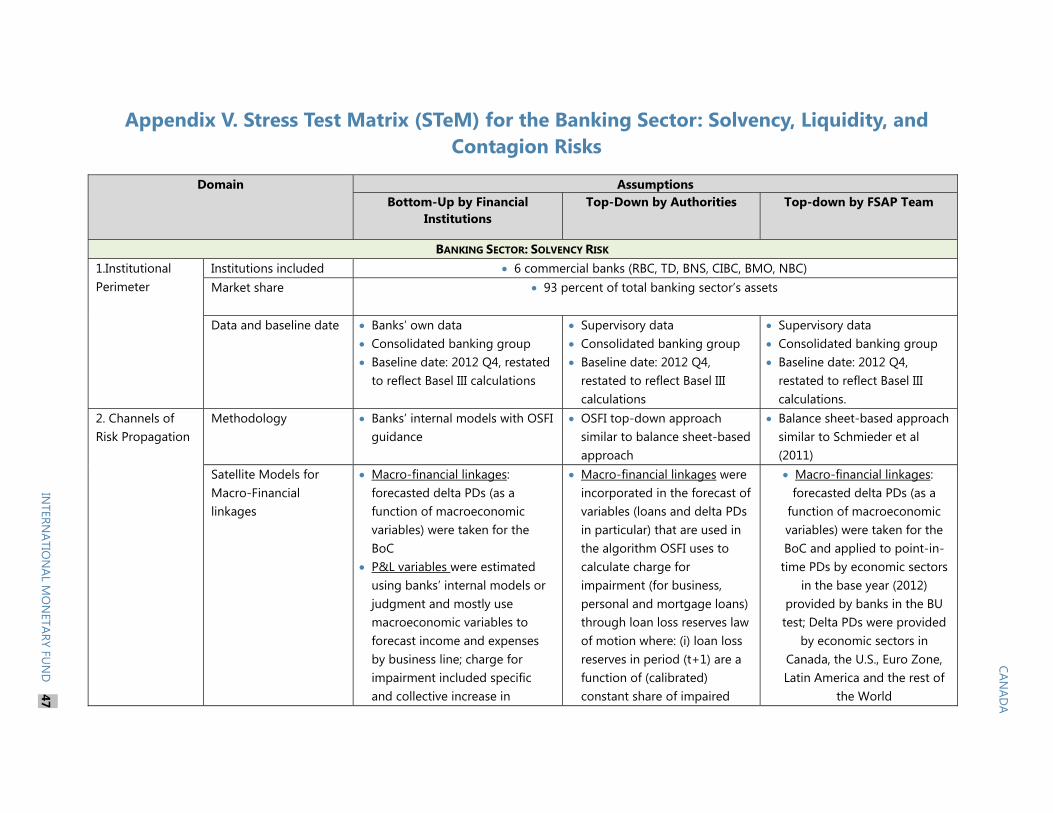
CANAD
A
INTERN
ATION
AL MO
NETARY FU
ND
47
Appendix V. Stress Test Matrix (STeM) for the Banking Sector: Solvency, Liquidity, and Contagion Risks
Domain Assumptions Bottom-Up by Financial
Institutions Top-Down by Authorities Top-down by FSAP Team
BANKING SECTOR: SOLVENCY RISK 1.Institutional Perimeter
Institutions included 6 commercial banks (RBC, TD, BNS, CIBC, BMO, NBC) Market share 93 percent of total banking sector’s assets
Data and baseline date Banks’ own data
Consolidated banking group Baseline date: 2012 Q4, restated
to reflect Basel III calculations
Supervisory data Consolidated banking group Baseline date: 2012 Q4,
restated to reflect Basel III calculations
Supervisory data Consolidated banking group Baseline date: 2012 Q4,
restated to reflect Basel III calculations.
2. Channels of Risk Propagation
Methodology Banks’ internal models with OSFI guidance
OSFI top-down approach similar to balance sheet-based approach
Balance sheet-based approach similar to Schmieder et al (2011)
Satellite Models for Macro-Financial linkages
Macro-financial linkages: forecasted delta PDs (as a function of macroeconomic variables) were taken for the BoC
P&L variables were estimated using banks’ internal models or judgment and mostly use macroeconomic variables to forecast income and expenses by business line; charge for impairment included specific and collective increase in
Macro-financial linkages were incorporated in the forecast of variables (loans and delta PDs in particular) that are used in the algorithm OSFI uses to calculate charge for impairment (for business, personal and mortgage loans) through loan loss reserves law of motion where: (i) loan loss reserves in period (t+1) are a function of (calibrated) constant share of impaired
Macro-financial linkages: forecasted delta PDs (as a
function of macroeconomic variables) were taken for the BoC and applied to point-in-time PDs by economic sectors
in the base year (2012) provided by banks in the BU test; Delta PDs were provided
by economic sectors in Canada, the U.S., Euro Zone, Latin America and the rest of
the World
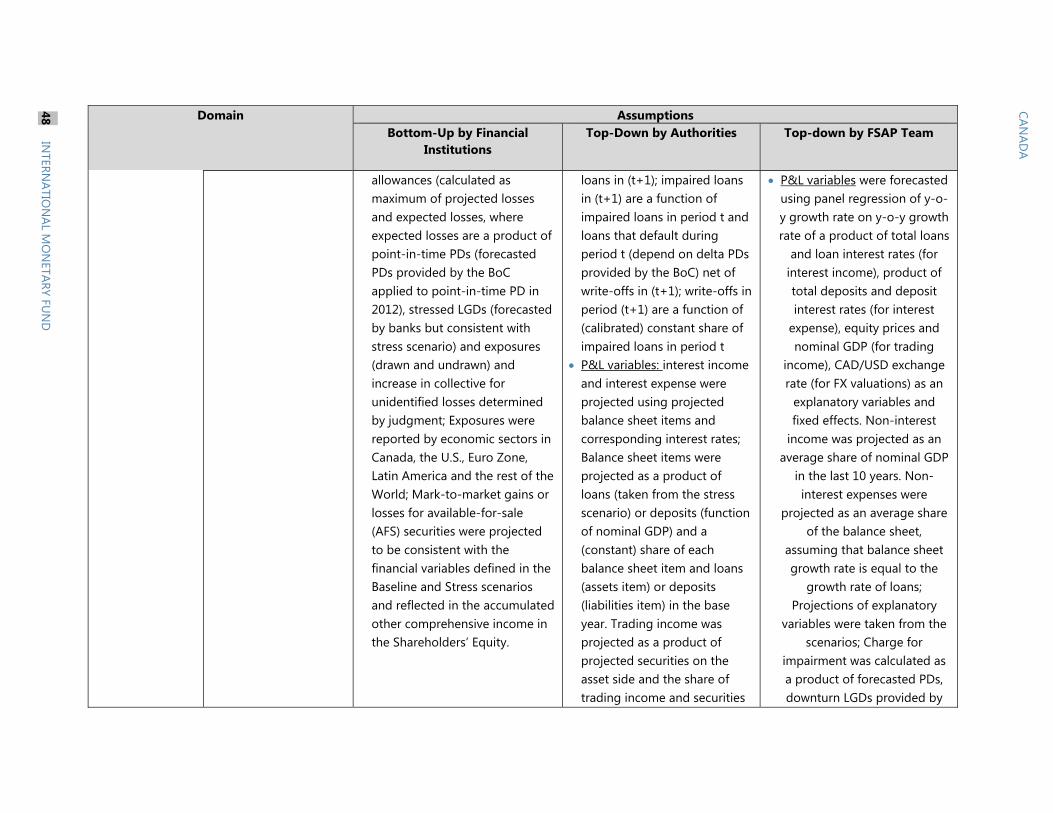
CANAD
A 48
INTERN
ATION
AL MO
NETARY FU
ND
Domain Assumptions Bottom-Up by Financial
Institutions Top-Down by Authorities Top-down by FSAP Team
allowances (calculated as maximum of projected losses and expected losses, where expected losses are a product of point-in-time PDs (forecasted PDs provided by the BoC applied to point-in-time PD in 2012), stressed LGDs (forecasted by banks but consistent with stress scenario) and exposures (drawn and undrawn) and increase in collective for unidentified losses determined by judgment; Exposures were reported by economic sectors in Canada, the U.S., Euro Zone, Latin America and the rest of the World; Mark-to-market gains or losses for available-for-sale (AFS) securities were projected to be consistent with the financial variables defined in the Baseline and Stress scenarios and reflected in the accumulated other comprehensive income in the Shareholders’ Equity.
loans in (t+1); impaired loans in (t+1) are a function of impaired loans in period t and loans that default during period t (depend on delta PDs provided by the BoC) net of write-offs in (t+1); write-offs in period (t+1) are a function of (calibrated) constant share of impaired loans in period t
P&L variables: interest income and interest expense were projected using projected balance sheet items and corresponding interest rates; Balance sheet items were projected as a product of loans (taken from the stress scenario) or deposits (function of nominal GDP) and a (constant) share of each balance sheet item and loans (assets item) or deposits (liabilities item) in the base year. Trading income was projected as a product of projected securities on the asset side and the share of trading income and securities
P&L variables were forecasted using panel regression of y-o-y growth rate on y-o-y growth rate of a product of total loans
and loan interest rates (for interest income), product of total deposits and deposit interest rates (for interest
expense), equity prices and nominal GDP (for trading
income), CAD/USD exchange rate (for FX valuations) as an
explanatory variables and fixed effects. Non-interest
income was projected as an average share of nominal GDP
in the last 10 years. Non-interest expenses were
projected as an average share of the balance sheet,
assuming that balance sheet growth rate is equal to the
growth rate of loans; Projections of explanatory
variables were taken from the scenarios; Charge for
impairment was calculated as a product of forecasted PDs, downturn LGDs provided by
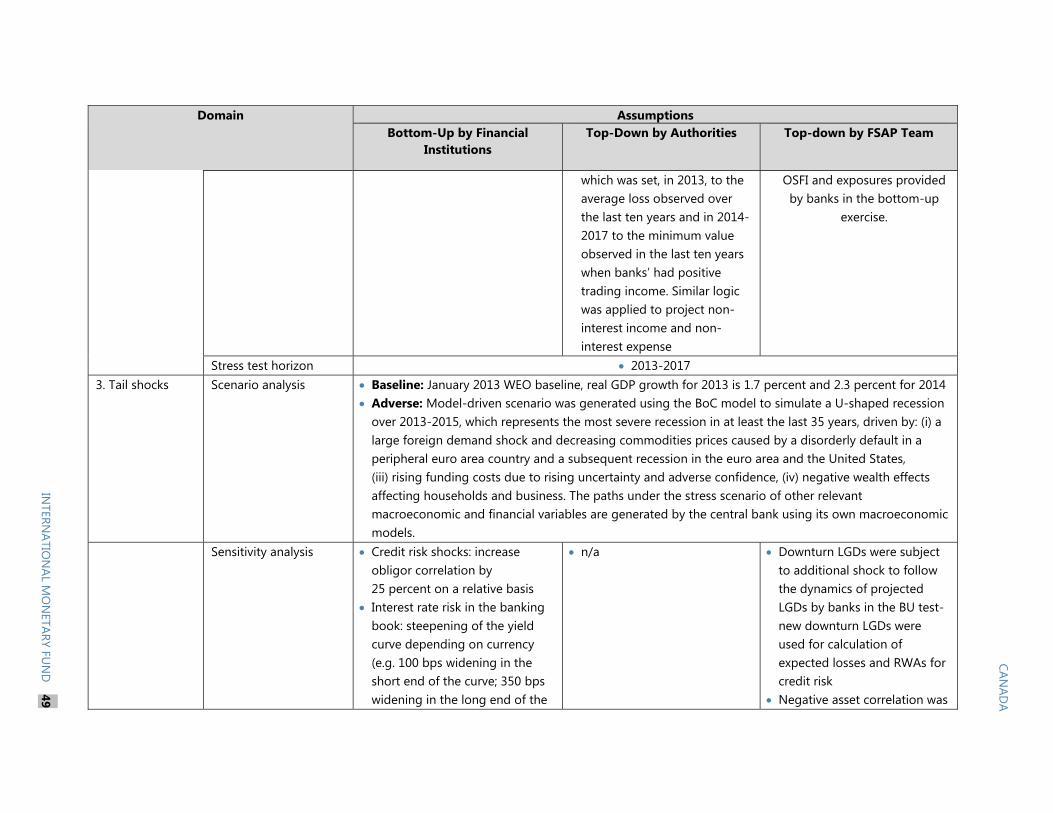
CANAD
A
INTERN
ATION
AL MO
NETARY FU
ND
49
Domain Assumptions Bottom-Up by Financial
Institutions Top-Down by Authorities Top-down by FSAP Team
which was set, in 2013, to the average loss observed over the last ten years and in 2014-2017 to the minimum value observed in the last ten years when banks’ had positive trading income. Similar logic was applied to project non-interest income and non-interest expense
OSFI and exposures provided by banks in the bottom-up
exercise.
Stress test horizon 2013-2017 3. Tail shocks Scenario analysis
Baseline: January 2013 WEO baseline, real GDP growth for 2013 is 1.7 percent and 2.3 percent for 2014 Adverse: Model-driven scenario was generated using the BoC model to simulate a U-shaped recession
over 2013-2015, which represents the most severe recession in at least the last 35 years, driven by: (i) a large foreign demand shock and decreasing commodities prices caused by a disorderly default in a peripheral euro area country and a subsequent recession in the euro area and the United States, (iii) rising funding costs due to rising uncertainty and adverse confidence, (iv) negative wealth effects affecting households and business. The paths under the stress scenario of other relevant macroeconomic and financial variables are generated by the central bank using its own macroeconomic models.
Sensitivity analysis Credit risk shocks: increase obligor correlation by 25 percent on a relative basis
Interest rate risk in the banking book: steepening of the yield curve depending on currency (e.g. 100 bps widening in the short end of the curve; 350 bps widening in the long end of the
n/a Downturn LGDs were subject to additional shock to follow the dynamics of projected LGDs by banks in the BU test- new downturn LGDs were used for calculation of expected losses and RWAs for credit risk
Negative asset correlation was
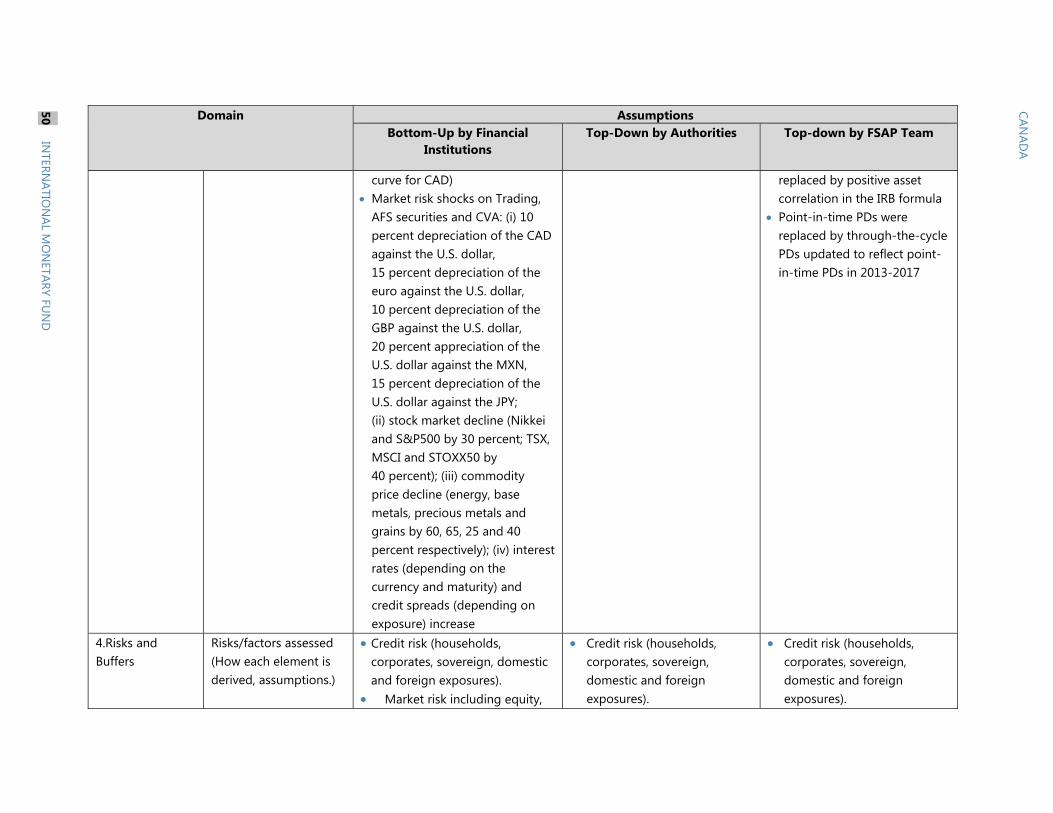
CANAD
A 50
INTERN
ATION
AL MO
NETARY FU
ND
Domain Assumptions Bottom-Up by Financial
Institutions Top-Down by Authorities Top-down by FSAP Team
curve for CAD) Market risk shocks on Trading,
AFS securities and CVA: (i) 10 percent depreciation of the CAD against the U.S. dollar, 15 percent depreciation of the euro against the U.S. dollar, 10 percent depreciation of the GBP against the U.S. dollar, 20 percent appreciation of the U.S. dollar against the MXN, 15 percent depreciation of the U.S. dollar against the JPY; (ii) stock market decline (Nikkei and S&P500 by 30 percent; TSX, MSCI and STOXX50 by 40 percent); (iii) commodity price decline (energy, base metals, precious metals and grains by 60, 65, 25 and 40 percent respectively); (iv) interest rates (depending on the currency and maturity) and credit spreads (depending on exposure) increase
replaced by positive asset correlation in the IRB formula
Point-in-time PDs were replaced by through-the-cycle PDs updated to reflect point-in-time PDs in 2013-2017
4.Risks and Buffers
Risks/factors assessed (How each element is derived, assumptions.)
Credit risk (households, corporates, sovereign, domestic and foreign exposures).
Market risk including equity,
Credit risk (households, corporates, sovereign, domestic and foreign exposures).
Credit risk (households, corporates, sovereign, domestic and foreign exposures).
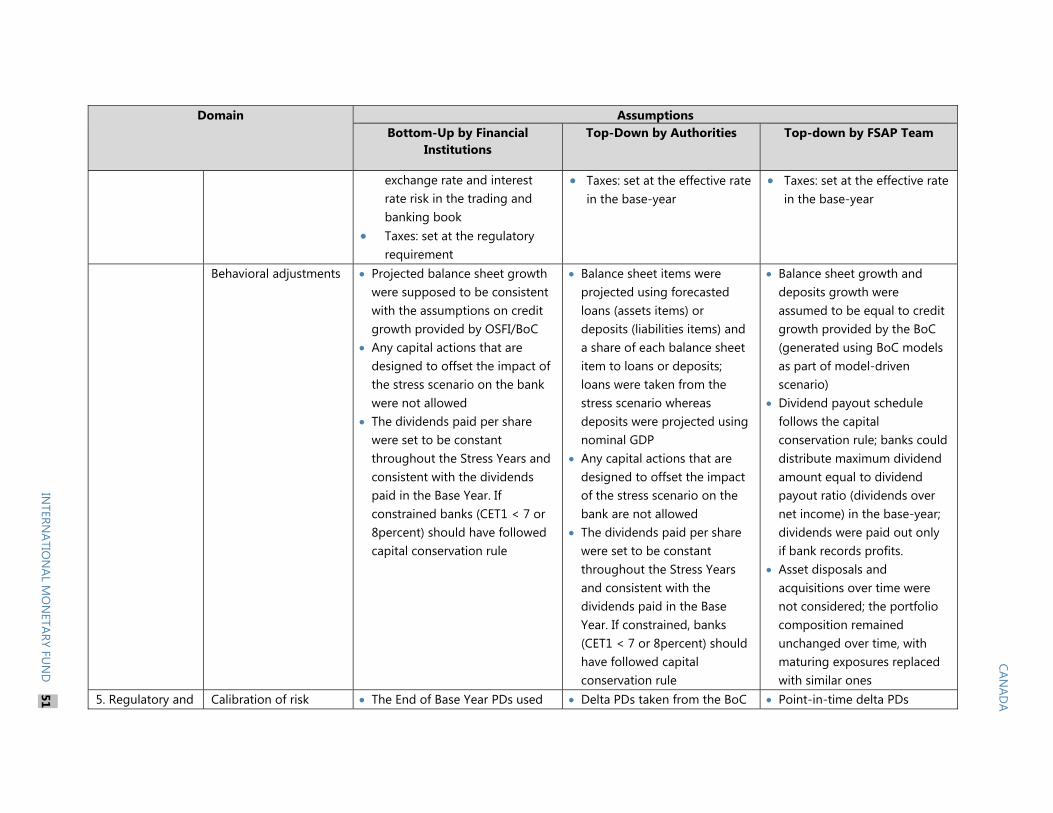
CANAD
A
INTERN
ATION
AL MO
NETARY FU
ND
51
Domain Assumptions Bottom-Up by Financial
Institutions Top-Down by Authorities Top-down by FSAP Team
exchange rate and interest rate risk in the trading and banking book
Taxes: set at the regulatory requirement
Taxes: set at the effective rate in the base-year
Taxes: set at the effective rate in the base-year
Behavioral adjustments
Projected balance sheet growth were supposed to be consistent with the assumptions on credit growth provided by OSFI/BoC
Any capital actions that are designed to offset the impact of the stress scenario on the bank were not allowed
The dividends paid per share were set to be constant throughout the Stress Years and consistent with the dividends paid in the Base Year. If constrained banks (CET1 < 7 or 8percent) should have followed capital conservation rule
Balance sheet items were projected using forecasted loans (assets items) or deposits (liabilities items) and a share of each balance sheet item to loans or deposits; loans were taken from the stress scenario whereas deposits were projected using nominal GDP
Any capital actions that are designed to offset the impact of the stress scenario on the bank are not allowed
The dividends paid per share were set to be constant throughout the Stress Years and consistent with the dividends paid in the Base Year. If constrained, banks (CET1 < 7 or 8percent) should have followed capital conservation rule
Balance sheet growth and deposits growth were assumed to be equal to credit growth provided by the BoC (generated using BoC models as part of model-driven scenario)
Dividend payout schedule follows the capital conservation rule; banks could distribute maximum dividend amount equal to dividend payout ratio (dividends over net income) in the base-year; dividends were paid out only if bank records profits.
Asset disposals and acquisitions over time were not considered; the portfolio composition remained unchanged over time, with maturing exposures replaced with similar ones
5. Regulatory and Calibration of risk The End of Base Year PDs used Delta PDs taken from the BoC Point-in-time delta PDs
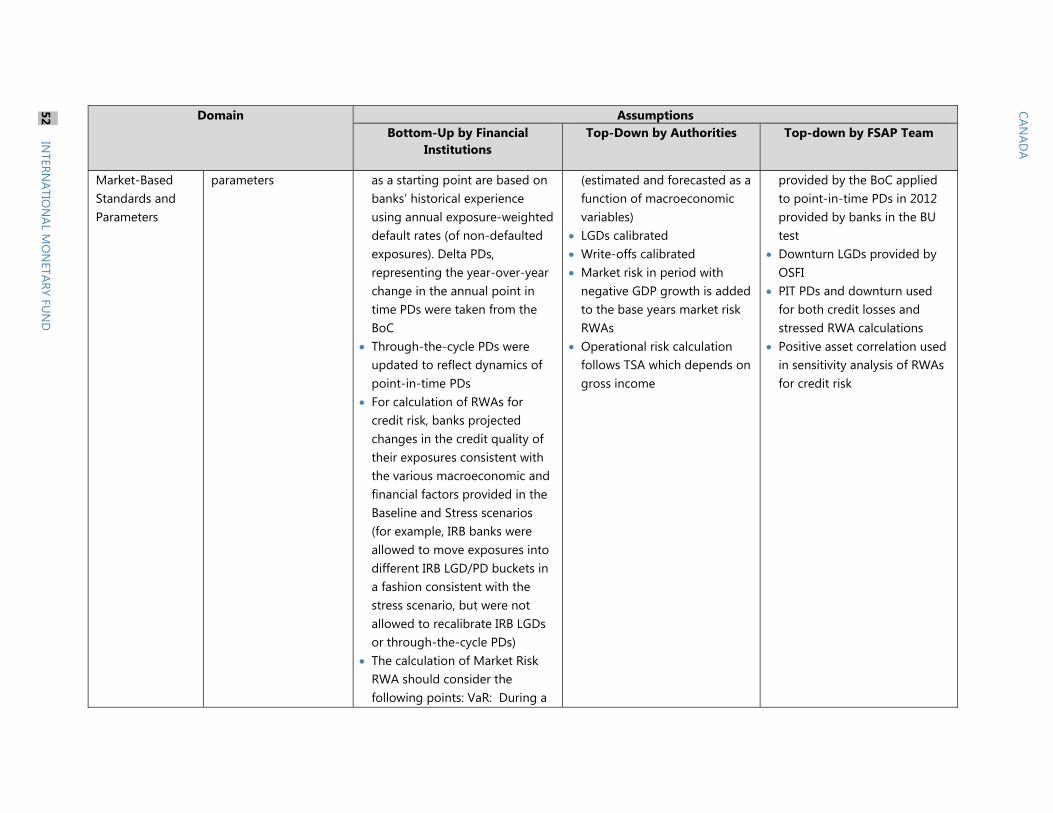
CANAD
A 52
INTERN
ATION
AL MO
NETARY FU
ND
Domain Assumptions Bottom-Up by Financial
Institutions Top-Down by Authorities Top-down by FSAP Team
Market-Based Standards and Parameters
parameters
as a starting point are based on banks’ historical experience using annual exposure-weighted default rates (of non-defaulted exposures). Delta PDs, representing the year-over-year change in the annual point in time PDs were taken from the BoC
Through-the-cycle PDs were updated to reflect dynamics of point-in-time PDs
For calculation of RWAs for credit risk, banks projected changes in the credit quality of their exposures consistent with the various macroeconomic and financial factors provided in the Baseline and Stress scenarios (for example, IRB banks were allowed to move exposures into different IRB LGD/PD buckets in a fashion consistent with the stress scenario, but were not allowed to recalibrate IRB LGDs or through-the-cycle PDs)
The calculation of Market Risk RWA should consider the following points: VaR: During a
(estimated and forecasted as a function of macroeconomic variables)
LGDs calibrated Write-offs calibrated Market risk in period with
negative GDP growth is added to the base years market risk RWAs
Operational risk calculation follows TSA which depends on gross income
provided by the BoC applied to point-in-time PDs in 2012 provided by banks in the BU test
Downturn LGDs provided by OSFI
PIT PDs and downturn used for both credit losses and stressed RWA calculations
Positive asset correlation used in sensitivity analysis of RWAs for credit risk
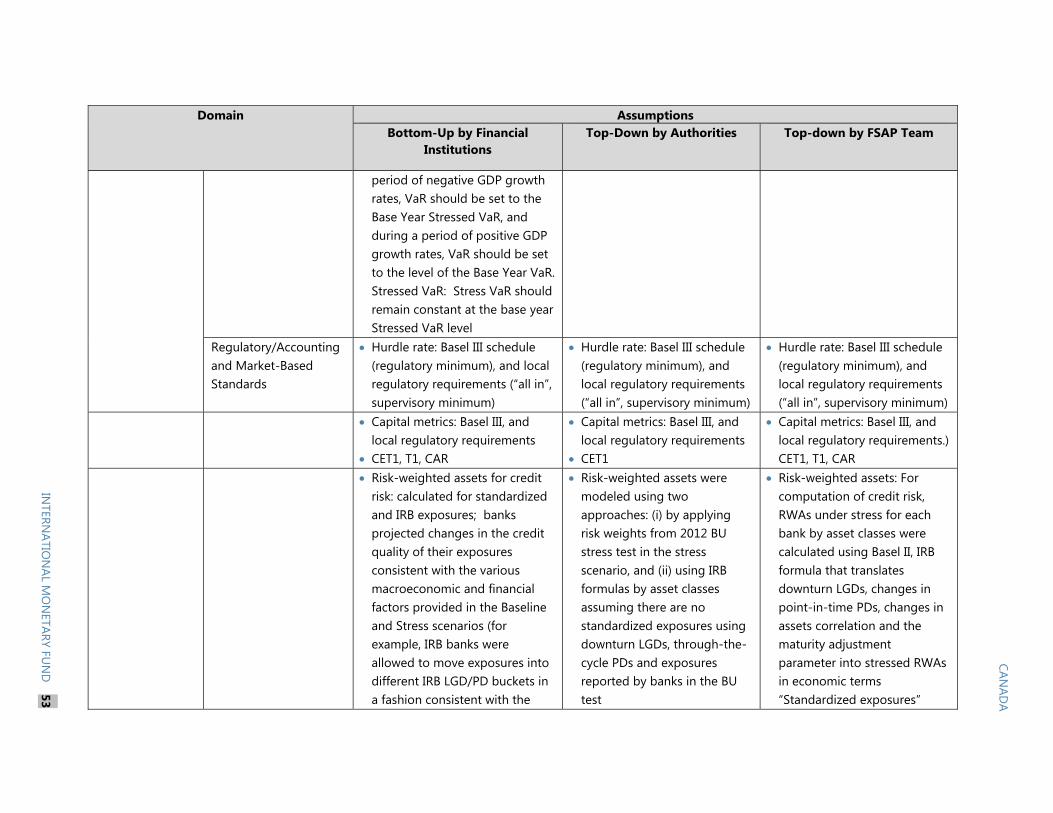
CANAD
A
INTERN
ATION
AL MO
NETARY FU
ND
53
Domain Assumptions Bottom-Up by Financial
Institutions Top-Down by Authorities Top-down by FSAP Team
period of negative GDP growth rates, VaR should be set to the Base Year Stressed VaR, and during a period of positive GDP growth rates, VaR should be set to the level of the Base Year VaR. Stressed VaR: Stress VaR should remain constant at the base year Stressed VaR level
Regulatory/Accounting and Market-Based Standards
Hurdle rate: Basel III schedule (regulatory minimum), and local regulatory requirements (“all in”, supervisory minimum)
Hurdle rate: Basel III schedule (regulatory minimum), and local regulatory requirements (“all in”, supervisory minimum)
Hurdle rate: Basel III schedule (regulatory minimum), and local regulatory requirements (“all in”, supervisory minimum)
Capital metrics: Basel III, and local regulatory requirements
CET1, T1, CAR
Capital metrics: Basel III, and local regulatory requirements
CET1
Capital metrics: Basel III, and local regulatory requirements.) CET1, T1, CAR
Risk-weighted assets for credit risk: calculated for standardized and IRB exposures; banks projected changes in the credit quality of their exposures consistent with the various macroeconomic and financial factors provided in the Baseline and Stress scenarios (for example, IRB banks were allowed to move exposures into different IRB LGD/PD buckets in a fashion consistent with the
Risk-weighted assets were modeled using two approaches: (i) by applying risk weights from 2012 BU stress test in the stress scenario, and (ii) using IRB formulas by asset classes assuming there are no standardized exposures using downturn LGDs, through-the-cycle PDs and exposures reported by banks in the BU test
Risk-weighted assets: For computation of credit risk, RWAs under stress for each bank by asset classes were calculated using Basel II, IRB formula that translates downturn LGDs, changes in point-in-time PDs, changes in assets correlation and the maturity adjustment parameter into stressed RWAs in economic terms “Standardized exposures”
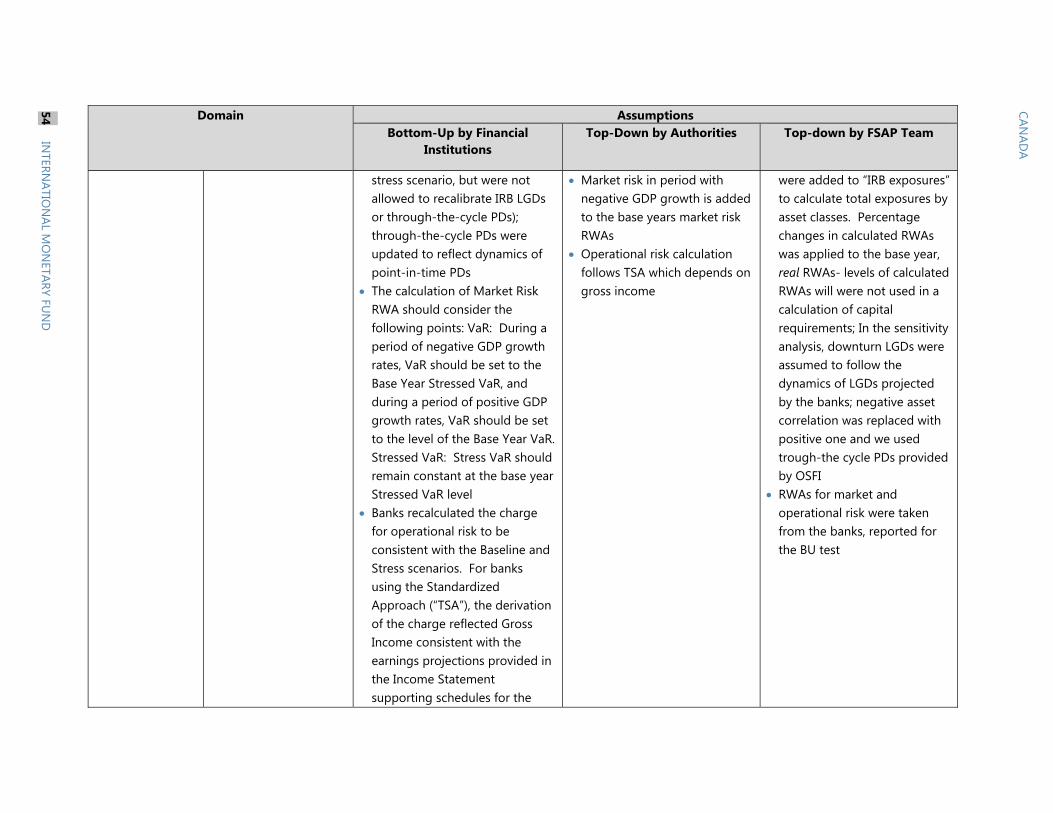
CANAD
A 54
INTERN
ATION
AL MO
NETARY FU
ND
Domain Assumptions Bottom-Up by Financial
Institutions Top-Down by Authorities Top-down by FSAP Team
stress scenario, but were not allowed to recalibrate IRB LGDs or through-the-cycle PDs); through-the-cycle PDs were updated to reflect dynamics of point-in-time PDs
The calculation of Market Risk RWA should consider the following points: VaR: During a period of negative GDP growth rates, VaR should be set to the Base Year Stressed VaR, and during a period of positive GDP growth rates, VaR should be set to the level of the Base Year VaR. Stressed VaR: Stress VaR should remain constant at the base year Stressed VaR level
Banks recalculated the charge for operational risk to be consistent with the Baseline and Stress scenarios. For banks using the Standardized Approach (“TSA”), the derivation of the charge reflected Gross Income consistent with the earnings projections provided in the Income Statement supporting schedules for the
Market risk in period with negative GDP growth is added to the base years market risk RWAs
Operational risk calculation follows TSA which depends on gross income
were added to “IRB exposures” to calculate total exposures by asset classes. Percentage changes in calculated RWAs was applied to the base year, real RWAs- levels of calculated RWAs will were not used in a calculation of capital requirements; In the sensitivity analysis, downturn LGDs were assumed to follow the dynamics of LGDs projected by the banks; negative asset correlation was replaced with positive one and we used trough-the cycle PDs provided by OSFI
RWAs for market and operational risk were taken from the banks, reported for the BU test
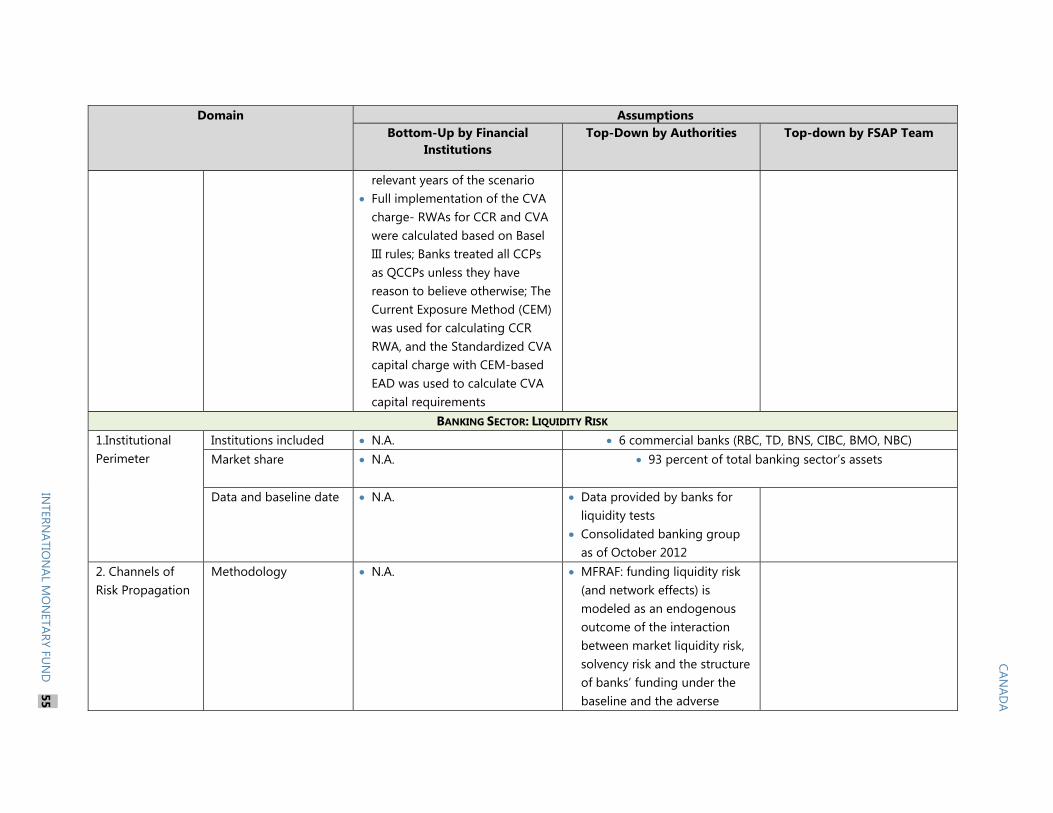
CANAD
A
INTERN
ATION
AL MO
NETARY FU
ND
55
Domain Assumptions Bottom-Up by Financial
Institutions Top-Down by Authorities Top-down by FSAP Team
relevant years of the scenario Full implementation of the CVA
charge- RWAs for CCR and CVA were calculated based on Basel III rules; Banks treated all CCPs as QCCPs unless they have reason to believe otherwise; The Current Exposure Method (CEM) was used for calculating CCR RWA, and the Standardized CVA capital charge with CEM-based EAD was used to calculate CVA capital requirements
BANKING SECTOR: LIQUIDITY RISK 1.Institutional Perimeter
Institutions included N.A. 6 commercial banks (RBC, TD, BNS, CIBC, BMO, NBC) Market share N.A. 93 percent of total banking sector’s assets
Data and baseline date N.A. Data provided by banks for
liquidity tests Consolidated banking group
as of October 2012
2. Channels of Risk Propagation
Methodology N.A. MFRAF: funding liquidity risk (and network effects) is modeled as an endogenous outcome of the interaction between market liquidity risk, solvency risk and the structure of banks’ funding under the baseline and the adverse
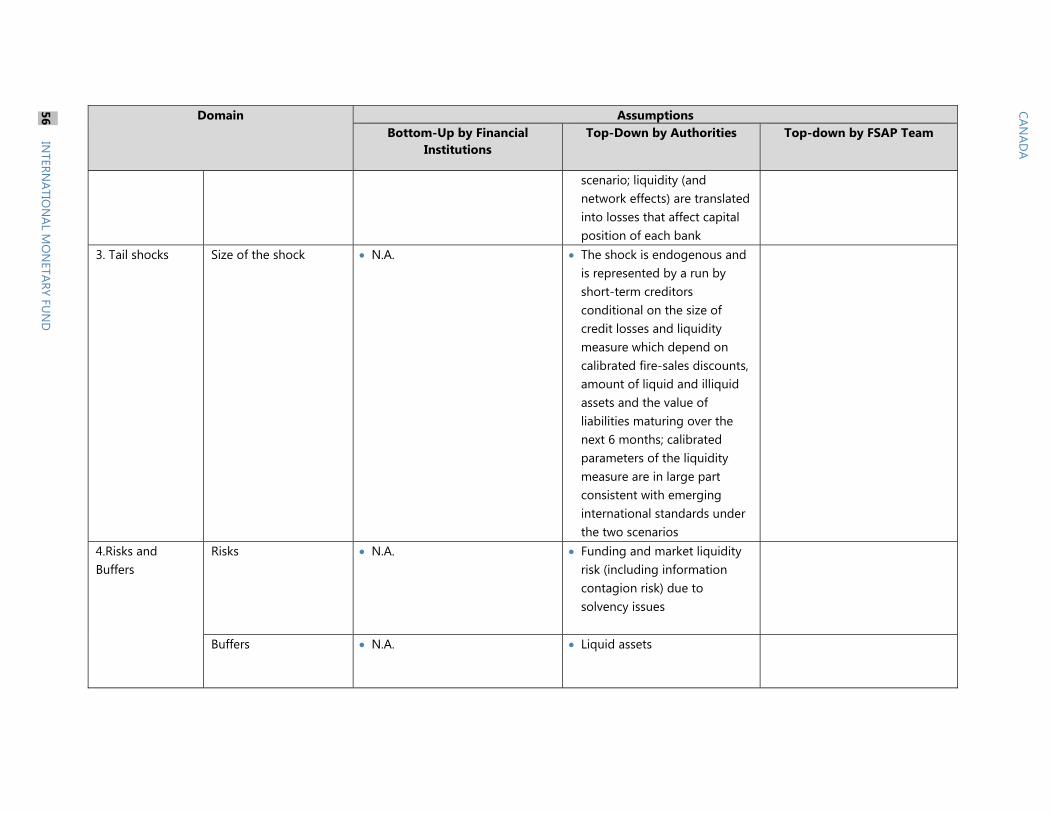
CANAD
A 56
INTERN
ATION
AL MO
NETARY FU
ND
Domain Assumptions Bottom-Up by Financial
Institutions Top-Down by Authorities Top-down by FSAP Team
scenario; liquidity (and network effects) are translated into losses that affect capital position of each bank
3. Tail shocks Size of the shock N.A. The shock is endogenous and is represented by a run by short-term creditors conditional on the size of credit losses and liquidity measure which depend on calibrated fire-sales discounts, amount of liquid and illiquid assets and the value of liabilities maturing over the next 6 months; calibrated parameters of the liquidity measure are in large part consistent with emerging international standards under the two scenarios
4.Risks and Buffers
Risks N.A. Funding and market liquidity risk (including information contagion risk) due to solvency issues
Buffers N.A. Liquid assets
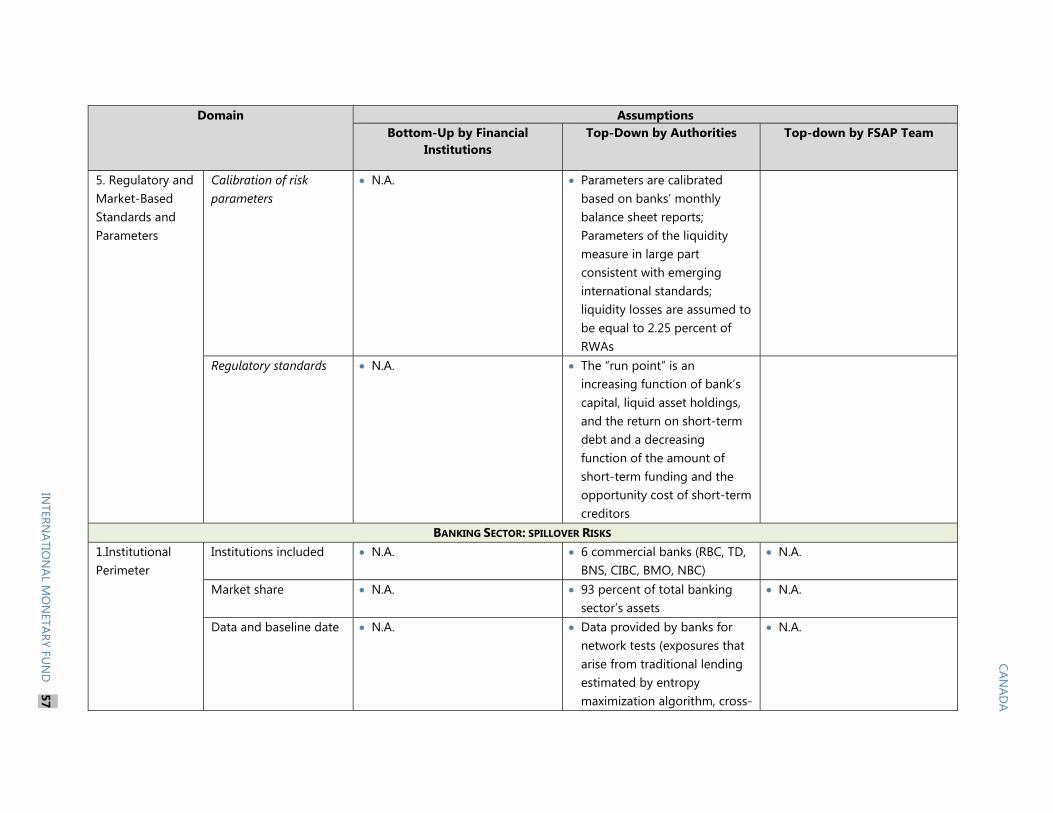
CANAD
A
INTERN
ATION
AL MO
NETARY FU
ND
57
Domain Assumptions Bottom-Up by Financial
Institutions Top-Down by Authorities Top-down by FSAP Team
5. Regulatory and Market-Based Standards and Parameters
Calibration of risk parameters
N.A. Parameters are calibrated based on banks’ monthly balance sheet reports; Parameters of the liquidity measure in large part consistent with emerging international standards; liquidity losses are assumed to be equal to 2.25 percent of RWAs
Regulatory standards N.A. The “run point” is an increasing function of bank’s capital, liquid asset holdings, and the return on short-term debt and a decreasing function of the amount of short-term funding and the opportunity cost of short-term creditors
BANKING SECTOR: SPILLOVER RISKS 1.Institutional Perimeter
Institutions included N.A. 6 commercial banks (RBC, TD, BNS, CIBC, BMO, NBC)
N.A.
Market share N.A. 93 percent of total banking sector’s assets
N.A.
Data and baseline date N.A. Data provided by banks for network tests (exposures that arise from traditional lending estimated by entropy maximization algorithm, cross-
N.A.
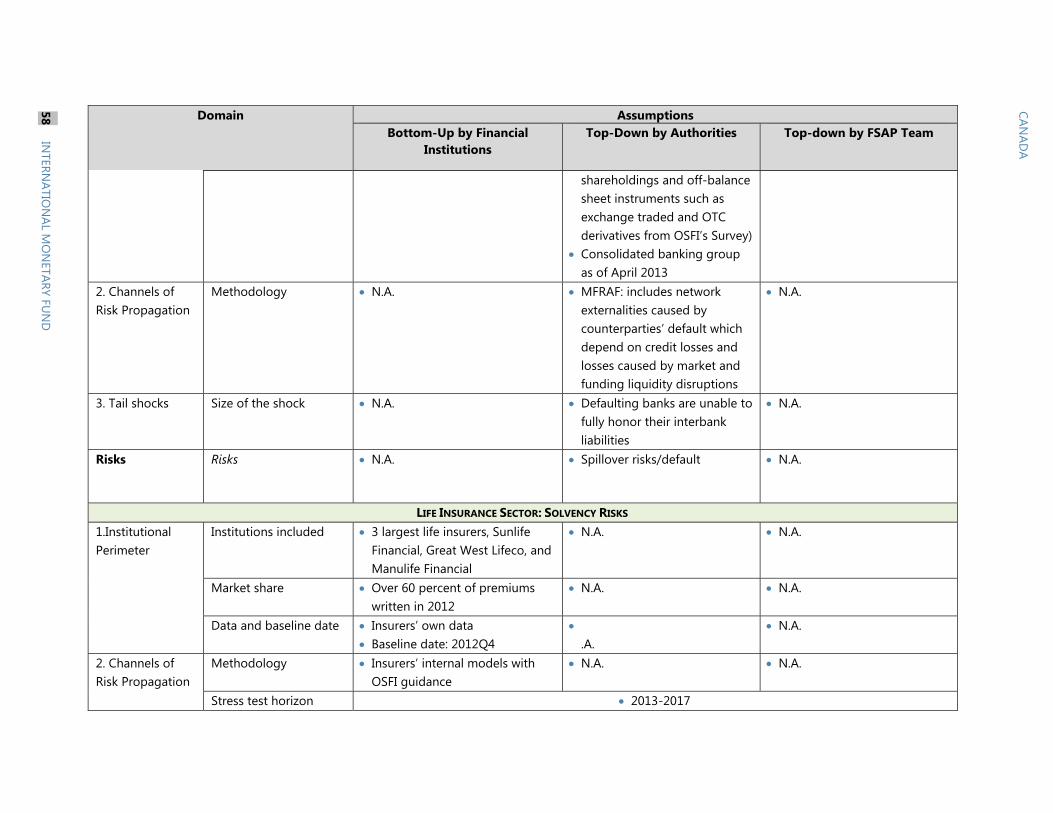
CANAD
A 58
INTERN
ATION
AL MO
NETARY FU
ND
Domain Assumptions Bottom-Up by Financial
Institutions Top-Down by Authorities Top-down by FSAP Team
shareholdings and off-balance sheet instruments such as exchange traded and OTC derivatives from OSFI’s Survey)
Consolidated banking group as of April 2013
2. Channels of Risk Propagation
Methodology N.A. MFRAF: includes network externalities caused by counterparties’ default which depend on credit losses and losses caused by market and funding liquidity disruptions
N.A.
3. Tail shocks Size of the shock N.A. Defaulting banks are unable to fully honor their interbank liabilities
N.A.
Risks Risks N.A. Spillover risks/default N.A.
LIFE INSURANCE SECTOR: SOLVENCY RISKS 1.Institutional Perimeter
Institutions included 3 largest life insurers, Sunlife Financial, Great West Lifeco, and Manulife Financial
N.A. N.A.
Market share Over 60 percent of premiums written in 2012
N.A. N.A.
Data and baseline date Insurers’ own data Baseline date: 2012Q4
.A.
N.A.
2. Channels of Risk Propagation
Methodology Insurers’ internal models with OSFI guidance
N.A.
N.A.
Stress test horizon 2013-2017
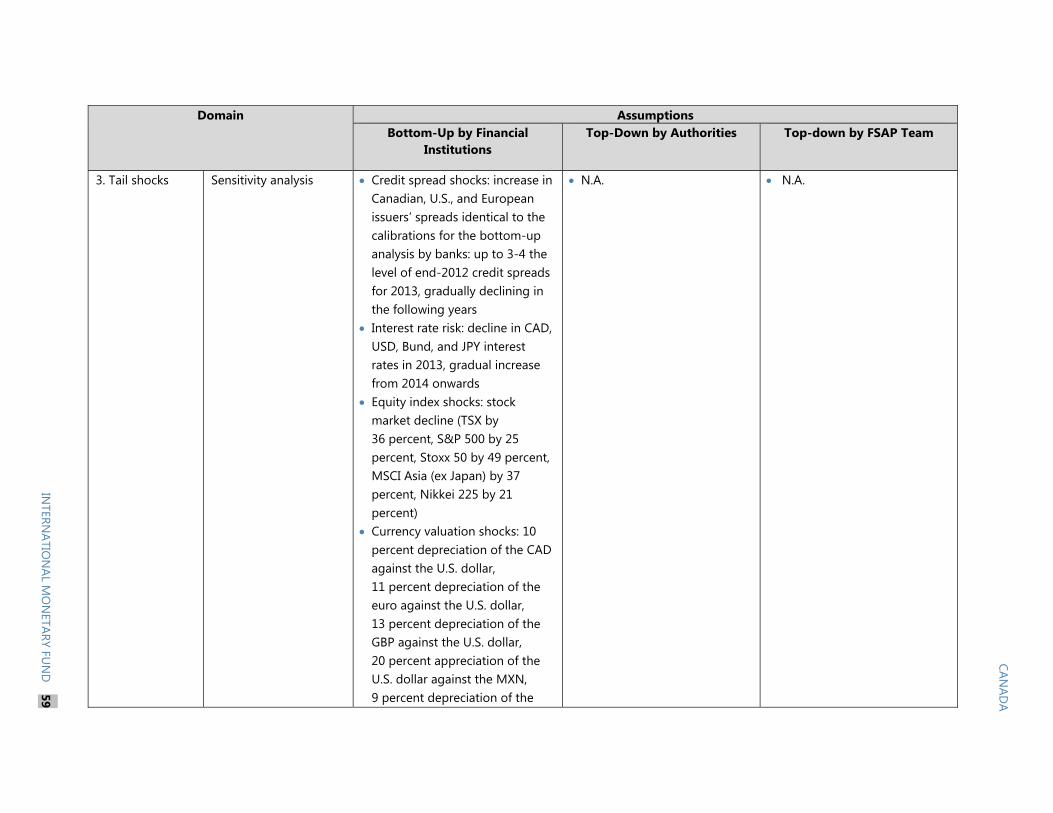
CANAD
A
INTERN
ATION
AL MO
NETARY FU
ND
59
Domain Assumptions Bottom-Up by Financial
Institutions Top-Down by Authorities Top-down by FSAP Team
3. Tail shocks Sensitivity analysis Credit spread shocks: increase in Canadian, U.S., and European issuers’ spreads identical to the calibrations for the bottom-up analysis by banks: up to 3-4 the level of end-2012 credit spreads for 2013, gradually declining in the following years
Interest rate risk: decline in CAD, USD, Bund, and JPY interest rates in 2013, gradual increase from 2014 onwards
Equity index shocks: stock market decline (TSX by 36 percent, S&P 500 by 25 percent, Stoxx 50 by 49 percent, MSCI Asia (ex Japan) by 37 percent, Nikkei 225 by 21 percent)
Currency valuation shocks: 10 percent depreciation of the CAD against the U.S. dollar, 11 percent depreciation of the euro against the U.S. dollar, 13 percent depreciation of the GBP against the U.S. dollar, 20 percent appreciation of the U.S. dollar against the MXN, 9 percent depreciation of the
N.A.
N.A.
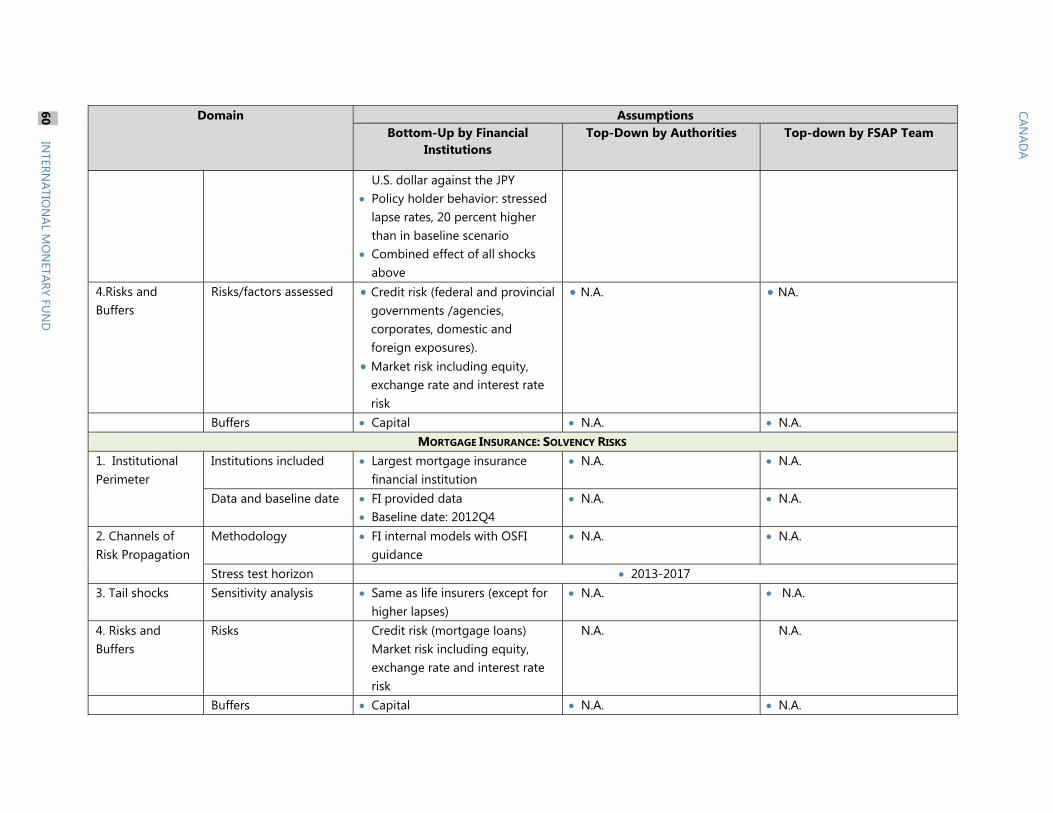
CANAD
A 60
INTERN
ATION
AL MO
NETARY FU
ND
Domain Assumptions Bottom-Up by Financial
Institutions Top-Down by Authorities Top-down by FSAP Team
U.S. dollar against the JPY Policy holder behavior: stressed
lapse rates, 20 percent higher than in baseline scenario
Combined effect of all shocks above
4.Risks and Buffers
Risks/factors assessed
Credit risk (federal and provincial governments /agencies, corporates, domestic and foreign exposures).
Market risk including equity, exchange rate and interest rate risk
N.A.
NA.
Buffers Capital N.A. N.A. MORTGAGE INSURANCE: SOLVENCY RISKS
1. Institutional Perimeter
Institutions included Largest mortgage insurance financial institution
N.A. N.A.
Data and baseline date FI provided data Baseline date: 2012Q4
N.A. N.A.
2. Channels of Risk Propagation
Methodology FI internal models with OSFI guidance
N.A.
N.A.
Stress test horizon 2013-2017 3. Tail shocks Sensitivity analysis Same as life insurers (except for
higher lapses) N.A.
N.A.
4. Risks and Buffers
Risks Credit risk (mortgage loans) Market risk including equity, exchange rate and interest rate risk
N.A.
N.A.
Buffers Capital N.A. N.A.