Embed Size (px)
Citation preview

Canada
June 2002
Think Dynamic
Think Competitive
Think Bottom Line
Think
Canada!
Canada
Canada: a Dynamic, Competitive Economy— Open for Global Business
2
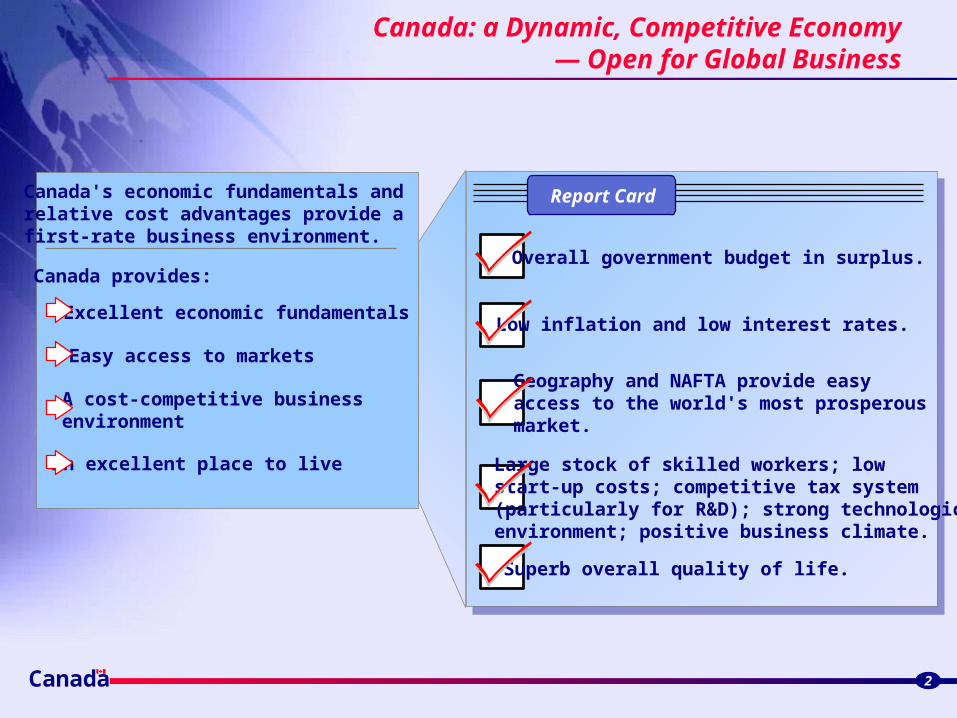
Canada's economic fundamentals andrelative cost advantages provide afirst-rate business environment. Canada provides:
Excellent economic fundamentals
Report Card
Overall government budget in surplus.
Low inflation and low interest rates.
Easy access to marketsGeography and NAFTA provide easyaccess to the world's most prosperousmarket.
A cost-competitive businessenvironment
Large stock of skilled workers; low start-up costs; competitive tax system(particularly for R&D); strong technologicalenvironment; positive business climate.
An excellent place to live
Superb overall quality of life.
Excellent economic fundamentals
Easy access to markets
A cost-competitive business environment
An excellent place to live and work
Excellent economic fundamentalsExcellent economic fundamentals
Canada Provides:
3Canada 3
Canada’s strong fiscal situation
C
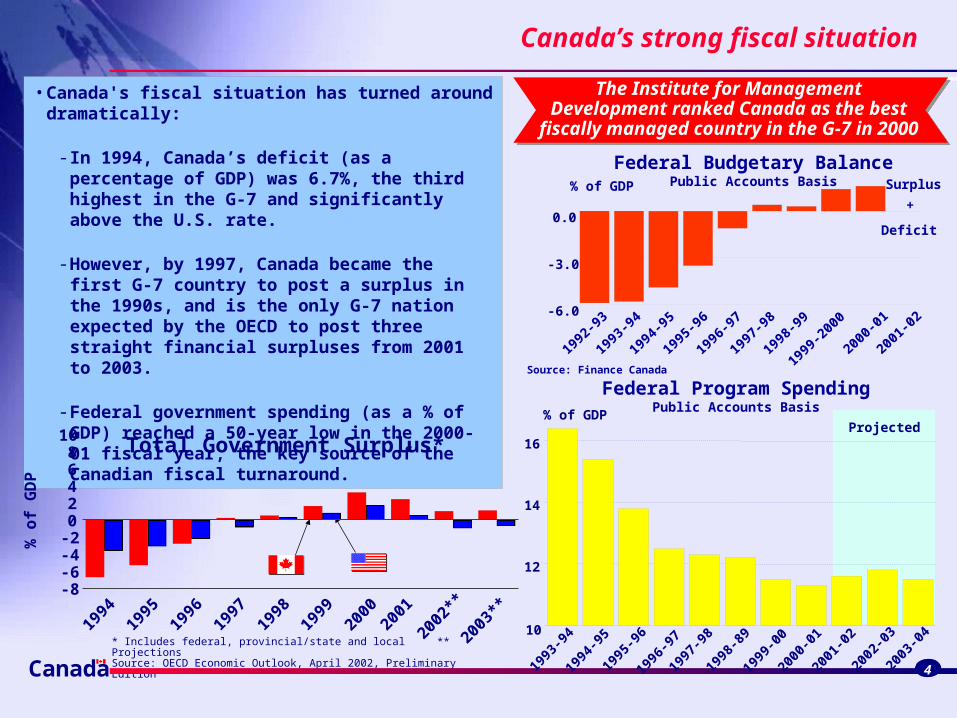
• Canada's fiscal situation has turned around dramatically:
- In 1994, Canada’s deficit (as a percentage of GDP) was 6.7%, the third highest in the G-7 and significantly above the U.S. rate.
- However, by 1997, Canada became the first G-7 country to post a surplus in the 1990s, and is the only G-7 nation expected by the OECD to post three straight financial surpluses from 2001 to 2003.
- Federal government spending (as a % of GDP) reached a 50-year low in the 2000-01 fiscal year, the key source of the Canadian fiscal turnaround.
* Includes federal, provincial/state and local ** ProjectionsSource: OECD Economic Outlook, April 2002, Preliminary Edition
Total Government Surplus*
The Institute for Management Development ranked Canada as the best fiscally managed country in the G-7 in 2000
Federal Budgetary BalancePublic Accounts Basis
Canada 4
Source: Finance Canada
0.0
-3.0
-6.0
% of GDP
1992
-93
1993
-94
1994
-95
1995
-96
1996
-97
1997
-98
1998
-99
1999
-200
0
2000
-01
2001
-02
Surplus
Deficit
+
Federal Program SpendingPublic Accounts Basis
1993
-94
1994
-95
1995
-96
1996
-97
1997
-98
1998
-89
1999
-00
2000
-01
2001
-02
2002
-03
2003
-04
10
12
14
16
% of GDPProjected
1994
1995
1996
1997
1998
1999
2000
2001
2002
**
2003
**
02468
10
-2-4-6-8
% o
f G
DP
Canada
A Strong Fiscal Surplus
5
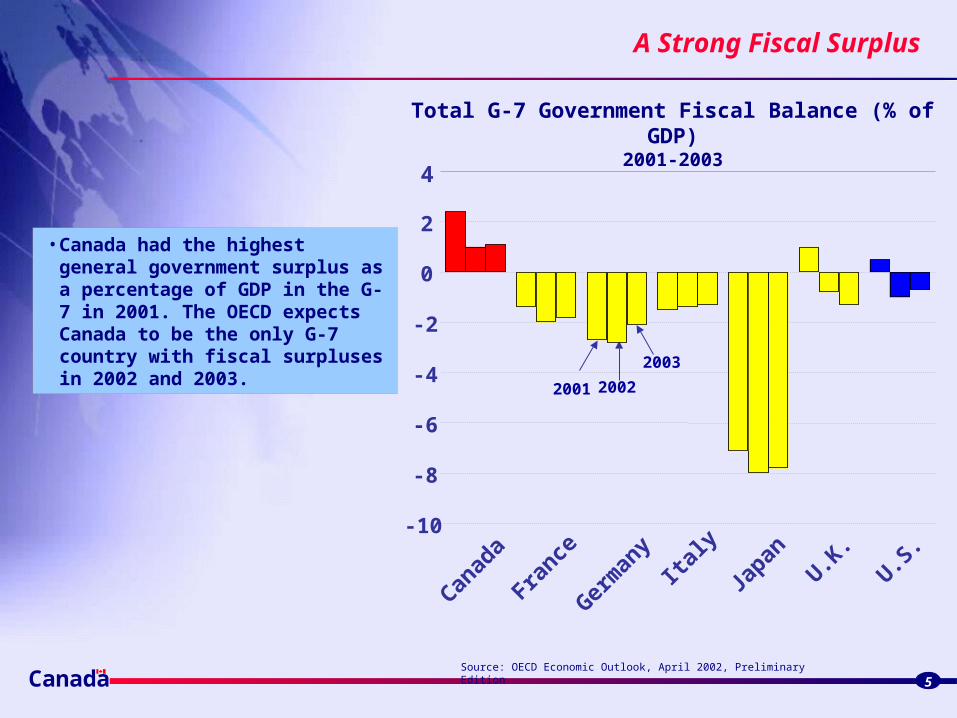
• Canada had the highest general government surplus as a percentage of GDP in the G-7 in 2001. The OECD expects Canada to be the only G-7 country with fiscal surpluses in 2002 and 2003.
Total G-7 Government Fiscal Balance (% of GDP)2001-2003
Source: OECD Economic Outlook, April 2002, Preliminary Edition
20022001
2003
Canad
a
France
Germ
any
Italy
Japan
U.K.
U.S.
0
2
4
-2
-4
-6
-8
-10

Canada
Low Inflation and Low Interest Rates
6
• Canada’s targeted inflation rate is locked between 1% to 3%.
- Over the past five years, Canadian inflation averaged 1.9% — 30% lower than the U.S. rate.
Sources: Statistics Canada and the Federal Reserve Bank of St. Louis
Inflation
Long-Term Interest Rates
1994
1995
1996
1997
1998
1999
2000
2001
0
1
2
3
4
Ye
ar-
Ov
er-
Ye
ar
% C
ha
ng
e
• Canada's excellent fiscal situation and low inflation are reflected in low domestic interest rates.
Source: Bank of Canada, Government long-term bond. U.S. Treasury, Constant Maturity long-term bond.
Last data points plotted: Canada – May 31, 2002; U.S. – June 10, 2002
1994 1995 1996 1997 1998 1999 2000 2001 20023
5
8
10
%
Canada
A Growing Domestic Economy
7
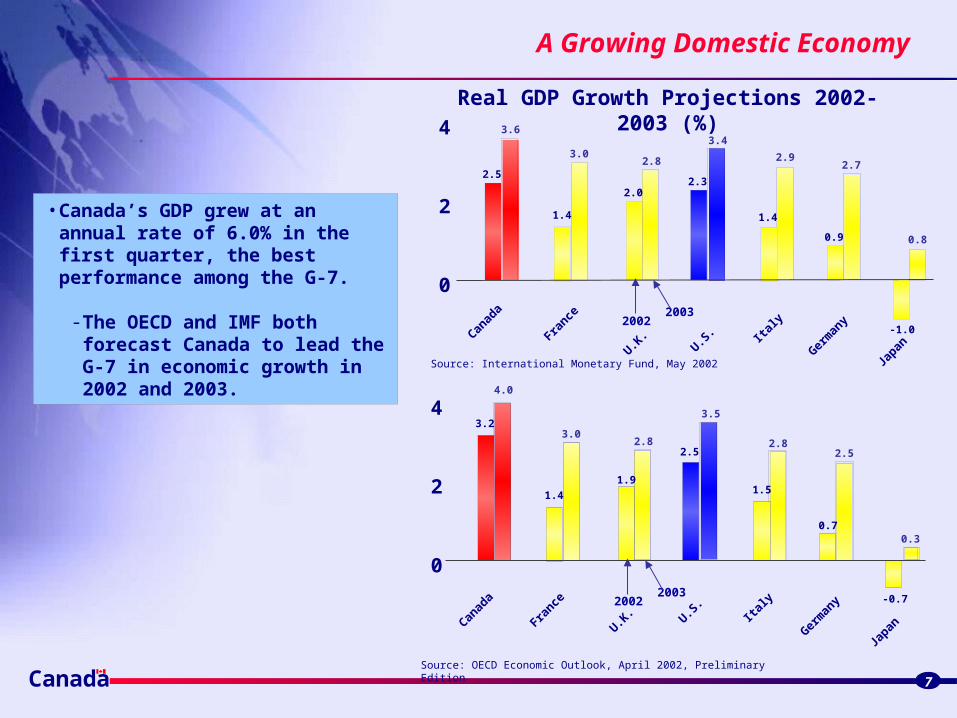
• Canada’s GDP grew at an annual rate of 6.0% in the first quarter, the best performance among the G-7.
- The OECD and IMF both forecast Canada to lead the G-7 in economic growth in 2002 and 2003.
Real GDP Growth Projections 2002-2003 (%)
20032002
2.5
1.4
2.02.3
1.4
0.9
-1.0
3.6
3.02.8
3.4
2.92.7
0.8
U.S.Can
ada
France
Italy
Germ
any
U.K.
Japan
0
2
4
20032002
3.2
1.4
1.9
2.5
1.5
0.7
-0.7
4.0
3.02.8
3.5
2.82.5
0.3
U.S.
Canad
a
France
Italy
Germ
any
U.K.
Japan
0
2
4
Source: International Monetary Fund, May 2002
Source: OECD Economic Outlook, April 2002, Preliminary Edition
Easy access to markets
Canada
Canada Provides:
8
Easy access to markets
A cost-competitive business environment
An excellent place to live
Excellent economic fundamentalsExcellent economic fundamentals
Canada
Streamlined Border Flows
9
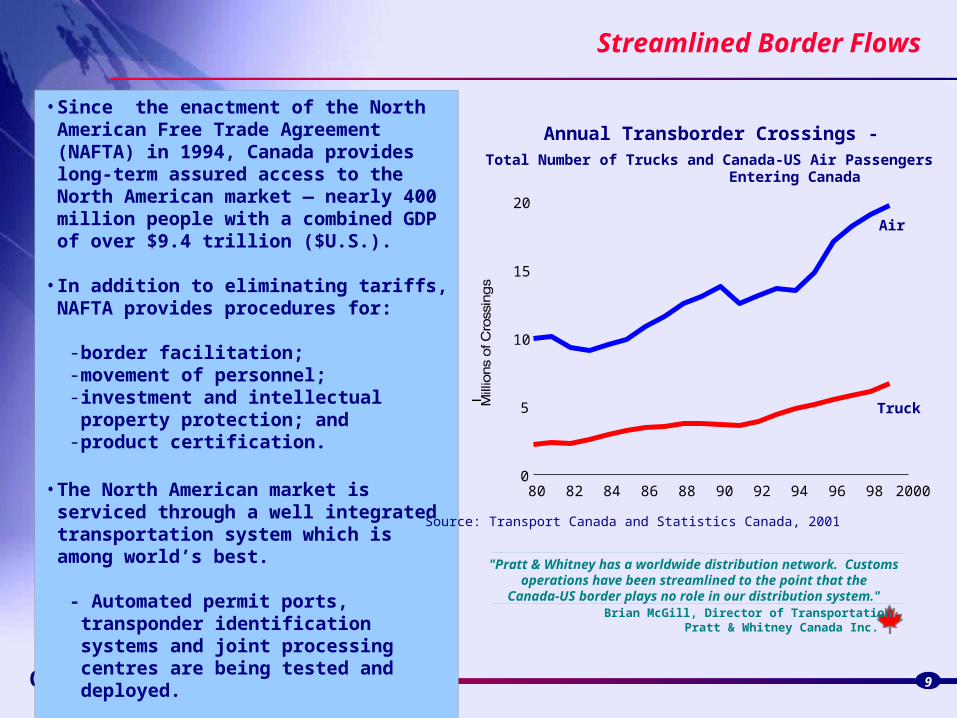
• Since the enactment of the North American Free Trade Agreement (NAFTA) in 1994, Canada provides long-term assured access to the North American market — nearly 400 million people with a combined GDP of over $9.4 trillion ($U.S.).
• In addition to eliminating tariffs, NAFTA provides procedures for:
- border facilitation;- movement of personnel;- investment and intellectual property
protection; and- product certification.
• The North American market is serviced through a well integrated transportation system which is among world’s best.
- Automated permit ports, transponder identification systems and joint processing centres are being tested and deployed.
Source: Transport Canada and Statistics Canada, 2001
Annual Transborder Crossings -Total Number of Trucks and Canada-US Air Passengers Entering Canada
Truck
Air
Brian McGill, Director of TransportationPratt & Whitney Canada Inc.
"Pratt & Whitney has a worldwide distribution network. Customs operations have been streamlined to the point that the
Canada-US border plays no role in our distribution system."
80 82 84 86 88 90 92 94 96 98 20000
5
10
15
20
Canada
Smarter Borders
10
• Efficient border crossing was restored within a week of the tragic events of Sept 11th
–today, border wait times average less than 10 minutes
• In December, Canada and the USA signed a declaration to build a Smart Border for the 21st Century to accommodate the growth in trade and commerce
–initiatives focus on improving existing border processes through the use of new technologies and infrastructure
• The December Budget also allocated $1.6 billion over the next five years for border initiatives
Canada
…and Short Distances to Markets
11
Calgary Regina
Halifax
Los Angeles
Denver
New York
Boston
Philadelphia
Washington
BaltimoreDetroitChicagoCleveland
St. Louis Pittsburgh
Milwaukee
Houston
Atlanta
Vancouver
Toronto
Montréal
Seattle
Miami
Mexico City
San Francisco
Winnipeg
300 mi
600 mi Charlottetown
St. John's
Edmonton
VictoriaOttawa
Windsor
QuébecFredericton
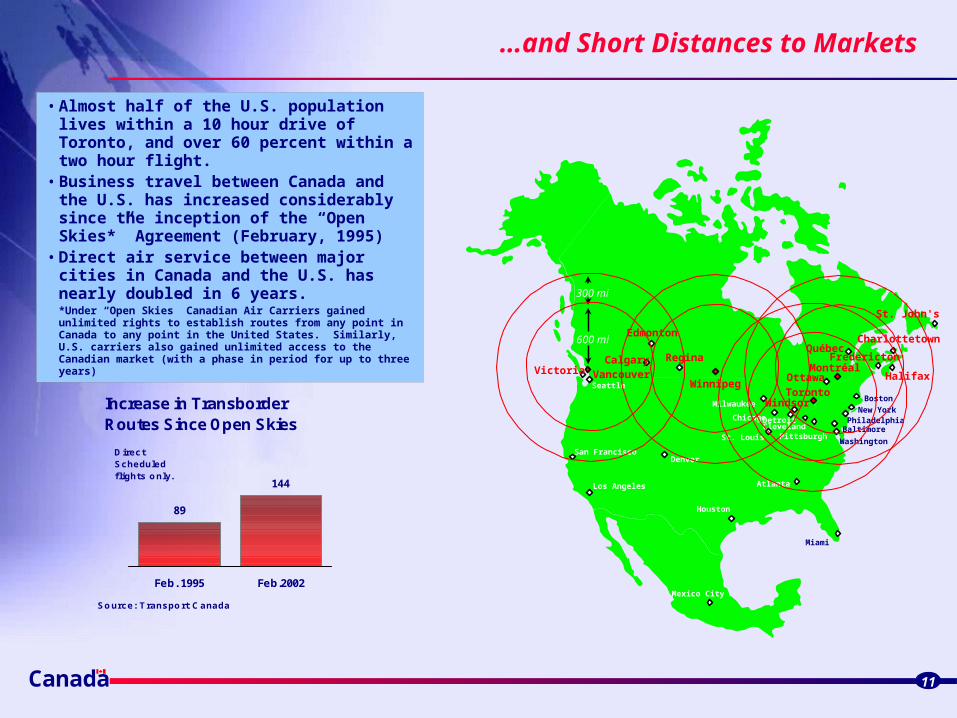
Increase in TransborderRoutes Since Open Skies
89
144
Feb. 1995 Feb.2002
Source: Transport Canada
Direct Scheduled flights only.
• Almost half of the U.S. population lives within a 10 hour drive of Toronto, and over 60 percent within a two hour flight.
• Business travel between Canada and the U.S. has increased considerably since the inception of the “Open Skies*” Agreement (February, 1995)
• Direct air service between major cities in Canada and the U.S. has nearly doubled in 6 years.*Under “Open Skies” Canadian Air Carriers gained unlimited rights to establish routes from any point in Canada to any point in the United States. Similarly, U.S. carriers also gained unlimited access to the Canadian market (with a phase in period for up to three years)
1995 1996 1997 1998 1999 20000
100
200
300
400
500
600
700
800$ Billions
Canada - U.S. Trade
$700 Billion
Source: Statistics Canada
Canada
Canada Is by Far the Largest U.S. Trading Partner
12
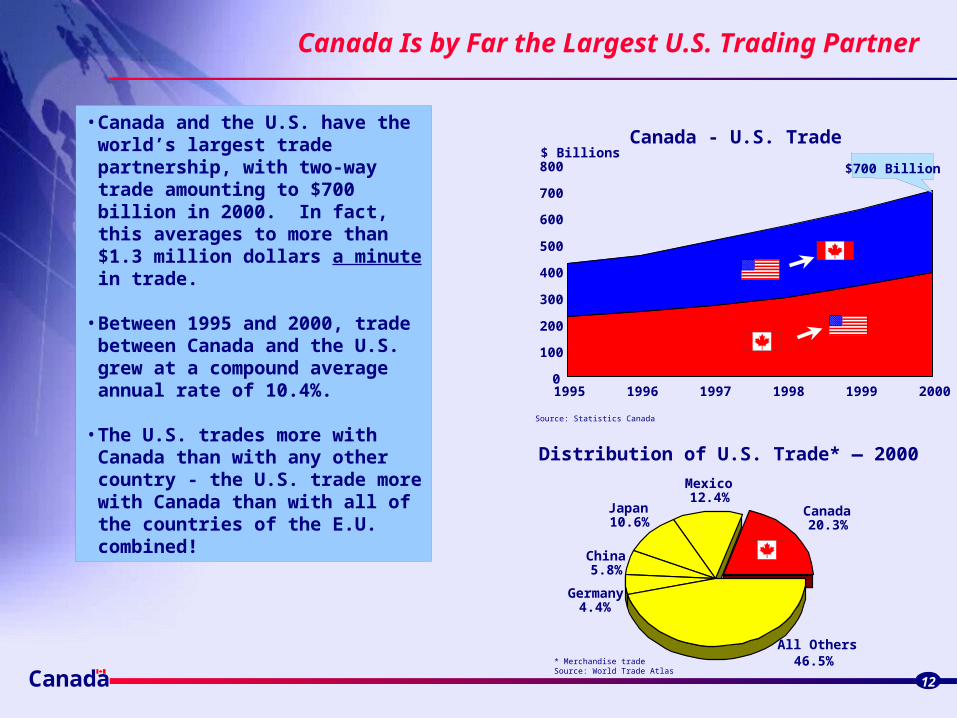
• Canada and the U.S. have the world’s largest trade partnership, with two-way trade amounting to $700 billion in 2000. In fact, this averages to more than $1.3 million dollars a minute in trade.
• Between 1995 and 2000, trade between Canada and the U.S. grew at a compound average annual rate of 10.4%.
• The U.S. trades more with Canada than with any other country - the U.S. trade more with Canada than with all of the countries of the E.U. combined!
Canada20.3%
Mexico12.4%
Japan10.6%
China5.8%
Germany4.4%
All Others46.5%
Distribution of U.S. Trade* — 2000
* Merchandise tradeSource: World Trade Atlas
Canada
Canada also has Strong Historical Trade Ties with Europe…
13
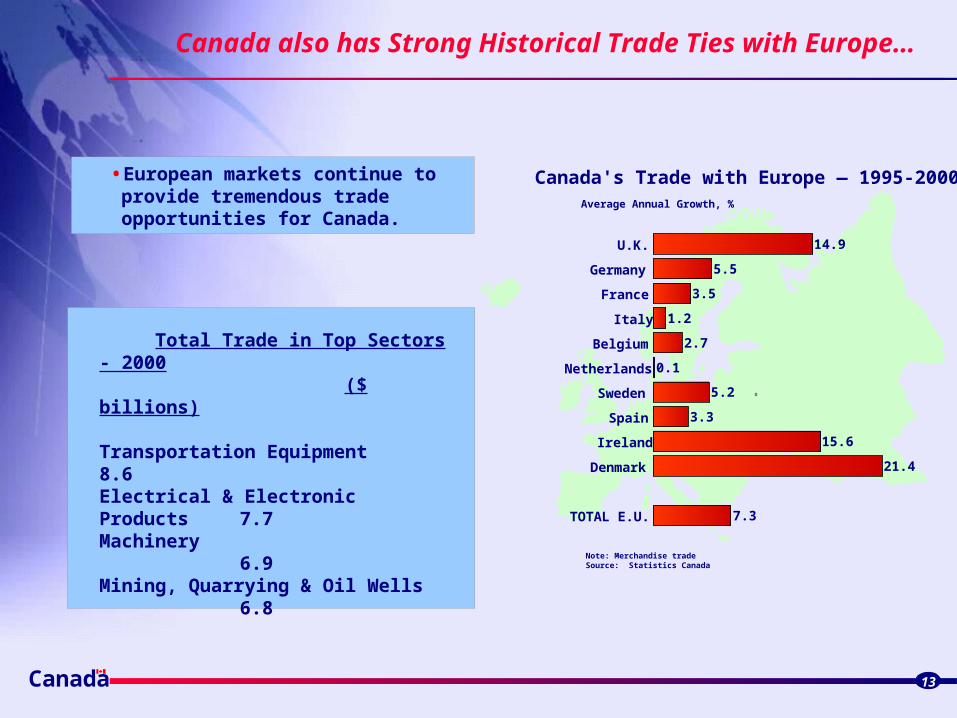
• European markets continue to provide tremendous trade opportunities for Canada.
Canada's Trade with Europe — 1995-2000
Note: Merchandise tradeSource: Statistics Canada
Average Annual Growth, %
14.9
5.5
3.5
1.2
2.7
0.1
5.2
3.3
15.6
21.4
7.3
U.K.
Germany
France
Italy
Belgium
Netherlands
Sweden
Spain
Ireland
Denmark
TOTAL E.U.
Total Trade in Top Sectors - 2000 ($ billions)
Transportation Equipment 8.6Electrical & Electronic Products 7.7Machinery 6.9Mining, Quarrying & Oil Wells 6.8
Canada
... and Unique Access to Asian Markets
14
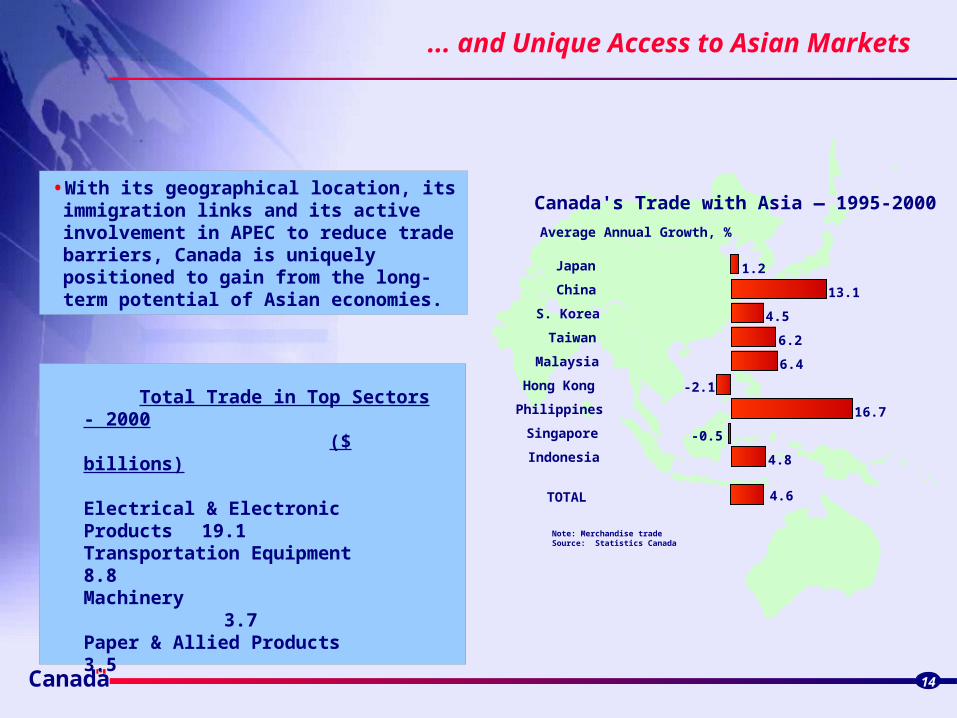
• With its geographical location, its immigration links and its active involvement in APEC to reduce trade barriers, Canada is uniquely positioned to gain from the long-term potential of Asian economies.
Canada's Trade with Asia — 1995-2000
Average Annual Growth, %
Note: Merchandise tradeSource: Statistics Canada
1.2
13.1
4.5
6.2
6.4
-2.1
16.7
-0.5
4.8
4.6
Japan
China
S. Korea
Taiwan
Malaysia
Hong Kong
Philippines
Singapore
Indonesia
TOTAL
Total Trade in Top Sectors - 2000 ($ billions)
Electrical & Electronic Products 19.1Transportation Equipment 8.8Machinery 3.7Paper & Allied Products 3.5
Canada
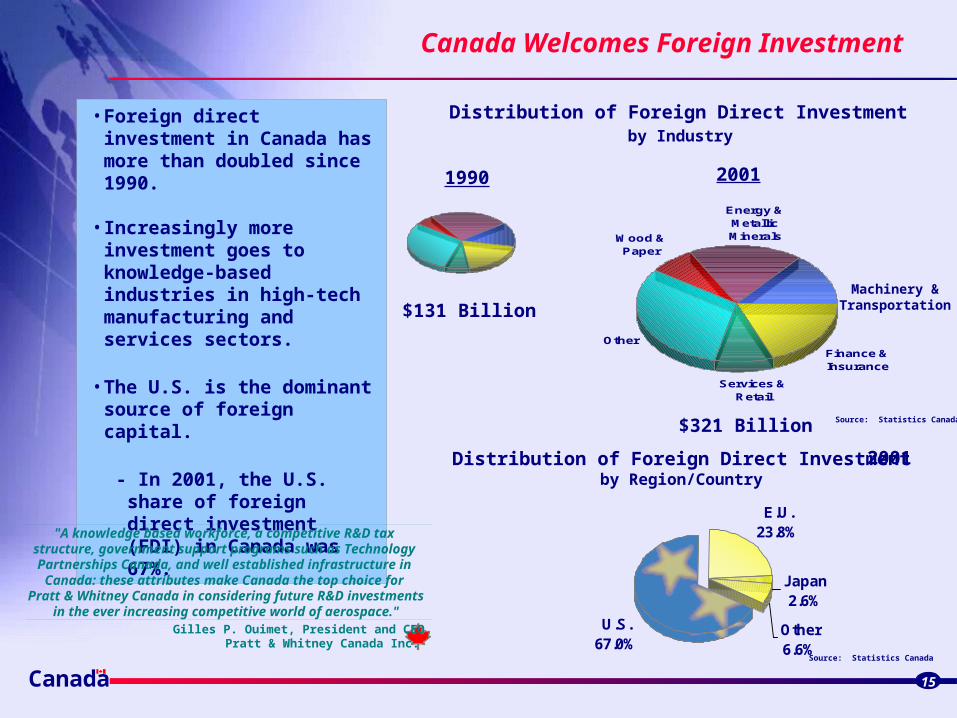
Canada Welcomes Foreign Investment
Source: Statistics Canada
2001
15
• Foreign direct investment in Canada has more than doubled since 1990.
• Increasingly more investment goes to knowledge-based industries in high-tech manufacturing and services sectors.
• The U.S. is the dominant source of foreign capital.
- In 2001, the U.S. share of foreign direct investment (FDI) in Canada was 67%.
Wood & Paper
Energy & Metallic Minerals
Finance & Insurance
Services & Retail
Other
Machinery & Transportation
$321 Billion
Distribution of Foreign Direct Investmentby Industry
1990
$131 Billion
Distribution of Foreign Direct Investmentby Region/Country
U.S. 67.0%
E.U. 23.8%
Japan 2.6%
Other 6.6%
Source: Statistics Canada
2001
Gilles P. Ouimet, President and CEOPratt & Whitney Canada Inc.
"A knowledge based workforce, a competitive R&D tax structure, government support programs such as Technology
Partnerships Canada, and well established infrastructure in Canada: these attributes make Canada the top choice for
Pratt & Whitney Canada in considering future R&D investmentsin the ever increasing competitive world of aerospace."
$340 Billion
Canada 16
1990 1991 1992 1993 1994 1995 1996 1997 1998 1999 20000
50
100
150
200
250
300
350$ Billions
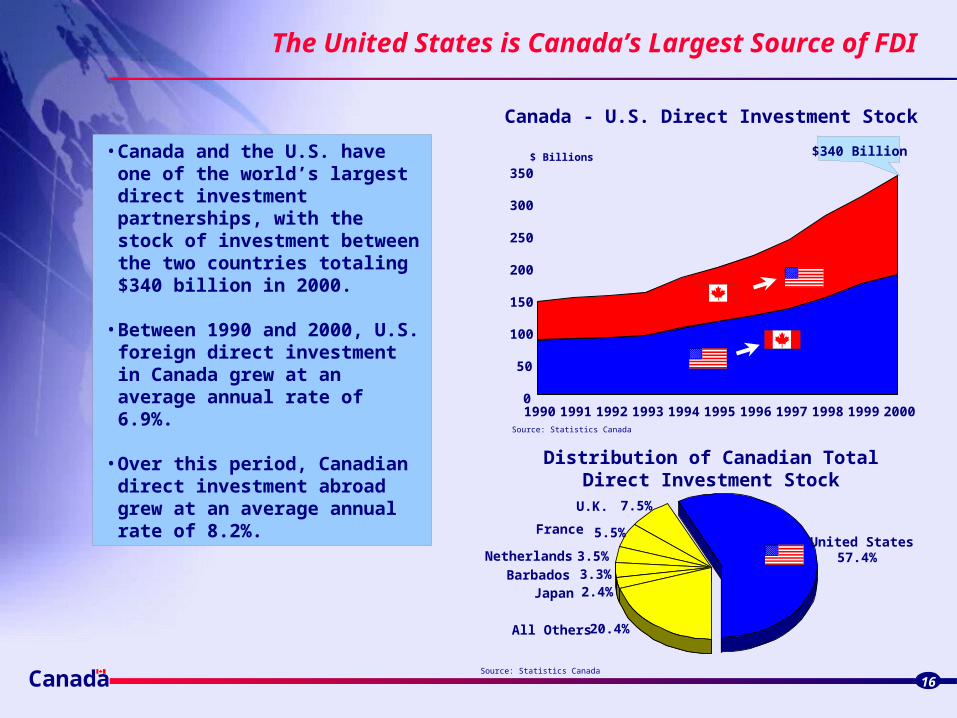
Canada - U.S. Direct Investment Stock
United States57.4%
U.K. 7.5%
France 5.5%
Netherlands 3.5%
Barbados 3.3%
Japan 2.4%
All Others 20.4%
Source: Statistics Canada
Source: Statistics Canada
Distribution of Canadian Total Direct Investment Stock
• Canada and the U.S. have one of the world’s largest direct investment partnerships, with the stock of investment between the two countries totaling $340 billion in 2000.
• Between 1990 and 2000, U.S. foreign direct investment in Canada grew at an average annual rate of 6.9%.
• Over this period, Canadian direct investment abroad grew at an average annual rate of 8.2%.
The United States is Canada’s Largest Source of FDI
A cost-competitive business environment
Canada
Canada Provides:
17
Easy access to markets
A cost-competitive business environment
An excellent place to live and work
Excellent economic fundamentalsExcellent economic fundamentals
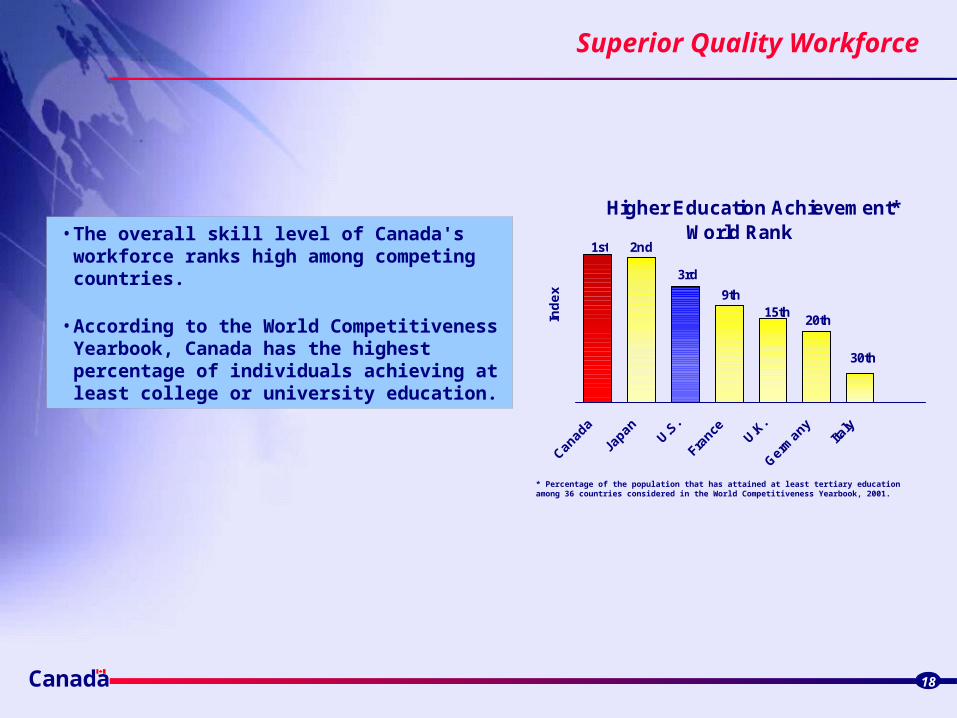
Superior Quality Workforce
Canada
• The overall skill level of Canada's workforce ranks high among competing countries.
• According to the World Competitiveness Yearbook, Canada has the highest percentage of individuals achieving at least college or university education.
* Percentage of the population that has attained at least tertiary education among 36 countries considered in the World Competitiveness Yearbook, 2001.
18
Ind
ex
1st 2nd
3rd
9th15th
20th
30th
Higher Education Achievement* World Rank
An Excellent Post Secondary System
Canada
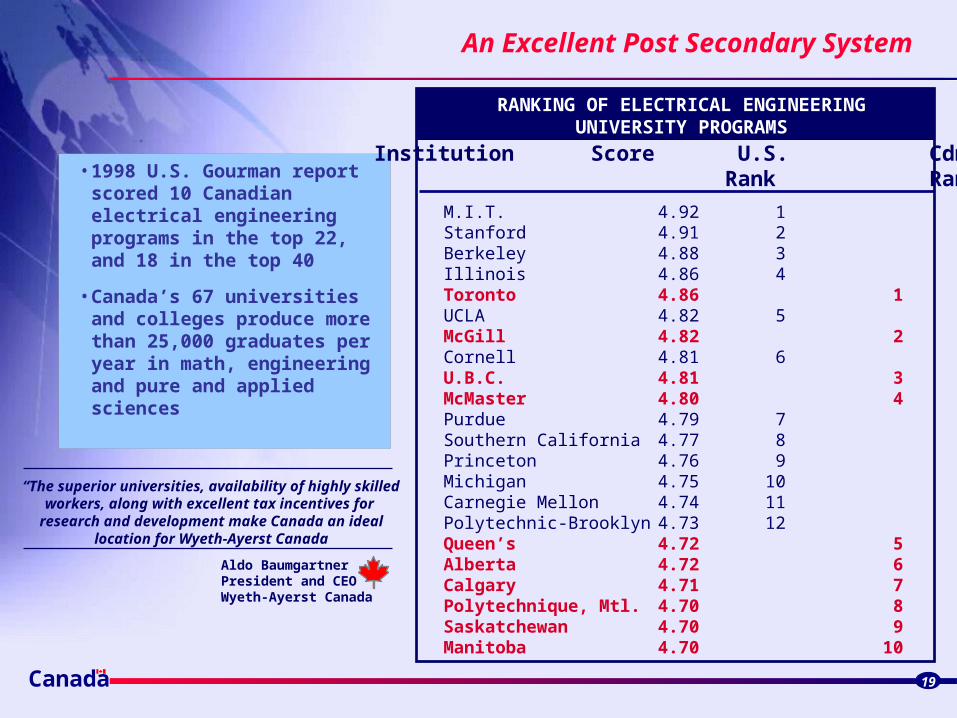
• 1998 U.S. Gourman report scored 10 Canadian electrical engineering programs in the top 22, and 18 in the top 40
• Canada’s 67 universities and colleges produce more than 25,000 graduates per year in math, engineering and pure and applied sciences
19
Institution Score U.S. Cdn. Rank Rank
M.I.T. 4.92 1Stanford 4.91 2Berkeley 4.88 3Illinois 4.86 4Toronto 4.86 1UCLA 4.82 5McGill 4.82 2Cornell 4.81 6U.B.C. 4.81 3McMaster 4.80 4Purdue 4.79 7Southern California 4.77 8Princeton 4.76 9Michigan 4.75 10Carnegie Mellon 4.74 11Polytechnic-Brooklyn 4.73 12Queen’s 4.72 5Alberta 4.72 6Calgary 4.71 7Polytechnique, Mtl. 4.70 8Saskatchewan 4.70 9Manitoba 4.70 10
RANKING OF ELECTRICAL ENGINEERINGUNIVERSITY PROGRAMS
Aldo BaumgartnerPresident and CEOWyeth-Ayerst Canada
“The superior universities, availability of highly skilledworkers, along with excellent tax incentives for
research and development make Canada an ideallocation for Wyeth-Ayerst Canada
Canada
Skilled Management
20
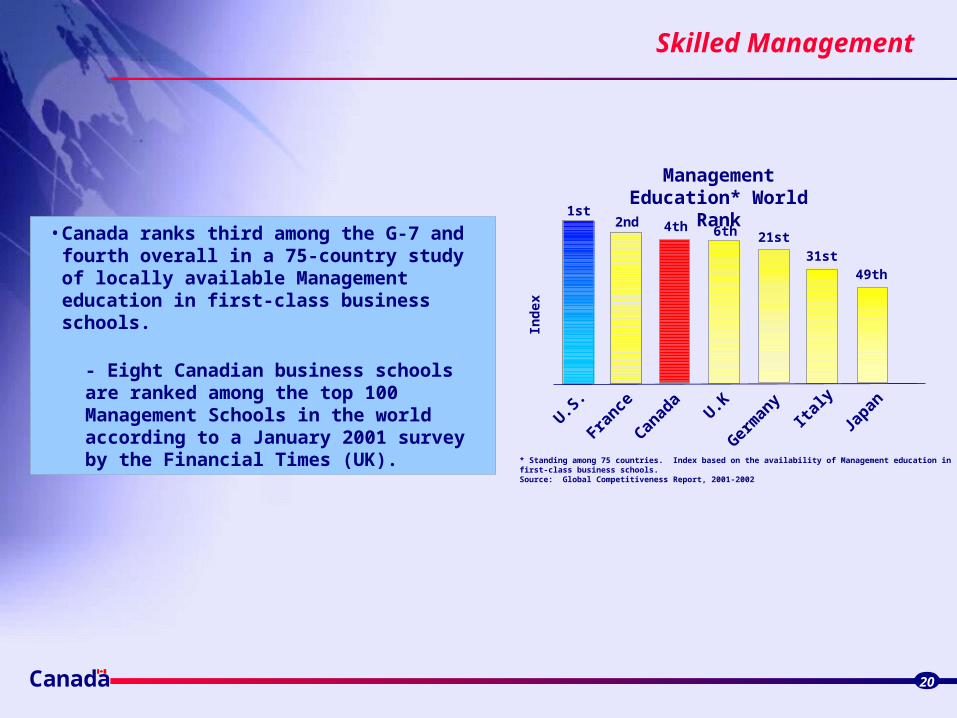
* Standing among 75 countries. Index based on the availability of Management education in first-class business schools. Source: Global Competitiveness Report, 2001-2002
Management Education* World Rank
U.S.
France
Canad
aU.K
Germ
any
Japan
Italy
Ind
ex
1st2nd 4th 6th 21st
31st49th
• Canada ranks third among the G-7 and fourth overall in a 75-country study of locally available Management education in first-class business schools.
- Eight Canadian business schools are ranked among the top 100 Management Schools in the world according to a January 2001 survey by the Financial Times (UK).
Canada
Low Labour Costs
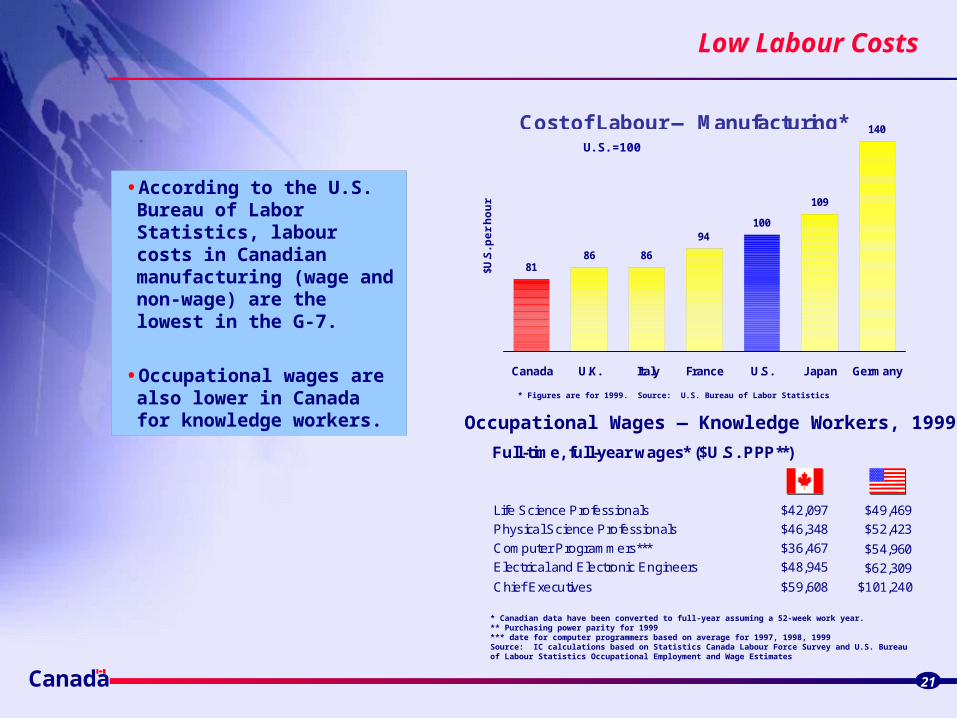
Occupational Wages — Knowledge Workers, 1999
* Canadian data have been converted to full-year assuming a 52-week work year. ** Purchasing power parity for 1999*** date for computer programmers based on average for 1997, 1998, 1999Source: IC calculations based on Statistics Canada Labour Force Survey and U.S. Bureau of Labour Statistics Occupational Employment and Wage Estimates
21
• According to the U.S. Bureau of Labor Statistics, labour costs in Canadian manufacturing (wage and non-wage) are the lowest in the G-7.
• Occupational wages are also lower in Canada for knowledge workers. * Figures are for 1999. Source: U.S. Bureau of Labor Statistics
8186 86
94100
109
140
Canada U.K. Italy France U.S. Japan Germany
$U.S
. pe
r h
ou
r
Cost of Labour — Manufacturing*U.S.=100
Life Science Professionals
Physical Science Professionals
Computer Programmers***
Electrical and Electronic Engineers
Chief Executives
$49,469
$52,423
$54,960
$62,309
$101,240
Full-time, full-year wages* ($U.S. PPP**)
$42,097
$46,348
$36,467
$48,945
$59,608
Canada
Low Production Costs
22
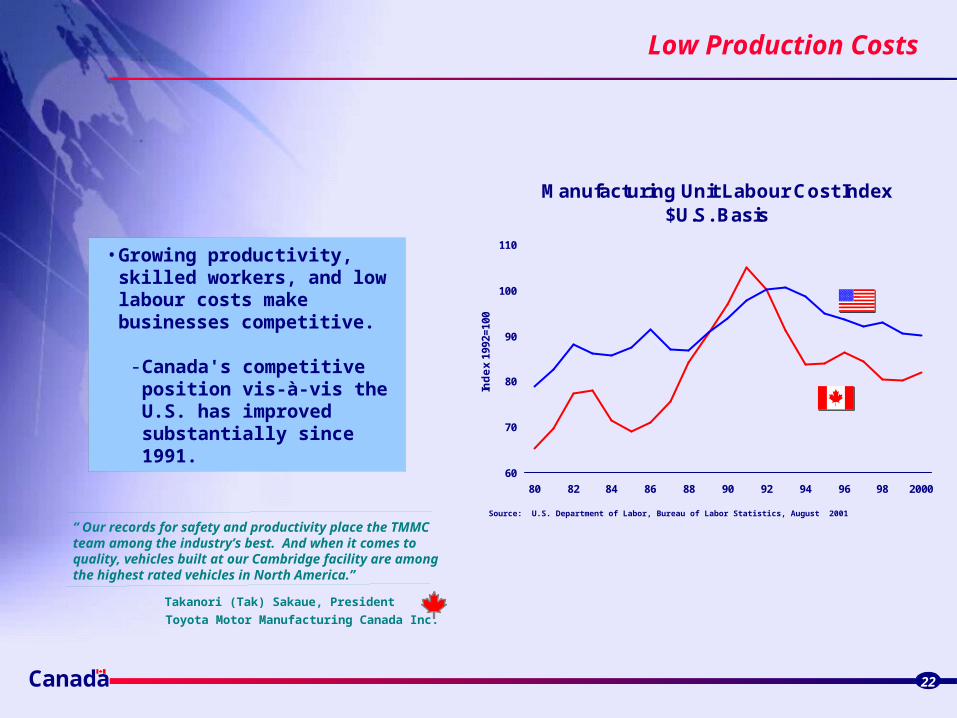
• Growing productivity, skilled workers, and low labour costs make businesses competitive.
- Canada's competitive position vis-à-vis the U.S. has improved substantially since 1991.
Manufacturing Unit Labour Cost Index $U.S. Basis
60
70
80
90
100
110
80 82 84 86 88 90 92 94 96 98 2000In
de
x 19
92=1
00
Source: U.S. Department of Labor, Bureau of Labor Statistics, August 2001
“ Our records for safety and productivity place the TMMCteam among the industry’s best. And when it comes to quality, vehicles built at our Cambridge facility are amongthe highest rated vehicles in North America.”
Toyota Motor Manufacturing Canada Inc.
Takanori (Tak) Sakaue, President
Canada
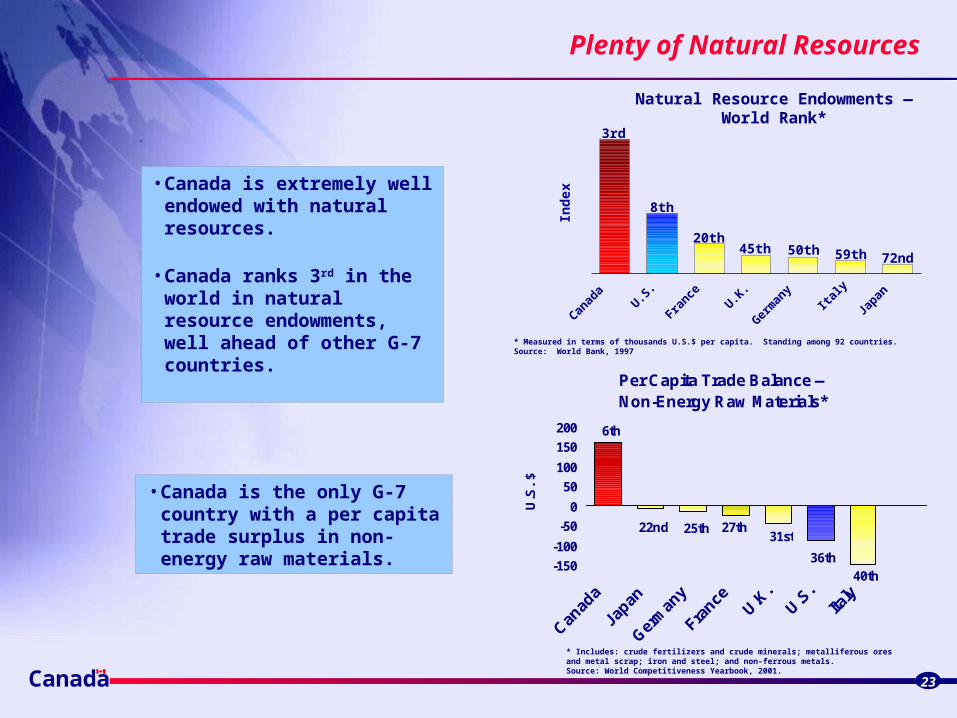
Plenty of Natural Resources
* Measured in terms of thousands U.S.$ per capita. Standing among 92 countries.Source: World Bank, 1997
23
• Canada is extremely well endowed with natural resources.
• Canada ranks 3rd in the world in natural resource endowments, well ahead of other G-7 countries.
Natural Resource Endowments —World Rank*
Canad
aU.S
.
France
U.K.
Germ
any
Italy
Japan
3rd
8th
20th45th 50th 59th 72nd
Ind
ex
* Includes: crude fertilizers and crude minerals; metalliferous ores and metal scrap; iron and steel; and non-ferrous metals.Source: World Competitiveness Yearbook, 2001.
-150
-100
-50
0
50
100
150
200
U.S
. $
6th
22nd 25th 27th31st
36th40th
Per Capita Trade Balance —Non-Energy Raw Materials*
• Canada is the only G-7 country with a per capita trade surplus in non-energy raw materials.
Canada 24
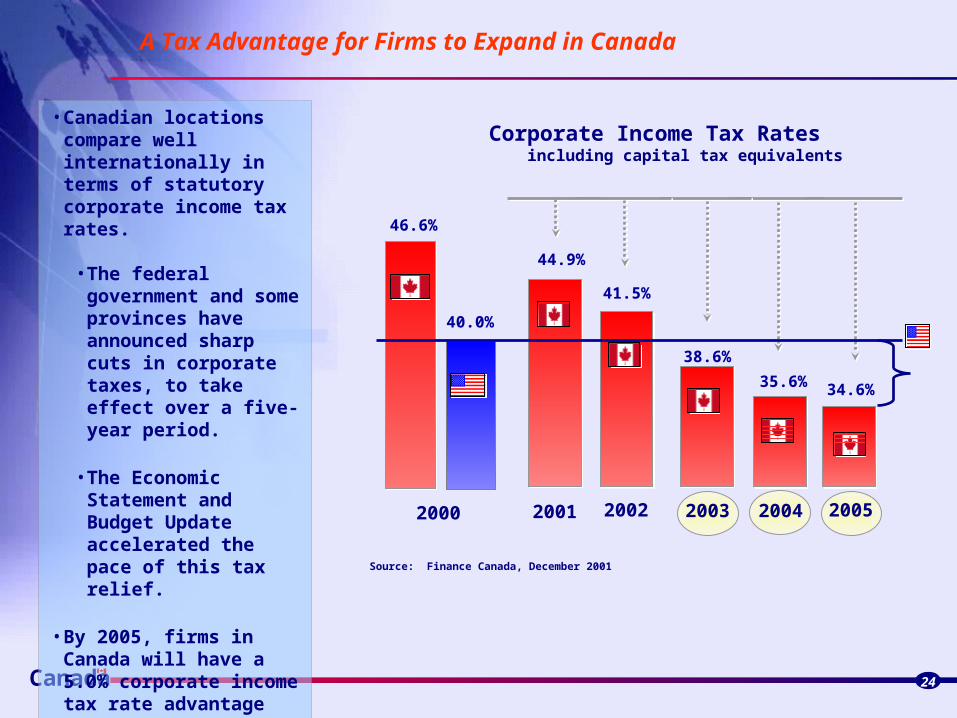
A Tax Advantage for Firms to Expand in Canada
Corporate Income Tax Rates including capital tax equivalents
44.9%
41.5%
38.6%
35.6% 34.6%
40.0%
46.6%
2000 2001 2002 2003 2004 2005
Source: Finance Canada, December 2001
• Canadian locations compare well internationally in terms of statutory corporate income tax rates.
• The federal government and some provinces have announced sharp cuts in corporate taxes, to take effect over a five-year period.
• The Economic Statement and Budget Update accelerated the pace of this tax relief.
• By 2005, firms in Canada will have a 5.0% corporate income tax rate advantage over U.S. firms (including capital tax).
Canada
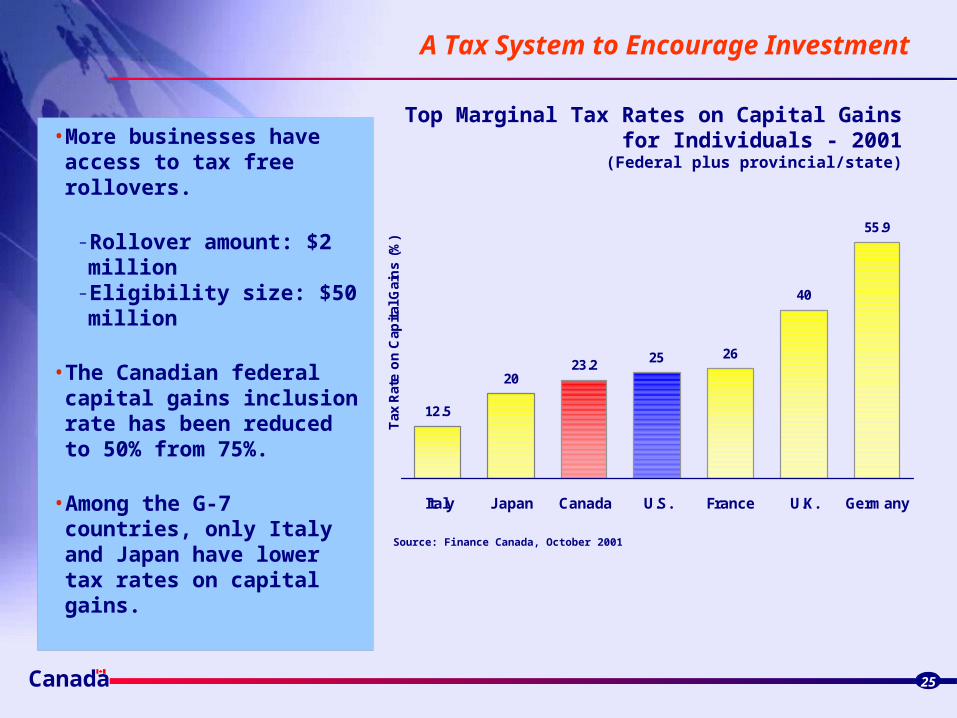
A Tax System to Encourage Investment
25
• More businesses have access to tax free rollovers.
- Rollover amount: $2 million- Eligibility size: $50 million
• The Canadian federal capital gains inclusion rate has been reduced to 50% from 75%.
• Among the G-7 countries, only Italy and Japan have lower tax rates on capital gains.
Top Marginal Tax Rates on Capital Gains for Individuals - 2001 (Federal plus provincial/state)
12.5
2023.2 25 26
40
55.9
Italy Japan Canada U.S. France U.K. Germany
Tax
Rat
e o
n C
apit
al G
ain
s (
%)
Source: Finance Canada, October 2001
Canada
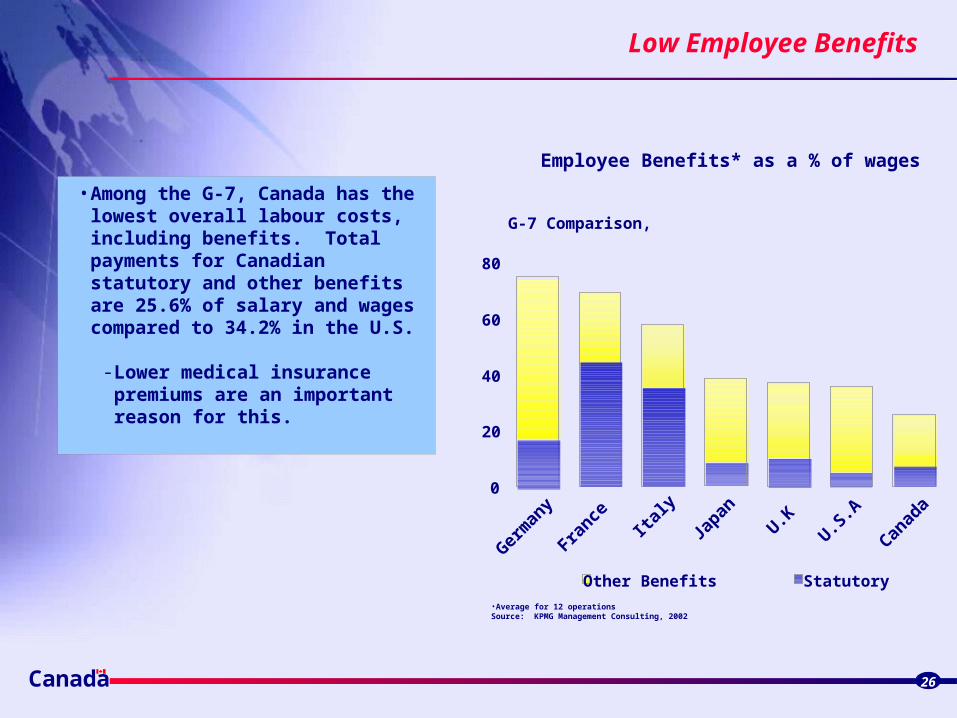
Low Employee Benefits
26
• Among the G-7, Canada has the lowest overall labour costs, including benefits. Total payments for Canadian statutory and other benefits are 25.6% of salary and wages compared to 34.2% in the U.S.
- Lower medical insurance premiums are an important reason for this.
Employee Benefits* as a % of wages
G-7 Comparison,
•Average for 12 operations Source: KPMG Management Consulting, 2002
0
20
40
60
80
Germ
any
France Ita
ly
Japan
U.KU.S
.A
Canad
a
Other Benefits Statutory
Canada
Quality Health Care at Low Cost
27
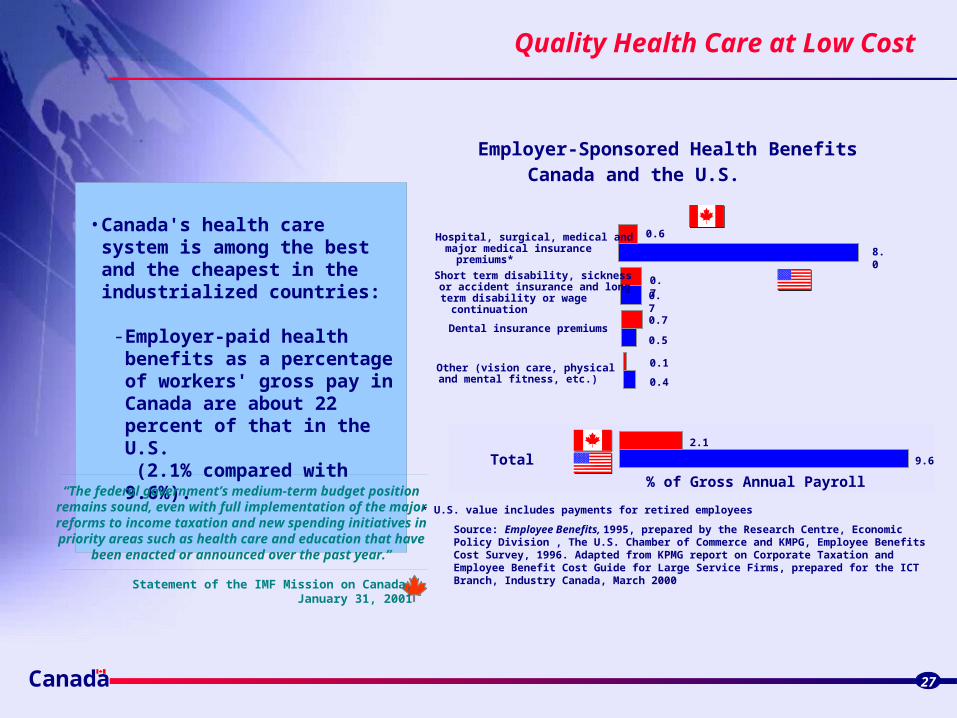
• Canada's health care system is among the best and the cheapest in the industrialized countries:
- Employer-paid health benefits as a percentage of workers' gross pay in Canada are about 22 percent of that in the U.S.
(2.1% compared with 9.6%).
2.1
9.6
% of Gross Annual Payroll
0.6
0.7
0.7
0.1
8.0
0.7
0.5
0.4
Hospital, surgical, medical and major medical insurance premiums*
Short term disability, sickness or accident insurance and long term disability or wage continuation
Dental insurance premiums
Other (vision care, physical and mental fitness, etc.)
Employer-Sponsored Health BenefitsCanada and the U.S.
* U.S. value includes payments for retired employees
Source: Employee Benefits, 1995, prepared by the Research Centre, Economic Policy Division , The U.S. Chamber of Commerce and KMPG, Employee Benefits Cost Survey, 1996. Adapted from KPMG report on Corporate Taxation and Employee Benefit Cost Guide for Large Service Firms, prepared for the ICT Branch, Industry Canada, March 2000
Total
“The federal government’s medium-term budget position remains sound, even with full implementation of the major reforms to income taxation and new spending initiatives in priority areas such as health care and education that have
been enacted or announced over the past year.”
Statement of the IMF Mission on Canada,January 31, 2001
Canada
Low R&D Costs
28
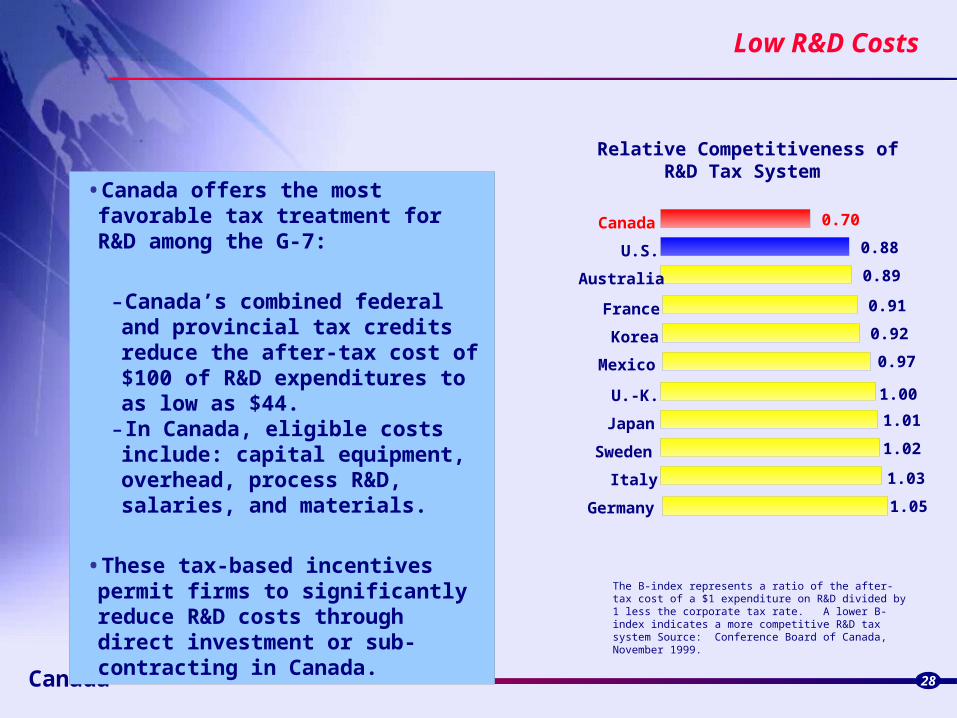
•Canada offers the most favorable tax treatment for R&D among the G-7:
-Canada’s combined federal and provincial tax credits reduce the after-tax cost of $100 of R&D expenditures to as low as $44.
- In Canada, eligible costs include: capital equipment, overhead, process R&D, salaries, and materials.
•These tax-based incentives permit firms to significantly reduce R&D costs through direct investment or sub-contracting in Canada.
Relative Competitiveness ofR&D Tax System
Canada 0.70
Korea
U.S.
France
U.-K.
Japan
Mexico
Italy
Germany
0.88
0.89
0.91
0.92
0.97
1.00
1.01
1.02
1.03
1.05
Australia
Sweden
The B-index represents a ratio of the after-tax cost of a $1 expenditure on R&D divided by 1 less the corporate tax rate. A lower B-index indicates a more competitive R&D tax system Source: Conference Board of Canada, November 1999.
Canada
Low Energy Costs and Rates
29
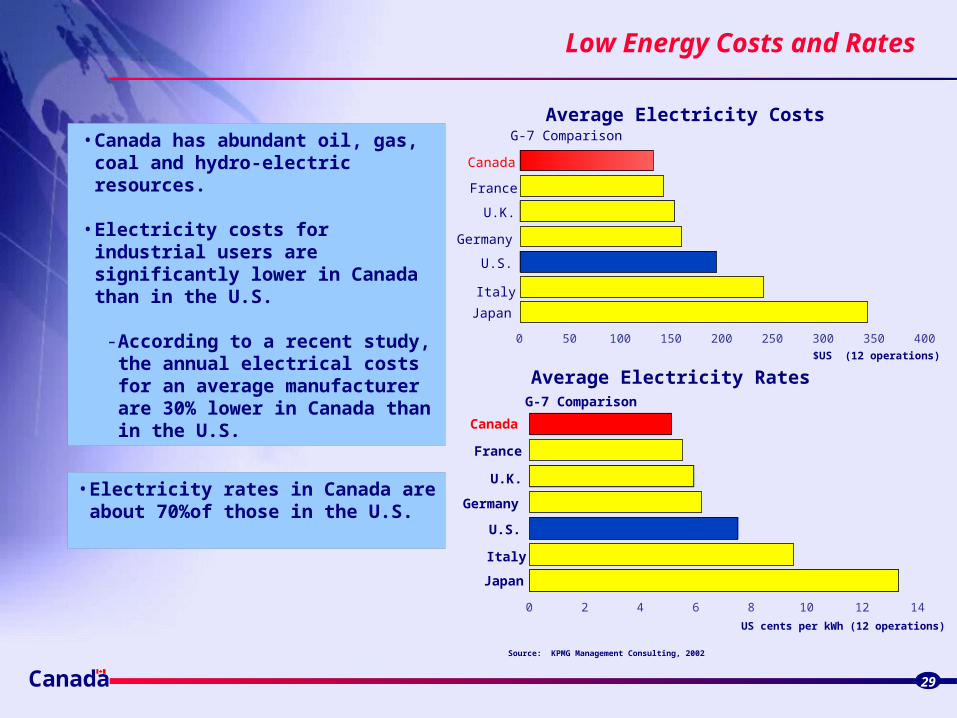
• Electricity rates in Canada are about 70%of those in the U.S.
• Canada has abundant oil, gas, coal and hydro-electric resources.
• Electricity costs for industrial users are significantly lower in Canada than in the U.S.
- According to a recent study, the annual electrical costs for an average manufacturer are 30% lower in Canada than in the U.S.
Source: KPMG Management Consulting, 2002
Average Electricity Rates
Canada
France
U.K.
Germany
U.S.
Italy
Japan
G-7 Comparison
Average Electricity Costs
Canada
France
U.K.
Germany
U.S.
Italy
Japan
G-7 Comparison
0 50 100 150 200 250 300 350 400
0 2 4 6 8 10 12 14
US cents per kWh (12 operations)
$US (12 operations)
Canada
Low Costs for Construction, Land, Office Lease
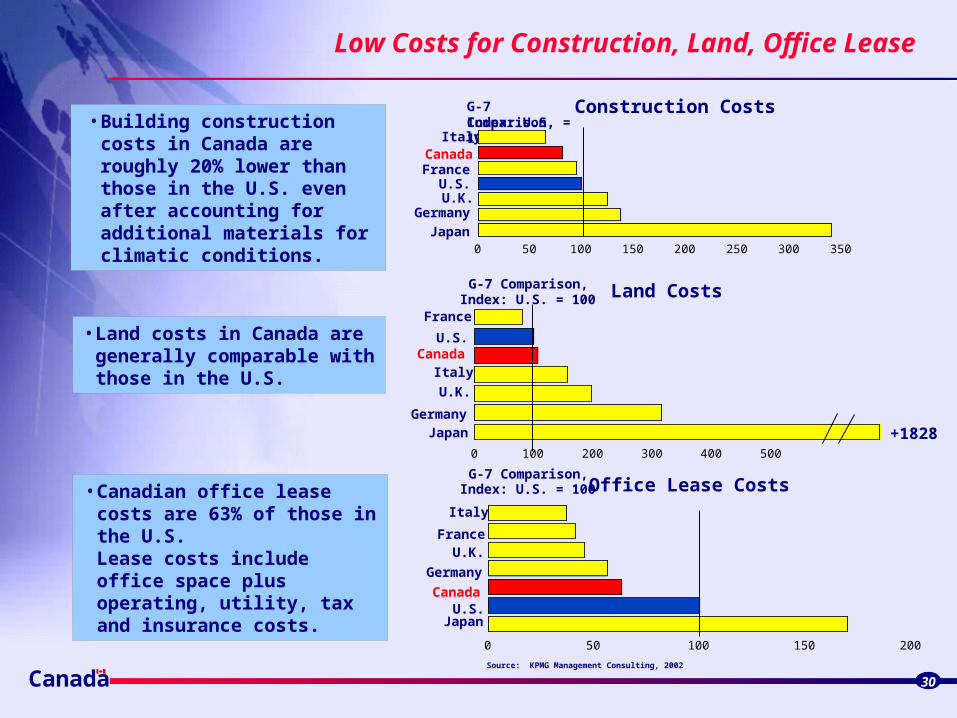
Source: KPMG Management Consulting, 2002
30
• Building construction costs in Canada are roughly 20% lower than those in the U.S. even after accounting for additional materials for climatic conditions.
Construction Costs
Land Costs
• Land costs in Canada are generally comparable with those in the U.S.
• Canadian office lease costs are 63% of those in the U.S. Lease costs include office space plus operating, utility, tax and insurance costs.
Office Lease Costs
ItalyCanadaFrance
U.S.U.K.
Germany
Japan
G-7 Comparison,Index: U.S. = 100
France
U.S.Canada
Italy
U.K.
GermanyJapan
G-7 Comparison,Index: U.S. = 100
Italy
France
Germany
Canada
U.K.
U.S.Japan
G-7 Comparison,Index: U.S. = 100
+1828
0 50 100 150 200 250 300 350
0 100 200 300 400 500
0 50 100 150 200
Canada
First-Class Technological Infrastructure
31
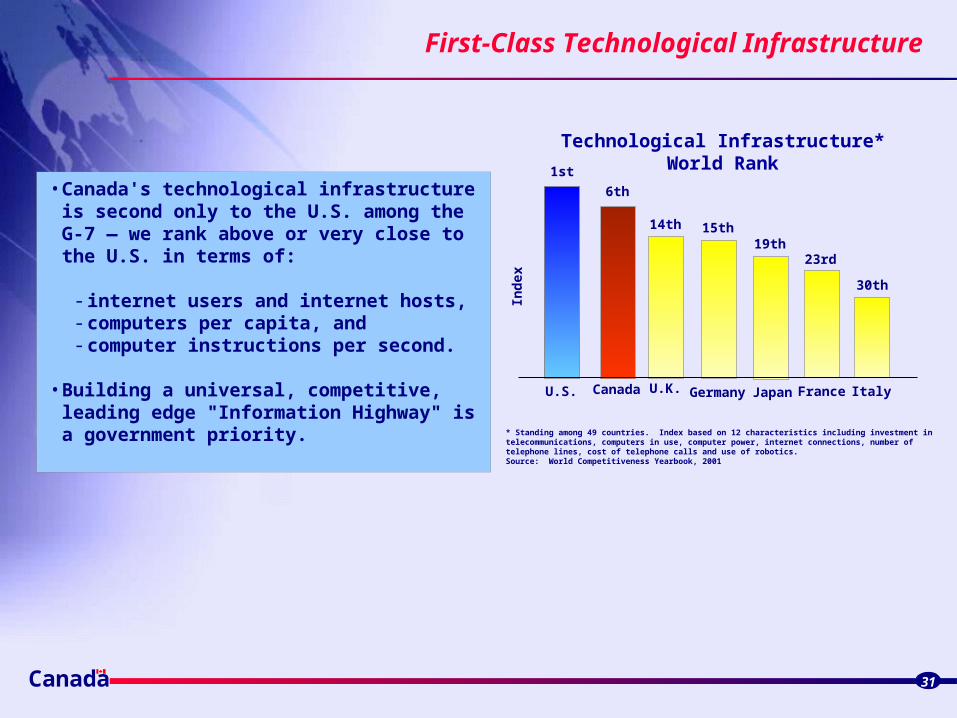
• Canada's technological infrastructure is second only to the U.S. among the G-7 — we rank above or very close to the U.S. in terms of:
- internet users and internet hosts, - computers per capita, and- computer instructions per second.
• Building a universal, competitive, leading edge "Information Highway" is a government priority. * Standing among 49 countries. Index based on 12 characteristics including investment in telecommunications,
computers in use, computer power, internet connections, number of telephone lines, cost of telephone calls and use of robotics. Source: World Competitiveness Yearbook, 2001
Technological Infrastructure*World Rank1st
6th
14th
19th15th
30th
23rd
CanadaU.S. U.K. JapanGermany ItalyFrance
Ind
ex

Canada
First in Internet Users and Among Leaders in PCs
32
501 488
281 268245
218
152
Canada U.S. U.K. Japan Germany Italy France
Internet Users Per 1,000Inhabitants
Source: World Competitiveness Yearbook 2001
581549
442389 373 369
308
U.S. Canada GermanyU.K. Japan France Italy
Source: World Competitiveness Yearbook 2001
Personal Computers Per 1,000Inhabitants
• Canada is tops among the G-7 countries in the share of its population that uses the Internet.
• Moreover, Canada is second only to the U.S. in the number of computers per 1,000 people.
Canada
First in Internet and Wireless Affordability
33
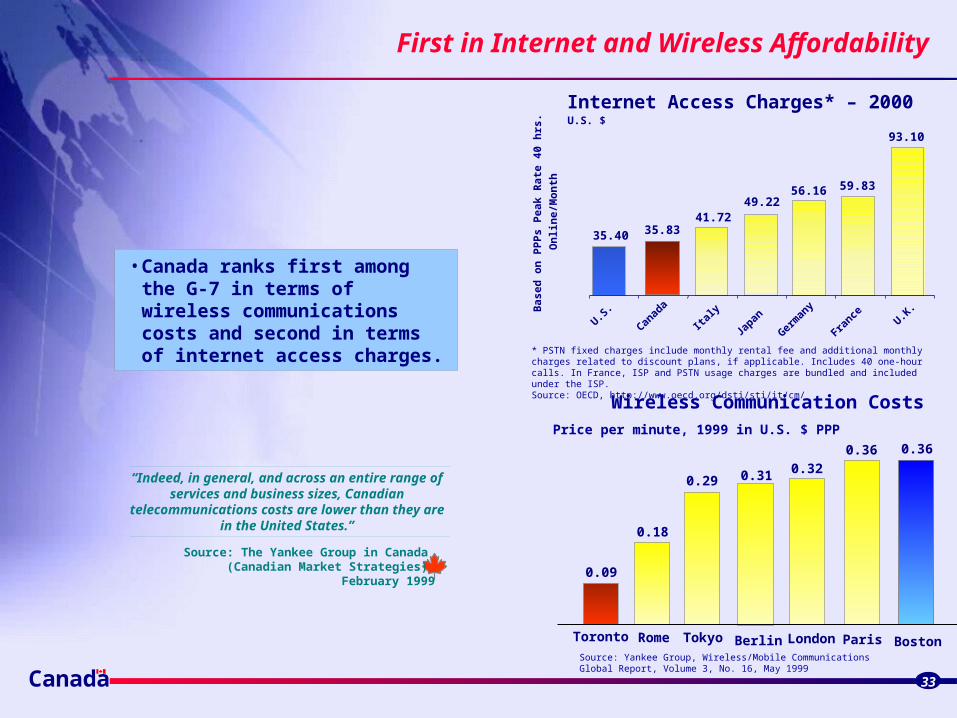
• Canada ranks first among the G-7 in terms of wireless communications costs and second in terms of internet access charges.
Internet Access Charges* – 2000
93.10
59.8356.1649.22
41.7235.8335.40
France U.K
.
Germ
any
JapanIta
lyU.S.
Canad
a
U.S. $
Bas
ed o
n P
PP
s P
eak
Rat
e 40
hrs
.
On
lin
e/M
on
th
* PSTN fixed charges include monthly rental fee and additional monthly charges related to discount plans, if applicable. Includes 40 one-hour calls. In France, ISP and PSTN usage charges are bundled and included under the ISP.Source: OECD, http://www.oecd.org/dsti/sti/it/cm/
0.360.36
0.320.310.29
0.18
0.09
BostonParisLondonBerlinTokyoRomeToronto
Wireless Communication CostsPrice per minute, 1999 in U.S. $ PPP
Source: Yankee Group, Wireless/Mobile Communications Global Report, Volume 3, No. 16, May 1999
Source: The Yankee Group in Canada (Canadian Market Strategies)
February 1999
“Indeed, in general, and across an entire range of services and business sizes, Canadian
telecommunications costs are lower than they are in the United States.”
Canada
First in Telephone Affordability
34
1566
1443
1215
1076
1067
1177
745
Italy
U.S.
Germany
France
U.K.
Japan
Canada
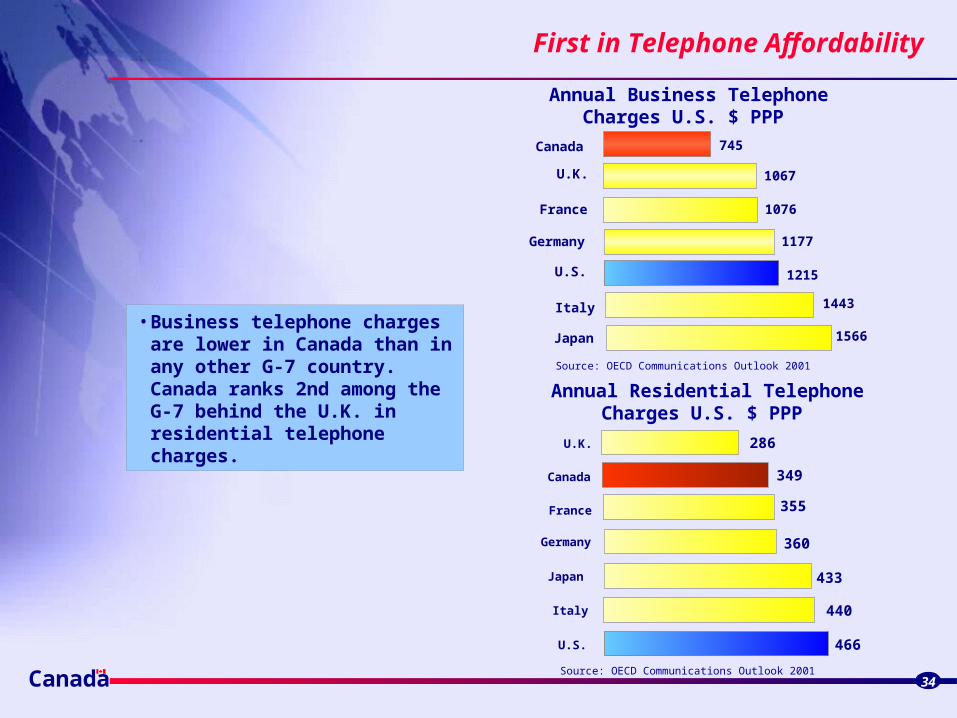
Annual Business Telephone Charges U.S. $ PPP
Source: OECD Communications Outlook 2001
466
440
433
360
355
349
286
Italy
France
Germany
U.K.
Japan
U.S.
Canada
Annual Residential Telephone Charges U.S. $ PPP
Source: OECD Communications Outlook 2001
• Business telephone charges are lower in Canada than in any other G-7 country. Canada ranks 2nd among the G-7 behind the U.K. in residential telephone charges.
Canada
First in Telephone and Cable Penetration
35
98.4 9896.9
9594.2
89.3
Canada France Italy U.K. U.S. Germany
69.5 67.0
52.7
25.9
11.612.0
Canada U.S. Germany U.K. France Italy
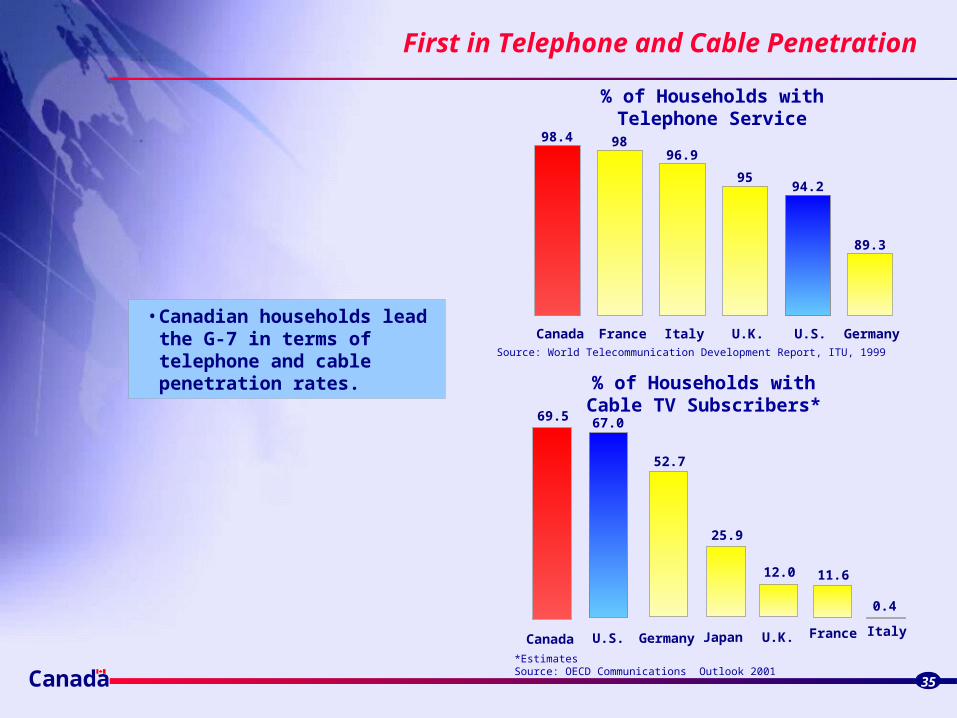
% of Households with Telephone Service
Source: World Telecommunication Development Report, ITU, 1999
% of Households with Cable TV Subscribers*
*Estimates Source: OECD Communications Outlook 2001
• Canadian households lead the G-7 in terms of telephone and cable penetration rates.
0.4
Japan
Canada
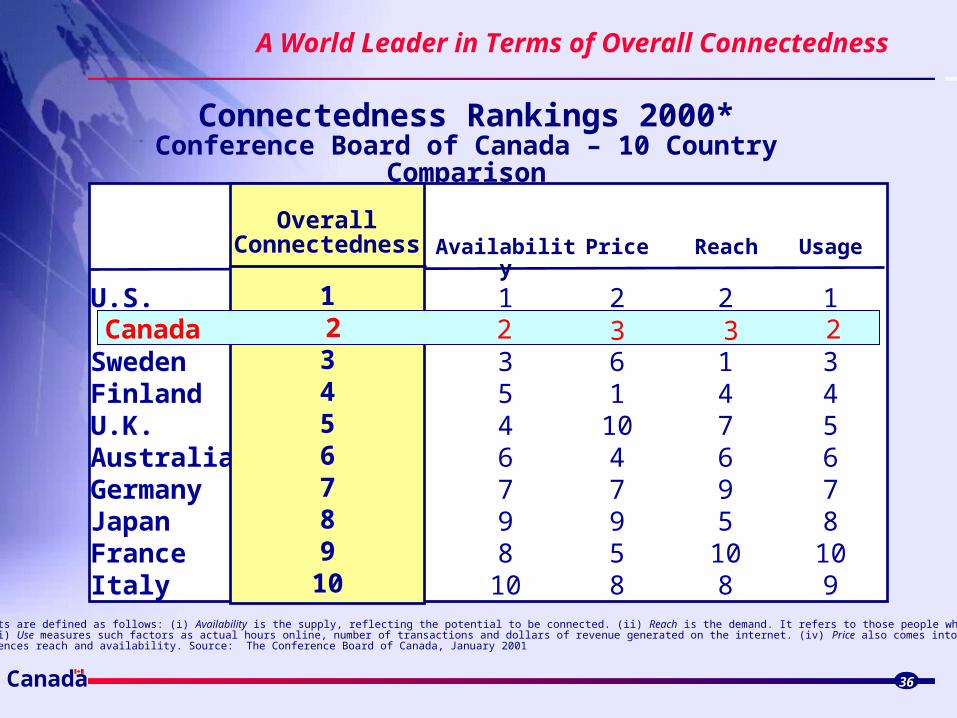
A World Leader in Terms of Overall Connectedness
36
Connectedness Rankings 2000*Conference Board of Canada – 10 Country Comparison
* The four components are defined as follows: (i) Availability is the supply, reflecting the potential to be connected. (ii) Reach is the demand. It refers to those people who already subscribe to the network. (iii) Use measures such factors as actual hours online, number of transactions and dollars of revenue generated on the internet. (iv) Price also comes into play insofar as it influences reach and availability. Source: The Conference Board of Canada, January 2001
2
147695
108
1
3546798
10
2
61
1047958
1
345678
109
Availability Price Reach Usage
U.S.
SwedenFinlandU.K.AustraliaGermanyJapanFranceItaly
Overall Connectedness
1
3456789
10
32 3 2Canada 2
Canada
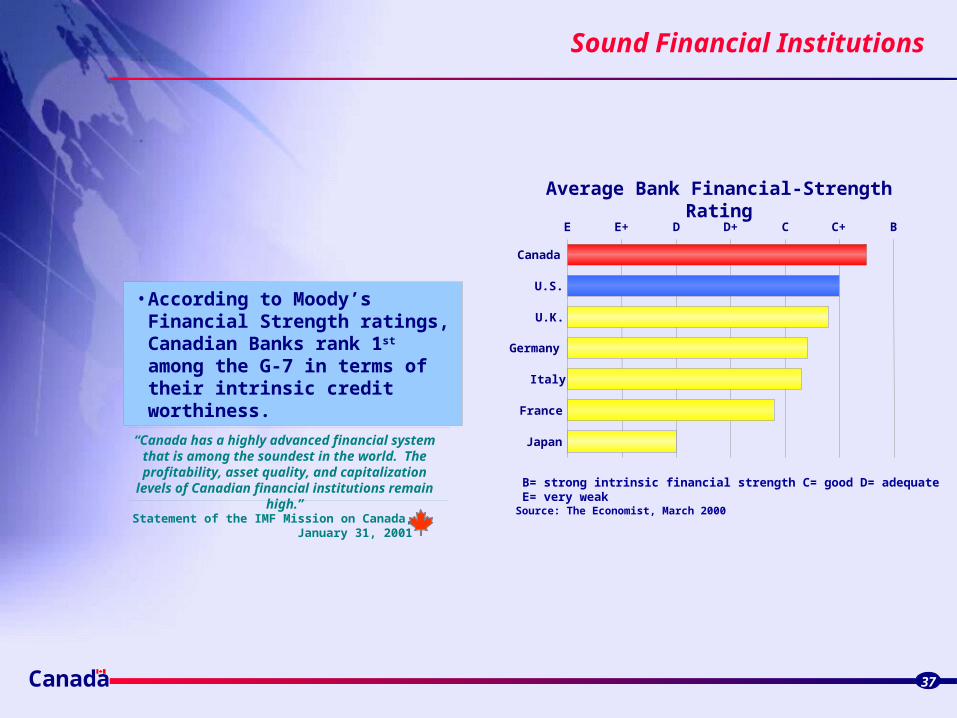
Sound Financial Institutions
37
• According to Moody’s Financial Strength ratings, Canadian Banks rank 1st among the G-7 in terms of their intrinsic credit worthiness.
E E+ D D+ C C+ B
Japan
France
Italy
Germany
U.K.
U.S.
Canada
Average Bank Financial-Strength Rating
B= strong intrinsic financial strength C= good D= adequate E= very weak
Source: The Economist, March 2000Statement of the IMF Mission on Canada,
January 31, 2001
“Canada has a highly advanced financial system that is among the soundest in the world. The
profitability, asset quality, and capitalization levels of Canadian financial institutions remain high.”
Canada 38
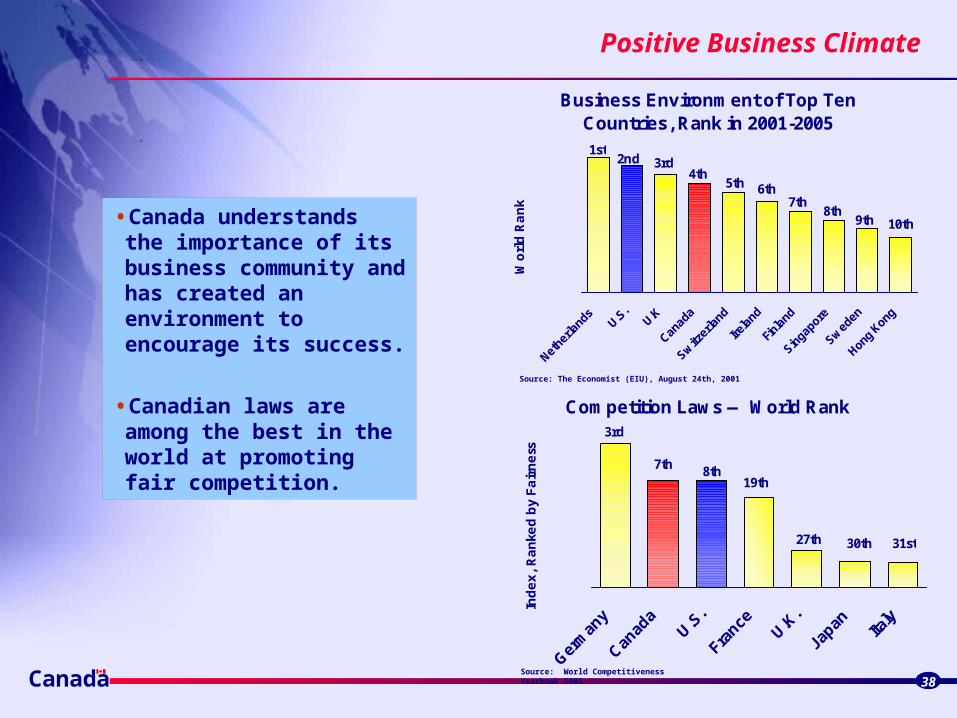
Positive Business Climate
•Canada understands the importance of its business community and has created an environment to encourage its success.
•Canadian laws are among the best in the world at promoting fair competition.
Source: The Economist (EIU), August 24th, 2001
Business Environment of Top TenCountries, Rank in 2001-2005
Wo
rld
Ra
nk
1st 2nd 3rd
4th 5th 6th
7th
10th9th8th
Competition Laws — World Rank
Ind
ex
, R
an
ked
by
Fa
irn
ess
31st30th27th
19th8th7th
3rd
Source: World Competitiveness Yearbook 2001
Canada
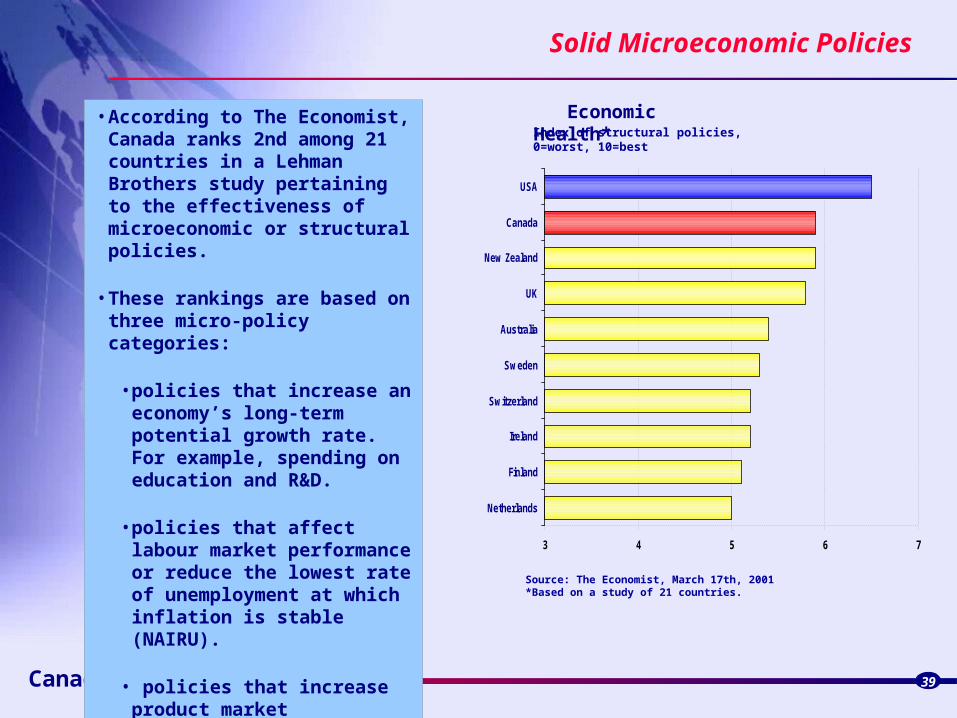
Solid Microeconomic Policies
39
• According to The Economist, Canada ranks 2nd among 21 countries in a Lehman Brothers study pertaining to the effectiveness of microeconomic or structural policies.
• These rankings are based on three micro-policy categories:
• policies that increase an economy’s long-term potential growth rate. For example, spending on education and R&D.
• policies that affect labour market performance or reduce the lowest rate of unemployment at which inflation is stable (NAIRU).
• policies that increase product market competition.
Economic Health* Index of structural policies, 0=worst, 10=best
3 4 5 6 7
Netherlands
Finland
Ireland
Switzerland
Sweden
Australia
UK
New Zealand
Canada
USA
Source: The Economist, March 17th, 2001*Based on a study of 21 countries.

Canada
Less Paperwork for New Businesses
40
•Canada makes it easier to set up a new business, with less paperwork than any other country.
•Canada is the most efficient place to pull together worldwide research or production teams.
Total Number of Business Start-up Procedures*
Source: The World Bank and Harvard University,taken from The Globe and Mail, November 14, 2000
*Procedures divided into five major categories: Safety & Health, Environment, Taxes, Labour, and Screening.
0 2 4 6 8
Norway
Israel
Denmark
Finland
Ireland
Sweden
USA
New Zealand
Australia
Canada
Canada
Forward-Looking Framework Policies
41
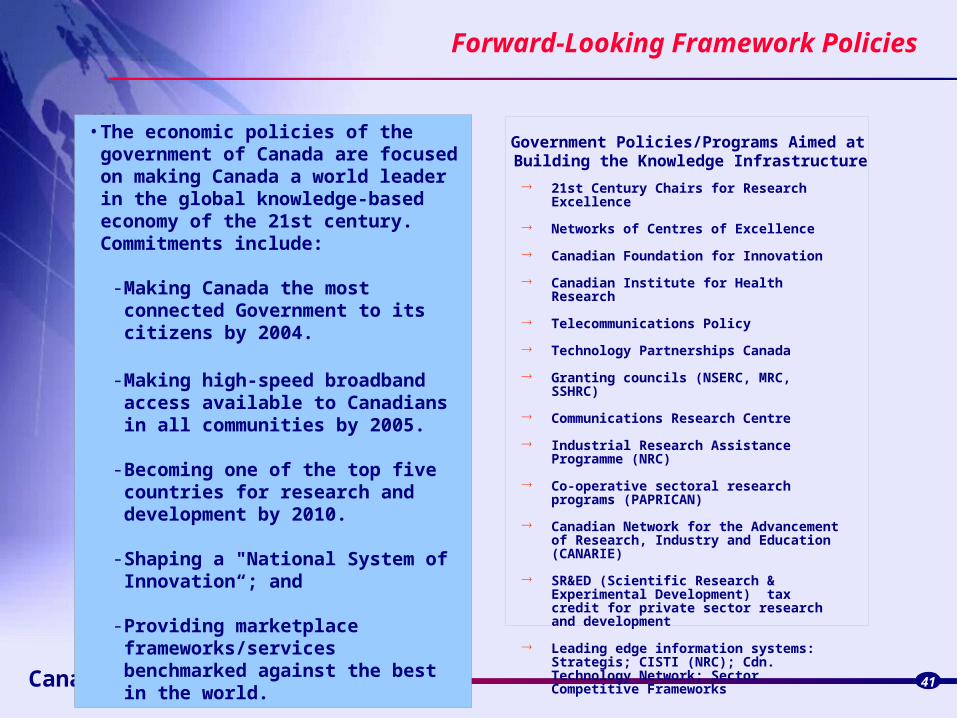
• The economic policies of the government of Canada are focused on making Canada a world leader in the global knowledge-based economy of the 21st century. Commitments include:
- Making Canada the most connected Government to its citizens by 2004.
- Making high-speed broadband access available to Canadians in all communities by 2005.
- Becoming one of the top five countries for research and development by 2010.
- Shaping a "National System of Innovation“; and
- Providing marketplace frameworks/services benchmarked against the best in the world.
Government Policies/Programs Aimed at Building the Knowledge Infrastructure
21st Century Chairs for Research Excellence
Networks of Centres of Excellence
Canadian Foundation for Innovation
Canadian Institute for Health Research
Telecommunications Policy
Technology Partnerships Canada
Granting councils (NSERC, MRC, SSHRC)
Communications Research Centre
Industrial Research Assistance Programme (NRC)
Co-operative sectoral research programs (PAPRICAN)
Canadian Network for the Advancement of Research, Industry and Education (CANARIE)
SR&ED (Scientific Research & Experimental Development) tax credit for private sector research and development
Leading edge information systems: Strategis; CISTI (NRC); Cdn. Technology Network; Sector Competitive Frameworks
Canada Provides:
Easy access to markets
A cost-competitive business environment
An excellent place to live
Excellent economic fundamentalsExcellent economic fundamentals
Canada 42
Canada
Reasonable Cost of Living ...
43
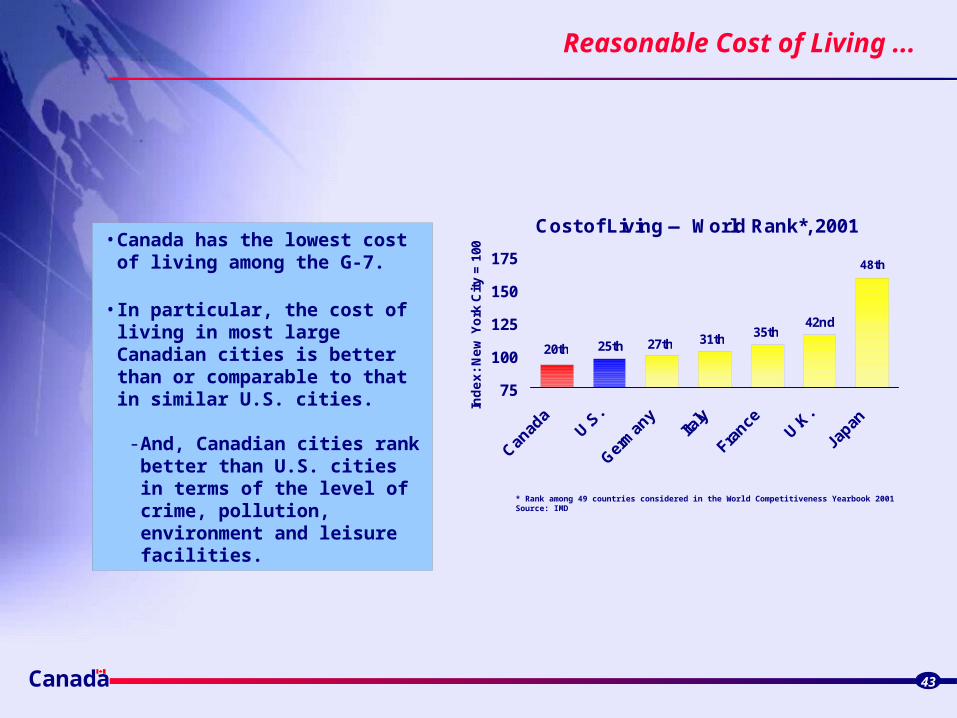
• Canada has the lowest cost of living among the G-7.
• In particular, the cost of living in most large Canadian cities is better than or comparable to that in similar U.S. cities.
- And, Canadian cities rank better than U.S. cities in terms of the level of crime, pollution, environment and leisure facilities.
Cost of Living — World Rank*, 2001
75
100
125
150
175
Canad
aU.S
.
Germ
any
Italy
France
U.K.
Japan
Ind
ex
: N
ew
Yo
rk C
ity
= 1
00
48th
42nd35th31th27th25th20th
* Rank among 49 countries considered in the World Competitiveness Yearbook 2001Source: IMD
Canada
…A Good Environmental Record
44
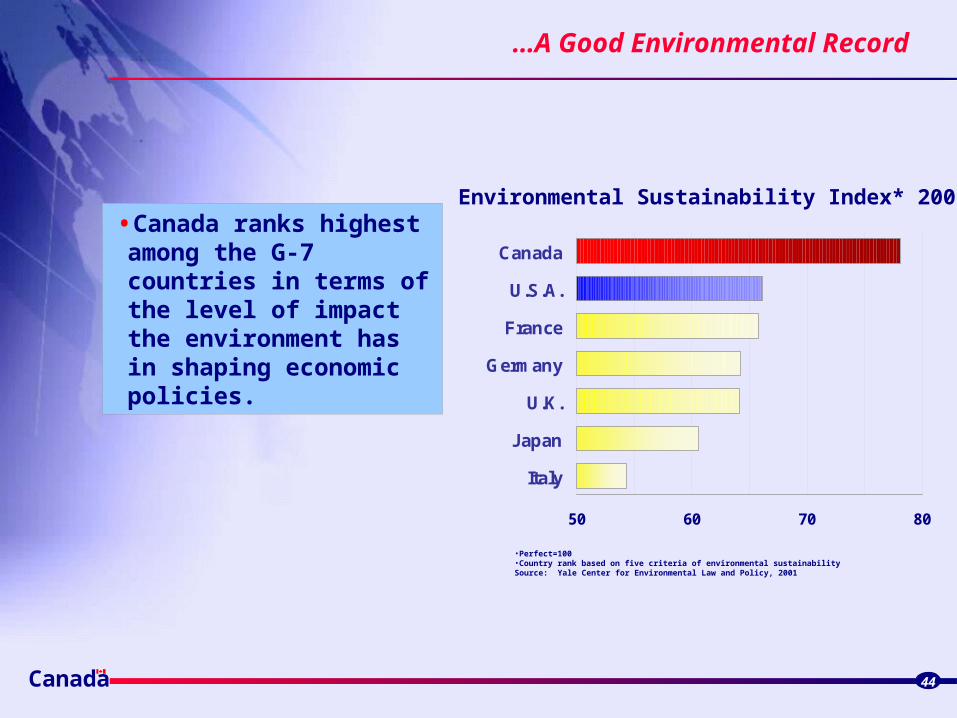
•Canada ranks highest among the G-7 countries in terms of the level of impact the environment has in shaping economic policies.
•Perfect=100•Country rank based on five criteria of environmental sustainabilitySource: Yale Center for Environmental Law and Policy, 2001
Environmental Sustainability Index* 2001
50 60 70 80
Italy
Japan
U.K.
Germany
France
U.S.A.
Canada
Canada
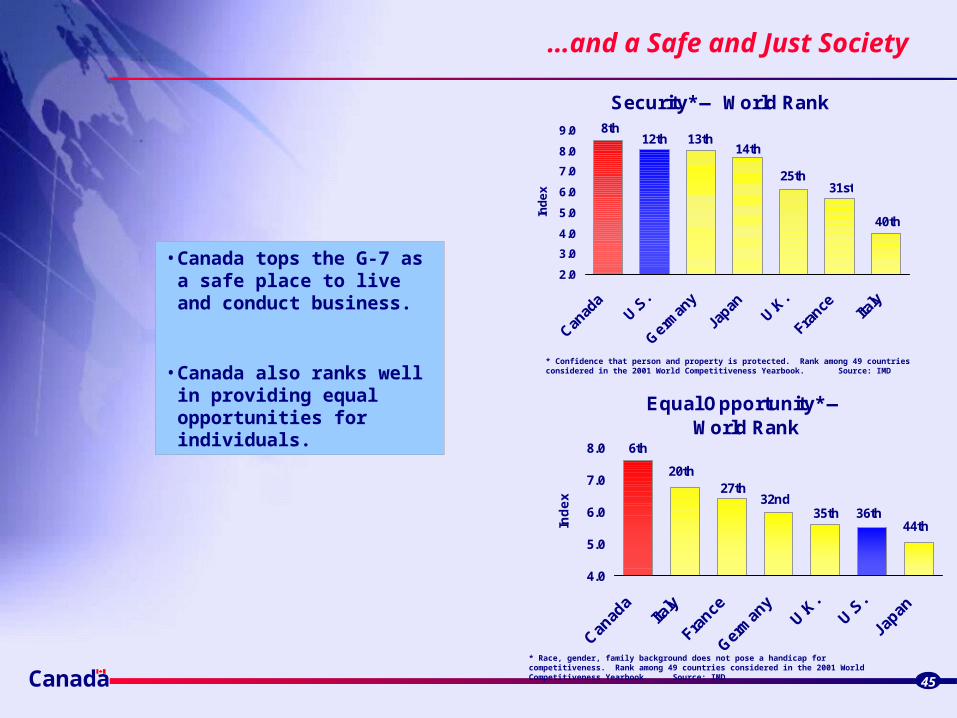
…and a Safe and Just Society
45
• Canada tops the G-7 as a safe place to live and conduct business.
• Canada also ranks well in providing equal opportunities for individuals.
* Race, gender, family background does not pose a handicap for competitiveness. Rank among 49 countries considered in the 2001 World Competitiveness Yearbook Source: IMD
* Confidence that person and property is protected. Rank among 49 countries considered in the 2001 World Competitiveness Yearbook. Source: IMD
Security* — World Rank
2.0
3.0
4.0
5.0
6.0
7.0
8.0
9.0
Canad
aU.S
.
Germ
any
Japan
U.K.
France Ita
ly
Ind
ex
40th
31st25th
14th13th12th
8th
Equal Opportunity* —World Rank
4.0
5.0
6.0
7.0
8.0
Ind
ex
44th36th35th
32nd27th
20th
6th
J. David O'Blenis, President,Honeywell Aerospace Canada
"Aerospace is truly a global business and these wins [move of Power Management and Generating systems to Toronto, expansion of plants in Montreal and Summerside, and
investment of more than $50 million in a new headquarters, engineering and
manufacturing facility] for Canada were made possible by the excellent business
climate here: sound fiscal management in the public sector, attractive R&D tax
incentives, and unique opportunities to partner with Governments to achieve growth.
It is clear to me that the decisions taken at the Corporate level of our global business to
focus our growth here show great confidence in Canada."
Canada Offers Much
Canada 46
• Canada's economic fundamentals are excellent — government policies are geared toward competitiveness.
• Canada provides assured access to the world's richest economy, in addition to having a large and growing domestic market of its own.
• Canada provides a cost-competitive and future-oriented environment for business:
- quality, productive workers;- a competitive tax system;- prime locations for R&D activities;- abundant energy at low prices; and- an excellent infrastructure.
• Canada is an outstanding place to live, invest and do business.

Any questions or comments?
Canada 47
• We welcome your questions, and comments. You can reach us by …
sending us a letter: Renée St-Jacques Director GeneralMicro-Economic Policy AnalysisIndustry Canada235 Queen StreetOttawa, OntarioK1A 0H5
e-mailing: [email protected]
or faxing us at: (613) 941-9224
• Think Canada! is prepared by Arif Mahmud,Micro-Economic Analysis Directorate, Industry Canada.


![Think Canada Again Web Version FINAL[1]](https://img.pdfslide.net/doc/110x75/577d220a1a28ab4e1e966e9e/think-canada-again-web-version-final1.jpg)