Embed Size (px)
Citation preview

THIS REPORT CONTAINS ASSESSMENTS OF COMMODITY AND TRADE ISSUES MADE BY
USDA STAFF AND NOT NECESSARILY STATEMENTS OF OFFICIAL U.S. GOVERNMENT
POLICY
Date:
GAIN Report Number:
Approved By:
Prepared By:
Report Highlights:
Broiler meat production is forecast to expand to record levels in 2018, prompted by sustained consumer
demand. Chicken remains competitively priced and an attractive substitute to other pricier meats.
Canada’s chicken tariff rate quota (TRQ) is projected to reach 90,000 metric tons (MT), and imports of
broiler meat are forecast to grow moderately. Imports from the United States are expected to remain
over 80 percent of Canada’s total imports. Additional imports under re-export programs, the great
majority of which originate in the U.S., are estimated to stay well below the record levels registered in
2015.
Mihai Lupescu
Rhiannon Elms
2017
Poultry and Products Annual
Canada
CA17034
8/3/2017
Required Report - public distribution

Canada – Poultry and Products Annual - 2017
2 | P a g e
Executive Summary
• Post forecasts continued sustained growth for 2018, with broiler meat production estimated at
1,240,000 MT, or 3.3 percent above the 2017 estimated level. Poultry meat continues to enjoy a solid
demand. With supply management, poultry farmers in Canada recover their costs of production from
processing plants. Farmers are, therefore, largely sheltered from the impact of fluctuating feed costs.
Although poultry processors' ability to pass on input costs to downstream customers is more limited, in
2018 they are likely to continue to enjoy positive profit margins.
• For 2017, Post estimates broiler meat production at 1,200,000 MT, a level reflecting a stronger
than expected growth in the sector compared to the previous year, as the industry steadily increased
production throughout the year to meet a solid demand. The growth in the chicken sector is estimated for
2017 at 4.4 percent, which is a remarkable level. The last time the sector grew at a rate above 4 percent
was back in 2001 (a 6 percent growth rate at the time).
• Canadian imports of chicken meat are regulated under a tariff rate quota (TRQ) which is a
function of the previous year's production level. The global quota for 2018 is projected at 90,000 MT,
which is supplied predominately by the U.S. In 2017 the TRQ level is 86,100 MT.
• Two import for re-export programs are currently used by Canadian poultry companies. The
Canada Border Services Agency (CBSA) operates the Duties Relief Program (DRP), which, starting
from 2012, saw a surge in popularity among Canadian companies. Global Affairs Canada (GAC)
administers the Imports to Re-Export Program (IREP). In 2016, following compliance verifications
undertaken by the CBSA which uncovered uncompliant program users, the volume of broiler meat
imported under the DRP has declined. For 2018, Post estimates imports under re-export programs (both
IREP and DRP) at 75,000 MT, down from the record level registered in 2015 of 113,000 MT.
IREP/DRP imports may be sourced in any country, but in practice almost the entire volumes are
imported into Canada from the United States, and once processed they return back to the U.S. market.

Canada – Poultry and Products Annual - 2017
3 | P a g e
Poultry, BROILER MEAT
NOTE: "NEW Post" data reflects Post's assessments and are NOT official USDA data.
CANADA Poultry
BROILER
2016 2017 2018
USDA Official Data
NEW Post Data
USDA Official Data
NEW Post Estimates
NEW Post Estimates
Beginning Stocks 43 43 55 42 40
Production 1,165 1,150 1,220 1,200 1,240
Total Imports 129 129 135 130 135
Total Supply 1,337 1,322 1,410 1,372 1,415
Total Exports 134 133 145 140 145
Total Dom. Consumption 1,148 1,147 1,205 1,192 1,225
Ending Stocks 55 42 60 40 45
Total Distribution 1,337 1,322 1,410 1,372 1,415
All data in 1,000 metric tons, carcass weight equivalent
Broiler Meat Production
For 2018, Post forecasts a 3.3 percent increase in broiler meat production, up to 1,240,000 metric tons
(MT), given that the current market conditions – strong demand for broiler meat competitively priced
relative to other meats – will continue to prevail. With supply management, poultry farmers generally
recover their cost of production from processing plants. In this way, farmers are largely sheltered from
the impact of fluctuating feed costs. Typically, the same cannot be said about poultry processors, since
their ability to pass on high input costs to downstream customers is more limited. However, given the
current market conditions, it is expected that processors will continue to enjoy positive profit margins
into the coming year.
For 2017, Post estimates broiler production at 1,200,000 MT reflecting an estimated 4.4 percent growth
over the previous year, as the industry steadily increased production to meet a stable and robust demand.
It must be said that growth rates above 4 percent, have not been observed since 2001, when the chicken
sector in Canada grew by 6 percent.
Canada – Poultry and Products Annual - 2017
4 | P a g e
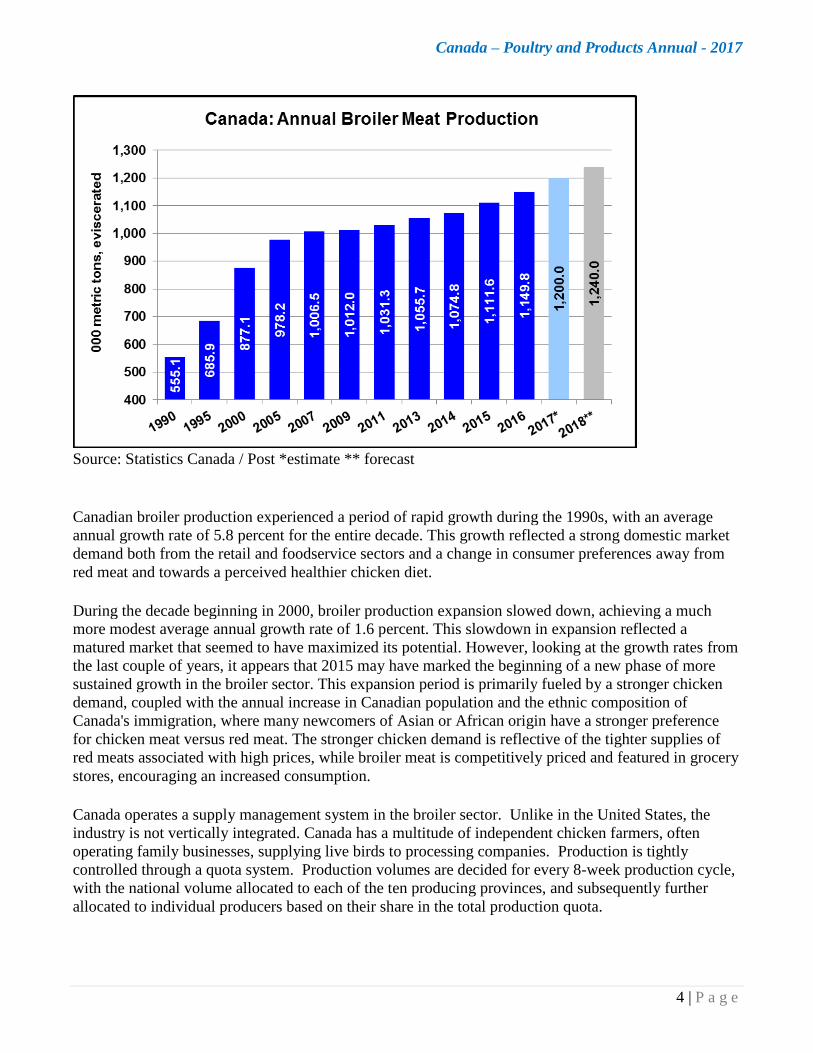
Source: Statistics Canada / Post *estimate ** forecast
Canadian broiler production experienced a period of rapid growth during the 1990s, with an average
annual growth rate of 5.8 percent for the entire decade. This growth reflected a strong domestic market
demand both from the retail and foodservice sectors and a change in consumer preferences away from
red meat and towards a perceived healthier chicken diet.
During the decade beginning in 2000, broiler production expansion slowed down, achieving a much
more modest average annual growth rate of 1.6 percent. This slowdown in expansion reflected a
matured market that seemed to have maximized its potential. However, looking at the growth rates from
the last couple of years, it appears that 2015 may have marked the beginning of a new phase of more
sustained growth in the broiler sector. This expansion period is primarily fueled by a stronger chicken
demand, coupled with the annual increase in Canadian population and the ethnic composition of
Canada's immigration, where many newcomers of Asian or African origin have a stronger preference
for chicken meat versus red meat. The stronger chicken demand is reflective of the tighter supplies of
red meats associated with high prices, while broiler meat is competitively priced and featured in grocery
stores, encouraging an increased consumption.
Canada operates a supply management system in the broiler sector. Unlike in the United States, the
industry is not vertically integrated. Canada has a multitude of independent chicken farmers, often
operating family businesses, supplying live birds to processing companies. Production is tightly
controlled through a quota system. Production volumes are decided for every 8-week production cycle,
with the national volume allocated to each of the ten producing provinces, and subsequently further
allocated to individual producers based on their share in the total production quota.
Canada – Poultry and Products Annual - 2017
5 | P a g e
In November 2014, a new allocation agreement was reached between industry and provincial
stakeholders that share future growth as follows: 45 percent of future growth is allocated to provinces
based on historical market shares, while the other 55 percent is allocated based on comparative
advantage factors. Provinces that experience a higher population growth rate or a higher gross domestic
product (GDP) growth rate receive a larger share of the future growth in broiler production. Other
comparative advantage factors that are taken into account include: the consumer price index, the farm
input price index, quota utilization, further processing and the supply share.
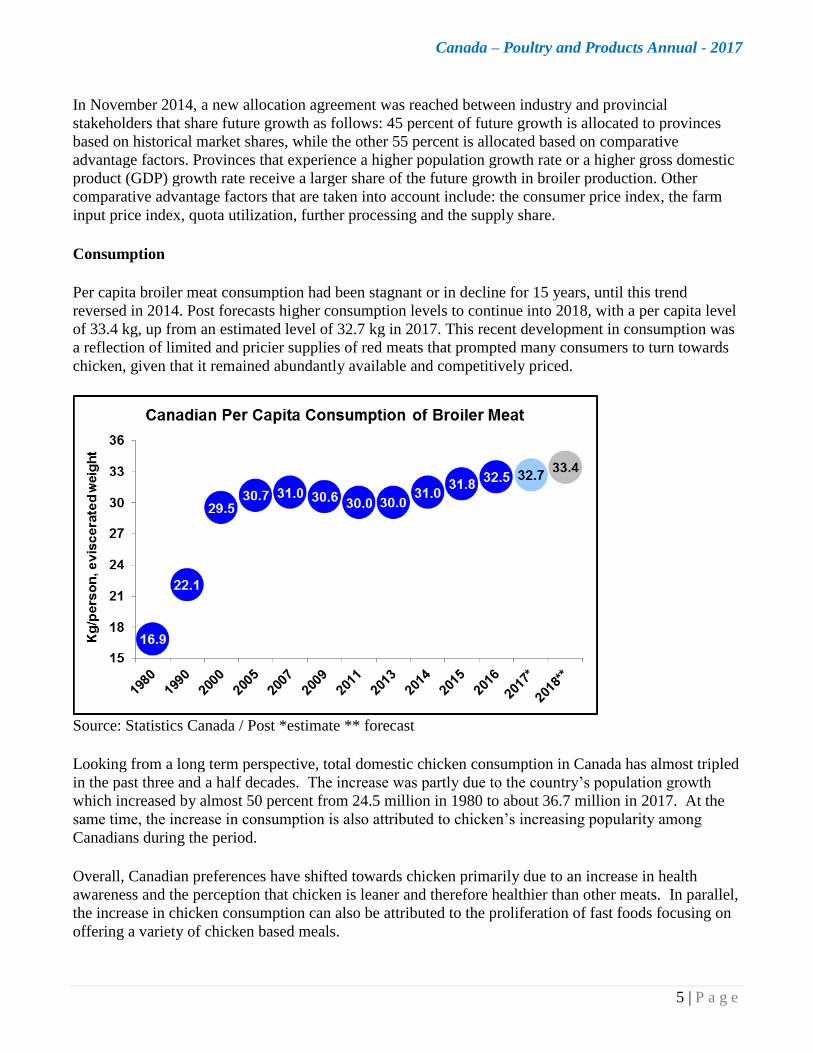
Consumption
Per capita broiler meat consumption had been stagnant or in decline for 15 years, until this trend
reversed in 2014. Post forecasts higher consumption levels to continue into 2018, with a per capita level
of 33.4 kg, up from an estimated level of 32.7 kg in 2017. This recent development in consumption was
a reflection of limited and pricier supplies of red meats that prompted many consumers to turn towards
chicken, given that it remained abundantly available and competitively priced.
Source: Statistics Canada / Post *estimate ** forecast
Looking from a long term perspective, total domestic chicken consumption in Canada has almost tripled
in the past three and a half decades. The increase was partly due to the country’s population growth
which increased by almost 50 percent from 24.5 million in 1980 to about 36.7 million in 2017. At the
same time, the increase in consumption is also attributed to chicken’s increasing popularity among
Canadians during the period.
Overall, Canadian preferences have shifted towards chicken primarily due to an increase in health
awareness and the perception that chicken is leaner and therefore healthier than other meats. In parallel,
the increase in chicken consumption can also be attributed to the proliferation of fast foods focusing on
offering a variety of chicken based meals.

Canada – Poultry and Products Annual - 2017
6 | P a g e
Price has typically not been a major factor in influencing consumption since poultry prices, due to the
supply management system, are usually consistently higher than pork and beef cuts, which are not under
supply management schemes. Over the past couple of years though, red meat prices trended higher
making chicken a more attractive choice price-wise as well.
In addition, the ethnic composition of Canada's immigration, where many newcomers are of Asian or
African origin, is one that is more likely to have stronger dietary preferences for chicken rather than
beef or pork. Plus, Canada’s food service providers are continually introducing chicken menu items in
creative ways, or as an ingredient in ethnic-style food offerings, that are becoming increasingly popular.
Chicken Farmers of Canada's Strategic Plan for 2014-2018 has as an overall objective to “grow
consumer demand for Canadian-grown chicken”, and lists only one quantitative goal, “to have
Canadians eat one additional chicken meal every two months”. The previous Strategic Plan for 2009-
2013 listed as an industry objective to increase annual per capita consumption of chicken to 33 kg, an
ambitious goal that, at the time, remained unachieved.
Prices
With the supply management system, chicken producers receive a fixed price for their live birds, which
is determined every 8-week production cycle based on production costs. Ontario is the largest chicken
producing province in Canada, capturing about one-third of the market, and therefore Ontario live bird
prices are the basis for the calculation of prices in other provinces. Due to the supply management
system, producer prices have remained remarkably stable over time, and only showed a more substantial
increase over the 2008-2013 period, due to dramatic increases in grain and feed prices. However, since
2014, prices have come down, reflecting once again cheaper feed costs.
Source: Chicken Farmers of Canada / *Post estimate

Canada – Poultry and Products Annual - 2017
7 | P a g e
The Canadian supply management system guarantees prices only for producers and not downstream for
the other participants in the supply chain. Wholesale and retail broiler meat prices are usually reflective
of market conditions in terms of supply and demand. They are also reflective of consumer preferences
for various chicken cuts, and of their quality and degree of transformation.
Similar to consumers in the United States, Canadian consumers tend to prefer white meat (breast and
wings) over dark meat (legs). The most expensive chicken cut is the fresh boneless skinless breast,
widely used in restaurants and a preferred barbecue item for Canadians. Wings are seen as a good
complement to beer and are very popular during the winter hockey season. Leg quarters have
traditionally been the least expensive chicken cuts in groceries, cheaper than the whole birds. However,
as the ethnic mix changes in the general population, and for economic reasons, leg quarters are slowly
becoming an increasingly popular item, and is reflected by a sustained upward trend in retail prices over
the past several years.
Sourc
e: Agriculture and Agri-Food Canada
Trade
Imports
For 2018, imports are projected at 135,000 metric tons (MT), up 5,000 MT from the revised estimate
level of 130,000 MT for 2017. Under the supply management system, broiler meat imports are

Canada – Poultry and Products Annual - 2017
8 | P a g e
controlled and subject to a tariff rate quota (for more information consult the policy section of this
report), which is a function of the production level. Additional imports outside of the TRQ may be
imported under re-export programs. Market conditions in the United Sates also play a significant role in
import decisions, since a large price differential between the lower U.S. broiler meat prices and the
higher Canadian ones is a strong incentive for importers to bring in more American meat, especially
under programs that provide a customs duty exemption, such as IREP (imports for re-export program)
or DRP (duties relief program).
Canada – Poultry and Products Annual - 2017
9 | P a g e
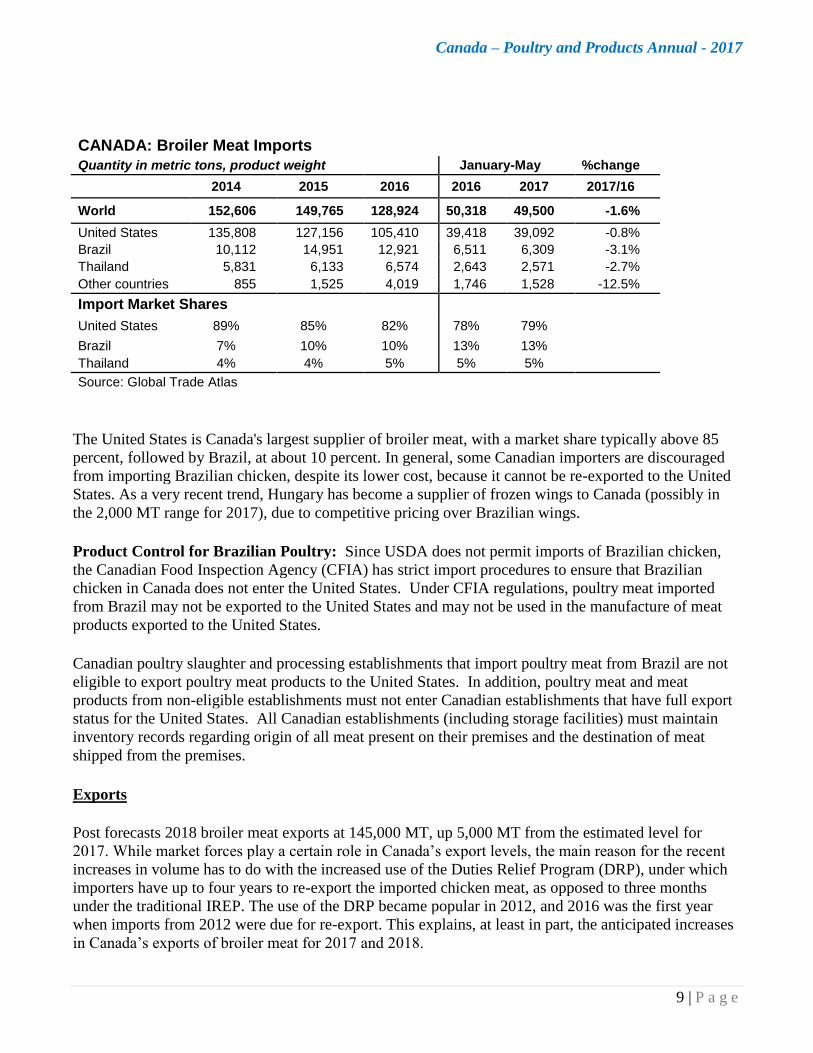
CANADA: Broiler Meat Imports
Quantity in metric tons, product weight January-May %change
2014 2015 2016 2016 2017 2017/16
World 152,606 149,765 128,924 50,318 49,500 -1.6%
United States 135,808 127,156 105,410 39,418 39,092 -0.8%
Brazil 10,112 14,951 12,921 6,511 6,309 -3.1%
Thailand 5,831 6,133 6,574 2,643 2,571 -2.7%
Other countries 855 1,525 4,019 1,746 1,528 -12.5%
Import Market Shares
United States 89% 85% 82% 78% 79%
Brazil 7% 10% 10% 13% 13%
Thailand 4% 4% 5% 5% 5%
Source: Global Trade Atlas
The United States is Canada's largest supplier of broiler meat, with a market share typically above 85
percent, followed by Brazil, at about 10 percent. In general, some Canadian importers are discouraged
from importing Brazilian chicken, despite its lower cost, because it cannot be re-exported to the United
States. As a very recent trend, Hungary has become a supplier of frozen wings to Canada (possibly in
the 2,000 MT range for 2017), due to competitive pricing over Brazilian wings.
Product Control for Brazilian Poultry: Since USDA does not permit imports of Brazilian chicken,
the Canadian Food Inspection Agency (CFIA) has strict import procedures to ensure that Brazilian
chicken in Canada does not enter the United States. Under CFIA regulations, poultry meat imported
from Brazil may not be exported to the United States and may not be used in the manufacture of meat
products exported to the United States.
Canadian poultry slaughter and processing establishments that import poultry meat from Brazil are not
eligible to export poultry meat products to the United States. In addition, poultry meat and meat
products from non-eligible establishments must not enter Canadian establishments that have full export
status for the United States. All Canadian establishments (including storage facilities) must maintain
inventory records regarding origin of all meat present on their premises and the destination of meat
shipped from the premises.
Exports
Post forecasts 2018 broiler meat exports at 145,000 MT, up 5,000 MT from the estimated level for
2017. While market forces play a certain role in Canada’s export levels, the main reason for the recent
increases in volume has to do with the increased use of the Duties Relief Program (DRP), under which
importers have up to four years to re-export the imported chicken meat, as opposed to three months
under the traditional IREP. The use of the DRP became popular in 2012, and 2016 was the first year
when imports from 2012 were due for re-export. This explains, at least in part, the anticipated increases
in Canada’s exports of broiler meat for 2017 and 2018.

Canada – Poultry and Products Annual - 2017
10 | P a g e
Generally speaking, chicken exports fall into two broad categories. The majority represents the "re-
export" side of the IREP or DRP, since exports are a requirement of the program. The remaining
volumes reflect "genuine" exports, and are made up mostly of dark meat cuts (such as leg quarters).
CANADA: Broiler Meat Exports Quantity in metric tons, product weight January-May %change
2014 2015 2016 2016 2017 2017/16
World 150,119 136,746 133,237 58,231 60,268 3.5%
United States 60,300 69,253 67,835 30,380 25,885 -14.8%
Philippines 15,151 10,364 19,851 8,452 12,352 46.1%
Taiwan 24,234 13,992 13,765 6,979 7,358 5.4%
Hong Kong 7,157 4,207 8,461 3,051 4,478 46.8%
Cuba 4,449 10,589 2,715 797 1,739 118.2%
South Africa 943 310 2,628 1,279 3,167 147.6%
Jamaica 2,451 1,165 1,857 1,081 623 -42.4%
Other countries 35,434 26,866 16,125 6,212 4,666 -24.9%
Export Market Shares
United States 40% 51% 51% 52% 43%
Philippines 10% 8% 15% 15% 20%
Taiwan 16% 10% 10% 12% 12%
Hong Kong 5% 3% 6% 5% 7%
Cuba 3% 8% 2% 1% 3%
South Africa 1% 0% 2% 2% 5%
Jamaica 2% 1% 1% 2% 1%
Source: Global Trade Atlas
Policy:
Tariff Rate Quota
Canada controls imports of chicken under a TRQ. The minimum access level (into Canada) under the
World Trade Organization (WTO) commitment is 39,844 MT, but Canada applies the higher access
level under NAFTA, equal to 7.5 percent of the previous year's domestic chicken production as reported
by Statistics Canada. For 2018, the global permit allowance is forecast to increase to 90,000 MT based
upon the estimated 2017 production. For 2017, the global chicken TRQ is 86,100 MT as based on the
2016 production level. Actual chicken imports under the TRQ may be slightly higher or lower than the
allocated amounts, based on prevailing market conditions in each year.
Under the TRQ, imports are subject to low "within access commitment" rates of duty up to the
predetermined limit, while imports over this limit are subject to higher, prohibitive "over access
commitment" rates of duty. Imports from the United States benefit from a duty free treatment under the
chicken TRQ, while over-quota duties can reach 250 percent.

Canada – Poultry and Products Annual - 2017
11 | P a g e
Canada regularly issues supplementary import permits for: 1) periods when there are product shortages;
2) the chicken Import to Re-Export Program (IREP), under which import allocations are issued to
Canadian poultry processors whose finished manufactured products are intended for re-export, and 3) to
Canadian poultry companies, commonly referred to as the FTA (free trade agreement) sector, who
compete in the Canadian marketplace with similar, imported processed products that receive zero-tariff
treatment under the NAFTA. Information on the chicken TRQ, other supplementary imports and the
process of importing broiler meat into Canada is located on the web site of Global Affairs Canada
(GAC, formerly DFATD), at the following link.
Source: GAC/DFATD, CBSA, Statistics Canada, Post calculations / Post *estimate **forecast
Imports for Re-Export Program: Traditionally, the majority of supplementary imports have been
comprised of imports under the IREP program. The program requires that the resulting processed
chicken product be exported, since diversion of product imported under IREP to the Canadian
(domestic) market is prohibited. It is a policy that helps Canadian poultry processors remain viable by
giving them access to lower priced imported chicken, but offers little to Canadian consumers who pay
high retail prices for chicken under the supply managed regime. Canadian proponents of the IREP
program argue that it allows Canadian chicken processing plants to achieve economies of scale they
could not otherwise achieve if restricted to available supplies of domestically produced chicken. IREP
imports became popular at the end of the 1990s and have continued to grow significantly, to the point
where in 2008 they exceeded for the first time the import volumes under the global TRQ. IREP imports
may be sourced in any country, but in practice almost the entire volumes are imported into Canada from
the United States, and once processed they return back to the U.S. market.
Duties Relief Program: The year 2012 marked the emergence of usage in another import for re-export
program, namely the Duties Relief Program (DRP) operated by the Canada Border Services Agency
(CBSA). Details about the program can be found following this link. While in general the DRP is very
Canada – Poultry and Products Annual - 2017
12 | P a g e
similar to the IREP, there are some differences that make the DRP more appealing to importers. For
instance, the requirement to re-export the chicken meat within four years, rather than three months as
required by the IREP. In 2015, imports of chicken under DRP peaked, and have since been on a decline.
In 2016, CBSA conducted a series of compliance verification activities which uncovered a number of
non-compliant companies. Post expects that the use of the DRP will further decline into 2018, while, at
the same time, some companies will return to the older IREP program.
Government Consultations on IREP/DRP: Following an announcement made by the federal
government in November 2016, consultations were launched in the spring of 2017 with industry
stakeholders regarding potential changes to the two programs (IREP and DRP). The stated goal of these
possible program changes is to “address the concerns of import predictability and effective border
controls for supply-managed commodities, while ensuring that Canadian processors who use dairy and
poultry inputs can remain competitive in export markets”. Currently, the federal government is
reviewing the input received from stakeholders, but there is no timeframe for when the potential
changes would be released to the public.
Special Agricultural Safeguard (WTO)
In 2008, Canada gave notice of the volume and price triggers that will be used to operationalize the
WTO Special Agricultural Safeguard (SSG) for Canada’s supply-managed products (i.e. products under
a tariff rate quota). The special safeguard is a provision that allows additional duties to be triggered
when import prices fall below a certain price level or exceed a certain volume level. Currently
published volume triggers are available at the following link. Price triggers are also to be listed on the
same website (but not yet available). Unit prices which would theoretically trigger the SSG are currently
much lower than current import price trends and activation of the safeguard is not expected. In the event
that import prices do decline to levels below trigger prices, the SSG would not automatically be
activated, but the situation would be evaluated on a case-by-case basis requiring formal WTO
notification and an Order in Council (i.e. federal cabinet approval).