Embed Size (px)
Citation preview
National Libraryof Canada
Bibliothèque nallonaledu Candda
Acquisitions and Direction des acquisitions etBibliographie Services Branch des services bibliographiques
395 Wellington Street 395. rue WcllinQlonOttawa. Ontario Ottawa (Ontono)K1AON4 K1AON4
NOTICE AVIS
The quality of this microform isheavily dependent upon thequality of the original thesissubmitted for microfilming.Every effort has been made toensure the highest quality ofreproduction possible.
If pages are missing, contact theuniversity which granted thedegree.
Some pages may have indistinctprint especially if the originalpages were typed with a poortypewriter ribbon or if theuniversity sent us an inferiorphotocopy.
Reproduction in full or in part ofthis microform is governed bythe Canadian Copyright Act,R.S.C. 1970, c. C-30, andsubsequent amendments.
Canada
La qualité de cette microformedépend grandement de la qualitéde la thèse soumise aumicrofilmage. Nous avons toutfait pour assurer une qualitésupérieure de reproduction.
S'il manque des pages, veuillezcommuniquer avec l'universitéqui a conféré le grade.
La qualité d'impression decertaines pages peut laisser àdésirer, surtout si les pagesoriginales ont étédactylographiées à l'aide d'unruban usé ou si l'université nousa fait parvenir une photocopie dequalité inférieure.
La reproduction, même partielle,de cette microforme est soumiseà la Loi canadienne sur le droitd'auteur, SRC 1970, c. C-30, etses amendements subséquents.
•
•
Precipitation Kinetics and Partitioningof Rare Earth Elements (REE) bet\yeen
Calcite and Seawater
by
Shaojun Zhong
A thesis submitted to the Faculty of Graduate Studies and Researchin partial fuifilment of the requirements for
the Degree of Doctor of Philosophy.
Earth and Planetary SciencesMcGiII UniversityMontreal, Canada
March 1993
© Shaojun Zhong 1993
Nationallibraryof Canada
Bibliothèque nationaledu Canada
Acquisitions and Direction des acquisitions etBibliographie Services Branch des services bibliographiques
395 Wellington Street 395. rue WellingtonOttawa. Ontario Ottawa (Ontario)K1A ON4 K1A ON4
The author has granted anirrevocable non-exclusive licenceallowing the National Library ofCanada to reproduce, loan,distribute or sell copies ofhisjher thesis by any means andin any form or format, makingthis thesis available to interestedpersons.
The author retains ownership ofthe copyright in hisjher thesis.Neither the thesis nor substantialextracts from it may be printed orotherwise reproduced withouthisjher permission.
L'auteur a accordé une licenceirrévocable et non exclusivepermettant à la Bibliothèquenationale du Canada dereproduire, prêter, distribuer ouvendre des copies de sa thèsede quelque manière et sousquelque forme que ce soit pourmettre des exemplaires de cettethèse à la disposition despersonnes intéressées.
L'auteur conserve la propriété dudroit d'auteur qui protège sathèse. Ni la thèse ni des extraitssubstantiels de celle-ci nedoivent être imprimés ouautrement reproduits sans sonautorisation.
ISBN 0-315-91658-3
Canada
SHORT TITLE
PRECIPITATION AND REE PARTITIONINGBETWEEN CALCITE AND SEAWATER
Shaoj un ZhongINRS-Oceanologie310 Ursulines
-, Rimouski. PQCanada G5L 3A 1
Tel: 814-723-1834
May 4, 1993
MS. Anna Cecile JungerCopyright DepartmentPergamon PressHeadington Hill HallOxford, OX3 OBWUnited Kingdom
Dear MS. Junger:
1 would like to requst an Official Copyright Waiver(s) from your of'ice for including anarticle 1 co-authored fOl)jGeochimica et Cosmochimica Acta (MS 8222; S. Zhong and A.Mucci, Calcite precipitation in seawater using a constant addition technique: a new overallreaction kinetic expression. GCA, Vo1.57: 1409-1417) in my thesis (Thesis tille: PrecipitationKinetics and Partitioning of Rare Earth Elements (REE) between Calcite and Seawater),submitted to McGiIl U'liversity, Montreal, Canada in partial fui filment of the requirementsof the degree of Ph.D.
Thank you very much for your corporation.
Sincerely,,
S'IC?:;' '\....., Shaojun Zltong.
/1
.. '). r ....,1~v /~
r--;.,.·'" -'
PERMISSION REQUEST
We hereby grant you permission to reprint therl)ateriaJ ~pP.'::ifieC i:: :r;;;:r letter (~ee recto) forthe purpose you have indicated therein, at nocharge, provided tha!:
1. The material to be used has appeared in ourpublication without credit or acknowledgementto another source.
2. Suitable acknowledgement to the source isgiven as follows: -
For Book.<: "Reprinted from (Authorrritle). Copyright(Year), Pages No.•with kind permission from PergamonPress Ltd. Headington Hill Hall, Oxford OX3 OBW,UK"
For Journals: "Reprinted from Journaltitle, Volumenumber, Author(s), Title of article, Pages No. ,Copyright(Year), with kind permission from Pergamon Press Ltd,Headington Hill Hall, Oxford OX3 OBW, UK."
3. Reproduction of this material is confined tothe purpose for which permission is herebygiven.
FeL' Fullire Penuissioos please contact:Anne-Cecile Junger(MS~~Subsidiary Rights Manager •Pergamon Press Ltd .Headington Hill HallOxford OX3 OBW, U.K. FAX:(0865743 50
Should your thesis be published commercially.please reapply for permission.
•
•
SHORT TITLE
PRECIPITATION AND REE PARTITIONING
BETWEEN CALCITE AND SEAWATER
•
•
ABSTRACT
A novel and simple "constant-addition" technique was used to study calcite
precipitation kinetics and the partitioning of REE between calcite overgrowths and
their parent seawater solutions under steady state conditions.
As a consequence of solute interactions in solution and at the growing mineraI
surface, the calcite precipitation mechanism in seawater is complex. It is dominated
by the following reversible overall reaction:
A kinetic expression is proposed which describes the precipitation rate according
to this reaction. A partial reaction order of 3 with respect to CO/ is obtained.
.REE have a strong affinity for calcite and substitute for Ca2+. REE partition
'~oe;~~i~n~i~~âI8ît~overgrowths were calculated from their concentrations in the
overgrov.ihs and their par~nt solutions using a non-thermodynamic homogeneous
mode!. The concentrations were determined by chelation and gradient ion
chromatography (CGIC) us.:ng a revised procedure. REE partition coefficients
decrease gradually with incr.~asing REE atomic number. They are sensitive to
changes in [REE]:[Ca2+] and th~ presence of O2 in solution, but unaffected by the
precipitation rate, [CO/] or Pc02 .0f the solution. The partitioning behaviour of
REE is negatively correlated to the s01ubility of their respective carbonates and
influenced by speciation, adsorption, and subsequent surface reactions (e.g.,
dehydration).
l
•
•
RESUMÉ
Une nouvelle technique d'addition constant~ fut utilisée pour étudier la cinétique de
précipitation de la calcite et le partage des terres-rares (TR) entre les précipités et leurs
solutions mères d'eau de mer dans des conditions stationnaires.
Le mécanisme de précipitation de la calcite dans l'eau de mer est complexe et résulte
d'interactions des électrolytes en solution et à la surface du minéral en croissance. La
précipitation est dominée par la réaction réversible suivante:
Une expression cinétique est proposée qui décrit la vitesse de précipitation selon celte
réaction. l':l ordre de réaction partiel de 3 par rapport à l'ion CO,'- a été obtenu.
Les TR ont une grande affinité pour la calcite et se substituent pour l'ion Ca" dans
le réseau cristallin. Les coefficients de partage des TR dans la calcite ont été calculés à
partir des concentrations dans les précipités et les solutions mères et d'un modèle non
thermodynamique appliqué à un solide homogène. Les concentrations ont été déterminées
par chromatographie ionique chélatante à gradient en utilisant une procédure revisée. Les
coefficients de partage des TR diminuent progressivement avec une augmentation du
chiffre atomique. Leurs valeurs absolues sont influencées par des changements du rapport
[TR]:[Ca'+] et la présence d'a, en solution mais sont indépendantes de la vitesse de
précipitation, de la [CO/-J, et de la PCO, en solution. Les coefficients de partage des TR
varient selon la solubilité de leurs carbonates respectifs et sont déterminés par la
spéciation en solution ainsi que l'adsorption et d'autres réactions à la surface du solide (par
ex: déshydratation).
11

•
•
MANUSCRIPTS AND AUTHORSHIP
This thesis is prepared following the "Guidelines Concerning Thesis
Preparation", Faculty of Graduate Studies and Research, McGill University:
"Candidates have the option, subject to the approval oftheir Departmellt,
of including, as part of their thesis, copies of the text of a paper(s)
submitted for publication, or the clearly-duplicated text of a published
paper(s) , provided that these copies are bound as an integral part of the
thesis.
-If this option is chosen, c01l1lectillg texts, providillg logical bridges
betwee/l the differellt papers, are malldatory.
- The thesis must still conform to ail other requirements ofthe "Guidelines
Concerning Thesis Preparation" and should be in a literary form that is
more than a mere collection ofmanuscripts published or to be published.
The thesis must illclude, as separate cllapters or sectiolls: (1) a Table of
Contents, (2) a general abstract in English and French, (3) an introduction
which clearly states the rationale and objectives of the study, (4) a
comprehensive general review of the background literature to the subject
of the thesis, when this review is appropriate, and (5) a final overall
conclusion and/or summary.
- Additional material (procedural and design data, as weil as descriptions
111
•
•
ofequipment used) must be provided where appropriate and ill su;tliciellt
detail (eg. in appendices) to allow a clear alld precise judgemem to be
made of the importance and originality of the research reported ill the
î'l:?sis.
- ln the case ofmanuscripts co-authored by the candidate and others. tlze
calldidate is required to make ail explicit statemellt ill tlze tlzesis ofw/III
cOlltributed to sucll work and to wllat extellt; supervisors must aUest to
the accuracy ofsuch claims at the Ph.D. Oral Defence. Since the task of
the examiners is made more difficult in these cases, il is in the candidate's
interest to make perfectly clear the responsibilities of the diflerent authors
of co-authored papers. "
The following papers, ail of which have been, or will be, submitted for
publication in scientific journals, are included in this dissertation:
1, Calcite precipitation in seawater using a constant addition technique:
a new overall reaction kinetic expression.
S. Zhong and A. Mucci,
Geochim. Cosmochim. Acta (Volume 57, /409-1417)
2, Quantitative determination of REE III seawater by chelation and
gradient ion chromatography.
S. Zhong and A. Mucci,
Submitted to Analy. Chim. Acta
IV

•
•
3, Partitioning of rare earth elements (REE) between calcite and seawater
solutions at 25°C and 1 atm.
S. Zhong and A. Mucci,
To be submitted to Geochim. Cosmochim. Acta
Ali research work presented in these papers was performed by the author.
Professor A. Mucci, the research director and co-author, contributed
significantly through instruction, consultation, and editing (sometimes very
extensive).
v
•
•
ACKNOWLEDGEMENTS
Above ail, 1 would like to express my sincere gratitude and appreciation
to my research director, Professor Alfonso Mucci, for suggesting the research
topic and having confidence in me to take on such a challenging and
interesting research project. 1 don't think 1 could have made it through
without his excellent supervision and guidance, constant encouragement and
motivation. 1 am especially grateful to him for showing great concem and
empathy during "difficult" times.
1 thank Drs. T. Barrett, E. Mountjoy, P. Pan, and S. Wood at McGill for
valuable discussions, enthusiastic support and encouragement.
Technical assistance contributed by T. Ahmedali, A. Bono, C. Colassin,
C. Guignard, L. Hendelman, G. Keating, G. Kopp, S. Lalli, X. Wu, and A.
Yannakis at McGill during various stages of this study are greatly
appreciated. 1 am also grateful to S. Boyajian, P. Chang, J. Grant, and K. Lin
from DionexQ!) Canada and G. Keating for showing me tlle art of ion
chromatography.
Special thanks to G. Hartley for proofreading rough drafts of the text and
numerous valuable discussions; to Dr. D. Baker for many constructive
comments and suggestions; to Dr. P. Zuddas for having faith in the
"constant-addition" system and various helpful discussions; to Drs. J. Zullig
(Exxon Long-Range Research Centre, Houston, Texas) and M. Harrold
VI
•
•
(Dionexlll Corp., Sunnyvale, Califomia) for insightful criticism and comments;
to Dr. E. Burton and !Wo anonymous reviewers affiliated wit.h Geochimica
et Cosmochimca Acta and !Wo anonymous reviewers associated with
Analytica Chimica Acta for their constructive criticism.
1 am deeply indebted to my lovely wife, Xiaoxing, and my parents for
their immense love and support..
Financial support for this study was provided by the National Sciences
and Engineering Research Council of Canada (NSERC) to Dr. Mucci. 1 am
also grateful to the Department ofEarth and Planetary Sciences at McGill for
awarding me the Davison, LeRoy, Lynch, Reinhardt (x5), William
scholarships, and to GEOTOPIUQAM for providing graduate scholarships
through FCAR-Centre and Team grants.
vu
•
•
TABLE OF CONTENTS
Abstract
Resumé Il
Manuscript and Authorship 111
Acknowledgements VI
Table of Content V1I1
List of Figures XII
List of Tables XVI
Chapter 0 Introduction 1
0.1 Rationale and Objectives 1
0.2 Experimental System 3
0.3 Calcite Precipitation Kinetics 4
0.4 Analysis of Rare Earth Elements 4
0.5 Rare Earth Elements Partitioning 5
0.6 Conclusion 6
0.7 Reference 7
Chapter 1 Calcite Precipitation in Seawater Using a Constant
Addition Technique: a New Overall Reaction Kinetic
Expression 9
1.1 Introduction Il
1.2 Experimental System 14
1.3 Steady State Condition 21
1.4 Calcite Precipitation Kinetics 27
1.5 Conclusions 42
1.6 Acknowledgements 44
Vlll
•
•
3.3.3.2 The Influence of Precipitation Rate or [CO):-]
3.3.3.3 The Influence of Solution Pco:
3.3.3.4 The Influence of [REE] or [REE]:[Ca:·] Ratio
3.3.3.5 The Influence of Redox Potential
3.3.3.6 The Role of Adsorption
3.3.3.7 Partitioning and the Solubility of
Individual REE Carbonates
3.3.3.8 Comparison of Laboratory Studies
3.3.3.9 Comparison of Laboratory and Field Results
3.4 Conclusions
3.5 Acknowledgements
3.6 References
Chapter 4 Concluding Remarks
4.1 Contributions to Original Knowledge
4.2 Suggestions for Future Work
4.2.1 Calcite Precipitation Kinetics
4.2.2 Analysis of REE Using CGIC
4.2.3 REE Partitioning
Appendix 1. Raw Experimental Data on Calcite Precipitation
from REE-free Seawater Solutions
Appendix II. Raw Data on Calcite Precipitation for
the "5-g" Type Experiments.
Appendix III. Composition of Calcite Overgrowths Precipitated
from the "5-g" Type Experiments.
x
III
116
116
126
130
I~?
-'-
134
136
138
140
141
148
148
149
149
150
151
152
154
156

•
•
Appendix IV. Raw Data on Calcite Precipitation for
the "0.6-g" Type Experiments.
Appendix V. Steady State REE Concentrations (nglg) in Parent
Solutions for the "0.6-g" Type Experiments
Appendix VI. REE" Concentrations (mglg) in Calcite
Overgrowths Precipitated from the "0.6-g" Type Experiments.
Appendix VII. REE Partition Coefficients (i.e., Log(D))
for the "0.6-g" Type Experiments.
Appendix VIII. REE Adsorption by Calcite: Variations
of [REE] (nglg) in Calcite-equilibrated Seawater Solutions
with Reaction Time (hr). (Solid to Solution Ratio = 1:3000)
Xl
158
161
164
167
170
• LIST OF FIGURES
Page Figure Title
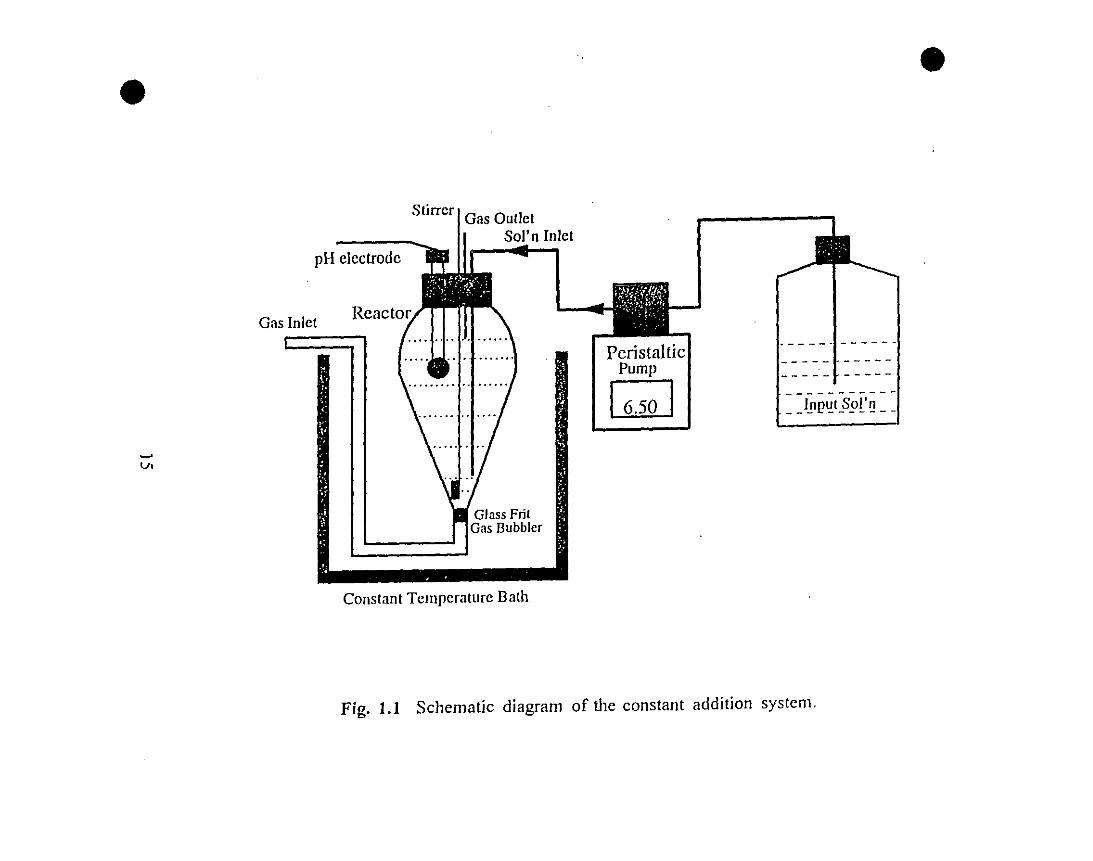
15 1.1 Schematic diagram of the constant addition system.
25 1.2 (a) Change in total calcium ion concentration (t.), carbonate
alkalinity (0), and (b) pH in the reacting seawater solution
with time during calcite precipitation by the constant
addition system.
28 1.3 Log(Rate) vs. Log(Q-1) for calcite obtained by the constant
addition system in phosphate-free seawater at 25°C and
Pco2=0.0031 atm.
30 lA CompaÎison of the available empirical calcite precipitation
rate equations obtained in phosphate-free seawater solutions
at 25°C and Pco2=0.0031-0.01 atm.
37 1.5 Log(Rate) vs. Log«(C03D for calcite in phosphate-free
seawater at 25°C and Pco2=0.0031 atm.
39 1.6 Log(Rate+0.29) vs. Log«(C03D for calcite in phosphate-free
seawater at 25°C and Pco2=0.0031 atm.
56 2.1 Schematic diagram of the chelation and gradient ion
chromatographie system.
• Xll
• 59 2.2 Schematic diagram of the analytical procedure (Modified
after Harrold ct al. [16]).
64 2.3 Typical REE chromatograms of (a) deionized water and (b)
artificial seawater samples (concentrations of individual
REE: 5 ppb) after REE instrumental extraction (AU:
Absorbance Unit).
68 2.4 Typical standard calibration curves for REE.
70 2.5 Typical REE chromatogram of artificial seawater samples
(concentrations of individual REE: 5 ppb) containing 40
ppm Fe3+.
87 3.1 Schematic diagram of the "constant addition" experimental
system.
88 3.2 Variability of individual REE concentrations in the reacting
solution throughout an experirnental mn by the "constant
addition" system. Concentrations of individual REE in the
input solutions were 100 ng/g.
94 3.3 Solubility products of REEiC03)3 in dilute aqueous
solutions. Data from Smith and Martel! (1976).
100 3.4 The sorption behaviour of sorne REE by calcite in calcite-
equilibrated seawater solutions.
• X111

• 103 3.5 The inhibitory effect of REE on the calcite precipitation rate
in seawater solutions.
106 3.6 Constancy of the Mgl +partition coefficient in calcite
precipitated from seawater as a function of (a) calcite
precipitation rate and (b) the total REE content of calcite
overgrowths on "5-g" type experiments.
109 3.7 Valencies and ionic radii (coordination number: 6) for
cations of interest. Data from Shannon (1976).
110 3.8 Na+ partition coefficients as a function of the total REE
content in calcite overgrowths precipitated from seawater
solutions.
113 3.9 REE partition coefficients as a function of calcite
precipitation rate.
115 3.10 REE speciation as a function of the total C03l- ion
concentration in seawater solutions.
118 3.11 REE partition coefficients as a function of the solution Pcol .
119 3.12 REE partition coefficients as a function of their steady state
concentrations in solution.
128 3.13 The influence of Eh or the presence of H2S and O2 iil
seawater on REE partition coefficients in calcite
overgrowths.
• XIV
•
•
131 3.14 REE partition coefficients and REE adsorption coefficients
between calcite and seawater solutions as a function of
atomic number.
133 3.15 Relationship between REE partition coefficients and the
thermodynamic solubility products of REE carbonates. The
solubility data are from Smith and Martell (1976)
135 3.16 Comparison of field and experimentally derived REE
partition coefficients between calcite and its parent
solutions. Field data are from Parekh et al (1977), Scherer
and Seitz (1980), and Palmer (1985), experimental
measurements are those of Terakado and Masuda (1988)
and this study.
xv
• LIST OF TABLES
Page Table Title
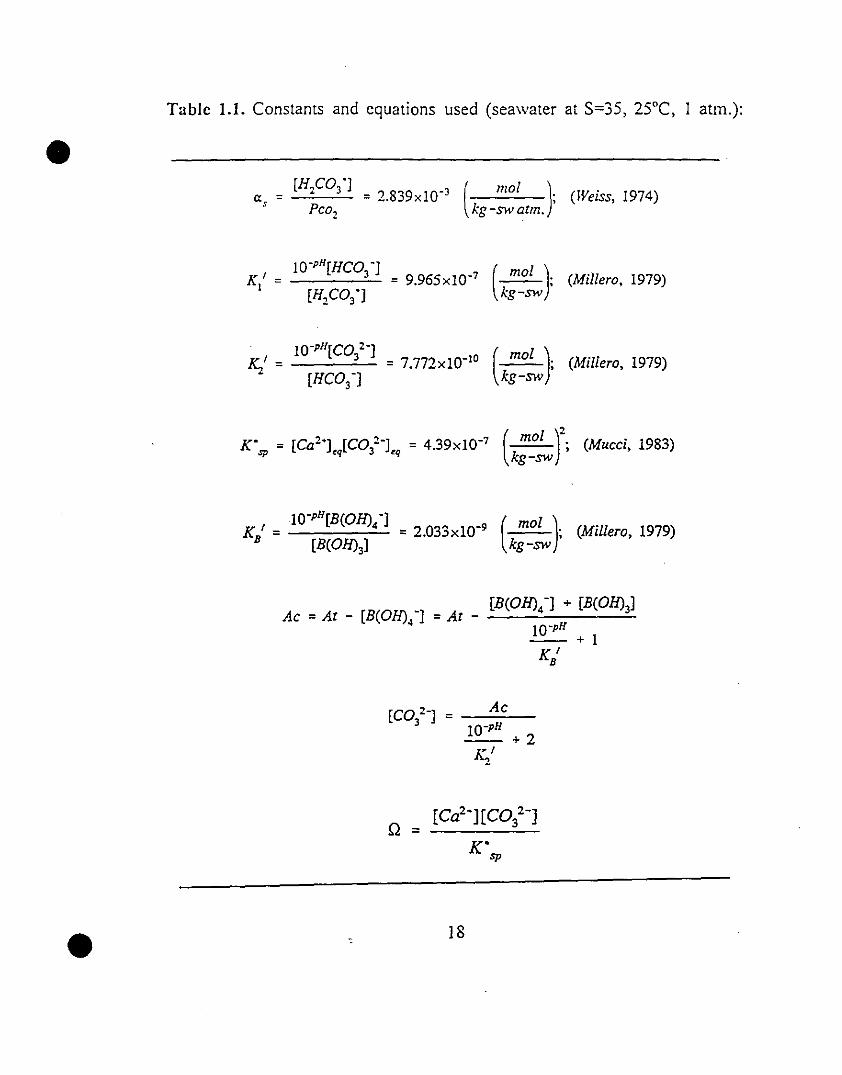
18 1.1 Constants and equations used (seawater at S=35, 25°C,
atm.).
31 1.2 Summary of empirical rate equations for calcite-seawater
precipitation (r is the linear correlation coefficient).
57 2.1 Compositions of the eluent solutions and post-column
reagent.
65 2.2 Example of "Timed Events File" for (a) GPMI and (b)
GPM2.
71 2.3 REE concentration of samples analyzed by chelation and
gradient ion chromatography.
102 3.1 REE adsorption coefficients (# of measurements: 3; Ali data
are within ±0.1 of the given values).
112 3.2 Average REE partition coefficients versus calcite
precipitation rate (Ali data are within ±D.2 of the given
values).
117 3.3 Av~rage REE partition coefficients as a function of solution
Pco2 (Ali data are within ±D.2 of ,he given :values).
• XVI
•
•
127 3.4 REE partition coefficiems versus solution Eh (Ail data are
within ±O.2 of the given values.
xvii
•
•
CHAPTER 0
INTRODUCTION
0.1 RATIONALE AND OBJECTIVES:
in recent years, there has been increased interest, and expectations, for the
potential applications ofREE partitioning in carbopate mineraIs to diagenetic,
paleoceanographic, and environmental studies (e.g., Banner et al., 1988;
Dorobek and Filby, 1988). However, very limited research efforts have been
directed at understanding the systematics of REE incorporation in these
mineraIs. In fact, REE partition coefficients between carbonate mineraIs and
their parent solutions have not been accurately Jetennined. Many essential
and important questions such as what factors control the incorporation of
REE in calcite remain unanswered.
Mucci and Morse (1990) have reviewed much of the literature on
experimental studies of coprecipitation reactions of "foreign" elements in
calcite. They pointed out that these reactions are often affected by kinetic
factors such as specifie solution components (i.e., inhibitors), calcite
precipitation rate, and reaction pathways. In otller words, "foreign" element
partition or distribution coefficients in calcite reported in tlle literature are
phenomenological measurements of kinetic partition coefficients rather than
thennodynamic distribution coefficients (Morse and Bender, 1990).
1
•
•
The study of kinetics is inherently more difficult and complex tllan that
of thermodynamics, because kinetic processes are time dependent and thus
path dependent (Lasaga, 1981). However, if the composition of the reacting
sol"·;on, including tlle concentrations of ail the participating species, is kept
constant throughout an experiment despite the ongoing reaction or reactions
(i.e., steady state conditions), we expect reactions to proceed at constant rates
and follow identical reaction paths. Under this condition, the time and path
dependent nature of a kinetic process will, therefore, be eliminated or
controlled.
Terakado and Masuda (1988) conducted the tirst and only experimental
study on the partitioning of REE in carbonate mineraIs at room temperature.
They noted that REE partition coefficients in calcite varied with tlleir
solution concentration, indicating tllat the partitioning of REE in calcite was
a kinetic process or was affected by kinetic factors. The intcrpretation oftheir
experimental data, however, is ambiguous and their applicability to natural
environments is profoundly limited due to tlleir failure to maintain steady
state conditions during the precipitations. Factors which may have affected
the partitioning process were not adequate!y controlled. Consequently, we
decided to launch an experimental study to make quantitative measurements
of REE partition coefficients between calcite precipitates and tlleir parent
scawater solutions as weil as investigate factors which may influence the
partitioning process at 25°C. We conducted our experiments in seawater
solutions for the simple reason that the fonnation and diagenesis of most
carbonate:minerals and rocks occur in seawater or seawater related solutions.
2
•
•
0.2 EXPERIMENTAL SYSTEM:
Various experimental techniques have been appl ied to achieve and
maintain steady state conditions during calcite precipitation and "foreign"
element coprecipitation studies (see chapter ] for an extensive review). In the
case of REE, solution concentrations must be maintained at extremely low
levels (i.e., at the nglg leveI) to confonn with natural conditions and to avoid
the precipitation of discrete REE carbonate mineraIs. Furthennore, based on
the results of field studies, REE partition coefficients in calcite are expected
to be extremely high (_102 to 103; Parekh et al., 1977; Scherer and Seitz,
1980; and Palmer, 1985). Under these conditions and using existing
experimental teclmiques, it would have been extremely difticult, if not
impossible, to maintain REE concentrations constant during their partitioning
from solutions. Consequently, a new experimental design was required,
A simple "constant addition" experimental technique was designed based
on the working principle of the fluidized bed reactor. Before il could be
tested for conducting REE partitioning experiments, its ability to maintain
steady state conditions during calcite precipitation had to be verified. This led
to t11e first paper or the first chapter of this dissertation.
3
•
•
0.3 CALCITE PRECIPITATION KINETICS:
The kinetics of calcite precipitation m seawater solutions has been
extensively reviewed by Morse (1983) and more recently by Morse and
Mackenzie (1990). Until now, calcite precipitation rates in complex solutions
such as seawater have most frequently and successfully been described by an
empirical rate mode!. Although of use for predictive purposes, tlle empirical
model gives very little insight into the precipitation mechanisms.
Consequently, in addition to confirm tlle suitability oftlle "constant addition"
technique to calcite precipitation study, we also strived to derive a detailed
mechanistic model that would adequately describe bOtll the calcite
precipitation rate and mechanism in complex electrolyte solutions such as
seawater under near-equilibrium conditions.
0.4 ANALYSIS OF RARE EARTH ELEMENTS:
The second paper or chapter 2 of this dissertation was bom as a result of
the recent acquisition of a chelation and gradient ion chromatograph (COlC)
in the Department of Earth and Planetary Sciences at McGiIl University and
our limited access to altemative ana1ytical instrumentation. In addition,
modem analytical techniques such as inductively coupled plasma mass
spectrometry (lCP-MS) and instrumental neutron activation analysis (INAA)
are only applicable to the detennination of REE in sampIes with simple
matrices. Samples with complex matrices such as most geological materials
4
•
•
and our seawater solutions are subject to tedious and undcsirablc malrix
elimination procedures before they can be analyzed. Coincidentally, one
advantage the CGlC does offer is its capability of handling sampi es of
complex matrices. Using preliminai)' results provided by Dionex~', a revised
procedure was developed for the quantitative separation and delennination
ofREE in salI:ples with diverse matrices using CGIC. This method was used
to determine the REE concentrations in calcite overgrowths and seawatcr
solutions for the subsequent REE partitioning study (chapter 3).
0.5 RARE EARTH ELEMENTS PARTITlONING:
FinaIly, the main goal of this thesis, a study of REE partitioning in calcite
from seawater could only be undertaken after the experimental design and
analytical obstacles had been resolved. In chapter 3, the partitioning of REE
between calcite precipitates and their parent seawater solutions was studied
under steady state conditions using the "constant addition" technique. REE
partition coefficients were obtained and the influence of calcite precipitation
kinetics and a number of solution variables on the partitioning process were
examined. The REE partition coefficients were compared with results of
previous laboratory and field studies.
5 -,
•
•
0.6 CONCLUSION:
The fourth chapter is a general conclusion to the dissertation. It contains
11 detailed description of the thesis contributions to original knowledge and
suggestions for future studies. Our raw experimentaJ data are presented in the
appendices.
6
•
•
0.7 Reference:
Banner J.L, Hanson G.N. and Meyers W.J. (1988) Rare earth c1cmcnt
and Nd isotopic variations in regionally extensive dolomites fi'0111 thc
Burlington-Keokuk Fonnation (Mississippian): Implications for REE
mobility during carbonate diagenesis. J. Sediment. Petrol., 58, 415-432.
Dorobek S.L. and Filby R.H. (1988) Ongin of dolomites in a downslope
biostrome, Jefferson Fonnation (Devonian), Central Idaho: Evidence [Tom
REE patterns, stable isotopes, and petrography. Bull. Canad. Petrol. Geol.,
36,202-215.
Lasaga A.C. (1981) Rate laws of chemical reactions. In: Kinetics of
Geochemical Processes (ed. A.C. Lasaga and R.J. Kirkpatrick), pp.I-68.
Mineral. Soc. Amer., Reviews in Mineralogy, VoL8, Washington D.C.
Morse J.W. (1983) The kinetics of calcium carbonate dissolution and
precipitation. In: Carbonates: Mineralogy and Chemistry (ed. R.J. Reeder),
pp.227-264, Mineral. Soc. Amer., Reviews in Mineralogy, VoU 1,
Washington D.C.
Morse J.W. and Bender M.L. (1990) Partition coefficients in calcite:
Examination offactors influencing the validity of experimental results and
their application to natural systems. Chem. Geol., 82, 265-277.
Morse J.W. and Mackenzie F.T. (1990) Geochemistry of Sedimentary
Carbonates. Elsevier Sci. Publ., chapter 2, Amsterdam.
Mucci A. and Morse J.W. (1990) Chemistry of low-temperature abiotic
calcites: Experimental studies on coprecipitation, stability, and
fractionation. Reviews in Aquatic Sciences 3, 217-254.
7
•
•
Palmer M.R. (1985) Rare earth elements II1 foraminifera tests. Earth
Planet. Sei. Lett. 73, 285-298.
Parekh P.P., Müller P., Dukski P. and Bausch W.M. (1977) Distribution
of trace elements between carbonate and non-carbonate phases of
limestone. Earth Planet. Sei. Let!. 34, 39-50.
Scherer M. and Seitz H. (1980) Rare-earth e1ement distribution in
Holocene and Pleistocene corals and their redistribution during diagenesis.
Chem. Geol. 28, 279-289.
8
•
•
CIIAPTER 1
Calcite Precipitation in Scawatcr Using a Constant Addition
Techniquc: a New Ovcrall Rcaction Kinctic Exprcssion
S. Zhong and A. Mucci
Earth and PlanetaI)' Sei., McGill Univ., Montreal, PQ, Canada
ABSTRACT
A simple "constant addition" system was developed to stlldy calcite
precipitation reaction kinetics in seawater under steady state conditions. lt can
be applied to carbonate-trace element coprecipitation stlldies and may also
provide an interesting altemative for kinetic stlldies of calcite dissolution
reactions and other mineral-solution interactions.
Calcite precipitation 111 seawater can be represented by a reversible
overall reaction:
The measured precipitation rate, Ri is adequately described by a c1assic
kinetic model of the fonn:
where Rf, Rb and kf , kb are the forward and backward reaction rates and rate
9
•
•
constants for the overall reaction, respectively; (i], Yi, and ni are the total
concentration, activity coefficient, and reaction rate order, respectively, for
each species involved in the reaction.
If (Ca2+] is held constant throughout the precipitation experiments, the
above equation reduces to:
R=K [CO 2-]":-kf 3 b
The equation was used to fit calcite precipitation rate data measured over
a wide range of saturation states and extending to near saturation conditions.
The least-squares fit to the above expression yields values ofK f=103.s Jlmol
kg-sw3m-2hr-1mmol-3, n2=3, and kb=0.29 Jlmol m-2hr-1 with a correlation
coefficient of 0.99 at 25°C, when Pc02=0.0031 atm. and (Ca2+]"'10.5
mmollkg-sw.
The partial reaction order for the carbonate ion suggests that calcite
precipitation in seawater proceeds through a complex mechanism as
suggested by previous calcite-seawater interaction studies. The calcite
dissolution rate constant derived from this study is significantly lower than
values obtained in dill1te solutions. This observation is in agreement Witll
results of prev:ous studies which indicate tllat calcite dissolution is much
faster in diIute solutions tllan in seawater under identical saturation
conditions.
10
•
•
1.1 INTRODUCTION
Natural fluids are not always in equilibrium with solid carbonate phases
with which thty are in temporary or pennanent contact. The deviation fTom
equilibrium is usually small and the reaction kinetics under this condition are
often very sensitive to environmental factors and solution composition.
Therefore, it is desirable to obtain accurate reaction rate data of individual
carbonate minerais in various environmen',ally-relevant solutions and
conditions. Ideally, laboratory kinetic experiments should be conducted when
the system under study is at steady state so that reactions suclr as
precipitation, dissolution, and trace element coprecipitation occur at a
constant rate, in an invariant enviranment, and following the same reactional
pathway. Under these conditions, any measurable thennodynamic and kinetic
property can be reasonably obtained in the time frame required by the
measurements without having to take into consideration changes of the
reaction parameters with time. Factors which may directly or indirectly
influence the reactions can be studied by conducting a set of experiments
while varying a particular parameter and keeping others constant. A detailed
kinetic description of the reaction mechanism can be derived from a series
of investigations of individual parameters.
Experimental techniques have always played an important raie in the
evolution of our understanding of calcite-solution reaction kinetics. Various
experimental techniques have been applied to achieve and maintain steady
state conditions. Examples of such techniques include: (1) the "free-drift"
11
•
•
method utilizing a single calcite crystal in a large volume of solution Ce.g.,
Nancollas et al., 1981; Busenberg and Plummer, 1986); (2) the "pH-stat"
technique (e.g., Morse, 1974; Inskeep and Bloom, 1985); (3) the "chemo-stat"
system (e.g., Mucci and Morse, 1983; Zhong and Mucci, 1989) or "constant
composition" system (e.g., Kazmlerczak et al., 1982); and more recently, (4)
the "fluidized bed" reactor (Chou et al., 1989). Of these experimental
techniques, only the "chemo-stat" or "constant composition" system and t11e
"fluidized bed" reactor provided actual steady state conditions for the calcite
solution reaction. However, to apply the "chemo-stat" system, preliminary
knowledge of the rates of the reactions under study is essential for the
preparation of "titrant" solutions. It often requires trial-and-error
experimentation before a successful ron can be conducted. More importantly,
a non-steady state period exists at the beginning ofany experimental ron. The
duration of this period is a function of t11e reaction rate and the diftèrence
between initial and steady state conditions. Difficulties were also encountered
when the "chemo-stat" system was used to conduct calcite precipitation or
dissolution experiments near calcite saturation, a situation more representative
of natural conditions. Under these conditions, the reaction rate is extremely
slow and observed rates are highly sensitive to t11e presence of reaction
inhibitors (Mucci, 1986). The "chemo-stat" system is not weil suited for
conducting trace element partitioning experiments where maintaining a
constant trace element solution concentration is essential (Morse and Bender,
1990). The "fluidized bed" reactor has been used successfully in carbonate
(Chou et al., 1989) and albite (Chou and Wollast, 198.4) dissolution studies,
but its applicability to the precipitation of carbonate mineraIs still remains to
12
•
•
be examined.
This paper introduces a novel yet simple expcrimental systcm which
proveà to be excellent for kinetic studies of carbonate precipitation and
coprecipitation reactions. Il may also provide a suitable altemative for thc
investigation of calcite dissolution reactions and other mineral-solution
interactions. In addition, calcite precipitation rate data obtained in this study
were used to derive a kinetic expression which adequately describes the
reaction in seawater. Results of the application of this system to the study of
trace element partitioning, more specifically rare earth elements, between
calcite and seawater under various conditions will be presented elsewhere
(Le., Chapter 3).
13
•
•
1.2 EXPERIMENTAL SYSTEM
The experimental system is schematically illustrated in Fig. 1.1. It was
inspired by the working principle of the "fluidized bed" reactor described by
Chou and coworkers (Chou and Wollast, 1984; Chou et al., 1989). In the
reactor, a steady state can be reached if a constant input of the reactants is
maintained and the characteristics of the solid-solution interface remain
unchanged (see Chou and Wollast, 1984 for details). However, in our early
attempts to apply the "fluidized bed" system to calcite precipitation kinetic
studies, variations of the carbon dioxide partial pressure (Pc02) in the solution
\Vere significant enough that steady state conditions would not be maintained.
Pc02 variations affect the pH of the solution and the relative concentrations
of carbonic acid species which, in tum, influences the saturation state and
calcite precipitation kinetics.
Two fi.ll1dameI;(al changes were made to t:1e "fluidized bed" system: agas
phase was added and the reacting solution was no longer circulated and
pumped ou,. of the reactor. The introduction of a gas phase to the system
served two purposes. Il kept the solid and liquid phases weil mixed and more
importantly, it maintained the Pco! of the solution at a constant and fixed
value. Furthennore, pumping solution out of the reactor at a constant speed
while keepll1g ail the fine calcite seed material in the reaetor was technically
difficult to achieve. This procedure is theoretically unnecessaI)' ifmaintaining
a steady state is the primaI)' purpose (see next section). Using the new
system, a steady state is reached and maintained if the reactant solution is
14
•
~
<J,
pH electrode
Gas Inlet
Stirrer 1 Gas OUlletSol'n Inlet
PeristalticPump
G;J
.---_."'-----_____ a- _
-----------------------_)PP'!t§.s>l'!l __
•
Constant Temperature Bath
Fig. 1.1 Schematic diagram of the constant addition system.
•
•
added to the reactor at a constant rate and the total reactive surface area of
the solid does not change significantly with precipitation. For this reason, we
dubbed the experimental design the "constant addition" system.
Baker"" "lnstra-analyzed flux reagent" grade calcite, treated by the
procedure described by Mucci (1986), was used as seed material for the
calcite precipitation experiments. The material has a weil restricted size
range, 3 to 7 Ilm, as observed by scanning electron microscopy (SEM) and
a specifie reactive surface area of 0.52 m~/g as detennined by the Kr-BET
method (deKanel and Morse, 1979). Aged artificial seawater with a salinity
of 35 was used for ail the experiments after being filtered through a
Millipore® 0.45 Ilm filter. This artificial seawater contained ail the major
constituents of natural seawater, including fluoride (F), while temporarily
excluding carbonic acid species. It also had a slightly higher calcium
concentration CI 1.0 mmollkg-sw) than natural seawater. Molybdate blue
spectrophotometric analysis (Koroleff, 1976) indicated that the seawater was
essentially phosphate-free, or contained Jess than 1.6 nmollkg-sw of soluble
reactive phosphate. The aged artificial seawater was further pre-treated by
suspending calcite powder in solution CI glkg-sw) for an average of 30
minutes to scavenge possible inhibitors before it was filtered. However,
calcite precipitation experiments conducted using tlle treated and untreated
seawater yielded identical results and the pre-treatment procedure was
abandoned. Prior to each experiment, weighed amounts of Na~C03 and
NaHCO, were added to a known volume of artificial seawater and
equilibrated with a water vapour saturated CO~-N~ gas phase of known Pco~
16
•
•
(i.e., 0.0031 atm.) to obtain a solution ofdesired initial calcite supersaturation
(n, defined in Table 1.1).
Calcite precipitation experiments were conducted by first introducing a
weighed amount of calcite seed material (-0.6 g) into the empty reactor (250
ml) while the C01-N1 gas was flowing through. The calcite supersaturated
artificial seawater, or input solution, was then pumped into the reactor at a
constant rate (0.03 to 1.0 g/min.) with a peristaltic pump. Once the input
solution was in contact with the seed material, a magnesian calcite; (-8 11101%
MgC03) precipitated on the seed (Hartley et al., 1992), as previously
observed (e.g., Mucci, 1986; Burton and Walter, 1987). No spontaneous
nucleation or precipitation took place from the calcite supersaturated input
solutions (I <n<15) before they were introduced into the reactor. The volume
of the solution in the reactor increased from zero to a maximum of 250 ml.
The solution to soIid ratio, therefore, changed dramatically during the course
of an experimental mn. However, we have no reason to believe that the
change in solid to solution ratio would affect the calcite precipitation reaction
kinetics once the solid material was immersed completely in the solution.
Suspension of the seed material was achieved within a very short period of
time relative to the total length of an experimental mIl. About 15 ml of
solution was generally required to suspend the solid completely. The solid
and Iiquid phases were weil mixed and the Pc01 of the solution was kept
constant by continuous bubbling of the gas mixture. An overhcad electric
motor with an one-bladed glass propeller can also be added to the system to
17
•Table LI. Constants and equations used (seawater at S=35, 25°C, 1 atm.):
Ct =s[H2C03°] = 2.839xlO-3 ( mol ); (Weiss, 1974)
Pc02 kg-swatm.
KI =1
1O-PH[HC03-]
[H2C03°]= 9.965x10⁻⁷ ( mOl); (Mil/ero, 1979)
kg-sw
10-pl/[CO)2-] ()ICzl = '--- = 7.772xlO-JD mol; (Millero, 1979)[HCO) -] kg-sw
KO = [Ca 2o] [CO 2-1. = 4.39xlü-7 ( mol )2; (Mucci, 1983)ST' ,q) q kg-sw
= 2.033xl0-9 ( mOl); (Millero, 1979)kg-sw
Ac =At - [B(OH). -] =At -[B(OH);] + [B(OH))]
lü-pH+ 1
KIB
2 Ac[CO) -] = ---
lü-pH+ 2
•
.Q =[<7a20
] [<7()32-]
K"sp
18
•
•
msure sufficient solid-solution mlxmg and gas-solution interaction. The
reactor was partly immersed in a constant temperature bath maintained at
?-±O -oC_:>_.:> .
Aliquots of the input and reacting solutions were drawn fr0111 the
reservoir at the beginning of each experiment and from the reactor
throughout or at the end of the precipitation. The solutions were immediately
filtered through Milliporell\' 0.45 !lm filters. These samples were analyzed for
total calcium concentration ([Ca2+], hereafter referred to as [Ca)) and titration
alkalinity (At). The pH of the input solution and the steady state pH of the
reacting solution were measured directly in the reservoir and in the reactor,
respectively, at times corresponding to sampling intervals. The [Ca], At, pH,
and total boric acid concentration in solution were used to calculate the
solution carbonate alkalinity (Ac), total carbonate ion concentration ([CO/-],
simplified as [C03)), and calcite saturation state (n). Apparent and
stoichiometric constants and equations used in the calculations are listed in
Table 1.1. The steady state calcite precipitation rate (R, !lmol m-2hr- l) was
calculated by multiplying the solution addition rate (1, kg-sw/hr) by the
difference in Ac (meqlkg-sw) between the input solution (AcQ) and reacting
solution (Acs), The rate was normalized with respect to the initial reactive
surface area of the calcite seeds (specific reactive surface area, S, multiplied
by the weigh~ of seed introduced in the reactor, W,ccd):
19
• I(Aco - Ac.JR = xl00ü
2S W""d(U)
•
pH measurements were conducted using a combination electrode
(Radiometer'" GK2401C) connected to a pH/mV meter (Radiometer'" M84).
The electrode was calibrated against three NBS (now NIST) buffer solutions
(pH of 6.838, 7.382, 9.180 at 25°C). Reproducibility of pH calibrations
carried out before and after measurements of a single sample solution was
better than ±O.005 pH unit. In addition, a TRIS buffer solution in artificial
scawater (8.074 at 25°C and S=35, Hansson, 1973; or 8.067 according to
Millero, 1986) was used to evaluate liquid junction potential variations
(Dickson, 1984). pH measurements on the TRIS buffer scale, when used v.'ith
the appropriate constants (Hansson, 1973; Millero, 1979), give an
independent assessment of the concentrations of carbonic acid species.
Calcite saturation calculations using the two sets ofpH and constants agreed
to within ±5% or better. Results presented in this study were calculated from
pH measurements and carbonic acid apparent dissociation constants (Table
1.1) based on the NBS scale. The total calcium concentration and total
titration alkalinity detenninations were perfonned according to the procedures
described by Mucci (1986), with estimated precisions of better than ±O.5%
and ±O.4%, respectively.
20
• 1.3 STEADY STATE CONDITION
One important criteria to be met by the system is to provide a steady
state environment for the calcite precipitation reaction. In this section, we
demonstrate, tirst from a theoretical standpoint, that the constant addition
system will indeed create and maintain a steady state environment for calcite
precipitation reactions throughout an experiment. We then examine this
c0nclusion using experimental data obtained from the system. The change of
calcium concentration in the reacting solution ([Ca]y) with time (T) is chosen
as the principal variable in the foUowing discussion.
A weighed amount of calcite seed material was introduced into the empty
reactor. A calcite supersaturated seawater solution with a calcium
concentration [Calo was then pumped into the reactor at a constant rate, I. In
the reactor, calcium can only be removed from the solution by calcite
precipitation. On the basis of mass balance, at time T, the total amount of
calcium precipitated as calcite is given by the difference between the total
amount of calcium introduced into the system and that which remains in the
reacting solution:
•
T
JR dT = ([Calo-[Cah)ITo
R is the calcite precipitation rate. Differentiating Eqn. 1.2, we obtain:
21
(1.2)
•Differentiating again, yields:
dR =1 [_ 2 d[CaJT _ T d2[Cah]dT dT dT2
T dR =1 [_ 2T d[Cah _ T2
d2[CaJT]
dT dT dT2
This equation can be integrated ta:
~T dRlnT = _1T2
d[Cah
il dT f dT
According to the above equation:
(1.3)
(1.4)
(1.5)
(1.6)
(1.7)
d[C J TIf. a T >0 then: IfT dRlnT<o
dT il dT fthus: dR<O
dT(1.8)
•
If. d[CaJT <0dT
T
then: IfT dRlnT>oil dT f
22
thus: dR >0dT
(1.9)
• T
d[Cah QT dR~ dRIf. =0 then: -- T=O thus: - =0dT idT dT
(1.10)
On the other hand, based on basic kinetic principles, the precipitation rate
of calcite should be positively correlated with [Ca]T (or calcite saturation
state, Q) under our experimental conditions. In other words:
d[CahIf. >0
dT
d[Ca]TIf. < 0
dT
d[CahIf. =0
dT
chen: dR> 0dT
then: dR < 0dT
dRchen: - = 0
dT
(1.11 )
(1.12)
(1.13)
The only situation which can satis!}' both the mass balance and kinetic
considerations is:
d[Cah= 0
dTdR = 0dT
(1.14)
•
This means that both the calcium concentration in the reactor and the
precipitation rate of calcite are invariant with time. Similar conclusions can
be reached by choosing the carbonate alkalinity of the reacting solution as
the principal variable. The dissociation reactions of carbonic acid in solution
23

•
•
are quasi-instantaneous (Lasaga, 1981). Given a constant carbonate alkalinity
and Pc02 in solution, concentrations of ail the carbonic acid species and
solution pH should be constant throughout an e~;perimental mn. In view of
the stoichiometry of the possible calcite precipitation reactions (see next
section), it can be concluded that the system is held at steady state for the
calcite precipitation reaction.
Exp,~rimental results, presented in Fig. 1.2a, indicated that both the (Cah
and ACr of the reacting solution were, within the precision of the analytical
methods, constant throughout the whole precipitation experiment. Periodic
monitoring of the reacting solution pH throughout the mn also indicated that
after a very short period of time the pH also became very stable (Fig. 1.2b).
Two factors could be used to explain the lower solution pH at the
beginning of each mn. A faster calcite precipitation reaction may occur at the
initial stage caused by the presence of a greater density of high energy
surface sites, such as kinks, steps, and holes (Nancollas et al., 1981) on the
seed materiaI. Il is also possible that the sluggish CO2 hydration reaction
could not keep up with the calcite precipitation reaction (Bemer, 1975;
Plummer et al., 1978) and result in the drifting of solution pH. In other
words, degassing of CO2 from the reacting solution was too slow and
resulted in an supersaturation of the solution with respect to the gas phase.
24

12,0 12.0
...-..~ ,,-..-• '" ~ [Ca] of input solution ~1 ...-
0.0 '".... 10,0L 06
~ AM 10,0 1- e S 0.0...... .:::::~- ......0 0-
S ~
8, ~ Ac of input solution 8,0 ES '-''-'
13 6 0 999 0 C)........ 0 0 -<t:co;:
U 6,0 6,0~
0 500 1000 1500 2000 2500 3000
Time (minutes)
8,50,..-------...----------.....,
8,25
pH of input solution
1\ /\
•
7,75
7,50 0...--~500~--..lOOO....---15~OO....--2~OOO....--..25~OO--......3000
Time (minutes)
Fig. 1.2 (a) Change in total calcium ion concentration (.e.), carbonate
alkalinity (0), and (b) pH in the reacting seawater solution with
time during calcite precipitation by the constant addition system.
25
•
•
It appears that the constant addition design does provide a steady state
environment for the calcite precipitation reaction. The fact that it is a simple
and self-regulating system makes it an attractive choice for conducting
carbonate precipitation-dissolution expeziments at near equilibrium conditions.
ln a subsequent paper (i.e., Chapter 3), we will demonstrate that it is also
weIl suited for carbonate-trace element coprecipitation studies. It may also
provide an interesting alternative to researchers investigating other mineral
water interactions. There is one important limitation to the application of this
system, however; when the rate of the reaction under investigation is either
too low or too high, an unrealistic solution injection rate may be required.
26
• 1.4 CALCITE PRECIPITATION KINETICS
Calcite precipitation rate data obtained in seawater solutions have 11l0st
frequently been fitted to an empirical rate law (Morse, 1983) of the l'Olin:
R = k(O - l)n
or its logarithmic expression:
Log(R) =nLog(O -1) + Log(k)
where n is the empirical reaction order and k is the rate constant.
(1.15)
(1.16)
•
This empirical rate law fits our data very weil over the whole range of
calcite supersaturations covered in this study (Fig. 1.3, Table 1.2). One of the
major advantages of the constant addition system is its ability to conduct
calcite precipitation experiments in solutions close to calcite saturation. A
possible change in the calcite precipitation reaction mechanism in the near
equilibrium region has frequently been suggested (e.g., Reddy et al., 1981;
Busenberg and Plummer, 1986). Yet, because of the difficulties involved in
obtaining accurate rate data in this region by existing experimental methods,
this hypothesis could not be confinned. From our limited data set, however,
we were unable to observe a deviation trom the empirical rate law in the
near equilibrium region. Comparison with previous studies shows that calcite
precipitation rate data obtained by the constant addition system agree
reasonably weil with those generated by the chemo-stat system under similar
27

•2.0
.-;--......-NS-. 1.0-0S::l..'-'
~....~es 0.0CIl0~
-1.0
-0.5 0.0
Log(ü-l)
0.5 1.0
•
Fig. 1.3_Log(Rate) vs. Log(O-l) for calcite obtained by the constant
addition system in phosphate-free seawater at 25°C and
Pco2=O.0031 atm.
28
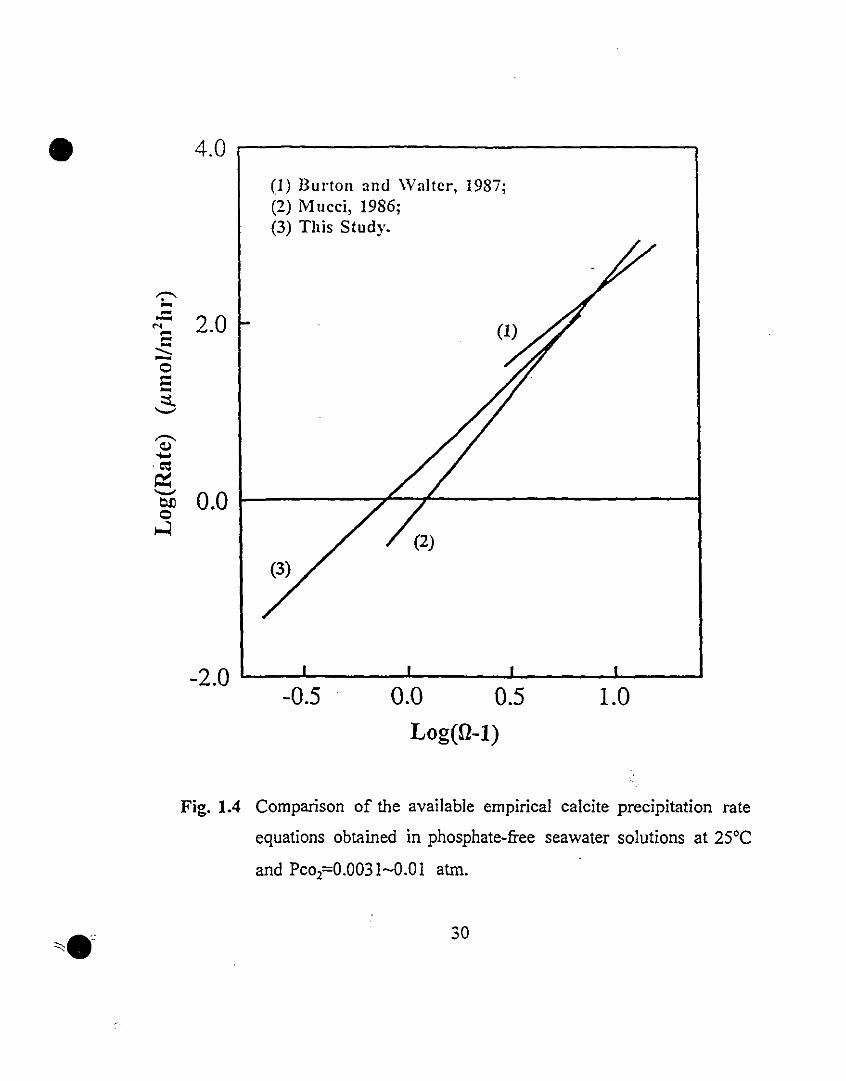
• experimental conditions (Fig. 1.4. Table 1.2). confimling the suitability of the
new system for conducting experimental calcite precipitation kinetic studies.
The empirical model. although useful in relating calcite precipitation rates to
solution supersaturation states. offers little insight into the kinetic mechanisl11
of calcite precipitation and/or dissolution.
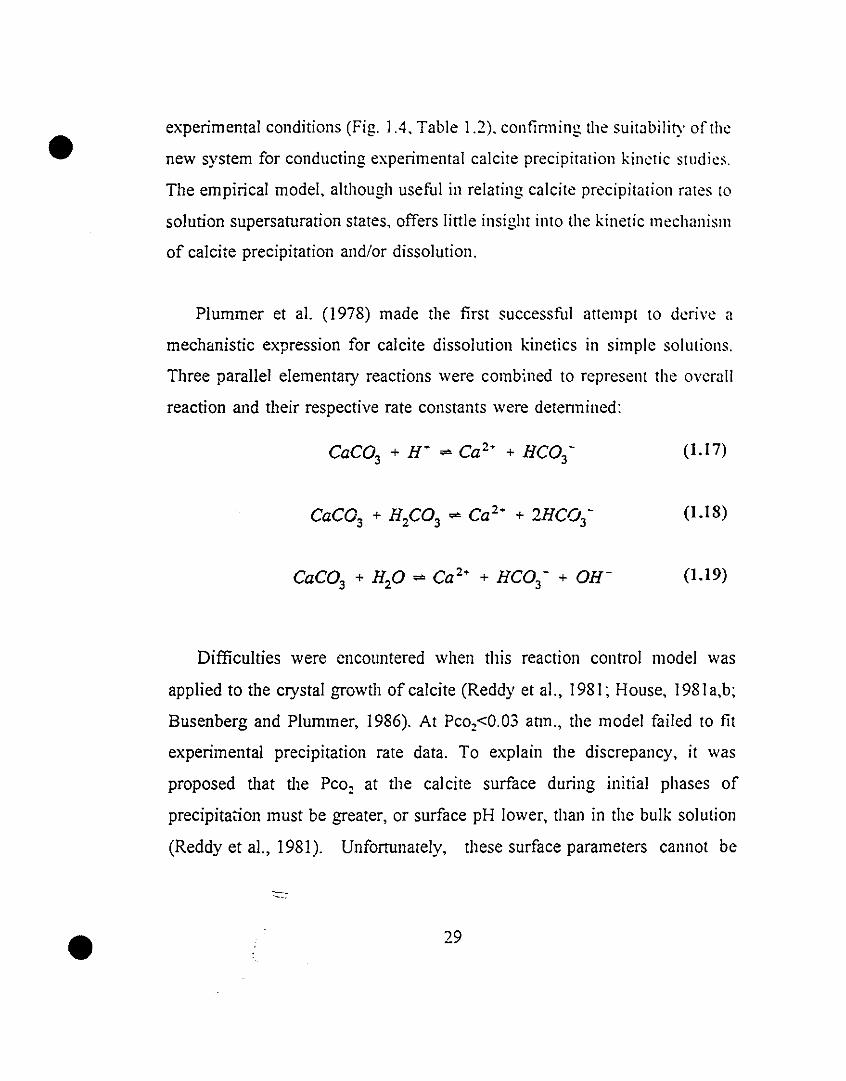
Plummer et al. (1978) made the tirst successful allempt to dcrive a
mechanistic expression for calcite dissolution kinetics in simple solutions.
Three parallel elementary reactions were combined to represent the ovcrail
reaction and their respective rate constants were detennined:
(U7)
(US)
(U9)
•
Difficulties were cncountered when this reaction control model was
applied to the crystal growth of calcite (Reddy et al., 1981; House, 1981 a,b;
Busenberg and Plummer, 1986). At Pc02<O.03 atm., the model failed to fit
experimental precipitation rate data. To explain the discrepancy, it was
proposed that the Pc02 at the calcite surface during initial phases of
precipitai:ion must be greater, or surface pH lower, than in the bulk solution
(Reddy et al., 1981). Unfortunately, these surface parameters cannot be
-.-"
29
• 4.0
(1) BUI"ton and Walter, 1987;(2) Mueci, 1986;(3) This Study.
~-... 2.0-N ...C........-0c-:::t.'-'
".....,~....
·ee~'-' 0.00Jl0~
-2.0 L..-_L-.-__....i-__--!-__---J.__-"
-0.5 0.0 0.5 1.0
Log(O-l)
Fig. 1.4 Comparison of the available empirical calcite precipitation rate
equations obtained in phosphate-free seawater solutions at 25°C
and Pco2=0.0031-0.01 atm.
30
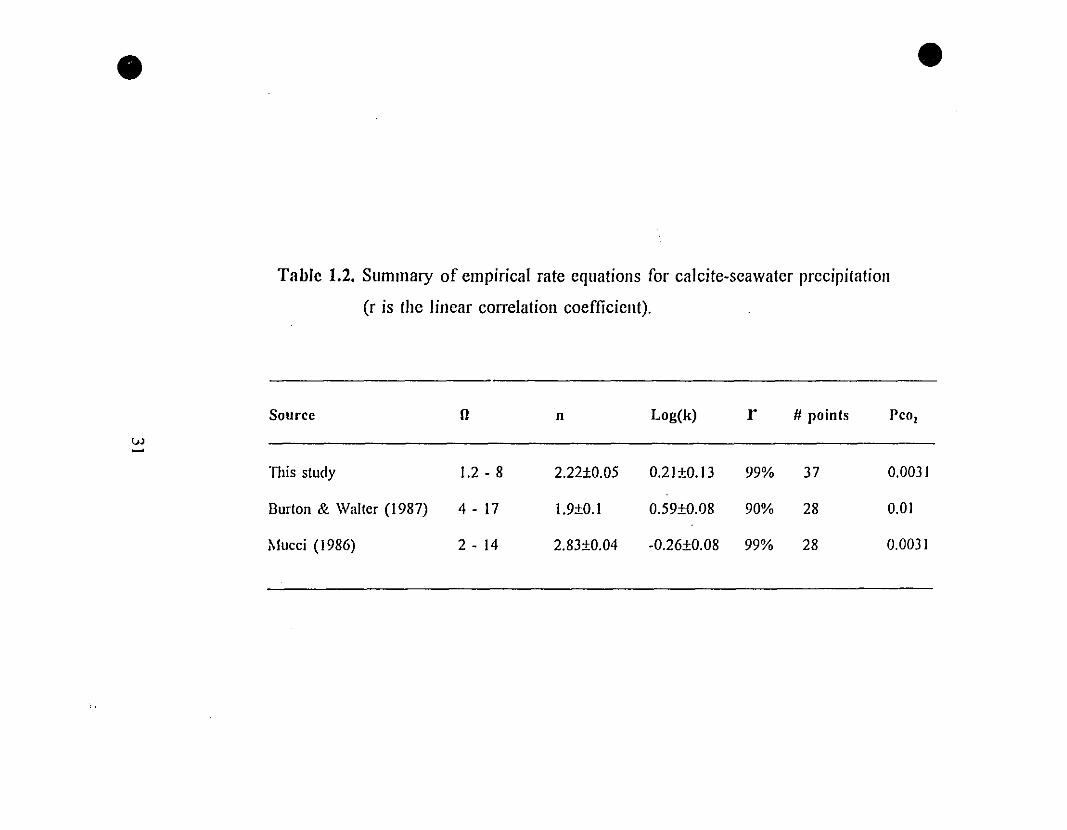
•
Table 1.2. Summary of empirical rate equations for calcite-seawater precipitation
(r is the linear correlation coefficient).
•
Source Il n Log(k) r # points Pco,
vJ~
TIlis sludy 1.2 - 8 2.22±0.05 0.21±0.13 99% 37 0.0031
Burlon & Walter (1987) 4 - 17 1.9±0.1 0.59±0.08 90% 28 0.01
Mucci (1986) 2 - 14 2.83±0.04 -0.26±0.08 99% 28 0.0031
• measured directly at this time. More importantly, disequilibrium or the Jack
of a quantitative relationship between surface and bulk solution composition
(Busenberg and Plummer, 1986) compromises the applicability of the mode!.
lnskeep and Bloom (1985) conducted a senes of calcite precipitation
experiments using a pH-stat technique in solutions with ionic strengths of
less than O.lm at a pH greater than 8 and Pc02 les~ than 0.01 atm. Using
their own experimental data set, they examined a number ofkinetic models,
including the Plummer et al. (1978) mechanistic mode!. They concluded that
calcite precipitation kinetics under their experimental conditions was best
represented by a simple elementary reaction:
Ca 2+ + CO 2- "'" CaCO3 3(S)
(1.20)
or by the Nancollas and Reddy (1971) model, which can be derived from this
reversible elementary reaction:
R = ken - 1) (1.21)
•
Chou et a!. (1989) condl1cted calcite dissolution experiments in dilute
solutions using a fluidized-bed reactor technique. Applying the Plummer et
al. (1978) approach, they also proposed the use of three parallel elementary
reversible calcite dissolution-precipitation reactions (i.e., Eqns. 1.17, 1.18,
and 1.20) to describe the overall reaction. Like 1nskeep and Bloom (1985),
they concluded that at high pH (i.e., 7 to 10) and low Pc02 (i.e., less than
0.001 atm.) calcite precipitation is dominated by Eqn. 1.20. In other words,
•
•
the rate can be expressed sim ply in tenns of the activity product of carbonate
and calcium ions, or by the Nancollas and Reddy (] 97]) mechanistic mode!.
A companson of the Nancollas and Reddy (] 97]) model with the
empirical rate model reveals that the fonner can be regarded as a special case
of the latter, and more specifically as an empirical rate law with a reaction
order of one. As was observed for other processes such as calcite-solution
reaction inhibition by Mi+ and phosphate (Burton and Walter, ]990; Mucci,
1986) and foreign ion incorporation in calcite (Burton and Walter, ]987;
1990; Mucci et al., 1989), mechanistic descriptions of calcite precipitation
(Nancollas and Reddy, 1971; Inskeep and Blooll1, 1985) and dissolution
(Chou et al., 1989) in dilute solutions may not be directly applicable to
calcite precipitation in seawater. Indeed, results from Mucci (1986), Burton
and Walter (1987; 1990), as weIl as from this study indicate that the
empirical order of the calcite precipitation reaction is larger than one in
seawater solutions (Table 1.2). The higher reaction order suggests that calcite
precipitation from seawater solutions does not proceed through simple
elementary reactions. Furthennore, studies on the inhibition of the reaction
by Mg2\ a major seawater component, support the hypothesis that crystal
growth proceeds through a complex surface-controlled mechanism in
seawater solutions (Mucci and Morse, 1983).
The ,'ontribution of individual species (e.g., HC03', W, and H2C03") to
the calcite precipitation reaction in seawater can be eval uated by conducting
experiments at different Pc02• By changing. Pc02, it is possible to vary
33

•
•
[HC03-], [H'], and [H2C03'], while at the same time keeping [C03] constant.
Preliminary experiments were conducted using Pc02 ranging from 0.00033
(equivalent to present atmospheric CO2 partial pressure) to 0.3 atm. At a
calcite saturation state typical of average surface seawater, 0=5, and over
this range of Pc02, [HC03-] will vary from 1.6 to 48 mmol/kg-sw, pH from
8.32 to 6.76, and [H2C03'] from 0.001 to 0.85 mmol/kg-sw. We observed
that the calcite precipitation rate is not affected significantly by variations of
Pco,. This conclusion is supported by a more complete study carried out by
Burton and Walter (1990). Their results show that varying Pc02 from 0.0003
to 0.1 atm. had almost no influence on the calcite precipitation rate in
phosphate-free natural seawater solutions (see their Fig. la). Similar results
were also obtained by Mucci (1986, his Fig. 1). Thus, we conclude tllat Eqn.
1.20 is the dominant calcite precipitation reaction in seawater solutions.
Nevertheless, a more careful examination of our preliminary data and tllOse
of Burton and Walter (1990) reveals tlJat tlle calcite precipitation rate at a
given saturation state may be slightly faster wben a higber Pc02 is used. This
observation suggests that the other two parallel reactions (Eqns. 1.17 and
1.18) may also participate to the precipitation. Their contribution is so small
that it will be difficult to quantifY or to determine tlleir respective rate
constants, unless the precision of the experimental system is improved
significantly.
A kinetic rate equation for the overall calcite precipitation reaction in
seawater, as represented by Eqn. 1.20, can be written as tlle difference
between the forward and backward reaction rates (Lasaga, 1981; bis Eqns.
34
• 2 and 109):
(Lm
where R is the observed calcite precipitation rate; Rf' Rh and kt". kh are the
forward and backward reaction rates and rate constants for the overall
reaction, respectively, and ai and ni are the activity and partial reaction order
for species involved in the reaction.
Since the activity of a relatively pure sol id can be considered as one.
Eqn. 1.22 reduces to:
kn n.,R = "fa ) I(a ). - kJ' Ca C03 b
(1.23)
In this study, we were able to conduct a series of experiments for which
[Ca] was held constant and [C03] varied between 0.05 and 0.35 meqlkg-sw.
Othervariables include pH (7.44-7.84) and [HC03'] (2.4-6.0 meqlkg-sw); but
these have been shown not to influence the reaction rate significantly. The
concentration of aIl the other species in solution were maintained essentially
constant. Under such conditions, the activity of calcium and the activity
coefficient of the carbonate ion (yc03) can be considered as constants. Eqn.
1.23 can, therefore, be simplified to:
(1.24)
•where:
35

• (1.25)
Rearranging Eqn. 1.24 and taking the logarithm, we obtain:
When R » kh, the above equation reduces to:
Log(R) = nLog([C0;J) +Log(K)
(1.26)
(1.27)
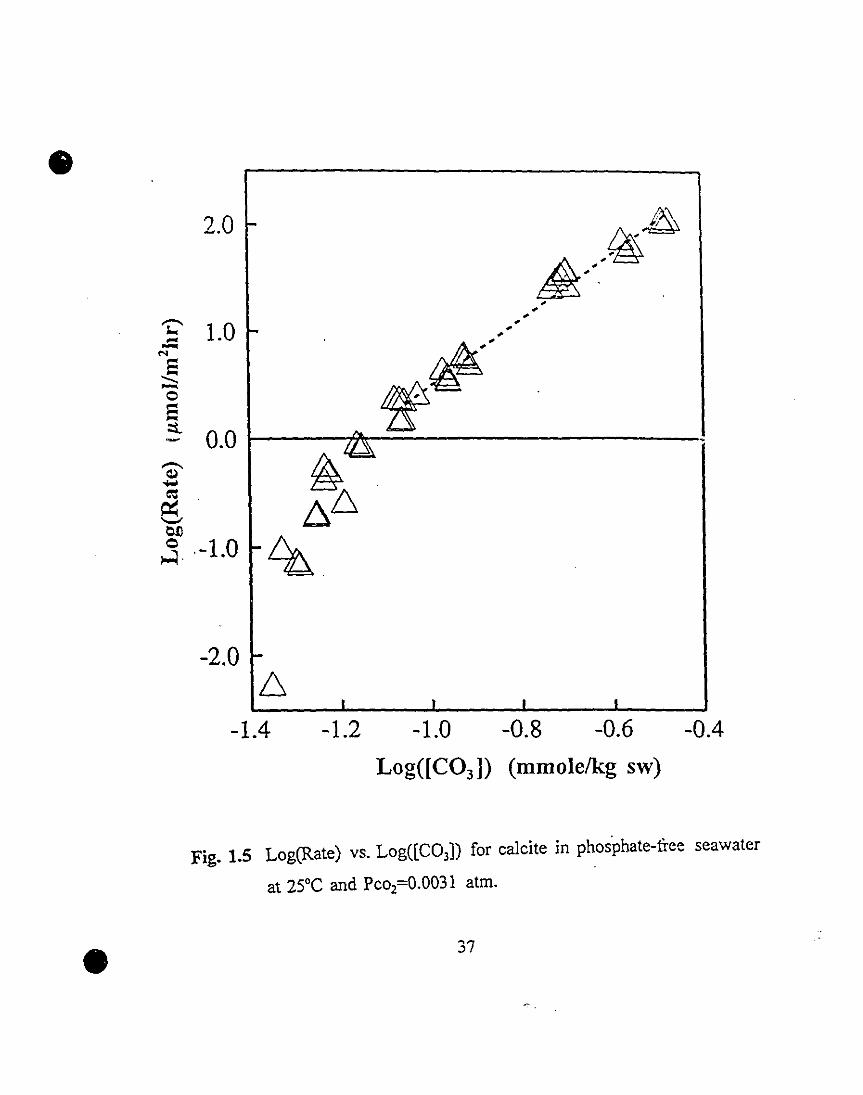
and thus, a linear relationship should exist between Log(R) and Log([C03]).
Our experimental data were plotted accordingly in Fig. 1.5. It is apparent
that a linear relationship does exist in the far-from-equilibrium region under
our experimental conditions. In this region, where Log(R»O, a least-squares
linear regression gives a slope corresponding to a reaction order of 3.09±O.09
and an intercept corresponding to a rate constant of 103.57±O.o9 with a
correlation coefficient of 0.99. For the foIIowing discussion we adopted a
reaction order of 3.0 and a raie constant of 103.6 which were substiiuted into
Eqn. 1.26:
Log(R +k~ = 3.0Log([CO;J) + 3.6
At equilibrium, [C03]=[C03Lq and R=O, therefore:
Log(k~ = 3.0Log([C0;Jeq) +3.6
(1.28)
(1.29)
•The stoichiometric solubility of calcite in seawater under our experimental
conditions (i.e., seawater, S=35, t=25°C) is given as (Table LI):
36
•2.0 -
"C' 1.0.::N
~oS::t
-2.0 6
1 1 1 1
•
-1.4 -1.2 -1.0 -0.8 -0.6 -004
Log([C03 ]) (mmolelkg sw)
Fig. 1.5 Log(Rate) vs. Log([C03D for calcite in phos'phate-free seawater
at 25°C and Pco2=O.0031 atm.
37
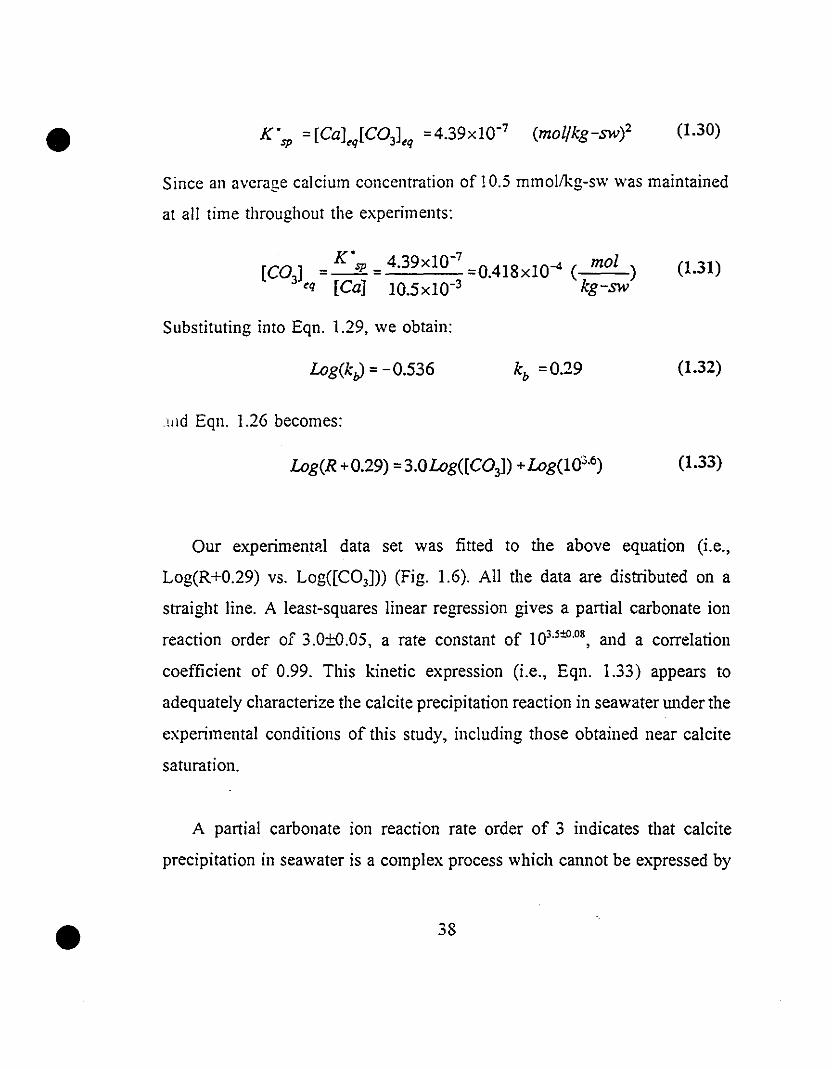
• (1.30)
Since an average calcium concentration of 10.5 rnmollkg-sw was maintained
at ail time throughout the experiments:
K' 7[CO] =---!!!.. = 4.39xlO- =OA18xlO-4 ( mol )
3 tq [Ca] 10.SxlO-3 kg-sw
Substituting into Eqn. 1.29, we obtain:
(1.31)
Log(kJ = -0.536
!ild Eqn. 1.26 becomes:
(1.32)
Log(R +0.29) =3.0Log([C03D+Log(W'·6) (1.33)
•
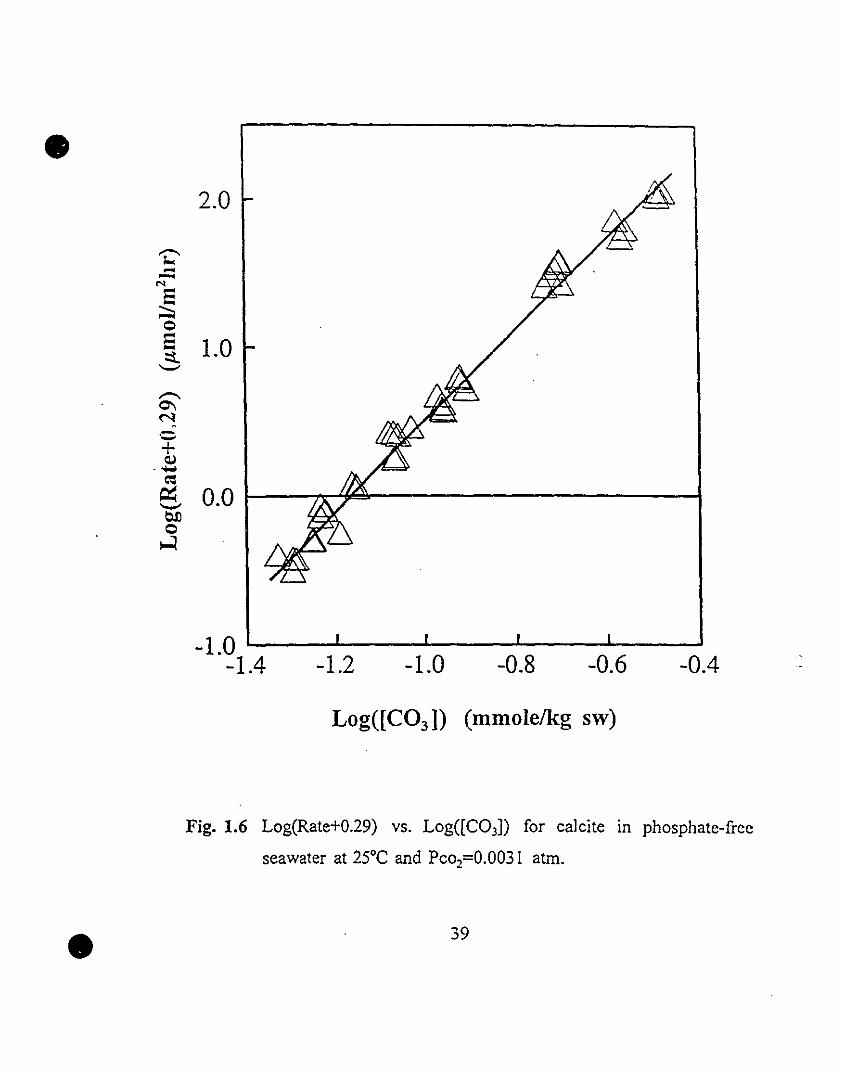
Our experirnent?l data set was fitted to the above equation (i.e.,
Log(R+0.29) vs. Log([C03])) (Fig. 1.6). AIl the data are distributed on a
straight line. A least-squares linear regression gives a partial carbonate ion
reaction order of 3.0±O.OS, a rate constant of 103.5±O.08, and a correlation
coefficient of 0.99. This kinetic expression (i.e., Eqn. 1.33) appears to
adequately characterize the calcite precipitation reaction in seawater under the
experimental conditions of this study, including those obtained near calcite
saturation.
A partial carbonate ion reaction rate order of 3 indicates that calcite
precipitation in seawater is a cornplex process which cannot be expressed by
38
•2.0
'l:'--N5;:::.05 1.0:::t'-"
,.......,0'\NC+Q,l.......~
~ 0.0'-"b.ll0~
•
-1.0 L--_---L.__....L-__.L--_--L__.....J
-1.4 -1.2 -1.0 -0.8 -0.6 -0.4
Log([C03 D (mmolelkg sw)
Fig. 1.6 Log(Rate+O.29) vs. Log((C03D for calcite in phosphate-free
seawater at 25°C and Pco2=O.0031 atm.
39

•
•
a simple elementary reactioll. il does not, however, necessarily reflect the
molecularity of the reaction. The difference between calcite precipitation
kinetics in distiIIed water and seawater can probably be explained by the high
ionic strength and the presence of other components such as Mg2+, SO/,
Na" and CI- in seawater. These ions are bound to interact with each other to
fonn complexes, or ion-pairs, which may influence the behavior ofindividual
ions in solution and at the solid-solution interface. Furthennore, a variety of
foreign ions can be cop,-ecipitated in the calcite lattice and may modify the
thennodynamic characteristics of calcite growth surface. In fact, Busenberg
and Plummer (1985; 1989) demonstrated that the incorporation of Na+ and
;:,0/ in the calcite lattice increases the unit eell size and decreases the
stability of the sol id. Mg2+ and SO/- interact strongly with each other in
solution (Millero and Schreiber, 1982) while both influence calcite
precipitation rate in seawater. Mucci et al. (1989) observed that calcite
precipitation is faster in sulphate-free seawater than in "nonnal" seawater at
identical calcite supersaturations. Furthennore, they observed that the amount
of Mg2+ incorporated in calcite following precipitation in seawater increased
from 8 to 10.5 mol% MgC03 when SO/" ions were withheld from the
artificial seawater preparation. On the other hand, calcite precipitation rate
is nearly independent of the seawater salinity between 5 and 44, whereas the
amount of MgC03 incorporated in calcite increases with decreasing salinity
(Zhong and Mucci, 1989). AlI these observations suggest that the calcite
precipitation reaction mechanism in seawater is complex and depends on both
solute interactions in solution and at the surface of the growing solid.
40
•
•
The calcite dissolution rate constant obtliined in seawater, kh=0.29 ~lmol
rn'2h(1, is significantly smaller than that of Chou et al. (1989; kJ=2324.4
Jlmol m'2hr· l) in dilute solutions. This is in agreement with observations that
calcite dissolution rate is significantly slower in seawater than in low ionic
strength CaCI2+MgCI2 solutions at identical undersaturations and close to
equilibriurn (Walter, 1986). The rate difference would be larger if the low
ionic strength solutions were Mg2+-free since Mg2
+ acts as an inhibitor on the
calcite dissolution reaction (Sjoberg, 1978).
Further resolution of the calcite precipitation rate constant, k.., and
deterrnination of the partial reaction order for the calcium ion will require
conducting experiments by varying the calcium ion and maintaining the
carbonate ion concentrations invariant. Furtherrnore, we believe that to fully
characterize the calcite precipitation-dissolution reaction in complex
electrolyte solutions such as seawater, a systematic investigation is required
to carefuIly study the effect of aIl major seawater components as weIl as
some of the more powerflll and naturaIly occllmng trace inhibitors sllch as
phosphate.
41
•
•
1.5 CONCLUSIONS
ln this study, we were able to demonstrate that a simple experimental
design is suitable for conducting carbonate-solution reaction kinetic studies.
It is self-regulating in tenns of achieving steady state conditions for
carbonate precipitation-dissolution reactions. It might also be applied equally
weil to other mineral-solution kinetic investigations.
Of ail the possible calcite parallel precipitation reactÏons, the fastest and
therefore the rate determining, involves interaction of the carbonate and
calcium ions (i.e., Eqn. 1.20) in simple dilute solutions (Inskeep and Bloom,
1985; Chou et al., 1989) as weil as in seawater solutions. However, while the
interaction is adequately described by an elementary reaction in simple dilute
solutions (Inskeep and Bloom, 1985; Chou et al., 1989), rate data trom this
study and numerous others show that it is a complex reaction in seawater
solutions. This observation suggests that major components of seawater play
an important raIe in calcite and even other carbonate mineraI precipitation
and dissolution reactions. Consequently, mechanistic kinetic expressions
derived to describe calcite precipitation in dilute solutions cannot be applied
directly to seawater.
. The calcite precipitation reaction in seawater can, however, be adequately
described by a complex (or overall) reaction rate model. Data trom this study
yield a partial reaction order of 3 with respect to the carbonate ion and a
backward (i.e., dissolution) reaction rate constant of 0.29 /lmol m·2hr·1• The
42
•
•
interaction of seawater solutes in solution as wel1 as at the surface of the
precipitating solid are most likely responsible for the diffcrence betwcen
reaction mechanisms in dilute and complex electrolyte solutions. The
backward reaction rate constant determined in this study is significantly
lower than that obtained by Chou et al. (1989) from dissolution experiments
in dilute solutions. However, this discrepancy is in accordance with
observations that calcite dissolution rates are much faster in dilute solutions
under identical saturation conditions. Further experimentation (i.e., varying
[Ca] while keeping [C03] and other species constant) is required to ful1y
develop the kinetic expression (i.e., reaction order with respect to [Ca],
forward reaction rate) which describes the precipitation of calcite trom
seawater. In addition, refinements to this model would also require deiailed
investigations on the influence of other major seawater components such as
Mg2+, HC03', H2C03, H+, SO}", Na+, as weIl as reaction catalysts and
inhibitors (e.g., phosphate).
43
•
•
1.6 ACKNOWLEDGEMENTS
The authors wish to express their gratitude to A. Bono, C. Guignard, L.
Hendelman, X. Wu, and A. Yannakis for their technical assistance during
various stages of this study. We also wish to acknowledge the insightfuI
criticism and comments of George Hartley and Dr. James Zullig on an earlier
version of this manuscript. We thank Dr. E. A. Burton and two anonymous
reviewers for their constructive criticism.
FinanciaI support was provided by the NaturaI Sciences and Engineering
Research Council ofCanada (NSERC) to AM. SZ would like to acknowledge
the financial assistance provided by the Lynch, Reinhardt, and William and
Reinhardt funds from the Department of Geological Sciences at McGiIl
University and graduate scholarships awarded by GEOTOPfUQAM through
FCAR-Centre and Team grants.
44
•
•
1.7 REFERENCES
Berner RA. (1975) The role of magnesium in the crystal growth of calcite
and aragonite from seawater. Geochim. Cosmochil11. Acta 39, 489-504.
Burton E.A. and Walter L.M. (1987) Relative precipitation rates of
aragonite and Mg calcite from seawater: tel11perature or carbonate ion
control? Geology 15, 111-114.
Burton E.A. and Walter L.M. (1990) The role of pH in phosphate
inhibition of calcite and aragonite precipitation rates in seawater.
Geochim. Cosmochim. Acta 54, 797-808.
8usenberg E. and Plummer L.N. (1985) Kinetic and thennodynal11ic
factors controlling the distribution of Sa/and Na+ in calcites and
aragonites. Geochim. Cosmochim. Acta 49, 713-725.
Busenberg E. and Plummer L.N. (1986) A comparative study of the
dissolution and crystal growth kinetics of calcite and aragonite. In:
Studies in Diagenesis (ed. Mumpton F.A.). pp.139-168. U.S. Geological
Survey Bulletin 1578.
Busenberg E. and Plummer L.N. (1989) Thennodynamics of magnesian
calcite solid-solutions at 25°C and 1 atm. total pressure. Geochim.
Cosmochim. Acta 53, 1189-1208.
Chou L. and Wollast R (1984) Study of the weathering of albite al room
temperature and pressure with a fluidized bed reactor. Geochim.
Cosmochim. Acta 48, 2205-2217.
Chou L., Garrels RM. and Wollast R (1989) Comparative study of the
kinelics and mechanisms of dissolution of carbonate minerais. Chem.
45
•
•
GeoI., 78, 269-282.
deKaneI J. and Morse J.W. (1979) A simple technique for surface area
determinations. J. Phys. E. Scî. Instr. 12, 272-273.
Dickson A.G. (1984) pH scales and proton-transfer reactions 111 saline
media such as sea water. Geochim. Cosmochim. Acta 48, 2299-2308.
Hansson I. (1973) A new set of acidity constants for carbonic acid and
boric acid in sea water. Deep-sea Res. 20,461-478.
Hartley G., Zhong S. and Mucci A. (1992) The influence of Pcoz on the
incorporation of magnesium in calcite overgrowths precipitated from
seawater at 25°C (abstr.). Eos 73, 168.
Bouse W.A. (1981a) Kinetics of crystallisation of calcite from calcium
bicarbonate solutions. J. Chem. Soc., Faraday Trans. 77,341-359.
House W.A. (1981b) An experimental investigation of carbon dioxide
adsorption during calcite precipitation. Colloids and Surfaces 2, 119-131.
Inskeep W.P. and Bloom P.R. (1985) An evaluation of rate equatiolls for
calcite precipitation kinetics at pCOz less than 0.01 atm and pH greater
than 8. Geochim. Cosmochim. Acta 49, 2165-2180.
Kazmlerczak T.F., Tomson M.B. and Nancollas G.H. (1982) Crystal
growth of calcium carbonate. A cOlltrolled composition kinetic study. J.
Phys. Chell1. 86, 103-107.
Koroleff F. (1976) Detenl1inatioll of phosphorus. In: Methods of Seawater
Analysis (ed. K. Grasshoff), pp. 117-126. Verlag-Chimie.
Lasaga A.C. (1981) Rate laws of chemical reactiollS. In: Kinetics of
Geochemical Processes (eds. A.C. Lasaga and R.J. Kirkpatrick). pp.1-68.
Milleralogical Society of America, Reviews in Mineralogy,Vol. 8,
46
•
•
Washington D.C.
Millero F.J. (1979) The thennodynamics of the carbonate system 111
seawater. Geochim. Cosmochim. Acta 43. 1651-1661.
Millero F.J. (1986) The pH of estuarine waters. Limno1. Oceanogr. 31.
839-847.
Millero F.J. and Schreiber D.R. (1982) Use of the ion pairing model to
estimate activity coefficients of the ionic components of natural water.
Amer. J. Sei. 282, 1508-1540.
Morse J.\V. (1974) Dissolution kinetics of calcium carbonate in sea water.
III: a new method for the study of carbonate reaction kinetics. Amer. J.
Sei. 274, 97-107.
Morse J.W. (1983) The kinetics of calcium carbonate dissolution and
precipitation. In: Carbonates: Mineralogy and Chemistl)' (ed. RJ.
Reeder), pp.227-264, Mineralogical Society of America, Review in
Mineralogy, Vol. 11, Washington D.C.
Morse J.W. and Bender M.L. (1990) Partition coefficients in calcite:
Examination of factors influencing the validity of experimental results
and their application to natural systems. Chem. Geol. 82, 265-277.
Mucci A. (1983) The solubility of calcite and aragonite in seawater at
various salinities, temperatures, and one atmosphere total pressure. Amer.
J. Sei. 283, 780-799.
Mucci A. (1986) G~owth kinetics and composition of magnesian calcite
overgrowths precipitated from seawater: Quantitative influence of
orthophosphate ions. Geochim. Cosmochim. Acta 50, 2255-2265.
Mucci A. and Morse J.W. (1983) The incorporation of Mg2- and Sr' into
47
•
•
calcite overgrowths: influences of growth rate and solution composition.
Geochim. Cosmochim. Acta 47, 2 J7-233.
Mucci A., Canuel R. and Zhong S. (1989) The solubility of calcite and
aragonite in sulphate-fTee seawater and the seeded growth kinetics and
composition of the precipitates at 25°C. Chem. Geo!. 74, 309-320.
Nancollas G.R. and Reddy M.M. (1971) The crystallization of calcium
carbonate. II. Calcite growth mechanism. J. Colloid Interface Sei. 37,
824-830.
Nancollas G.R., Kazmlerczak T.F., and Schuttringer E. (1981) A
ccntrolled composition study of calcium carbonate crystal growth: the
influence of scale inhibitors. Corrosion 37, 76-80.
Plummer L.N., Wigley T.M.L. and Parkhurst D.L. (1978) The kinetics
of calcite dissolution in CO2-water systems at 5°C to 60°C and 0.0 to 1.0
atm CO2• Amer. J. Sei. 278, 179-216.
Reddy M.M., Plummer L.N. and Busenberg E. (1981) Crystal growth of
calcite from calcium bicarbonate solutions at constant Pc02 and 25°C: a
test of a calcite dissolution mode!. Geochim. Cosmochim. Acta 45,
1281-1289.
Sjoberg E.L. CI 978) Kinetics and mechanism of calcite dissolution In
aqueous solutions at low temperatures. Stockholm Contributions to
Geology 32, 1-96.
Walter L.M. CI 986) Relative efficiency of carbonate ûissolution and
precipitation during diagenesis: a progress report on the raie of solution
chemistry. In: Roles of Organic Matter in Sediment Diagenesis (ed. D.L.
Gautier), pp.l-ll, SEPM Spec. Pub!. Vo!. 38.
48
•
•
Weiss R.F. (19ï4) Carbon dioxide in water and seawater: The solubility of
a non-ideal gas. Mar. Chem. 2, 203-215.
Zhong S. and Mucci A. (1989) Calcite and aragonite precipitation tram
seawater solutions ofvarious salinities: Precipitation rates and overgrowth
compositions. Chem. Geol. ïS, 283-299 .
49
•
•
CHAPTER 2
Quantitative Determination of REE in Seawater by Chelation apd
Gradient Ion Chromatography
S. Zhong and A. Mucci
Earth and Planetary Sei., McGill Univ., Montreal, PQ, Canada
ABSTRACT
A revised procedure is described for the quantitative detennination ofrare
earth elements (REE) in aqueous sampies of diverse matrices and high levels
of aluminium, iron, and other transition metals by means of chelation and
gradient ion chromatography. Matrix components such as anions and alkali
and alkali-earth cations were eliminated through selective trapping of REE
and transition metals on a chelating resin. The amounts of aluminium, iron,
and other transition metals in the sample were then reduced to a non
interfering level following elution through a cation exchange column using
a mixture of HCI-ethanol as eluent. REE ions were separated individually by
a gradient mixture oftwo complexing eluents in an anion exchange analytical
column. Individual REE ions were then derivitized with a post-column
reagent and their concentrations detennined colorimetrically at 520 nm using
a variable wavelength detector. The procedure has direct applications to
various aquatic samples and dissolved solid Illa:erials with limits of detection
of 10-20 ng and precision of ±5% relative s~ji1dard devi:.>tion (1 cr). lt is also
50
•
•
flexible enough to allow a direct REE extraction ITom a large volume of
sarnple solution. This extraction capability is especially valuable for sampics
whose REE concentrations are low and close to the dctection lim its .
51
•
•
2.1 INTRODUCTION
Rare earth elements (REE, or lanthanides), because of their umque
chemical and geochemical properties, have been used as tracers to provide
conclusive infonnation about various high temperature (see, e.g. [1-2]) and
more recently, low temperature geological and geochemical [3-7] (e.g.
sedimentary and oceanographic) processes. One of the major impediments to
the advancement of such applications, however, is the lack of a convenient
and reliable technique to obtain accurate REE concentration data from
sampIes with complex matrices such as seawater, estuarine water, brine, and
geological materials. While modern analytical techniques such as inductively
coupled plasma mass spectrometry (lCP-MS), isotopic dilution lCP-MS,
inductively coupled plasma emission spectrometry (lCP-ES), and instrumental
neutron activation analysis (lNAA) are readily applicable to dilute solutions,
difficulties were experienced when they were applied to samples with
complex matrices [1]. The extremely high levels of alkaline and alkaline
earth metals, halogens, silicates, carbonates, phosphates, transition metals,
and other elemental and molecular matrix constituents in such materials,
compared to the often extremely low levels of REE, present a fonnidable
obstacle to direct instrumenta! analysis. REE in complex matrices are most
frequently separated by open column ion-exchange procedures, which are
often tedious, expensive, and for which extreme care must always be taken
to avoid contamination [8-10].
An alternative method for the quantitative analysis of REE in geological

•
•
samples was introduced by le Roex and Watkins [II] using chelation and
gradient ion chromatography. This method was originally developcd by
Heberling and coworkers at Dionex"" Corp. [12-16]. It has been successflllly
applied to the direct detennination of REE and trace metals in samples of
diverse matrices. However, difficulties were encountered when it was uscd
to analyze samples with high levels of aluminum, iron, or other transition
metals [11]. An undesirable pre-instrumental open column clean up procedure
was required to eliminate those interfering constituents (e.g., aluminum, iron).
Unfortunately, most often than not, geological sampIes and natural fluids
contain much higher levels of aluminum and iron than REE. ln addition,
procedures for REE extraction and preconcentration, such as the ferric iron
coprecipitation method [10], which is routinely applied to the detennination
of REE in seawater and other low REE-containing natural fluids, invariably
1ead to the introduction of large quantities of iron and an increase in the
concentration of other interfering metals in the sample. It would be extremely
desirable, therefore, if a procedure could be developed that would allow
samples of such nature to be analyzed for their REE content following direct
injection onto an automated ion chromatographic system.
The separation ofmetals in a cation exchange column using a mixture of
hydrochloric acid (HCl) and an organic solvent as eluent lias been studied
extensively by Fritz and Rettig [17], Korkisch and Ahluwalia [18], Strelow
et al. [19], and many others. Preliminary results, using a mixture of HCI and
ethanol for the separation of aluminium and iron from REE in an iOIl
chromatographic system similar to the one used in the le Roex and Watkins
53
•
•
[II] study, are promising [20). Further studies are warranted.
In this paper, a revised chelation and gradient ion chromatographie
procedure is introduced for the quantitative analysis of REE in solutions of
diverse background matrices and with high levels of iron. This method was
used to detennine the REE concentration of artificial seawater solutions and
dissolved carbonate mineraIs prepared during the course of a study on the
REE partitioning between calcite and seawater solutions [21].
54
•
•
2.2 EXPERIMENTAL
2.2.1. Instrumentation:
A Dionex® 4000i chelation and gradient ion chromatograph, similar 10 Ihe
one described by le Roex and Watkins [Il], was used in this study. The
system was constructed around three slider-double-stack-four-way valves
(Fig. 2.1). These valves were controlled by (wo identical and programmable
gradient pump modules (GPM1 and GPM2) which also handled and
delivered ail the eluent solutions required for chelation concentration (GPM 1)
"nd separation (GPM2). Three columns were emp10yed in the system: a
chelating concentrator co1umn (MetPac CC-l), a high capacity cation
exchange concentrator co1umn (TMC-1), and a metal separation anion
exchange ana1ytical column (IonPac CSS). Sampie solutions were de!ivered
to the system by an autosampler or a sample pump, and derivitized REE ions
were measured using a variable wavelength detector module (YOM). The
whole system was controlled by a microcomputer through an advanced
computer interface (ACI).
2.2.2. Eluent and Standard Solutions:
Eight eluent solutions and one post-column reagent were required (Table
2.1). The 3.0 M HCi/SO V.% ethanol eluent (Eluent l, GPM1) was prepared
by mixing 6.0 M HCl (Baker Instra-Analyzed"") with an equal volume of
ethanol (HPLC Spectrograde Reagent). Other solutions were prepared by
55
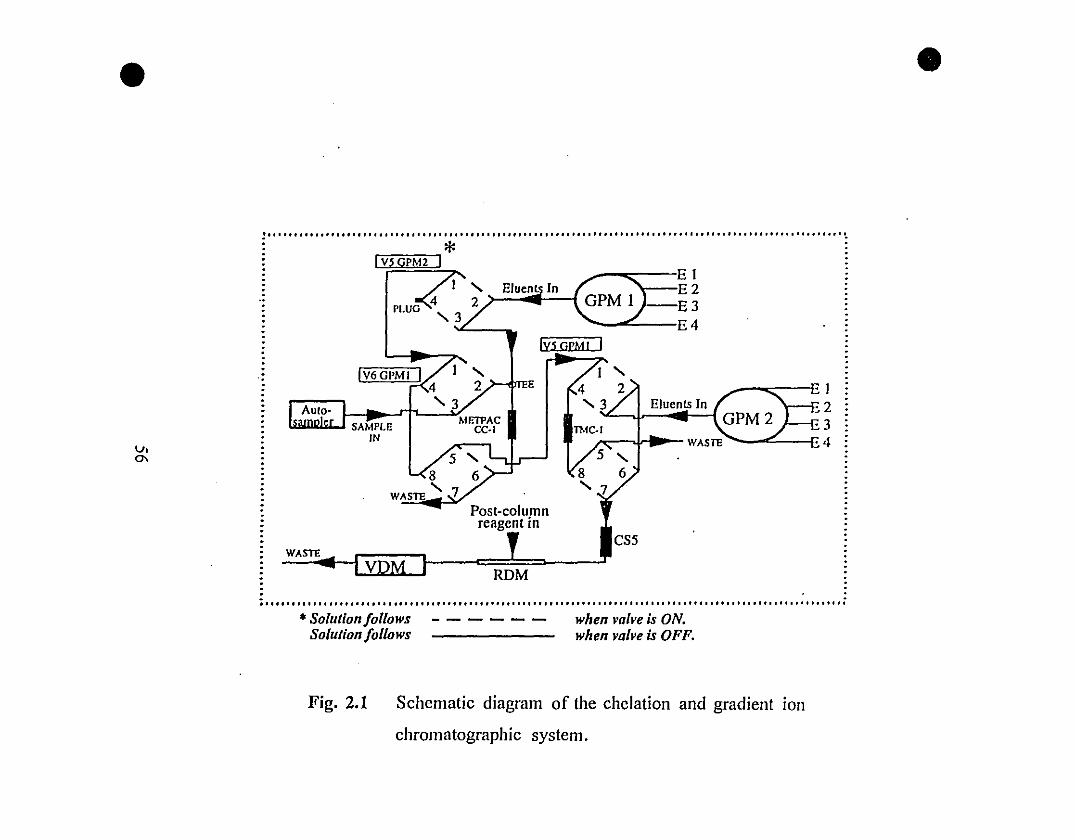
• •
, ," , , , .
r ........ El2
~3
..... .L E4
Eluents ln
,2
s ,6
r ,\=EIE2E3
..... L E4IYS-GrMT'la- 7
E
Posl-columnreagenl in
,4 2) ... (
'3PLUO
*lr.y"S"O'G;;;P"M""2'11
(V6GPMj-,=<',4
1AUIO- 1" ' 3SNDP v'"!cr SAMPLE T METI'ACIN CC·)
V,0\
cssWASTE
v RDM
""1" • l , ••• " •••••• '" l '"' • Il •• "I •••• 1 •• 1 •••• 1. 1 ., •• 1 • "'1" •••••• t ••• 1 ••• 1 •• "" • "' 1 •••••• , •••••••••••••••
• Solution follows - - - - - Solution follows
when valve is ON.when valve is OFF.
Fig. 2.1 Schematic diagram of the chelation and gradient 1011
chromatographie system.
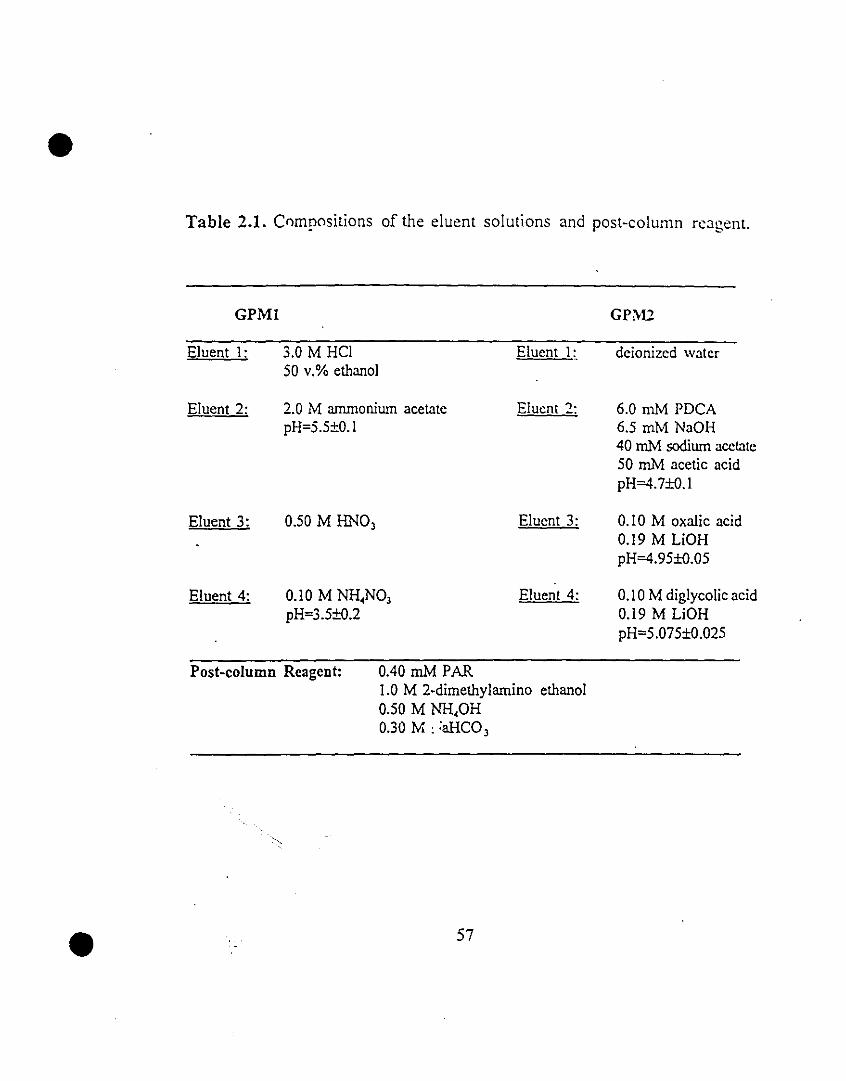
•Table 2.1. Cnmpositions of the eluent solutions and post-column rcagent.
GPMI GPM2
Eluent 1: 3.0 M HCl Eluent 1:. deionized watcr50 v.% ethanol
Eluent 2: 2.0 M ammonium acetate Eluent 2: 6.0 mM PDCApH=5.5±0.1 6.5 mM NaOH
40 mM sodium acctatc50 mM acetic acidpH=4.7±O.1
Eluent 3: 0.50 M HNO) Eluent 3: 0.1 0 M oxaiic acid0.19 M LiOHpH=4.95±O.05
Eluent 4: 0.10 M NH.NO) Eluent 4: 0.1 0 M diglycolic acidpH=3.5±O.2 0.19 M LiOH
pH=5.075±0.025
•
Post-column Reagent: 0040 mM PAR1.0 M 2-dimethylamino ethanol0.50 M NH.oH0.30 M : :aHCO)
57

• following the procedures and conditions outlined by Dionex''ll [13-14]. High
grade chemicals and Milli-Q deionized water (>17.9 Mn) were used in the
preparation of ail eluents and standard solutions. A REE standard stock
solution was prepared by mixing and diluting concentrated (1000 Ilg/ml, or
ppm) individual REE atomic absorption standard solutions (Aldrich<l!l Inc.).
Twelve REE were used: lantllanum, cerium, praseodymium, neodymium,
samarium, europium, gadolinium, terbium, dysprosium, holmium, erbium, and
ytterbium. Lutecium was not inc1uded because it is not possible to separate
it from ytterbium [11], while a thulium standard was not available in our
laboratory at the time. REE standard solutions were prepared from tlle
standard stock solution and were acidified to a pH of 1.5 to 2.0 using ultra
pure 4.0 M nitric acid.
2.2.3. Procedures:
Most of the analytical procedure described below is also given by
Dionex<l!l [13-14]. The major contribution of tllis paper is tlle addition of a
step which serves to eliminate aluminum and iron from sample solutions. An
on-line buffering procedure was also inc1uded to make tlle system more
flexible. A complete and detailed description of tlle procedure is prcsented- .-
so tllat tlle working principle can be more c1early understOod. A simplified
overview of tlle analytical procedure is provided by Fig. 2.2.
•SampIe injection and matrix purification: Sample solutions were
acidified to a pH of 1.5 to 2.0 with ultra-pure 4.0 M nitric acid to prevent
58
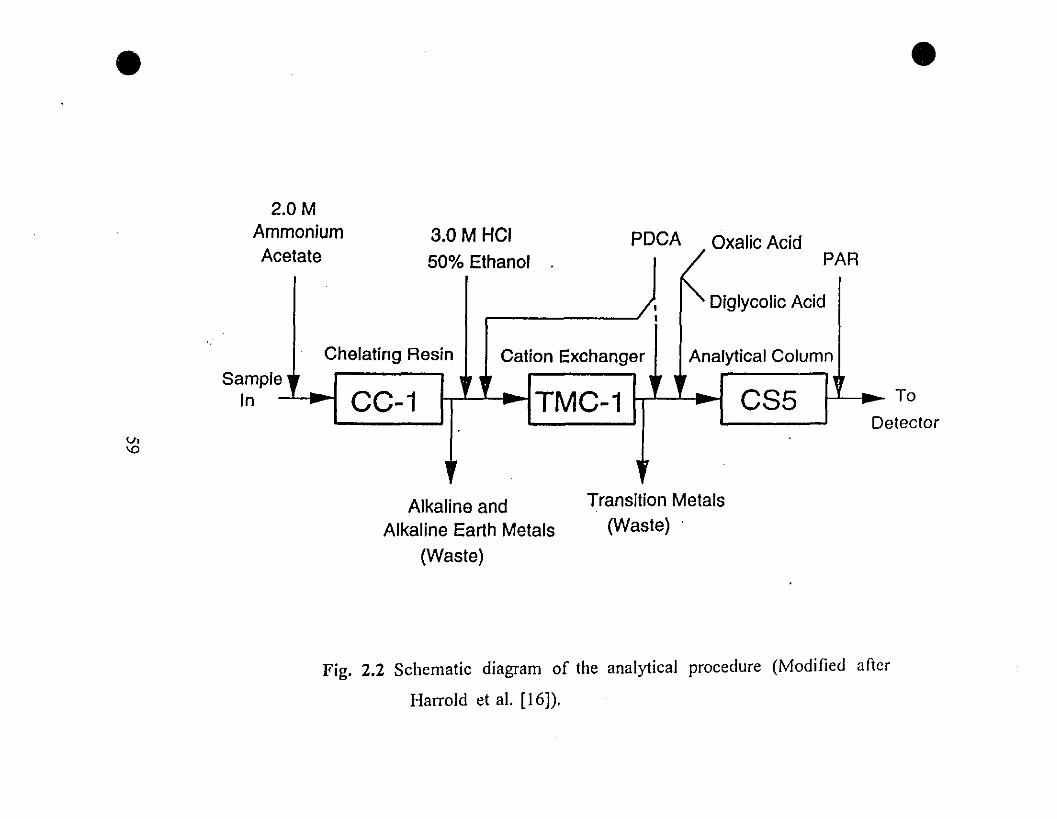
• •
To
etector
PDCA Oxalic Acid3.0 M HCI~léiU:1 50% Ethanol PAH
1 '" Diglycolic Acid1
Chelating Resin Cation Exchanger Analytical Column,Ir Ir , Ir Ir Ir
~ CC-1 ~ TMC-1 ~ CS5 •~ -
,Ir 'v
2.0MAmmoniumAc
Sampleln
v.'0
Alkaline andAlkaline Earth Metals
(Waste)
Transition Metals(Waste) ,
Fig. 2.2 Schematic diagram of the analytical procedure (Modified aftcr
Harrold et al. [16]).
•
•
losses of REE due to precipitation and adsorption onto the walls of sample
containers. The acidified sampIe or standard was introduced into the system
by an autosampler or by a sample pump ifunconventional volumes of sample
(>5 ml) had to be loaded when REE cor.centrations were very low «25 ppb).
Sampie volumes ranging from several millilitres (ml) to severa! litres (1) can
be loaded onto the system by a sample pump. The pH of the sample or
standard was adjusted to a value of 5.5±O.2 before it was pushed through the
chelation concentrator column, MetPac CC-l. Optimum selectivity for
polyvalent metal, REE and transition metal ions, is achieved at this pH. The
selectivity of the resin used in the MetPac CC-l column is extremely pH
Jependent. At a pH less than 2, the resin is in the fully protonated fonn and
is not able to chelate cations from solution. The inability of the resin to
chelate at low pH allows chelated metals to be efficiently removed from the
resin. At an intennediate pH, ranging from 4 to 7, the resin displays an
excellent selectivity for REE and transition metals relative to alkali-earth
metals. Alkali metals are not retained within this pH range. At a higher pH
the resin is fully ionized and the selectivity for REE and transition metals
relative to alkali-earths is greatly diminished.
The pH adjustment was achieved through an on-line buffering step:
mixing equal volumes of the sample and the 2.0 M ammonium acetate
eluentJbuffer solution (Eluent 2, GPMl) via a tee connector (Fig. 1.1). The
mixture, having a pH of approximately 5.5, t11en passes t11rough the MetPac
CC-l column. Anions and alkali metals were essentially unretained and went
directly to waste. The weakly retained alkali-earth metal ions were then
60
•
•
selectively eluted to \Vaste by the 2.0 M ammonium acetate eluent (Eluent 2.
GPMl). The direct sample injection and on-line buffering greatly simplif)'
pre-instrumental sampIe manipulation and allow for the injection of a large
volume of sample solution if desired.
Elimination of transition mctals: The strongly retained REE and
transition metals were then eluted to the high capacity cation exchangc
concentrator column, TMC-l, by dilute (0.50 M) nitric acid (Eluent 3,
GPM1). The TMC-l column contains fully sulfonated cation exchange resin
which has sufficient capacity to retain the metal ions under elution conditions
fi'om the MetPac CC-l.
Aluminum and iron were eluted to waste by a HCI-ethanol mixed eluent
(Eluent l, GPM1). The selective removal of aluminum and iron trom the
cation exchange column is based upon the fonnation of metal-chloride
complexes (anions) induced by the water miscible organic solvent, ethanol
[19]. The presence of an organic solvent limits the hydration of metal ions
by water molecules and thus enhances the fonnation of metal-chloride
complexes. The degree of complexation is detennined by the concentration
of HCI, the proportion of organic solvent in the eluent, and the nature of the
cations. Because of the dissimilarities in their charge and charge dcnsities,
"c-0iff<:rent cations will fonn metal-chloride complexes with distinct stabilities.
Using the optimal mixture of HCI and ethanoL 3.0 M HCI/50 v.% ethanol
[19, 22], the relatively stable metal-chloride complexes of aluminium and
iron were selectively eluted to waste while REE, which fonned less stable
61
• metal-chloride complexes, were quantitatively retained on the TMC-l
column.
The TMC-l column was then converted from hydrogen to ammonium
form with 0.10 M ammonium nitrate (Eluent 4, GPM1) before REE and the
remaining transition metals were eluted to the analytical column, IonPac CS5.
This step was necessary to prevent the protonation of the next weak acid
eluent solutions (e.g., pyridine-2,6-dicarboxylic (PDCA), oxalic, and
diglycolic acids) and disruption of subsequent analytical separation.
Separation of transition metals and individua! REE ions: The
concentrated REE and remaining transition metals were eluted from the
TMC-I column as metal-PDCA anionic complexes to the IonPac CS5 column
by the PDCA eluent (Eluent 2, GPM2). PDCA is a strong complexing agent.
Transition metals fonn stable monovalent or divalent anionic complexes,
while REE ions fonn stable trivalent anionic complexes with PDCA [23].
Transition metals were chromatographed isocratically from the IonPac CS5
analytical column by the PDCA eluent through anion exchange. The
difference in ionic charge of the metal-PDCA complexes permitted separation
of the transition metals and allowed the REE to be quantitatively retained on
the CS5 separator coiumn.
The REE ions were then eluted separately using a gradient mixture of
oxalate (Eluent 3, GPM2), diglycolate (Eluent 4, GPM2), and deionized
water (Elu,:nt l, GPM2) through an anion exchange process. The separation
62
•
•
of the REE \Vas not possible with a single eluent due to the chemical
similarity of the ions in the series. The gradient mcthod givcs a high
resolution separation of the REE in the mixed solutions (scc. Fig. 2.3a).
Detection: In this study. the separated metal-acid complexes from the
analytical column were derivitized with 4-(2-pyridylazo) resorcinol
monosodium salt (PAR) and detected by measuring the absorbance at 520 nm
using a variable wavelength detector module (VDM). A membrane reactor
and a reaction coil. which maximized the efficiency of the derivitization
reaction, were used to improve the detection limits to -20 ng for light rare
earths (LREE) and -lOng for heavy rare earths (HREE).
System Control: The system is completely automated and controlled by
a microcomputer (PC 286). It manages the system and collects data from the
detector through an advanced computer interface (ACI) using the Dionex'"
Corp. AI-450 chromatography software. An example of the instrumental
controlling "Timed-events" program is given in Table 2.2. This software was
also used to process raw data into the final desired results and output.
63
,;"',
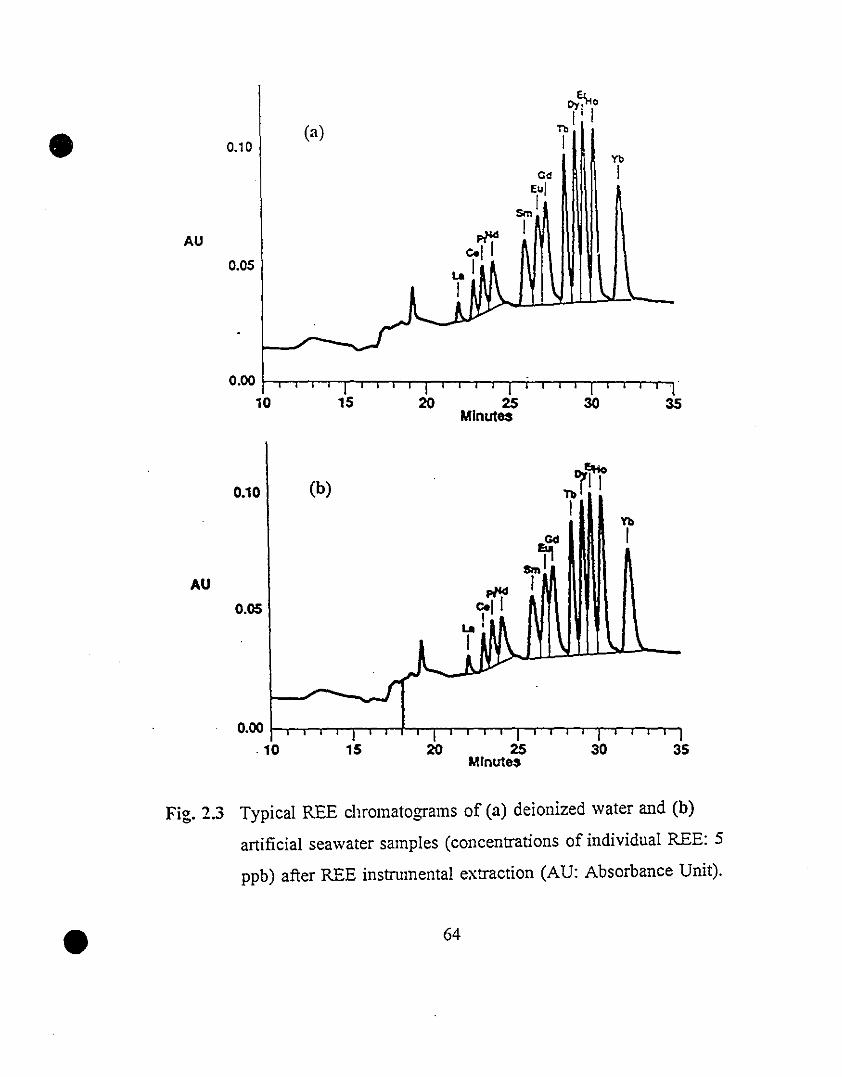
C>y~o
(a)1 1
• Tb
0.10 1
YbCd 1
Eul
sm l
AU f>ll:d 1
0.05Coll
lai
l 1 \..A.
- ""'"0.00 , , ~T TT
1 ~1 , , 1 1 1 • 1 • , , "
10 15 20 25 30 35Minutes
AU
0.10
0.05
(b)o,.t'
ni 1
1Yb
1
353020 25Mlnute$
150.00 \-T-,--r-r,-..-+Tï-,-.,..--,r-r-r-rT-,-,.....,--,-,.-,.-,-,
,10
•
Fig. 2.3 Typical REE chromatograms of (a) deionized water and (b)
artificial seawater samples (concentrations of individual REE: 5
ppb) after REE instrumental extraction (AU: Absorbance Unit).
64
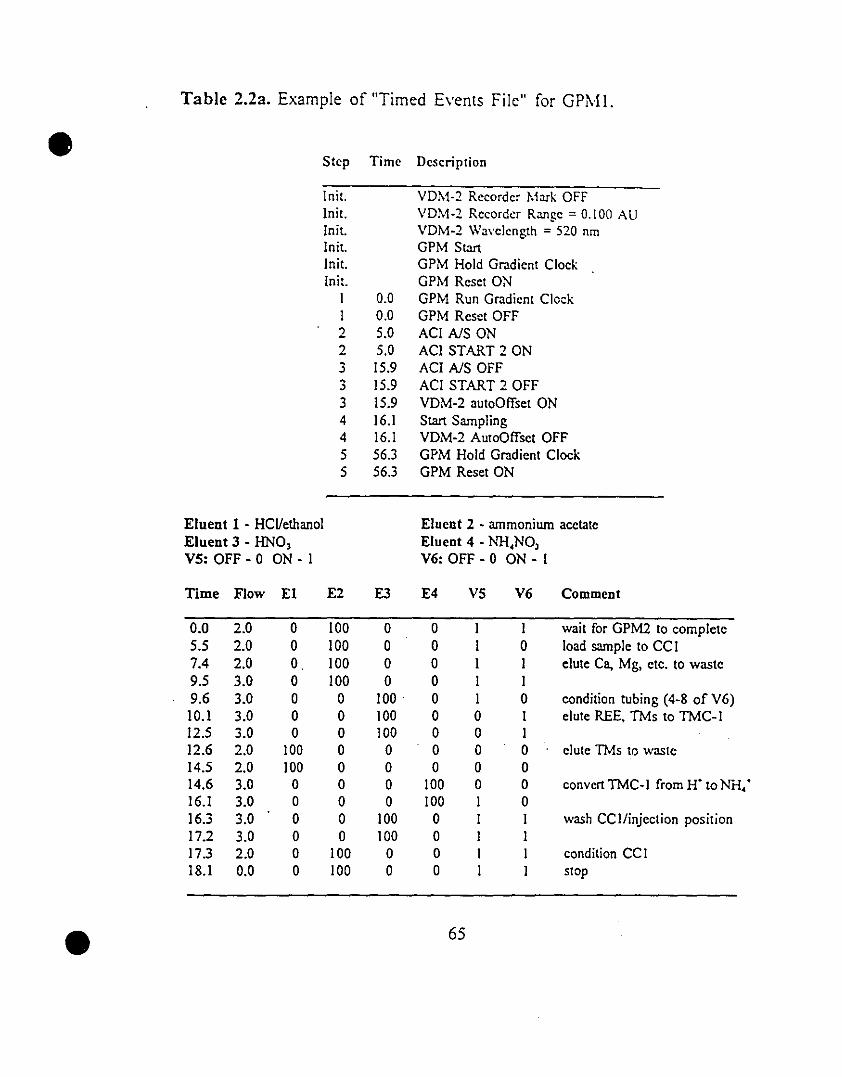
Table 2.2a. Example of "Timed Events File" for GP~11.
• Step Time Description
1nit. VDM·2 Recorder Mark OFFInit. VDM-2 Recorder Range = 0.100 AUInit. VDM·2 Wavelength = 520 nmInit. GPM StartInit. GPM Hold Gradient ClockInit. GPM Reset ON
1 0.0 GPM Run Gradient Clock1 0.0 GPM Reset OFF2 5.0 ACI NS ON2 5.0 ACI START 2 ON3 15.9 ACI NS OFF~ 15.9 ACI START 2 OFF~
3 15.9 VDM-2 autoOffset ON4 16.I Start Sampling4 16.I VDM-2 AutoOffset OFF5 56.3 GPM Hold Gradient Clock5 56.3 GPM Reset ON
Elnent 1 - HCl/ethanol Eluent 2 - ammonium acctateElnent 3 - HNO, Eluent 4 - NH,NO,VS: OFF - 0 ON - 1 V6: OFF - 0 ON - 1
Time Flow El E2 E3 E4 VS V6 Comment
0.0 2.0 0 100 0 0 1 1 wait for GPM2 to complete5.5 2.0 0 100 0 0 1 0 load sample to CCI7.4 2.0 O. 100 0 0 1 1 elute Ca, Mg, etc. to waste9.5 3.0 0 100 0 0 1 19.6 3.0 0 0 100 . 0 1 0 condition tubing (4-8 of V6)
10.1 3.0 0 0 100 0 0 1 elute REE, TMs to TMC-I12.5 3.0 0 0 100 0 0 112.6 2.0 100 0 0 0 0 0 elute TMs to waste14.5 2.0 100 0 0 0 0 014.6 3.0 0 0 0 100 0 0 eonvert TMe-1 from HO to NH,o16.1 3.0 0 0 0 100 1 016.3 3.0 0 0 100 0 1 1 wash CC lIinjeelion position17.2 3.0 0 0 100 0 1 117.3 2.0 0 100 0 0 1 1 condition CC118.1 0.0 0 100 0 0 1 1 stop
• 65
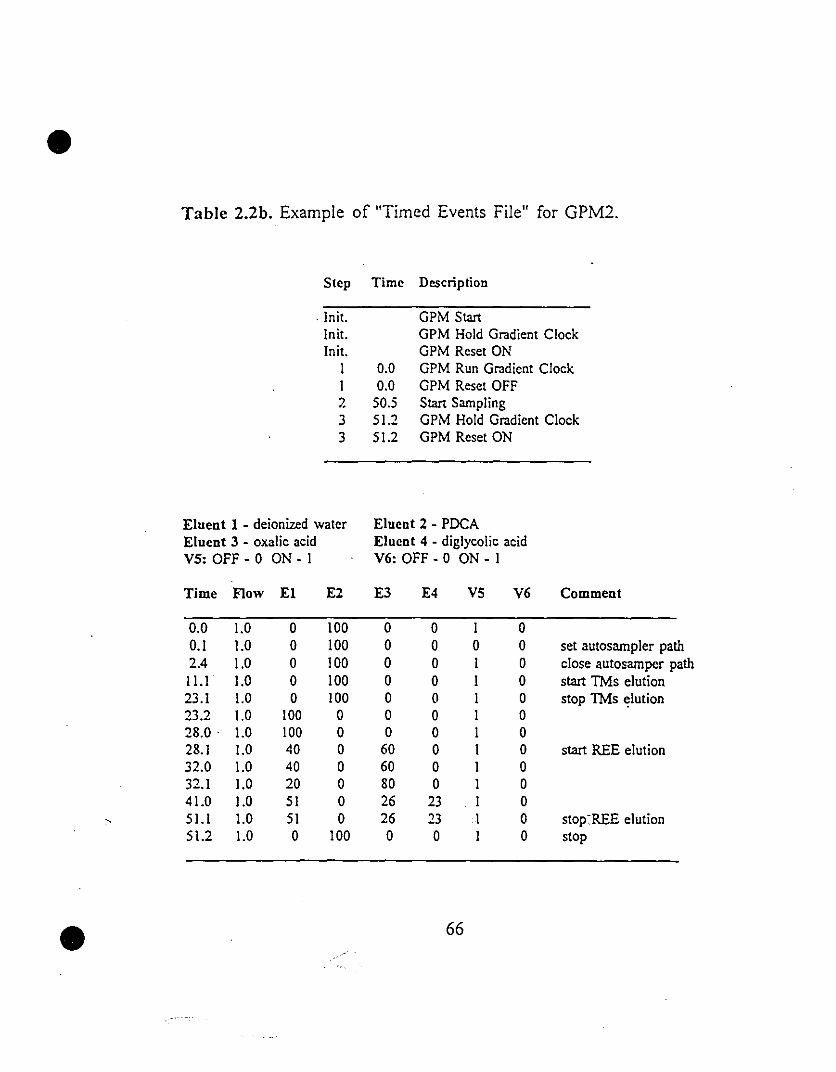
•
•
Table 2.2b. Example of "Timed Events File" for GPM2.
Stcp Timc Description
. Init. GPM Star!Init. GPM Hold Gradient ClockInit. GPM Reset ON
1 0.0 GPM Run Gradient Clock1 0.0 GPM Reset OFF7- 50.5 Star! Sampling3 51.2 GPM Hold Gradient Clock3 51.2 GPM Reset ON
Eluent 1 - deionized water Elucnt 2 - PDCAEJuent 3 - oxalic acid Elucnt 4 - diglycolic acidVS: OFF - 0 ON - 1 V6: OFF - 0 ON - 1
Time Flow El E2 E3 E4 VS V6 Comment
0.0 1.0 0 100 0 0 1 00.1 1.0 0 100 0 0 0 0 set autosampler path2.4 1.0 0 100 0 0 1 0 close autosampcr pathlU 1.0 0 100 0 0 1 0 star! TMs elution23.1 1.0 0 100 0 0 1 0 stop TMs "lution23.2 1.0 100 0 0 0 1 02S.0· 1.0 100 0 0 0 1 02S.1 1.0 40 0 60 0 1 0 star! REE elution32.0 1.0 40 0 60 0 1 032.1 1.0 20 0 SO 0 1 041.0 1.0 SI 0 26 23 1 051.1 1.0 51 0 26 23 1 0 stop:REE elution51.2 1.0 0 100 0 0 1 0 stop
66
•
•
2.3. RESULTS AND DISCUSSIONS
Analyses were conducted on REE spiked artificial samples with various
background electrolyte matrices, transition rr.etal content, and known REE
concentrations. The REE stock solution used for spiking was the same as the
standard solution preparation. Calibrations using peak area and peak height
generally agreed very weIl with each other, with peak area giving slightly
more consistent results. Peak area was selected for the calibration in this
study. Excellent linearity in the calibration curves for individual REE \Vas
observed when the amount of element in the system was above 75 ng and
below 300 ng for the LREE and between 20 and 300 ng for the HREE (Fig.
2.4). Within the linear range, a precision of ±5% (la, relative standard
deviation) or better was obtained for individual REE based on repeated
analyses (i.e. 10 to 16 times) of the same sample solutions within a 48-hour
period.
Solutions of Simple vs. Complex Matrices: REE spiked distilled water
and artificial seawater [24] with a salinity of 35 were analyzed. Identical
results were obtained for the two groups of samples despite the difference in
background electrolytes (Fig. 2.3). The similarity is more striking than it
appears to be since these analyses used large volumes of sample solutions
(-60 ml).
Solutions with High Transition Metal Content: REE spiked artificial
seawater solutions containing as much as 40 ppm iron (Fe3') were also-
67

• 16000
12000
u~
"g,~
u 8000cr;
4000
o
150000
50000
100
100
200La (Dg)
200Yb (Dg).
300
300
e·
Fig. 2.4 TypicaI standard calibration curves for REE.
68
•
-'
•
analyzed. SampIes of such hich iron content could not be analyzed din;ctly- '.
by ion chromatography using the le Roex and Watkins [11] procedure. ln the
worst case, precipitation of iron following the post-column reagent reaction
resulted in obstruction of the membrane reactor and a system breakdown.
With the revised procedure, however. such sample solutions were analyzed
successfully without any pre-instrumental open column c1ean up tn:atmenL
The iron content was effectively reduced to a non-interference level and REE
were quantitatively retained (Fig. 2.5; Table 2.3). Measured concentrations
were aIl within ±5% of the expected values.
REE extraction experiments were conducted on one litre REE-spiked
artificial seawater sample~; using the ferric iron coprecipitat:ùn procedure
described by Greaves et al. [10]. The resulting solutions had a 25 ml final
volume and an iron concentration of approximately 40 ppm. They were
loaded directly into tlle ion chromatograpil. The results are presented in Table
2.3. In fuis particular case, the average standard deviation from the expected
concentration for aIl of the REE in the sample is ±3.5%.
Direct REE Extraction: The revised procedure is aiso flexible enough
to allow a direct REE extraction from sam pIe solutions by the ion
chromatographie system. This is achieved by pumping a large volume of
sample solution (up to several litres if desired) through the MetPac CC-I
column. At a pH of 5.5, REE and transition metals were quantitatively
retained while the other ions went directly to waste. This extraction method
is especially valuable for analyzing samples whose REE concentrations are
69
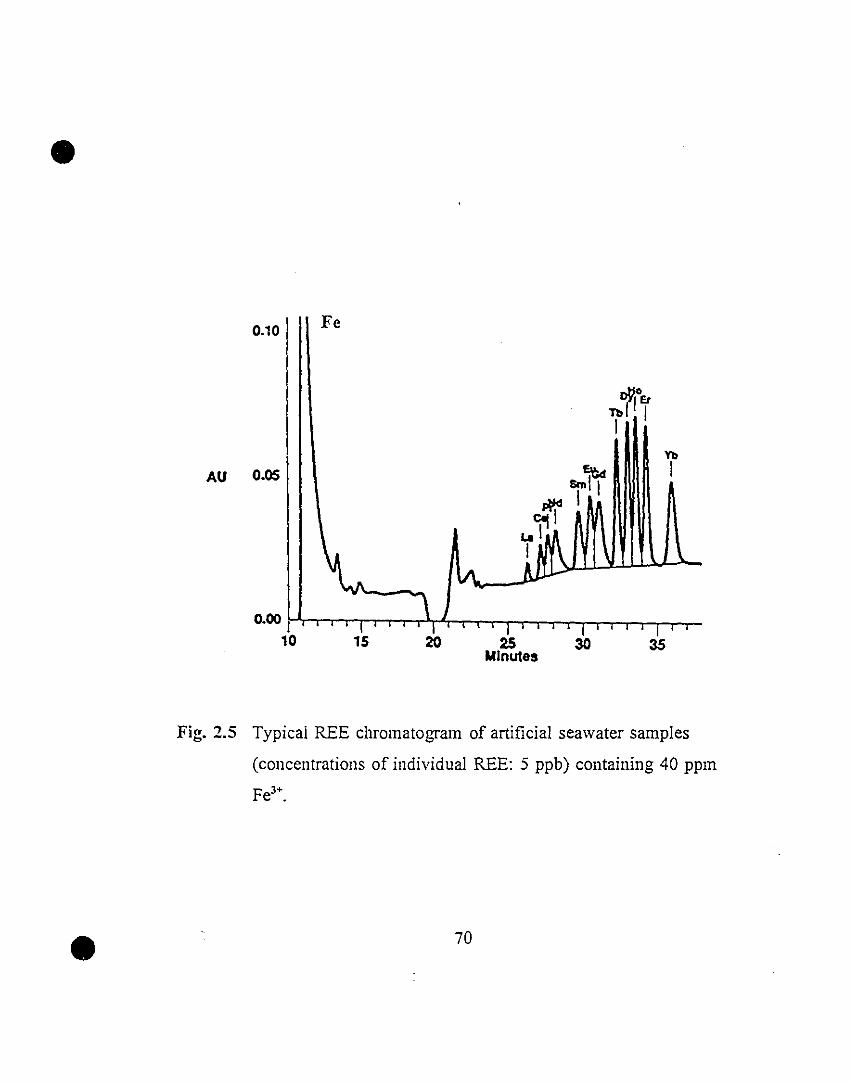
•
0.10 Fe
oWI,1EtTb 11
Yb
1
353025MInutes
20150.00 1r'r-r.....,--r..,-,r-r-nJ,-r-T.,.-,,-.,.-,-.,--,-,-,-,-,-,-..,....,.
10
AU 0.05
Fig. 2.S Typicai REE chromatogram of artificial seawater samples
(concentrations of individual REE: 5 ppb) containing 40 ppm
Fe3+.
• 70
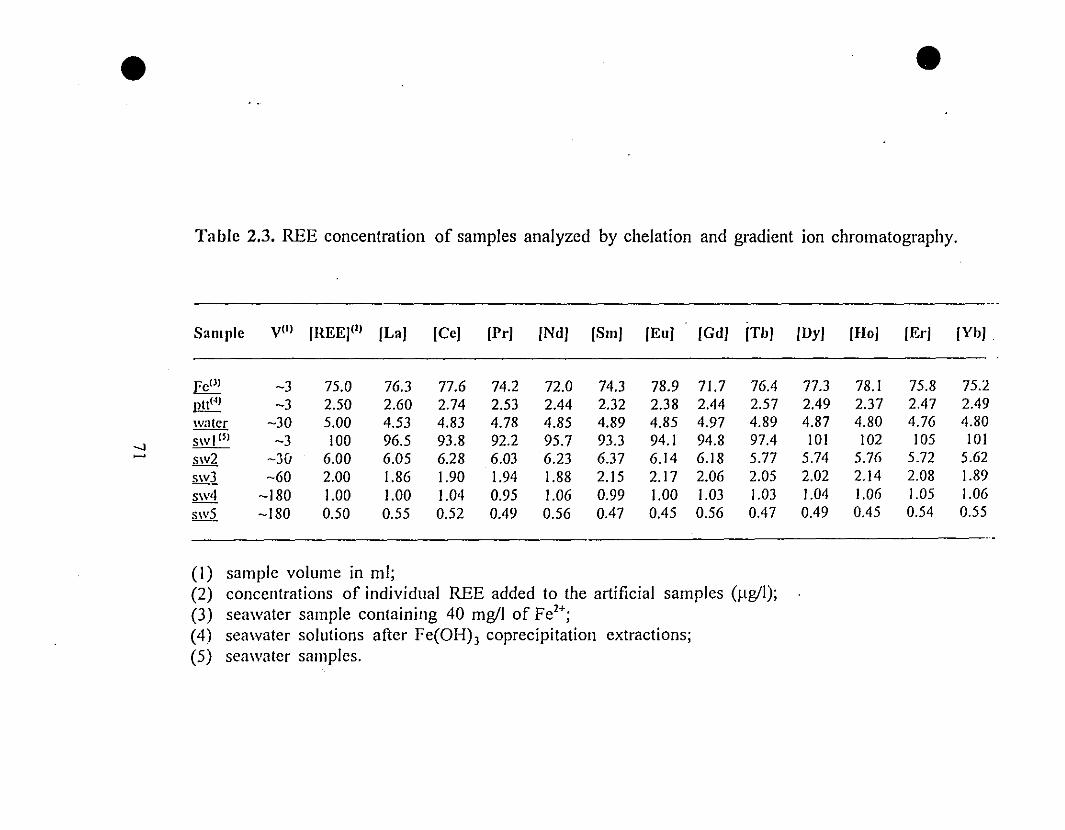
• •
Table 2.3. REE concentration of samples analyzed by chelation and gradient ion chromatography.
Sam pic VII) [REE)(') lLa) [Cc) [Pr) [Nd) [Sm) [Eu] [Gd) [Tb) (Dy) [Ho) (Er) [Yb} .
Fell) -3 75.0 76.3 77.6 74.2 72.0 74.3 78.9 71.7 76.4 77.3 78.1 75.8 75.2ptl!" -3 2.50 2.60 2.74 2.53 2.44 2.32 2.38 2.44 2.57 2.49 2.37 2.47 2.49wnler -30 5.00 4.53 4.83 4.78 4.85 4.89 4.85 4.97 4.89 4.87 4.80 4.76 4.80
-J5wl (5) -3 100 96.5 93.8 92.2 95.7 93.3 94.1 94.8 97.4 101 102 105 101
~ 5w2 -JO 6.00 6.05 6.28 6.03 6.23 6.37 6.14 6.18 5.77 5.74 5.76 5.72 5.625w3 -60 2.00 1.86 1.90 1.94 1.88 2.15 2.17 2.06 2.05 2.02 2.14 2.08 1.89sw4 -180 1.00 1.00 1.04 0.95 1.06 0.99 1.00 1.03 1.03 1.04 1.06 1.05 1.0651\'5 -180 0.50 0.55 0.52 0.49 0.56 0.47 0.45 0.56 0.47 0.49 0.45 0.54 0.55
(1) sampIe volume in ml;(2) concentrations of individual REE added to the artificial samples (J-lg/l);(3) seawater sample containing 40 mg/lof Fe2+;(4) seawater solutions after Fe(OH») coprecipitation extractions;(5) seawatcr samples.
•
•
close to the detection limits. Ir~ this study, samples with volumes ranging
from 3 ml to 180 ml were used and œsults indicated that quantitative
extractions were achieved (Table 2.3).
Future Efforts: The detection limit and allalytical preCISion of the
procedure were largely determined by tile detector. Solutions, after passing
through the ion chromatograph, were free from matrix interferences and REE
were isolated from each other or can be divided into sub-groups. These
sampIe solutions could be analyzed by other analytical techniques, such as
ICP-MS (or isotopic dilution ICP-MS) and INAA, that provide better
precision and 10wer detection limits for REE than the VDM used in this
study. Such combinations may provide more c;·,mvenient and reliable methods
for the routine analysis of REE in samples that traditionally require tedious
and undesirable manipulations such as metal extraction, matrix purification,
and instrumental matrix correction. Finally, it is worth no,i!1g that the
applicatiori of ion chromatography is not limited to the analysis of REE. In
some cases, it may provide a better alternative for the detennination of many
other anions and trace and ultra-trace metals.
72
•
•
2.4. ACK1'10WLEDGEMENTS
We are very grateful to Dionex" Corp. for providing us with unpublished
preliminary laborato;y results on the use of the HCl-ethanol eluent. W~ wish
to thank G. Keating at McGiIl University and S. Boyajian, P. Chang, J.
Grant, and K. Lin from Dionex" Corp., Canada for sharing th~ir expertise
and providing tech:1ical assistance. Special thanks are due to Dr. M. Harrold
ofDionex® Corp. at Sunnyvale, Califomia, for providing insightful comments
on an early draft of this manuscript. Financial support for this study was
provided by the National Sciences and Engineering Research Council of
Canada (NSERC) through equipment and operating grants to A.M., and by
the Ministère de l'Education du Québec through FCAR team and centre
(GEOTOP) grants.
73

•
•
2.5. REFERENCES
1 P. Henderson (Ed.), Rare Earth Element Geochcl1listr\', Elscvicr,
Amsterdam, 1984, 510p.
2 B.R. Lipin and G.A. McKay (Eds.) Geochel1listry and rVlineralogy ûf
Rare Earth Elements, Mincralogical Society of America, Reviews in
Mineraiogy, Vol.21, 1989, 348p.
3 J.L. Banner, G.N. Hanson and W.J. Meyers, J. Sediment. Petrol., 58
(1988) 415.
4 S.L. Dorobek and R.H. Filby, Bull. Cano Petrol. Geol.. 36 (1988) 202.
5 H.J.W. de Baar, C.R. German, H. Elderfield and P.V. Gaans, Geochil1l.
Cosmochim. Acta, 52 (1988) 1203.
6 Y.G. Liu, M.R.U. Miah and R.A. Schmitt, Geochim. Cosmochim. Acta,
52 (1988) 1361.
7 D.J. Piepgras and S.s. Jacobsen, Geochim. Cosmochim. Acta, 56 (1992)
1851.
8 J.G. Crock, F.E. Lichte and T.R. Wildeman, Chem. Geol., 45 (1984) 149.
9 1. Jarvis and K.E. Jarvis, Chem. Geol., 53 (1985) 335.
10 M.J. Greaves, H. Elderfield and G.P. Klinkhammer, Anal. Chim. Acta,
218 (1989) 265.
11 A.P. le Roex and R.T. Watkins, Chem. Geol., 88 (1990) 151.
12 S.S. Heberling, J.M. RivieJlo, M. Shifen and A.W. Ip, Res. Dev., 29
(1987) 74.
13 Dionexoo, Technical Note, 23 (1987) 4p.
14 Dionexoo, Technica1 Note, 25 (1990) 17p.
74
•
•
15 A. Siriraks, H.M. Kingston and J.M. Rivieilo, Anal. Chem., 62 (1990)
1185.
16 M.P. Harrold, A. Siriraks and J. Riviello, Pittsburgh Conference, New
Orleans, Louisiana, 1992.
17 J.S. Fritz and TA Rettig, Anal. Chem., 34 (1962) 1562.
18 J. Korkisch and S.S. Ahluwalia, Talanta, 14 (1967) 155.
19 F.W.E. Strelow, C.R. Van Zyl and C.J.C. Bothma, Anal. Chim. Acta,
45 (1969) 81.
20 Dionex"", unpublished work, 1991.
21 S. Zhong and A. Mucci, in preparation.
12 K.Lin, personal communication, 1991.
23 A.E. Martell and R.M. Smith, Critical Stability Constants. VoU: Amino
Acids, Plenum Press, NY., 1974, pp.367-370.
24 D.R. Kester, .LW. Duedall, D.N. Connors and R.M. Pytkowicz, Limnol.
Oceanogr., 12 (1967) 176.
75
•
•
CHAPT ER 3
Partitioning of Rare Earth Elements (REE) b(;tween Calcite and
Seawater Solutions at 25"C and 1 atm
S. Zhong and A. Mucci
Earth and Planetary Sei., McGill Univ. Montreal, PQ, Canada
ABSTRACT
The partitioning ofREE in calcite oV'~rgrowths precipitated from seawater
solutions under steady state conditions was investigated experimentally using
a constant addition technique. The steady state compositions of the
overgrowths and their parent solutions were detennined by chelation and
gradient ion chromatography (CGIC) and described using non-thennùdynamic
homogeneous partition coefficients. REE are strongly partitioned into calcite
and substitute for Caz+ in the crystal lattice. Their partition coefficients
decrease gradually with atomic number, from _103.4 for La3+ to ':""101.& for Yb3
+.
Under our experimental conditions, the partition coefficient of individual
. REE is not affected by the calcite precipitation rate, [Got] and Pcoz of the
solutions. Ce3+ was stable or metastable in our oxidizing solutions and was
believed to be incorporated in calcite as a trivalent ion since its partition
coef.:icient followed the general partitioning pattem of other REE. On the
other hand, we noticed that increases in the absolute concentrations of REE
or [REE]:[Caz+] ratio and the presence of Oz in solutionincrease REE
76
•
•
partition coefficients significnntly, especially for the light REE.
The partitioning behaviour of REE is closely related to the solubility of
their respective carbonate minerais. However, REE speciation in solution,
adsorption on the surface of calcite, and subsequent reactions Ce.g.,
dehydration) most likely participate in the partitioning process. The
compatibility of our experimental data with results obtained from field
studies suggests that partition coefficients derived from this study can serve
as a too: for the interpretation of environmental, diagenetic, and
paleoceanographic studies.
77
•
•
3.1 INTRODUCTION
Rare earth elements (REE) represent a spectnllll of elements lalOllIic
numbers: 57 to 71) which have the same number (3) and type of valence
electrons in ùleir outennost shell (GS"). They compensate for an increased
positive charge in the nucleus by filling the inne~ partia!ly occupied 4rsubshelI. It is because of this unique electronic configuration that REE
usually occur in nature as trivalent ions and have similar chemical properties.
They behave as a coherent group and appear together in most geological
environments and processes. On the other hand, their chemical properties are
not identical. There is a progressively stronger attraction between the growing
positive charge in the nucleus ~nd the increasing negative charge in the 4f
subshell across the REE series. Consequently, the size ofREE trivalent ions
shrinks smoothly with increasing atomic number; this is known as the
lantha,ide contraction. In tum, it is reflected in graduaI and systematic
variations in the fundamental chemical properties of REE with atomic
number. The unique systematics among REE allow them, as a group, to be
used as a particularly incisive tool in assessing relationships between their
geochemical behaviours and fundamental chcmical properties (e.g.,
Henderson, 1984; Taylor and McLennan, 1988; Lippin and McKay, 1989).
ln addition, two REE, Ce and Eu, can exhibit peculiar geochemical
behaviours due almost exclusively to their distinctive ability to adopt
different oxidation states in aqueous solutions. Under reducing conditions Eu
may assume a divalent state and Ce may exist as a highly insoluble
tetravalent ion in oxidizing environments. Distribution anomalies exhibited
78
•
•
by Eu and Ce in relation to o:i1er REE can, thereforc., be used to extract
infonnation conceming the redox and pH conditions of geological
environments (e.g., Brookins, 1983; 1989; Sverjensk)', 1984; Elderfield and
Sholkovitz, 1987; deBaar et al., 1988; Liu et al., 1988).
Carbonate mineraI~; are sorne of the most important components of
sediments and sedimentary rocks. They contain a variety of coprecipitates,
including REE, that refleçt the mode and environment oftheir formation and
subsequent alteration. Knowledge of the factors that control the incorporation
(Jf foreign ions in these minerais has widespread applications to the study of
paleo-environments and the pathways hy whieh diagenesis and lithification
occur (see Mucci and Morse, 1990 for a r~view). In 1ight of the unique
properties of REE, it is surprising that only very lirriite~ research efforts have-''':-,
been directed at understanding the incorporation of REr::-i~.carhon<!te .
mineraIs.
The incorporation of "foreign" metal ions 111 carbonate mineraIs
precipitated from a solution or melt can be described by a non
t:.ermodynamic partition coefficient. When the composition of the
precipitating solution, including the concentration(s) of coprecipitating
components, is kept constant throughout the growth process (i.e., steady
state), a compositionaIly-homogeneous precipuate is expected. Under these
conditions, the composition of the precipitate can be described by the
Henderson-Kracek (1927) (or homogeneous) partition coefficient (D):
79
•D =
(XM,)
XCC solid
([Me])[Ca] solin
(3.1 )
where X is the molar fraction of the coprecipitating foreign metal (Me) or
calcium (Ca) ion in the precipitate; [Me] and [Ca] are molar concentrations
of Me and Ca in the reacting soIutior·, resp'ectively. On the other hand. when
the composition of the reacting solution varies with time during precipitation
(i.e., non-stf~ady state), a heterogeneclus solid may be precipitated and the
Doerner-Hoskins (1925) (or heterogeneous) partition coefficient is llsed to
describ':: its composition:
D =t
(dMe)dCa solid
([Me]t)[Ca]t 1
sol n
(3.2)
•
where dMe and dCa are infinitesimal increments of Me and Ca precipitated
in the soIid from a solution which had Me and Ca concentrations of [Me],
and [Ca], at a time t of the precipitation (i.e., instantaneous correlation).
Because of the practicaI difficulties in obtaining dMe and dCa and their
corresponding instantaneous solution concentrations, Eqn. 3.2 is usually
integrated to:
80
•D = (3.3)
•
where subscripts i and f denote, respectively, initial and final solution
compositions. Although more practical, Eqn. 3.3 is valid only if the partition
coefficient (0) remains invariant throughout the precipitation reaction and no
recrystallization of the r'ecipitate takes place (Mucci and Morse, 1990).
Parekh et al. (1977) examined the distribution ofREE in the calcite phase
ofmarine limestones. The close simiJarity between REE distribution patterns
in calcite and normal seawater was interpreted to indicate that the
coprecipitation of REE with calcite occurred directly from seawater with no
. subsequent diagenetic redistribution. REE partition coefficients were
estimated according to Eqn. 3.1, assuming that the calcite was
compositionally homogeneous and precipitated from a seawater solution of
average North Atlantic Oeep Water composition (Hogdahl et al., 1968). The
estimated REE partition coefficients decreased gradually from about 1400 for
the Iightest REE, La, down to about 460 for the heaviest, Lu. They
postu!ated that fractionation among the REE series during coprecipitation
with calcite was controlled by REE complexation in seawater and t1leir
sorption at t1le minerai surface.
Scherer and Seitz (1980) estimated the REE partition coefficients III
81
•
•
Holocene and Pleistocene corals (aragonite) and their œments (!\lg-calcitd.
They also applied the Henderson-Kracek (1927) trace metal partitioning
model to the interpretation of their data, assuming that "average" l'<orth
Atlantic Deep Water was the precipitating fluid. ln contrast to Parekh et al.
(1977), their data suggested a relative heavy REE (HREE) enrichment in thc
Mg-calcite phase. They proposed that the coprecipitation of REE in Mg
calcite was n::>t an equilibrium process and that the re!a(ive HREE enrichmcnt
might be the result of oacterial activÎ1y.
Palmer (1985) investigated REE incorporation in foraminifera! calcite
.::ùJlected from Atlantic Ocean sediment core tops of variolls locations.
Similar to previous studies, the calcite lattice phase was assllmed
homogeneous and the Henderson-Kracek (1927) partition coefficient was
calculated between the lattice phase and a fluid with a composition
corresponding to average seawater collected from a depth of 100 m in the
Atlantic Ocean. They concluded that whereas the REE distribution pattem in
the surface authigenic Fe-Mn-rich coating was detennined by REF. speciation
in seawater, REE partition coefficients in the calcite lattice phase was
controlled by the similarity of the REE ionic radii to that of Ca" and the
solubility of REE carbonates. Their estimated REE partition coefficients in
calcite were about one order of magnitude lower than those reported by
Parekh et al. (1977) for calcite in marine limestones.
Unfortunately, natural carbonate mineraIs are rarely homogeneous.
Furtllennore, experimental investigations indicate that partitioning of foreign
82
•
•
metal ions in carbonate minerais during precipitation is often affected by
kinetic factors (see Mucci and Morse, ] 990 for review). In fact, Morse and
Bender (1990) pointed out that most of the trace element distribution
coefficients in calcite reported in the ]iterature are phenomenological
measurements of kinetic partition coefficients rather than thennodynamic
distri'Jution coefficients. In other words, panition coefficients genera1iy vary
with solution composition and/or reaction rate and pathways. Bt:'cause of the
uncertainties stated above and the complexity ofnatural environments, results
obtained from these field studies remained inconclusive. For these reasons,
we believed that an experimental investigation of REE partitioning in calcite
in a weil defined and controlled system was perhaps more likely to yield
c1early interpretable results and thus worthy of our efforts.
To the best of our knowledge, only one experimental st'Jdy has been
conducted to detennine the partitioning of REE in carbonate mineraIs and
identifY factors that influence this process. Terakado and Masucia (1988)
detennined the partition coefficients of REE between CaC03 (calcite and
aragonite) and simple aqueous solutions at room temperature (20 to 25°C)
using a fre:':-drift experimental technique. The composition of their reacting
solutions, including REE concentrations, and reaction rates changed
dramatically with time during precipitation. Partition coefficients were
calculated according to the Doemer and Hoskins (1925) model (Eqn. 3.3)
despite the fact that D was found to be depeIident on REE solution
concentrations (Terakado and Masuda, 1988). ln addition, carbonate
nucleation occurred in the eariy stages oftheir experiments and was followed
83
•
•
by crystal growth. It is most likely that REE partitioning was strongly
affected at different stages of a given precipitation experiment. Thercfore. the
interpretation of their experimental data is ambiguous and their applicability
to natural environments is profoundly limited. ln facto their results were one
to two oràers of magnitude lower than REE partition coefficients estimated
from field studies.
The major objective ofthis study is to determine the partition coet1icients
ofREE in calcite precipitated from seawater solutions under weil detïned and
strictly controlled laboratory conditions. While experimental conditions and
solution variables, inc1uding calcite precipitation rate (or calcite saturation
state and [Cot] in solution), redox potential (Eh), REE concentration, and
Pc02 (or pU and (BCO)"]) were kept constant throughout a given precipitation
reaction, they were systematically varied in order to detennine their influence
on REE partitioning in calcite.
84
•
•
3.2 EXPERIMENTAL METHODS
3.2.1 Material:
Artificial seawater with a salinity of 35 was prepared according to Kester
et al. (1967) with two modifications: it had a slightly higher calcium
concentration (10.55 instead of 10.28 mmol!kg-sw) and carbonic acid species
were temporarily withheld from the preparation. This seawater was stored in
a 20-litre NaIgenellO plastic container tor at least three months to reduce
soluble reactive phosphate concentrations. Phosphate ions are known to be
strong inhibitors of calcite precipitation reactions (Mucci, 1986; Burton and
Walter, 1990). Molybdate blue spectrophotometric analysis (Koroleff, 1976)
of the aged artificial seawater indicated that it was essentially phosphate-free
or contained less than 1.6 nmol!kg-sw of soluble reactive phosphate.
BakerOll "Instra-analyzed flux reagent" grade calcite, treated by the
procedure described by Mucci (1986), was used as seed material for the
calcite precipitation and REE coprecipitation experiments. The material has
a weil restricted size range (3-7 ).lm) as observed by scanning electron
microscopy (SEM) and a specifie reactive surface area of 0.52 m2/g as
detennined by the Kr-SET method (deKanel and Morse, 1979).
A REE spike solution was prepared by mixing and diluting concentrated
individual REE atomic absorption standard (1000 ).lg/ml) solutions (AldrichOll
lnc.). Twelve REE were included: lanthanum, cerium, praseodymium,
85
,:::-::---'-~-. ,
•
•
neodymium, samanum, europIUm, gadolinium, terbium, dysprosium.
holmium, erbium, and ytt~rbium. The spike solution contained 50.00 Ilg/m1
of each of the twelve individual REE.
Gases of known compositions were purchased commercially, slored in
high pressure gas cylinJers. Compositions used in this study inc1udcd:
0.033% CO:, 0.31 % CO:, 2.0% CO:, 30% CO:, 0.031 % CO: + 21 % 0:, and
0.031 % CO: + 0.000264% H:S. Ali gases were balanced by N:.
3.2.2 Calcite Precipitation and REE Coprecipitation:
A "constant-addition" experimental system, similar to the one described
by Zhong and Mucci (1993a) (or Chapter 1), was used to conduct calcite
precipitation and REE coprecipitatioll experiments (Fig. 3.1). It provided a
steady state environment for the calcite precipitation reactions (Zhong and
Mucci, 1993a). The system also kept the concentrations of coprecipitating
components (e.g., REE) constant in the reacting solution (Fig. 3.2) and
therefore, created and maintained a steady state environment for the
coprecipitation reactions. Under such conditions, the composition of the
precipitate, including the concentration ofthe coprecipitating components, are
expected to be invariant during the course of a given experimental run. Thus,
a homogeneous precipitate should be obtained.
Briefly, the system consisted of a reactor constructed from a modified
86

•
00-:J
pH e1ectrode
Gas Inlet
Stirrer 1 Gas Outlet
Sol'n Inlet.. 1
'J Glass FritGas Bubbler
PeristalticPump
G:;] __ IllPt.!1§9r!! __
•
Constant Temperature Bath
Fig. 3.1. Schematic diagram of the "constant addition" experimenlal
system.
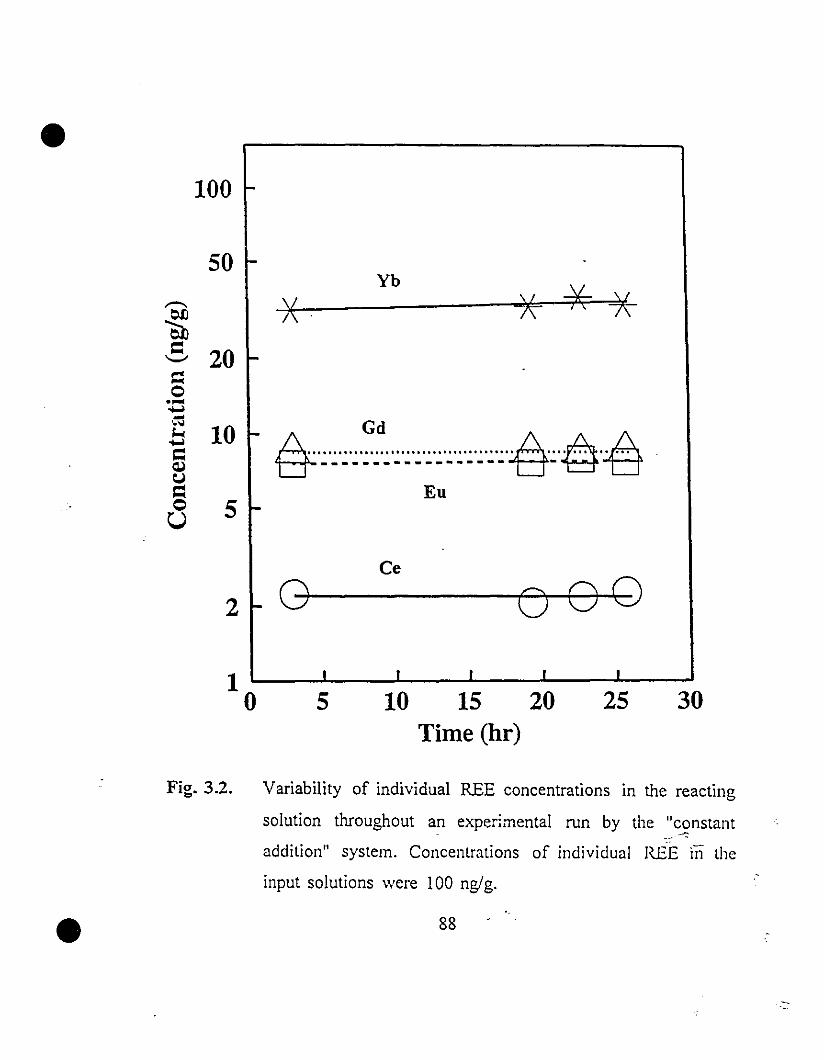
•100
Eu
GdA ::::.A.,:..A A~-------_._------ 1::t ~1::t
50-...
~5 201:o.-......,~
.b 10=Cl,)u=o 5U
x·Yb
**x
2 oCe
08 0
5 10 15 20Time (hr)
25 30
•
Fig. 3.2. Variability of individual REE concentrations in the reacting
solution throughout an experimental run by the "constant- ~.~
addition" system. Concentrations of individual REE in the
input solutions were 100 nglg.
88
•
•
2-litre Pyrex"" glass separatory funnel into which the reacting solution is
introduced by a peristaluc pump from a 2-litre NalgenellC narrow-mouth
plastic reservoir bottie. The input solution was delivered from the reservoir
to the reactor at a selected, constant rate by the pump using Tygon"" tubing.
A water-saturated gas mixture of known composition was introduced to the
reactor at a controlled rate through a glass frit titted at the bottom of the
separatory funnei. Bubbling of the gas through the reactor served to keep the
Pco2 and redox potential (Eh) of the reacting solution at d.esired and constant
values as weIl as maintaining the calcite solid seed material in suspension.
Mixing of the soIid, liquid, and gas phases in the reactor was further
.:nhanced by a Pyrex"" glass propeller driven by an overhead electric motor.
The temperature of the system was maintained at 25±loC by partly
immersing the reactor in a constant temperature bath.
Before eacl1. experimental run, the input solution was prepared by tirst
introducing two litres oftiltered (0.45 Ilm MiIIiporellC) carbonate-free artiticial
seawater to the reactor. Weighed amounts of Na2C03 and NaHC03 were
added to the seawater to obtain the desired calcite supersaturation after
equilibration with the gas phase. A precise quantity (:>;6 ml) of REE spike
solution was then added to the solution, foIIowed by a smaII and pre-
."- detennined volume of 10 wt.% of NaOH solution to neutralize the nitric acid" '
introduced with the REE spike solution. The introduction of the REE spike
and NaOH solutions had no measurable effect on the carbonate alkalinity and
salinity of the seawater solution. This seawater solution was aIIowed to
equilibrate \Vith the gas phase for at least two hours. pH measurements at ,the
89
•
•
end of the procedure confinned anainment of equilibrium between the
solution and the gas phase. REE complexation reactiong are also t"xpectcd to
reach equilibrium within this period (Cantrell and Byme. 1987). When gases
whose composition included 0" or H"S were used. the input solution.s were
allowed to equilibrate with the gas phase for at least 48 hours to cnsure that
possible redox reactions were at or close to equilibrium. Eh mcasurcments
indicated that the redox potential of the solution stabilized within 48 hours.
The solution was then transferred to the 2-litre plastic reservoir bottle. Calcite
precipitation and REE coprecipitation experimcnts were':;;:';; conductcd
according to the procedure described by Zhong and Mucci (1993a).
pH measurements were conducted usmg a combina~ion electrode
(Radiometer<lO GK2401C) connected to a pH/mV meter (Radiometer<lO M84).
The electrode was calibrated against three NBS (now NIST) buffer solutions
(pH of 6.838, 7.382, 9.180 at 25°C). Reproducibility of pH calibrations
çarried out before and after measurements of a single sample solution was
better than ±0.005 pH unit. In addition, a TRIS buffer solution in artificial
seawater (pH of 8.074 at 25°C and S=35, Hansson, 1973; or 8.067 according
to Millero, 1986) was used to evaluate liquid junction potential variations. pH
measurements on the TRIS buffer scale, when used with the appropriate
constants (Hansson, 1973; Millero, 1979), give an independent assessment of
the concentrations of carbonic acid species. Calcite saturation calculations
using the (wo sets of pH and constants agreed to within ±5% or better.
Results presented in this study were calculated from pH measurements and
carbonic acid apparent dissociation constants based on the NBS scale. Eh
90
•
•
measurements were conducted usmg a combination redox electrode
(Radiometer<lO PK1401), a platinum sensing element a:ld a caloIr.el reference
cell, calibrated against two Eh buffer solutions (Eh(SCE)=196 mV; Eh(sCE)=430
mV, Light, 1972).
At the end of the experiment, the input and the reacting solutions were
collected directly from the reservoir and reactor, respectively, using c1ean 60
ml B_D<IO syringes and immediately filtered through 0.45 !lm Millipore<lO
fiIters. Their total calcium concentrations and titration alkalinities were
determined by automated potentiometric titrations according to the procedures
described by Mucci (1986), with estimated precisions of better than ±O.5%
and ±O.4% (lcr), respectively. The rest of the reacting solution was vacuum
fiItered through a 0.45 !lm MilliporeClil filter. The filtrate was acidified with
4.0 M ultrapure HN03 to a pH between 1.5 and 2.0 and stored in 1-1itre
Nàlgene<lO plastic bottle. The REE concentrations in the filtered and acidified
reacting solutions were determined by chelation and gradient ion
chromatography (COle). A solution volume ranging from 3.0 ml to 200 ml
was injected directly into the COlC. The analytical procedure developed by
Zhong and Mucci (l993b) (or Chapter 2) has a detection limit of 10 to 20
ng and precision of ±5% (lcr). The filter residue (calcite seed plus
overgrowth) was rinsed with calcite-saturated water and air dried. A weighed
fraction of the solid was dissolved in dilute HN03 and REE concentrations
determined by COlC. [Sr·] and [Mg2.] in the reacting solution and in the
acid digested solid were analyzed by atomic absorption spectrophotometry
(AAS) whereas [Na·] was detennined by atomic emission spectrophotometry
91

• (AES), with estimated precisions of better than ±5%. +1%. and ±5% (1 cr).
respectively.
Calcite precipitation rates (R, /lm01 m·~hr·l) were calculated from the
difference in carbonate alkalinity (meq!kg-sw) between the input (Ac) al,d
reacting solutions (Ac,) and the addition rate of the input solution to the
reactor (1, kg-sw/hr). The rate was nonnalized to the initial reactive surface
area of the calcite seeds:
R = _I_(A_c_o _-.A_c_s_)x_S_OO_
S w:.ud(3.4)
where S is the specific reactive surface area and W,ccd is the weight of seed
introduced in the reactor. The amount of calcite overgrowth (Wovcrg" g) was
calculated according to:
(3.5)
where t is the duration (hr) of the experiment. The molar fractions (XMc) of
foreign metal ions in the overgrowths were calculate-d from their
concentrations in the weighed fraction of solid (seed plus overgrowth)
analyzed ([Me],olid' mollg), the amounts of calcite overgrowths, the seed
weights, and the molecular weight of calcite (M.Wc.lcil.):
[Me]solid M.Wcalclu (W....d + WOvtrg)
Wov.rg.
(3.6)
•In order to avoid discrete REE minerai precipitation, REE concentrations
92
• in solutions should be lower than the solubility of the least soluble REE
mineraI. In the absence of phosphate, the solubility of REE in our
experimental solutions is limited by the precipitation of carbonates (Byme
and Kim, 1993). The solubility products of REE carbonates, REElCÛ3)3,
increase gradually from 10-33.4 for La to 10-31.1 for Yb (Fig. 3.3) (Smith and
Martell, 1976). Since La;:(Cû3)3 is the least soluble among al! REE
carbonates, the equilibrium La3+ concentration in seawater will provide us
with an upper stability limit for the reacting solutions. Its value can be
estimated from the thennodynamic solubility product of LalC03)3 (KOsp=IO
33.4, Smith and Martel!, 1976\, estimates of the C03;:- total ion activity
~üefficient (YT=0.037, Morse and Mackenzie, 1990), molar fraction
(XF=[La3+]~[La3+h, Millero, 1992; Lee and Byme, 1993) and actlVlty
coefficient of free La3+ (rF-0.10, Millero, 1992) in our seawater solutions:
(3.7)
•
A minimum value of about ISO ng/g for [La3+h is obtained for seawater
solutions within the range of compositions covered in this study (i.e.,
2:5:0.:5:15 orO.OS:5:[CO/-]:5:0.63 mmol/kg-sw). Individual REE concentrations
in our seawater solutions should ideally be kept below this value. On the
other hand, we are also constrained by the detection limits of our analytical
technique. REE concentrations exceeding 0.5 ng/g are required for precise
measurements by COIC (Zhong and Mucci, 1993b).
93
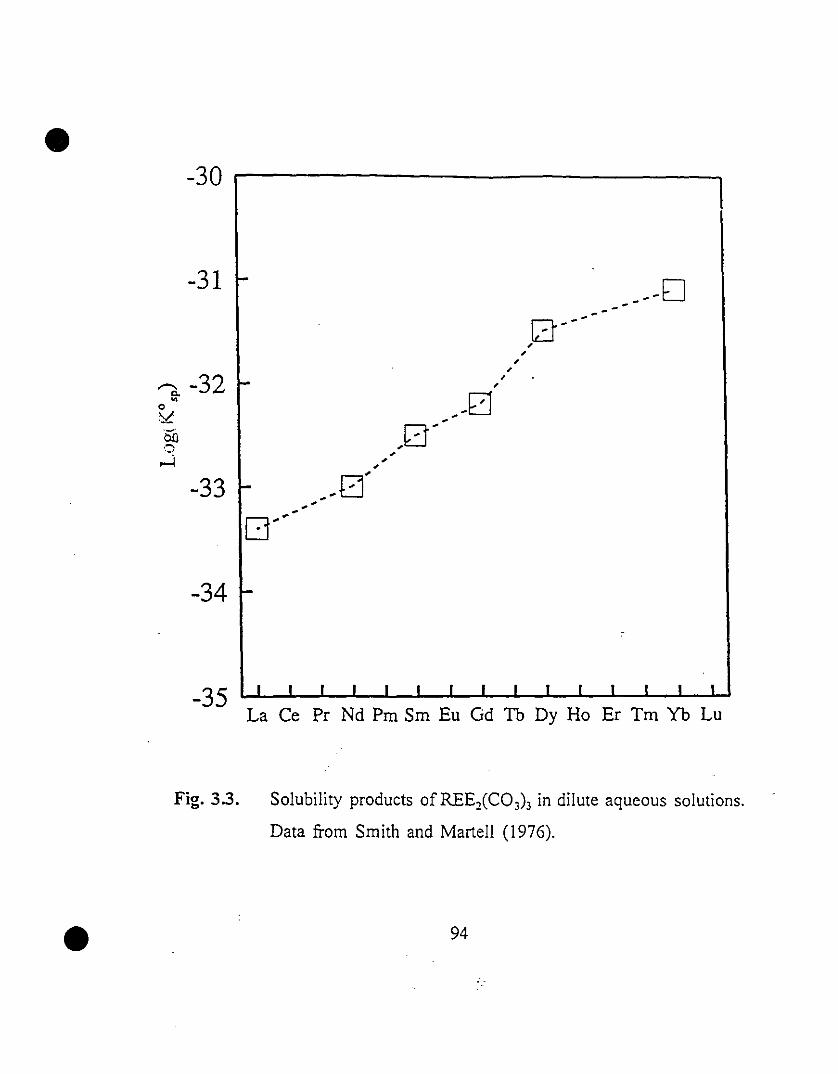
• -30 ~--------------.
-31 ~
0~~
,,,,,,
-34 1-
•
-35
Fig. 3.3.
III III 1 1 1 1 l , 1 l ,
La Ce Pr Nd Pm Sm Eu Gd Tb Dy Ho Er Tm Yb Lu
Solubility products of REE2(C0 3)3 in dilute aqueous solutions.
Data from Smith and Martel! (1976).
94
•
•
Results from previous field slUdies and our preliminary results indicated
that REE are strongly partitioned into calcite precipitates in seawater. Light
REE (LREE) partition coefficients in calcite exceed 10'. This implies that in
order to maintain the concentrations of individual REE in the precipitating
solution above the 0.5 nglg limit, the amount of calcite precipitated from a
unit volume of solution must be extremely smal!. On the other hand, the
amount of calcite precipitated ITom a unit volume of solution must be
quantifiabie (Eqns. 3.4 and 3.5) and thus requires that the difference in
alkalinity between the input and precipitating solutions (Aca-Ac,) be at least
one order of magEitude larger than the precision of the potentiometric
titration (±0.4%, 10'). The weight of calcite overgrowth is essential to
calculate the molar fractions of coprecipitated foreign metal ions (i.e., Eqn.
3.6).
ln summary, it is not possible to maintain the concentrations ofindividual
REE in the input solution below 180 nglg and those in the precipitating
solution above 0.5 ng/g, ifreliable estimates of the amount of overgrowth are
to be ~cquired. To overcome this dilemma, for each parameter investigated,
two ditferent sets of experiments were. conducted. In the tirst set, a large
mass of calcite seed material (5 grams) was used so that signiticant quantities
of calcite were precipitated from a unit volume of solution. Conseqllently,
aCCllrate detenninations of the amount of calcite overgrowth and precipitation
rate were obtained (hereafter reférred to as "5-g" type experiments). In the
second set, a smaller amollnt of seed material (0.6 gram) was introduced to
the reactor so that while accurate estimates of the amount of calcite
95
•
•
precipitated could not be obtained, individual REE in the final rcacting
solutions were not strongly depleted and accurate detenllinations of their
concentrations cOi.:ld be achieved (hereafter referred to as '0.6-g" type
experiments). Since absolute calcite precipitation rates are directly
proportional to the reactive surface areas and the two type of experiments
were condueted under nearly identieal conditions, rate data obtained from the
"5-g" type experiments were used to estimate calcite precipitation rates and
weights of overgrowths precipitated in the "0.6-g" type experiments at the
same degree of supersaturation. For both types of experiments, the input
solutions had equivalent individual REE concentratio'lS, which ranged iTom
40 to 150 ng/g.
Finally, because of uncertainties 111 the estimates of the solubility
pmducts of REE carbonates and the activity of REE ions in our solutions,
there was a possibility that sorne of our initial input solutions were
supersaturated. Ali input solutions, however, were indisputably stable.
Analyses of the solutions indicated that there was no CaC03 or REE
carbonate nucleation and precipitation in the input solutions stored in the
reservoir during the course of a ôven experiment. Apparently, even if the
input solutions were supersaturated with respect to REE carbonates, the
supersaturation states were not high enough to induce the nucleation of
solids. While minerai surface induced precipitation reactions occur in slightly
supersaturated solutions, nucleation requires much higher supersaturation
conditions to overcome the interfacial iTee energy barrier (Niel sen, 1964).
96
•
•
3.2.3 Sorption:
Parallel REE adsorption experiments were conducted in calcite
equilibrated seawater solutions to establish the importance of adsorption
reactions in the incorporation of REE during calcite precipitation. These
experiments also provided estimates of the importance ofREE adsorption by
the inner walls of the reactor. The experiments were perforrned in the
precipitation reactor filled with two litres of carbonate-free artificial seawater.
Agas containing 0.31 % CO2 in N2 was bubbled through the solutions at
25±1°C. The overhead electric stirrer was tumed on to ensure efficient
ll11xing and interaction between the gas and liquid phases. A weighed amount
of NaHC03 was added to the solution to saturate it with respect to calcite at
the experimental Pc02• After one hour, about 0.2 g of calcite seed material
was added and allowed to equilibrate with the solution for an additiona1 four
hours. This step was necessary to make sure that the seawater solution was
at, or very close to, equilibrium with calcite. 4.0 ml of the REE spike
sclution was then introduced to yield a seawater concentration of about 100
ng/g for each of the twelve individual REE. A pre-detennined volume of 10
wt.% of NaOH solution was added to neutralize the nitric acid introduced
with the REE spike solution. This REE-containing seawater solution was
allowed to equilibrate with the calcite solid and the gas phase for an
additional 15 hours and then filtered through a 0.45 l!m Millipore"'îilter. An
aliquot of the solution was collected, acidified with a few drops of 4.0 M
ultrapure HN03 to a pH of less than 2.0, and stored in 15-ml screw-cap
plastic tubes (SarstedtOt') for later REE analysis. The separatory funnel reactor
97

•
•
was washed with a dilute He' solution and carefully rinsed with deionized
water. The prepared solution was transferred back into tne reactor wherc gas
bubbling and stirring were resumed. After 1.5 hours. another sample of
solution \Vas collected and acidified before 0.6 g of calcite seed matcrial was
added to the reactor, initiating the sorption experiment. Aliquots were
collected at regular inte!'Vals using c1ean 60-ml B-D"" plastic syringes and
immediately filtered through 0.45 !-un Mi!1ipore<l\l filters. acidificd. and ston~d
for later analysis.
98
•
•
3.3 RESIJLTS AND DISCUSSIONS
3.3.1 REE Adsorption on Calcite:
Aliquots of solutions collected before and after they were in contact with
the reactor for 1.5 hours had almost identical REE concentrations. REE
adsorption by the inner walls of the glass reactor was insigriificant and thus
neglected in ail caiculations. The adsorption of REE by the calcite seed
material from calcite saturated seawater solutions was relatively slow and,
followed a sorption behaviour that has typically been documented for
divalent cations (e.g., Davis et al., 1987; Zachara et al., 1988): an initial
relatively fast uptake ofREE, followed by a slow adsorption, and eventually
reaching steady state or equilibrium conditions (Fig. 3.4). The adsorption of
REE by other mineraI surfaces (e.g., hydroxyapatite, goethite, vernadite) in
seawater at higher REE concentrations (250 Ilg/g) also displayed a similar
behaviour (Koeppenkas:::-op and De Carlo, 1992). Again, should our input
solutions be supersaturatcd with respect to REE carbonates, even the presence
of calcite seeds in solution failed to induce the nucleation or precipitation of
discrete REE carbonate mineraIs.
An adsorption coefficient (K), modified after Koeppenkastrop and De
Carlo (1992), was calculated from the steady state or equilibrium solution
concentration for each REE according to:
99
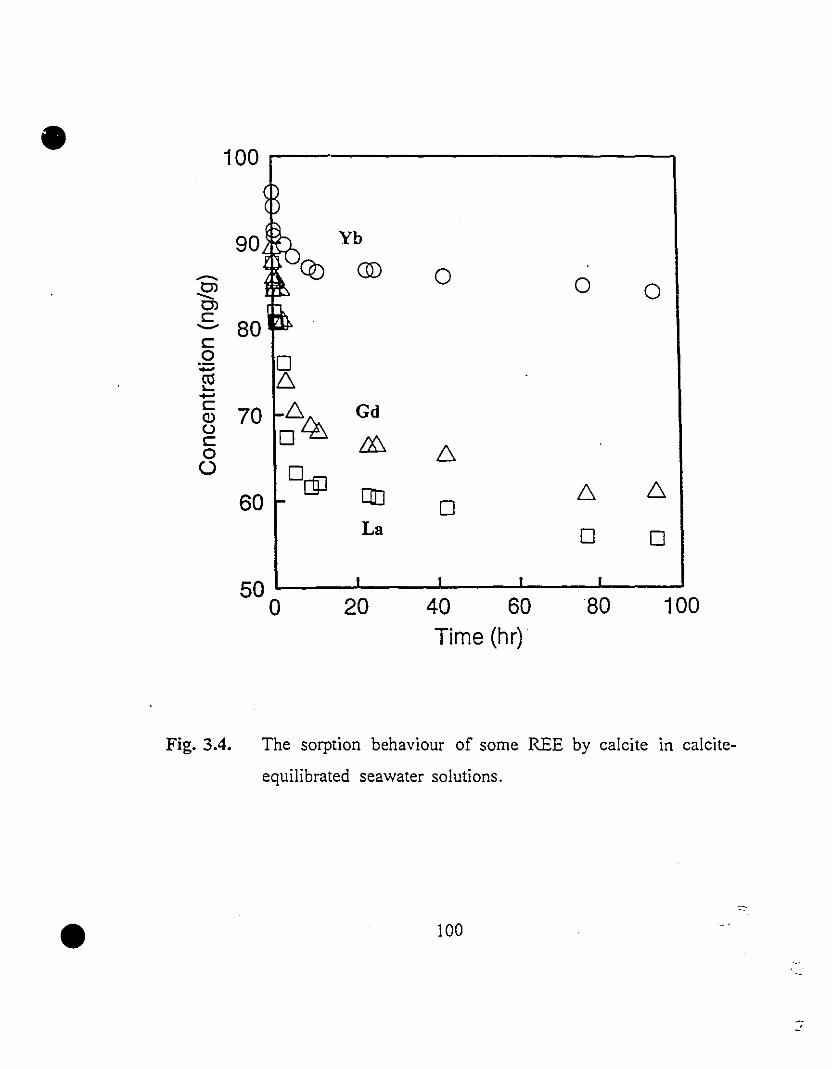
•
•
100 ...-_0 ---..,
90 Yb
........ CV CID 0 0~ 0Olc
80---c0 0-co 6-.....-c 70 g~
GdIDüC ~0ü 0cYJ
60 []J 6-0
La 0 0
5060 80 100a 20 40
Time (hr)
Fig. 3.4. The sorption behaviour of sorne REE by calcite in calcite
equilibrated seawater solutions.
100

• K=[REEJ.sw:rau<t.Lg m -2)
[REE1so/'n(llg g-l)(3.8)
•
where [REE]surracc is the concentration of individual REE at the calcite
surface. It is defined as the mass of individual REE adsorbed per unit of
calcite reactive surface area (m1). Results of REE adsorption coefficient
calculations are presented in Table 3.1. These results and the raIe of
adsorption on the partitioning of REE between calcite overgrowths and
seawater solutions will be discussed later in section 3.3.3.6.
3.3.2 Calcite Precipitation from Seawater:
3.3.2.1 REE Inhibition of Calcite Precipitation:
Terjesen et al. (1961) observed that some metal ions, inc1uding La3"
could significantly inhibit calcite precipitation reactions in aqueous solutions.
Their experimental data indicated that the effectiveness of metal ions as
inhibitors increases with decreasing. solubility of the metal carbonates. The
inhibitors were effective even at concentrations below 10-6 mollI. Data from
our"5-g" type experiments indicated that the calcite precipitation rate from
seawater was more sluggish in the presence of REE al identical calcite
saturation states. An empirical re1ationship was derived between the ratio of
the rates measured in the presence (RREE) and absence (R) of REE and the
total REE concentrations in solution Œ[REE]) (Fig. 3.5):
101
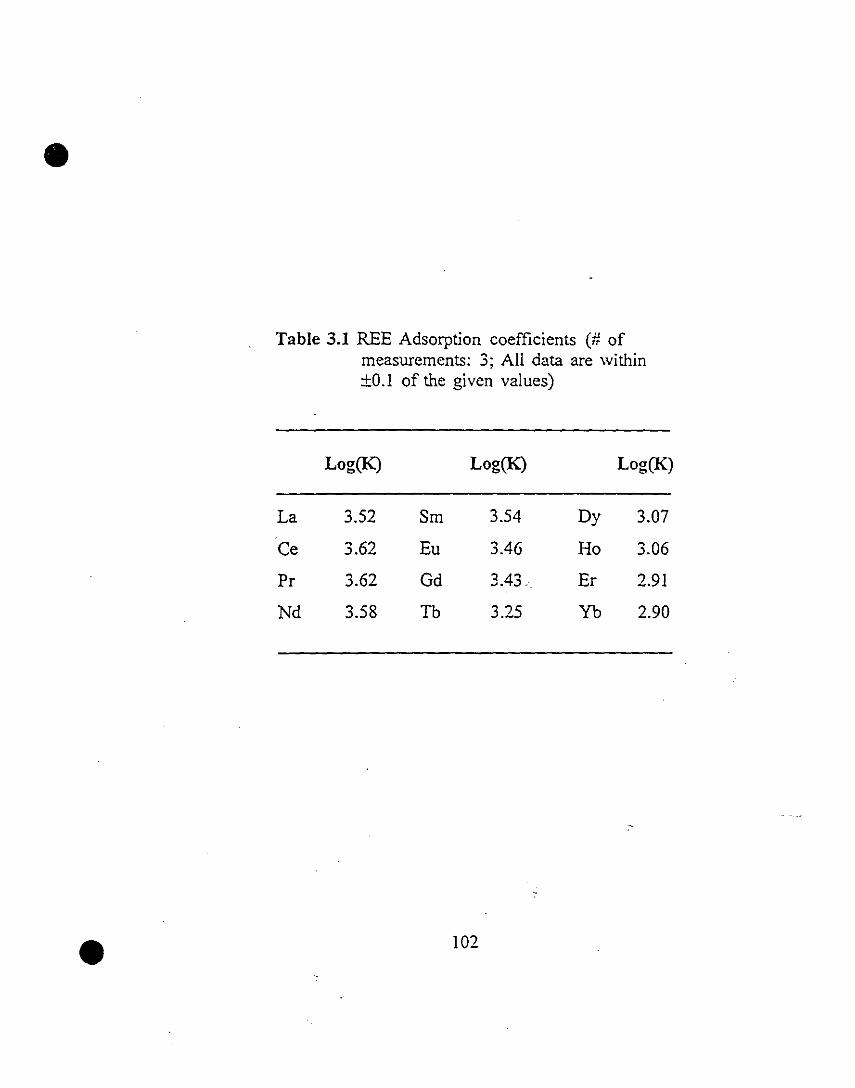
•
•
Table 3.1 REE Adsorption coefficients (# ofmeasurements: 3; Ail data are within±0.1 of the given values)
Log(K) Log(K) Log(K)
La 3.52 Sm 3.54 Dy 3.07
Ce 3.62 Eu 3.46 Ho 3.06
Pr 3.62 Gd 3.43 Er 2.91
Nd 3.58 Tb 3.25 Yb 2.90
102
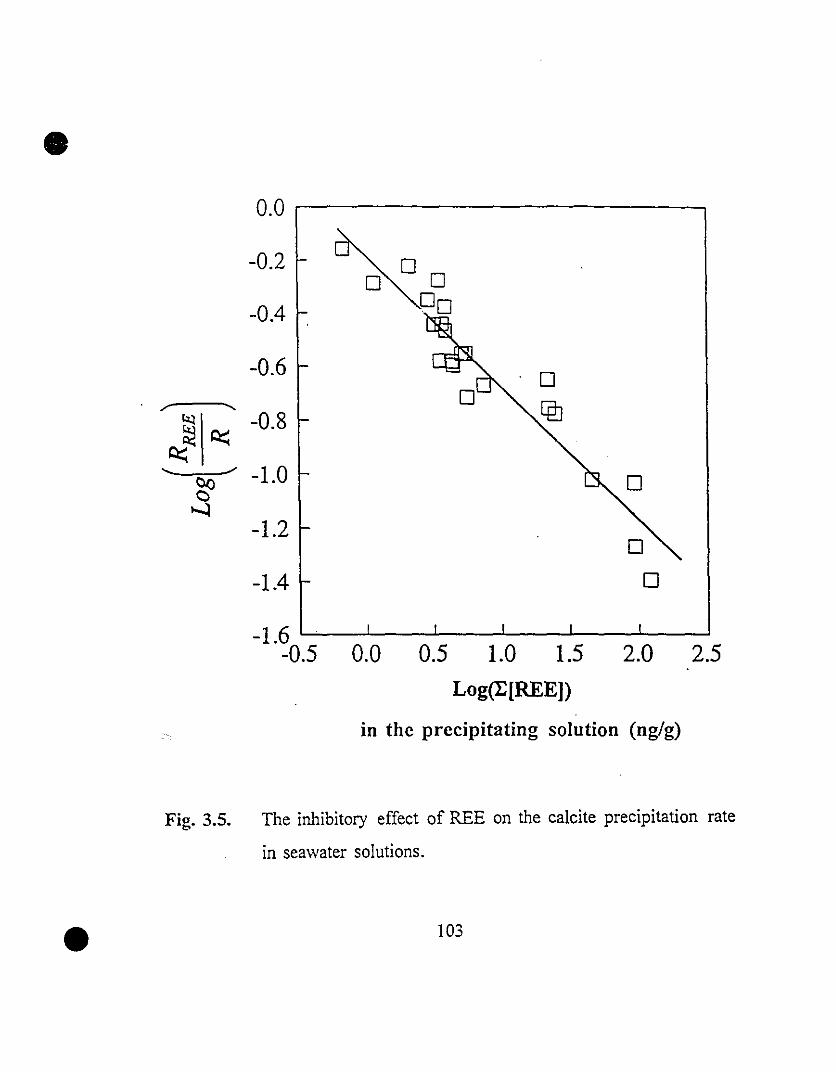
•0.0 r--------------,
-0.2
-0.4
-0.6
/" .......
t>:l -0 8e::..~ e::.. .
" ~./ -1.0
~
-1.2
-1.4
2.52.0-1.6 ~_-'--_...J.__ _ __'__ ___'__ ____''__----J
-0.5 0.0 0.5 1.0 1.5
Log(E[REE))
in the precipitating solution (ng/g)
Fig. 3.5. The inhibitory effect of REE on the calcite precipitation rate
in seawater solutions.
• 103
• Lo~R;:) = -(0.54±O.037) Log(E[REE]) - (O.12±O.12) (3.9)
Data on calcite precipitation rate in REE-free seawater solutions (R) arc
presented elsewhere (Zhong and Mucci, 1993a). The inhibitory effect of REE
on calcite precipitation reactions is further evidence of REE coprecipitation
in the calcite structure.
3.3.2.2 Amount of Calcite Overgrowth Precipitated:
For the "0.6-g" type experiment, the difference in the carbonate alkalinity
between the input and the reacting solutions at the end of the run (Ac,,-Ac,)
was usually small and close to the analytical error of the method (± 0.4%,
la). Consequently, it was not possible to accurately detennine the calcite
precipitation rate and the amount of calcite overgrowth using Eqns. 3.4 and
3.5. Alternatively, two independent methods were used to estimate the
amount of precipitate and the precipitation rate.
Calcite precipitation rates in REE-free artificial seawater solutions can be
calculated from their calcite saturation state (.0) according to the following
empirical rate law (Morse, 1983):
Log(R) = nLog(O -1) + Log(k) (3.10)
•where n is the empirical reaction order and k is the rate constant.
Experimental data obtained in REE-free seawater using a similar "constant
104
•
•
addition" system gave the following results: n=2.22±O.05 and
Log(k)=0.21±O.13 (Zhong and Mucci, 1993a). Rate estimates using the above
equation yield values with a relative precision of ±15% (1 cr). By combining
Eqns. 3.9 and 3.10, it is possible to estimate the calcite precipitation rate in
a REE-containing seawater solution from its il and I[REE). The amount of
calcite overgrowth can then be calculated from the precipitation rate and the
duration of the experiment. Errors involved in using this approach, however,
are expected to be relatively high since besides being derived from a limited
set of data, Eqn. 3.9 had to be extrapolated to higher I[REE] in order to
cover the range of REE concentrations investigated in the "0.6-g" type
experiments.
The second alternative takes advantage of the rate (Mucci and Morse,
1983; Mucci, 1986) and solution Pc02 (Hartley et al. 1992) independence of
the Mg2+ partition coefficient in calcite precipitated from seawater. Results
of this study also indicate that REE and the presence of H2S and O2 in
solution do not affect the Mg2+ partition coefficient (Fig. 3.6). Calcite
overgrowths precipitated from our "5-g" type experiments contained
7.00±O.41 mol% of MgC03. This corresponds to a Mg2+ partition coefficient
value of 0.015±O.001. Magnesium calcites of identical composition should
also precipitate from the "0.6-g" type experiments. Based on this assumption,
it is possible to estimate the amount of calcite overgrowth precipitated in a
"0.6-g" type experiment from the Mg2+ concentration ([Mg].olid) in the
weighed fraction of solid analyzed and the average v~lue of the Mg2+
partition coefficient (i.e., 0.015) applying Eqns. 3.1 and 3.6. Calcite
105

:O.i
• C N2/C0 2/H 2So N2/CO"0,036N2/02/C02
:.t...""~ 0,02
~ c8~ @fla 0 0 DO
0,01
0'OOO~----~10::------2~0-----3"'0----...J40
Calcite Precipitation Ràte (/lmol m-2hr-1)
0,04
o N/CÛ/H2S
0,03 o N/CÛ2
l:::,. N/û/Cû2..:;~ 0,02
0 O~l:::,.° ~arb 00
0,01 f-
8,0o,oo'=-----~----_'_----.......-----J6,0 6,S 7,0 7,5
LogCE[REE])In Calcite Overgrowths (ng/g)
•
Fig. 3.6 Constancy of the Mg2+ partition coefficient in calcite precipitatcd
from seawater as a function of (a) calcite precipitation rate and
(b) the total REE content of calcite overgrowths on "5-g" type
experimtnts.
106
•
•
precipitation rate can then be calculated from the amount of calcite
overgrowth and the duration of the experiment according to Eqns. 3.4 and
3.5. Accuracy ofthis estimation method was Iimited mostly by the analytical
precision of the Mg2' determination by AAS (±3%, 1a) and the uncertainty
in the value of the Mg2' partition coefficient (±7%, la).
We believe that Wovcrg. estimates obtained from the latter method are
likely to be more accurate than those calculated from the extrapolation of the
rate data. lt was chosen to estimate the weight of overgrowth and the rate of
precipitation of calcite for aIl the "0.6-g" type experiments. Overgrowth
weight estimates from the two methods yielded results that agreed to within
±100% )r better for the "0.6-g" type experiments.
3.3.3 REE Partitioning in Calcite:
3.3.3.1 Mode of REE Partitioning:
Foreign metal ions cO.n be incorporated in calcite through two principal
modes. They can substitute for Ca2+in the calcite crystal structure and form
dilute solid solutions. Mg2' incorporation in calcite is a typical example of
this mode (e.g., Mackenzie et al., 1983). They can also enter the crystal
structure at defect sites and exist as occlusions. Na+ ions are believed to exist
in such sites in calcite (e.g., Busenberg and Plummer, 1985). In addition,
sorne cations (e.g., Sr') can be found in both lattice and crystal defect sites
(Lorens, 1981; Pingitore and Eastman, 1986; Pingitore et al., 1992). In both
107
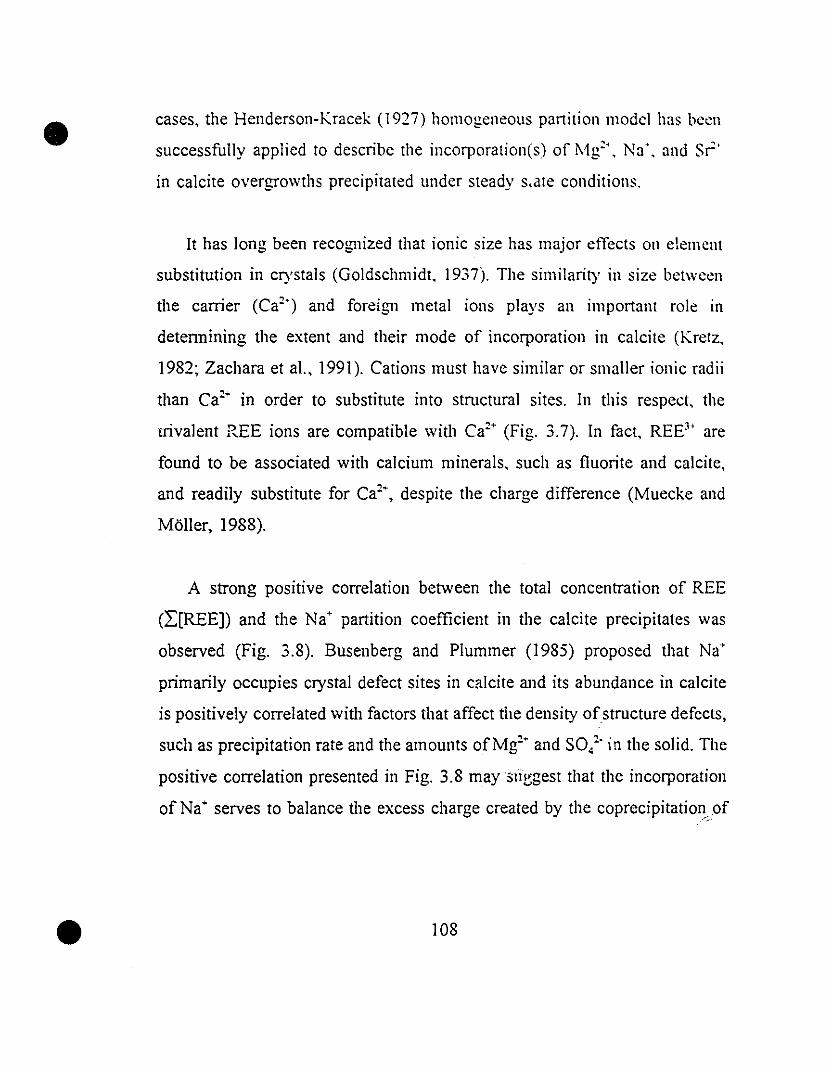
•
•
cases, the Henderson-Kracek (1927) homogeneous partition mode! has becn
successfully applied to describe the incorporation(s) of l\1g~', Na', and Sr'
in calcite overgrawths precipitated under steady s.ale conditions.
It has long been recognized that ionic size has major efTects on elemcnt
substitution in crystals (Goldschmidt, 1937). The similarit)' in size betwccn
the carrier (Ca"') and foreign metal ions plays an important raIe in
detennining the extent and their mode of incorporation in calcite (Kretz,
1982; Zachara et al., 1991). Cations must have similar or smaller ionic radii
than Cal + in order to substitute into stmctural sites. In this respect, the
trivalent REE ions are compatible with Ca"+ (Fig. 3.7). In fact, REE3' are
found to be associated with calcium mineraIs, such as fluonte and calcite,
and readily substitute for Ca"" despite the charge difference (Muecke and
MoIler, 1988).
A strong positive correlation between the total concentration of REE
(L[REE]) and the Na+ partition coefficient in the calcite precipitates was
observed (Fig. 3.8). Busenberg and Plummer (1985) proposed that Na'
primarily occupies crystal defect sites in calcite and its abundance in calcite
is positively correlated with factors that affect the density ofstmcture defects,
such as precipitation rate and the amounts ofMg"+ and sa/" in the solid. The
positive correlation presented in Fig. 3.8 maysll~gest that the incorporation
of Na+ serves to balance the excess charge created by the coprecipitatiol~9f
108
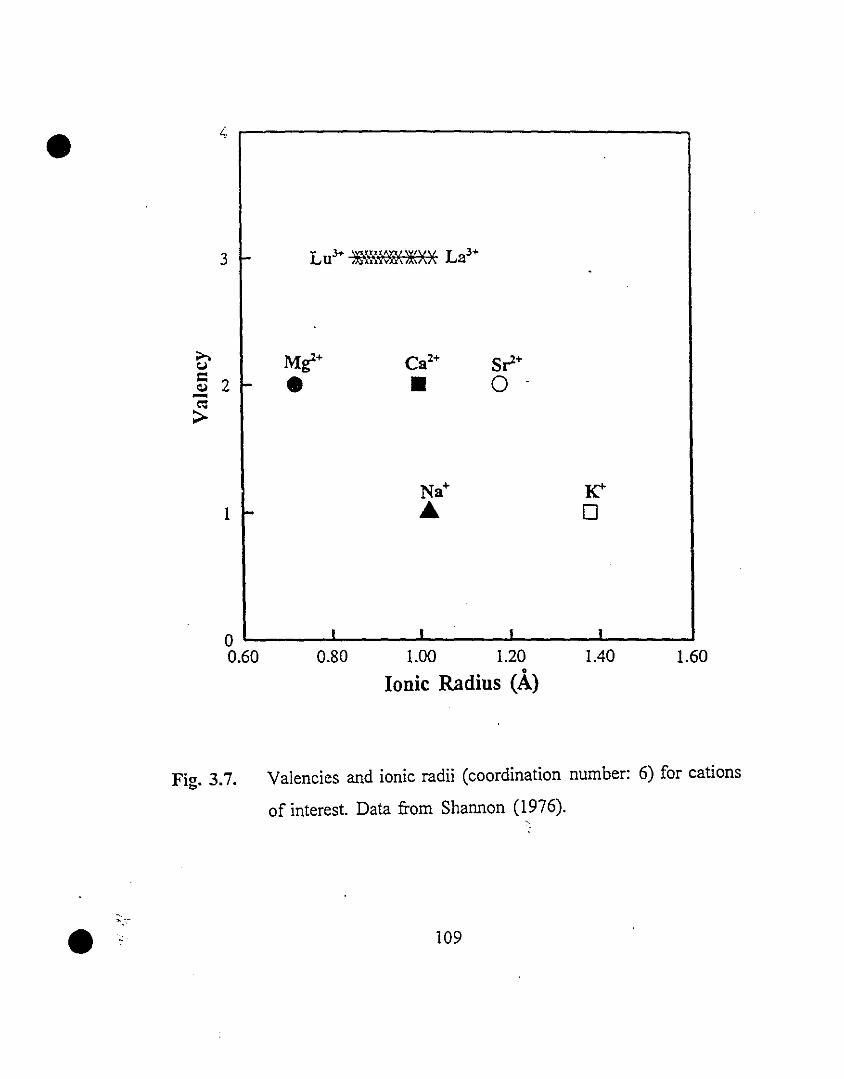
•
1
0.80 1.00 1.20o
Ionie Radius (A)
K'"o
1.40 1.60
• "',-,-
Fig. 3.7. Valencies and ionic radii (coordination number: 6) for cations
of interest. Data from Shannon (1976).,
109
•-1.0
~zê -2.0eJlo~
-3.0
6.0 7.0
Log(E[REE])
8.0
•
in calcite overgrowths (ng/g)
Fig. 3.8. Na+ partition coefficients as a function of the total REE
content in calcite overgrowths precipitated from seawater
solutions.
110
•
•
REE in calcite. If REE substitute for Ca1- in the calcite structure, a cationic
site must be created which either remains vacant or is occupied by Na·. The
charge imbalance created by the incorporation of REE may also cause an
increase in the crystal defect density and thus an increase in the amount of
Na· incorporated.
3.3.3.2 The Influence of Precipitation Rate or [CO/-j:
REE partition coefficients obtained from calcite precipitation in seawater
solutions of constant Pc01 (0.031 atm) and a narrow range of individual REE
concentrations <I[REE]: 270 to 350 ng/g) appear to be independent of the
precipitation rate (Table 3.2; Fig. 3.9). However, it must be emphasized that
the range of precipitation rates investigated in this study was limited (1 to 20
).lmol m-1 hr-!). This corresponds to calcite saturation states from 3.5 to 15 or
cot concentrations from 0.15 to 0.63 mmollkg-sw. Further experimental
studies over a wider range of precipitation rates, perhaps by lowering REE
concentration in solution, will be required before a generalization of our
observation can be validated. Nevertheless, the lack of an apparent calcite
precipitation rate dependency reinforces the hypothesis that REE substitute
for Ca1• in calcite lattice sites. The partition coefficient of Sr· in calcite
shows a strong correlation with precipitation rate when the incorporation
occurs at crystal defect sites, but such a correlation becomes ambiguous when
the principal mode of coprecipitation is dominated by Ca1• -substitution at
lattice sites (Lorens, 1981; Pingitore and Eastman, 1986; Pingitore et al.,
1992).
111
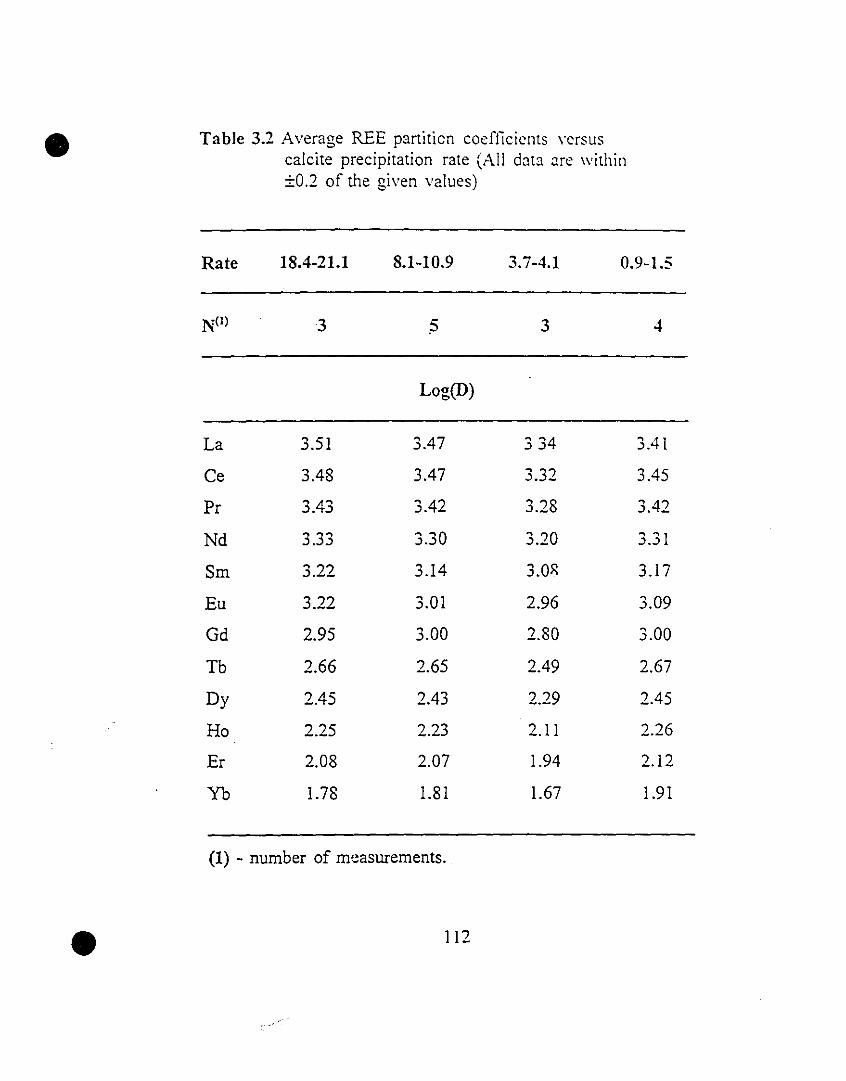
• Table 3.2 Average REE partiticn coefiicicnts versuscalcite precipitation rate (Ali data are within±0.2 of the given values)
Rate 18.4-21.1
3
8.1-10.9 3.7-4.1
3
0.9-1.5
4
•
Log(D)
La 3.51 3.47 334 3.41
Ce 3.48 3.47 ~ 3" 3.45,). -Pr 3.43 3.42 ~ "8 3.42,).-
Nd 3.33 3.30 ~ "0 3.31,).-
Sm 3.22 3.14 3.0~ 3.17
Eu 3.22 3.01 2.96 3.09
Gd 2.95 3.00 2.80 3.00
Tb 2.66 " 6- 2.49 2.67_. :>
Dy " 4- 2.43 2.29 2.45-. :>
Ho 2.25 2.23 2.11 2.26
Er 2.08 2.07 1.94 2.12
Yb 1.78 1.81 1.67 1.91
(1) - number of m'~asurements.
112
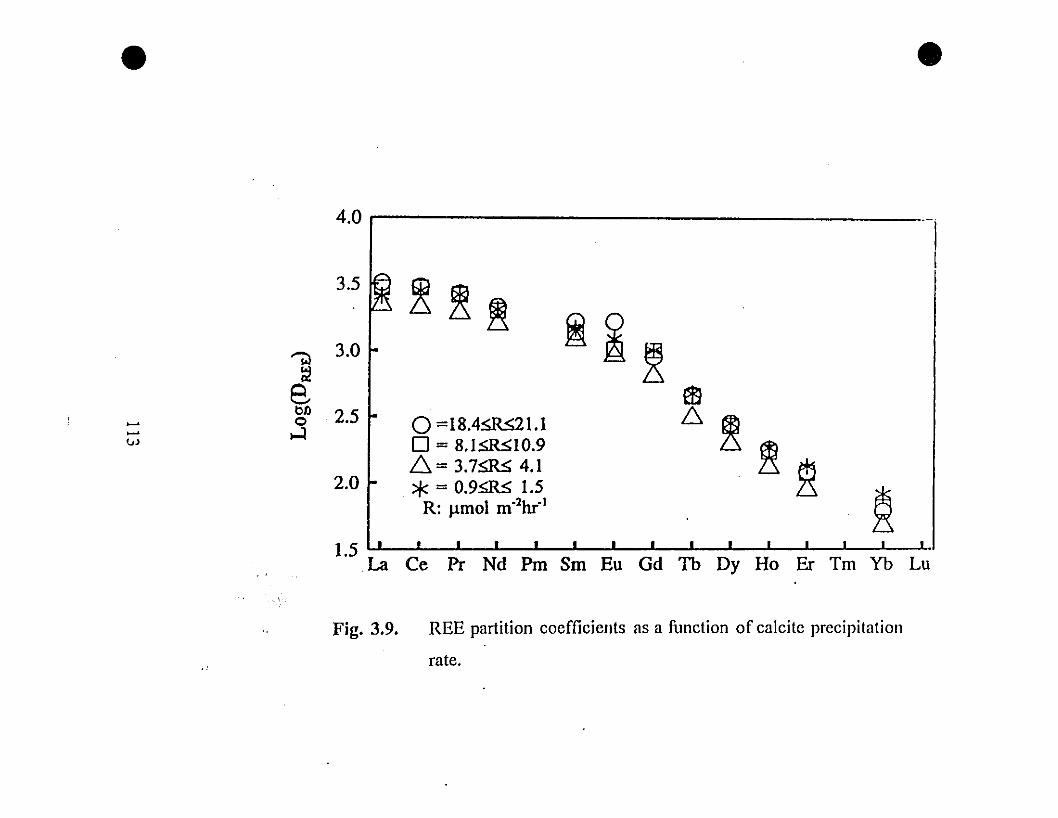
• •
4.0 ri--------------------~
3.5 Itl ~ ~ ~
~~~'ï:l 3.0::!
B mcil 2.5
62~ 0 O=18.4~I.l~ ...:luJ o = 8.1~IO.9
6= 3.7~ 4.1. ~ ~2.0 1- *=O.9~ 1.5
~R: Jlmol m·2hr-1
1
1.5.La Ce Pr Nd Pm Sm Eu Gd Tb Dy Ho Er Tm Yb Lu
Fig. 3.9. REE partition coefficients as a function of calcite precipitation
rate.
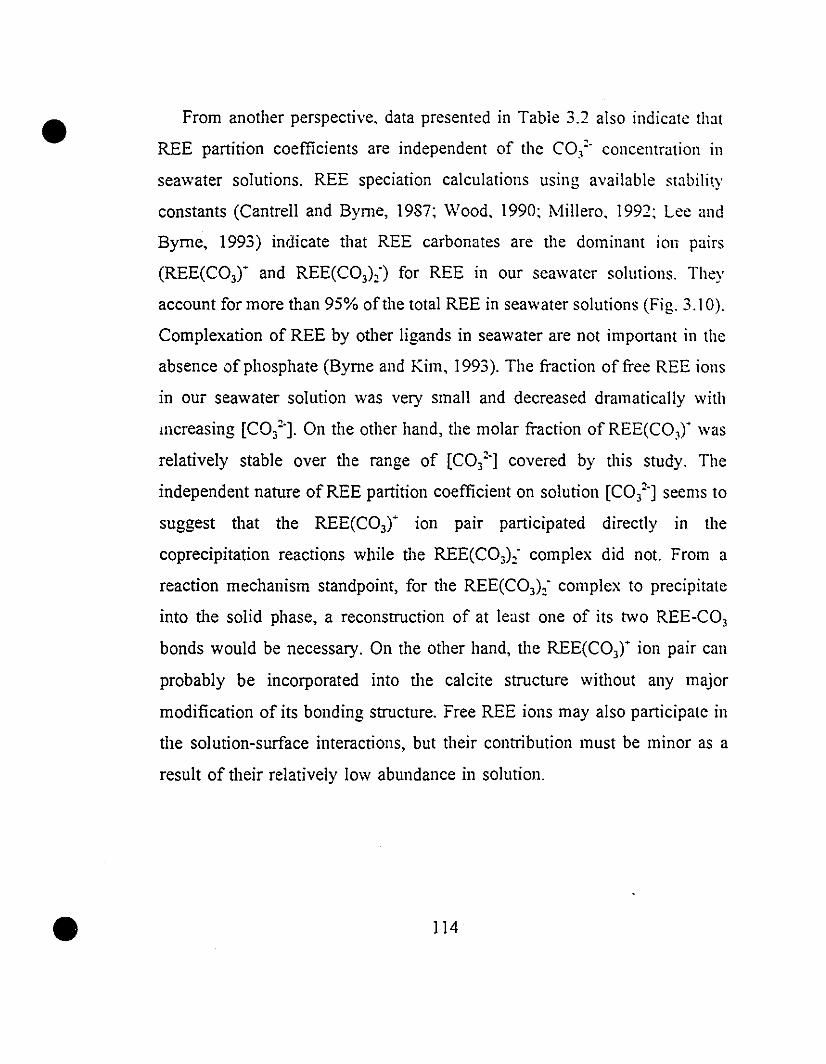
•
•
From another perspective. data presented in Table 3.2 also indicate that
REE partition coefficients are independent of the CO/, concentration in
seawater solutions. REE speciation calculations using available stability
constants (Cantrell and Byme, 1987; Wood, 1990; Millero, 1992; Lee and
Byrne, 1993) indicate that REE carbonates are the dominant ion pairs
(REE(C03f and REE(C03)2') for REE in our seawater solutions. They
account for more than 95% of the total REE in seawater solutions (Fig. 3.10).
Complexation of REE by other ligands in seawater are not important in the
absence of phosphate (Byme and Kim, 1993). The fraction of free REE ions
in OUi seawater solution was very small and decreased dramatically with
JI1creasing [Cot]. On the other hand, the molar fraction of REE(CO,f was
relatively stable over the range of [CO/] covered by this study. The
independent nature of REE partition coefficient on solution [CO/] seems to
suggest that the REE(C03f ion pair participated directly in the
coprecipitation reactions while the REE(C03)2' complex did not. From a
reaction mechanism standpoint, for the REE(C03)2' complex to precipitate
into the solid phase, a reconstruction of at least one of its two REE-CO,
bonds would be necessary. On the other hand, the REE(C03f ion pair can
probably be incorporated into the calcite structure without any major
modification of its bonding structure. Free REE ions may also participate in
the solution-surface interactions, but their contribution must be minor as a
result of their relatively low abundance in solution.
114
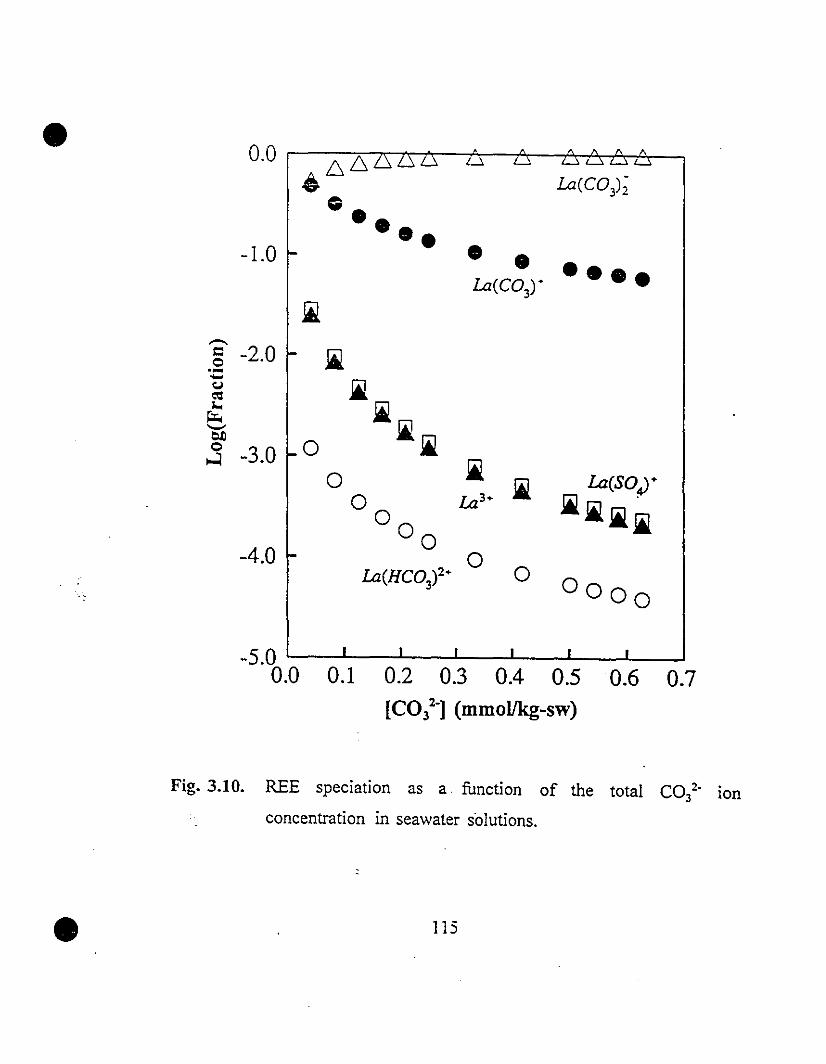
• 0.0 66 ~• La(C03);
G •
-1.0 ••• • • ••••La(C03
) +
~..-..c -2.0 ~0.-.....
i.(,,1
eo:l.o
.ii.r...'-'0Jl
0 .i0 -3.0..:l j,0
*La(s0,J+
00
La3+i.i.j,~
00-4.0 0
0La(HC03
)2+00 00
-5.0 L----I'----L_--'-_~_...L.__ _ _L__.J
0.0 0.1 0.2 0.3 0.4 0.5 0.6 0.7[CotI (mmollkg-sw)
•
Fig. 3.10. REE speciation as a. function of the total C03
2• ion
concentration in seawater solutions.
115
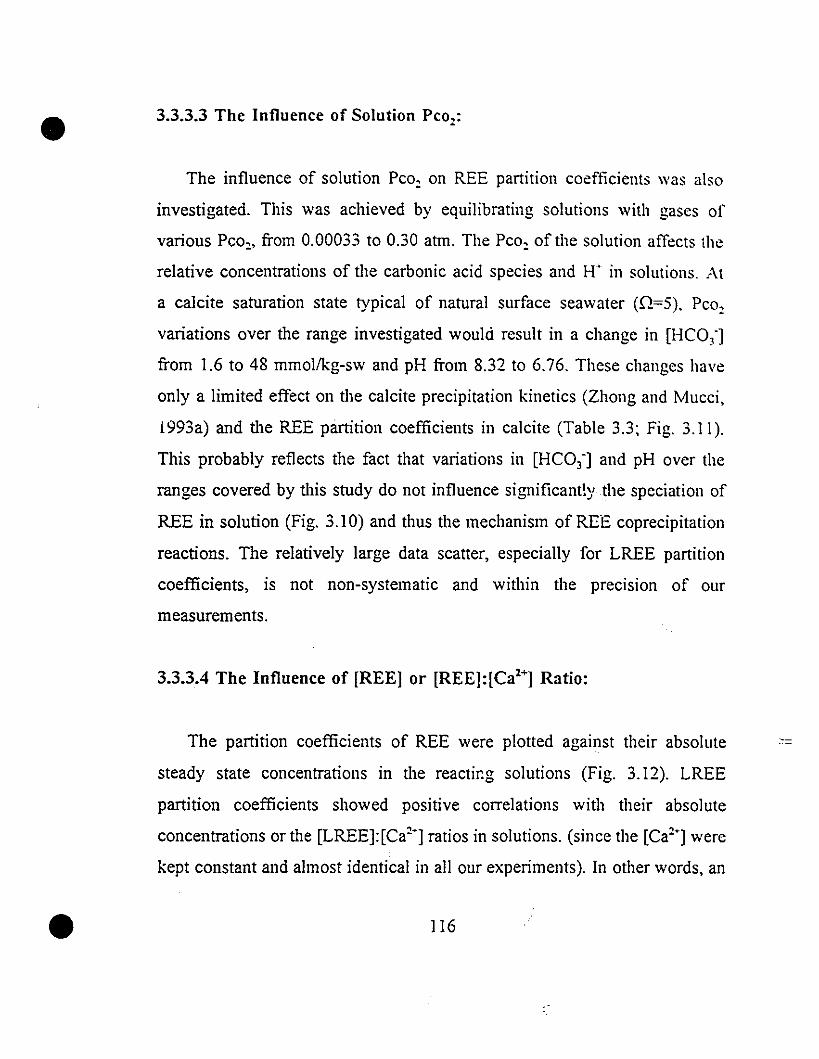
•
•
3.3.3.3 The Influence of Solution Pco~:
The influence of solution Pc02 on REE partition coefficients \Vas also
investigated. This was achieved by equilibrating solutions with gases of
various PC02, from 0.00033 to 0.30 atm. The Pc02of the solution affects the
relative concentrations of the carbonic acid species and H+ in solutions. At
a calcite saturation state typical of natural surface seawater (Q=5), Pc02
variations over the range investigated would result in a change in [HCO)']
from 1.6 to 48 mmol/kg-sw and pH from 8.32 to 6.76. These changes have
only a limited effect on the calcite precipitation kinetics (Zhong and Mucci,
1993a) and the REE partition coefficients in calcite (Table 3.3; Fig. 3.11).
This probably reflects the fact that variations in [HCO]'] and pH over the
ranges covered by this study do not influence significant!ythe speciation of
REE in solution (Fig. 3.10) and thus the mechanism of REE coprecipitation
reactions. The relatively large data scatter, especially for LREE partition
coefficients, is not non-systematic and within the precision of our
measurements.
3.3.3.4 The Influence of [REE] or [REE]:[Ca2+] Ratio:
The partition coefficients of REE were plotted against their absolute
steady state concentrations in the reactiJ:g solutions (Fig. 3.12). LREE
partition coefficients showed positive correlations with their absolute
concentrations or the [LREE]:[Ca2'] ratios in solutions. (since the [Ca2+] were
kept constant and almost identical in ail our experiments). In other words, an
116
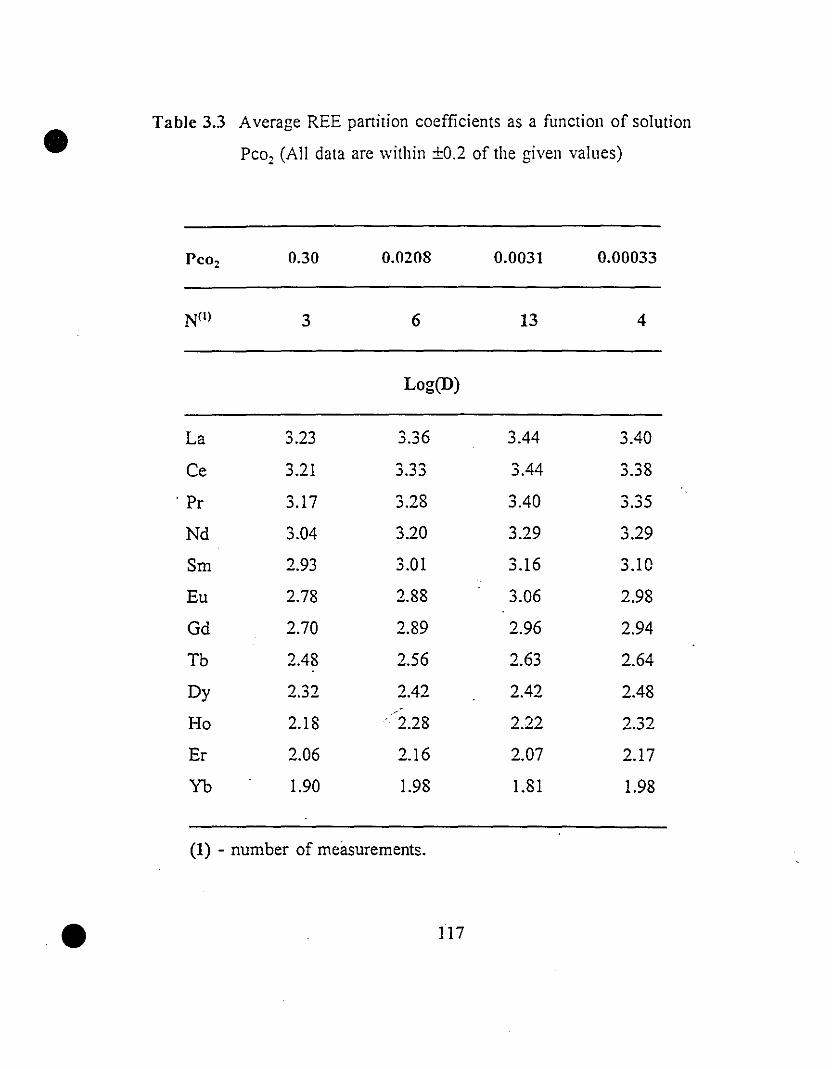
• Table 3.3 Average REE partition coefficients as a function of solution
Pcoz (AlI data are within ±0.2 of the given values)
PCOz 0.30
3
0.0208
6
0.0031
13
0.00033
4
•
Log(D)
La 3.23 ~ ~6 3.44 3.40.J •.J
Ce 3.21 ~ 3~ 3.44 ~ ~8.J. .J .J •.J
, Pr 3.17 ~ ?8 3.40 ~ ~5.J._ .J •.J
Nd 3.04 3.20 3.29 3.29
Sm 2.93 3.01 3.16 3.10
Eu 2.78 2.88 3.06 2.98
Gd 2.70 2.89 2.96 2.94
Tb 2.48 2.56 2.63 2.64
Dy 2.32 2.42 2.42 2.48
Ho 2.18 '2.28 2.22 2.32
Er 2.06 2.16 2.07 2.17
Yb 1.90 1.98 1.81 1.98
(1) - number of meàsurements.
117
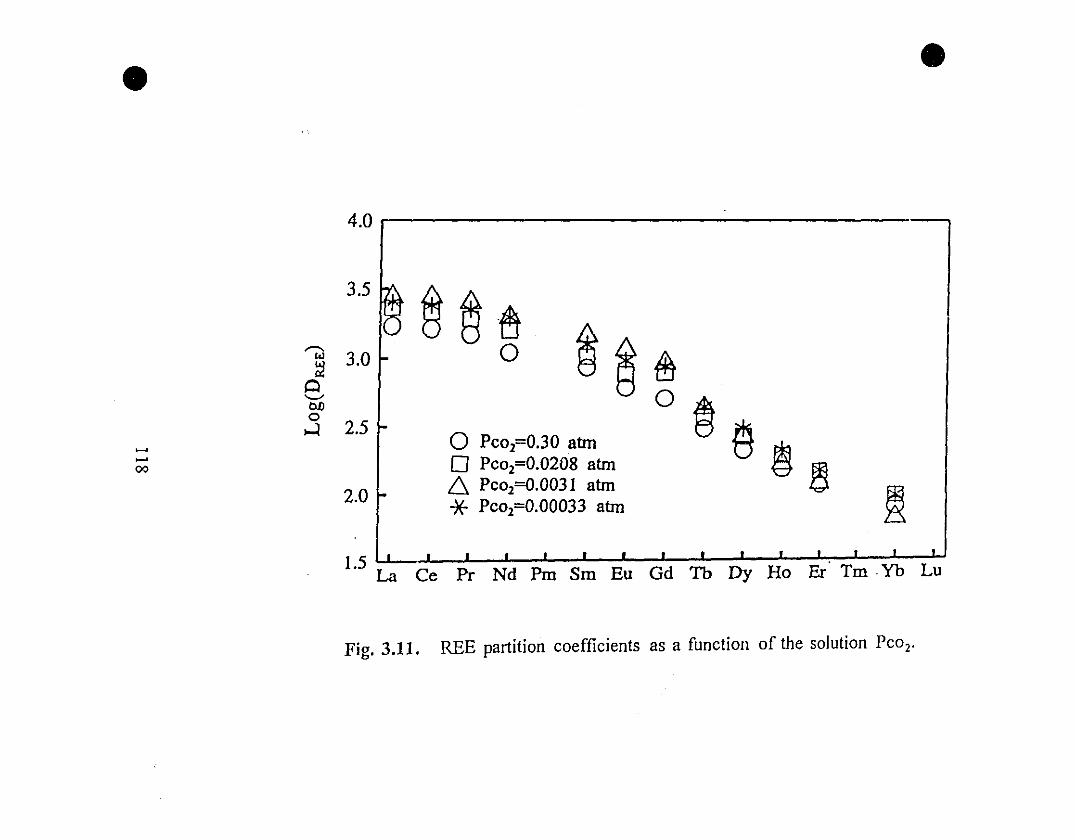
• •
4.0 1 ---,
3.5~ § ~e,-...
3.0 a ~ ~ ~'"~Cl'-"
a PcorO.30 atm a ~ è ~O/J0
2.5...:l~
~
00 o Pco2=O.02D8 atm ~
2.0 6. Pco2=O·0031 atm
~*Pco2=O.00033 atm
1.5 '. 11 1 1 1 1 1 1 1 1 1 , 1 , ,
La Ce Pr Nd Pm Sm Eu Gd Tb Dy Ho Er· Tm Yb Lu
Fig. 3.11. REE partition coefficients as a function of the solution Pco2•
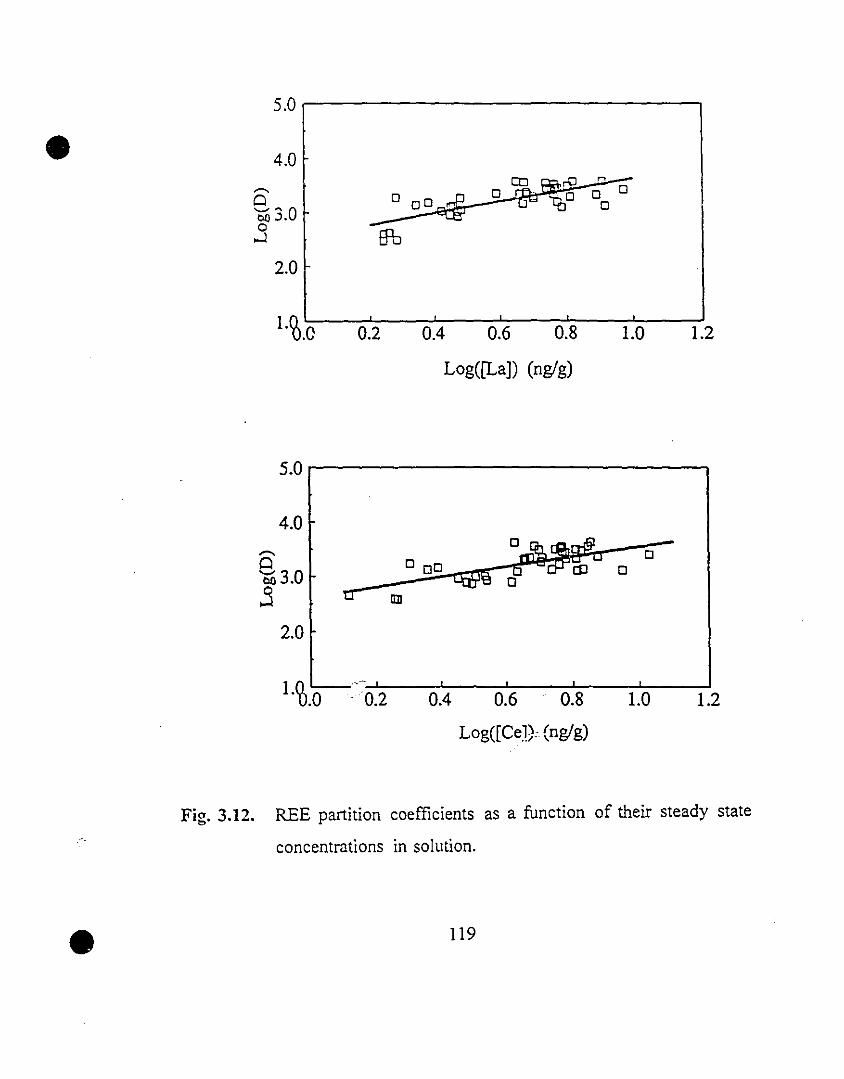
•5.0,-------------------.
4.0 f-
2.0
l.~.c 0.2.
0.4,
0.6 0.8 1.0 1.2
Log((La)) (ng/g)
5.0,-----------------.
4.0
'"'Cl'ëO 3.0.5
2.0
D-
•
1 0 '---.,~_'___ _'__ __'___'____ _'___ __l
.D.O 0.2 0.4 0.6 0.8 1.0 1.2
Log([Ce))c (ng/g)
Fig. 3.12. REE partition coefficients as a function of their steady state
concentrations in solution.
119
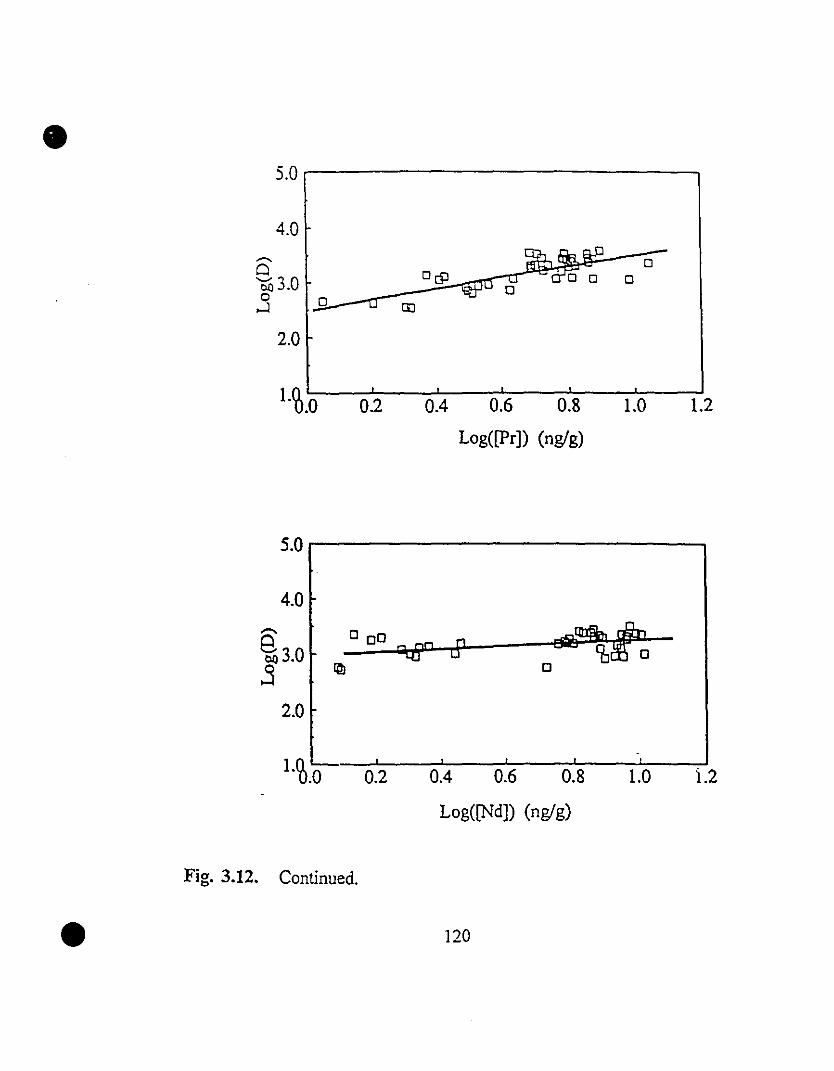
• 5.0 ,------------------,
4.0
2.0
DQJ~ 00
_120 --':Or-;:;;oo--
1.~.o 0.2 0.4 0.6 0.8
Log([pr]) (nglg)
1.0 1.2
5.0 ,.-----------------,
4.0
§et) 3.0j
2.0
1.~.o 0.2 0.4 0.6 0.8 1.0 1.2
•Fig. 3.12. Continued.
Log([Nd]) (nglg)
120
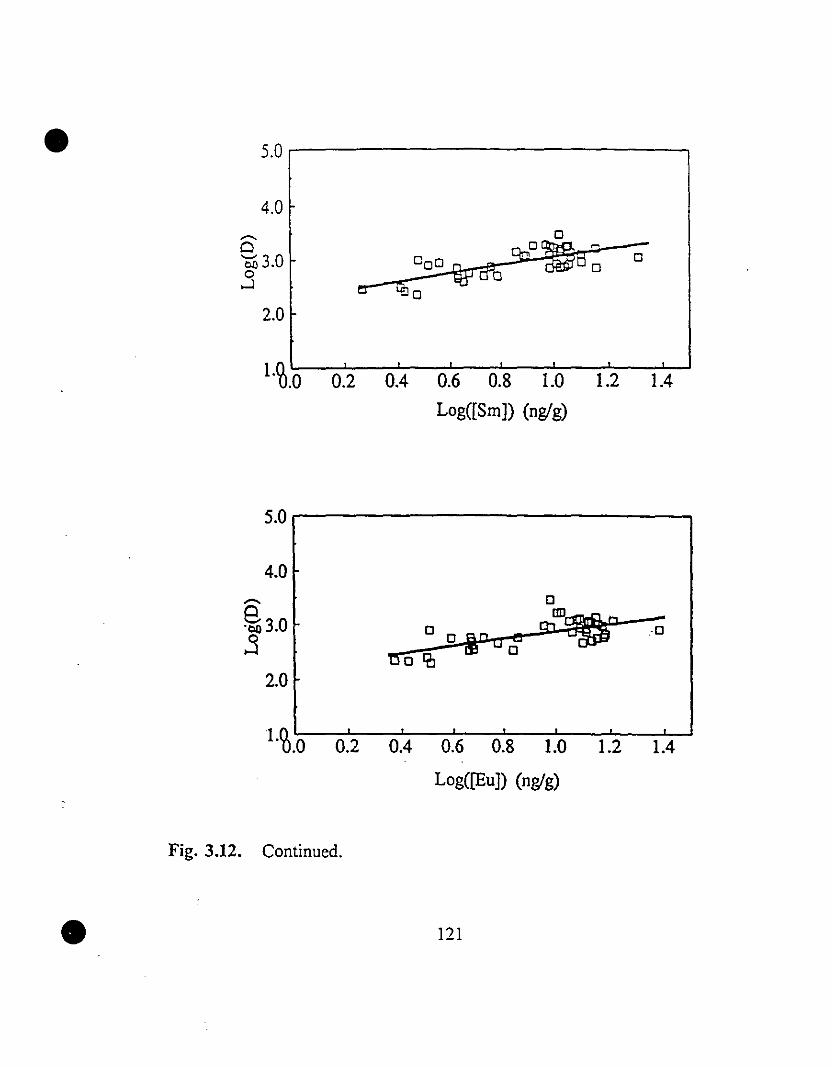
• 5.0.------------------,
4.0,-...Cl'ëli 3.0o
...J
2.0
o9:]0 ~e..-.C-c--
000 '@ db '"3&!J'B 0 0
0'" tb 0
l.~.o 0.2 0.4 0.6 0.8 1.0 1.2 1.4
Log([Sm]) (nglg)
5.0r----------------....
4.0
§·co3.0j
2.0
1.~.0 0.2 0.4 0.6 0.8 1.0 1.2 1.4
Log([EuJ) (nglg)
Fig. 3.12. Continued.
• 121
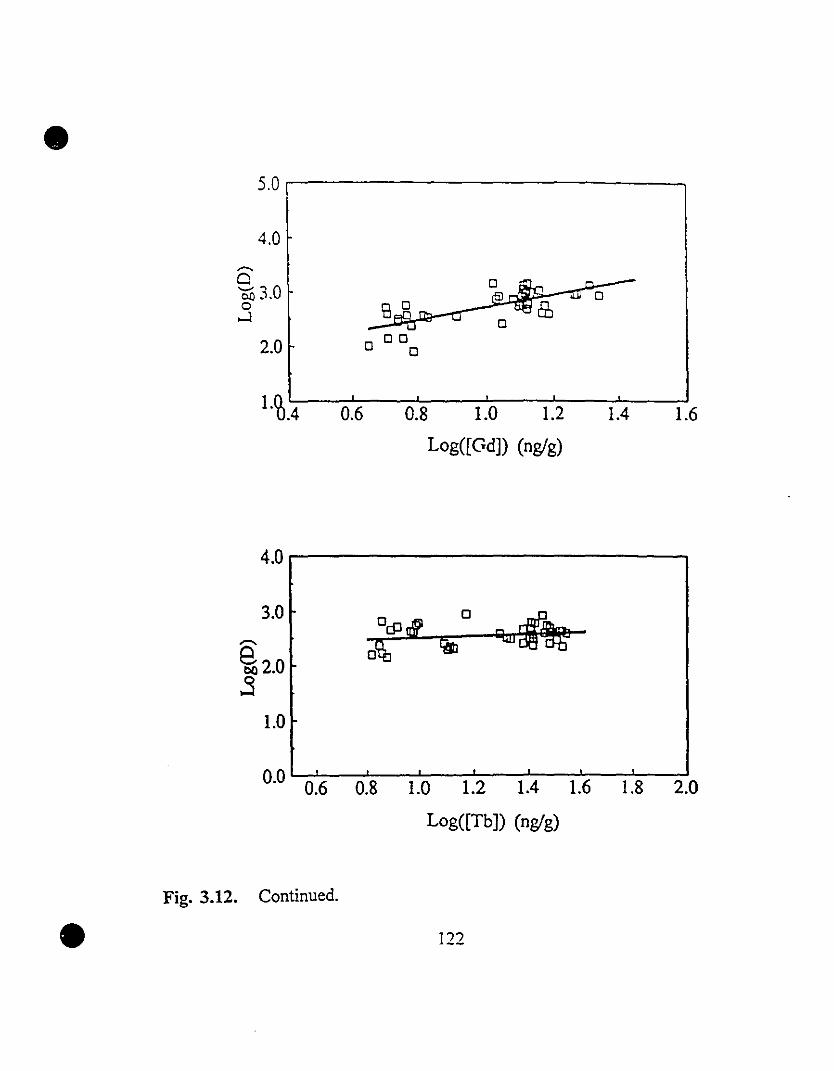
•5.0
4.0,......a003.00
.....l
2.0
1.~.4 0.6 0.8 1.0 1.2
Log([Gd]) (nglg)
1.4 1.6
•
4.0~-------------......,
3.0
§ClQ 2.0.3
1.0
0.0 0.6 0.8 1.0 1.2 1.4 1.6 1.8 2.0
Log([Tb]) (nglg)
Fig. 3.12. Continued.
122
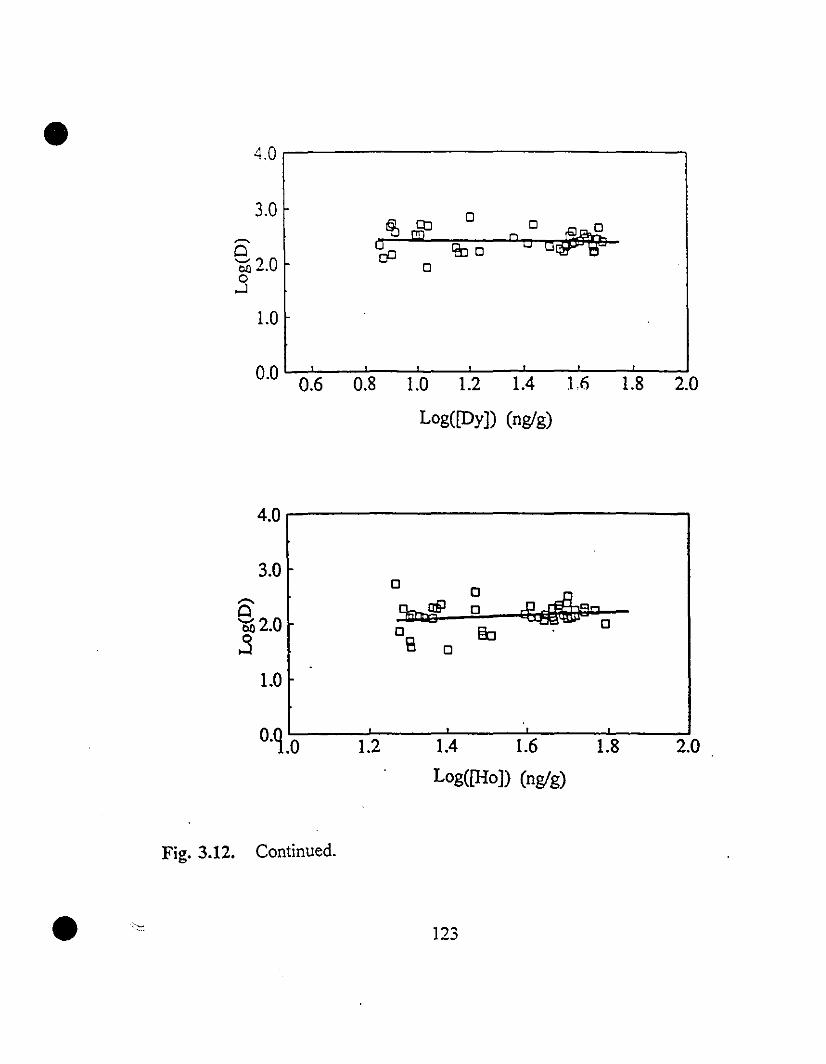
• 4.0.-------------------,
3.0~
Cl'Oli 2.0.3
1.0
~ o
o
\fbo o 0
0.0 0.6 0.8 1.0 1.2 1.4 1,6 1.8 2.0
Log([Dy]) (nglg)
4.0r-------------------,
3.0
•
Bco 2.0.3
1.0
Fig. 3.12. Continued.
1.2 1.4 1.6 1.8
Log([Ho]) (nglg)
l ?~_:>
2.0
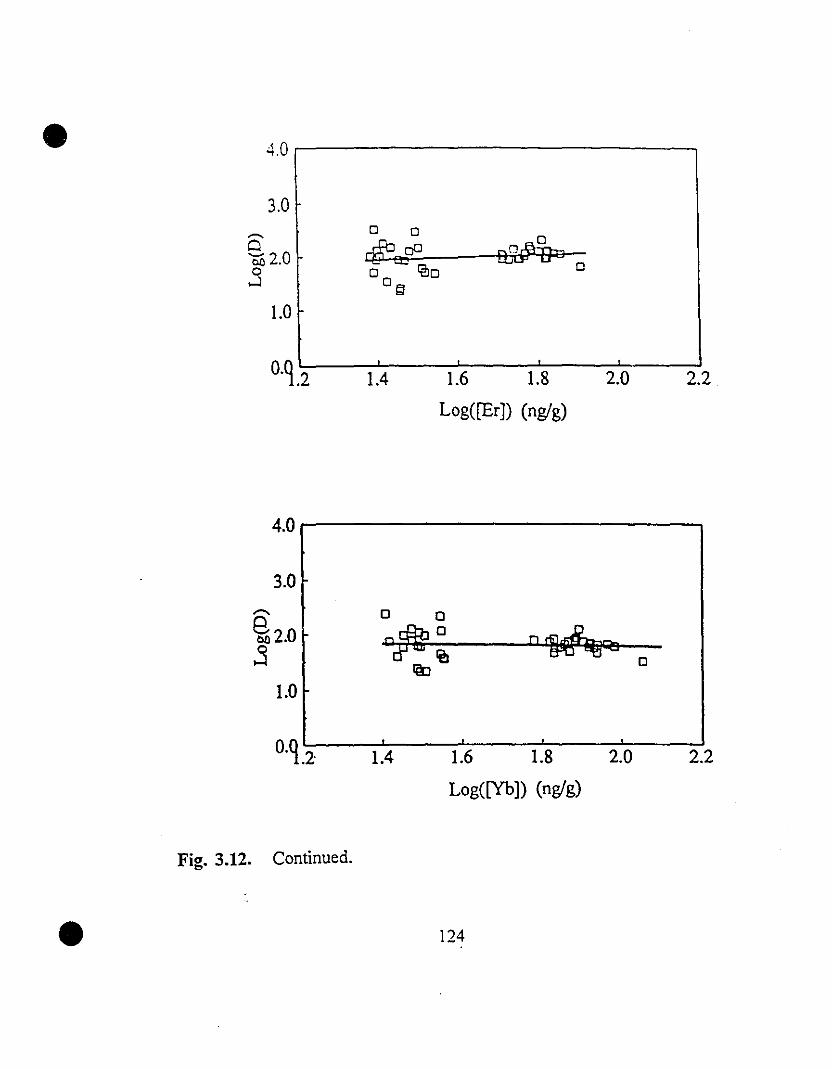
• 4.0 r------------------,
3.0......Clèi!l2.0.3
1.0
a
lA 1.6 1.8 2.0
Log([Er)) (nglg)
2.2
4.0 r------------------,
3.0.......e002.0.3
1.0
Fig. 3.12. Continued.
1.4 1.6 1.8 2.0
Log([Yb)) (ngfg)
2.2
• 124
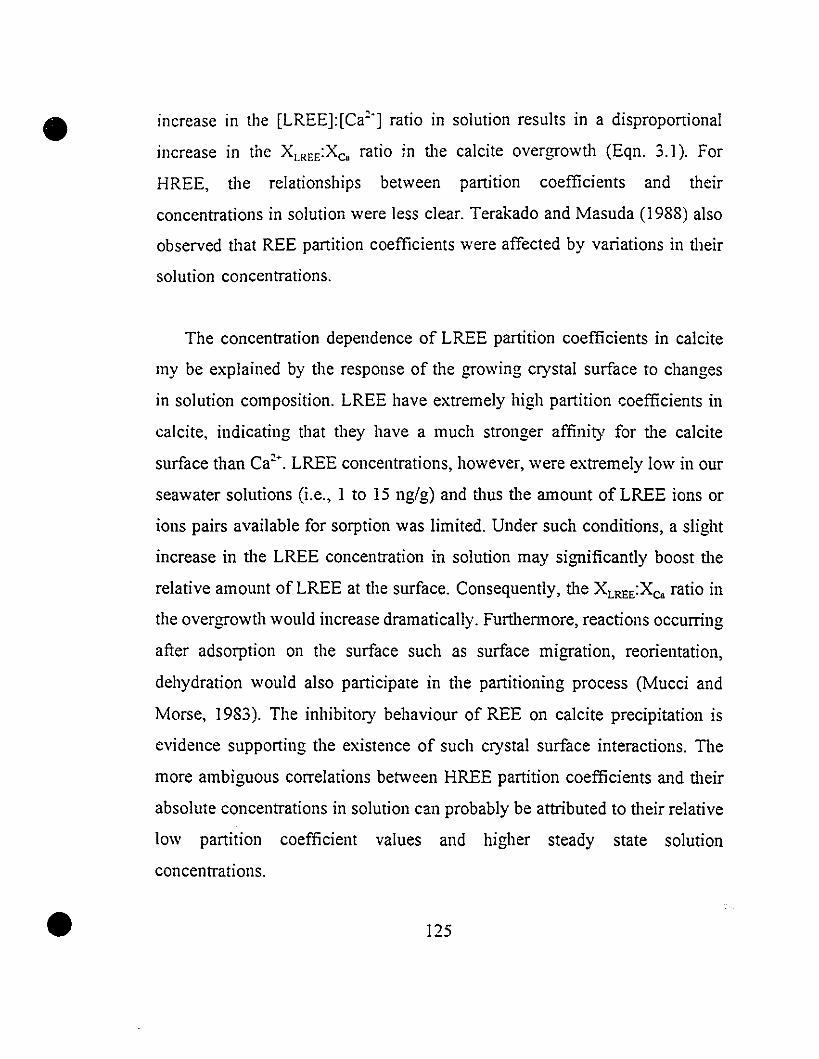
•
•
increase in the [LREE]:[Ca~'] ratio in solution results in a disproportional
lIlcrease in thc XLREE:XC. ratio in the calcite overgrowth (Eqn. 3.1). For
HREE, the relationships between partition coefficients and their
concentrations in solution were less c1ear. Terakado and Masuda (1988) also
observed that REE partition coefficients were affected by variations in their
solution concentrations.
The concentration dependence of LREE partition coefficients in calcite
my be explained by the response of the growing crystal surface to changes
in solution composition. LREE have extremely high partition çoefficients in
calcite, indicating that they have a much stronger affinity for the calcite
surface than Ca~+. LREE concentrations, however, were extremely 10w in our
seawater solutions (i.e., 1 to 15 ng/g) and thus the amount of LREE ions or
ions pairs available for sorption was 1imited. Under such conditions, a slight
increase in the LREE concentration in solution may significantly boost the
relative amount of LREE at the surface. Consequently, the XLREE:XCa ratio in
the overgrowth would increase dramatically. Furthennore, reactions occurring
after adsorption on the surface such as surface migration, reorientation,
dehydration would also participate in the partitioning process (Mucci and
Morse, 1983). The inhibitory behaviour of REE on calcite precipitation is
evidence supporting the existence of such crystal surface interactions. The
more ambiguous correlations between HREE partition coefficients and their
absolute concentrations in solution can probably be attributed to their relative
low partition coefficient values and higher steady state solution
concentrations.
125
•
•
Similar arguments have been proposed to explain the influcncc of
solution [Mg~+]:[Ca~+] ratio on the l'dg" partition cocflïcicnl (Lahann and
Siebert, 1982; Mucci and Morse. 1983) and the mechanism of Cd" sorplion
and subsequent solid solution fonnation in calcite (Davis d al.. 1987).
3.3.3.5 The Influence of Rcdox Potcntial:
The redox potential (Eh) of our seawater solution was maintaincd al thrcc
different levels by equilibrating the solutions with gases of thrce diffcrent
compositions. A N/CO/H~S (i.e., Pms=2.64x10.6 atm.; Pco~=0.0031 atm.) gas
ll11xture was used to simulate a slightly reducing environment. The seawaler
solutions had an estimated total H~S content of 10'" to 10.7 mol!kg-sw when
equilibrated-with the gas phase (Drummond, 198]) and a measured Eh,sCEl
of -140±20 mV. A relatively oxidizing environment was created by bubbling
the solutions with a N/O/CO, (i.e., Po~=0.21 atm.; Pco~=0.0031 atm.)
mixture. An Eh(sCE) of 190±10 mV was obtained. Eh(sCE) measuremenls of
solutions through whieh N/CO, (i.e., Pco,=0.0031 atm.) mixtures were
bubbled gave an average value of 150±10 mV.
The partition coefficients of Ce and Eu, the only two REE ions that are
sensitive to the redox conditions of aqueous solutions, were not specificaIly
influenced by the changes in Eh (Table 3.4; Fig. 3.13). In fact, both clements
adhere to the same REE partitioning pattem under aIl conditions of this
126
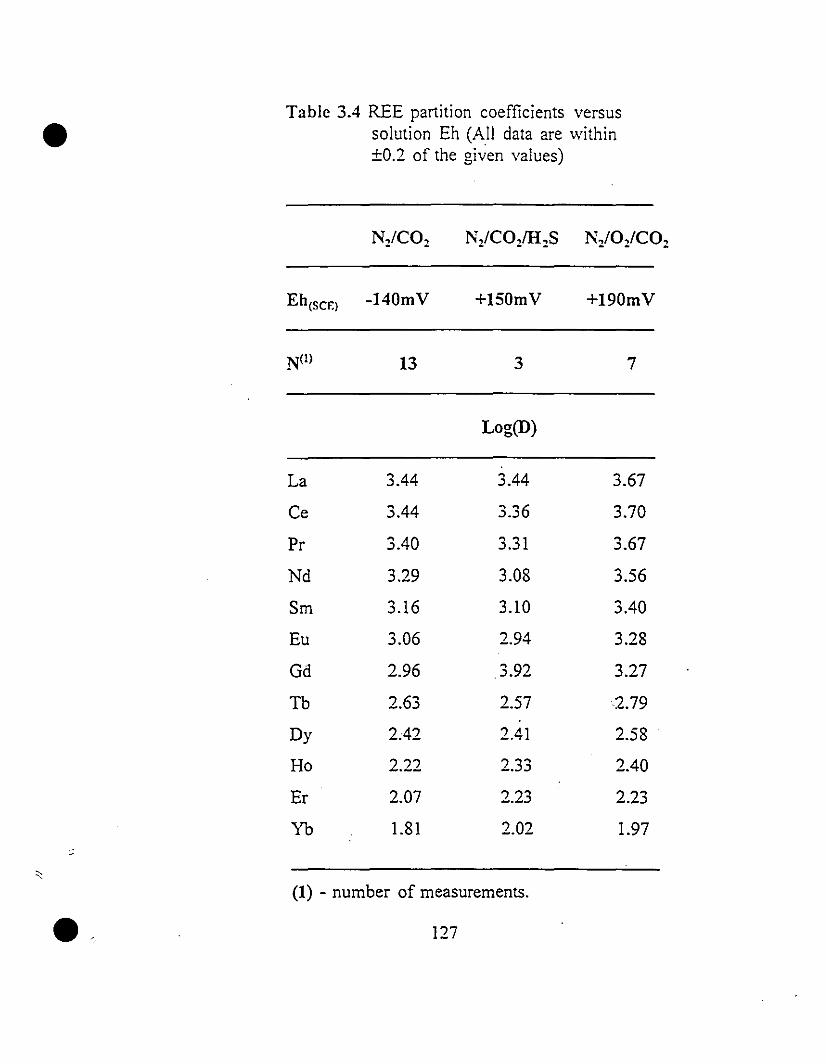
• Table 3.4 REE partition coefficients versussolution Eh (AIl data are within±O.2 of the given values)
Eh(sCF.) -140rnV +150rnV
3
+190rnV
7
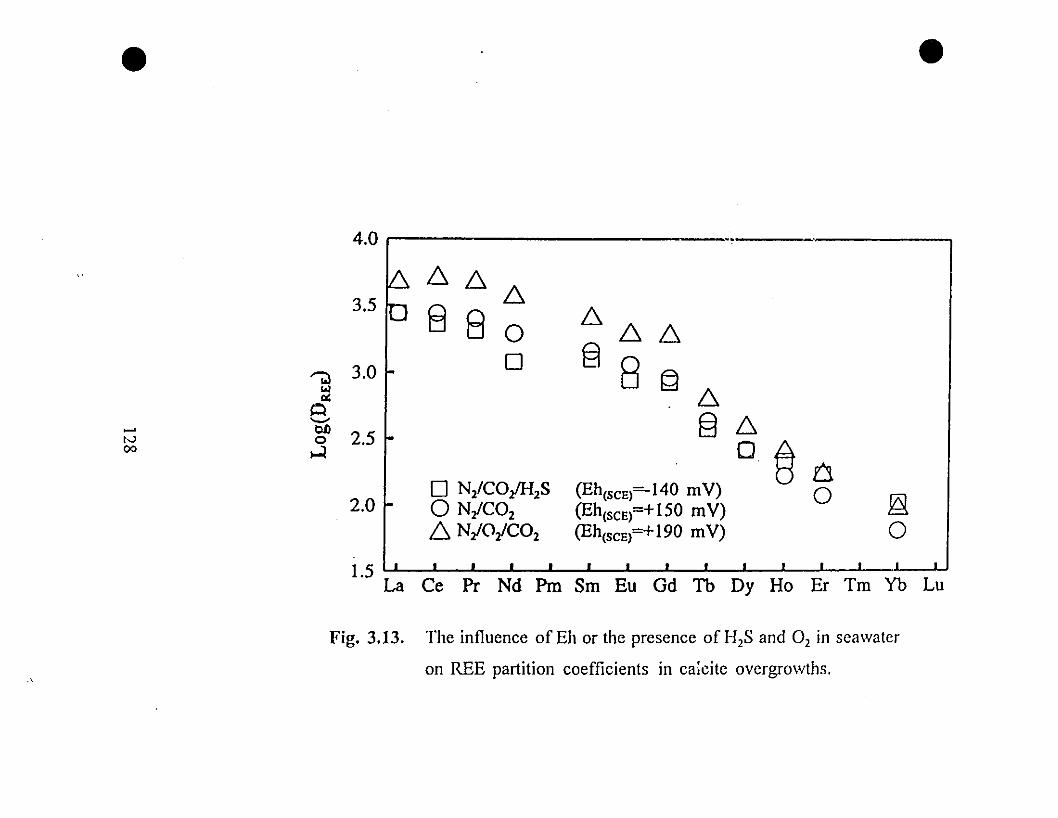
• •
4.0
3.5 ~ 666
8 8 a 66 63.0 0 §
8""';;l §w 6<>:0
El 6'-"..... 002.5,'-' 0
0 ên00 ...:l
o N/COJHzS (Eh(sCE)=-140 rnV)2.0 1- a §aN/COz (Eh(SCE)=+l50 rnV)
6 N/O/COz (Eh(sCE)=+190 rnV) 01.5 ( 1 1 1 1 1 1 1 1 1 1 1 1 1 1 1
La Ce Pr Nd Pm Sm Eu Gd Th Dy Ho Er Tm Yb Lu
Fig. 3.13. The influence of Eh or the presence of H2S and O2 in scawalcr
on REE partition coefficients in caicite overgrowths.
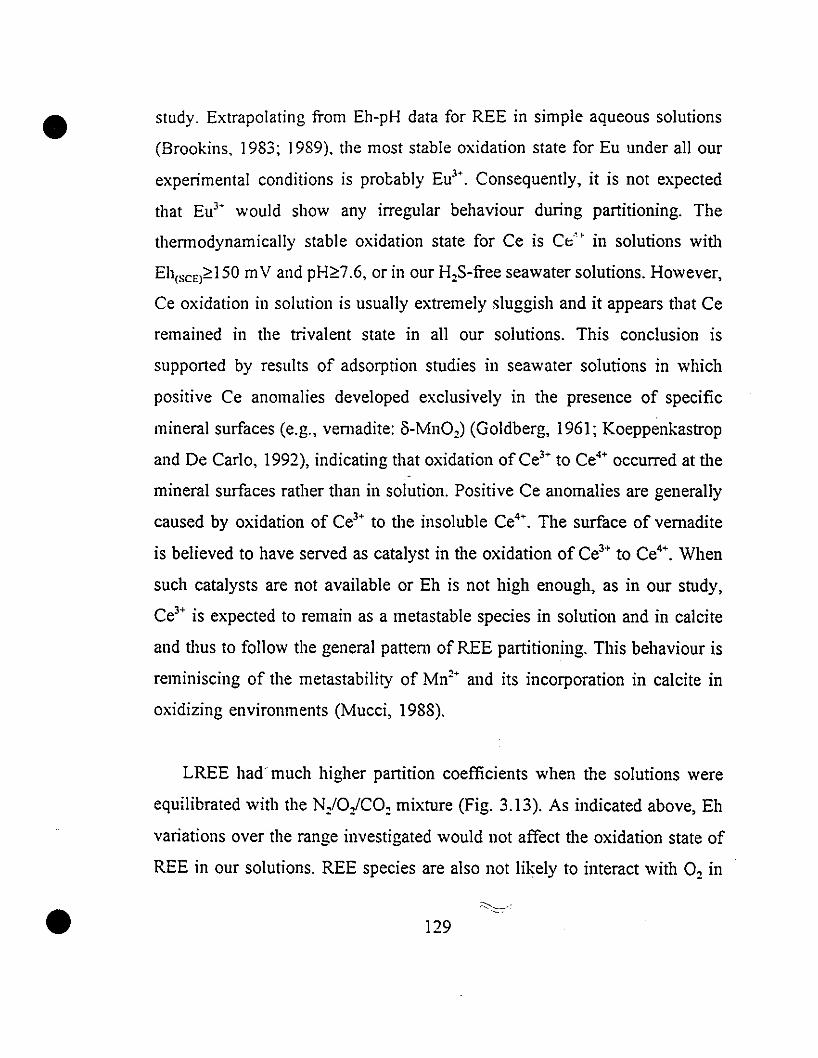
•
•
study. Extrapolating from Eh-pH data for REE in simple aqueous solutions
(Brookins, 1983; 1989), the most stable oxidation state for Eu under aIl our
experimental conditions is probably Eu3+. Consequently, it is not expected
that Eu3- would show any irregular behaviour during partitioning. The
therrnodynamically stable oxidation state for Ce is Ct,'" in solutions with
Eh(sCE)~150 mV and pH~7 .6, or in our H~S-free seawater solutions. However,
Ce oxidation in solution is usuaIly extremely sluggish and it appears that Ce
remained in the trivalent state in aIl our solutions. This conclusion is
supported by results of adsorption studies in seawater solutions in which
positive Ce anomalies developed exdusively in the presence of specifie
mineraI surfaces (e.g., vemadite: 8-MnO~) (Goldberg, 1961; Koeppenkastrop
and De Carlo, 1992), indicating that oxidation of Ce3+ to Ce4
+ occurred at the
mineraI surfaces rather than in solution. Positive Ce anomalies are generaIly
caused by oxidation of Ce3+ to the insoluble Ce4
+. The surface of vernadite
is believed to have served as catalyst in the oxidation of Ce3+ to Ce4
+. When
such catalysts are not available or Eh is not high enough, as in our study,
Ce3+ is expected to remain as a metastable species in solution and in calcite
and thus to foIlow the general pattem of REE partitioning. This behaviour is
reminiscing of the metastability of Mn~+ and its incorporation in calcite in
oxidizing environments (Mucci, 1988).
LREE had" much higher partition coefficients when the solutions were
equilibrated with the N/O/CO~ mixture (Fig. 3.13). As indicated above, Eh
variations over the range investigated would not affect the oxidation state of
REE in our solutions. REE species are also not likely to interact with O~ in
129

•
•
solution. In other words, the presence of O~ in solution should not affect REE
speciation in solutions to the degree that is exhibited by the REE partition
coefficient variations. We suspect that 0: may participate in some of the
complex reactions occurring at the surface of the growing crystal and
consequentIy influel:ced tIle partitioning of LREE. However, there are no
data to substantiate this hypothesis.
3.3.3.6 The Role of Adsorption:
REE partition coefficients were compared with the distribution
coefficients for REE sorption on calcite. Botil coefficients decrease smoothly
witIl atomic number (Fig. 3.14). This similarity is in agreement with the
hypotIlesis tIlat adsorption of REE ions or ion pairs by the calcite surface is
tIle first step in a series of complex reactions leading to their incorporation
in tIle growing crystal. On tIle other hand, the general pattern for REE
sorption distribution coefficients is flatter than tIlat of the REE partition
coefficients in calcite. This observation reinforces the hypothesis that
coprecipitation of REE in calcite does not occur simply by incorporation of
aU ions adsorbed on the SUI Îace. Reactions occurring at the surface of the
solid must also lead to a further partitioning of REE between the adsorbed
layer and th~ bulk crystal. For example, Jess energy is required to dehydrate
tIle larger LREE ions or ion pairs, thus it is expected that these would be
more rapidly assimilated into the crystalline lattice (Muecke and Moller,
1988). This may explain, at least in part, the greater affinity of LREE for the
130
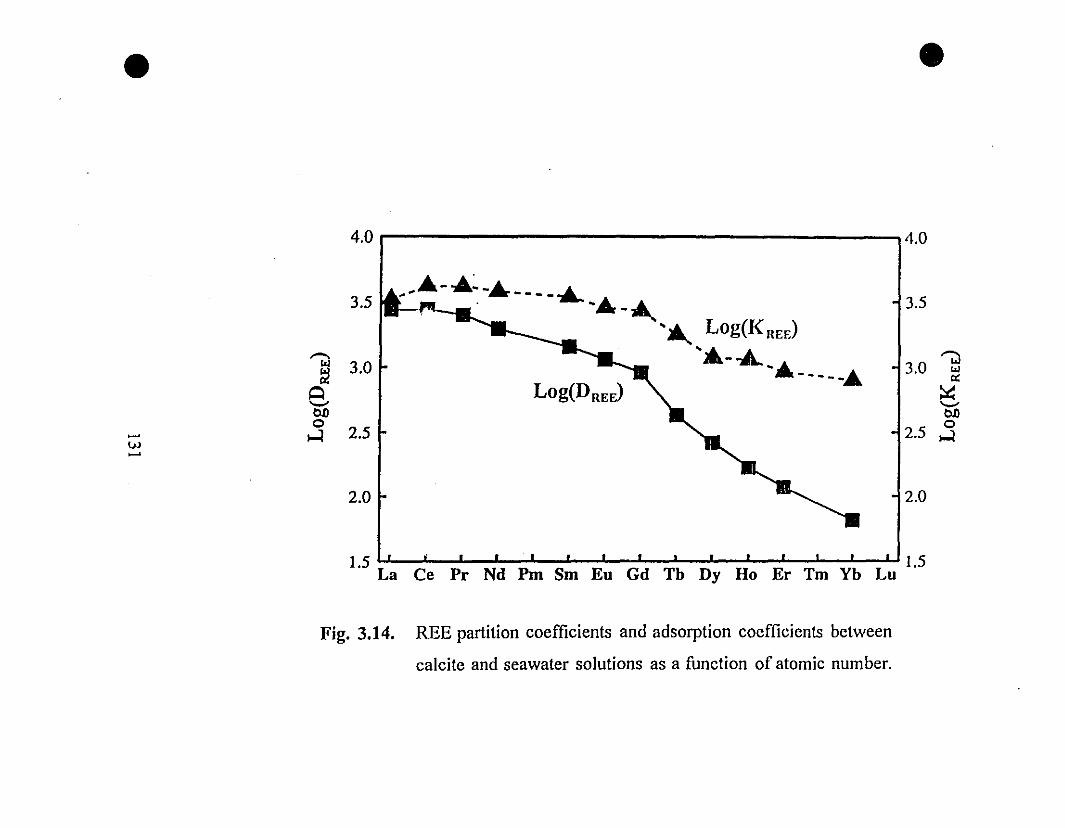
• •
14
.04.0 1
-13.5À-....~-Â----.....À_.. Log(J(•.J
"";;)
~~. '"'3.0 '"
3.5. "'-- ..._......... _____....
"~-
'-'0Jl
Log(DREJ
0
1 3.0
2.5 ...:l
Q
~ J2.0
'-'0Jl0
2.5...:l~
2.0 lVJ~
1.5 ' 1 t ' , , , , , 1 , , , l , 1 1 1.5La Ce Pr Nd Pm Sm Eu Gd Tb Dy Ho Er Tm Yb Lu
Fig. 3.14. REE partition coefficients and adsorption coefficients between
calcite and seawater solutions as a function of atomic number.
• solid phase.
3.3.3.7 Partitioning and the Solubility of Individual REE Carbonates:
There is a negative correlation between REE partition coefficients and the
solubility products of their respective carbonates (Fig. 3.15). The correlation
suggests that the solubility of REE carbonates has significant control over
REE partitioning in calcite. It is weil established that under thennodynamic
equilibrium conditions, the distribution (thennodynamic) coefficients (DO) of
metal ions in calcite should be related to the ratio of the solubility product
! KO,p) of the metal carbonate to that of calcite (Mucci and Morse, 1990):
D~=JK°.sp(cacOJlt
KO.sp(REE,,(COJlJl
(3.11)
•
Although REE partition coefficients reported 111 this study are not
thermodynamic distribution coefficients and are of little thennodynamic
relevance, nonetheless and because of their similar chemical properties, ail
REE should follow the same reaction mechanism during coprecipitation.
Based on these assumptions, REE for which the carbonate minerais have the
lower solubility should have greater tendency of being incorporated into the
solid phase and therefore yield higher partition coefficients.
132
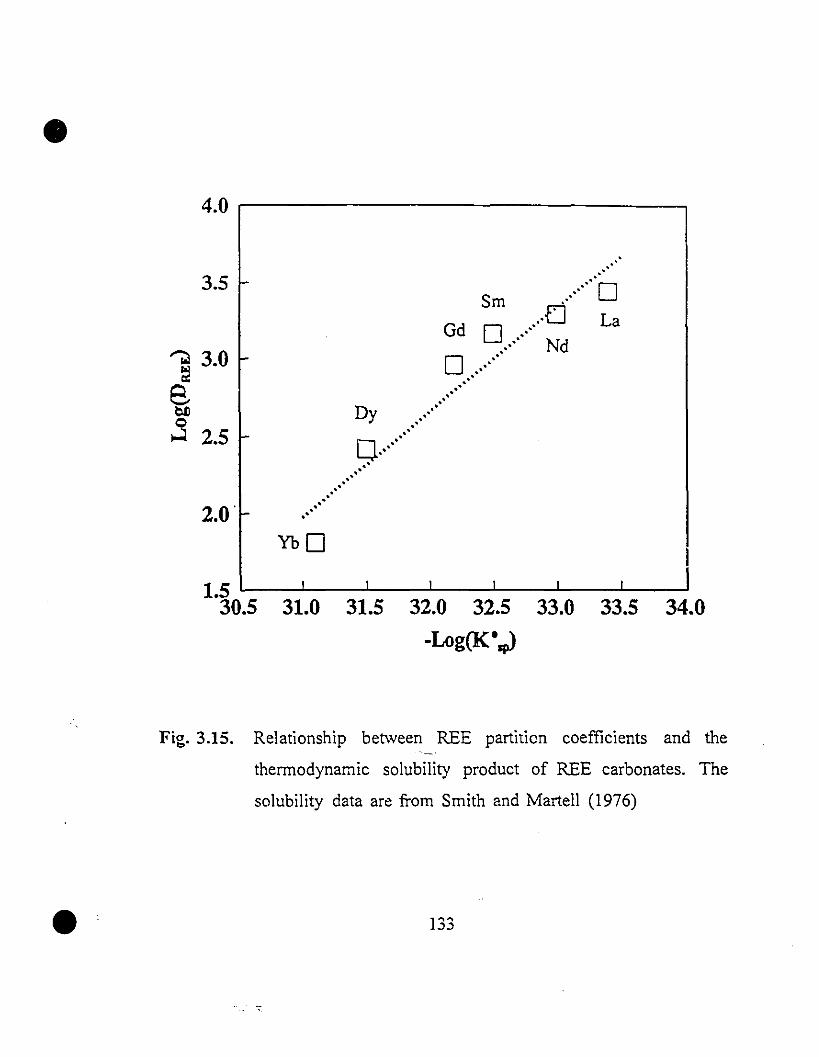
•4.0 r----------------,
3.5 -
1 3•0
ebtI
:3 2.5 ~
2.0· ...
...·····6·Sm .,.0 LaGd q Ndo ..'
Dy •.....•····•·····•·
[J. .
.' .
34.0
•
1.5 l..-__.l...-'_--I.'__....J''---__.l...-'__...J......I_-J'__---J
30.5 31.0 31.5 32.0 32.5 33.0 33.5
-Log(Kesp)
Fig. 3.15. Relationship between REE partition coefficients and the
thennodynamic soIubility product of REE carbonates. The
soIubility data are from Smith and MarteII (1976)

•
•
3.3.3.8 Comparison of Laboratory Studies:
The REE partition coefficient data obtained in this study were c\early
different from those reported by Terakado and Masuda (1988) (Fig. 3.16).
The large discrepancies probably reflect the fact that the two studies were
carried out under very different conditions. Terakado and Masuda (1988)
conducted their experiments in a free-drift system in which spontaneous
nucleation of calcite and consequent crystal growth took place. Solution
compositions and calcite growth rates changed dramatically throughout the
precipitation. As was observed by Terakado and Masuda (1988), such
changes resulted in variations in the REE partitioning mechanism and
partition coefficient values during the course of a given experiment. In
contrast, our study was carried out under controlled experimental conditions
so that resulting REE partition coefficients should be representative of the
specifie geochemical conditions under which calcite was precipitated. We
suspect that because Terakado and Masuda (1988) canied out their
experiments at extremely high reaction rates and in solutions of low REE
concentrations, calcite precipitation and REE coprecipitation reactions were
probably controlled by the diffusion and adsorption rates of ions or ion pairs
from the bulk solution to the mineraI surface. As the diffusion and adsorption
rates of REE ions or ion pairs could not keep up with the precipitation rate,
only a limited amount of REE could be adsorbed on the surface of the
growing crystal before being included within the solid thus resulting in
anomalously low partition coefficients. This observation supports the idea put
forth by Morse and Bender (1990) that partition coefficient of foreign metals
134
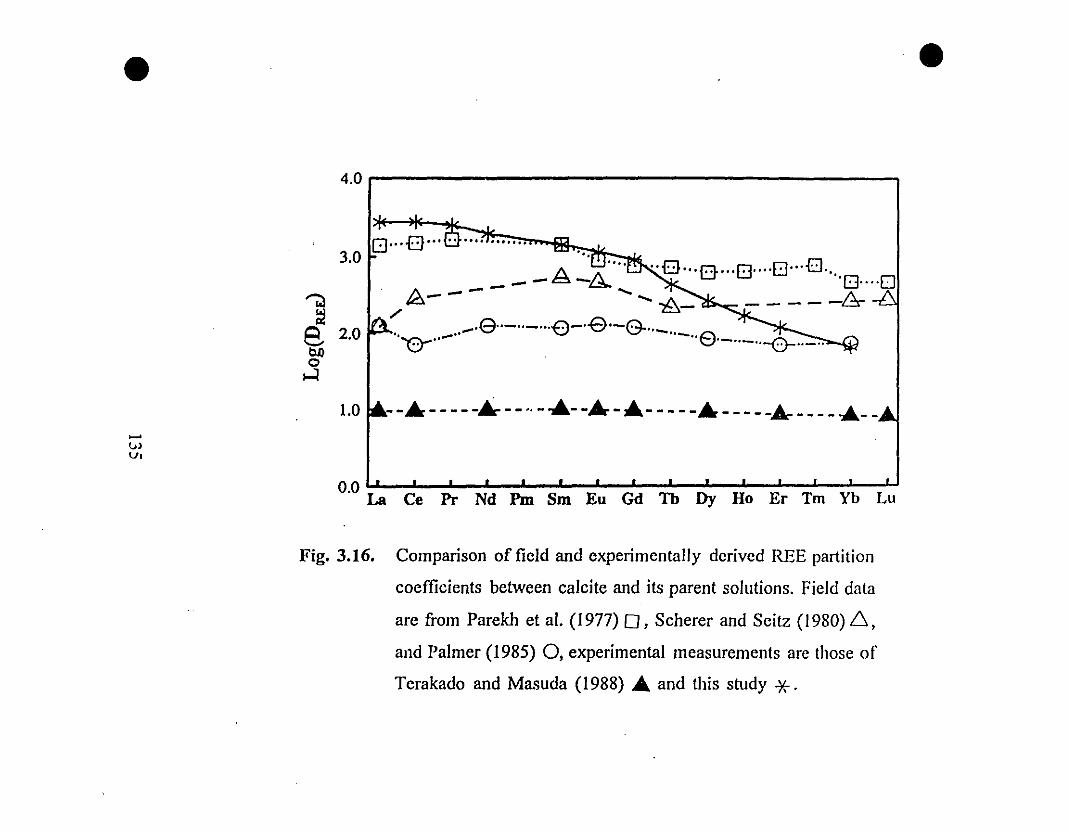
• •4.0 i 1
--Â - - -- -~ - _.. - .....- -Â-Â- - - - -Â - - - - -Â- - - - - -Â--
/\ _....~ -L::!1-Â ~.B...o ...O' .. -o..·o........ "."':8 8 ....0
" _·e··_..e B - - - - - /\'0"
,,-" -'" . -' '-8- -t.=r.. ' "-..- e..'-.. - .. -r.Lo--..-~
0 0 ( .1:.:J - 1 ..
3.0
""";;ll:!B 2.0
b.O0~
.....1.0
u)v,
0.0~~~~~~~~Th~~&~n~
Fig. 3.16. Comparison of field and experimcntally derived REE partition
coefficients between calcite and ils parent solutions. Field data
are trom Parekh et al. (1977) 0, Scherer and Seitz (1980) 6.,
and Palmer (1985) 0, experimental measurements are those of
Terakado and Masuda (1988) Â and this study *.
•
•
In calcite are not equivalent to thermodynamic constants and gcnerally
represent phenomenological measurements under a given set of conditions.
3.3.3.9 Comparison of Laboratolj' and Field Results:
The fact that there are large discrepancies among the few available field
data sets makes it difficult. if not impossible. to compare our experimcntal
data with those obtained from field samples (Fig. 3.16). The discrepancics
among field data sets probably reflect the diversity of the environments under
which calcite was precipitated. Different sampIe treaUnent procedures and
ullcertainties inherent in partition coefficient detenninations and analytical
methods used in these earlier studies further contributed to the data scattering
(Parekh et al., 1977; Palmer, 1985). On the other hand, because of analytical
limitations, the REE concentrations investigated in this study were much
higher than those normally encounte,ed in seawater or other natura! solutions.
In addition, most natural calcites were biogenic. The uptake mechanism of
REE in biogenic calcites may be affected by "vital effects" which cannot be
reproduced under laboratory conditions. Other natural seawater componenls
such as reactive phosphate and dissolved organic matter which were not
investigated in this study form strong complexes with REE and/or influence
the surface properties of calcite as weil as its precipitation kinetics. Ali these
factors will certainly affect the compatibility of our experimental data to field
results. Nevertheless, despite of ail these uncertaintÎe::;::our REE partition
coefficient data are generally compatible with field observations.
136
•
•
Finally, it should be noted that extrapolations oflaboratory results to field
studies are rarely straightforward. The discrepancy between Mg2' partition
coefficients in calcite detennined under controlled laboratory conditions and
field observations serves as a good illustration of the problem (see Morse and
Mackenzie, 1990 for summary). We acknowledge that it will certainly require
more than the present study and the study of Terakado and Masuda (1988)
to elucidate our understanding of the behaviour of REE during carbonate
mineral precipitation. Nevertheless, the compatibility ofour experimental data
with results obtained from field studies suggests that partition coefficients
derived from experimental study can be used for the interpretation of
environmental, diagenetic. and paleoceanographic studies.
137
•
•
3.4 CONCLUSIONS
(1) Through this study, we successfully demonstrated that it is possible
to create and maintain a steady state environment for calcite precipitation and
foreign ion coprecipitation reactions using a simple "constant addition"
experimental technique. The reponed REE partition coefficients represent
quantitative measurements ofREE incorporation in calcite precipitated under
weil defined kinetic and strictly controlled conditions. The influence of
kinetic as weil as thennodynamic factors on the REE partitioning can be
individually and systematically resolved.
(2) REE are incorporated in calcite by substituting for Ca2+ in the crystal
lattiee, fonning solid solutions. Partitioning of REE in calcite will probably
reflect conditions under which the mineraI is fonned.
(3) The presence of REE in seawater solutions, even at low extremely
concentrations (i.e., L[REE]<10 ng/g), inhibit the precipitation of calcite.
(4) REE are strongly partitioned into calcite during precipitation !Tom
seawater. Their partition coefficients are as high as 103.5 and decrease
gradually with increasing atomic number. Based on this observation, we
predict that the general REE distribution pattern in calcite will exhibit strong
LREE enrichments when compared with its parent solution.
(5) Among the factors investigated, the partition coefficients of REE,
138
•
•
especially LREE, in calcite are significantly affected by their absolute
concentrations or [REE]/[Ca~·] ratios in solutions. Calcite precipitation rate,
[CO/] or Pco~ in solution, however, have little effect on the REE partition
coefficients. Eh variations in the range covered by this study also do not
affect the oxidation state of Ce3• and Eu3
• in solution and their partition
coefficients, since both ions were stable or metastable under our experimental
conditions. On the other hand, the presence of O2 in solution influenced the
partition coefficients for LREE in calcite dramatically, but we have failed to
find an acceptable explanation for this behaviour.
(6) The non-thennodynamic REE partition coefficients are negatively
correlated to the solubility of their respective carbonate minerais. Individual
REE with lower carbonate solubility products have higher REE partition
coefficients. REE speciation in solutions, adsorption ofREE ions or ion pairs
(e.g., REE(C03n, and subsequent surface reactions such as dehydration also
influence the incorporation of REE in calcite.
(7) The compatibility of our data with results obtained from field studies
suggests that results of our experimental study could at least serve as a
general guide for the application of REE partItiOn coefficients to
environmental, diagenetic, and paleoceanographic studies.
139
•
•
3.5 ACKNOWLEDG EM El\'TS:
We wish to thank A. Bono. L. Hendelman. S. Lalli. G. Keating. anô X.
Wu for their technical assistance in the laboratory. Financia! support \l'as
provided by the National Sciences and Engineering Research Council of
Canada (NSERC) to AM. SZ gratefully acknowledges the financia! assistance
provided by the Davison. LeRoy. Lynch. Reinhardt and William funds l'rom
the Department of Earth and Planetary Sciences at McGill University and
graduate scholarships awarded by GEOTOP/UQAM through FCAR-Centre
and l'eam grants.
140
•
•
3.6 REFERENCES
Brookins D.G. (1983) Eh-pH diagrams for the rare earth elements at 25°C
and one bar pressure. Geochem. J. 17,223-229.
Brookins D.G. (1989) Aqueous geochemistry of rare earth elements. In:
Reviews in Mineralogy VoU!. Geochemical and Mineralogy of Rare
Earth Elements (eds. Lipin B.R. and McKay G.A.) Mineralogical Society
of America. Washington D.C.
Burton E.A. and Walter L.M. (1990) The role of pH in phosphate
inhibition of calcite and aragonite precipitation rates in seawater.
Geochim. Cosmochim. Acta 54, 797-908.
Busenberg E. and Plummer L.N. (1985) Kinetic and thennodynamic
factors controlling the distribution of sa/" and Na+ in calcites and
selected aragonites. Geochim. Cosmochim. Acta 49, 713-725.
Byrne RH and Kim K.H. (1993) Rare earth precipitation and
coprecipitation behavior: The limiting role of pot on dissolved rare
earth concentrations in seawater. Geochim. Cosmochim. Acta 57, 519
526.
Cantrell K.J. and Byrne RH. (1987) Rare earth element complexation by
carbonate and oxalate ions. Geochim. Cosmochim. Acta 51, 597-605.
Davis J.A., Fuller c.c. and Cook A.D. (1987) A model for trace metal
sorption processes at the calcite surface: Adsorption of Cd2+ and
subsequent solid solution fonnation. Geochim. Cosmochim. Acta 51,
1477-1490.
DcBaar H.J.W., German C.R, Elderfield H. and Gaans P.V. (1988)
141
•
•
Rare earth element distributions in anoxic waters of the Cariaco Trencl!.
Geochim. Cosmochim. Acta 52, 1203-12219.
deKanel J. and l\"1orse J.W. (1979) A simple technique for surface area
determinations. J. Phys. E. Sci. Instr. 12, 272-273.
Doerner H. A. and Hoskins W.M. (1925) Coprecipitation of radium and
barium sulphates. J. Amer. Chem. Soc., 47, 662-675.
Drummond S.E.Jr. (1981) Boiling and Mixing of I-Iydrothennal Fluids:
Chemical Effects on Mineral Precipitation. Ph.O. dissertation,
Pennsylvania State University.
Elderfield H. and Sholkovitz E.R. (1987) Rare earth elements in the pore
waters ofreducing nearshore sediments. Earth. Planet. Sci. Leu. 82,280
288.
Goldberg E.D. (1961) Chemistry of the oceans. In: Oceanography (ed. M.
Sears). Amer. Assoc. Ad\'. Sci. Publ., 67, 538-597.
Goldschmidt V.M. (1937) The principle of distribution of chemicaI
elements in mineraIs and rocks. 1. Chem. Soc., 655-672.
Hansson 1. (1973) A new set of acidity constants for carbonic acid and
borie acid in sea water. Oeep-Sea Res. 20,461-478.
Hartley G., Zhong S. and Mucci A. (1992) The influence of Pc02 on the
incorporation of magnesium in calcite overgrowths precipitated from
seawater at 25°C (abstract). Eos Trans. AGU Spring Meeting Suppl., 73,
168.
Henderson L.M. and Kracek F.C. (1927) The fractional precipitation of
barium and radium chromates. 1. Amer. Chem. Soc., 49, 739-749
Henderson P. (ed.) (1984) Raie Earth Element Geochemistry. Elsevier
142
•
•
Science Publishers. 51 Op.
Hogdahl O.T., Mclson S. and Bowen V.T. (1968) Neutron activation
analysis of lanthanide elements in seawater. In: Trace Inorganics in
Water, Adv. Chem. Ser. 73, 308-325.
Kester D.R., Duedall J.W., Connors D.N. and Pytkowicz RM. (1967)
Preparation of artificial seawater. LimnoI. Oceanogr. 12, 176-179.
Koeppenkastrop D. and De Carlo E.H. (1992) Sorption of rare-eartIl
elements from seawater onto synthetic mineraI partic1es: An experimenta1
approach. Chem. Geoi. 95, 251-263.
Koroleff F. (1976) Detennination of phosphorus. In: Methods of Seawater
Analysis (ed. K. Grasshoft). pp.l17-126. VerIag-Chimie.
Kretz R (1982) A model for the distribution of trace elements between
calcite and dolomite. Geochim. Cosmochim. Acta 46, 1979-1981.
Lahann RW. and Siebert RM. (1982) A kinetic model for distribution
coefficients and application to Mg-calcites. Geochim. Cosmochim. Acta
46, 2229-2237.
Lee J.H. and Byrne RH. (1993) Complexation of trivalent rare earth
elements (Ce, Eu, Gd, Tb, Yb) by carbonate ions. Geochim. Cosmochim.
Acta 57, 295-302.
Light T.S. (1972) Standard solution for redox potential measurements.
Anal. Chem. 44, 1038-1039.
Lipin B.R. and McKay G.A. (eds) (1989) Geochemistry and Mineralogy
of Rare Earth Elements. Mineral. Soc. Amer., Reviews in Mineralogy,
VoL21. Washington D.C. 348p.
Liu Y. Miah M.R.U. and Schmitt R.A. (1988) Cerium: A chemicaI tracer
143
•
•
for paleo-oceanic redox conditions. Geochim. Cosmochim. Acta 52,
1361-137I.
Lorens R.B. (1981) Sr, Cd, Mn and Co distribution coefficients in calcite
as a function of calcite precipitation rate. Geochim. Cosmochim. Acta 45,
553-56I.
Mackenzie F.T., Bischoff W.B., Bishop F.C., Loijcns M., Schoonmakcr
J. and Wollast R. (1983) Magnesian calcites: Low-temperaturc
occurrence, solubility and solid-solution behaviour. In: Carbonates:
Mineralogy and Chemistry (ed. R.J. Reeder), pp.97-144. Mineral. Soc.
Amer., Reviews in Mineralogy, Vol. Il. Washington D.C.
Millero F.J. (1986) The pH of estuarine waters. Limnol. Oceanogr. 31,
839-847.
Millero F.J. (1992) Stability constants for the fonnation of rare earth
inorganic complexes as a function of ionic strength. Geochim.
Cosmochim. Acta 56, 3123-3132.
M"orse J.W. (1983) The kinetics of calcium carbonate dissolution and
precipitation. In: Carbonates: Mineralogy and Chemistry (ed. R.J.
Reeder), pp.227-264, Mineral. Soc. Amer., Reviews in Mineralogy, Vol.
Il. Washington D.C.
Morse J.W. and Bender M.L. (1990) Partition coefficients in calcite: An
examination offact0rs influencing the validity of experimental results and
their application to f.atural systems. Chem. Geol. 82, 265-277.
Morse J.W. and Ma{;kenzie F.T. (1990) Geochemistry of Sedimentary
Carbonates. Elsevier Sci. Pub!. 707p. Amsterdam
Mucci A. (1986) Growth kinetics and composition of magnesian calcite
144
-->'
•
•
overgrowths precipitated from seawater: Quantitative influence of
orthophosphate ions. Geochim. Cosmochim. Acta 50, 2255-2265.
Mucci A. (1988) Manganese uptake during calcite precipitation from
seawater: Conditions leading to the fonnation of a pseudokutnahorite.
Geochim. Cosmochim. Acta 52, 1859-1868.
Mucci A. and Morse J.W. (1983) The incorporation of Mg2+and Sr+ into
calcite overgrowths: influences of growth rate and solution composition.
Geochim. Cosmochim. Acta 47, 217-233.
Mucci A. and Morse J.W. (1990) Chemistry of low-temperature abiotic
calcites: Experimental studies on coprecipitation, stability, and
fractionation. Reviews in Aquatic Sciences 3, 217-254.
Muecke G.K. and Mimer P. (1988) The not-so-rare earths. Sciemific
Amer. 258, 72-77.
Nielsen A.E. (1964) Kinetics of Precipitation. MacMiIlan, New York, 151p.
Palmer M.R. (1985) Rare earth elements in foraminifera tests. Earth
Planet. Sci. Let!. 73, 285-298.
Parekh P.P., MiiIler P., Dukski P. and Bausch W.M. (1977) Distribution
of trace clements between carbonate and non-carbonate phases of/ -
Iimestone. Ea:rth Planet. Sci. Let!. 34, 39-50.
Pingitore N.E. and Eastman M.P. (1986) The coprecipitation of Sr+ with
calcite at 25°C and 1 atm. Geochim. Cosmochim. Acta 59, 2195-2203.
Pingitore N.E., Lytle F.W., Davies B.M., Eastman M.P., EIIer P.G. and
Larson E.M. (1992) Mode of incorporation of Sr+ in calcite:
determination by X-ray absorption spectroscopy. Geochim. Cosmochim.
Acta 56, 1531-1538.
145
•
•
Scherer M. and Seitz H. (1980) Rare-earth element distribution in
Holocene and Pleistocene corals and their redistribution during
diagenesis. Chem. Geol. 28, 279-289.
Shannon R.D. (1976) Revised effective ionic radii and systematic studies
of interatomic distances in halides and chalcogenides. Acta Cryst. .-\32,
751-767.
Smith R.M. and Martell A.E. (1976) Critical Stability Constants. VolA,
Inorganic Complexes. Plenum Press, NY and London. P.37.
Sverjensky D.A. (1984) Europium redox equilibria in aqueous solution.
Earth Planet. Sci. Lett. 67, 70-78.
Taylor S.R. and McLennan S.M. (1988) The significance of the rare
earths in geochemistry and cosmochemistry. In: Handbook on the
Physics and Chemistry of Rare Earths, Vol.11 (eds. Gschneidner Jr. K.A.
and Eyring L.) Elsevier Science Publishers B.V. New York.
Terakado Y. and Masuda A. (1988) The coprecipitation of rare-earth
elements with calcite and aragonite. Chem. Geol. 69, 103-110.
Terjesen S.G., Erga O., Thorsc.. G. and Vc A. (1961) II. Phase boundary
processes as rate detennining steps in reactions between solids and
liquids. Chem. Engn. Sci. 14, 277-289
Wood S.A. (1990) The aqueous geochemistry of the rare-earth elements
ancLyttrium. ). Review of availablc low~temperature data for inorganic
complexes and the inorganic REE speciation of natural waters. Chem.
Geol. 82, 1159-186.
Zachara J.M., Kittrick J.A. and Harsh J.B. (1988) The mechanism of
Zn2+ adsorption on cabte. Geochim. Cosmochim. Acta 52, 2281-2291.
146
•
•
Zachara J.M., Cow:m C.E. and R.:sch C.T. (1991) Sorption of divalent
metals on calcite. Geochim. Cosmochim. Acta 55, 1549-1562
Zhong S. and Mucci A. (1993a) Calcite precipitation in seawater using a
constant addition technique: a new overall reaction kinetic expression.
Geochim. Cosmochim. Acta 57, 1409-1417.
Zhong S. and Mucci A. (1993b) Quantitative detennination of rare earth
elements in seawater and strong electrolyte solutions by chelation and
gradient ion chromatography. Anal. Chim. Acta (submitted).
147
•
•
CH..\PTER 4
Concluding Remarks
4.1 CONTRIBUTION TO ORIGINAL KNOWLEDGE
There are four major contributions from this study which 1would like ta
emphasize:
(1) The development of the "constant addition" experimental technique
which has proven to be a superb technique for the study of precipitation
kinetics and "foreign" element partitioning in calcite. lt is a simple technique
which enabled us to res'rict operational eITors to a minimum. Its most
important advantage is its inherent ability to achieve and maintain steady
state conditions during calcite precipitation and "foreign" element
coprecipitation reactions. This feature aIIowed us to accurately measure
calcile precipitation rates in seawater at lower saturation states than could be
achieved before and to maintain a steady state environmcnt for the
partitioning of multi-elements present at extremely low solution
concentrations (e.g., REE). This technique may also provide aninteresting
altemative for other mineral-solution interaction kinetic studies.
(2) The establishment of a yet incomplete kinetic model for calcite
precipitation reactions in complex solutions such as seawater. The model is
based on the consideration of four paraIIel reactiOlls, which are believed to
participate in the global precipitation reaction.
148
•
•
(3) The improvement of an analyticaI procedure for the separation and
determination of REE by chelation and gradient ion chromatography. It has
the ability of eliminating interfering matrix constituents and provides a
convenient and reliable method for the determination of REE in geological
materials and strong electrolyte solutions, with low detection limits and
relatively high precision.
(4) Most importantly, the accurate measurements of REE partition
coefficients between calcite overgrowths and their parent seawater solutions
and an investigation of factors which influence the partitioning process. This
is the tirst successful study on the subject and ail data and observations
presented can be considered contributions to original knowledge.
4.2. SUGGESTIONS FOR FUTURE STUDY
4.2.1. Calcite Precipitation Kinetics:
Further experimentation is required to fully develc;J the kinetic expression
which describes the precipitation of calcite from seawater solutions.
Retinements to this model will require systematic investigations on the
influence of major seawater constituents such as Mg!·, HC03-, H!C03, H+,
SO/", Na+, as weil as reaction catalysts and inhibitors (e.g., phosphate). As
a matter of fact, a study has already been initiated in our laboratory to
detennine the partial reaction order with respect to the Ca!· ion (Le., varying
[Ca!·) while keeping [CO/") and other species constant). Ultimately, the
149
•
•
kinetic expression may take into account the participation of specifie
dissolved complexes such as ion pairs and the inhibitory efTect of other
naturaliy occurring substances (e.g., phosphate. dissolved organic carbon).
Finally, a similar study of dissolution kinetics would complete the mode\.
lt will be extremely beneficial if future studies could take ad-, antage of
the recent developments in atomic force microscopy (AFM), scanning
tunneliing microscopy (STM), and X-ray absorption spectroscopy (XAS) and
their potential application to the study of minerai surface reactions (e.g.•
growth, dissolution, partitioning, zoning).
4.2.2. Analysis of REE using CGIC:
The detection limit and analytical precision of the chelation and gradient
ion chromatographie method were largely detennined by the detector (i.e.,
variable wavelength detector) we used. Sample solutions, after passing
through the COIC, were matrïx-free and REE were isolated from each other.
These solutions could be analyzed by other analytical techniques, such as
ICP-MS and INAA, which provide better precision and lower detection
limits. Such combinations may provide more convenient and reliable methods
for the routine analysis of REE in samples that traditionally required tedious
and undesirable manipulations such as metal extraction, matrix purification,
and instrumental matrix correction (e.g., geological and seawater samples).
Il is also worth noting that the application of ion chromatography is not
150
•
•
lirnited to the analysis of REE. In sorne cases, it rnay provide a better
alternative for the detennination of rnanv other anions, as weIl as trace and
ultra-trace rnetals.
4.2.3. REE Partitioning:
Future experirnental studies could consider lowering REE concentration
in the reacting solutions to a level that is more representative of natural
oceanic environrnents (i.e., pg/g), probably by using analytical techniques that
provide lower detection lirnits for REE analysis, such as cornbining CGIC
with isotope dilution ICP-MS. The effect of calcite precipitation rate on REE
partitioning should also be extended over a wider range of rates or saturation
states, which could probably also be achieved by lowering REE
concentrations in the reacting solutions. The effect of O2 on REE partitioning
certainly warrants further study. Partitioning reactions should be carried out
under more reducing conditions (by equilibrating seawater solutions with
gases of higher H2S partial pressures) so that the change in the oxidation
state of Eu3+ to Eu2
+ on its partitioning can be investigated.
151
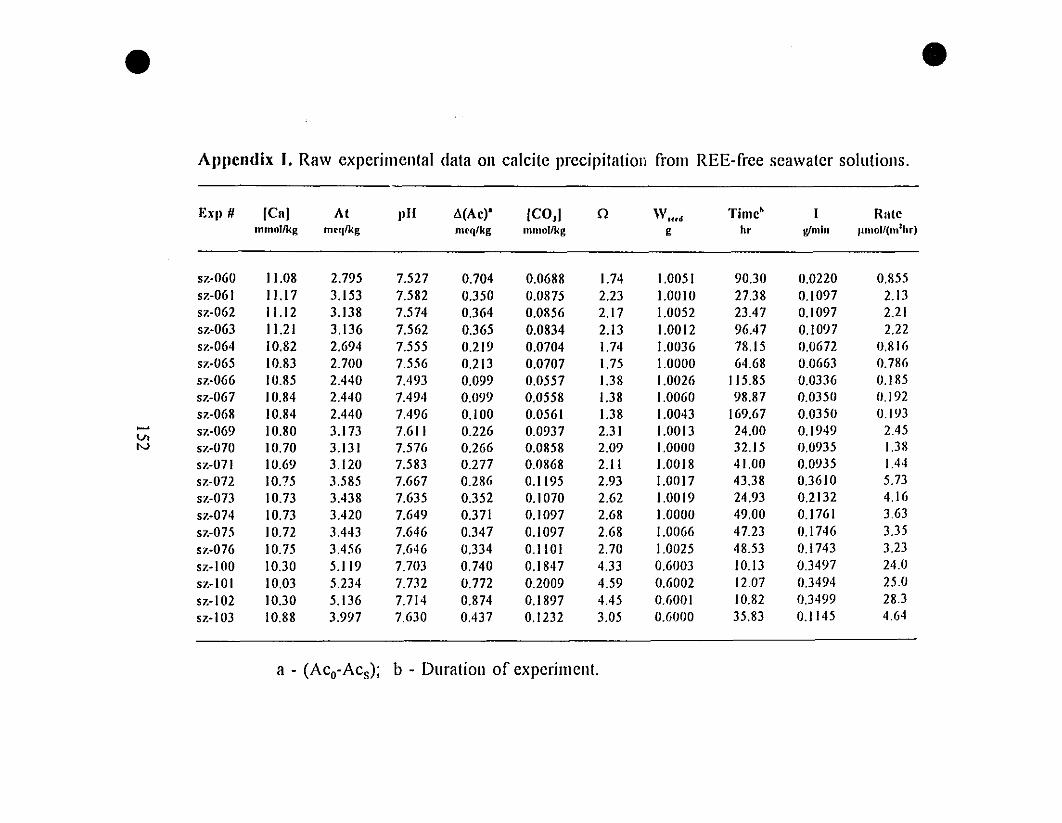
•Appcndix J. Raw experimental data on calcite precipitation from REE-free seawater solutions.
EXil # (Cal At JIll "'(Ac)' (CO,I n \Vmd Timc' 1 Ralcmmollkg m('qfkg meq/kg mmollkg g hr glmln 'Imol/(mJhr)
57.-060 11.08 2.795 7.527 0.704 0.0688 1.74 1.0051 90.30 0.0220 0.85557.-061 11.17 3.153 7.582 0.350 0.0875 2.23 1.0010 27.38 0.1097 2.1357.-062 11.12 3.138 7.574 0.364 0.0856 2.17 1.0052 23.47 0.1097 2.2157.-063 11.21 3.136 7.562 0.365 0.0834 2.13 1.0012 96.47 0.1097 2.2257.-064 10.82 2.694 7.555 0.219 0.0704 1.74 1.0036 78.15 0.0672 0.81657.-065 10.83 2.700 7.556 0.213 0.0707 1.75 1.0000 64.68 0.0663 0.78657.-066 10.85 2.440 7.493 0.099 0.0557 1.38 1.0026 115.85 0.0336 0.18557.-067 10.84 2.440 7.494 0.099 0.0558 1.38 1.0060 98.87 0.0350 o.ln57.-068 10.84 2.440 7.496 0.100 0.0561 1.38 1.0043 169.67 0.0350 0.193- 57.-069 10.80 3.173 7.611 0.226 0.0937 2.31 1.0013 24.00 0.1949 2.45
VIIv 57.-070 10.70 3.131 7.576 0.266 0.0858 2.09 1.0000 32.15 0.0935 1.38
57.-071 10.69 3.120 7.583 0.277 0.0868 2.11 1.0018 41.00 0.0935 1.4457.-072 10.75 3.585 7.667 0.286 0.1195 2.93 1.0017 43.38 0.3610 5.7357.-073 10.73 3.438 7.635 0.352 0.1070 2.62 1.0019 24.93 0.2132 4.16
57.-074 10.73 3.420 7.649 0.371 0.1097 2.68 1.0000 49.00 0.1761 3.63
57.-075 10.72 3.443 7.646 0.347 0.1097 2.68 1.0066 47.23 0.1746 3.35
57.-076 10.75 3.456 7.646 0.334 0.1101 2.70 1.0025 48.53 0.1743 3.23
57.-100 10.30 5.119 7.703 0.740 0.1847 4.33 0.6003 10.13 0.3497 24.0
57.-101 10.Q3 5.234 7.732 0.772 0.2009 4.59 0.6002 12.07 0.3494 25.0
57.-102 10.30 5.136 7.714 0.874 0.1897 4.45 0.6001 10.82 0.3499 28.3
57.-103 10.88 3.997 7.630 0.437 0.1232 3.05 0.6000 35.83 0.1145 4.64
a - (Aco-Acs); b - Duration of experimenl.
•
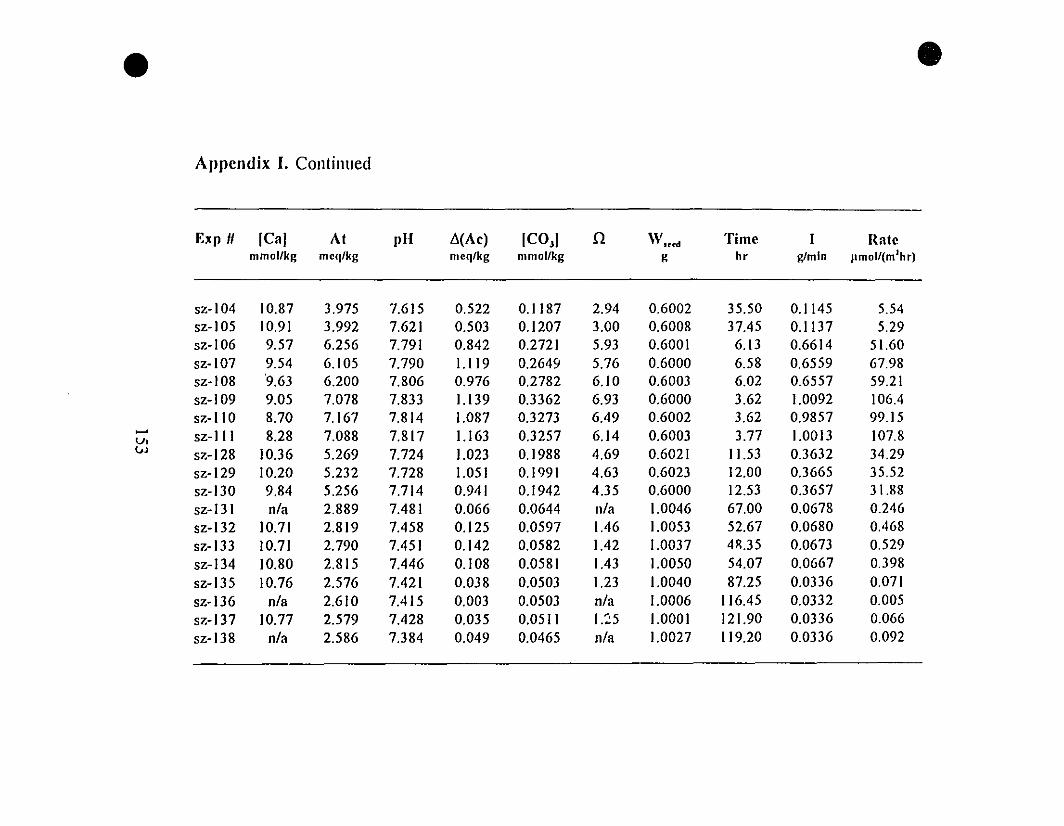
•Appcndix I. Continucd
•
Exp # ICaf At pH tl(Ac) ICO,! il \V1tC'd Time 1 Ratemmol/kg mcqlkg mcq!kg mmol!kg g hr gtmln 'Imoll(m1hr)
sz-104 10.87 3.975 7.615 0.522 0.1187 2.94 0.6002 35.50 0.1145 5.54sz-105 10.91 3.992 7.621 0.503 0.1207 3.00 0.6008 37.45 0.1137 5.29sz-106 9.57 6.256 7.791 0.842 0.2721 5.93 0.6001 6.13 0.6614 51.60sz-107 9.54 6.105 7.790 1.119 0.2649 5.76 0.6000 6.58 0.6559 67.98sz-108 '9.63 6.200 7.806 0.976 0.2782 6.10 0.6003 6.02 0.6557 59.21sz-109 9.05 7.078 7.833 1.139 0.3362 6.93 0.6000 3.62 1.0092 106.4sz-IIO 8.70 7.167 7.814 1.087 0.3273 6.49 0.6002 3.62 0.9857 99.15
~ sz- 1II 8.28 7.088 7.817 1.163 0.3257 6.14 0.6003 3.77 1.0013 107.8V.vJ sz-128 10.36 5.269 7.724 1.023 0.1988 4.69 0.6021 11.53 0.3632 34.29
sz-129 10.20 5.232 7.728 1.051 0.1991 4.63 0.6023 12.00 0.3665 35.52sz-130 9.84 5.256 7.714 0.941 0.1942 4.35 0.6000 12.53 0.3657 31.88sz- 131 nIa 2.889 7.481 0.066 0.0644 nIa 1.0046 67.00 0.0678 0.246sz-132 10.71 2.819 7.458 0.125 0.0597 1.46 1.0053 52.67 0.0680 0.468sz-133 10.71 2.790 7.451 0.142 0.0582 1.42 1.0037 4R.35 0.0673 0.529sz-134 10.80 2.815 7.446 0.108 0.0581 1.43 1.0050 54.07 0.0667 0.398sz-135 10.76 2.576 7.421 0.038 0.0503 1.23 1.0040 87.25 0.0336 0.071sz-136 nIa 2.610 7.415 0.003 0.0503 nIa 1.0006 116.45 0.0332 0.005sz-137 10.77 2.579 7.428 0.035 0.051 1 1.~5 1.0001 121.90 0.0336 0.066sz-138 nIa 2.586 7.384 0.049 0.0465 nIa 1.0027 119.20 0.0336 0.092
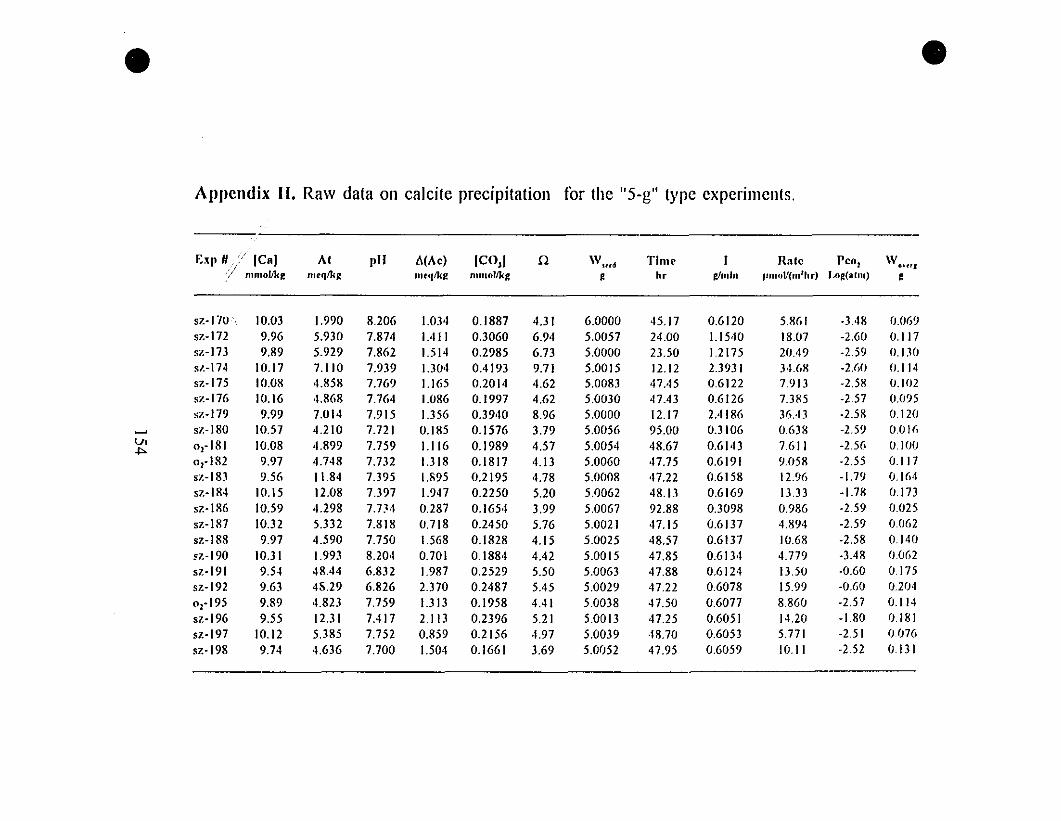
•Appcndix Il. Raw data on calcite precipitation for the "5-g" type cxpcrimcnls.
•
Exp # " (C.) At pli ll(Ae) (CO,) n \Vmil Tlme 1 Rate Pco J \V....,'mmollk2 lI1l'q lkll: llIeqlk2 mmollkjt 2 hr t'min ,UIIOL'(III'hr} Lo~(alm) 2
sz-110. 10.03 1.990 8.206 1.034 0.1887 4.31 6.0000 45.17 0.6120 5.861 ·3,48 0'<)69sz·l72 9.96 5.930 7.874 1.411 0.3060 6.94 5.0057 24.00 1.15·10 18.07 ·2.60 0.1 17sz·173 9.89 5.929 7.862 1.514 0.2985 6.73 5.0000 23.50 12175 20,4 9 -2.59 0.130sz·174 10.17 7.110 7.939 1.304 0,4193 9.71 5.0015 12.12 2.3931 H.68 ·2.W 0.114sz·175 10.08 4.858 7.769 1.165 0.2014 4.62 5.0083 47.'15 0.6122 7.913 ·2.58 0.102sz-176 10.16 4.868 7.764 1.086 0.1997 4.62 5.0030 47,43 0.6126 7.385 ·257 0.095s7.·179 9.99 7.014 7.915 1.356 0.3940 8.96 5.0000 12.17 2.4186 36..13 -2.58 0.120
~ sz·180 10.57 4.210 7.721 0.185 0.1576 3.79 5.0056 95.00 0.3106 0638 -2.59 0.01(,<Jo 0,·181 10.08 4.899 7.759 1.116 0.1989 4.57 5.0054 48.67 0.6143 7611 ·2.56 0.100-l>o
0,·182 9.97 4.748 7.732 1.318 0.1817 4.13 5.0060 47.75 0.6191 9.058 ·2.55 0.117sz-183 9.56 11.84 7.395 1.895 0.2195 4.78 5.0008 47.22 0.6158 12.96 -1.79 0.164s7.·184 10.15 12.08 7.397 1.947 0.2250 5.20 5.~062 48.13 0.6169 13.33 -1.78 0173sz·186 10.59 4.298 7.7J.l 0.287 0.1654 3.99 5.0067 92.88 0.3098 0.986 ·2.59 0.025sz-187 10.32 5.332 7.818 0.718 0.2450 5.76 5.0021 47.15 0.6137 4.894 ·2.59 0'<J62sz-188 9.97 4.590 7.750 1.568 0.1828 4.15 5.0025 48.57 0.6137 10.68 ·2.58 0.140sz·190 10.31 1.993 8.204 0.701 0.1884 4,42 5.0015 47.85 0.6134 4.779 ·3,48 0.062sz·191 9.54 48,44 6.832 1.987 0.2529 5.50 5.0063 47.88 0.6124 13.50 ·0.60 o 175sz-l92 9.63 48.29 6.826 2.370 0.2487 5,45 5.0029 47.22 0.6078 15.99 ·0.60 0.2040,·195 9.89 4.823 7.759 1.313 0.1958 4,41 5.0038 47.50 0.6077 8.860 ·2.57 0.114sz·196 9.55 12.31 7,417 2.113 0.2396 5.21 5.0013 47.25 0.6051 14.20 ·1.80 0.181,,·197 10.12 5.385 7.752 0.859 0.2156 4.97 5.0039 48.70 0.6053 5.771 ·2.51 00765z-198 9.74 4.636 7.700 1.504 0.1661 3.69 5.0052 47.95 0.6059 10.11 -252 o 131
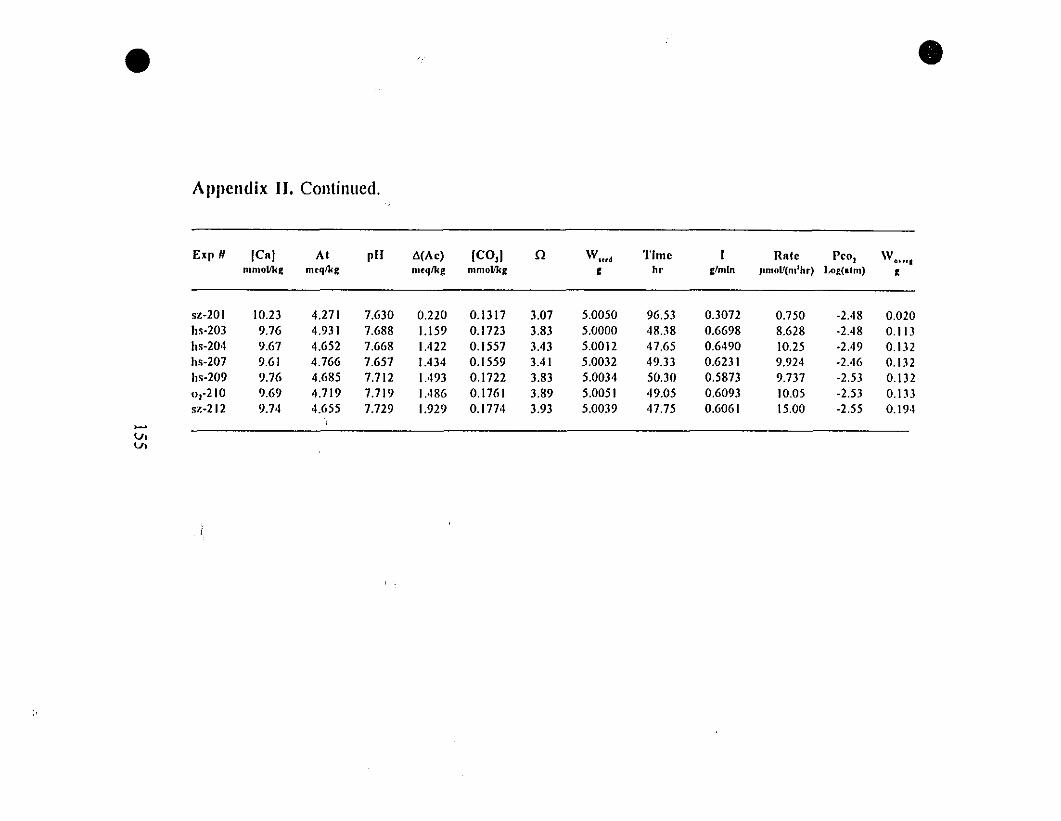
•Appendix II. Continued.
•
Exp /1 (CRI At pli 6(Ae) [CO,! n \Vurd Tlme 1 RRte PCO J 'Vo....mmoVk~ ml'qlk-= n1tqlkg mmolJ1cg g hr g/mln 'lmol!(m'hr) l.og(alm) g
sz-201 10.23 4.271 7.630 0.220 0.1317 3.07 5.0050 96.53 0.3072 0.750 -2.48 0.020hs-203 9.76 4.931 7.688 1.159 0.1723 3.83 5.0000 48.38 0.6698 8.628 -2.48 0.113hs-204 9.67 4.652 7.668 1.422 0.1557 3.43 5.0012 47.65 0.6490 10.25 -2.49 0.132hs-207 9.61 4.766 7.657 1.434 0.1559 3.41 5.0032 49.33 0.6231 9.924 -2.46 0.\32hs-209 9.76 4.685 7.712 \.493 0.\722 3.83 5.0034 50.30 0.5873 9.737 -2.53 0.\320,-210 9.69 4.719 7.719 1.486 0.\76\ 3.89 5.0051 49.05 0.6093 10.05 -2.53 0.133s,,-212 9.74 4.655 7.729 1.929 0.1774 3.93 5.0039 47.75 0.606\ \5.00 -2.55 0.194
......v,v.
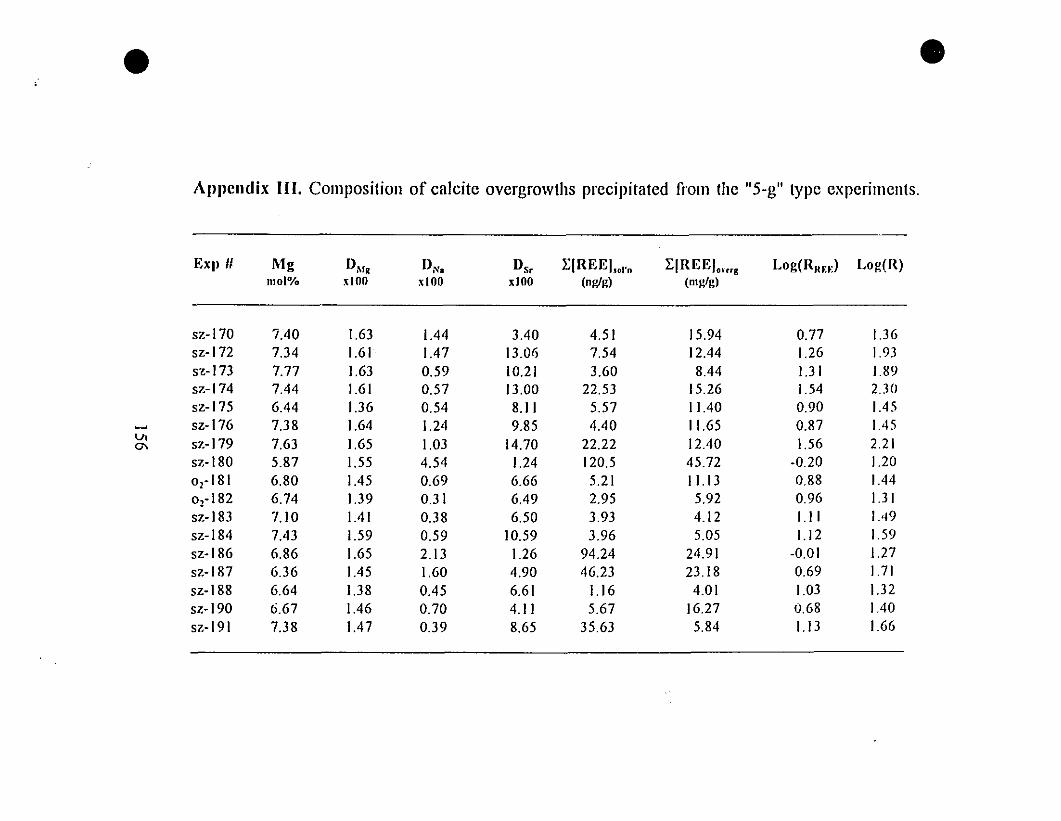
• •Aflflcndix III. Composition of calcite overgrowths precipitatcd from thc "5-g" type cxpcrimcnts.
Exp # Mg DMR UNI Ds• E[REEI..,·. E[REE]..". Log(RRF.t:) Log(R)0101% ,100 ,100 ,100 (nglg) (ntglg)
5z-170 7040 1.63 1.44 3040 4.51 15.94 0.77 1.365z-l72 7.34 1.61 1.47 13.06 7.54 12044 1.26 1. 935'1:- J73 7.77 1.63 0.59 10.21 3.60 8044 1.31 1.895z-174 7044 1.61 0.57 13.00 22.53 15.26 1.54 2.305z-175 6044 1.36 0.54 8.11 5.57 11040 0.90 1045
~ 5z-176 7.38 1.64 1.24 9.85 4040 11.65 0.87 1.45VI 5z-179 7.63 1.65 1.03 14.70 22.22 12040 1.56 2.21cr-
5z-180 5.87 1.55 4.54 1.24 120.5 45.72 -0.20 1.200,-181 6.80 1045 0.69 6.66 5.21 11.13 0.88 1.440,-182 6.74 1.39 0.31 6049 2.95 5.92 0.96 1.315z-183 7.10 1041 0.38 6.50 3.93 4.12 1.11 IA95z-184 7.43 1.59 0.59 10.59 3.96 5.05 1.12 1.595z-186 6.86 1.65 2.13 1.26 94.24 24.91 -0.01 1.275z-187 6.36 1045 1.60 4.90 46.23 23.18 0.69 1.715z-188 6.64 1.38 0045 6.61 1.16 4.01 1.03 1.325z-190 6.67 1.46 0.70 4.11 5.67 16.27 0.68 1.405z-191 7.38 1.47 0.39 8.65 35.63 5.84 1.13 1.66
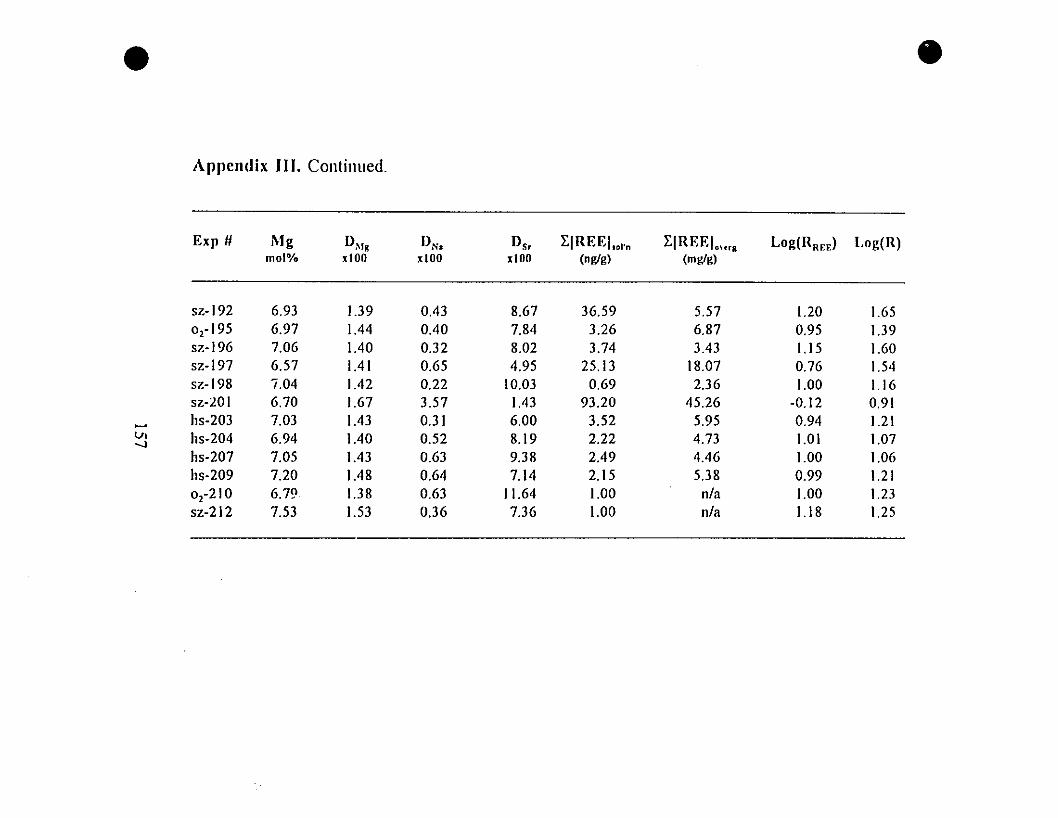
•Appendix III. Contillued.
•
Exp # Mg DM, DN• Ds• LIREEI",·. LIREEI...., Log(R.,,) Log(R)mol% ,100 '100 ,100 (nglg) (mglg)
sz-l92 6.93 1.39 0.43 8.67 36.59 5.57 1.20 1.650,-195 6.97 1.44 0.40 7.84 3.26 6.87 0.95 1.39sz-l96 7.06 1.40 0.32 8.02 3.74 3.43 1.15 1.60sz-l97 6.57 1.41 0.65 4.95 25.13 18.07 0.76 1.54sz-198 7.04 1.42 0.22 10.03 0.69 2.36 1.00 1.16sz-20 1 6.70 1.67 3.57 1.43 93.20 45.26 -0.12 0.91
...... I1s-203 7.03 1.43 0.31 6.00 3.52 5.95 0.94 1.21v, I1s-204 6.94 1.40 0.52 8.19 2.22 4.73 1.01 1.07-J
I1s-207 7.05 1.43 0.63 9.38 2.49 4.46 1.00 1.06I1s-209 7.20 1.48 0.64 7.14 2.15 5.38 0.99 1.210,-210 6.79 1.38 0.63 11.64 1.00 nIa 1.00 1.23sz-212 7.53 1.53 0.36 7.36 1.00 nIa 1.18 1.25

•Appcndix IV. Raw clata on calcite precipitation for the "O.6-g·' type experiments.
'1
•
Exp # (Cal At plI [CO,I n \Vurd Timc 1 Peo, [l\Igl..". \v.Wl Ratcmmollkg mt'q!kg mmol/kg g hr glmln l.og(alm) "glg mg 'lmol/(m l hr)
sz-113 10.87 5.165 7.803 0.230 5.69 0.6000 23.58 1.274 -2.59 89.7 4.38 5.95sz-114 10.96 5.326 7.797 0.234 5.85 0.6010 23.45 1.261 -2.57 78.0 3.98 5.44sz-115 10.94 5.305 7.780 0.225 5.61 0.6016 22.33 1.249 ·2.55 52.3 2.47 3.54sz-116 10.97 4.067 7.606 0.119 2.98 0.6007 91.28 0.346 -2.48 150.9 6.59 2.31sz·117 10.86 7.438 7.926 0.427 10.57 0.6013 5.48 5.458 ·2.56 54.9 2.87 16.74sz-118 10.78 7.390 7.919 0.419 10.28 0.6000 5.31 5.398 ·2.56 79.2 3.78 22.81s7.-119 10.80 3.943 8.034 0.278 6.85 0.6026 90.12 0.331 -2.97 209.0 9.14 3.24sz-120 10.77 7.308 8.171 0.675 16.57 0.6000 5.45 5.250 ·2.85 92.1 4.65 27.35
- s7.-122 10.75 6.497 7.825 0.3U3 7.43 0.6016 Il.73 2.655 ·2.51 95.6 4.56 12,42V1 sz-123 10.82 6.604 7.889 0.352 8.67 0.6024 Il.52 2.674 ·2.57 112.9 4.99 13.8400
s7.-124 1lJ.76 6,459 7.870 0.331 8.11 0.6009 12.05 2.672 -2.56 116,4 5.26 13.'JXsz·125 1lJ.73 7.523 7.771 0.314 7.68 0.6057 5.55 5.314 -2.39 82.8 4.59 26.26sz-126 10.82 4.052 7.532 0.101 2,49 0.6030 90.12 0.330 -2.40 66.9 3.U5 1.08sz·127 10.84 4.036 7.625 '. !J.123 3.04 0.6017 83.47 0.331 -2.50 88.9 4.16 1.59sz·139 10,44 13,44 7.392 0.248 5.89 0.6018 25.38 Ll58 -1.73 36.5 2.14 2.69sz-140 10.53 13.33 7.374 0.236 5.65 0.6028 26.00 LlI7 ·1.72 85.7 4.36 5.35sz-141 10.51 13.17 7.372 0.232 5.56 0.6015 24.72 1.095 -1.72 94.4 3.76 4.86
s7.·142 10.53 2.276 8.209 0.218 5.24 0.5999 27.32 1.078 ·3.42 51.2 2.fJ4 2.40
0,·143 10.83 5.845 7.827 0.274 6.75 0.6006 92.00 0.331 ·2.56 137.3 5.98 2.US
0,-144 10.83 5.720 7.883 0.301 7,41 0.6040 47.58 0.666 -2.63 92,4 4M, 2.98
0,-145 IU.78 5.878 7.845 0.286 7.02 0.6016 45.10 0.674 ·2.58 95.3 4.21 2.98
0,·146 10.75 5.901 7.849 0.289 7.08 0.6002 45.53 0.678 -2.58 107.5 4.53 3.19sz·147 11.23 4.566 7.748 0.181 4.63 0.6020 100.00 0.297 ·2.58 70.8 3.02 096
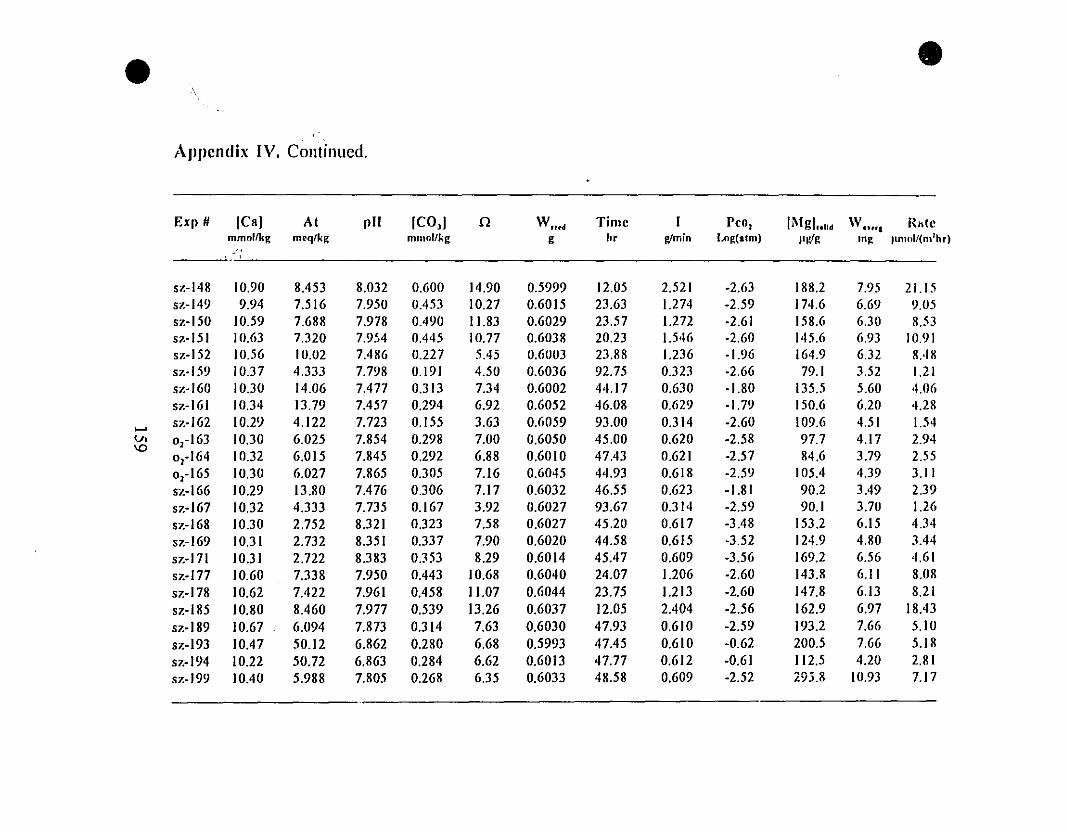
•AJlJlcndix IV. Conlil1ucd.
•
EXil # (Ca) Al pli (CO,) n \VUt4 Time [ Peo, IMgl"", \"eurl Rotemmo,n.g meq/kg mmol/kg g hr glmin Lo~(atm) "Wg m~ '111101f(m'hr)
--,•..l,'
570-148 10.90 8.453 8.032 0.600 14.90 0.5999 12.05 2.521 -2.63 188.2 7.95 21.15570-149 9.94 7.516 7.950 0.453 10.27 0.60[5 23.63 1.274 -2.59 174.6 6.69 9.05570-150 10.59 7.688 7.978 0.490 11.83 0.6029 23.57 1.271 -2.61 158.6 6.30 8.53570-151 10.63 7.320 7.954 0.445 10.77 0.6038 20.23 1.546 -2.60 145.6 6.93 10.91570-152 10.56 10.02 7.486 0.227 5.45 0.6003 23.88 1.236 -1.96 164.9 6.32 8.48570-159 10.37 4.333 7.798 0.191 4.50 0.6036 92.75 0.323 -2.66 79.1 3.52 1.21570-160 10.30 14.06 7.477 0.313 7.34 0.6002 44.17 0.630 -1.80 135.5 5.60 4.0657.-161 10.34 13.79 7.457 0.294 6.92 0.6052 46.08 0.629 -1.79 150.6 6.20 4.28
...... 570-162 10.29 4.122 7.723 0.155 3.63 0.6059 93.00 0.314 -2.60 109.6 4.51 1.54v, 0,-163 10.30 6.025 7.854 0.298 7.00 0.6050 45.00 0.620 -2.58 97.7 4.17 2.94'0
0,-164 10.32 6.015 7.845 0.292 6.88 0.6010 47.43 0.621 -2.57 84.6 3.79 2.550,-165 10.30 6.027 7.865 0.305 7.[6 0.6045 44.93 0.618 -2.59 105.4 4.39 3.1151.-166 10.29 13.80 7.476 0.306 7.17 0.6032 46.55 0.623 -1.81 90.2 3.49 2.39
57.-167 10.32 4.333 7.735 0.167 3.92 0.6027 93.67 0.314 -2.59 90.1 3.70 1.26
570-168 10.30 2.752 8.321 0.323 7.58 0.6027 45.20 0.617 -3.48 153.2 6.15 4.34
57.-169 10.31 2.732 8.351 0.337 7.90 0.6020 44.58 0.6[5 -3.52 124.9 4.80 3.44
57.-171 10.31 2.722 8.383 0.353 8.29 0.6014 45.47 0.609 -3.56 169.2 6.56 4.61
57.- 177 10.60 7.338 7.950 0.443 10.68 0.6040 24.07 1.206 -2.60 143.8 6.11 8.08
57.-178 10.62 7.422 7.961 0.458 11.07 0.6044 23.75 1.213 -2.60 147.8 6.13 8.21
57.-185 10.80 8.460 7.977 0.539 13.26 0.6037 12.05 2.404 -2.56 162.9 6.97 18.43
57.-189 10.67 6.094 7.873 0.314 7.63 0.6030 47.93 0.610 -2.59 193.2 7.66 5.10
57.-193 10.47 50.12 6.862 0.280 6.68 0.5993 47.45 0.610 -0.62 200.5 7.66 5.18
57.-194 10.22 50.72 6.863 0.284 6.62 0.6013 47.77 0.612 -0.61 112.5 4.20 2.81
57.-199 10.40 5.988 7.805 0.268 6.35 0.6033 48.58 0.609 -2.52 295.8 10.93 7.17

•Appcndix IV. Continued.
•
......0\o
EXil # (Cn) Al Il'' (CO,) n \V"'d Timc 1 Peo, [Mg]..". 'V'url Ralcmmnllkg mt'q/kg mmol!kg g hr glOlin Log(a.m) ,iglg mg 'UTIolI(m'hr)
s7.-20U 10.34 6.154 7.780 0.262 6.16 0.6052 48.43 0.606 -2.48 149.2 5.72 3.75sz-202 10.36 6.125 7.827 0.287 6.77 0.6070 47.88 0.605 -2.54 154.3 6.11 4.U4hs-205 10.40 6.266 7.827 0.294 6.96 0.6070 47.90 0.637 -2.53 167.8 6.33 4.19hs-2U6 10.31 6.157 7.791 0.268 6.29 0.6025 48.10 0.622 -2.50 166.4 6.20 4.11hs-208 10.32 6.170 7.817 0.283 6.66 0.6043 49.75 0.571 -2.52 135.7 5.U6 3.24
1.1
'/
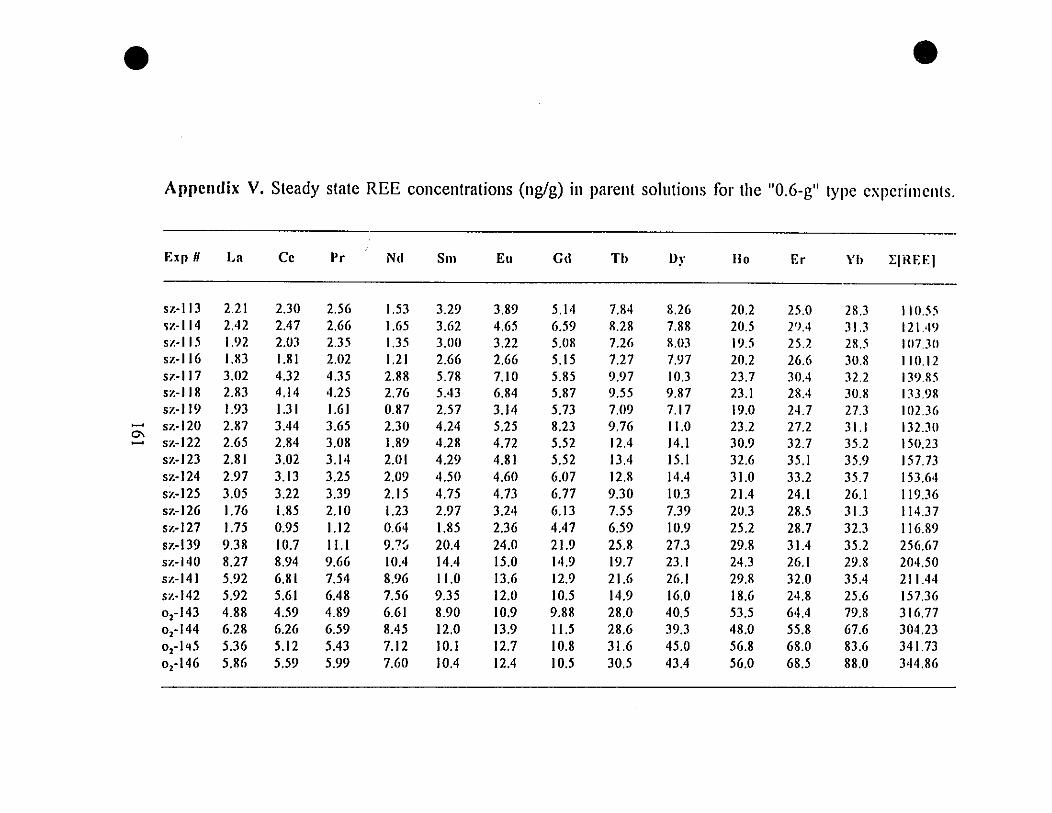
• •Appcnllix V. Steady state REE concentrations (ng/g) in parent solutions for the "O.6-g" type cxpcrimcnts.
Exp # La Cc Pr Nd Sm Eu Gd Tb Dy 110 Er Yb rlnEEI
51.-113 2.21 2.30 2.56 1.53 3.29 3.89 5.14 7.84 8.26 20.2 25.0 28.3 110.55~1.-114 2.42 2.47 2.66 1.65 3.62 4.65 6.59 8.28 7.88 20.5 2').4 31.3 121.4951.-1 15 1.92 2.03 2.35 1.35 3.00 3.22 5.08 7.26 8.03 19.5 25.2 28.5 1117.31151.-116 1.83 1.81 2.02 1.21 2.66 2.66 5.15 7.27 7.97 20.2 26.6 30.8 1111.1251.-117 3.02 4.32 4.35 2.88 5.78 7.10 5.85 9.97 10.3 23.7 30.4 32.2 139.8551.-118 2.83 4.14 4.25 2.76 5.43 6.84 5.87 9.55 9.87 23.1 28.4 30.8 133.9851.-119 1.93 1.31 1.61 0.87 2.57 3.14 5.73 7.09 7.17 19.0 24.7 27.3 102.36- 51.-120 2.87 3.44 3.65 2.30 4.24 5.25 8.23 9.76 11.0 23.2 27.2 31.1 132.30
0\51.-122 2.65 2.84 3.08 1.89 4.28 4.72 5.52 12.4 14.1 30.9 32.7 35.2 150.23- 51.-123 2.81 3.02 3.14 VII 4.29 4.81 5.52 13.4 15.1 32.6 35.1 35.9 157.7351.-124 2.97 3.13 3.25 2.09 4.50 4.60 6.07 12.8 14.4 31.0 33.2 35.7 153.6451.-125 3.05 3.22 3.39 2.15 4.75 4.73 6.77 9.30 10.3 21.4 24.1 26.1 119.3651.-126 1.76 1.85 2.10 1.23 2.97 3.24 6.13 7.55 7.39 20.3 28.5 31.3 114.3751.-127 1.75 0.95 1.12 0.64 1.85 2.36 4.47 6.59 10.9 25.2 28.7 32.3 116.8951.-139 9.38 10.7 11.1 9.?~ 20.4 24.0 21.9 25.8 27.3 29.8 31.4 35.2 256.6751.-140 8.27 8.94 9.66 10.4 14.4 15.0 14.9 19.7 23.1 24.3 26.1 29.8 204.5051.-141 5.92 6.81 7.54 8.96 11.0 13.6 12.9 21.6 26.1 29.8 32.0 35.4 211.4451.-142 5.92 5.61 6.48 7.56 9.35 12.0 10.5 14.9 16.0 18.6 24.8 25.6 157.360,-143 4.88 4.59 4.89 6.61 8.90 10.9 9.88 28.0 40.5 53.5 64.4 79.8 316.770,-144 6.28 6.26 6.59 8.45 12.0 13.9 11.5 28.6 39.3 48.0 55.8 67.6 304.230,-lq5 5.36 5.12 5.43 7.12 10.1 12.7 10.8 31.6 45.0 56.8 68.0 83.6 341.730,-146 5.86 5.59 5.99 7.60 10.4 12.4 10.5 30.5 43.4 56.0 68.5 88.0 344.86
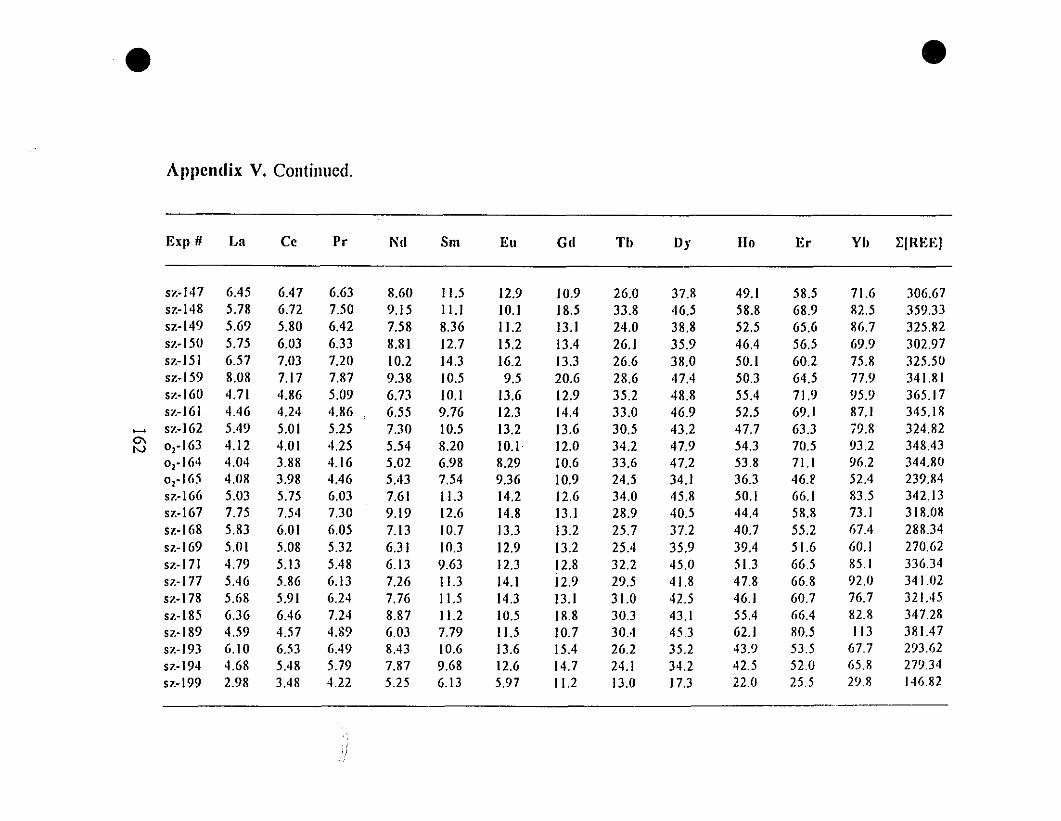
•Appendix V. Continued.
•
EXil # La Cc Pr Nd Sm Eu Gd Tb Dy 110 Er Yb ~IREEJ
57.-147 6.45 6.47 6.63 8.60 11.5 12.9 10.9 26.0 37.8 49.1 58.5 71.6 306.6757.-148 5.78 6.72 7.50 9.15 11.1 10.1 18.5 33.8 46.5 58.8 68.9 82.5 359.3357.-149 5.69 5.80 6.42 7.58 8.36 11.2 13.1 24.0 38.8 52.5 65.6 86.7 325.8257.-150 5.75 6.03 6.33 8.81 12.7 15.2 13.4 26.1 35.9 46.4 56.5 69.9 302.9757.-151 6.57 7.03 7.20 10.2 14.3 16.2 13.3 26.6 38.0 50.1 60.2 75.8 325.5057.-159 8.08 7.17 7.87 9.38 10.5 9.5 20.6 28.6 47.4 50.3 64.5 77.9 341.8157.-160 4.71 4.86 5.09 6.73 10.1 13.6 12.9 35.2 48.8 55.4 71.9 95.9 365.1757.-161 4.46 4.24 4.86 6.55 9.76 12.3 14.4 33.0 46.9 52.5 69.1 87.1 345.18
~ 57.-162 5.49 5.01 5.25 7.30 10.5 13.2 13.6 30.5 43.2 47.7 63.3 ï9.8 324.820\ 0,-163 4.12 4.01 4.25 5.54 8.20 10.1 12.0 34.2 47.9 54.3 70.5 93.2 348.431-..1
0,.164 4.04 3.88 4.16 5.02 6.98 8.29 10.6 33.6 47.2 53.8 71.1 96.2 344.800,.165 4.08 3.98 4.46 5.43 7.54 9.36 10.9 24.5 34.1 36.3 46.F 52.4 239.8457.-166 5.03 5.75 6.03 7.61 11.3 14.2 12.6 34.0 45.8 50.1 66.1 83.5 342.13Sl.·167 7.75 7.54 7.30 9.19 12.6 14.8 13.1 28.9 40.5 44.4 58.8 73.1 318.0857.-168 5.83 6.01 6.05 7.13 10.7 13.3 13.2 25.7 37.2 40.7 55.2 67.4 288.3457.-169 5.01 5.08 5.32 6.31 10.3 12.9 13.2 25.4 35.9 39.4 51.6 60.1 270.6257.-171 4.79 5.13 5.48 6.13 9.63 12.3 12.8 32.2 45.0 51.3 66.5 85.1 336.3457.-177 5.46 5.86 6.13 7.26 11.3 14.1 12.9 29.5 41.8 47.8 66.8 92.0 341.0257.-178 5.68 5.91 6.24 7.76 11.5 14.3 13.1 31.0 42.5 46.1 60.7 76.7 321.4557.-185 6.36 6.46 7.24 8.87 11.2 10.5 18.8 30.3 43.1 55.4 66.4 82.8 347.2857.-189 4.59 4.57 4.89 6.03 7.79 11.5 10.7 30.4 45.3 62.1 80.5 113 381.4757.-193 6.10 6.53 6.49 8.43 10.6 13.6 15.4 26.2 35.2 43.9 53.5 67.7 293.6257.-194 4.68 5.48 5.79 7.87 9.68 12.6 14.7 24.1 34.2 42.5 52.0 65.8 279.3457.-199 2.98 3.48 4.22 5.25 6.13 5.97 11.2 13.0 17.3 22.0 25.5 29.8 146.82
,'1
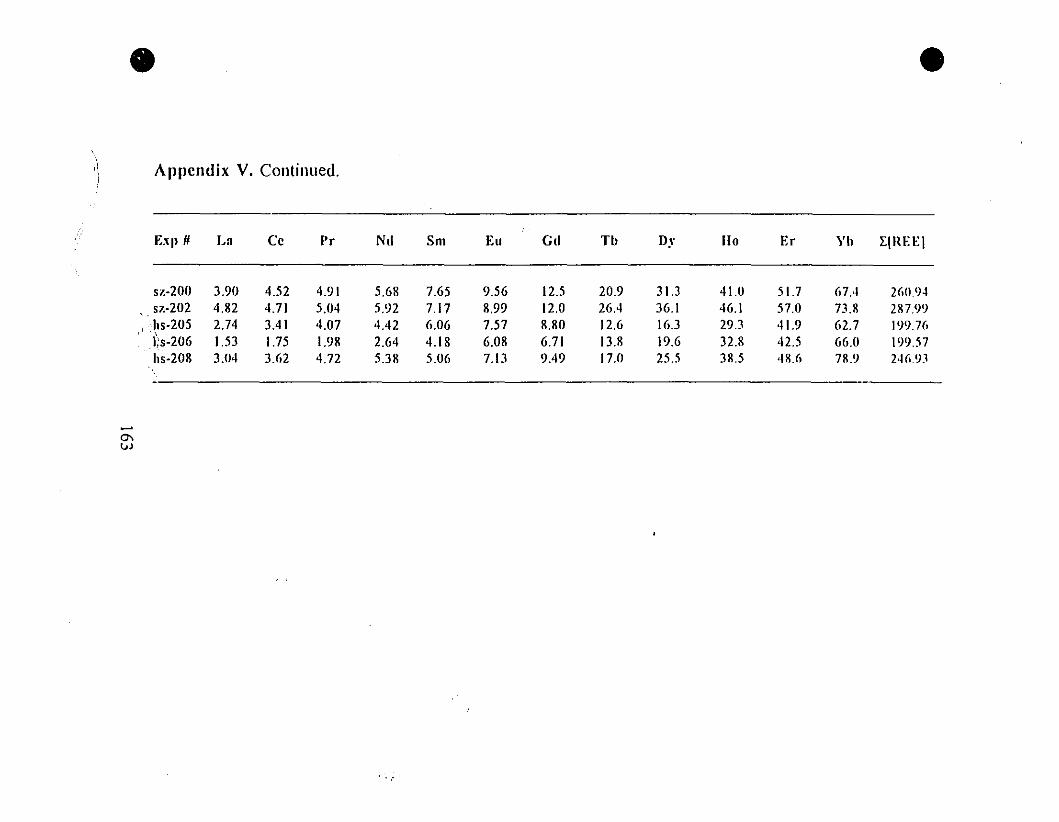
• •,'i Appcndix V. Continued.!
E"fI # Ln Cc Pr Nd Sm Eu Gd Tb D~' 110 Er Yb l:IHEEI
sz-200 3.90 4.52 4.91 5.68 7.65 9.56 12.5 20.9 31.3 41.0 51.7 67.4 260.9~
sz-202 4.82 4.71 5.04 5.n 7.17 8.99 12.0 26.4 36.1 46.1 57.0 73.8 287.99,bs-205 2.74 3.41 4.07 4.42 6.06 7.57 8.80 12.6 16.3 29.3 41.9 62.7 199.76"i)s-206 1.53 1.75 1.98 2.64 4.18 6.08 6.71 13.8 19.6 32.8 42.5 66.0 199.57
hs-208 3.04 3.62 4.72 5.38 5.06 7.13 9.49 17.0 25.5 38.5 48.6 78.9 24('.9.1
-a-v)
" ',r
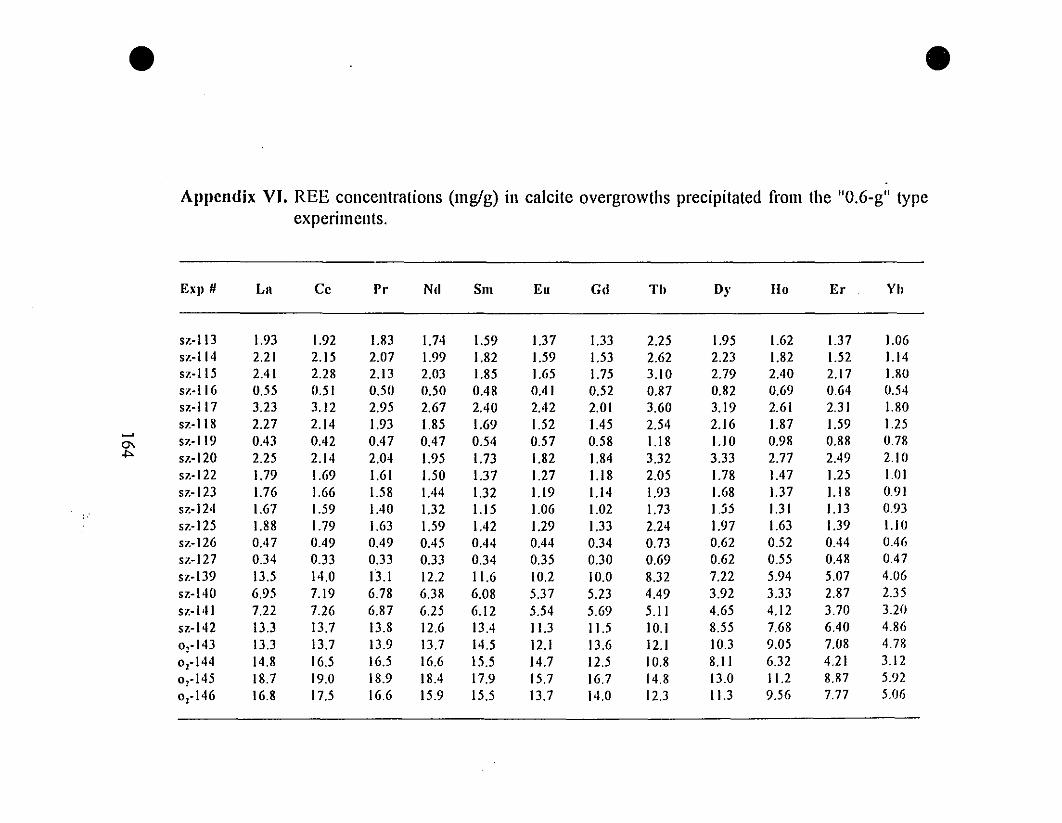
• •Appcndix VI. REE concentrations (mg/g) in calcite overgrowths precipitated from the "O.6-g" type
experimcnts.
Ex)! # Ln Cc Pr Nd Sm Eu Gd Tb Dy 110 Er Yb
57.-113 1.93 1.92 1.83 1.74 1.59 1.37 1.33 2.25 1.95 1.62 1.37 1.0657.-114 2.21 2.15 2.07 1.99 1.82 1.59 1.53 2.62 2.23 1.82 1.52 1.1457.-115 2.41 2.28 2.13 2.03 1.85 1.65 1.75 3.10 2.79 2.40 2.17 1.8057.-116 0.55 0.51 0.50 0.50 0.48 0.41 0.52 0.87 0.82 0.69 0.64 0.5457.-117 3.23 3.12 2.95 2.67 2.40 2.42 2.01 3.60 3.19 2.61 2.31 1.8057.-118 2.27 2.14 1.93 1.85 1.69 1.52 1.45 2.54 2.16 1.87 1.59 1.25
~
57.-119 0.43 0.42 0.47 0.47 0.54 0.57 0.58 1.18 1.10 0.98 0.88 0.780\.j:>. 57.-120 2.25 2.14 2.04 1.95 1.73 1.82 1.84 3.32 3.33 2.77 2.49 2.10
57.-122 1.79 1.69 1.61 1.50 1.37 1.27 1.18 2.05 1.78 1.47 1.25 1.0157.-123 1.76 1.66 1.58 1.44 1.32 1.19 1.14 1.93 1.68 1.37 1.18 0.9157.-124 1.67 1.59 1.40 1.32 1.15 1.06 1.02 1.73 155 1.31 1.13 0.93
: :
57.-125 1.88 1.79 1.63 1.59 1.42 1.29 1.33 2.24 1.97 1.63 1.39 1.1057.-126 0.47 0.49 0.49 0.45 0.44 0.44 0.34 0.73 0.62 0.52 0.44 0.4657.-127 0.34 0.33 0.33 0.33 0.34 0.35 0.30 0.69 0.62 0.55 0.48 0.4757.-139 13.5 14.0 13.1 12.2 11.6 10.2 10.0 8.32 7.22 5.94 5.07 4.0657.-140 6.95 7.19 6.78 6.38 6.08 5.37 5.23 4.49 3.92 3.33 2.87 2.3557.-141 7.22 7.26 6.87 6.25 6.12 5.54 5.69 5.11 4.65 4.12 3.70 3.2057.-142 13.3 13.7 13.8 12.6 13.4 11.3 11.5 10.1 8.55 7.68 6.40 4.860,-143 13.3 13.7 13.9 13.7 14.5 12.1 13.6 12.1 10.3 9.05 7.08 4.780,-144 14.8 16.5 16.5 16.6 15.5 14.7 12.5 10.8 8.11 6.32 4.21 3.120,-145 18.7 19.0 18.9 18.4 17.9 15.7 16.7 14.8 13.0 11.2 8.87 5.920,-146 16.8 17.5 16.6 15.9 15.5 13.7 14.0 12.3 11.3 9.56 7.77 5.1J6
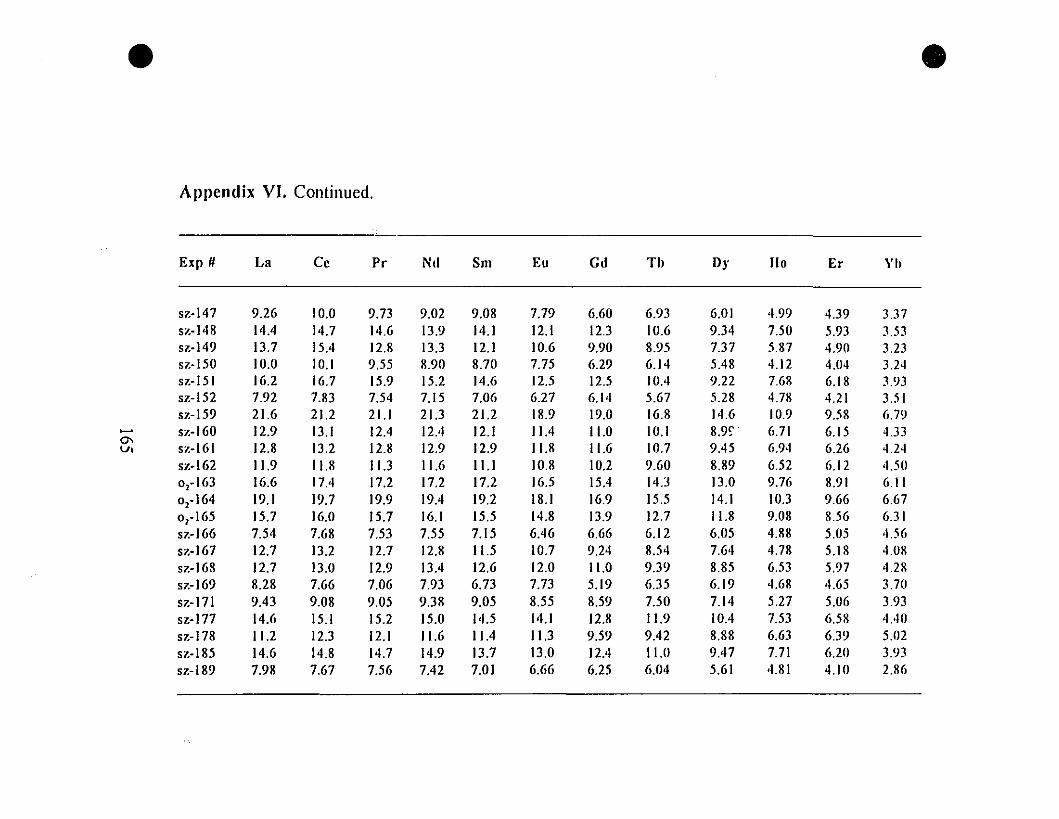
•Appendix VI. Continued.
•
Exp" La Cc Pr Nd Sm Eu Gd Tb D}' 110 Er Yh
51.-147 9.26 10.0 9.73 9.02 9.08 7.79 6.60 6.93 6.01 4.99 4.39 3.3751.-148 14.4 14.7 14.6 13.9 14.1 12.1 12.3 10.6 9.34 7.50 5.93 3.5351.-149 13.7 15.4 12.8 13.3 12.1 10.6 9.90 8.95 7.37 5.87 4.90 3.2351.-150 10.0 10.1 9.55 8.90 8.70 7.75 6.29 6.14 5.48 4.12 4.04 3.2451.-151 16.2 16.7 15.9 15.2 14.6 12.5 12.5 10.4 9.22 7.68 6.18 3.'1351.-152 7.92 7.83 7.54 7.15 7.06 6.27 6.14 5.67 5.28 4.78 4.21 3.5151.-159 21.6 21.2 21.1 21.3 21.2 18.9 19.0 16.8 14.6 10.9 9.58 6.7'1
...... 51.-160 12.9 13.1 12.4 12.4 12.1 Il.4 11.0 10.1 8.9, 6.71 6.15 4.330\
51.-161 12.8 13.2 12.8 12.9 12.9 Il.8 11.6 10.7 9.45 6.94 6.26 4.24v,51.-162 Il.9 Il.8 11.3 11.6 11.1 10.8 10.2 9.60 8.89 6.52 6.12 4.500,-163 16.6 17.4 17.2 17.2 17.2 16.5 15.4 14.3 13.0 9.76 8.91 6.110,-164 19.1 19.7 19.9 19.4 19.2 18.1 16.9 15.5 14.1 10.3 9.66 6.670,-165 15.7 16.0 J5.7 16.1 15.5 14.8 13.9 12.7 11.8 9.08 8.56 6.3151.-166 7.54 7.68 7.53 7.55 7.15 6.46 6.66 6.12 6.05 4.88 5.05 4.5651.-167 12.7 13.2 12.7 12.8 11.5 10.7 9.24 8.54 7.64 4.78 5.18 4.0851.-168 12.7 13.0 12.9 13.4 12.6 12.0 11.0 9.39 8.85 6.53 5.97 4.2851.-169 8.28 7.66 7.06 7.93 6.73 7.73 5.19 6.35 6.19 4.68 4.65 3.7051.-171 9.43 9.08 9.05 9.38 9.05 8.55 8.59 7.50 7.14 5.27 5.06 3.9351.-177 14.6 15.1 15.2 15.0 14.5 14.1 12.8 11.'1 10.4 7.53 6.58 4.4051.-178 11.2 12.3 12.1 Il.6 1J.4 11.3 9.59 9.42 8.88 6.63 6.39 5.0251.-185 14.6 14.8 14.7 14.9 13.7 13.0 12.4 11.0 9.47 7.71 6.20 3.9351.-189 7.98 7.67 7.56 7.42 7.01 6.66 6.25 6.04 5.61 4.81 4.10 2.86
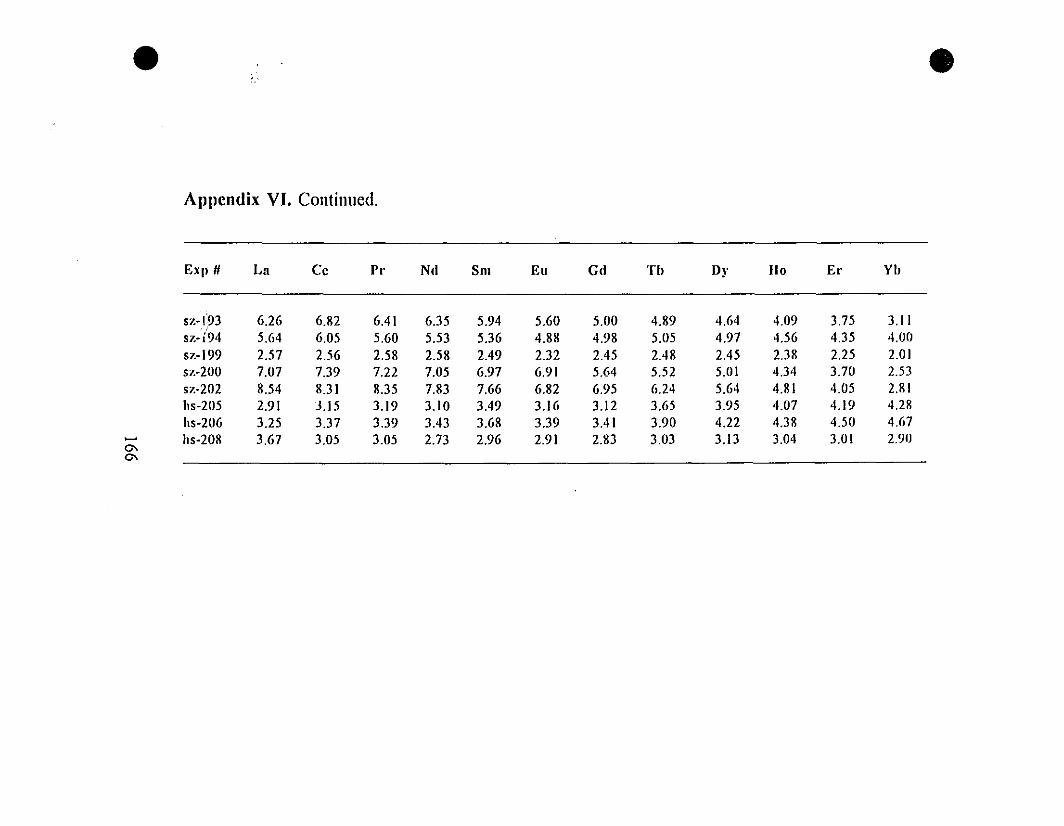
• ','
Appcndix VI. Continued.
•
EXil # Ln Cc Pr Nd Sm Eu Gd Tb D)' 110 Er Yb
sz-I'93 6.26 6.82 6.41 6.35 5.94 5.60 5.00 4.89 4.64 4.09 3.75 3.11.)
sz-i94 5.64 6.05 5.60 5.53 5.36 4.88 4.98 5.05 4.97 4.56 4.35 4.00sz-199 2.57 2.56 2.58 2.58 2.49 2.32 2.45 2.48 2.45 2.38 2.25 2.01sl.-200 7.07 7.39 7.22 7.05 6.97 6.91 5.64 5.52 5.01 4.34 3.70 2.53sz-202 8.54 8.31 8.35 7.83 7.66 6.82 6.95 6.24 5.64 4.81 4.05 2.81hs-205 2.91 3.15 3.19 3.10 3.49 3.16 3.12 3.65 3.95 4.07 4.19 4.28hs-206 3.25 3.37 3.39 3.43 3.68 3.39 3.41 3.90 4.22 4.38 4.50 4.67
~ hs-208 3.67 3.05 3.05 2.73 2.96 2.91 2.83 3.03 3.13 3.04 3.01 2.900-.0\
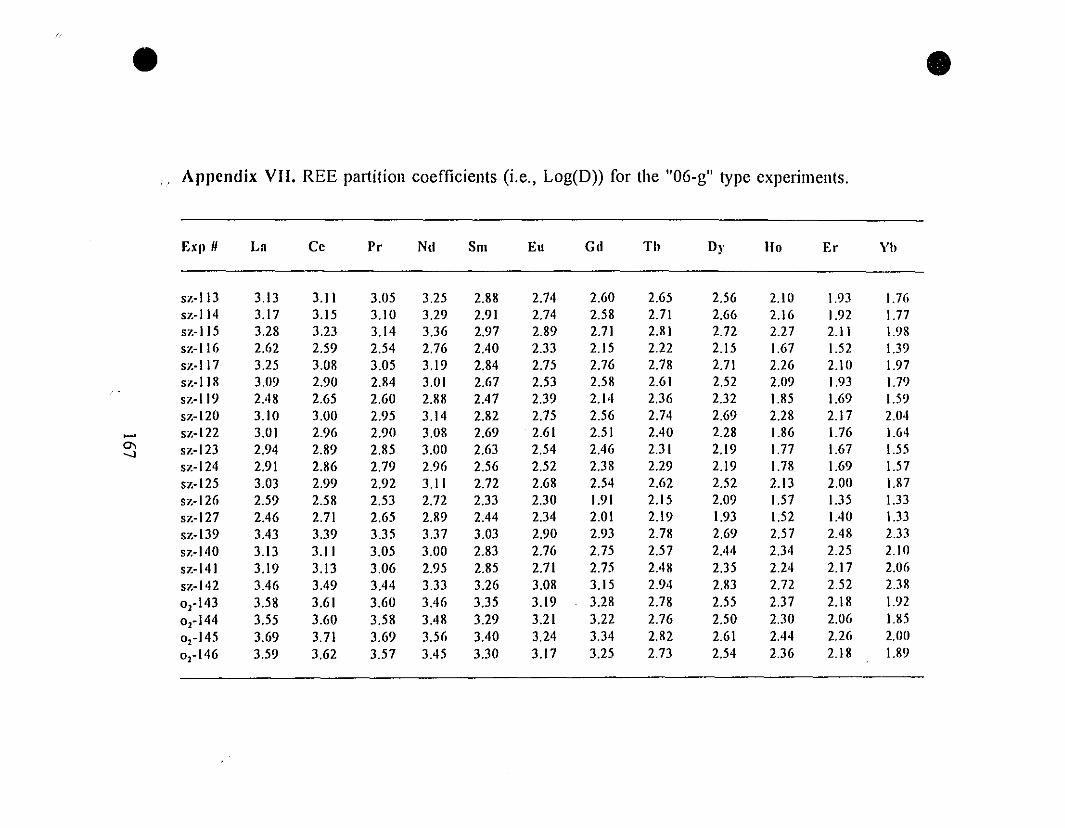
•... Appendix VII. REE partition coefficients (i.e., Log(D)) for the "ü6-g" type expcrimcnts.
EXIl # La Cc Pr Nil Sm Eu Gd Tb Dl' 110 Er Yb
sz-113 3.13 3.11 3.05 3.25 2.88 2.74 2.60 2.65 2.56 2.10 1.93 1.76sz-114 3.17 3.15 3.10 3.29 2.91 2.74 2.58 2.71 2.66 2.16 1.92 1.77sz-115 3.28 3.23 3.14 3.36 2.97 2.89 2.71 2.81 2.72 2.27 2.11 1.98sz-116 2.62 2.59 2.54 2.76 2.40 2.33 2.15 2.22 2.15 1.67 1.52 1.39sz-II 7 3.25 3.08 3.05 3.19 2.84 2.75 2.76 2.78 2.71 2.26 2.10 1.97sz-118 3.09 2.90 2.84 3.01 2.67 2.53 2.58 2.61 2.52 2.09 1.93 1.79sz-119 2.48 2.65 2.60 2.88 2.47 2.39 2.14 2.36 2.32 1.85 1.69 1.59sz-120 3.10 3.00 2.95 3.14 2.82 2.75 2.56 2.74 2.69 2.28 2.17 2.04
..... sz-122 3.01 2.96 2.90 3.08 2.69 2.61 2.51 2.40 2.28 1.86 1.76 1.640\ sz-123 2.94 2.89 2.85 3.00 2.63 2.54 2.46 2.31 2.19 1.77 1.67 1.55-.l
sz-124 2.91 2.86 2.79 2.96 2.56 2.52 2.38 2.29 2.19 1.78 1.69 1.57sz-125 3.03 2.99 2.92 3. Il 2.72 2.68 2.54 2.62 2.52 2.13 2.00 1.87sz-126 2.59 2.58 2.53 2.72 2.33 2.30 1.91 2.15 2.09 1.57 1.35 1.33sz-127 2.46 2.71 2.65 2.89 2.44 2.34 2.01 2.19 1.93 1.52 1.40 1.33sz-139 3.43 3.39 3.35 3.37 3.03 2.90 2.93 2.78 2.69 2.57 2.48 2.33sz-140 3.13 3.11 3.05 3.00 2.83 2.76 2.75 2.57 2.44 2.34 2.25 2.10
sz-141 3.19 3.13 3.06 2.95 2.85 2.71 2.75 2.48 2.35 2.24 2.17 2.06sz-142 3.46 3.49 3.44 3.33 3.26 3.08 3.15 294 2.83 2.72 2.52 2.38
0,-143 3.58 3.61 3.60 3.46 3.35 3.19 3.28 2.78 2.55 2.37 2.18 1.92
0,-144 3.55 3.60 3.58 3.48 3.29 3.21 3.22 2.76 2.50 2.30 2.06 1.850,-145 3.69 3.71 3.69 3.56 3.40 3.24 3.34 2.82 2.61 2.44 2.26 2.00
0,-146 3.59 3.62 3.57 3.45 3.30 3.17 3.25 2.73 2.54 2.36 2.18 1.89
•
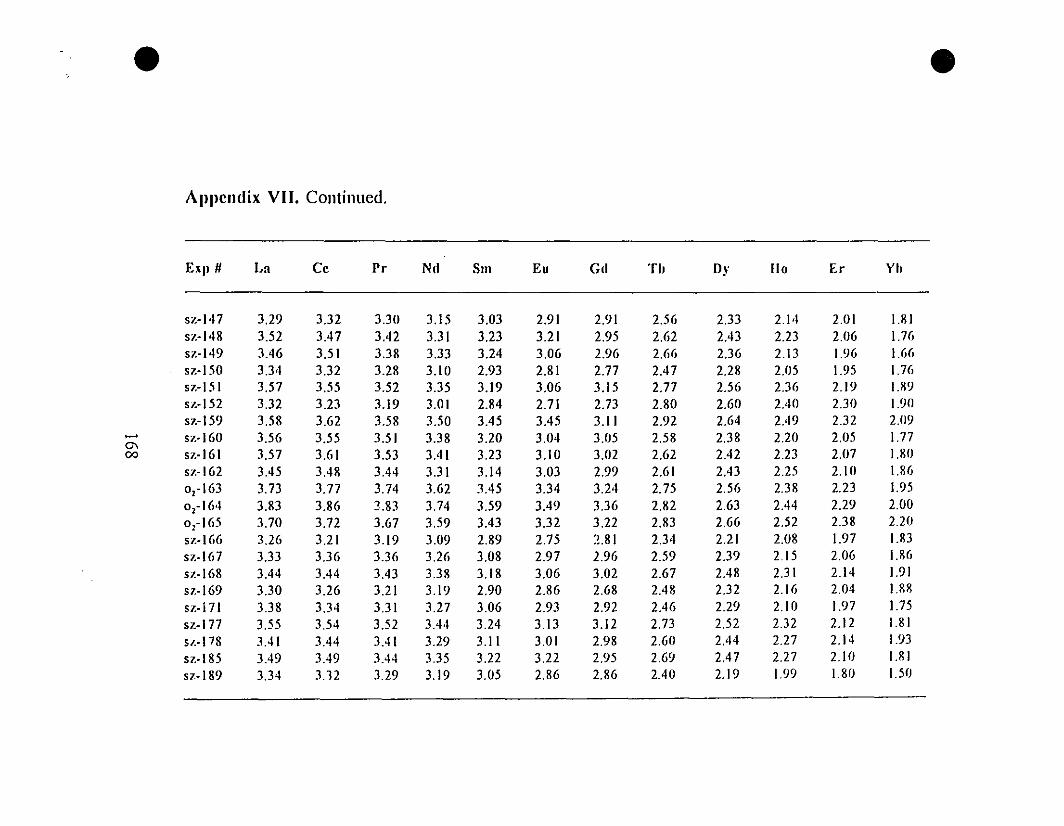
•Appcndix VII. Continued.
•
EXJI # La Cc Pr Nd Sm Eu Gd Tb Dy 110 Er Yb
51.-147 3.29 3.32 3.30 3.15 3.03 2.91 2.91 2.56 2.33 214 2.01 I.R 151.-148 3.52 3.47 3,42 3.31 3.23 3.21 2.95 2.62 2,43 2.23 2.06 1.7651.-149 3.46 3.51 3.38 3.33 3.24 3.06 2.96 2.66 2.36 2.13 1.96 1.6657.-150 3.34 3.32 3.28 3.10 2.93 2.81 2.77 2,47 2.28 2.05 1.95 1.7657.-151 3.57 3.55 3.52 3.35 3.19 3.06 3.15 2.77 2.56 2.36 2.19 I.R951.-152 3.32 3.23 3.19 3.01 2.84 2.71 2.73 2.80 2.60 2,40 2.30 1.9057.-159 3.58 3.62 3.58 3.50 3.45 3.45 3.11 2.92 2.64 2.49 2.32 2.09- 57.-160 3.56 3.55 3.51 3.38 3.20 3.04 3.05 2.58 2.38 2.20 2.05 1.77
C\00 57.-161 3.57 3.61 3.53 3,41 3.23 3.10 3.02 2.62 2,42 2.23 2.07 1.RO
51.-162 3.45 3.4R 3,44 3.31 3.14 3.03 2.99 2.61 2,43 2.25 2.10 I.R60,-163 3.73 3.77 3.74 3.62 J,45 3.34 3.24 2.75 2.56 2.38 2.23 1.950,-164 3.83 3.86 3.83 3.74 3.59 3.49 3.36 2.82 2.63 2,44 2.29 2.000,-165 3.70 3.72 3.67 3.59 3.43 3.32 3.22 2.R3 2.66 2.52 2.38 2.2057.-166 3.26 3.21 3.19 3.09 2.89 2.75 2.81 2.34 2.21 2.08 1.97 1.83
57.-167 3.33 3.36 3.36 3.26 3.08 2.97 2.96 2.59 2.39 2.15 2.06 1.86
51.-168 3,44 3.44 3,43 3.38 3.18 3.06 3.02 2.67 2.48 2.31 2.14 1.9157.-169 3.30 3.26 3.21 3.19 2.90 2.86 2.68 2,48 2.32 2.16 2.04 1.88
57.- i 71 3.38 3.34 3.31 3.27 3.06 2.93 2.92 2,46 2.29 2.10 1.97 1.75
57.-177 3.55 3.54 3.52 3.44 3.24 3.13 3.12 2.73 2.52 2.32 2.12 1.81
57.-178 3,41 3,44 3,41 3.29 3.11 3.01 2.98 2.60 2,44 2.27 2.14 1.93
57.-185 3,49 3,49 3,44 3.35 3.22 3.22 2.95 2.69 2.47 2.27 2.10 1.81
57.-189 3.34 3.12 3.29 3.19 3.05 2.86 2.86 2,40 2.19 1.99 1.80 1.50
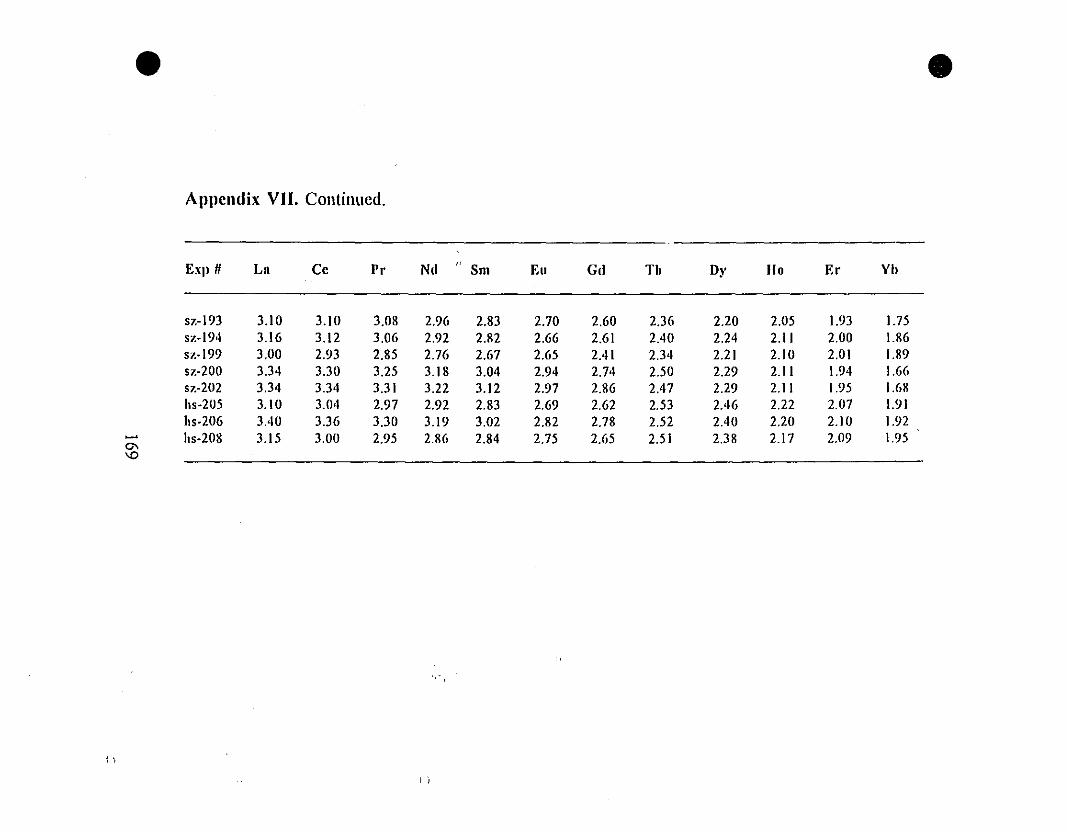
•Appcndix VII. Continued.
•
I~
Ex)! # Ln Cc Pr Nd .' Sm Eu Gd Tb Dy 110 Er Yb
57.-193 3.10 3.10 3.08 2.96 2.83 2.70 2.60 2.36 2.20 2.05 1.93 1.7557.-194 3.16 3.12 3.06 2.92 2.82 2.66 2.61 2.40 2.24 2.11 2.00 1.8657.-199 3.00 2.93 2.85 2.76 2.67 2.65 2.41 2.34 2.21 2.10 2.01 1.8957.-200 3.34 3.30 3.25 3.18 3.04 2.94 2.74 2.50 2.29 2.11 1.94 1.6657.-202 3.34 3.34 3.31 3.22 3.12 2.97 2.86 2.47 2.29 2.11 1.95 1.68h5-205 3.10 3.04 2.97 2.92 2.83 2.69 2.62 2.53 2.46 2.22 2.07 1.91hs-206 3.40 3.36 3.30 3.19 3.02 2.82 2.78 2.52 2.40 2.20 2.10 1.92
~ h5-208 3.15 3.00 2.95 2.86 2.84 2.75 2.65 2.51 2.38 2.17 2.09 1.950\'0
i)
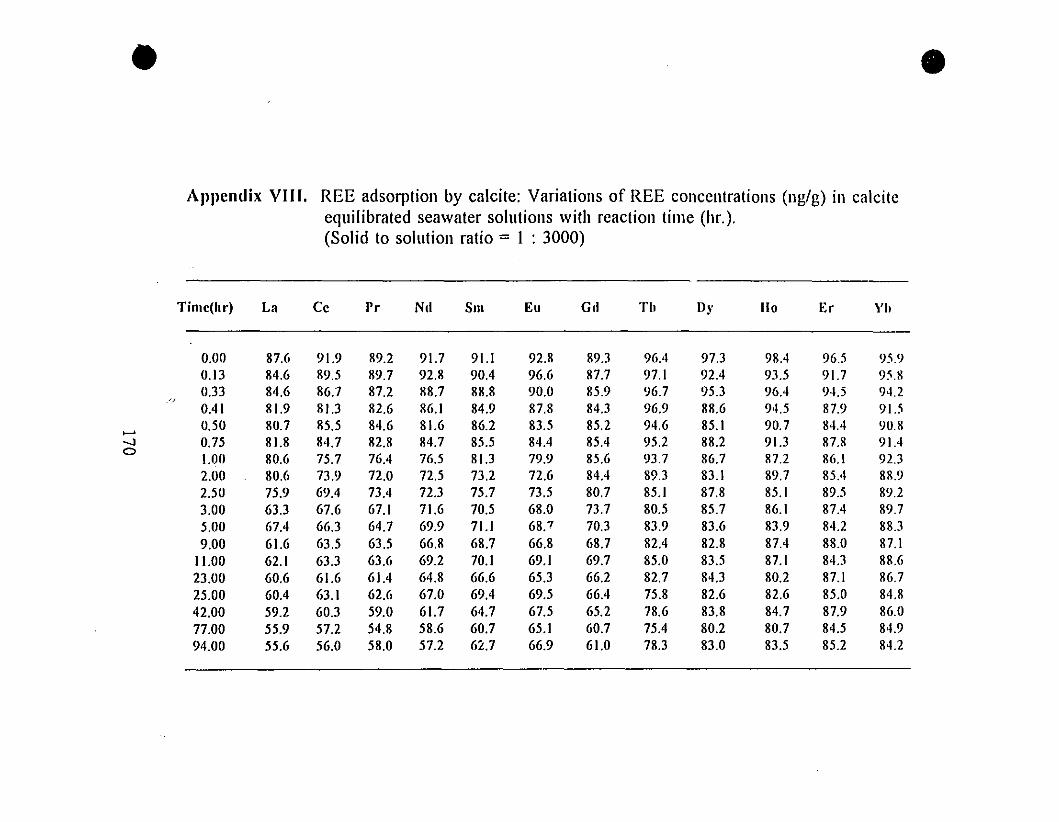
• •Appcndix VIII. REE adsorption by calcite: Variations of REE concentrations (ng/g) in calcite
equilibrated seawater solutions with reaction time (hf.).(Solid to solution ratio = 1 : 3000)
Timcthr) La Cc Pr Nd Sm Eu Gd Th Dy 110 Er Yh
0.00 87.6 91.9 89.2 91.7 91.1 92.8 89.3 96.4 97.3 98.4 96.5 95.90.13 84.6 89.5 89.7 92.8 90.4 96.6 87.7 97.1 92.4 93.5 91.7 95.80.33 84.6 86.7 87.2 88.7 88.8 90.0 85.9 96.7 95.3 96.4 945 94.2
/,
84.3 96.9 88.60.41 81.9 81.3 82.6 86.1 84.9 87.8 94.5 87.9 9l.5
...... 0.50 80.7 85.5 84.6 81.6 86.2 83.5 85.2 94.6 85.1 90.7 84.4 90.8-J 0.75 81.8 84.7 82.8 84.7 85.5 84.4 85.4 95.2 88.2 91.3 87.8 91.40
I.on 80.6 75.7 76.4 76.5 81.3 79.9 85.6 93.7 86.7 87.2 86.1 92.32.0n 80.6 73.9 72.0 72.5 73.2 72.6 84.4 89.3 83.1 89.7 85.4 88.92.50 75.9 69.4 73.4 72.3 75.7 73.5 80.7 85.1 87.8 85.1 89.5 89.23.00 63.3 67.6 67.1 71.6 70.5 68.0 73.7 80.5 85.7 86.1 87.4 89.75.00 67.4 66.3 64.7 69.9 71.1 68.7 70.3 83.9 83.6 83.9 84.2 88.39.00 61.6 63.5 63.5 66.8 68.7 66.8 68.7 82.4 82.8 87.4 88.0 87.1
11.00 62.1 63.3 63.6 69.2 70.1 69.1 69.7 85.0 83.5 87.1 84.3 88.623.00 60.6 61.6 61.4 64.8 66.6 65.3 66.2 82.7 84.3 80.2 87.1 86.725.00 60.4 63.1 62.6 67.0 69.4 69.5 66.4 75.8 82.6 82.6 85.0 84.842.00 59.2 60.3 59.0 61.7 64.7 67.5 65.2 78.6 83.8 84.7 87.9 86.077.00 55.9 57.2 54.8 58.6 60.7 65.1 60.7 75.4 80.2 80.7 84.5 84.994.00 55.6 56.0 58.0 57.2 6'2.7 66.9 61.0 78.3 83.0 83.5 85.2 84.2

•Appendix VIII. Continucd.
•
Timc(hr) La Cc Pr Nd Sm Eu Gd Tb D)' 110 Er Yh
0.00 87.7 88.5 87.3 85.6 84.2 87.3 88.3 88.4 93.6 98.3 98.6 98.50.25 84.0 83.2 82.5 82.0 81.2 78.9 84.5 88.2 92.8 92.5 94.2 95.40.52 83.0 78.9 78.8 77.8 77.7 77.8 80.3 85.9 89.7 88.3 91.0 91.30.83 80.3 75.4 74.5 75.5 76.5 74.5 81.0 84.9 89.4 91.0 93.6 94.61.92 78.2 72.3 71.1 74.2 73.7 73.6 80.0 85.3 89.5 90.7 93.9 93.22.92 74.1 68.1 66.6 70.5 70.9 69.0 77.5 82.4 87.3 90.4 94.9 94.04.00 73.2 65.1 64.0 68.1 68.0 68.3 74.8 81.4 86.2 89.8 93.3 93.2
~ 23.33 63.8 60.6 60.4 64.7 65.0 67.0 75.8 79.4 87.2 91.4 92.6 90.9-.l 24.17 64.7 62.2 60.4 66.7 64.6 64.6 75.2 72.3 87.0 91.3 92.5 87.4~
48.20 58.9 52.8 51.9 56.2 54.8 59.0 63.3 65.4 80.1 83.6 84.1 88.0
0.00 81.2 82.8 82.7 81.6 81.6 81.7 84.3 90.2 93.2 92.7 95.6 95.90.50 77.6 79.2 78.2 79.3 80.4 78.2 85.0 89.2 88.1 85.6 87.9 93.21.00 78.1 75.9 74.7 77.9 77.4 77.3 84.0 86.0 89.4 85.2 85.6 87.92.00 68.3 71.5 69.9 74.0 74.4 72.4 81.4 86.5 83.2 84.9 83.7 87.7
24.33 56.2 58.3 57.1 51.5 51.4 51.7 58.6 77.5 71.7 74.3 86.0 79.947.67 49.1 44.1 41.3 42.8 42.5 49.2 53.9 65.7 72.4 73.8 85.1 82.6