Embed Size (px)
Citation preview

Canada’s Catch-22: The State of Canada-US Relations in 2014
by Alexander Moens and Alex Bartos
January 2014
1974 - 2014 Y E A R S40

January 2014
Canada’s Catch-22The State of Canada-US Relations in 2014
by Alexander Moens and Alex Bartos

fraserinstitute.org

fraserinstitute.org / i
Contents
Executive summary / iii
Bilateral trade relations / 1
Trade and regulatory barriers/disputes / 12
State of the border and regulatory cooperation / 18
Canadian and American public perceptions / 24
US policy uncertainty / 27
Trade diversification / 30
Conclusion: the bilateral and diversification agenda / 39
References / 41
About the authors / 49
Acknowledgments / 50
Publishing information / 51
Supporting the Fraser Institute / 52
Purpose, funding, & independence / 53
About the Fraser Institute / 54
Editorial Advisory Board / 55

fraserinstitute.org

fraserinstitute.org / iii
Executive summary
Economic and political relations between Canada and the United States, our most important foreign relationship, have worsened since the Fraser Institute’s previous report on the state of Canada-US relations, Skating on Thin Ice (Moens, 2010). The recovery of the US economy after the financial crash in 2008 has been slow. The long-term uncertainty in US budget politics and public debt resolution remains, and the concomitant policy instability—as we first noted in US Election 2012: Implications for Canada (Moens and Clemens, 2013)—continues to put a drag on economic growth. The across-the-board budget cuts that took effect on January 1, 2013, better known as sequestration, offer a ray of light in the present context, as they have imposed cuts on spending of $84 billion in both 2013 and 2014.
Canadian merchandise exports to the United States have weakened in relative terms. At the same time, there is not enough Canadian export diversification to other destinations to make up this relative loss. The natural resources component of Canadian exports is the only major growing segment of overall trade. In both merchandise and services trade, the post-2007 per-iod shows Canada is losing in trade competitiveness in relation to the United States. The negative trend in trade competitiveness in services is even big-ger than in merchandise trade. The relative loss of trade competitiveness in our relationship may be a surprise to many Canadians who believe Canada is simply doing better than the United States.
Canada’s weakening competitiveness vis-à-vis the United States is occurring at the same time as political relations at the top are in a slump. The main sector in US-bound trade showing growth in the last decade, crude oil products, is also the one facing most political interference from US deci-sion makers. The six-year delay in the international permit for KXL to cross the Canada-USA border is without precedent in our bilateral relations. At the same time, the US mandatory country-of-origin labeling rule, which took effect in 2009, has severely damaged the decades-old and deeply inte-grated supply chain in beef and pork, costing Canadian producers some $1 billion per year. “Buy American” in the public procurement sector remains a latent threat to bilateral relations. While American trade barriers have risen,

iv / The state of Canada-US relations in 2014
fraserinstitute.org
Canada has removed some from its side: intellectual property rights have been strengthened, and the Canadian Wheat Board dissolved.
Because of the Beyond the Border Vision, set in motion in 2011, American and Canadian regulators are talking about rationalization, mutual recognition, and harmonization regarding certain policy areas, manufactur-ing product standards, and border security regulations. Incremental prog-ress is being made, mainly by pilot projects, and it appears that border costs have plateaued. As we called for in Measuring the Costs of the Canada-US Border (Moens and Gabler, 2012), governments on both sides need to provide cost metrics in addition to identifying individual projects, so that the public can assess whether common perimeter agreements are delivering cost sav-ings to travelers and traders. Capping costs is good, but the goal remains to reduce border costs. Border crossing data, though incomplete, suggests that Americans are travelling far less to Canada and that the commercial costs of crossing the border remain too high.
While Canadians are selling relatively less to the US than they buy from the US, they are also not selling substantially more to the rest of the world. In other words, Canada’s record for diversifying its trade from the US is mod-est over the last five years. The conclusion of the Comprehensive Economic and Trade Agreement (CETA) with the European Union offers a small trade effect for Canada: about $12 billion in an overall trade figure of nearly $700 billion. Nevertheless, the deal presents a confidence boost for Canadian free traders who are not getting much help from their southern neighbour. CETA also promises an important advance in lowering certain regulatory barriers to trade.
The Ryan-Murray budget accord will offer another two years of modest budget cuts in the USA, and will likely improve policy stability and thus foster GDP growth. Canada’s opportunities to benefit from a stronger US economy in 2014/15 exist, but Canadians cannot count on any policy governance from the bilateral relationship to facilitate such market growth. The Catch-22 of Canada’s ongoing trade dependency with the USA and its modest success in diversification can only be lessened by strategic and systematic attention from the US Executive branch. In such a strategy, a two-pronged approach would emerge. It involves both lowering North American barriers to trade and negotiating freer trade with the rest of the world as a North American economic actor.

fraserinstitute.org / 1
Bilateral trade relations
Merchandise trade
There is a significant decline in both exports and imports from 2008 to 2009 as a result of the US recession (table 1). The sharpest decline is in Canadian merchandise exports to the US, which decreased by 27 percent in 2009 and still have not recovered to the 2008 level in 2012. Canadian merchandise imports from the US, on the other hand, did not fall as sharply—16 percent in 2009—and in 2012 are only slightly below the 2008 number. Thus on balance, Canadian exports to the US have suffered significantly more from the reces-sion than American exports to Canada (figures 1, 2). Given this re-balancing, Canada’s merchandise trade balance surplus with the USA has been virtu-ally cut in half (46 percent) from $77 billion in 2008 to $35 billion in 2012.1
The traditionally large gap between merchandise exports and imports between Canada and its largest trading partner have shrunk substantially. As a result, Canada’s trade balance with the world has declined from $41 billion in 2008 to a deficit of $10 billion in 2012. The monthly import and export numbers in 2013 show a continuation of this trend.
A noticeable trend in Canada in the last 7 years reveals that less GDP is derived from trade (and thus more from Canada’s domestic market), while in the United States the trade versus domestic market share of GDP is on a ris-ing trend (table 2). When we examine the US share of Canada’s total exports and imports over a longer period (1993–2012) we notice the overall down-ward trend (figures 3, 4). The main causal factors are the higher value of the Canadian dollar, the post-2008 slump in US demand, and a certain amount of diversification in Canada’s trade, as well as stronger relative growth in Canada’s domestic market.
1. All figures are in real Canadian dollars unless otherwise noted.

2 / The state of Canada-US relations in 2014
fraserinstitute.org
A breakdown of the top export and import sectors in Canada-US trade shows that the traditionally strong machinery and automotive sectors are holding well in terms of US exports to Canada, but the same sector is weaker on the Canadian side. The gains on our side are in minerals and energy prod-ucts (tables 3, 4). The slow decline in Canadian exports of manufactured prod-ucts suggests a weakening on Canada’s side in the integrated supply-chain in this sector. Lower productivity and border costs may well play a role.
Table 1: Canadian merchandise trade, 2007–2012 (2002 CA$ billions)
2007 2008 2009 2010 2011 2012
Total exports 413.80 427.05 320.99 346.75 380.99 380.06
Exports to US 317.95 323.31 236.10 253.32 275.17 278.09
Total imports 372.91 388.77 326.91 355.08 380.36 389.93
Imports from US 242.15 246.66 206.41 223.12 234.75 243.60
Total balance 40.89 38.27 -5.92 -8.33 0.63 -9.87
Balance with US 75.79 76.66 29.69 30.20 40.42 34.50
Note: On a balance of payments basis.
Source: Statistics Canada (2013d).
15
20
25
30
3520
13-0
5
2013
-01
2012
-09
2012
-05
2012
-01
2011
-09
2011
-05
2011
-01
2010
-09
2010
-05
2010
-01
2009
-09
2009
-05
2009
-01
2008
-09
2008
-05
2008
-01
2007
-09
2007
-05
2007
-01
Import Export
2002
CA
$ bi
llion
s
Figure 1: Canada’s merchandise trade (monthly), 2007–2013
Source: Statistics Canada (2013c); calculations by authors.

The state of Canada-US relations in 2014 / 3
fraserinstitute.org
Table 2: Merchandise trade as a % of GDP, 2005–2012 (current US$)
2005 2006 2007 2008 2009 2010 2011 2012
Canada 60.2% 58.4% 56.9% 58.3% 48.3% 50.1% 51.5% 51.0%
% Growth 0.2% -3.0% -2.6% 2.5% -17.2% 3.7% 2.8% -1.0%
US 21.0% 22.1% 22.7% 24.3% 19.1% 22.5% 25.0% 24.8%
% Growth 6.1% 5.2% 2.7% 7.0% -21.4% 17.8% 11.1% -0.8%
Source: The World Bank (2013a).
01
2
3
4
5
6
7
8
9
2013-05
2013-01
2012-09
2012-05
2012-01
2011-09
2011-05
2011-01
2010-09
2010-05
2010-01
2009-09
2009-05
2009-01
2008-09
2008-05
2008-01
2007-09
2007-05
2007-01
2002
CA
$ bi
llion
s
Figure 2: Canada-US net merchandise trade (monthly), 2007–2013
Source: Statistics Canada (2013c); calculations by authors.

4 / The state of Canada-US relations in 2014
fraserinstitute.org
-5
-4
-3
-2
-1
0
1
2
3
2012201120102009200820072006200520042003200220012000
Gro
wth
(%)
Figure 4: Growth—US share of Canada’s annual merchandise trade (%), 2000–2012
Source: Industry Canada (2013b); calculations by authors.
Import Export
45
50
55
60
65
70
75
80
85
90
2011200920072005200320011999199719951993
Import Export
%
Figure 3: US share of Canada’s annual merchandise trade (%), 1993–2012
Source: Industry Canada (2013b).

The state of Canada-US relations in 2014 / 5
fraserinstitute.org
Table 3: Top sectors for Canadian merchandise exports to the US, 2012
Industry Exports
2002 CA$ billions Percentage
Mineral products 88.6 31.8%
Products of chemical or allied industries 16.3 5.9%
Plastics and related articles 11.8 4.3%
Base metals and articles of base metals 20.0 7.2%
Machinery, mechanical appliances, electrical equipment, and related articles 27.6 9.9%
Vehicles, aircraft, vessels, and associated transport equipment 53.0 19.1%
Note: On a customs basis.
Source: Statistics Canada (2013a).
Table 4: Top industries for Canadian merchandise imports from the US, 2012
Industry Imports
2002 CA$ billions Percentage
Mineral products 16.3 8.5%
Products of chemical or allied industries 17.1 8.9%
Plastics and related articles 12.7 6.6%
Base metals and articles of base metals 15.8 8.2%
Machinery, mechanical appliances, electrical equipment, and related articles 41.3 21.5%
Vehicles, aircraft, vessels, and associated transport equipment 41.3 21.5%
Note: On a customs basis.
Source: Statistics Canada (2013a).

6 / The state of Canada-US relations in 2014
fraserinstitute.org
Trade in services
As a share of overall bilateral trade, trade in services is growing gradually. Total bilateral services trade in 2010 amounted to 18 percent of bilateral merchan-dise trade. It was 15 percent in 2007.2 The United States is by far the largest trading partner in Canada’s international trade in services. Trade with the US is nearly ten times the amount with the next largest partner, the United Kingdom. But unlike merchandise trade, the value of non-US services trade is nearly half (44 percent in 2010) of that with the USA (table 5). In other words, there is more diversification from the US market in services than in merchandise.3
The trend reveals rising competitiveness on the US side (and non-USA), as Canadian imports are growing considerably while Canadian exports are stagnant, resulting in a growing services trade deficit (figure 5).
Bilateral trade in services was not impacted by the US recession as merchandise trade was. Total volume of trade is slightly up in the three years after 2007 (figure 6). Most of this gain is from growth in Canadian imports from the US (and from non-US), while Canadian exports to the USA are slightly down.
Given that there is no growth in Americans traveling to Canada during this time period (as we will show later), the relative strength of US exports vis-à-vis Canadian exports appears to lie in the commercial sector (tables 6, 7).
In conclusion, in both merchandise and services trade, the post 2007 period shows that Canada is relatively losing in trade competitiveness in rela-tion to the United States. The relative loss of trade competitiveness in our relationship may be a surprise to many Canadians who believe Canada has simply been doing better than the US since 2008. The ‘doing better’ part may apply to domestic economic activity but not to external trade.
2. Data on trade in services is not as recent as merchandise trade.3. Top export destinations in 2010 after the USA are the UK, France, and Germany. Top importers to Canada in 2010 after the USA include UK, Hong Kong (China), France, Germany, and Mexico. The case with importers to Canada is similar to that with export-ing countries. Imports from the UK make up roughly 10 percent that of imports from the US. Imports from Hong Kong are 51 percent that from the UK with France at 42 percent and both Germany and Mexico rest at roughly 38 percent each.

The state of Canada-US relations in 2014 / 7
fraserinstitute.org
Table 5: Services trade between Canada and the US, 2005–2010 (2002 CA$ billions)
2005 2006 2007 2008 2009 2010
Exports to USA 39.88 38.15 38.34 39.66 37.18 37.00
Imports from USA 43.58 43.95 45.44 48.33 47.83 49.60
Trade balance with USA -3.70 -5.80 -7.10 -8.66 -10.65 -12.60
Trade balance with USA % -4.43% -7.07% -8.47% -9.85% -12.40% -14.55%
Exports to non-USA 28.32 30.80 29.85 30.52 31.42 31.02
Imports from non-USA 30.22 31.87 33.80 35.18 34.96 37.22
Trade balance with non-USA -1.89 -1.08 -3.95 -4.66 -3.54 -6.20
Trade balance with non-USA % -3.23% -1.72% -6.21% -7.10% -5.40% -9.09%
Total services exports 68.20 68.94 68.19 70.18 68.60 68.02
Total services imports 73.79 75.82 79.24 83.50 82.79 86.82
Total trade balance -5.59 -6.88 -11.05 -13.33 -14.19 -18.80
Total trade balance % -3.94% -4.75% -7.50% -8.67% -9.37% -12.14%
Bilateral (X+I) USA 83.46 82.10 83.78 87.99 85.89 86.60
Bilateral (X+I) non-USA 58.54 62.67 63.65 65.69 65.51 68.24
Bilateral (X+I) total 142.00 144.77 147.42 153.68 151.40 154.84
Source: Foreign Affairs, Trade and Development Canada (2013a).

8 / The state of Canada-US relations in 2014
fraserinstitute.org
80
81
82
83
84
85
86
87
88
89
90
201020092008200720062005
2002
CA
$ bi
llion
s
Figure 6: Canada-US net services trade, 2005–2010
Source: Foreign A�airs, Trade and Development Canada (2013a).
-20
-16
-12
-8
-4
0
201020092008200720062005
Trade balance with USA Total trade balance
Figure 5: Canada’s trade de�cit with US and the world, 2005–2010
Source: Foreign A�airs, Trade and Development Canada (2013a).
2002
CA
$ bi
llion
s

The state of Canada-US relations in 2014 / 9
fraserinstitute.org
Table 6: Top categories for service trade exports, Canada-World, 2012
Category Subcategory Exports
2002 CA$ billions Percentage
Government services 1.3 1.9%
Travel services 14.3 20.7%
Personal travel 11.9 17.2%
Transportation services 11.1 16.1%
Air transport 5.2 7.6%
Commercial services 42.4 61.4%
Financial services 5.7 8.2%
Computer and information services 6.4 9.3%
Intellectual property use 3.1 4.4%
Management services 9.0 13.0%
Research and development 3.3 4.7%
Architectural, engineering 3.9 5.7%
Source: Foreign Affairs, Trade and Development Canada (2013a).
Table 7: Top categories for service trade imports, Canada-World, 2012
Category Subcategory Imports
2002 CA$ billions Percentage
Government services 1.1 1.2%
Travel services 28.8 32.3%
Personal travel 25.3 28.4%
Transportation services 19.5 21.9%
Water transport 8.2 9.2%
Air transport 8.4 9.5%
Commercial services 39.6 44.6%
Insurance services 4.4 5.0%
Financial services 4.4 5.0%
Intellectual property use 8.9 10.0%
Management services 7.5 8.4%
Source: Foreign Affairs, Trade and Development Canada (2013a).

10 / The state of Canada-US relations in 2014
fraserinstitute.org
0.75
0.80
0.85
0.90
0.95
1.00
1.05
2013-07
2013-01
2012-07
2012-01
2011-07
2011-01
2010-07
2010-01
2009-07
2009-01
2008-07
2008-01
2007-07
2007-01
Figure 7: Canada/US dollar exchange rate, 2007–2013
Source: Bank of Canada (2013b).
CA/U
S ex
chan
ge ra
te
Dollar value and productivity trends
The first factor to consider regarding Canada’s trade competitiveness vis-à-vis the United States is the value of the Canadian dollar. The substantial appre-ciation of the Canadian dollar against the US dollar that began in the early 2000s has stabilized at a much higher average value of the loonie (figure 7). As is well documented, such exchange rate appreciation tends to have a strong effect on current account balances as exports decline (Kappler et al., 2011). A growing account deficit will likely push the value of the Canadian dollar downward in the longer term, and thus offer some remedy.
ProductivityOf more concern to Canadians should be the data indicating that Canadian labour productivity rates are lagging those in the United States (figures 8, 9). One would expect that Canada’s higher dollar has provided industry in recent years with an opportunity to improve productivity, as imported machinery and technology would be available at a lower price. However, Canada’s pro-ductivity rate of growth is modest and, in 2012, dips into negative territory again.

The state of Canada-US relations in 2014 / 11
fraserinstitute.org
-1
0
1
2
3
20122011201020092008
Canada US
Figure 8: Canada and US rates of output productivity growth (%), 2008–2012
Source: Statistics Canada (2013g).
Rate
of p
rodu
ctiv
ity g
row
th (%
)
-10
-5
0
5
20122011201020092008
Labour productivity (Canada) Real GDP (Canada) Hours worked (Canada)
Labour productivity (US) Real GDP (US) Hours worked (US)
Figure 9: Real US-Canadian output and hours worked (%), 2008–2012
Source: Statistics Canada (2013g).
Ann
ual %
cha
nge

12 / fraserinstitute.org
Trade and regulatory barriers/disputes
Table 8 provides a synopsis of the major trade disputes/barriers that have played a role in bilateral relations in the last five years and that are pertinent for the 2014 period (pages 16-17). The two large disputes—Keystone XL and Mandatory Country-of-Origin Labeling (MCOOL) on red meat—are more ominous than they may seem. First, both in crude oil products and in cattle and hogs, the United States is unilaterally disrupting or dismantling a well-established, integrated sector. Canada has started attempts to diversify its oil transportation structure, including more rail and new pipeline routes. But, as all proposed alternative pipelines have shown, the alternatives are contro-versial and at best years away from making a difference. Meanwhile, there is considerable risk in putting too much crude oil on rail, as its accident rates are higher than pipe.
Canadian threats to counter US MCOOL action with tariffs on food products are not going to have much impact in the near future. Moreover, an escalating tariff war on food products cannot be won by Canada and will ultimately harm consumers on both sides of the border. US defiance of two WTO rulings also means more uncertainty for Canadian traders.
Keystone XL pipeline
Proposed in 2008, the Keystone XL (KXL) extension is part of a pipeline sys-tem connecting Alberta oil sands and US mid-West and Gulf region refineries. KXL is a 1,897 km crude oil pipeline with a capacity of 465,000 barrels per day (Hussain, 2013). It is a substantial private infrastructure proposal that will create employment and guarantee a secure energy source for the United States (Millington and Murillo, 2013). It is by no means a new feature in Canada-US energy relations, as a dense network of oil and electricity carri-ers cross the border at multiple points.
What is unprecedented is that the permit process is now in its sixth year and the final resolution remains uncertain (by US law a cross-border line requires Department of State approval). If not resolved in 2014, the question may well be handed over to the next president after 2016. The policy uncertainty associated with KXL approval has by far the largest impact on Canada-US trade

The state of Canada-US relations in 2014 / 13
fraserinstitute.org
relations. The dragged-out procedure has chilled relations. The southern leg of KXL has been completed and the original route objection by Nebraska has been resolved. What remains ostensibly the problem is that the US administration has identified this heavy oil as a component of its policy objective of curbing the emission of greenhouses gasses to reduce global warming.
The impact of this pipeline delay in the 2.7 million barrels per day (bpd) export of Canadian oil products to the USA reverberates at various levels. Across Canada, investment in mining, oil, and gas extraction for 2013 is pre-dicted to decrease by 2.7 percent—the largest decline since the 2008 recession (Statistics Canada, 2013f ). In Alberta, investment is predicted to increase by only 0.1 percent (Statistics Canada, 2013f ). Capital investment in oil and gas extraction has not recovered to pre-2008 levels (Industry Canada, 2013a).
While the industry has become increasingly dependent on rail trans-port to move product, it is a costly alternative. It can cost up to three times as much as pipeline transport (Millington and Murillo, 2013), and its limita-tions are self-evident, because rail movement of oil is constrained by the lim-ited availability of rail cars. In 2012, 130,000 bpd of heavy crude was being transported by rail. This is expected to rise to 425,000 bpd by the end of 2014, falling short of the 465,000 bpd which could have been moved through KXL (Hussain, 2013). The forced increase in rail transport has resulted in unintended costs for the industry: a total of US$1 billion must be invested for new rail terminals, and another US$4–5 billion for new rail cars (Lewis, 2013).
Rail transport is both more costly and more dangerous. A recent study concluded that “pipeline transportation is safer than transportation by road, rail, or barge, as measured by incidents, injuries, and fatalities” (Green & Furchtgott-Roth, 2013). It is not inconceivable that another major oil acci-dent either in Canada or the USA—such as took place in Quebec in July 2013, killing 47 people—would result in a moratorium on oil transport by rail, with grave consequences for Canadian producers.
2002 Mandatory Country-of-Origin Labeling
Mandatory Country-of-Origin Labeling (MCOOL) is a provision mandated by Congressional law and first implemented in 2008. The measure imposes strict segregation rules on American, Canadian, and Mexican cattle and hogs, and the subsequent slaughtering and processing of these animals to produce beef and pork products for retail sale. The stated purpose is to create labels that indicate the origin in part or in whole of the product. In effect, it is a veiled trade barrier because it gives US animals and products a competitive advantage due to higher labeling, inventory, and processing costs for equiva-lent Canadian products.

14 / The state of Canada-US relations in 2014
fraserinstitute.org
Table 8: Synopsis of trade disputes in Canadian-American relations in 2013
Dispute Impact and cost Prospect for resolution
Keystone XL Pipeline Very serious Poor
2008 proposal for a 1,897 km 465,000 bpd crude oil pipeline spanning from Alberta down to Nebraska.
Downward pressure on investment.
Lost wages: January 2012 postponement is costing US $4.7 million a day in lost wages (Consumer Energy Alliance, 2013).
Continuation of crude oil price discounts due to lack of infrastructure.
Costly alternative: rail has emerged as a transportation alternative, but can cost up to three times as much as pipeline travel (Millington and Murillo, 2013).
Permit postponed twice.
Resolution is not transparent.
Rising risk of decision deferral past 2016.
Mandatory Country-of-Origin Labelling (MCOOL)
Serious Poor
2008 Congressional Law mandating rules for segregated livestock processing and packaging, and a labeling structure in order to have food labels indicate origin of product.
Annual cost to Canadian beef and pork sector of $1 billion.
Deconstruction of a highly integrated trilateral supply chain industry.
MCOOL adds no animal health or food safety benefits.
US has defied both WTO complaint and the core part of the WTO Appeal ruling.
2013 US reaction has been to strengthen the discriminatory provision banning co-mingling of meats altogether.
Canada plans to retaliate with tariffs, but this is a costly gambit with low chance of success.
Softwood Lumber Agreement Moderate Good
In 2011, American softwood companies took their Canadian counterparts to the London Court of International Arbitration, accusing them of circumventing the SLA (Foreign Affairs, Trade and Development Canada, 2012a).
If in violation, Canadian industry would face $380 million in penalties (The Canadian Press, 2012).
The London Court of International Arbitration in 2012 ruled in favor of Canada (Foreign Affairs, Trade and Development Canada, 2012a).
SLA was to expire in 2013 but Canada and the USA extended it until 2015 (CBC News, 2012).
Long-term free trade in lumber needs to replace SLA.
Buy American Provision Serious Partial resolution but high risk of recurring Buy American legislation
2009 American Recovery and Reinvestment Act.
Exclusion of Canadian products and production sharing in US public works procurement.
Canada-US Procurement Agreement in 2010 which allowed for the purchase of Canadian goods on seven U.S. infrastructure projects valued at more than $7,777,000.
Canada needs to seek a comprehensive agreement in order to escape future American protectionism with all provinces on board and compliant with the WTO provision.
The state of Canada-US relations in 2014 / 15
fraserinstitute.org
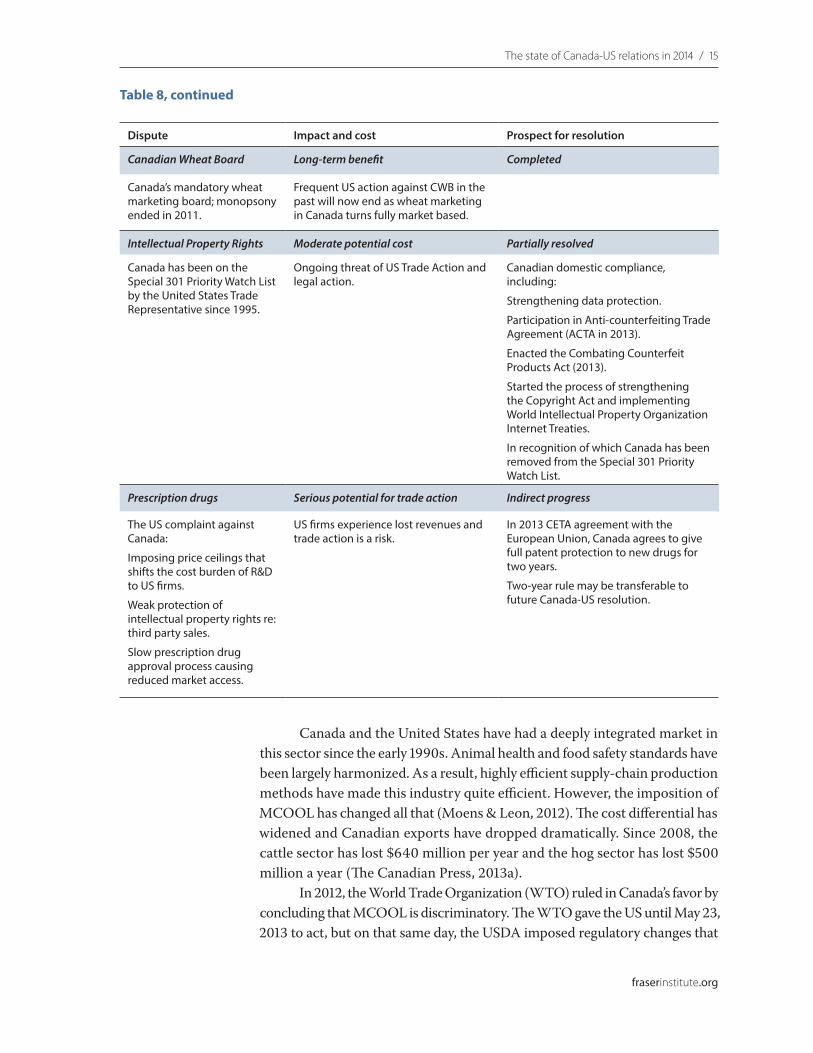
Dispute Impact and cost Prospect for resolution
Canadian Wheat Board Long-term benefit Completed
Canada’s mandatory wheat marketing board; monopsony ended in 2011.
Frequent US action against CWB in the past will now end as wheat marketing in Canada turns fully market based.
Intellectual Property Rights Moderate potential cost Partially resolved
Canada has been on the Special 301 Priority Watch List by the United States Trade Representative since 1995.
Ongoing threat of US Trade Action and legal action.
Canadian domestic compliance, including:
Strengthening data protection.
Participation in Anti-counterfeiting Trade Agreement (ACTA in 2013).
Enacted the Combating Counterfeit Products Act (2013).
Started the process of strengthening the Copyright Act and implementing World Intellectual Property Organization Internet Treaties.
In recognition of which Canada has been removed from the Special 301 Priority Watch List.
Prescription drugs Serious potential for trade action Indirect progress
The US complaint against Canada:
Imposing price ceilings that shifts the cost burden of R&D to US firms.
Weak protection of intellectual property rights re: third party sales.
Slow prescription drug approval process causing reduced market access.
US firms experience lost revenues and trade action is a risk.
In 2013 CETA agreement with the European Union, Canada agrees to give full patent protection to new drugs for two years.
Two-year rule may be transferable to future Canada-US resolution.
Table 8, continued
Canada and the United States have had a deeply integrated market in this sector since the early 1990s. Animal health and food safety standards have been largely harmonized. As a result, highly efficient supply-chain production methods have made this industry quite efficient. However, the imposition of MCOOL has changed all that (Moens & Leon, 2012). The cost differential has widened and Canadian exports have dropped dramatically. Since 2008, the cattle sector has lost $640 million per year and the hog sector has lost $500 million a year (The Canadian Press, 2013a).
In 2012, the World Trade Organization (WTO) ruled in Canada’s favor by concluding that MCOOL is discriminatory. The WTO gave the US until May 23, 2013 to act, but on that same day, the USDA imposed regulatory changes that

16 / The state of Canada-US relations in 2014
fraserinstitute.org
actually strengthened the provisions of MCOOL. In retaliation, the Canadian government released a list of US exports to Canada that would be subjected to tariffs, and it is preparing to seek a compliance panel at the WTO. Until this situation is resolved, the Canadian government predicts a continuing annual loss of $1 billion for the Canadian red meat sector (The Canadian Press, 2013a).
Softwood lumber
In 2011, several American softwood companies took their Canadian counter-parts to the Court of International Arbitration in London, accusing them of cir-cumventing the Softwood Lumber Agreement of 2006 (Foreign Affairs, Trade and Development Canada, 2012a). The dispute centered on the accelerating pace of lumber harvests resulting from the pine beetle infestation. The stakes were high: $380 million in penalties should Canada lose (The Canadian Press, 2012).
In 2012, the Court of International Arbitration ruled in Canada’s favor (Foreign Affairs, Trade and Development Canada, 2012a). In addition, while the Softwood Lumber Agreement was set to expire in 2013, the Canadian and American governments successfully negotiated an extension of the Agreement until 2015 (CBC News, 2012). The fact remains that as long as a large part of Canada’s softwood lumber is managed in terms of quotas and the stumpage fee system, US trade action is very likely.
‘Buy American’ provision
The 2009 American Recovery and Reinvestment Act (ARRA, which expired on September 30, 2011) and the more recent 2011 American Jobs Act, stipu-lated that steel, iron, and other goods used in the repair and construction of infrastructure projects in the US (highways, bridges, mass transit, and fed-eral buildings) must be manufactured in the United States (Matthiesen, 2011).
In response to ARRA, Canada and the US signed the Canada-US Procurement Agreement in 2010, which allowed for the purchase of Canadian goods on seven U.S. infrastructure projects valued at more than $7,777,000 or within the 37 states subject to the WTO GPA (Government of Canada, 2013a). The 2011 American Jobs Act did not pass in Senate and is thus moot.
While the ARRA dispute was partially resolved, ‘Buy American’ and a counter position of ‘Buy Canadian’ can flare up on either side of the bor-der. Canadian industry is most vulnerable in this uncertainty. The Canadian government ought to seek a comprehensive Buy American exemption to escape future American protectionism. In so doing, all provincial govern-ments need to be on board in order to make the WTO and NAFTA rules function optimally.

The state of Canada-US relations in 2014 / 17
fraserinstitute.org
Canadian Wheat Board (CWB)
In 2011, the Canadian government removed the monopsony held by the Canadian Wheat Board. This unilateral action offers a successful reduction in bilateral trade distortion. Today, the CWB continues to operate as a mar-keting group.
Intellectual Property Rights (IPR)
From 1995 through 2013, Canada was on the Special 301 Priority Watch List by the United States Trade Representative. The US complaint was that protection and enforcement of IPR in Canada were weak. The Special 301 Priority Watch List is designed to identify US trading partners that are the worst offenders in IPR protection (Embassy of the United States, Ottawa, Canada, 2013).
Although the issue is not completely resolved, Canada has made sig-nificant progress in recent years. The federal government has strengthened data protection regulations, criminalized the use of camcorders in theaters, and participates in the Anti-Counterfeiting Trade Agreement (ACTA) nego-tiations (2013). Most recently, Canada enacted the Combatting Counterfeit Products Act (Embassy of the United States, Ottawa, Canada, 2013). The Canadian Government is in the process of strengthening the Copyright Act and implementing World Intellectual Property Organization Internet Treaties (Embassy of the United States, Ottawa, Canada, 2013).
As a result of these steps, Canada was removed from the Special 301 Priority Watch List in 2013.
Prescription drugs
Prescription drug prices in Canada are relatively low due to a price ceil-ing mandated by Canada’s healthcare system. In addition, Health Canada approval times for prescription drugs significantly lag behind their counter-parts in the United States and the European Union (Barua and Esmail, 2013). US lawmakers have repeatedly expressed their concerns over cheap prescrip-tion drugs re-entering the US from Canada (Moens and Gabler, 2011). The EU also asked Canada to strengthen IPR protections for prescription drugs (Lexchin and Gagnon, 2013). Since the signing of the CETA agreement in principle on October 18, 2013, the issue between Canada and the EU is now resolved (Waldie, 2013). Canada has agreed to “EU demands for patent pro-tection for up to two years on brand-name drugs” (Blanchfield, 2013).

18 / fraserinstitute.org
State of the border and regulatory cooperation
The decline in Americans traveling to Canada corresponds with the US Greenback losing value against the Canadian dollar (figures 10, 11). However, when we consider the extent of the decline in total numbers it appears dispro-portionate. The change in American travel suggests instead a bigger problem following the 9-11 shock. The imposition of new border transit requirements such as passports, as well as longer wait times and more security screening, has likely dampened US travel across this international boundary. Given the modest economic recovery in the USA from the beginning of 2010 onward, one would expect disposable income, including for travel, to trend back up. Instead the numbers remain stagnant at around 20 million, less than half the number of 2002.
While an overall national average for border wait times is not avail-able, data on major border crossings in both Central Canada and British Columbia indicate that no reductions in wait times have been achieved between 2006 and 2011 (figure 12). The problem of inefficiency as presented by the Canada-US border goes well beyond wait times. It includes inefficient activity away from the border such as extra warehousing, and costs of com-plying with various facilitated traveler and goods programs such as FAST for trucks, loads, and drivers.
There are consistent cost differences between domestic and cross-bor-der truck-borne trade which point to significant border costs. “For exports to the US, these costs added 0.9 percent to the delivered price of goods in 2004. This figure fell to 0.4 percent in 2009 … Higher fixed costs per shipment accounted for most of the additional cost of transporting goods to the US” (Brown and Anderson, 2012). When we consider that, in the manufacturing sector, parts cross the border several times in various stages of assembly, we realize how this cost accumulates and defeats the efficiency gains otherwise generated by integrated supply chain manufacturing. Border costs are typ-ically passed on to the consumer as fixed costs per shipment.

The state of Canada-US relations in 2014 / 19
fraserinstitute.org
An unprecedented border problem has arisen in the current US Administration’s lengthy (six years) review of the permitting of a pipeline border crossing as proposed in the Keystone XL project. As a result, oil-by-rail transport has recently increased, while the pipeline mode of Canada-US trade has seen a drop in growth in the 2011/12 period (figures 13, 14).
0
10
20
30
40
50
201220112010200920082007200620052004200320022001200019991998
Mill
ions
Figure 10: Travellers entering Canada, 1998–2012
Source: Statistics Canada (2013e).
US residents Non-US residents
0
3
6
9
12
15
18
0
0.3
0.6
0.9
1.2
1.5
1.8
20122011201020092008200720062005200420032002
Trips Spending US$/CA$ (Secondary axis)
Figure 11: US overnight travel to Canada, 2002–2012
Source: Statistics Canada (2011); Bank of Canada (2013b).
Mill
ions
of t
rips
/ Nom
inal
CA
$ bi
llion
s
US$/CA
$ exchange rate

20 / The state of Canada-US relations in 2014
fraserinstitute.org
0
5
10
15
20
201120102009200820072006
Northbound average delay Southbound average delay
Figure 12: Peace Arch average border wait time, 2006–2011
Source: Cascade Gateway Data (2013).
Min
utes
0255075
100125150175200225250275300
201220112010200920082007200620052004
2004
US$
bill
ions
Figure 13: All surface modes of freight �ow data based on value of goods, 2004–2012
Source: Bureau of Transportation Statistics (2013).
Truck Rail Pipeline

The state of Canada-US relations in 2014 / 21
fraserinstitute.org
‘Beyond the Border’ and Regulatory Cooperation
In 2011, Canada and the United States announced an ambitious agreement to reduce border costs by means of deeper bilateral regulatory and secur-ity cooperation. The accord seeks to streamline various border procedures—some already in existence, and some new—to improve intelligence-sharing between law enforcement agencies, mutual recognition of passenger baggage screening, improved frameworks for trusted trade programs, harmoniza-tion of NEXUS protocols, streamlined supply chains, enhanced trade com-petitiveness, collaboration in border infrastructure investment, and deeper cooperation in national security investigations. The agreement is known as Beyond the Border: A Shared Vision for Perimeter Security and Economic Competitiveness (February 4, 2011).
The Beyond the Border Vision accord also set up a Regulatory Cooperation Council. In it, Canadian and American officials seek to reduce red tape and harmonize regulations in certain key sectors. To date, the Council has announced various plans affecting agriculture and food, trans-portation, health, personal care products, workplace chemicals, environment, nano materials, and small business loans. We summarize the key points of progress made since 2011 in table 9.
-35
-25
-15
-5
5
15
25
35
20122011201020092008200720062005
Truck Rail Pipeline
Figure 14: Growth rate of all surface modes of freight �ows (%), 2005–2012
Source: Bureau of Transportation Statistics (2013); calculations by authors.
%

22 / The state of Canada-US relations in 2014
fraserinstitute.org
Table 9: Key elements of Beyond the Border and Regulatory Cooperation
Beyond the Border Program
Integrated Cargo Security Strategy (ICSS),December 2011
Reduces administrative duplication between Canada and the US by addressing security risks in advance within the shipment supply chain and at the border (Canada Border Services Agency, 2013).
Prince Rupert Pilot, October 2012 Offshore cargo heading to the US via marine transport and then forwarded from port of entry via rail is examined by Canadian officials on behalf of the US (Government of Canada, 2013c).
Montreal Pilot, January 2013 Offshore cargo heading to the US via marine transport and then forwarded from port of entry to the US via truck is examined by Canadian officials on behalf of the US (Government of Canada, 2013c).
Pre-load Air Cargo Targeting (PACT) Joint pilot by CBSA and Transport Canada to screen cargo pre-flight on Canada-bound airplanes at foreign airports (Canada Border Services Agency, 2013).
Tamper Evident Technology Pilot,October 2012
Pilot collaboration between CBSA and US CBP to ensure containers remain sealed upon arrival at the U.S. border (Canada Border Services Agency, 2013).
Truck Cargo Pre-Inspection Pilot,March 2013
Pilot program between the CBSA and the US CBP for pre-inspection of southbound traffic into US (Canada Border Services Agency, 2013).
Free and Secure Trade (FAST) Pilot,Sarnia, Ontario
Pilot program for usage of FAST lanes without Partners in Protection and Customs Self Assessment programs (Government of Canada, 2013c).
Canada-U.S Shiprider, June 2013 Removal of jurisdictional barriers to improve law enforcement personnel in Windsor-Detroit and Vancouver-Blaine waterways (Government of Canada, 2013c).
Entry/Exit Initiative Phase II, June 2013 Exchange entry/exit data between the CBSA and US DHS on individuals at Canada-U.S. land border crossings (Government of Canada, 2013c).
Regulatory Cooperation Program
Memorandum of Understanding between Transport Canada and the Railway Association of Canada, September 2013
Framework for Canadian rail emissions between 2011 to 2015 (Government of Canada, 2013d).
Canada-United States Perimeter Approach to Plant Protection, September 2013
Draft framework for increased cooperation and reduction in administrative duplication between the Canadian Food Inspection Agency (CFIA) and United States Animal and Plant Health Inspection Service (APHIS) on trade in plants and plant products (Government of Canada, 2013d).
Common Electronic Submission Gateway Pilot (CESG), August 2013
FDA and Health Canada will allow pharmaceutical firms to electronically submit drug applications (Government of Canada, 2013d).
Initiative to Align Veterinary Drug Approvals, December 2012
Joint reviews between US FDA and Health Canada on veterinary drug products (Government of Canada, 2013d).
Stricter Air Pollutant Emissions Environment Canada aligns car emissions beginning in 2017 with the US Environmental Protection Agency’s “Tier 3” (Government of Canada, 2013d).

The state of Canada-US relations in 2014 / 23
fraserinstitute.org
On September 4, 2013, $46.6 million in investment was allocated to the Border Action plan by the Government of Canada in order expand two marine container examination facilities (Government of Canada, 2013c). $3.3 million was invested by the Government of Canada in the Asia Pacific Gateway and Trade Corridor Initiative (Government of Canada, 2013c). The Plan includes an additional 29 harmonization initiatives that will enhance trade activity between Canada and the US.
Neither Beyond the Border nor the Regulatory Cooperation Council offer further investment or cost estimates on the initiatives described in table 9. Moens and Gabler (2012) pointed to the need for both the Canadian and American governments to provide data on border costs so that a cost-benefit analysis can ensue. Nonetheless, the small steps of progress towards inte-grating and harmonizing US and Canadian border practices remains a very important (long-term) part of reducing the profile of the border.

24 / fraserinstitute.org
Canadian and American public perceptions
Three observations are noteworthy in recent assessments of public percep-tions between Americans and Canadians. First, Americans consistently have a very high favourability rating of Canadians, typically in the 90% plus range (table 10, figure 15). Both as a friend and a strategic ally, Americans hold Canadians in the most favourable light possible (table 11). Disagreements over policy between the two countries, whether in defence and foreign affairs or over border and trade issues, do not move this fundamental asset Canadians enjoy in dealing with their neighbour.
Second, Canadians do not have high expectations of either the American or Canadian government regarding progress in bilateral relations. As table 12 shows, Canadians hold Obama in high regard (63 percent), but only 54 percent expect progress from him in trade relations. Prime Minister Harper is rated slightly ahead of President Obama in terms of working hard towards improving Canada-US relations (table 13).
Third, and most significant in light of Canada’s Catch-22 situation: both Canadians and Americans are more supportive of closer cooperation and inte-gration policies than is the case for political representatives in either the United States or Canada. In two recent studies we showed how US Senators and House Representatives are quite critical of Canada with regard to NAFTA issues and bor-der security (Moens and Gabler, 2011). Similarly, we found that among the three major political parties in Canada’s parliament, only one consistently expressed itself in favour of closer ties with the United States (Moens and Gabler, 2011).
A recent survey of American and Canadian (and Mexican) attitudes towards free trade and NAFTA show surprisingly strong data for more trade integration. In response to the statement “There should be more free trade between the US, Canada and Mexico,” 80 percent of Canadians approved, as did 74 percent of Americans. Even on border security, Canadians and Americans are more pro-cooperation and integration than their governmental policies suggest. In the US, 41 percent support a common perimeter while 20 percent are opposed. In Canada, 43 percent support it and 30 percent are opposed (Graves, Pastor, and Basáñez, 2013). Therefore, in terms of public mandate, both governments would have a case to work towards broader bilat-eral (or trilateral) cooperation to lower trade barriers.

The state of Canada-US relations in 2014 / 25
fraserinstitute.org
Table 10: Canadian favourability rating among Americans (February 2012)
Very favourable
Mostly favourable
Mostly unfavourable
Very favourable Not sure Total
favourableTotal
unfavourable
53% 38% 3% 2% 3% 91% 5%
Note: n=1015.
Source: Gallup Poll (2012).
Table 11: Ally or enemy for Americans? (June 2013)
Country Ally Friendly Unfriendly Enemy Total Ally and Friendly
Great Britain 66% 25% 2% 1% 91%
Canada 61% 33% 2% 1% 94%
China 11% 44% 26% 14% 55%
Note: n=1529.
Source: Gallup Poll (2013).
88
90
92
94
96
98
201220112010200920082007
Figure 15: Canadian favourability among Americans (%), 2007–2012
Source: Gallup Poll (2012).
% fa
vour
able

26 / The state of Canada-US relations in 2014
fraserinstitute.org
Table 12: What effect will Obama have on Canada-US relations? (November 2012)
Canadians Americans
Positive Negative None Positive Negative None
Relationship 62% 5% 34% 48% 12% 40%
Trade 54% 10% 35% 48% 12% 39%
Harmonizing 53% 8% 40% 47% 14% 39%
Note: n=1066.
Source: Abacus Data (2012).
Table 13: Has each leader worked hard to improve Canada-US relations? (July 2012)
Country Agree Disagree Not sure
Stephen Harper 58% 32% 10%
Barack Obama 53% 32% 15%
Note: Sample of Canadians.
Source: Harris/Decima (2012).

fraserinstitute.org / 27
US policy uncertainty
Canadian economic prospects face their most important challenge in the United States. The US economic recovery has been modest, and real GDP growth so far has remained below the post-World War II average of post-recession periods (figure 16). As we noted above, the less-than-stellar US recovery is made even more challenging for Canadian traders in that pro-ductivity gains in Canada are lagging while the Canadian dollar remains high. On top of that, several American-imposed regulatory obstacles to free trade are depressing trade prospects in crude oil, red meat, and public works pro-curement. These impediments reduce Canadian competitive access to the US market.
A high level of public spending until the January 2013 sequester, and ongoing monetary stimulation, have not produced notable US GDP growth. The seven post-recession periods below show the current average to be well below the historical average (Young, 2013).
1948-1957: 3.80%1958-1967: 4.28%1968-1977: 3.18%1978-1987: 3.15%1988-1997: 3.05%1998-2007: 2.99%2008-2013: 0.73%
While economic growth has been modest, growth in the public debt has not (figure 17). Publicly held debt in the US is now at 73 percent of GDP, the highest since 1946 (Congressional Budget Office, 2013).
The widening gap between federal government outlays and revenues has only recently been capped by the Sequester (figure 18). However, the budget Sequester is temporary, and final resolution of public spending and taxation levels remains unclear given repeated gridlock in presidential-con-gressional policy making. High debt levels, combined with stalemate over taxes and budget cuts, have produced a case of policy instability or uncer-tainty in the last five years (Baker, Bloom, and Davis, 2013).

28 / The state of Canada-US relations in 2014
fraserinstitute.org
US policy uncertainty is further aggravated by inaction on the large ‘entitlement’ programs—Social Security, Medicare, and Medicaid—which are the major drivers of the long-term gap in revenues and spending.
-4
-2
0
2
4
6
8
201220062000199419881982197619701964
%
Figure 16: US GDP growth rate, 1961–2013 (2014 forecast)
Source: The World Bank (2013b); OECD (2013).
-10
-8
-6
-4
-2
0
0
20
40
60
80
100
20122011201020092008200720062005200420032002
Government de�cit as a percentage of GDP Government debt as a percentage of GDP
Figure 17: US Government de�cit and debt as a percentage of GDP, 2002–2012
Source: Congressional Budget O�ce (2013).
De�
cit p
erce
ntag
e (%
) Debt percentage (%
)

The state of Canada-US relations in 2014 / 29
fraserinstitute.org
0
1,000
2,000
3,000
4,000
5,000
6,000
7,000
8,000
9,000
10,000
20122003199319831973
Revenue Outlays
Figure 18: US Government revenue and outlays, 1973–2012 (1983 US$ billions)
Source: Congressional Budget O�ce (2013).
1983
US$
bill
ions

30 / fraserinstitute.org
Trade diversification
Given the weakness in near-term US opportunities, Canadians are (again) wondering how to pursue trade diversification away from the United States. The objective is logical and, if achieved, will prove advantageous; but various trends in trade and investment show that diversification for Canada is a slow and arduous journey (table 14).
In terms of overall share, exports to China in the last five years have doubled, but the numbers—from 2.17 percent to 4.26 percent—remain rela-tively low. In the same period, the US-bound share declined by 3 percent but remains a towering 74.54 percent. The pattern of small overall impact applies to all the other top trading partners. For example, exports to the UK have increased, but exports to Japan and Mexico have essentially stalled. When we consider average export growth rates over the last five years (table 15), we see a very strong rate for China (15.5 percent) and strong rates for the UK and South Korea (8.9 percent and 6.9 percent). However, a 15 percent increase in a 4 percent overall trade share produces little change. The point we are making is that, at this rate and pattern of trade ‘diversification,’ it will actually take a very long time—while relatively small upward trends in trade with the United States could have a quick and very large impact in the opposite direction.
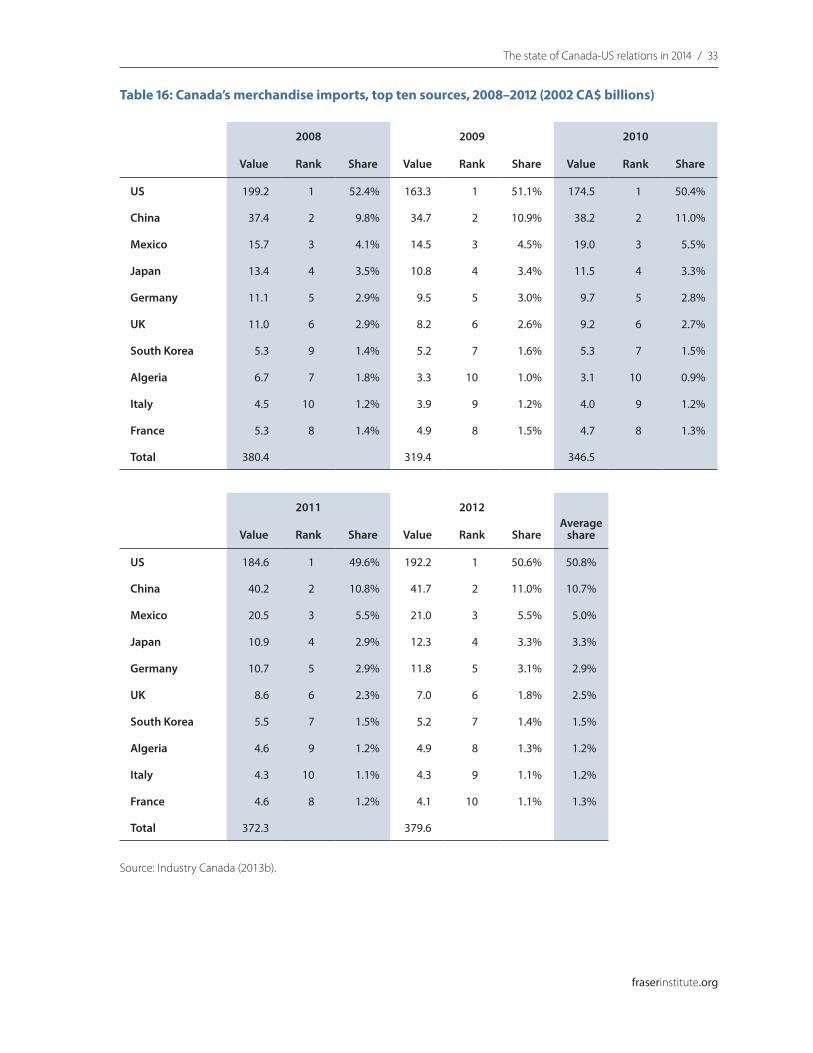
On the import side we notice more trade diversification, with the US share at 50 percent and the Chinese share at 11 percent (table 16). The Chinese growth rate on the import side is less than on the export side (table 17). The most revealing number may be the high average over five years for Mexico, at 9 percent. This could be indicative of a growing supply chain with Mexico.
While foreign direct investment (FDI) is not a direct indicator of future trade, trends in investment may harbinger change. In terms of outbound FDI, we notice that only a small segment (less than 10 percent) is targeted for manufacturing (table 18). It is investment in this category in which one would expect growth in supply chains.

The state of Canada-US relations in 2014 / 31
fraserinstitute.org
Table 14: Canada’s merchandise exports, top ten destinations, 2008–2012 (2002 CA$ billions)
2008 2009 2010
Value Rank Share Value Rank Share Value Rank Share
US 329.1 1 77.7% 236.1 1 75.1% 256.4 1 74.9%
China 9.2 4 2.2% 9.7 3 3.1% 11.4 3 3.3%
UK 11.4 2 2.7% 10.5 2 3.3% 14.1 2 4.1%
Japan 9.7 3 2.3% 7.3 4 2.3% 7.9 4 2.3%
Mexico 5.1 5 1.2% 4.2 5 1.3% 4.3 5 1.3%
Netherlands 3.2 8 0.8% 2.4 8 0.8% 2.8 8 0.8%
South Korea 3.4 7 0.8% 3.1 7 1.0% 3.2 7 0.9%
Germany 3.9 6 0.9% 3.3 6 1.0% 3.4 6 1.0%
France 2.8 9 0.7% 2.3 9 0.7% 2.0 10 0.6%
Brazil 2.3 10 0.5% 1.4 10 0.4% 2.2 9 0.6%
Total 423.7 314.5 342.4
2011 2012Average
shareValue Rank Share Value Rank Share
US 275.0 1 73.7% 278.3 1 74.5% 75.2%
China 14.0 3 3.8% 15.9 2 4.3% 3.3%
UK 15.7 2 4.2% 15.4 3 4.1% 3.7%
Japan 8.9 4 2.4% 8.5 4 2.3% 2.3%
Mexico 4.6 5 1.2% 4.4 5 1.2% 1.2%
Netherlands 4.0 7 1.1% 3.7 6 1.0% 0.9%
South Korea 4.3 6 1.1% 3.0 7 0.8% 0.9%
Germany 3.3 8 0.9% 2.9 8 0.8% 0.9%
France 2.6 9 0.7% 2.6 9 0.7% 0.7%
Brazil 2.4 10 0.6% 2.1 10 0.6% 0.6%
Total 373.2 373.4
Source: Industry Canada (2013b).

32 / The state of Canada-US relations in 2014
fraserinstitute.org
Table 15: Canadian export growth rates, 2008–2012
2008 2009 2010
% Rank % Rank % Rank
US 5.6 7 -28.1 9 10.6 = 5
China 10.1 6 6.5 1 18.7 3
UK 1.6 9 -7.3 2 35.8 2
Japan 20.2 3 -25.0 7 10.6 = 5
Mexico 17.9 4 -17.8 6 4.3 9
Netherlands -8.5 10 -25.5 8 18.3 4
South Korea 27.6 2 -8.0 3 5.2 8
Germany 16.0 5 -16.7 4 5.4 7
France 3.6 8 -17.4 5 -12.2 10
Brazil 70.6 1 -38.0 10 60.3 1
2011 2012Average
%% Rank % Rank
US 10.4 8 2.7 2 0.2
China 27.0 4 15.2 1 15.5
UK 14.8 6 -0.2 4 9.0
Japan 16.1 5 -2.9 6 3.8
Mexico 9.4 9 -1.6 5 2.4
Netherlands 47.5 1 -5.5 7 5.3
South Korea 37.4 2 -27.2 10 7.0
Germany 0.5 10 -9.5 9 -0.9
France 31.1 3 2.3 3 1.5
Brazil 10.9 7 -9.2 8 18.9
Source: Industry Canada (2013b); calculations by authors.
The state of Canada-US relations in 2014 / 33
fraserinstitute.org
Table 16: Canada’s merchandise imports, top ten sources, 2008–2012 (2002 CA$ billions)
2008 2009 2010
Value Rank Share Value Rank Share Value Rank Share
US 199.2 1 52.4% 163.3 1 51.1% 174.5 1 50.4%
China 37.4 2 9.8% 34.7 2 10.9% 38.2 2 11.0%
Mexico 15.7 3 4.1% 14.5 3 4.5% 19.0 3 5.5%
Japan 13.4 4 3.5% 10.8 4 3.4% 11.5 4 3.3%
Germany 11.1 5 2.9% 9.5 5 3.0% 9.7 5 2.8%
UK 11.0 6 2.9% 8.2 6 2.6% 9.2 6 2.7%
South Korea 5.3 9 1.4% 5.2 7 1.6% 5.3 7 1.5%
Algeria 6.7 7 1.8% 3.3 10 1.0% 3.1 10 0.9%
Italy 4.5 10 1.2% 3.9 9 1.2% 4.0 9 1.2%
France 5.3 8 1.4% 4.9 8 1.5% 4.7 8 1.3%
Total 380.4 319.4 346.5
2011 2012Average
shareValue Rank Share Value Rank Share
US 184.6 1 49.6% 192.2 1 50.6% 50.8%
China 40.2 2 10.8% 41.7 2 11.0% 10.7%
Mexico 20.5 3 5.5% 21.0 3 5.5% 5.0%
Japan 10.9 4 2.9% 12.3 4 3.3% 3.3%
Germany 10.7 5 2.9% 11.8 5 3.1% 2.9%
UK 8.6 6 2.3% 7.0 6 1.8% 2.5%
South Korea 5.5 7 1.5% 5.2 7 1.4% 1.5%
Algeria 4.6 9 1.2% 4.9 8 1.3% 1.2%
Italy 4.3 10 1.1% 4.3 9 1.1% 1.2%
France 4.6 8 1.2% 4.1 10 1.1% 1.3%
Total 372.3 379.6
Source: Industry Canada (2013b).

34 / The state of Canada-US relations in 2014
fraserinstitute.org
Table 17: Old and new trade prospects—import growth rates, 2008–2012
2008 2009 2010
% Rank % Rank % Rank
US 2.9 8 -17.8 7 8.9 5
China 11.2 4 -7.0 2 12.3 3
Mexico 4.3 7 -7.7 4 33.7 1
Japan -1.1 10 -19.2 8 8.9 4
Germany 10.5 5 -14.9 6 4.4 7
UK 9.5 6 -25.2 9 14.1 2
South Korea 12.0 3 -1.4 1 3.6 8
Algeria 51.8 1 -51.1 10 -5.0 10
Italy 1.1 9 -13.2 5 4.8 6
France 19.1 2 -7.0 3 -3.5 9
2011 2012Average
%% Rank % Rank
US 8.8 5 5.7 4 1.7
China 8.2 6 5.3 5 6.0
Mexico 11.1 3 3.9 6 9.1
Japan -2.9 9 15.1 1 0.1
Germany 13.2 2 11.7 2 5.0
UK -3.6 10 -17.3 10 -4.5
South Korea 7.6 7 -3.7 8 3.7
Algeria 53.3 1 9.1 3 11.6
Italy 9.5 4 2.3 7 0.9
France 2.2 8 -9.7 9 0.2
Source: Industry Canada (2013b); calculations by authors.

The state of Canada-US relations in 2014 / 35
fraserinstitute.org
In terms of overall Canadian outbound FDI, stocks in the US remain very high despite the recent US recession, while growth in stock in Asia is modest (figure 19). When we examine Canadian FDI in the so-called BRIC states, we notice that investment in both China and India is relatively small. Canadian mining investment in Brazil is much larger (figure 20). In fact, when we examine amounts of FDI, we find that Canada is not really a big BRIC investor other than Brazil. Chile, Hong Kong, and Peru are larger FDI recipi-ents than China and India (figure 21).
In terms of FDI flowing into Canada, we notice the very large share (28.65 percent) in manufacturing, which indicates both the predominant share of US FDI and the extensive integrated supply chains in Canada-US manufacturing (table 19). Even more than for outbound FDI, inflow stocks show very large US preponderance (figure 22). Such continued concentra-tion of US FDI in Canada suggests that Canadian trade diversification is not just a decision to be made by Canadian producers.
Like trade growth, Chinese FDI growth in Canada is positive but the overall numbers are small and do not show rapid growth in the last 3 years (figure 23).
Table 18: Top industries for outward stocks of FDI, 2012
Category Value % Share
Mining, oil and gas extraction 109.9 18.8%
Oil and gas subcategory 54.2 9.3%
Manufacturing 56.9 9.7%
Finance and insurance 233.4 39.9%
Management of companies and enterprises 75.7 12.9%
Note: Value in 2002 CA$ billions. Categories in North American Industry Classification System.
Source: Foreign Affairs, Trade and Development Canada (2013c).

36 / The state of Canada-US relations in 2014
fraserinstitute.org
01
2
3
4
5
6
7
8
9
10
2012201120102009200820072006
2002
CA
$ bi
llion
s
Figure 20: Canadian foreign direct investment (stock), BRIC, 2006–2012
Source: Foreign A�airs, Trade and Development Canada (2013c).
Brazil PRC India Russia
020406080
100120140160180200220240260
20122011201020092008200720062005
2002
CA
$ bi
llion
s
Figure 19: Canadian foreign direct investment (stock), various regions, 2005–2012
Notes: Excluding Mexico. Canadian FDI to Mexico in 2012 was $5.57 billion.
Foreign Direct Investment measures the purchase of various forms of capital stock abroad. However, tax havens (Barbados, Bermuda, etc.) are frequently found to be some of the highest recipients of FDI. In reality, tax havens do not re�ect economic growth as FDI �gures invested into tax havens are often reinvested back to the source country in a concept known as round-tripping (Financial Post, 2013). We have accounted for tax havens by removing them from tables and �gures in this section. The numbers corresponding to Figure 19 would be: Barbados ($59.3 billion); Bermuda ($11.8 billion); British Virgin Islands ($2.1 billion); Cayman Islands ($30.2 billion).
Source: Foreign A�airs, Trade and Development Canada (2013c).
US Europe Asia & Oceania Central & South America Africa

The state of Canada-US relations in 2014 / 37
fraserinstitute.org
Table 19: Top industries for inward stocks of FDI, 2012
Category Value % Share
Oil and gas extraction 76.6 14.7%
Manufacturing 149.2 28.7%
Petroleum and coal products manufacturing 37.7 7.2%
Wholesale trade 39.5 7.6%
Finance and insurance 69.9 13.4%
Management of companies and enterprises 99.9 19.2%
Note: Value in 2002 CA$ billions. Categories in North American Industry Classification System.
Source: Foreign Affairs, Trade and Development Canada (2013c).
0
2
4
6
8
10
12
2012201120102009200820072006
2002
CA
$ bi
llion
s
Figure 21: Canadian foreign direct investment (stock), Chile, Hong Kong, Peru & Korea, 2006–2012
Source: Foreign A�airs, Trade and Development Canada (2013c).
Chile Hong Kong Peru Korea

38 / The state of Canada-US relations in 2014
fraserinstitute.org
0
40
80
120
160
200
240
280
20122011201020092008200720062005
2002
CA
$ bi
llion
s
Figure 22: Foreign direct investment (stock) in Canada from top three countries, 2005–2012
Source: Foreign A�airs, Trade and Development Canada (2013c).
US Netherlands UK
0
2
4
6
8
10
12
201220112010200920082007
2002
CA
$ bi
llion
s
Figure 23: Foreign direct investment (stock) in Canada from China, 2007–2012
Source: Foreign A�airs, Trade and Development Canada (2013c).

fraserinstitute.org / 39
Conclusion: the bilateral and diversification agenda
China was Canada’s second largest trading partner in 2012, with net merchan-dise totaling $70 billion, but this was far behind US net merchandise trade at $572.59 billion (Industry Canada, 2013b). Both trade and investment patterns suggest that change will be slow. Canada’s foreign investment review process has signaled its concern with China’s State-Owned Enterprises’ predominant involvement in energy projects. Until China proceeds with more privatization of this sector, or Canada’s changes its criteria, Chinese FDI levels in Canada will remain small. The flattening of FDI flows in the 2010–2012 period show this pattern (figure 23).
European economies remain among Canada’s top export destinations and import sources, with at least four European countries consistently rank-ing in the top ten. The successful completion of the Comprehensive Economic Trade Agreement (CETA) with the European Union in 2013 bodes well for stronger trade growth with these countries. A joint report between Canada and the European Union, issued in 2009, predicts the gains from trade over seven years to be €8.2 billion and €11.6 billion, respectively (Foreign Affairs, Trade and Development Canada, 2012b). Trade liberalization in services and the elimination of tariffs on goods contribute the most to these GDP gains. Most recent estimates predict that Canadian exports to the EU will increase by 20.6 percent and that EU exports to Canada will increase by 24.3 percent (Foreign Affairs, Trade and Development Canada, 2012b).
The boost CETA offers in terms of Canada’s trade diversification is not so much in volume as it is in perception, confidence, and possibly in terms of strategic trade position in North America. As both Mexico and Canada now have EU trade agreements, they may be in a better position to leverage this advantage within NAFTA as the US is pursuing a Transatlantic Trade and Investment Partnership (TTIP) with the EU. Another boost offered by CETA is that the agreement calls for lowering regulatory barriers in several sectors. It is both inside NAFTA, in TTIP, and in a potential Trans Pacific Partnership trade agreement that such mutual recognition on regulations or common standards can boost trade.

40 / The state of Canada-US relations in 2014
fraserinstitute.org
Ultimately, Canada’s objectives intersect at the point where frustration with the US meets the limits of diversification. The most optimal short-term outcome for Canada remains a vibrant US economy coupled with lower trade barriers in North America. Helping to create a strategic focus at the highest levels in Washington for lowering regulatory barriers inside North America must remain a priority for Canadian officials, as progress on this file benefits Canadian consumers and producers most.

fraserinstitute.org / 41
References
Abacus Data (2012, November 20). Beyond the Canadian-American Border. <http://abacusdata.ca/wp-content/uploads/2012/11/Can-AM_Report_CABC_Nov2012_FINAL.pdf>
Angus Reid (2012, May 17). Americans and Canadians Feel They Have Lost Out with NAFTA. Press Release. <http://vcu.visioncritical.com/wp-content/uploads/2012/05/Americans-and-Canadians-Feel-They-Have-Lost-Out-with-NAFTA.pdf>
Baker, J. S., and M. Byers (2012). Crossed Lines: The Curious Case of the Beaufort Sea Maritime Boundary Dispute. Ocean Development & International Law 43, 1: 70–95.
Baker, S. R., N. Bloom, and S. J. Davis (2013). Measuring Economic Policy Uncertainty. Center for Economic Performance.
Bank of Canada (2013a). Consumer Price Index, 2000 to Present. <http://www.bankofcanada.ca/rates/price-indexes/cpi/>
Bank of Canada (2013b). Monthly and annual average exchange rates. <http://www.bankofcanada.ca/rates/exchange/exchange-rates-in-pdf/>
Bank of Canada (2013c). Monthly Average Exchange Rates: 10-Year Lookup. <http://www.bankofcanada.ca/rates/exchange/monthly-average-lookup/>
Barua, B., and N. Esmail (2013). The Case for Mutual Recognition of Drug Approvals. Studies in Health Policy. Fraser Institute.
Blanchfield, M. (2013, November 16). Prescription drug costs to rise due to EU deal. The Vancouver Sun. <http://www.vancouversun.com/business/Prescription+drug+costs+rise+deal/9174282/story.html>
Websites retrievable as of January 12, 2013.

42 / The state of Canada-US relations in 2014
fraserinstitute.org
Brown, M. W., and W. P. Anderson (2012, November 19). Trucking Across the Border: The Relative Cost of Cross-border and Domestic Trucking, 2004 to 2009. Statistics Canada.<http://www5.statcan.gc.ca/bsolc/olc-cel/olc-cel?catno=11F0027MWE2012081&lang=eng>
Bureau of Transportation Statistics (2013). North American Transborder Freight Data: Indexed Data. <http://transborder.bts.gov/programs/international/transborder/index/Index_Interface.html>
Canada Border Services Agency (2013, September 4). Integrated Cargo Security Strategy (ICSS) Overview. <http://www.cbsa-asfc.gc.ca/trade-commerce/icss-sisf/icss-sisf-menu-eng.html>
The Canadian Press (2012, July 18). Canada Claims Victory in Softwood Dispute. <http://metronews.ca/news/canada/302143/canada-claims-victory-in-softwood-dispute/>
The Canadian Press (2013a, June 7). Canada Threatens to Impose Tariffs on U.S. Foods, Furniture in Meat-Labelling Dispute. <http://business.financialpost.com/2013/06/07/canada-threatens-to-impose-tariffs-on-u-s-foods-furniture-in-meat-labelling-dispute/>
The Canadian Press (2013b, July 17). Canada-EU Trade Deal May Come in 2014, But Will be Worth the Wait, Says Envoy. <http://www.montrealgazette.com/business/CanadaEU+trade+deal+come+2014+will+worth+wait+says+envoy/8672771/story.html>
The Canadian Press (2013c, July 3). EU Envoy Prods Canada to Finalize Free Trade Deal. <http://www.cbc.ca/news/politics/story/2013/07/03/pol-cp-canada-eu-trade-talks-push.html>
The Canadian Press (2013d, February 27). U.S. Program Cuts Threaten Border Pact with Canada. <http://www.cbc.ca/news/politics/story/2013/02/27/canada-us-beyond-the-border-pact-federal-programs.html>
Cascade Gateway Data (2013). Border Data Warehouse. <http://www.cascadegatewaydata.com/CustomQuery>
CBC News (2008, October 31). Wheat Board Wins Tariff Dispute with U.S. <http://www.cbc.ca/news/canada/manitoba/story/2008/10/31/wheat-tariffs.html>
CBC News (2012, January 23). Softwood Lumber Agreement with U.S. Extended. <http://www.cbc.ca/news/politics/story/2012/01/23/pol-canada-us-trade-softwood-lumber.html>

The state of Canada-US relations in 2014 / 43
fraserinstitute.org
Congressional Budget Office (2013, August 12). Historical Budget Data—August 2013. <http://www.cbo.gov/publication/44507>
Consumer Energy Alliance (2013, June 20). Keystone XL By The Numbers. <http://www.theenergyvoice.com/874/>
Embassy of the United States, Ottawa, Canada (2013). Special 301 Report (Intellectual Property Rights). <http://canada.usembassy.gov/key-reports/special-301-report-intellectual-property-rights.html>
Financial Post (2013, June 26). Tax Havens Thriving as Efforts to Stop Flow of Money Offshore Fail: UN. <http://business.financialpost.com/2013/06/26/tax-havens-thriving-as-efforts-to-stop-flow-of-money-offshore-fail-un/>
Food Marketing Institute (2013, May 23). FMI Statement on U.S. Department of Agriculture’s New Rule Regarding Mandatory Country of Origin Labeling Requirements for Meat. <http://www.fmi.org/news-room/news-archive/view/2013/05/23/fmi-statement-on-u.s.-department-of-agriculture-s-new-rule-regarding-mandatory-country-of-origin-labeling-requirements-for-meat>
Foreign Affairs, Trade and Development Canada (2012a, July 19). Canada Applauds Softwood Lumber Ruling on British Columbia’s Timber-Pricing System. News Release. <http://www.international.gc.ca/media_commerce/comm/news-communiques/2012/07/18a.aspx>
Foreign Affairs, Trade and Development Canada (2012b, April 13). Canada-European Union Joint Report: Towards a Comprehensive Economic Agreement. <http://www.international.gc.ca/trade-agreements-accords-commerciaux/agr-acc/eu-ue/can-eu-report-can-ue-rapport.aspx?lang=eng>
Foreign Affairs, Trade and Development Canada (2013a, June 6). Canada’s International Trade in Services. <http://www.international.gc.ca/economist-economiste/assets/pdfs/Data/facts-fiches/Pfact_ENG_Services.pdf>
Foreign Affairs, Trade and Development Canada (2013b, April 15). Dispute Settlement, Cases Related to NAFTA Chapter 19. <http://www.international.gc.ca/trade-agreements-accords-commerciaux/topics-domaines/disp-diff/wheat.aspx?lang=eng>
Foreign Affairs, Trade and Development Canada (2013c, July 17). Foreign Direct Investment Statistics. <http://www.international.gc.ca/economist-economiste/statistics-statistiques/investments-investissements.aspx>

44 / The state of Canada-US relations in 2014
fraserinstitute.org
Gallup Poll (2012, February 16). Americans Give Record-High Ratings to Several U.S. Allies. <http://www.gallup.com/poll/152735/americans-give-record-high-ratings-several-allies.aspx>
Gallup Poll (2013, June 6). In U.S., More See China as Friend Than Foe. <http://www.gallup.com/poll/162935/u.s.-more-see-china-friend-foe.aspx>
Government of Canada (2013a, July 16). Canada-U.S. Agreement on Government Procurement. <http://www.canadainternational.gc.ca/sell2usgov-vendreaugouvusa/procurement-marches/agreement-accord.aspx?lang=eng>
Government of Canada (2013b). Canada’s Economic Action Plan. <http://www.actionplan.gc.ca/>
Government of Canada (2013c). Beyond the Border Action Plan News, October 2013. <http://actionplan.gc.ca/sites/default/files/pdfs/btb_news_october_2013.pdf>
Government of Canada (2013d). Regulatory Cooperation Council News, October 2013. <http://actionplan.gc.ca/sites/default/files/pdfs/rcc_news_october_2013.pdf>
Graves, F., R. Pastor, and M. Basáñez (2013). The NAFTA Promise and the North American Reality: The Gap and How to Narrow It. Center for North American Studies.
Green, K. P., and D. Furchtgott-Roth (2013). Intermodal Safety in the Transport of Oil. Studies in Energy Transportation. Fraser Institute. <https://www.fraserinstitute.org/uploadedFiles/fraser-ca/Content/research-news/research/publications/intermodal-safety-in-the-transport-of-oil.pdf>
Harris Decima (2012, July). Obama Remains Extremely Popular in Canada. <http://www.harrisdecima.com/news/releases/201207/1446-obama-remains-extremely-popular-canada>
Holden, M. (2010, July 22). Canadian Trade and Investment Activity: Canada–Algeria. Library of Parliament. <http://www.parl.gc.ca/Content/LOP/ResearchPublications/2010-45-e.pdf>
Hussain, Y. (2013, August 29). Investments in Western Canada Oil Rail Terminals Top USD1B: Report. Financial Post. <http://business.financialpost.com/2013/08/29/investments-in-western-canada-oil-rail-terminals-top-usd1b-report/?__lsa=3dab-05ea>

The state of Canada-US relations in 2014 / 45
fraserinstitute.org
Industry Canada (2013a, January 23). Capital Investment Oil and Gas Extraction (NAICS 211). <http://www.ic.gc.ca/cis-sic/cis-sic.nsf/IDE/cis-sic211inve.html>
Industry Canada (2013b, February 7). International Trade Utilities (NAICS 22). <http://www.ic.gc.ca/cis-sic/cis-sic.nsf/IDE/cis-sic22inte.html>
Kappler, M., H. Reisen, M. Schularick, and E. Turkisch (2011). The Macroeconomic Effects of Large Exchange Rate Appreciations. Organisation for Economic Co-operation and Development. <http://www.oecd-ilibrary.org/fr/development/the-macroeconomic-effects-of-large-exchange-rate-appreciations_5kgglsnbscbs-en>
Komarow, S., and E. Martin (2013, March 22). Mexico Envisions Nafta-EU Trade Agreement, Foreign Minister Says. Bloomberg News. <http://www.bloomberg.com/news/2013-03-23/mexico-envisions-nafta-eu-trade-agreement-foreign-minister-says.html>
Lexchin, J., and M.-A. Gagnon (2013). CETA and Intellectual Property: The Debate over Pharmaceutical Patents. Canada-Europe Transatlantic Dialogue, 7.
Lewis, J. (2013b, September 9). Keystone XL ‘No Longer a Necessity’ For Canadian Producers: Analyst. Financial Post. <http://business.financialpost.com/2013/09/09/keystone-xl-no-longer-a-necessity-for-canadian-producers-analyst/?__lsa=3dab-05ea>
Matthiesen, B. (2011, November 9). Recent Buy American Provisions: What you need to know. Canadian Manufacturers and Exporters. <http://www.cme-mec.ca/?lid=JCKNC-E742G-1W6JA&comaction=show&cid=6C5CK-2G55Y-WIB8R>
Millington, D., and C. A Murillo (2013). Canadian Oil Sands Supply Costs and Development Projects (2012-2046). Canadian Energy Research Institute. <http://www.ceri.ca/images/stories/2013-06-10_CERI_Study_133_-_Oil_Sands_Update_2012-2046.pdf>
Moens, A. (2010). Skating on Thin Ice: Canadian-American Relations in 2010 and 2011. Studies in Canada-US Relations. Fraser Institute.
Moens, A., and J. Clemens (eds.) (2013). The US Election 2012: Implications for Canada. Fraser Institute.

46 / The state of Canada-US relations in 2014
fraserinstitute.org
Moens, A., and N. Gabler (2011). What Congress Thinks of Canada. Studies in Canada-US Relations. Fraser Institute. <http://www.fraserinstitute.org/uploadedFiles/fraser-ca/Content/research-news/research/publications/whatcongressthinksofcanada.pdf>
Moens, A., and N. Gabler (2012). Measuring the Costs of the Canada-US Border. Studies in Canada-US Relations. Fraser Institute. <http://www.fraserinstitute.org/uploadedFiles/fraser-ca/Content/research-news/research/publications/measuring-the-costs-of-the-canada-us-border.pdf>
Moens, A., and A. V. Leon (2012). Mandatory Country of Origin Labeling: The Case For a Harmonized Canada-US Beef and Pork Regulatory Regime. Fraser Forum (July/August). Fraser Institute. <http://www.fraserinstitute.org/uploadedFiles/fraser-ca/Content/research-news/research/articles/mandatory-country-of-origin-labeling-ff0712.pdf>
Murse, T. (2013). Hillary Clinton on the Keystone XL Pipeline. <http://uspolitics.about.com/od/CampaignsElections/a/Hillary-Clinton-On-The-Keystone-Xl-Pipeline.htm>
The New York Times (2013, July 28). Interview With President Obama. <http://www.nytimes.com/2013/07/28/us/politics/interview-with-president-obama.html?ref=politics>
Office of the United States Trade Representative (2013, May 1). USTR Releases Annual Special 301 Report on Intellectual Property Rights. <http://www.ustr.gov/about-us/press-office/press-releases/2013/may/ustr-releases-annual-special-301-report>
Organisation for Economic Co-operation and Development [OECD] (2013). Economics: Key Tables from OECD. <http://www.oecd-ilibrary.org/economics/economics-key-tables-from-oecd_2074384x;jsessionid=7b10tnihdk01q.x-oecd-live-01>
Pew Global (2013). Opinion of the United States. <http://www.pewglobal.org/database/indicator/1/country/39/>
Robertson, C. (2013, April 3). North Korea’s Threats Show that Canada Needs to be Part of U.S. Missile Defence Pact. The Globe and Mail. <http://www.theglobeandmail.com/commentary/north-koreas-threats-show-that-canada-needs-to-be-part-of-us-missile-defence-pact/article10713612/>
The state of Canada-US relations in 2014 / 47
fraserinstitute.org
Statistics Canada (2011, February 25). Travellers to Canada by Country of Origin, Top 15 Countries of Origin. <http://www.statcan.gc.ca/tables-tableaux/sum-som/l01/cst01/arts38a-eng.htm>
Statistics Canada (2013a, November 7). Canadian International Merchandise Trade Database. <http://www5.statcan.gc.ca/cimt-cicm/section-section?lang=eng&dataTransformation=0&refYr=2012&refMonth=8&freq=12&countryId=0&usaState=9&provId=1&retrieve=Retrieve&save=null&trade=null>
Statistics Canada (2013b, April 5). Canadian International Merchandise Trade, February 2013. The Daily. <http://www.statcan.gc.ca/daily-quotidien/130405/dq130405b-eng.htm>
Statistics Canada (2013c). Merchandise Imports and Exports, Customs and Balance of Payments Basis. CANSIM Table 228-0058. <http://www5.statcan.gc.ca/cansim/a26?lang=eng&retrLang=eng&id=2280058&tabMode=dataTable&srchLan=-1&p1=-1&p2=9>
Statistics Canada (2013d, August 6). Imports, Exports and Trade Balance of Goods on a Balance-of-Payments Basis, by Country or Country Grouping. <http://www.statcan.gc.ca/tables-tableaux/sum-som/l01/cst01/gblec02a-eng.htm>
Statistics Canada (2013e, July 18). Non-Resident Travellers Entering Canada. <http://www.statcan.gc.ca/tables-tableaux/sum-som/l01/cst01/arts34-eng.htm>
Statistics Canada (2013f, February 27). Private and Public Investment, 2013. The Daily. <http://www.statcan.gc.ca/daily-quotidien/130227/dq130227a-eng.htm>
Statistics Canada (2013g, June 7). Business Sector: Labour Productivity and Related Variables for Canada and the United States. <http://www.statcan.gc.ca/daily-quotidien/130607/t130607b001-eng.htm>
TD Economics (2012, February 24). Strong Canadian Dollar Ahead, But Mind the Potholes. <http://www.td.com/document/PDF/economics/special/lp0212_can_dollar.pdf>
U.S. Department of Labor, Bureau of Labor Statistics (2013a, October 30). Consumer Price Index. <ftp://ftp.bls.gov/pub/special.requests/cpi/cpiai.txt>
U.S. Department of Labor, Bureau of Labor Statistics (2013b, November 2). Labor Force Statistics from the Current Population Survey. <http://data.bls.gov/timeseries/LNS14000000>

48 / The state of Canada-US relations in 2014
fraserinstitute.org
Waldie, P. (2013, October 18). Canada, EU Unveil ‘Historic’ Free-trade Agreement. The Globe and Mail. <http://www.theglobeandmail.com/news/politics/eu-harper/article14924915/>
The World Bank (2013a). Merchandise trade (% of GDP). <http://data.worldbank.org/indicator/TG.VAL.TOTL.GD.ZS>
The World Bank (2013b). United States. <http://data.worldbank.org/country/united-states>
Young, J. T. (2013, April 12). The Worst Four Years Of GDP Growth In History: Yes, We Should Be Worried. Forbes. <http://www.forbes.com/sites/realspin/2013/04/12/the-worst-four-years-of-gdp-growth-in-history-yes-we-should-be-worried/>

The state of Canada-US relations in 2014 / 49
fraserinstitute.org
About the authors
Alexander MoensAlexander Moens (www.alexandermoens.com) is a professor of Political Science at Simon Fraser University in Vancouver, Canada, and a Senior Fellow in American Policy at the Fraser Institute. Moens is the author of The Foreign Policy of George W. Bush: Values, Strategy, Loyalty (2004) and Foreign Policy Under Carter (1990), as well as editor or co-editor of Disconcerted Europe: The Search for a New Security Architecture (1994), NATO and European Security: Alliance Politics from the Cold War’s End to the Age of Terrorism (2003), and Immigration Policy and the Terrorist Threat in Canada and the United States (2008). Moens has published in numerous journals and newspapers. His most recent publications include: “Obama’s Foreign Policy: Change Without Conviction,” in Nikolaos Tzifakis (ed.), International Politics in Times of Change (Berlin and Heidelberg, 2012); “NATO and the EU: Canada’s Security Interests in Europe and Beyond,” in David S. McDonough (ed.), Canada’s National Security in the Post-9/11 World (Toronto University Press, 2012);
“Canadian Interests in Building Cooperation Between NATO and the African Union,” with Jimmy Peterson, in Brooke Smith-Windsor (ed.), AU–NATO Collaboration: Implications and Prospects (NATO Defence College, 2013); and “George W. Bush Decision Maker: Take Two,” Chapter 6 in Donald R. Kelley and Todd G. Shields (eds.), Taking the Measure: The Presidency of George W. Bush (Texas A&M University Press, 2013).
Alex BartosAlex Bartos holds a B.S.S. degree in Economics from the University of Ottawa, and a B.A. in Political Science from Simon Fraser University. He has worked for both federal and provincial elected representatives, founded and was president of the SFU Conservative Club, and acted in an executive capacity for the BC Conservative Youth Association. His specific research interests include Canada-US trade policy and international trade relations. Mr. Bartos is the recipient of several honours for both his academic and extracurricular volunteer activities.

50 / The state of Canada-US relations in 2014
fraserinstitute.org
Acknowledgments
The authors are indebted to the anonymous reviewers for their comments, suggestions, and insights. Any remaining errors or oversights are the sole responsibility of the authors. As the researchers worked independently, the views and conclusions expressed in this paper do not necessarily reflect those of the Board of Trustees of the Fraser Institute, the staff, or supporters.

The state of Canada-US relations in 2014 / 51
fraserinstitute.org
Publishing information
DistributionThese publications are available from <http://www.fraserinstitute.org> in Portable Document Format (PDF) and can be read with Adobe Acrobat® or Adobe Reader®, versions 7 or later. Adobe Reader® XI, the most recent ver-sion, is available free of charge from Adobe Systems Inc. at <http://get.adobe.com/reader/>. Readers having trouble viewing or printing our PDF files us-ing applications from other manufacturers (e.g., Apple’s Preview) should use Reader® or Acrobat®.
Ordering publicationsTo order printed publications from the Fraser Institute, please contact the publications coordinator:
• e-mail: [email protected] • telephone: 604.688.0221 ext. 580 or, toll free, 1.800.665.3558 ext. 580 • fax: 604.688.8539.
MediaFor media enquiries, please contact our Communications Department:
• 604.714.4582 • e-mail: [email protected].
CopyrightCopyright © 2014 by the Fraser Institute. All rights reserved. No part of this publication may be reproduced in any manner whatsoever without written permission except in the case of brief passages quoted in critical articles and reviews.
Date of issueJanuary 2014
ISBN978-0-88975-284-9
CitationMoens, Alexander, and Alex Bartos (2014). Canada`s Catch-22: The State of Canada-US Relations in 2014. Fraser Institute. <http://www.fraserinstitute.org>.
Cover designBill Ray
Cover imagesUS and Canada Flag Portions © aliced, Bigstock.

52 / The state of Canada-US relations in 2014
fraserinstitute.org
Supporting the Fraser Institute
To learn how to support the Fraser Institute, please contact
• Development Department, Fraser Institute Fourth Floor, 1770 Burrard Street Vancouver, British Columbia, V6J 3G7 Canada
• telephone, toll-free: 1.800.665.3558 ext. 586
• e-mail: [email protected]
Lifetime patronsFor their long-standing and valuable support contributing to the success of the Fraser Institute, the following people have been recognized and inducted as Lifetime Patrons of the Fraser Institute.
Sonja Bata
Charles Barlow
Ev Berg
Art Grunder
Jim Chaplin
Serge Darkazanli
John Dobson
Raymond Heung
Bill Korol
Bill Mackness
Fred Mannix
Jack Pirie
Con Riley
Catherine Windels

The state of Canada-US relations in 2014 / 53
fraserinstitute.org
Purpose, funding, & independence
The Fraser Institute provides a useful public service. We report objective information about the economic and social effects of current public policies, and we offer evidence-based research and education about policy options that can improve the quality of life.
The Institute is a non-profit organization. Our activities are funded by charitable donations, unrestricted grants, ticket sales, and sponsorships from events, the licensing of products for public distribution, and the sale of publications.
All research is subject to rigorous review by external experts, and is conducted and published separately from the Institute’s Board of Trustees and its donors.
The opinions expressed by the authors are those of the individuals themselves, and do not necessarily reflect those of the Institute, its Board of Trustees, its donors and supporters, or its staff. This publication in no way implies that the Fraser Institute, its trustees, or staff are in favour of, or op-pose the passage of, any bill; or that they support or oppose any particular political party or candidate.
As a healthy part of public discussion among fellow citizens who de-sire to improve the lives of people through better public policy, the Institute welcomes evidence-focused scrutiny of the research we publish, including verification of data sources, replication of analytical methods, and intelligent debate about the practical effects of policy recommendations.

54 / The state of Canada-US relations in 2014
fraserinstitute.org
About the Fraser Institute
Our vision is a free and prosperous world where individuals benefit from greater choice, competitive markets, and personal responsibility. Our mission is to measure, study, and communicate the impact of competitive markets and government interventions on the welfare of individuals.
Founded in 1974, we are an independent Canadian research and edu-cational organization with locations throughout North America and interna-tional partners in over 85 countries. Our work is financed by tax-deductible contributions from thousands of individuals, organizations, and foundations. In order to protect its independence, the Institute does not accept grants from government or contracts for research.
Nous envisageons un monde libre et prospère, où chaque personne bénéfi-cie d’un plus grand choix, de marchés concurrentiels et de responsabilités individuelles. Notre mission consiste à mesurer, à étudier et à communiquer l’effet des marchés concurrentiels et des interventions gouvernementales sur le bien-être des individus.
Peer review —validating the accuracy of our researchThe Fraser Institute maintains a rigorous peer review process for its research. New research, major research projects, and substantively modified research conducted by the Fraser Institute are reviewed by experts with a recognized expertise in the topic area being addressed. Whenever possible, external review is a blind process. Updates to previously reviewed research or new editions of previously reviewed research are not reviewed unless the update includes substantive or material changes in the methodology.
The review process is overseen by the directors of the Institute’s re-search departments who are responsible for ensuring all research published by the Institute passes through the appropriate peer review. If a dispute about the recommendations of the reviewers should arise during the Institute’s peer review process, the Institute has an Editorial Advisory Board, a panel of scholars from Canada, the United States, and Europe to whom it can turn for help in resolving the dispute.

The state of Canada-US relations in 2014 / 55
fraserinstitute.org
Members
Past members
Editorial Advisory Board
* deceased; † Nobel Laureate
Prof. Terry L. Anderson
Prof. Robert Barro
Prof. Michael Bliss
Prof. Jean-Pierre Centi
Prof. John Chant
Prof. Bev Dahlby
Prof. Erwin Diewert
Prof. Stephen Easton
Prof. J.C. Herbert Emery
Prof. Jack L. Granatstein
Prof. Herbert G. Grubel
Prof. James Gwartney
Prof. Ronald W. Jones
Dr. Jerry Jordan
Prof. Ross McKitrick
Prof. Michael Parkin
Prof. Friedrich Schneider
Prof. Lawrence B. Smith
Dr. Vito Tanzi
Prof. Armen Alchian*
Prof. James M. Buchanan* †
Prof. Friedrich A. Hayek* †
Prof. H.G. Johnson*
Prof. F.G. Pennance*
Prof. George Stigler* †
Sir Alan Walters*
Prof. Edwin G. West*