Embed Size (px)
Citation preview

Population Change and Lifecourse Strategic Knowledge ClusterDiscussion Paper Series/ Un Réseau stratégique deconnaissances Changements de population et parcours de vieDocument de travail
Volume 1 | Issue 1 Article 4
March 2013
Canada’s Immigrant Families: Growth, Diversityand ChallengesSharon M. LeeUniversity of Victoria, [email protected]
Barry EdmonstonUniversity of Victoria, [email protected]
Follow this and additional works at: https://ir.lib.uwo.ca/pclc
Part of the Demography, Population, and Ecology Commons, Family, Life Course, and SocietyCommons, Inequality and Stratification Commons, and the Race and Ethnicity Commons
This Article is brought to you for free and open access by the Canadian Research Data Centre Network at Scholarship@Western. It has been acceptedfor inclusion in Population Change and Lifecourse Strategic Knowledge Cluster Discussion Paper Series/ Un Réseau stratégique de connaissancesChangements de population et parcours de vie Document de travail by an authorized editor of Scholarship@Western. For more information, pleasecontact [email protected], [email protected].
Recommended CitationLee, Sharon M. and Edmonston, Barry (2013) "Canada’s Immigrant Families: Growth, Diversity and Challenges," Population Changeand Lifecourse Strategic Knowledge Cluster Discussion Paper Series/ Un Réseau stratégique de connaissances Changements de population etparcours de vie Document de travail: Vol. 1 : Iss. 1 , Article 4.Available at: https://ir.lib.uwo.ca/pclc/vol1/iss1/4

Discussion Paper No. 2013‐04
Canada’s Immigrant Families: Growth, Diversity and Challenges
Sharon M. Lee and Barry Edmonston University of Victoria
June 2013

2
DRAFT
CANADA’S IMMIGRANT FAMILIES:
GROWTH, DIVERSITY, AND CHALLENGES*
Sharon M. Lee and Barry Edmonston
University of Victoria
* Paper prepared for presentation at the Workshop on Immigrant Families, May 28-29, 2012, jointly sponsored by the Thematic Committee on Families and Thematic Committee on Immigrants and Migrants, Population Change and Lifecourse Strategic Knowledge Cluster. Direct correspondence to Sharon M. Lee, [email protected] or Barry Edmonston, [email protected].
June 6, 2013
3
ABSTRACT
As immigration continues to be the main factor in Canada’s recent population growth, the
number and proportion of Canada’s immigrant families have also increased, to almost one-fifth
of all families in Canada by 2006. We begin with a comparison of immigrant families with non-
immigrant families on several sociodemographic characteristics including family type and size
and home language to show similarities and differences. Next, we highlight diversity of
immigrant families along selected characteristics including place of birth, period of immigration,
and socioeconomic characteristics such as education and employment. Finally, we identify some
challenges for immigrant families and topics for future research, and conduct a more detailed
analysis of low-income or poor immigrant families.

4
INTRODUCTION
Canada’s immigrant or foreign-born population has grown rapidly in recent decades. The 1961
census reported 1.6 million foreign-born residents, representing 10 percent of the population. By
2006, the immigrant population had increased to over 6 million, or 19.8 percent of the
population. This is the highest percentage foreign-born since 1931.1
As the immigrant population increases, so has the number and proportion of immigrant
families in Canada. The definition of “immigrant family” can be quite broad. For example, an
immigrant family can refer to any family that contains at least one foreign-born person, whether
a child or adult. Another definition considers families with at least one immigrant parent as
immigrant families (Hernandez et al. 2007).
In this paper, we define immigrant families using an approach that is consistent with
previous research based on Canadian census data (Edmonston and Lee forthcoming; Haan 2005):
immigrant families refer to family households where the primary household maintainer is foreign
born, that is, an immigrant. We follow Statistics Canada’s definition of family households to
refer to households that contain at least one census family (that is, a married couple with our
without children, or a couple living common-law with or without children, or a lone parent living
with one or more children). This means that non-family households and family households where
the primary household maintainer is Canadian-born but which may contain one or more foreign-
born persons are excluded. It also means that we include family households where the primary
household maintainer is foreign born but where one or more household members may be
Canadian-born. While our approach may miss some families that contain immigrants, it may
also include families that contain one or more Canadian-born members.
1 Statistics on the foreign-born or immigrant population from various censuses can be found on Statistics Canada’s website (www.statcan.gc.ca). Statistics Canada also issues specific reports on the foreign born population (see Canadian Social Trends) and projections of the future diversity of the population (Statistics Canada 2010a).

5
The above discussion illustrates some of the complexities in defining something that is
seemingly as straightforward as an “immigrant family”. The intrinsic generational aspect of
families means that many immigrant families contain both immigrant and native-born members.
Immigrants may give birth to children in Canada, and their Canadian-born children are part of a
family that is considered an immigrant family because of their immigrant parents. In addition,
for countries such as Canada where immigration has been continuing for many decades,
marriages between immigrants and non-immigrants can also be common, adding a further twist
to the challenges of defining and studying immigrant families. There is an extensive literature on
cross-nativity intermarriage (see Lee and Edmonston 2005; Qian et al. 2001, for U.S.-based
studies and Lee and Boyd 2008). Many of these studies show that cross-nativity intermarriage
varies by gender and racial/ethnic group, which may further complicate the definition and
counting of immigrant families.2
The conceptual and measurement challenges described above should not, however,
discourage research on immigrant families. There are several important reasons for studying
immigrant families, including the following two reasons. First, as we noted above and show in
greater detail below, immigrant families are an increasing part of Canada’s families. Yet a
review of the literature shows very little information or research on immigrant families.3 Within
the field of demography, immigration researchers study migration and immigrants while family
demographers study families, with typically little overlap between the two areas. Thus, the first
2 For example, if immigrant women are more likely to marry a native-born partner, and men are more likely to be householders, then our definition of immigrant family would miss such families. Also, if individuals from some immigrant groups are more likely to intermarry with native-born persons than persons from other immigrant groups, and the native-born partner is more likely to be the householder, our definition would again miss these families. On the other hand, if the immigrant partner is more likely to be the householder, this family would be included. 3 The edited volume by Lansford et al. (2007) on immigrant families in the U.S. is one of the few exceptions. One chapter in this volume is written by a Canadian-based author who discusses Canadian-based research (Tyyska 2007).

6
objective of this paper is to fill this gap in the literature by providing a descriptive analysis of
immigrant families in Canada.
Second, from a lifecourse perspective, there are many critical issues about immigrant
families that need study, including (i) immigrant integration (particularly as immigrants arrive at
different ages and age in Canada); (ii) the second generation, that is, Canadian-born children of
immigrant parents and how they compare on socioeconomic achievement relative to their parents
and to children in non-immigrant families; (iii) the acculturation and socialization of children in
immigrant families and potential inter-generational differences and even conflict; (iv) elderly
immigrants, including immigrants who arrive at older ages and immigrants who age in place in
Canada; and (v) general wellbeing of immigrant families at different stages of the lifecourse (for
example, union formation or dissolution, childbearing, retirement, and health at different stages
in the life-cycle). In addition, Tyyska (2007) identified changing gender relations and
transnationalism (Wong 2007) as important topics for study of immigrant families.
In this paper, we compare immigrant and non-immigrant families along several
characteristics to identify similarities and differences and potential issues that may be
particularly challenging for immigrant families. We also compare immigrant families along
selected characteristics to highlight the diversity of immigrant families. Finally, we conduct
additional analysis of low income among immigrant families to provide further discussion of
some of the challenges facing immigrant families.
GROWTH OF IMMIGRANT FAMILIES
- Table 1 About Here -
Between 1991 and 2006, the foreign-born population increased from 16.1 percent to 19.8
percent of the total population (see Table 1). That almost one in five Canadian residents is

7
foreign-born in 2006 is a record high since 1931. Immigration continues to be the main factor in
Canada’s population growth, accounting for 69 percent of population growth between 2001 and
2006 (Canadian Social Trends).
Not surprisingly, the proportion of immigrant families has also increased along with the
growth of the immigrant population, growing from 21.7 percent in 1991 to 24 percent in 2006
(see Table 1).
COMPARING IMMIGRANT AND NON-IMMIGRANT FAMILIES
We compare immigrant families with non-immigrant families to identify similarities and
differences. We base the comparisons of individual characteristics such as age, gender,
education, and employment on characteristics of the householder, that is, the primary household
maintainer.
- Table 2 About Here -
Table 2 compares family household type for Canadian-born and immigrant families.
Most family households consist of one family with one couple (married or living common-law),
with or without children. However, a slightly lower percentage of immigrant families are in this
category. We note that the percentage of lone parent families has increased among Canadian-
born families from 12.6 percent in 1991 to 15 percent in 2006. This type of family has also
increased among immigrant families, but the percent remains lower, at 13.2 percent in 2006.
The largest difference in family type is in the higher percentage of immigrant families
that contain multiple families. While the percentage of multiple family households among
Canadian-born family households had increased from 0.9 percent in 1991 to 1.6 percent in 2006,
these levels are much lower than those among immigrant families. In 1991, 3.8 percent of

8
immigrant families contain multiple families, a percentage that steadily increased to 5.7 percent
by 2006.4
We examine 2006 census data in the remaining comparisons of immigrant and non-
immigrant families shown in Table 3.
- Table 3 About Here -
Mean household size is 3.4 for immigrant families versus 3.0 for non-immigrant families,
which is consistent with the higher percentage of multiple family households among immigrant
families shown in Table 2 earlier. Immigrant family householders are older, with a mean age of
52.1 compared with 48.8 for Canadian-born householders. A higher percentage of immigrant
householders are male (74.6 percent) compared with 67.4 percent male for Canadian-born
householders.
Immigrant families have lower mean total family income, at $74,386, compared with
mean total family income of $80,229 for Canadian-born families. A higher percentage of
immigrant families (18.6 percent) also fall into Statistics Canada’s definition of low income,
compared with 9.2 percent of Canadian-born families, meaning that twice as many immigrant
families are low income or poor when compared with non-immigrant families.5
Immigrant householders are less likely to own their homes compared with Canadian-born
householders (74.8 percent compared with 79 percent).
4 The higher percentage of immigrant families that include multiple families has at least two implications. First, immigrant family households are more likely to be larger (more people sharing a household unit). Second, our definition of immigrant family may underestimate the number and proportion of immigrant families. 5 “The low income cut-offs (LICOs) are income thresholds below which a family will likely devote a larger share of its income on the necessities of food, shelter, and clothing than the average family. The approach is essentially to estimate an income threshold at which families are expected to spend 20 percentage points more than the average family on food, shelter, and clothing…. Statistics Canada’s cut-offs … vary by 7 family sizes and 5 different populations of the area of residence” (Statistics Canada 2010b: 7). For example, the LICO (after tax) for a family of 4 residing in an urban area with population 100,000 to 499,999 was $27,550 in 2005 (Statistics Canada 2010b: Table 1).

9
Marital status breakdowns are fairly similar except for a slightly lower percentage that is
single and slightly higher percentage that is widowed among immigrant householders (both
reflecting the higher mean age described earlier).
Immigrant householders have slightly higher mean years of schooling compared with
Canadian-born householders --13.4 versus 12.98 years of schooling. In comparing categories of
highest level of education attained, higher percentages of immigrant householders have achieved
a Bachelor’s degree (18.8 percent compared with 14 percent of Canadian-born householders) and
post-Bachelor’s degree or professional degrees (10.2 percent versus 4.9 percent).
There are three indicators for comparing labor force characteristics – labor force status,
self-employment, and broad occupational categories. A higher percentage of Canadian-born
householders are employed (72.4 percent) compared with 66.8 percent employed among
immigrant householders. The percent unemployed is similar at 3.2 or 3.3 percent. The gap in
percent employed is attributable to the higher percentage of immigrant householders who are not
in the labor force (29.9 percent) compared with 24.3 percent of Canadian-born householders who
are not in the labor force. Among those who are employed, slightly more immigrants are self-
employed (17 percent) compared with 14.3 percent of Canadian-born householders.
We grouped occupation of employed householders into three categories –
managerial/professional, intermediate skill clerical/sales/services, and semi- and low-skill
clerical/sales/services – to provide a general overview of occupational attainment. A higher
percentage of immigrant householders (33.6 percent compared with 30.6 percent of Canadian-
born householders) have managerial or professional jobs. Half of Canadian-born householders
are employed in occupations in the intermediate category compared with 43 percent of

10
immigrant householders. Lastly, more immigrant householders have low or semi-skilled jobs
(23.4 percent) compared with 19.4 percent of Canadian-born householders.
The last part of Table 3 compares home language of immigrant and non-immigrant
families. Not surprisingly, immigrant families are more likely to have a non-official language as
their home language, and show greater diversity in languages spoken at home. While English
and French account for over 96 percent of Canadian-born families’ home language, the most
often spoken home languages among immigrant families are, in rank order, English (47.3
percent), Other European language (16.4 percent), Chinese (11.4 percent), and South Asian
languages (8.4 percent).
DIVERSITY OF IMMIGRANT FAMILIES
In this section, we focus on immigrant families and examine 2006 census microdata to
highlight the diversity of immigrant families along several characteristics. We begin with place
of birth and ethnic origin of immigrant families, as reported for the householder (that is, the
primary household maintainer as previously described).
- Table 4 About Here -
The largest group of immigrant householders (over one-fourth) was born in Europe.
Adding the 8.5 percent who were born in the United Kingdom, 34.1 percent of immigrant
families trace their origins to Europe. South Asia (including India, Pakistan, Bangladesh, Sri
Lanka, and other countries in the Indian sub-continent) was the area of birth for 12.9 percent of
immigrant householders, followed by China (including Hong Kong) with 12.1 percent. Adding
the 5.2 percent from the Philippines and 8.0 percent from other East and Southeast Asia, 38.3
percent of immigrant families originated in Asia (excluding the Middle East and West Asia).

11
The next notable place of birth for immigrant families is Latin America and the Caribbean, with
11.4 percent, the Middle East/West Asia with 6.1 percent, and Africa with 5.7 percent.
The diverse geographical origins of immigrant families are also reflected in ethnic
origins. We show ethnic origins because place of birth and ethnic origins do not overlap
completely and ethnic origin is conceptually more indicative of ethnocultural diversity and
ancestry.6 If we look at the single ethnic origin groups in Table 4, we see that the most common
ethnic origins reported are, in order, Other European ethnic origin (22.9 percent), Chinese (15.6
percent), South Asian (14.2 percent), British (6.3 percent), Arab/West Asian (6.2 percent),
Caribbean/Black (5.7 percent), Filipino (4.2 percent), and Latin American (2.4 percent).
Lastly, Table 4 shows immigrant householders’ reported knowledge of Canada’s official
languages. The majority knows English (78 percent), another 3.8 percent know French, and 11.3
percent know both official languages. However, 6.9 percent do not know either English or
French.
Some of Canada’s immigrants have been in Canada for many decades while others are
relatively recent arrivals. Period of immigration and by implication, duration of residence are
important characteristics of immigrants as they are related to place of origin and integration
experiences. Table 5 compares immigrant householders by year of arrival and duration of
residence.
- Table 5 About Here –
The share of immigrant householders who immigrated before 1950 is less than 2 percent
and 8.8 percent for arrivals in the 1950s. The low percentages reflect the effects of mortality
(and other factors including return migration) on immigrants who had arrived four or five
6 Consider the following hypothetical immigrants born in Africa: an immigrant born in South Africa of English ethnic origin is more similar to an immigrant born in England of English ethnic origin than to another immigrant born in South Africa of Zulu ethnic origin, or an immigrant born in Uganda of South Asian ethnic origin.

12
decades ago. Most immigrant householders arrived either in the 1990s (27.6 percent) or from
2000 on (22 percent). The next set of numbers on duration of residence in Canada reflects the
distribution by year of arrival. Over 30 percent of immigrant householders have been in Canada
less than 10 years, and another 25.5 percent from 10 to 19 years. Taken together, well over half
of immigrant householders have been in Canada less than twenty years. The last line in Table 5
shows that almost three-fourths of immigrant householders are naturalized Canadian citizens.
We briefly describe other characteristics of immigrant families not shown in tables.
Immigrant families overwhelmingly reside in metropolitan areas (90.9 percent). Over half (56.2
percent) of immigrant families reside in Ontario, with another 18.3 percent in British Columbia,
and 13.3 percent in Quebec.
CHALLENGES
The descriptive analyses suggest that, for the most part, immigrant families do not
markedly differ from non-immigrant families. However, there are some differences that may
pose potential challenge for immigrant families. We identify three that could be particularly
challenging for immigrant families.
First, the 18.6 percent of immigrant families that are low income or poor is more than
double the percent of low-income Canadian-born families. Low family income has many
repercussions for family well-being, including housing quality, nutrition and health, and
resources to help children in schooling and other areas of development. Some studies show that
poverty is the single most important factor for a range of negative outcomes for children
(Hernandez et al. 2007). Second, the higher percent of immigrant householders who are in low
and semi-skilled occupations -- over 23 percent compared with 19.4 percent of Canadian-born
householders, which, while not a large gap, is of potential concern given the generally higher

13
educational attainment of immigrants. Working in lower skilled occupations is obviously related
to low income. Third, almost 7 percent of immigrant householders do not know either one of
Canada’s official languages. While this is not a large percentage, still, not knowing either
English or French can only represent problems when it comes to communication, interacting
with the community for services including health care, and in job searches if the immigrant is
looking for work.
In additional analysis, we focus on factors associated with low income among immigrant
families, given the central role of adequate income for overall family well-being.
Logistic Regression of Low-Income Immigrant Families
We estimate a model predicting low income for immigrant families using 2006 census
data. The outcome, low income, is a binary variable, coded 0 if not low income and 1 if low
income. We include the following variables in the model, based on previous research on factors
associated with low income among families and immigrant families (see for example, Lee 1994;
Picot et al. 2008; Seccombe 2000). We grouped many of these variables to reduce the number of
categories. While this may result in loss of some potentially interesting details, we decided that
brevity is preferred given the exploratory objectives of this paper. The reference category for
categorical variables is indicated in the table reporting results.
Age: Income often increases with age as individuals gain work experience and seniority
(therefore, a conventional human capital factor). However, after a certain age, income may
decrease, as earnings of older workers flatten or decrease with reduced hours of work or when
older individuals retire and leave the labor force.
Gender: Males are expected to have higher income because of persistent gender gaps in earnings
and other economic assets, although we do not know if this is the case among immigrants.
14
Marital Status: It is a well-documented research finding that married people (and perhaps
persons living common-law) are generally better off than others (Seccombe 2000). The
explanations are complex but usually refer to selectivity factors and perhaps two-earner families.
Other categories of marital status are separated or divorced; single; and widowed.
Education: This is a key human capital variable that usually affects income positively. We have
three categories of education: less than high school; high school or high school plus some
additional education; and Bachelor’s degree or Bachelor’s degree plus more.
Home Language: We include home language as a proxy for the degree of linguistic integration of
immigrant families and knowledge or proficiency of official languages. This is a binary variable,
0=English or French or both, and 1=some other language.
Citizenship: Immigrants who acquire citizenship may do for many reasons and we do not have
data to examine this. However, we consider immigrants who have become naturalized Canadian
citizens to be more integrated and possibly more successful (see for example Edmonston and
Lee’s forthcoming paper on homeownership), and to have been in Canada long enough to qualify
and apply for citizenship. Having Canadian citizenship may also help in employment and
therefore income. This is also binary variable.
Age-at-immigration: This variable has been shown to be quite important for immigrant
integration and achievement (Lee and Edmonston 2011; Myers et al 2009). Immigrants who
arrived at younger ages are more likely to achieve higher levels of education, income, and
occupation. There are five categories for age-at-immigration: 0-12 years, 13-19, 20-29, 30-49,
and 50 years and older.
Place of birth: Finally, we include place of birth as a proxy for many factors, including affinity
with Canadian institutions and society (for example, immigrants born in the U.S. can be expected

15
to have higher affinity than immigrants born in Afghanistan), language and cultural similarities,
ease of transferability of educational credentials and/or labor market experience, and other
factors. There are eleven categories for place of birth as shown in Table 6.
- Table 6 About Here -
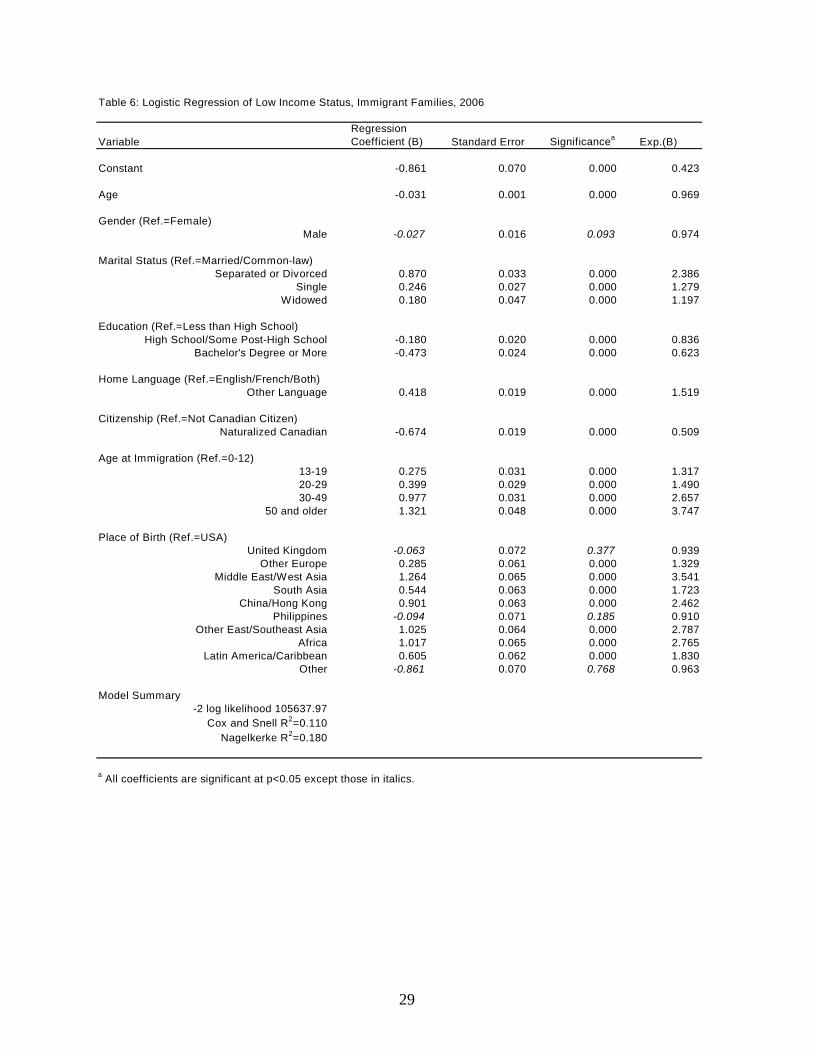
The results from the logistic regression are shown in Table 6. The model has an overall
82.3 percent predicted correctly, and a Cox and Snell R2 of 0.110. The last column in Table 6
shows the odds ratio computed by taking the exponential of the logistic regression coefficient (B)
for the variable, shown in the second column of the table.
Age has a negative effect on low-income status, meaning the odds of being poor are
reduced with increasing age: with each increase in age by a year, the odds of being in a low-
income immigrant family are reduced by 0.03 (1 minus 0.97).
Compared to the reference category of female, male immigrants are less likely to be in
low-income families. However, the gender difference is not statistically significant.
Home language has a large effect on low-income status. Compared to immigrant families
where the home language is one or both of Canada’s official languages, immigrant families with
home languages other than the official languages are 1.5 times more likely to be low-income.
Whether the immigrant family’s householder is a naturalized citizen has similarly large
effects: naturalized citizenship reduces the odds of being low-income by half.
Age at immigration has noticeably large effects on low-income status. Compared to the
reference category (immigrants who arrived as young children aged 0 to 12), the odds of being in
a low-income immigrant family increases with age at immigration – by 1.3 times for immigrants
who arrived as teenagers, by 1.5 times for immigrants who arrived in their 20s, by 2.7 times for

16
those who arrived as adults between 30 and 49, and by 3.7 times for immigrants who arrived
aged 50 and older.
The human capital characteristic of education shows expected and large effects.
Compared with immigrants with less than high school education, immigrants with high school or
high school plus some additional education have odds that are lower by 0.16 to be in a low-
income family, and the odds of immigrants with a Bachelor’s degree or Bachelor’s degree plus
additional education being in a low-income family are lower by 0.38.
The effects of marital status are also as expected. Compared with the reference category
(married or common-law couple), immigrants who are separated or divorced are 2.4 times more
likely to be in a low-income family; single immigrants are 1.3 times more likely to be in low-
income family; and widowed immigrants are 1.2 times more likely to be in low-income family.
Place of birth reveals interesting and, for some groups, substantial effects. Some
differences are not statistically significant. Compared to the reference category (place of birth is
the United States), immigrants born in the United Kingdom, the Philippines, and “other”
countries (mainly Oceania) are slightly less likely to be in a low-income family, but the
differences are small and not statistically significant. The largest effect for place of birth is for
immigrants born in the Middle East or West Asia, who are 3.5 times more likely than immigrants
born in the U.S. to be in a low-income family. Immigrants born in “Other East/Southeast Asia”
(including Vietnam and Cambodia) and Africa are about 2.8 times more likely to be in a low-
income family. Immigrants born in China also face higher likelihood of being in low-income
families, being 2.5 times more likely than U.S.-born immigrants.
Other groups of immigrants have lower likelihood of being in low-income families
compared to immigrants born in the above countries, but are still at greater risk, compared with

17
immigrants born in the U.S. Immigrants born in Latin America or the Caribbean are 1.8 times
more likely to be in a low-income family, immigrants born in South Asia are 1.7 times more
likely to be in a low-income family, and immigrants born in “Other European” countries are 1.3
times more likely to be in a low-income family.
DISCUSSION AND CONCLUSION
This paper provides an exploratory descriptive analysis of immigrant families in Canada. In
spite of the important role of immigration in Canada’s history and recent population growth,
information and research on Canada’s immigrant families is relatively sparse. This paper
contributes new information about immigrant families, one of the fastest growing types of
families in Canada. We document recent trends that show a steady increase in the number and
proportion of immigrant families in Canada, compare immigrant and non-immigrant families on
several key sociodemographic characteristics, provide a more detailed examination of immigrant
families to highlight the diversity of these families, identify some areas of concern and challenge
for immigrant families, and conclude with a further study of one of these areas of concern – the
higher incidence of low income among immigrant families.
For the most part, immigrant families do not differ from non-immigrant families. Most
consist of a couple (married or living common-law) with or without children in the household.
There are fewer lone parent immigrant families compared with non-immigrant families,
suggesting that divorce or non-marital family formation is less likely and acceptable among
immigrants. However, immigrant family households are more likely to have multiple families.
This latter difference means that immigrant family households tend to be larger, with more
people sharing a housing unit. This could reflect immigrants’ preferences for living together
with other relatives (which could, in turn, represent stronger familial ties and support) or a

18
strategy to reduce housing costs. One potential downside could be greater risk of overcrowding
and lower housing quality.
Other differences include the concentration of immigrant families in metropolitan areas
(over 90 percent of immigrant families live in metropolitan areas) and in the provinces of
Ontario (with over 56 percent of immigrant families), British Columbia (18 percent), and Quebec
(13 percent). It is well known that immigrants are attracted to Canada’s largest cities (Toronto,
Vancouver, and Montreal) for many reasons, including job opportunities, diversity of cities,
existing social networks, greater amenities, and so forth, thus the metropolitan and geographical
concentration is not surprising. Immigrant families add to the diversity and appeal of these areas
for new immigrants, and we can expect that these three cities and provinces will continue to be
the main destinations and place of residence for future immigrant families.
Given the geographical and ethnocultural diversity of immigrants, it is not surprising that
the ethnic origins and home language of immigrant families differ from that of non-immigrant
families. Immigrant families speak a variety of languages at home, including other European
languages, Chinese, and South Asian languages, although almost half speak English as their
home language. Linguistic diversity can be a bonus or a handicap. On the positive side, facility
in more than one language is always good, facilitating communication with other speakers of the
language, and more importantly, communication across generations within immigrant families,
where immigrant parents or grandparents may not speak or are not proficient in Canada’s official
languages. On the negative side, maintaining a home language that is different from English or
French may hamper immigrants or their children’s integration into Canadian society.
On several socioeconomic indicators, immigrant families do not compare favorably with
non-immigrant families. For example, immigrant household mean incomes are lower by almost

19
$6,000, the percentage of families that are considered low income is twice as high among
immigrant families, a higher percentage are working in low and semi-skilled jobs, and a slightly
lower percentage of immigrant families own their homes. These differences represent challenges
for immigrant families as they reflect possible poorer opportunities and outcomes in the labor
market and socioeconomic resources. If immigrant families are more likely to struggle
socioeconomically, then researchers need to study why and identify potential ways to improve
the chances for better outcomes. The less favorable socioeconomic situation of immigrant
families also contains implications for the welfare of children in such families.
However, immigrant householders have educational attainment that compare favorably
with their non-immigrant counterparts: for example, almost 30 percent have a Bachelor’s degree
or higher education, compared with about 20 percent among non-immigrants. The apparent
paradox of highly educated immigrant householders and poorer socioeconomic outcomes has
been observed and reported by others (Picot et al. 2008). Possible reasons for the inconsistency
include lack of transferability of immigrants’ educational credentials to the Canadian labor
market, lack of Canadian work experience, and employers’ preferences.
Immigrant families are not a homogenous category and are diverse along many
characteristics based on the householder, including place of birth, ethnic origins, period of arrival
in Canada and duration of residence in Canada. Canada has been appropriately described as a
nation of continuous immigration. However, the origins of immigrants have changed remarkably
in recent decades from a dominance of migration flows from the British Isles, and other parts of
Europe, to Asia (dominated by China and South Asia). While public attention has focused on the
growing immigrant population from Asia and other non-European countries, it bears reminding
that over 34 percent of immigrants originate from the United Kingdom and Europe, compared

20
with 12 percent from China and 13 percent from South Asia. As mortality reduces the older
cohorts of immigrants, the percent and social importance of more recent immigrants from Asia
and Latin America and their families will increase. Immigrant families can be expected to
become even more diverse than we have reported in this paper.
Finally, from a more detailed analysis of the risk of low income, one of the areas of
concern or challenge that we had identified for immigrant families, we are able to examine
several factors that can be called risk factors for low income among immigrant families. One
short hand way to interpret the results is that the immigrant family at greatest risk of being poor
is one where the householder immigrated at age 50 or older, has less than a high school
education, is divorced or separated, is not a naturalized citizen, speaks a home language that is
neither English nor French, and is born in the Middle East or West Asia. The effect of education
confirms the importance of human capital in socioeconomic wellbeing. Divorce and separation
are known to be associated with reduced economic resources for families as the income from a
partner are no longer available.
The remaining factors are unique to immigrants. First is the important effect of age at
immigration, shown by previous research to be a key factor in individual immigrant outcomes,
and now we also show that it is highly important for immigrant families’ economic wellbeing.
Younger the age at immigration implies more extensive Canadian experience with education,
social networks, institutions and labor market, which can help immigrants and their families.
Second, not having Canadian citizenship could directly limit economic opportunities but
can also reflect shorter duration of residence and lack of experience in Canada that can also limit
economic options. Third, we had previously discussed the potential positive and negative role of

21
a non-official language home language. The multivariate analysis of low income demonstrates
that a non-official language home language increases the risk of being low income or poor.
Finally, place of birth matters a lot for some immigrants and their families. The
substantially increased risk of being poor associated with place of birth in the Middle East/West
Asia, other East/Southeast Asia, Africa, and China reinforces the need to understand what these
place of birth effects are measuring. Since the effects of other factors such as age and education
are accounted for in the model, the large place of birth effects require further research to try and
explain them. As more of Canada’s immigrant families trace their origins to these countries, the
heightened risk of low income or poverty for growing numbers and percentages of immigrant
families can only be of great research and public concern.
While we have provided a descriptive overview of immigrant families in Canada and
identified some issues that are of particular concern for immigrant families, much remains to be
done. We hope this paper serves as a starting point for needed research on a wide range of topics
about immigrant families in Canada.

22
REFERENCES
Canadian Social Trends. Census Snapshot – Immigration in Canada: A Portrait of the Foreign
Born Population, 2006 Census. 11-008-XWE no. 85. 20008001. Catalogue no. 97-557.
Accessed online, www.statcan.gc.ca, February 18, 2012.
Edmonston, B. and S.M. Lee. Forthcoming. Immigrants’ transition to homeownership, 1991 to
2006. Canadian Studies in Population.
Haan, M. 2005. The decline of the immigrant homeownership advantage: life-cycle, declining
fortunes, and changing housing careers in Montreal, Toronto, and Vancouver. Urban Studies,
42: 2191-2212.
Hernandez, D.J., N.A. Denton, and S.E. Macartney. 2007. Family circumstance of children in
immigrant families. Pp. 9-29 in Immigrant Families in Contemporary Society, edited by J.E.
Lansford, K. Deater-Deckard, and M.H. Bornstein. New York: The Guildford Press.
Lee, S.M. 1994. Poverty and the U.S. Asian population. Social Science Quarterly, 75:541-559.
Lee, S.M. and M. Boyd. 2008. Marrying out: comparing the marital and social integration of
Asians in the U.S. and Canada. Social Science Research, 37:311-329.
Lee, S.M. and B. Edmonston. 2005. New Marriages, New Families: U.S. Racial and Hispanic
Intermarriage. Population Bulletin, vol. 60, no. 2. Washington, D.C.: Population Reference
Bureau.
Lee, S.M. and B. Edmonston. 2011. Age-at-arrival’s effects on Asian immigrants’
socioeconomic outcomes in Canada and the U.S. International Migration Review, 45(3): 527-
561.
Picot, G., F. Hou, and S. Coulombe. 2008. Poverty dynamics among recent immigrants to
Canada. International Migration Review, 42(2): 393-424.

23
Qian, Z., S.L. Blair, and S.D. Ruf. 2001. Asian American interracial and interethnic marriages:
differences by education and nativity. International Migration Review, 35(2): 557-586.
Seccombe, K. 2000. Families in poverty in the 1990s: trends, causes, consequences, and lessons
learned. Journal of Marriage and the Family, 62(4): 1094-1113.
Statistics Canada. 2010a. Projections of the Diversity of the Canadian Population 2006 to 2031.
Ottawa: Minister of Industry, Catalogue no. 91-551-X.
Statistics Canada. 2010b. Low Income Lines, 2008-2009. Income Research Paper Series,
Catalogue No. 75F0002M, no. 005. Accessed online, www.statcan.gc.ca, March 11, 2012.
Statistics Canada. 2005. Proportion Foreign Born Population by Province and Territory, 1991 to
2001 Censuses. Accessed online, www.statcan.gc.ca, February 18, 2012.
Tysska, V. 2007. Immigrant families in sociology. Pp. 83-99 in Immigrant Families in
Contemporary Society, edited by J.E. Lansford, K. Deater-Deckard, and M.H. Bornstein. New
York: The Guildford Press.
Wong, B. 2007. Immigration, globalization, and the Chinese American family. Pp. 212-228 in
Immigrant Families in Contemporary Society, edited by J.E. Lansford, K. Deater-Deckard, and
M.H. Bornstein. New York: The Guildford Press.

24
Table 1: Percent Foreign-Born Population and Immigrant Families, 1991 to 2006
Year
Percent Foreign-
BornTotal
Population (N)
Percent Immigrant
FamiliesTotal Family
Households (N)
1991 16.1 27,296,856 21.7 218,6821996 17.4 28,846,761 22.7 214,2982001 18.4 30,007,094 23.7 220,6372006 19.8 31,612,897 24.0 229,471
Source: Statistics Canada for population numbers and percent foreign-born.Authors' analysis of microdata from the 1991, 1996, 2001, and 2006 censuses fordata on immigrant families and family households. See text for definition of immigrant family.

25
Table 2: Family Household Type for Canadian-born and Immigrant Families, 1991 to 2006 (in percent)
Family Household TypeCanadian-born Immigrant
Canadian-born Immigrant
Canadian-born Immigrant
Canadian-born Immigrant
1 family, couple 86.5 84.8 84.8 81.9 83.7 80.3 83.5 81.11 family, lone parent 12.6 11.4 14.1 13.2 14.7 14.0 15.0 13.2
Multiple family 0.9 3.8 1.1 4.9 1.5 5.6 1.6 5.7
Total number of families 171,183 47,499 165,743 48,555 168,264 52,373 174,451 55,020
2006
Source: Authors' analysis of 1991, 1996, 2001, and 2006 census microdata.
1991 1996 2001

26
Table 3: Selected Characteristics of Canadian-born and Immigrant Families, 2006
Characteristic Canadian-born Immigrant
Mean Household Size 3.0 3.4
Mean Age 48.8 52.1
Percent Male 67.4 74.6
Mean Total Family Income ($) 80,229 74,386
Percent Low Income Status 9.2 18.6
Percent Homeowner 79.0 74.8
Marital Status (%)Married/Living Common-Law 84.4 85.8
Separated/Divorced 7.7 7.2Widowed 2.7 3.8
Single 5.1 3.2
Mean Years of Schooling 12.8 13.4
Highest Education Attained (%)Less than High School 19.2 18.2
High School 22.9 18.9Post-High School, Less than University 39.1 34.0
Bachelor's Degree 14.0 18.8Post-Bachelor and Professional 4.9 10.2
Labor Force Status (%)Employed 72.4 66.8
Unemployed 3.2 3.3Not in Labor Force 24.3 29.9
Percent Self-employed 14.3 17.0
Occupation (%)Manager/Professional 30.6 33.6
Intermediate Clerical, Sales, Services 50.0 43.0Semi-and low skilled Manual/Sales/Services 19.4 23.4
Home Language (%)English 71.1 47.3French 25.5 4.0
English and French 2.1 0.6Other European 0.5 16.4
Aboriginal 0.5 0.0Arabic/West Asian Language 0.0 2.0
Chinese 0.1 11.4Filipino/Tagalog 0.0 2.3
Other East/Southeast Asian Language 0.0 2.2South Asian Language 0.1 8.4
Other 0.1 5.4
Source: Authors' analysis of 2006 census microdata.

Table 4: Place of Birth, Ethnic Origins, and Knowledge of Official Language, 2006 (in percent)
Place of Birth United States 3.9
United Kingdom 8.5Other Europe 25.6
Middle East/West Asia 6.1South Asia 12.9
China 12.1Philipines 5.2
Other East/Southeast Asia 8.0Africa 5.7
Latin America/Caribbean 11.4Other 0.6
Ethnic OriginCanadian 0.4
British 6.3French 0.8
Other European 22.9Aboriginal 0.0
Arab/West Asian 6.2South Asian 14.2
Chinese 15.6Filipino 4.2Korean 1.8
Vietnamese 1.3Other East/Southeast Asian 1.0
Latin American 2.4Caribbean/Black/African 5.7
Other Single Origin 0.3Multiple Origins 17.1
Knowledge of Official LanguagesEnglish 78.0French 3.8
Both English and French 11.3Neither English nor French 6.9
Source: As for Table 3.

28
Table 5: Year of Immigration and Citizenship of Immigrant Householders, 2006
PercentYear of Immigration
Before 1950 1.81950-59 8.81960-69 10.91970-79 15.11980-89 13.71990-99 27.6
2000 and later 22.0
Duration of Residence in Canada0-9 years 30.1
10-19 years 25.520-29 years 14.830-39 years 15.4
40 or more years 14.2
Naturalized Canadian Citizen 74.8
Source: As for Table 4.
29
Table 6: Logistic Regression of Low Income Status, Immigrant Families, 2006
VariableRegression Coefficient (B) Standard Error Significancea Exp.(B)
Constant -0.861 0.070 0.000 0.423
Age -0.031 0.001 0.000 0.969
Gender (Ref.=Female)Male -0.027 0.016 0.093 0.974
Marital Status (Ref.=Married/Common-law)Separated or Divorced 0.870 0.033 0.000 2.386
Single 0.246 0.027 0.000 1.279Widowed 0.180 0.047 0.000 1.197
Education (Ref.=Less than High School)High School/Some Post-High School -0.180 0.020 0.000 0.836
Bachelor's Degree or More -0.473 0.024 0.000 0.623
Home Language (Ref.=English/French/Both)Other Language 0.418 0.019 0.000 1.519
Citizenship (Ref.=Not Canadian Citizen)Naturalized Canadian -0.674 0.019 0.000 0.509
Age at Immigration (Ref.=0-12)13-19 0.275 0.031 0.000 1.31720-29 0.399 0.029 0.000 1.49030-49 0.977 0.031 0.000 2.657
50 and older 1.321 0.048 0.000 3.747
Place of Birth (Ref.=USA)United Kingdom -0.063 0.072 0.377 0.939
Other Europe 0.285 0.061 0.000 1.329Middle East/West Asia 1.264 0.065 0.000 3.541
South Asia 0.544 0.063 0.000 1.723China/Hong Kong 0.901 0.063 0.000 2.462
Philippines -0.094 0.071 0.185 0.910Other East/Southeast Asia 1.025 0.064 0.000 2.787
Africa 1.017 0.065 0.000 2.765Latin America/Caribbean 0.605 0.062 0.000 1.830
Other -0.861 0.070 0.768 0.963
Model Summary-2 log likelihood 105637.97
Cox and Snell R2=0.110Nagelkerke R2=0.180
a All coefficients are significant at p<0.05 except those in italics.