Embed Size (px)
Citation preview

CANADArsquoS NATIONAL DEFORESTATION MONITORING SYSTEM SYSTEM DESCRIPTION
Andrew Dyk Don Leckie Sally Tinis and Stephanie Ortlepp
CANADIAN FOREST SERVICEPACIFIC FORESTRY CENTRE
INFORMATION REPORT BC-X-439
The Pacific Forestry Centre Victoria British Columbia
The Pacific Forestry Centre of the Canadian Forest Service undertakes research as part of a national network system responding to the needs of various forest resource managers The results of this research are distributed in the form of scientific and technical reports and other publications
Additional information on Natural Resources Canada the Canadian Forest Service and Pacific Forestry Centre research and publications is also available online at httpcfsnrcangccapublications where you can download this document
Canadarsquos National Deforestation Monitoring System System Description
Andrew Dyk Don Leckie Sally Tinis and Stephanie Ortlepp
Deforestation Monitoring Group
Digital Remote Sensing
Natural Resources Canada Canadian Forest Service Pacific Forestry Centre
Information Report BC-X-439
2015
Natural Resources Canada Canadian Forest Service Pacific Forestry Centre 506 West Burnside Road Victoria British Columbia V8Z 1M5 Tel 250-363-0600
httpnrcangccaforestsresearch-centrespfc13489
Cover photos All CFS
ISSN ISBN 978-0-660-01978-9Cat no Fo143-2439E-PDFPrinted in Canada
Library and Archives Canada Cataloguing in Publication
Dyk Andrew 1964- Canadarsquos National Deforestation Monitoring System system description Andrew Dyk Don Leckie Sally Tinis and Stephanie Ortlepp
(Information report BC-X-439)Electronic monograph in PDF formatAvailable also on the Internet Includes abstract in French
1 Deforestation--Canada 2 Forest monitoring--Canada 3 Forest management--Canada 4 Forest conservation--Canada I Leckie Donald Gordon 1953- II Tinis Sally 1967- III Ortlepp Stephanie 1976- IV Pacific Forestry Centre V Title VI Series Information report (Pacific Forestry Centre) BC-X-439
SD4183 C3D95 2015 333750971 C2015-980019-6
copy Her Majesty the Queen in Right of Canada as represented by the Minister of Natural Resources 2015
Mention in this report of specific commercial products or services does not constitute endorsement of such by the Canadian Forest Service or the Government of Canada
Information contained in this publication or product may be reproduced in part or in whole and by any means for personal or public non-commercial purposes without charge or further permission unless otherwise specified
You are asked to
bull Exercise due diligence in ensuring the accuracy of the materials reproduced
bull Indicate both the complete title of the materials reproduced as well as the author organization and
bull indicate that the reproduction is a copy of an official work that is published by Natural Resources Canada (NRCan) and that the reproduction has not been produced in affiliation with or with the endorsement of NRCan
Commercial reproduction and distribution is prohibited except with written permission from NRCan For more information contact NRCan at copyrightdroitdauteurnrcan-rncangcca
ii
Contents
List of Acronyms iv
Abstract v
1 Introduction 1
2 System Requirements and Definitions 1
21 Definitions 1
211 Forest 1
212 Deforestation 2
213 Land Use Categories 2
3 System Design 2
31 Where Deforestation Has Occurred 3
32 When Deforestation Has Occurred 4
33 Why Deforestation Has Occurred 4
4 Implementation 6
41 Stratification and Sampling 6
42 Data Sources and Information Collection 10
421 Core Image Data 10
422 Additional Image Data 10
423 Ancillary Spatial Data 10
424 Records Data 11
43 Mapping 11
431 Data Handling 11
432 Project Packages 12
433 Interpretation 12
44 Deforestation Estimation 13
441 GIS processing 13
442 Large Events and Records Data 15
443 Expert Intervention 15
444 Database Processing 15
5 Quality Control 18
51 Quality Control at the Mapping Stage 18
52 Quality Control at the Data Processing Stage 20
53 Quality Control at the Output Analysis Stage 20
54 External Quality Control 20
6 Conclusions 20
7 References 21
Appendix 1 Pretype Forest Conditions 23
Appendix 2 Post-class Modifiers by Industrial Category25
Appendix 3 Deforestation Strata Units and Reconciliation Unit Inclusion 29
iii
List of Figures
Figure 1 Deforestation reconciliation units and reporting zones in Canada 3
Figure 2 Deforestation strata units and sampling framework 6
Figure 3 Sampling intensity in two different deforestation strata 7
Figure 4 Deforestation strata sampling rates for mapping period P1 8
Figure 5 Deforestation strata sampling rates for mapping period P2 9
Figure 6 Deforestation strata sampling rates for mapping period P3 9
Figure 7 Examples of various Landsat satellite band combinations and change enhancements that may be used in the mapping process 11
Figure 8 Examples of supplemental data use path and oblique aerial photograph from a deforestation field verification campaign 12
Figure 9 Simplified deforestation GIS processing flow 14
Figure 10 Schematic of the deforestation database process used to produce estimates 16
Figure 11 Example deforestation trend produced using data from three mapping periods 17
Figure 12 Example of a deforestation area trend from sample mapping and large events data 18
Figure 13 The deforestation mapping and quality control process flow 19
List of Tables
Table 1 Deforestation post-land use classes 4
Table 2 Deforestation post class aggregation 5
Table A11 Pre-change forest type descriptors 23
Table A12 Pre-change forest density descriptors 23
Table A13 Pre-change forest maturity descriptors 23
Table A14 Valid combinations of pretype attributes 24
Table A21 Post class and post-class modifier codes and short descriptions grouped by industrial categorysector 25
Table A22 Aggregation of deforestation mapping classes to good practice guidance and industrial categories 28
Table A31 Area of strata units and percent of strata unit area that is in each reconciliation unit 29
List of Acronyms
CBM-CFS3 Carbon Budget Model of the Canadian Forest Service version 3
GHG greenhouse gas
GPG Good Practice Guidance
IPCC Intergovernmental Panel on Climate Change
NDMS National Deforestation Monitoring System
RU Reconciliation Unit
RZ Reporting Zone
UNFCCC United Nations Framework Convention on Climate Change
iv
v
Abstract
Deforestation is the direct human-induced conversion of forested land to non-forested land use Canadarsquos National Deforestation Monitoring System (NDMS) was designed and implemented to provide information needed by Canada to meet its obligation under the United Nations Framework Convention on Climate Change (UNFCCC) to report the areas affected annually by deforestation It also provides important information for the public government policy makers and scientists To provide information about the amount of deforestation and why where and when it occurred in Canada the NDMS uses deforestation mapped on a system of sample areas The mapping is based on visual interpretation of satellite imagery supported by available ancillary information such as high resolution imagery forest inventory and industrial databases and informed by records-based information and expert knowledge Accurate detection and map-ping of deforestation events involves manual interpretation of satellite remote sensing imagery by specialized analysts A key factor in the mapping is to distinguish deforestation from other forest cover losses that occur in Canada This report describes the methods used to monitor and report on deforestation including stratification and sampling data sources mapping and interpretation estimation procedures and quality control through all stages of the process The NDMS was designed to make use of all available lines of evidence and be flexible to accommodate variable resourcing levels This system has been producing national deforestation monitoring results annually since 2006 The flexibility of the NDMSrsquos design makes it possible to adapt to future changes in data and resource availability and positions the program well for sustained operational delivery into the future
Keywords deforestation National Deforestation Monitoring System NDMS mapping and interpretation land use change data sources quality control
Reacutesumeacute
Le deacuteboisement est la conversion anthropique directe de terres forestiegraveres en terres non forestiegraveres Le Systegraveme national de surveillance du deacuteboisement (SNSD) du Canada a eacuteteacute conccedilu et mis en œuvre afin de fournir lrsquoinformation dont le Canada a besoin pour srsquoacquitter de son obligation aux termes de la Convention-cadre des Nations Unies sur les changements climatiques (CCNUCC) de produire annuellement un rapport sur les reacutegions toucheacutees par le deacuteboisement Il fournit eacutegale-ment drsquoimportants renseignements au public aux responsables des politiques gouvernementales et aux scientifiques Afin drsquooffrir de lrsquoinformation sur lrsquoampleur du deacuteboisement ainsi que pour expliquer pourquoi ougrave et quand il a eu lieu au Canada le SNSD effectue une cartographie du deacuteboisement en fonction drsquoun reacuteseau de zones drsquoeacutechantillonnage La cartographie repose sur une interpreacutetation visuelle de lrsquoimagerie satellite appuyeacutee par les donneacutees accessoires disponibles mdash notamment lrsquoimagerie agrave haute reacutesolution lrsquoinventaire forestier et les bases de donneacutees fournies par lrsquoindustrie mdash et eacuteclaireacutee par lrsquoinformation provenant de dossiers existants et des connaissances des experts Lrsquointerpreacutetation manuelle des images de teacuteleacutedeacutetection par satellite par des analystes speacutecialiseacutes est essentielle pour assurer lrsquoexactitude de la deacutetection et de la cartographie des activiteacutes de deacuteboisement Pour la cartographie lrsquoun des facteurs cleacutes consiste agrave faire la distinc-tion entre le deacuteboisement et toute autre perte de couvert forestier qui se produit au Canada Dans le preacutesent rapport nous deacutecrivons les meacutethodes utiliseacutees pour surveiller le deacuteboisement et en faire un compte rendu y compris la stratification et lrsquoeacutechantillonnage les sources de donneacutees la cartographie et lrsquointerpreacutetation les proceacutedures drsquoestimation et le controcircle de la qualiteacute agrave toutes les eacutetapes du processus Le SNSD a eacuteteacute conccedilu pour tirer parti de toutes les sources de donneacutees agrave sa disposi-tion et pour ecirctre suffisamment souple pour faire usage de ressources dont les niveaux sont variables Ce systegraveme a permis de produire les reacutesultats nationaux de la surveillance du deacuteboisement tous les ans depuis 2006 La souplesse de la concep-tion du SNSD permet de srsquoadapter aux futurs changements dans la disponibiliteacute des donneacutees et des ressources et place le programme dans une bonne position pour assurer une prestation opeacuterationnelle soutenue dans les anneacutees agrave venir
Mots-cleacutes deacuteboisement Systegraveme national de surveillance du deacuteboisement SNSD cartographie et interpreacutetation change-ment drsquoaffectation des terres sources de donneacutees controcircle de la qualiteacute
vi
Canadarsquos National Deforestation Monitoring System System DescriptionInformation Report BC-X-439
1
1 Introduction Forest cover in Canada is estimated to be 35 million km2 Canadarsquos forests have long been managed to provide goods and services valued by society This management has included the temporary clearing for forest products and sometimes the permanent clearing of land for cultiva-tion settlement or other uses Deforestation is defined as ldquothe direct human-induced conversion of forested land to non-forested landrdquo (United Nations Framework Convention on Climate Change 2002)
Knowing the amount of deforestation and where when and why it occurs is important for several reasons Forests around the world are coming under increasing pressure as human populations grow and the footprint of human civili-zation expands This pressure is relatively modest in Canada but nevertheless must be taken into consideration
The need to rigorously monitor and report on deforesta-tion in Canada increased when Canada became party to the United Nations Framework Convention on Climate Change (UNFCCC) Deforestation releases carbon stored in forest vegetation as CO2 and other greenhouse gases (GHG) and is a globally significant source of greenhouse gas emissions especially in the tropics (Pan et al 2011 Le Queacutereacute et al 2014) The UNFCCC obliges countries to report their emissions on an annual basis The Montreal Process an international agreement on criteria and indicators for conservation and sustainability of forests also highlights the maintenance of forest area as an important criterion of sustainable forest management (Montreal Process 2009)
The Canadian Forest Service is the national and interna-tional voice for the Canadian forest sector The organiza-tion provides science and policy expertise and advice on national forest sector issues working in close collaboration with the provinces and territories As a part of this role the Canadian Forest Service develops information and knowledge of Canadarsquos forest resources Thus in 2000 work began on the design of a National Deforestation Monitor-ing System (NDMS) with pilot projects starting in 2002 At the same time a new plot-based National Forest Inven-tory (Gillis et al 2005) was being implemented It uses a systematic grid of sample cells and an approach similar to this was desirable for the NDMS The first national defores-tation monitoring results were produced in 2005 and the NDMS has been producing updated results on an annual basis ever since These results are published annually in Canadarsquos national greenhouse gas inventory reports to the UNFCCC (Environment Canada 2006 2014) are summa-rized in Canadarsquos State of the Forest Reports and have also contributed to reports published in the scientific literature (eg Masek et al 2011 Kurz et al 2013)
Although the NDMS is used to conduct Canadarsquos estima-tion process and maintain the national deforestation data-base other national and provincial-level initiatives have an interest in deforestation estimates (eg the National Forest Inventory the Canadian Forest Service Carbon Accounting Team Agriculture and Agri-Food Canada and Environment Canada) The NDMS has close links with these programs
This report provides an overview and description of the NDMS The system is described as it has been imple-mented for calculations of deforestation up to the annual report of 2015 The report also includes the original system requirements the overall system design and details of the system implementation
2 System Requirements and DefinitionsThe NDMS exists to serve information needs beyond national greenhouse gas inventory reporting but the strict reporting requirements of the UNFCCC guided the systemrsquos design and implementation The UNFCCC require-ments are set by good practice guidance (GPG) provided by the Intergovernmental Panel on Climate Change (IPCC) (Intergovernmental Panel on Climate Change 2003) which helps countries meet forest monitoring and reporting chal-lenges presented by the UNFCCC
21 Definitions
Several basic terms were given precise definitions fol-lowing the general guidelines provided by the UNFCCC including ldquoforestrdquo ldquodeforestationrdquo and ldquoland use categoriesrdquo
211 Forest
Forest is defined for the purposes of national monitoring in Canada as a minimum area of land of 1 ha with tree crown cover of more than 25 and with trees having the potential to reach a minimum height of 5 m at maturity in situ Young natural stands and all plantations that have yet to reach a crown density of 25 or tree height of 5 m are included as are areas that normally form part of the forest area which are temporarily un-stocked as a result of human intervention such as harvesting or natural causes but that are expected to revert to forest (United Nations Framework Convention on Climate Change 2002 Environment Canada 2006)
The above definition was adopted by Canada for UNFCCC reporting purposes in 2003 working within the parameters agreed to in the Marrakesh Accords (UNFCCC Decision 11CP7) This definition is different from that used by the Food and Agriculture Organization of the United Nations ldquoLand spanning more than 05 hectares with trees higher than 5 meters and a canopy cover of more than 10 per cent
Canadian Forest Service | Pacific Forestry Centre | nrcangccaforestsresearch-centrespfc134892
or trees able to reach these thresholds in situ It does not include land that is predominantly under agricultural or urban land userdquo (Food and Agriculture Organization 2001) The density parameter is the most important difference and Canada reports areas with 10ndash25 tree cover as ldquoother wooded landrdquo The difference is most relevant in Canadarsquos northern forest
212 Deforestation
Deforestation is defined by the UNFCCC as ldquothe direct human-induced conversion of forested land to non-forested landrdquo (United Nations Framework Convention on Climate Change 2002) The term ldquodeforestationrdquo is some-times used elsewhere to refer more broadly to forest cover loss whether temporary or permanent human-induced or natural The NDMS tracks direct human-induced forest land use change It provides clarity that is useful for policy analysis (eg Lempriegravere et al 2013) by identifying perma-nent conversion of forest land and distinguishing it from temporary forest cover loss related to forest management or natural forest cover dynamics such as wildfire or insect damage (Kurz 2010) Thus temporary change in land cover such as tree harvesting is not classified as deforestation Non-anthropogenic land cover changes such as naturally occurring landslides are also not considered deforesta-tion as these events are not caused by humans they are relatively rare in any case
Detailed specifications regarding shape size and configu-ration of forest and deforestation events used for deforesta-tion mapping are found in the Deforestation Interpretation Guide (Leckie et al 2012) For linear deforestation events (eg roads and right-of-ways) a minimum cleared width of 20 m is used Therefore narrow linear disturbances are not reported by the NDMS Also loss of areas having sparse tree cover is not reported because of the defined require-ment of 25 tree crown cover
213 Land Use Categories
The UNFCCC employs six land use categories defined under the IPCCrsquos good practice guidance (Intergovernmen-tal Panel on Climate Change 2003) to help report on and understand the dynamics of land use land use change and carbon emissions
1 forest land
2 cropland
3 grassland
4 wetlands
5 settlements
6 other land
Although more detailed information on land transitions is needed for other applications the NDMS must at a mini-mum be able to provide information on land use transi-tions from forest to the other five categories
3 System DesignThe NDMS uses a sampling approach with mapping and detection from satellite imagery informed by records-based information and expert knowledge to provide information about the amount of deforestation and why where and when it occurred in Canada Land use changes are interpreted manually by expert interpreters who use all available evidence to support their interpretation This design was adopted to provide the most detailed possible estimates of deforestation rates through time given avail-able resources
A full-area annual detection and mapping of all deforesta-tion events in Canada is neither practical nor necessary It is not practical because the task of finding on the order of 500 km2 of deforestation every year in a country with 35 million km2 of forest and up to 10 000 km2 of harvest per year would be prohibitively expensive and manual interpretation is needed to reliably distinguish deforesta-tion events from non-permanent forest cover change such as harvest Spatial and temporal sampling strategies can be used to provide the necessary information Practical implementation considerations associated with sampling were recognized early and factored into the NDMS
In addition to the amount of deforestation the NDMS was designed to provide three types of information
1 where deforestation occurred (spatial location shape and topology)
2 when deforestation occurred (the year or years during which forest clearing occurred) and
3 why deforestation occurred (the classes of post-deforestation land use)
It also provides information on the type of forest being re-moved The NDMS maintains a high level of detail in order to make its data as widely useful as possible
Canadarsquos National Deforestation Monitoring System System DescriptionInformation Report BC-X-439
3
31 Where Deforestation Has Occurred
The NDMS was designed to produce national and sub-national outputs Sub-national reporting units were cre-ated in collaboration with scientists involved in the design and implementation of Canadarsquos National Forest Carbon Monitoring Accounting and Reporting System (Kurz and Apps 2006) the Canadian Agricultural Greenhouse Gas Monitoring Accounting and Reporting System team of Agriculture and Agri-Food Canada and Canadarsquos national greenhouse gas inventory reporting system (Environment Canada 2006) This allows NDMS outputs to be integrated seamlessly by all of these systems
Deforestation mapping is done within sample cells The mapping data from all sample cells are compiled in an ArcGIS database and then input into an estimation process that produces data at the scale of reconciliation units and
reporting zones (see Figure 1) The reconciliation units are common areas that are used by the teams listed above to summarize information Environment Canada reports greenhouse gas emissions and removals in reporting zones The reporting zone boundaries follow the bound-aries of the Terrestrial Ecozones of Canada (Ecological Stratification Working Group 1996) with some additional stratification to distinguish eastern and western portions of the largest ecozones (Taiga Shield and Boreal Shield) and to distinguish two different portions of the Prairies ecozone (Subhumid Prairies and Semiarid Prairies) (McGov-ern 2008) The reconciliation unit boundaries follow the geographic intersection of the reporting zone boundaries with provincial and territorial borders National estimates are calculated by summing reporting zone deforestation estimates
Figure 1 Deforestation reconciliation units and reporting zones in Canada For international reporting purposes Environment Canada compiles NDMS results for each reconciliation unit (RU identified by number) and summarizes them for each reporting zone (RZ identified by colour)
Canadian Forest Service | Pacific Forestry Centre | nrcangccaforestsresearch-centrespfc134894
Table 1 Deforestation post-land use classes During interpretation deforestation events are attributed according to their post-deforestation land use type classes and subclasses (post classes and modifiers)
Post class Post-class modifiers
Agriculture (AG) Crop pasture farm yard
Artificial Lake (AL) Agriculture pond golf course related water body recreational water body pond in rural residen-tial setting pondsmall lake in developed urban setting agriculture effluent pond industrial efflu-ent pondholding pond mining tailingwaste pond oil and gas related water body hydroelectric floodingreservoir (cleared forest) hydroelectric floodingreservoir (standing forest)
Corridor (CR) Hydro line (mainsecondarytertiaryother minor) pipeline (mainsecondarytertiaryother minor) cut line railway airstrip undifferentiated corridor
Open Field (OF) Agricultural setting industrial setting recreational setting mine setting mine facility setting oil and gas facility setting pit and quarry setting oil sands setting rural residential setting urbansuburban setting undifferentiated field
Industrial (IN) Heavy industrial light industrial oil sands infrastructure oil and gas infrastructure mine heavy mine light well pad hydro infrastructure
Recreational (RC) Campground golf course ski areas playing field undifferentiated recreational
Road (RD) General road (mainsecondarytertiary) forestry road (mainsecondarytertiary) oil and gas road (mainsecondarytertiary) mine related road (mainsecondarytertiary) hydroelectric related road (mainsecondarytertiary)
Soil Disturbance (SD) Open pit mine logging landing landfill oil sands extraction peat extraction gravel pitquarry rock slide scar (human induced) undifferentiated soil disturbance
Rural Residential (RR) Many trees remaining (residual tree cover 25ndash75) few trees remaining (residual tree cover lt 25)
Urban Residential (UR) Many trees remaining (residual tree cover 25ndash75) few trees remaining (residual tree cover lt 25)
32 When Deforestation Has Occurred
The NDMS provides information about when deforestation occurred by establishing deforestation mapping periods Image data for deforestation mapping are obtained as close to the time period bounding dates as possible The dates of these images are considered ldquocore datesrdquo Defor-estation events are detected and mapped by interpreting changes between these core date images The mapped events are then used to compute deforestation rates for the period These rates are interpolated and in some cases extrapolated to produce estimates of annual deforestation trends When the timing of large deforestation events is known these are processed separately and added to the trend results after interpolation
The NDMS provides estimates of deforestation rates from 1970 onwards in part to accommodate the needs of Canadarsquos UNFCCC reporting Although international UN-FCCC reporting addresses greenhouse gas emissions and removals since 1990 deforestation events that occurred before 1990 contribute to emissions in 1990 and after Deforestation causes both immediate and delayed residual greenhouse gas emissions Immediate emissions are those that occur when forest cover is cleared such as the burn-
ing of discarded biomass and are accounted for in that year Residual emissions which can continue for up to 20 years after the deforestation event are the result of long-term decay of discarded biomass and dead organic matter (Intergovernmental Panel on Climate Change 2003) and are estimated and incorporated in each yearrsquos emissions for 20 years as forest land converted to the post-conversion category
33 Why Deforestation Has Occurred
The NDMS provides information about why deforestation occurred by recording the new land uses that are found where deforestation has been detected and mapped For each mapped deforestation event interpreters record both the type of forest that was present before the change (pre-type) and the new land use that followed (post class) The pretype is described in terms of forest age class density class and cover type (see Appendix 1) It provides insight into the type of forest being converted and is input into the Carbon Budget Model of the Canadian Forest Sector (CBM-CFS3 Kurz et al 2009) for calculating emissions The post class which identifies the new land use is recorded using the categories shown in Table 1
Canadarsquos National Deforestation Monitoring System System DescriptionInformation Report BC-X-439
5
These deforestation post classes can be aggregated in dif-ferent ways according to user need Table 2 provides an ex-ample of post class grouping into industrial categories and good practice guidance land use categories For example within the deforestation post class ldquocorridorrdquo (CR) the modi-fier code further distinguishes events such as hydroelectric lines (CRhm) from pipelines (CRpp) so that the former can
be aggregated into the ldquohydro infrastructurerdquo industrial category and the latter aggregated into the ldquooil and gasrdquo industrial category Both of these examples are classified as settlements (SL) under the good practice guidance land use categorization scheme Appendix 2 provides a detailed listing of all post classes and modifier codes and how they translate to good practice guidance land use categories
Table 2 Deforestation post class aggregation Post classes are cross-referenced to industrial and good practice guidance classes (Intergovernmental Panel on Climate Change 2006) by means of post-class modifiers ldquoXrdquo indicates the presence of modifiers available within each post class
Good practice guidance class
Crop-land (CL) Wetlands (WL) Settlements (SL)
Industrial categories
Agric
ultu
re
Floo
ded
stan
ding
fore
st
Hyd
ro re
serv
oir
Peat
min
ing
Fore
stry
Hyd
ro in
fras
truc
ture
Indu
stry
Min
ing
Mun
icip
al
Oil
and
gas
Recr
eatio
n
Tran
spor
tatio
n
Def
ores
tatio
n po
st c
lass
Agriculture AG X
Artificial Lake AL X X X X X X X X
Corridor CR X X X X
Industrial IN X X X X
Open Field OF X X X X X X
Recreational RC X
Road RD X X
Rural Residential RR X
Soil Disturbance SD X X X X X
Urban Residential UR X
Canadian Forest Service | Pacific Forestry Centre | nrcangccaforestsresearch-centrespfc134896
Figure 2 Deforestation strata units and sampling framework Canada is stratified into types of land that have distinct patterns and rates of deforestation Deforestation mapping has been completed in the areas indicated by shading
The pretype and post class attributes are used for a range of applications including the calculation of greenhouse gas emissions in the CBM-CFS3 (Kurz et al 2009) Because of different type and carbon density of the forest being removed and different treatment and fate of woody debris and soil carbon for deforestation to different land uses some land use transitions result in differing amounts and rates of greenhouse gas emissions than others even when removing similar forest Therefore it is important to have the pretype and post class information available for input into emissions estimation and analysis tools
4 ImplementationDeforestation monitoring begins with visual interpreta-tion of satellite imagery Data are collected from relevant sources to support the work of expert interpreters who use all available lines of evidence to map and attribute de-forestation events Mapped deforestation events in sample
cells within a stratified sampling approach are compiled in a GIS database and used to estimate deforestation rates by scaling from sample to national estimates
A systematic sequence of operational steps is followed whereby mapping work is broken up into work or project packages for completion by in-house Canadian Forest Service technical staff provincial partners or contractors and then passed through a series of quality control checks before being included in the compilation and estimation procedures (see Section 51 for more details)
41 Stratification and Sampling
Deforestation mapping is guided by the stratification of the Canadian landscape into units of land having similar patterns and rates of deforestation (Figure 2) This stratifica-tion is done so that sampling effort can be directed where it is most needed Sampling rates are set for each stratum according to intelligence about deforestation activity
Canadarsquos National Deforestation Monitoring System System DescriptionInformation Report BC-X-439
7
The deforestation strata were created incorporating infor-mation from ecozone locations forest tenure boundaries known and interpreted land use and landscape patterns and provincial and territorial boundaries The strata are fur-ther refined into ldquodeforestation strata unitsrdquo which are gen-erally the deforestation strata within a single reconciliation unit but sometimes within several adjacent reconciliation units Appendix 3 lists the deforestation strata units and gives their size and spatial relationship with reconciliation units More detailed discussion of the stratification process is provided by Leckie et al (2006a and 2006b) Hotspots are areas (strata units) of localized high deforestation activ-ity such as rapidly expanding urban areas Hotspots are delineated to exclude high-activity areas from the larger deforestation strata The deforestation rates in hotspots can be far greater than the levels observed in the larger strata and these areas should therefore be treated separately
The sampling density within each stratum varies depend-ing on a number of factors including the level of deforesta-tion activity and resource constraints A sampling rate of approximately 12 is obtained by establishing
35 times 35 km sample units (termed ldquocellsrdquo) at the intersec-tions of a regular 10 times 10 km grid This grid is aligned with the National Forest Inventoryrsquos 20 times 20 km grid A sampling rate of 6 is obtained by excluding every second cell as shown on the left side of red line in Figure 3 Higher sampling densities are used in strata where more precise estimates are needed When resources permit full-area mapping is conducted in some strata such as hotspots Leckie et al (in review) provide details on sample design considerations
The actual mapping is done on a scene basis and therefore gaps between scenes exist in some strata which reduces the sampling rate somewhat from the target rate These gaps are more common in some early mapping due to the fact that Landsat scenes were not free at that time In addition to focus efforts on regions of high deforestation a subset of some low-deforestation strata (eg forest activity strata of Quebec and Ontario (Figure 2)) was identified based on a systematic pattern of Landsat scene coverages and deforestation was then mapped in sample cells within the sub-area (eg for a 6 sample)
Figure 3 Sampling intensity in two different deforestation strata The sample cells in a stratum are collectively referred to as a sample ldquogridrdquo This example illustrates 6 sampling in the left stratum (blue grid) and 12 sampling in the right stratum (yellow grid)
Canadian Forest Service | Pacific Forestry Centre | nrcangccaforestsresearch-centrespfc134898
The sampling rate for a stratum is the proportion of the to-tal area examined divided by the total area of the stratum Total area examined is the area of the sample cells reduced by any area within them deemed non-interpretable owing to cloud shadow or lack of imagery which is generally less than 2 of the total area mapped
The sample coverage has been improving with more coverage in recent mapping periods in most deforestation strata (see Figures 4ndash6) The sample area is larger for map-
ping period P2 (1990ndash2000) and P3 (2000ndash2008) than for mapping period P1 (1975ndash1990) The P2 period has several large areas with full-area mapping The sample coverage for periods P1 P2 and P3 has likely stabilized at that shown in Figures 4 5 and 6 respectively This coverage was built up over time early national reporting of deforestation was derived from smaller sample coverages and indeed the P3 sample estimate was not introduced to the national deforestation report until 2010
Figure 4 Deforestation strata sampling rates for mapping period P1 (1975ndash1990)
Canadarsquos National Deforestation Monitoring System System DescriptionInformation Report BC-X-439
9
Figure 5 Deforestation strata sampling rates for mapping period P2 (1990ndash2000)
Figure 6 Deforestation strata sampling rates for mapping period P3 (2000ndash2008)
Canadian Forest Service | Pacific Forestry Centre | nrcangccaforestsresearch-centrespfc1348910
The total area of Canada covered by the sampled regions (ie the shaded area in Figure 2) in one or more time periods is 346 times 106 km2 This includes full-area map-ping for 56 times 105 km2 of hydro survey areas in northern Quebec and another 25 times 105 km2 in northern Manitoba in which only hydroelectric development deforestation was mapped Excluding hydro survey areas the area of the sample cells interpreted was 165 times 105 km2 in P1 409 times 105 km2 in P2 and 218 times 105 km2 in P3 The large sample area for P2 reflects the greater amount of full-area mapping
42 Data Sources and Information Collection
Remote sensing imagery is the most critical input to the process of deforestation monitoring In the NDMS image data are used to identify the location size and timing of events These data are also used to determine pre-existing forest types and subsequent post classes The NDMS em-ploys medium-resolution satellite imagery in combination with high-resolution satellite and air photo data wherever available Ancillary sources in the form of spatial data and non-spatial records are used to support the mapping process and act as supplementary sources for estimation and quality control
421 Core Image Data
Landsat is the primary data source for deforestation map-ping Landsat series satellites have been acquiring data since the early 1970s and provide a consistent data stream for all NDMS mapping periods with a spatial and spectral detail suitable for deforestation mapping The current Landsat instruments are medium-resolution sensors with 30 times 30 m pixels and a large image footprint (170 times 185 km) Each satellite has a return period of 16 days with continual image acquisition and scene sidelap that increases at higher latitudes
Landsat imagery formerly available for purchase was made freely available by the United States Geological Survey starting in January 2009 (Wulder et al 2012) For mapping done before 2009 data had to be purchased and thus image acquisition focussed on the basic summer data for core dates (circa 1975 1990 2000 and 2008) and winter imagery in more difficult-to-interpret regions For mapping done after 2009 more imagery was used and additional dates were added to help identify with more precision when deforestation events occurred and also help increase mapping confidence This new imagery was also used to review any previous mapping
422 Additional Image Data
Delineating deforestation boundaries can benefit from use of high-resolution imagery Higher-resolution data are also very useful in supporting the interpretation of pre-existing conditions and forest types and in confirming deforesta-tion and better identifying the post class and post-class modifier High-resolution imagery is therefore used to supplement core Landsat data wherever possible
Data are continuously being sought out by NDMS staff for example a 25 m resolution SPOT 5 panchromatic mosaic of the Prairies (circa 2006) was provided by Agriculture and Agri-Foods Canada and a 10 m SPOT 45 national coverage called GeoBase1 was obtained from the Centre for Topographic Information of Natural Resources Canada The SPOT 45 satellites offer a higher spatial resolution but provide fewer spectral bands than Landsat Various aerial photo data sets have been assembled through partner-ships with provincial governments and other agencies in-cluding National Air Photo Library imagery provincial aerial photography and high-resolution satellite image data sets
Google Earthtrade and Bing Mapstrade are a valuable resource with an ever-expanding selection of recent high-resolution imagery over population centres and many other regions of the country In some cases archives of older imagery (eg circa 2002) are also available and can be accessed through the Time Slider tool available in Google Earth Even current high-resolution imagery can help with the identification of events that occurred in an earlier time period
423 Ancillary Spatial Data
Ancillary data are also incorporated to support the inter-pretation process These data may be used to validate or confirm deforestation occurrence or to support the interpretation of prior forest type or post-change land use Some data types are available nationally whereas others are present only within limited extents Such data include GIS data sets of road networks hydrology wetlands wood-ed areas from provincial base maps pit and quarry licence areas forest inventories forest management tenure areas specialized oil and gas pipeline and well pad databases field oblique photos and other data
In addition to the satellite and aerial photo data described above Google Earthtrade offers further ancillary spatial data in the form of terrain display crowd-sourced Panoramiotrade photographs ground-based StreetViewtrade photography and other useful layers
1 See httpwwwgeobasecageobaseendataimageryimrindexhtml
Canadarsquos National Deforestation Monitoring System System DescriptionInformation Report BC-X-439
11
424 Records Data
Spatial and non-spatial records and activity data may also be incorporated into the estimation or quality control processes In early deforestation reports records and activity data were sometimes used to provide estimates of deforestation associated with a particular sector and area As more mapping was completed estimates from records were replaced by mapping-based information Records data used in the past have included hydroelectric clearing areas forestry road records and standard road class widths and oil and gas pipeline records
43 Mapping
Deforestation event mapping is done using core date im-agery and multi-band image products Mapping is broken up into units of mapping work called ldquoproject packagesrdquo to be completed by internal staff provincial partners or qualified private sector contractors All relevant images and supporting data are assembled as a package for mapping in a particular area Detection interpretation digitization and attribution of individual deforestation events is done manually by trained interpreters according to the estab-lished NDMS methods in a standardized ArcGIS geodata-base (Leckie et al 2012)
431 Data Handling
Interpretation of deforestation events requires the detec-tion of change between pairs of images acquired at two ldquocore datesrdquo chosen to best represent the mapping time period start and end year (ie 1975 1990 2000 and 2008) Forest cover changes or potential events are highlighted using a multi-temporal display or ldquochange enhancementrdquo image created using the visible red band from two core dates of imagery When the mapping period end date image is displayed using the red image colour gun and the mapping period start image is displayed using green and blue the resulting image shows areas of vegetation loss as red In addition possible deforestation events can be detected by comparing the two core images directly Many changes besides deforestation can cause a difference between the images (eg forest harvest forest fires beaver dam flooding wind blowdown agricultural field changes and avalanches) so it is critical that a change event be confirmed as deforestation before it is mapped
Individual deforestation events are manually interpreted and identified delineated and attributed Figures 7 and 8 illustrate some of the data that are used in this process Landsat multiple band combinations at both core dates change enhancement higher-resolution imagery and field oblique aerial photographs
Figure 7 Examples of various Landsat satellite band combinations and change enhancements that may be used in the mapping process Note the change enhancement at right shows red triggers where vegetation loss or change has occurred Band combinations shown are normal colour rendition on left with colour infrared in the middle The right-hand column shows Landsat Thematic Mapper (TM) and Enhanced Thematic Mapper (ETM) bands 453 (ie the two near infrared bands and a red band) displayed as red green blue
Canadian Forest Service | Pacific Forestry Centre | nrcangccaforestsresearch-centrespfc1348912
Figure 8 Examples of supplemental data use Left Example of confirmed and interpreted events (red and yellow lines) shown as polygons on the SPOT imagery (25 m resolution SPOT 5 top left and 10 m SPOT 4 bottom left) Right Example of flight path and oblique aerial photograph from a deforestation field verification campaign
Typically the interpretation process is conducted in a GIS environment where change enhancement and single-date images can be layered and compared by blinking or using the swipe tool Georeferenced ancillary imagery can be simultaneously displayed and a link between ArcGIS and Google Earth allows the synchronization of spatial display extents in both programs
432 Project Packages
Project packages are units of mapping work They include specification of the mapping area time period to be mapped and the sample cells to be used Each project package contains a standardized geodatabase with pre-defined sets of values for some of the attribute fields core date and change enhancement imagery other imagery in-cluding winter and overlapping scenes from east and west of the scene being mapped additional SPOT and aerial photographs (if available) and ancillary data sets
Once the mapping has been completed for a project and passed successfully through quality control the data are added to the national geodatabase which carries all defor-estation mapping data for the country including all time
periods The structure of the project geodatabases mirrors the structure of the national geodatabase
433 Interpretation
Image interpretation is done manually on a cell-by-cell ba-sis Typically the change enhancement is used first to iden-tify change events These are then confirmed or refuted as deforestation by the interpreter using the individual core date images supported by other image and ancillary data The supporting data are used to assess whether an event area was forested before the change and whether the event meets the deforestation definition Supporting data are also used to help interpret pretype and post class
The boundary of a deforestation event is identified in the Landsat images but higher-resolution imagery is used in a supporting role to improve event boundary delineation Interpreters follow specific digitizing guidelines provided in the Deforestation Interpretation Guide (Leckie et al 2012) that dictate how events shall be mapped (eg digitize smooth lines rather than following pixel boundaries avoid gaps and overlaps between adjacent events keep the mapping topology clean etc)
Canadarsquos National Deforestation Monitoring System System DescriptionInformation Report BC-X-439
13
Deforestation events may be linear in form (eg roads hydro lines) or polygonal They are digitized accordingly as lines or polygons in the project geodatabase Specific guidelines apply for each type of feature Delineation fol-lows clearly defined situational rules (eg for compositemixed use polygons roads in cutblocks tertiary versus more significant roads episodic clearing etc) all of which are addressed in detail in the Deforestation Interpretation Guide When events extend beyond the boundaries of a sample cell they are delineated to the full extent of the event but only the portion inside the cell is included in the estimation
Event attributes are interpreted and recorded using attri-bute values defined in the NDMS data dictionary Pretype attributes include forest type density and maturity (see Appendix 1 for details) Post class attributes are listed in Table 2 (see Appendix 2 for details) Interpreters also record their level of confidence about each deforestation event (ie how confident they are that it was forest before the change and that it is indeed a new land use) Comment fields are used extensively to record details specific to each event These may indicate uncertainty in an event a request by the interpreter for specific review by the qual-ity control person or the need for checking the event in a later time period The widths for linear events (such as roads or corridors) are also recorded as it is more efficient to map these as lines and later convert to polygons using the width data during a subsequent processing stage
If mapping already exists for an earlier time period in the area the interpreter reviews it in the context of recent imagery either to confirm the previous interpretations or to note whether corrections are required Points are used to flag areas for revision or later review by analysts such as where older mapping may require updating
In some cases imagery available for a core date is contami-nated by clouds shadows or missing data at image edges In such cases the interpreter digitizes the contaminated area within the sample cells and saves the polygon into a special geodatabase layer for ldquonon-interpretable areardquo poly-gons and notes the affected date The areas saved into this layer are removed from the sample during later processing to create what is termed the ldquointerpretable gridrdquo The open-ing of the Landsat archive through free access to geocor-rected imagery has substantially reduced the amount of
non-interpretable area entering the estimate calculations For example sometimes images outside the core date can be used to infer deforestation in the non-interpretable area In fact recently non-interpretable areas have been almost eliminated from the process
A series of quality checks has been built into the mapping process these are completed in every mapping project Canadian Forest Service analysts conduct quality control checks of the mapped data (see Section 5) and return a set of quality control points to the interpreters indicating where more work and specific changes are needed before the mapping can be loaded into the national geodata-base
44 Deforestation Estimation
The mapping data from deforestation sample cells are used to estimate the area of deforestation in each RU by scaling up from sample to population in each defor-estation stratum and then summing the deforestation estimate for each stratum in an RU Scaling up is done for each land use type (post-class modifier) in each time period Temporal interpolation is used to compute annual deforestation rates Lastly large event mapping records and activity data and intelligence are used to refine the estimates when appropriate
441 GIS processing
The national deforestation geodatabase contains all the mapped areas representing deforestation events sampled within each time period as lines and polygons The geo-database also contains layers required for the estimation calculations including the sample grids the non-interpre-table areas the Landsat image boundaries (which define the core dates and areas sampled) the deforestation strata boundaries and the RU boundaries
The spatial data are first processed to prepare them for the scaling up analysis which is conducted later in a non-spa-tial database program (Section 444) Figure 9 provides a schematic of the tasks involved in the GIS processing (Burt et al 2006) The two main calculated outputs produced are the event and grid tables shaded in red in Figure 9 The processing of the mapped GIS data for the national sum-mary is performed for each time period
Canadian Forest Service | Pacific Forestry Centre | nrcangccaforestsresearch-centrespfc1348914
Figure 9 Simplified deforestation GIS processing flow Input tables are in green processes in yellow and output tables in red Gold arrows denote updates to a table The term ldquolinesrdquo refers to linear deforestation events ArcGIS commands are underlined
Canadarsquos National Deforestation Monitoring System System DescriptionInformation Report BC-X-439
15
The first of the output tables the ldquointerpretable gridrdquo (labelled grd_ident in Figure 9) defines the actual area for which mapping was done As a result the full set of sample cells is clipped by the extent of the Landsat imagery (thus removing portions of the cells that fall outside the Landsat image boundary) and has the non-interpretable areas (eg clouds) removed
The second table the ldquoFinal Event Polygonsrdquo (labelled py_fn) is created from the intersection of many input lay-ers The post-class modifier code for each event is carried through in these deforestation calculations The linear de-forestation events are converted to polygons by applying a buffer according to the width attribute associated with each line then combined with the other deforestation polygon events to create a complete polygonal coverage of all deforestation events mapped The events are then intersected with the interpretable grid layer Further inter-sections are applied to the boundary RU and deforestation strata layers to identify which strata and RU are associ-ated with each event In the end the data for each event include attributes drawn from all the intersected layers including the deforestation stratum and RU of each event As well small slivers created during the GIS processing steps are removed
At this stage it is possible to calculate the rate of deforesta-tion for each time period All events are assigned to the time period in which they occur (ie P1 [1975ndash1990] P2 [1990ndash2000] or P3 [2000ndash2008]) based on the core dates of imagery used for mapping For each event an effective annual rate of deforestation (hectares per year) is calculat-ed by dividing the deforested area by the number of years between the core dates Later in the process the resulting per-event annual rates are summed for each stratum and divided by the area of grid cells interpreted to determine the average annual rate for each time period and post-class modifier (Section 444)
To provide flexibility the mapping activity captures forest clearings that meet a more inclusive definition of defor-estation than strictly required Land conversion of sparse forest does not constitute deforestation (unless it is conver-sion of a recently disturbed or regenerating area) but is mapped for completeness unless otherwise specified The GIS processing steps are used to exclude such mapped events with sparse forest density
442 Large Events and Records Data
Certain types of events that are large uncommon and iso-lated (eg hydroelectric reservoirs new surface mines long and major hydroelectric lines etc) are better represented by complete mapping and census rather than sampling (Leckie et al [in review]) Such events termed ldquolarge eventsrdquo are mapped separately and completely using either core date imagery or imagery captured as close to the actual event dates as possible When large events fall within sample cells and thus are also captured by the sampling
these are excluded from the processing of sample data to avoid double-counting
Records and activity data when used for a given type of deforestation in a region (eg stratum) are added to the database and removed from the processing of sample data similar to large events (see Section 424)
443 Expert Intervention
After the mapping and GIS processing steps have been completed the initial estimation results are analyzed to identify potential problems With the nature of deforesta-tion in Canada and intensity of the sample occasionally spurious estimates may occur
Canadian Forest Service deforestation monitoring ex-perts have accumulated familiarity with land use change patterns and activities in Canada over many years These experts scrutinize NDMS estimation process outputs and investigate questionable outputs that may be then modi-fied if a change is justified
When suspicious estimation outputs are encountered ex-perts intervene by evaluating available records information and reconnaissance data For example when a particular event type is rare and sampling produces estimates that are unexpectedly high or low expert reviewers may scan available imagery to see what is occurring outside the sample cell boundaries (ie in the non-sampled area) and use this to inform expert intervention Estimation outputs may be deemed suspicious when they contradict previous estimates or other available lines of evidence All expert interventions are documented for transparency and in case they need to be reassessed as new evidence emerges (eg Leckie et al 2009 Leckie et al 2010)
444 Database Processing
Annualized national deforestation estimates are produced for each industrial sector and RU by combining the GIS data and any large event or recordsactivity data and incorporating expert interventions These data are loaded into a non-spatial database environment (Paradine 2007) The resulting estimates are used to produce customized re-ports for NDMS data users such as provincial government agencies Canadarsquos National Forest Carbon Monitoring Accounting and Reporting System for input to greenhouse gas emission estimation and others
The non-spatial part of the processing follows the work flow shown in Figure 10 The ratio of the area sampled (the ldquointerpretable gridrdquo) to the area of the stratum is calculated (labelled ldquo1rdquo in Figure 10) The area of deforestation in the sample is then scaled up by this proportion (labelled ldquo2rdquo in Figure 10) to produce the deforestation estimate for the stratum This process is repeated for all strata time periods and post classes (including post-class modifiers) using the mapped sample data only
Canadian Forest Service | Pacific Forestry Centre | nrcangccaforestsresearch-centrespfc1348916
Figure 10 Schematic of the deforestation database process used to produce estimates
Canadarsquos National Deforestation Monitoring System System DescriptionInformation Report BC-X-439
17
The expert intervention can be added at the strata level for a particular time period as an adjustment factor (labelled ldquo3rdquo in Figure 10) or as replacements or additions (labelled ldquo4rdquo in Figure 10) to existing data It can also be applied at the RU level (labelled ldquo7rdquo in Figure 10) Early national deforesta-tion reporting had more expert interventions because of lower sample rates less availability of high-resolution imagery and more use of records data over the remote sensing sample Currently few expert interventions occur with most occurring for the 1975ndash1990 time period which has a smaller sample
At the strata level the updated deforestation estimates by time period and post-class modifier are proportioned (labelled ldquo5rdquo in Figure 10) into their respective RUs (see Ap-pendix 3)
The data are then annualized The deforestation estimates for each time period (by post class and RU) are assigned
to the middle year of the time period (ie 1983 for 1975ndash1990 1995 for 1990ndash2000 and 2004 for 2000ndash2008) Annual trends are produced by applying linear interpola-tion between midpoints and extrapolation from endpoints (labelled ldquo6rdquo in Figure 10) Figure 11 provides one example
Large event mapping data records and activity data and expert interventions are applied as shown by the various green boxes in Figure 10 Large event data have the year of the event attached to them and are added to the mapping data at the RU level (labelled ldquo7rdquo in Figure 10) Records data also generally have a date attached and are added to the annualized data in a similar fashion to large event data
Figure 12 shows the trend line calculated in Figure 11 and the large event data (purple) representing hydro reservoir flooding facility construction and associated transporta-tion and hydro line corridors
Figure 11 Example deforestation trend produced using data from three mapping periods
Canadian Forest Service | Pacific Forestry Centre | nrcangccaforestsresearch-centrespfc1348918
Figure 12 Example of a deforestation area trend from sample mapping (red) and large events data (purple)
The post-class modifier classes (Table 1 and Table A21 in Appendix 2) are aggregated (labelled ldquo8rdquo in Figure 10) to the appropriate industrial category and good practice guidance class using a lookup table The various modifiers within each deforestation post class provide flexibility to summarize to different industrial categories based on user requirements (eg the categories used by the National For-est Carbon Monitoring Accounting and Reporting System and shown in Tables A21 and A22)
The result of the processing is a series of database tables A major product among these is the list of annual deforesta-tion area per RU per industrial class (labelled ldquo9rdquo in Figure 10) Another product is the breakdown of forest pretype percentages by RU this is done by calculating the percent-age area of each pretype mapped in the RU Reporting for the UNFCCC requires separate estimates of deforestation and greenhouse gas emissions for managed and unman-aged forest thus a separate table is produced for unman-aged forest (labelled ldquo10rdquo in Figure 10)
5 Quality ControlThree major quality control stages are applied during the deforestation mapping process
1 initial mapping quality control
2 revision quality checks and
3 overall quality assurance or vetting where a check on the final mapping data is performed
This multi-stage approach reduces the likelihood of errors and increases consistency of and confidence in the final product The data processing stage has further checks for data integrity After the data are calculated in the esti-mate process the final numbers and trends are assessed for changes from previous year estimates Deforestation estimates are also scrutinized by external users before they incorporate the data into their applications For an over-view of quality control practices see Dyk et al (2011)
51 Quality Control at the Mapping Stage
The mapping process flow is illustrated in Figure 13 includ-ing the quality control steps Typical errors caught through quality control at the mapping stage include incorrect event interpretations or delineations event omissions or commissions missing field values typographical errors and topology problems During the quality control phase an internal Canadian Forest Service reviewer performs detailed checks to ensure consistency with mapping and interpretation rules and returns a set of points to flag and describe the problem areas to the interpreter or contrac-tor These quality control points are stored in the mapping geodatabase as a permanent layer
Canadarsquos National Deforestation Monitoring System System DescriptionInformation Report BC-X-439
19
Figure 13 The deforestation mapping and quality control process flow
The mapping interpreter reviews these points and applies the recommended corrections to the working database The quality control points are sent to the interpreter early and frequently in the project timeline to reduce or avoid propagation of persistent errors or misunderstandings through the duration of the project
The original line and polygon mapping is preserved and re-visions are performed in separate ldquorevised linerdquo and ldquorevised polygonrdquo layers in the project geodatabase Information about the changes including what was done by whom and the date is added for every revised event Any deleted events are also retained in what are termed the ldquodrop lay-ersrdquo to mark the area as a non-deforestation event which is reviewed during future mapping
When the revised data are resubmitted to the Canadian Forest Service the data layers make clear what changes were requested and what changes were made The re-viewer uses these layers to verify that appropriate revisions were properly applied at all quality control points Any further errors or misunderstandings are communicated to the interpreter immediately for resolution At this stage the interpreter can also open a dialogue regarding specific events using additional comment fields in the quality control point layer or personal communication
The next level of quality control is the final vetting This audit step is conducted internally by senior Canadian For-est Service interpreters to ensure consistency of mapping across all projects All aspects of the new data are reviewed during this stage omission and commission errors delinea-
tion and attribution In addition the older mapping data are scanned to ensure newer imagery confirms the original interpretation A set of ldquovet revisionrdquo points is created to mark all adjustments required in the database An analyst works through these point by point to make the necessary changes noting any complex or uncertain events and communicating directly with the vetting interpreter when necessary
Field validation is a desirable aspect of the revision process but is not included during the mapping stage In general field campaigns are conducted on an ongoing basis when resources permit Areas where local knowledge or ground truth information are needed to clarify the interpretation are identified from the interpreter confidence records or the revision point data Dedicated field programs schedule air or ground visits to high-impact and low- to moderate-confidence events Local experts sometimes provide information about ground conditions that can be used to verify and update the database
Throughout the entire mapping and revision process an internal ldquoproject storyrdquo is maintained by the Canadian For-est Service This document summarizes activity on a given project including staff and contractors involved dates and actions completed It also includes detailed explanation of any complex situations or vet revisions as well as notes on any issues raised by the quality control or vetting interpret-ers To maintain consistency analysts who are involved in revisions or who vet revisions read this project story before starting work
Canadian Forest Service | Pacific Forestry Centre | nrcangccaforestsresearch-centrespfc1348920
52 Quality Control at the Data Processing Stage
Once revisions are vetted final data integrity checks are conducted on the project database to find and correct any technical errors such as missing attributes mismatched post classes and modifiers incorrect or reversed event dates inappropriate line widths topology errors overlaps and duplicates and typos This stage is partially automated The final mapping layers can be loaded into the national database only after the integrity checks have been com-pleted
Data quality checks are built into the script that automates the data processing stages The script both delivers reports to the screen while running and dumps to log files which are reviewed by Canadian Forest Service staff to ensure the runs were successful
Transfer of the final GIS tables into the non-spatial defor-estation database is also automated The grid and event tables for each time period are checked before load-ing and the number of records loaded is recorded and compared with previous runs to highlight any potential discrepancies
The database queries and tables used to create the annual estimates by industrial category and RU are controlled by Microsoft Access macros to ensure consistency between the runs
53 Quality Control at the Output Analysis Stage
Following generation of the estimate tables the main out-puts (annualized deforestation by industrial class and RU pretype table and unmanaged forest table) are evaluated closely by Canadian Forest Service experts to ensure that estimates have been calculated properly and that discrep-ancies from previously calculated values can be explained To aid in this effort a comparison spreadsheet is created for each RU showing the deforestation estimates by indus-trial class for the current and previous yearrsquos national run together with illustrations and statistics The experts scru-tinize the data for changes and ensure the new estimates are consistent with the input mapping data Any specific issues and special adjustments required are documented in a report that becomes part of the record for each yearrsquos estimate
54 External Quality Control
Users of the deforestation estimates conduct their own reviews of the data prior to use in their systems and com-municate any issues before incorporating the data into their own business processes When new issues arise these are dealt with and the NDMS quality control processes are updated to catch similar issues in the future
6 ConclusionsDeforestation is the direct human-induced conversion of forested land to non-forested land use The NDMS was de-signed and implemented to provide information needed by Canada to meet its obligation under the UN Frame-work Convention on Climate Change to report the areas affected annually by deforestation Also considered was the need to provide information useful for policy analysis land management and forest stewardship applications Understanding why where and when deforestation occurs is a prerequisite to the development of appropriate policy instruments to optimize land use develop mitigation strat-egies and address cumulative impacts on forest resources
The NDMS uses manual mapping from a satellite remote sensing sampling system informed by records-based information and expert knowledge to provide information about deforestation in Canada The remote sensing map-ping is supported by available ancillary information such as high-resolution imagery forest inventory road networks and other industrial databases Certain types of events that are large and isolated (eg mine and hydroelectric devel-opments) are mapped and incorporated separately in the overall deforestation estimates Occasionally records and activity data on land use changes are incorporated when they are deemed more appropriate than the sampling es-timate The mapping results from the sample are scaled up to regional levels In the data processing stage these data are merged and annualized to produce national deforesta-tion estimates
The system has been used and improved over the last 10 years The flexibility of the NDMSrsquos design makes it possible to adapt to future changes in image sources ancillary data resource availability and user needs and positions the pro-gram well for long-term maintenance and improvement
Canadarsquos National Deforestation Monitoring System System DescriptionInformation Report BC-X-439
21
7 References
Burt W Paradine D Leckie D 2006 Geographic Information system processing of deforestation mapping data for estimating deforested area of Canada Natural Resources Canada Canadian Forest Service Pacific Forestry Centre Victoria BC Report DRS-P-001
Dyk A Tinis S Leckie D 2011 National Inventory Report 2011 Deforestation area estimation for Canada Quality con-trol overview Natural Resources Canada Canadian Forest Service Pacific Forestry Centre Victoria BC Report DRS-N-031
Ecological Stratification Working Group 1996 A national ecological framework for Canada Agriculture and Agri-Foods Canada Research Branch Centre for land and Biological Resources Research and Environment Canada State of the Environ-ment Directorate Ottawa Ont
Environment Canada 2006 National Inventory Report 1990ndash2004 Greenhouse gas sources and sinks in Canada Govern-ment of Canada Submission to the UN Framework Convention on Climate Change httpunfcccintnational_reportsannex_i_ghg_inventoriesnational_inventories_submissionsitems3734php (Accessed August 2014)
Environment Canada 2014 National Inventory Report 1990ndash2012 Greenhouse gas sources and sinks in Canada Govern-ment of Canada Submission to the UN Framework Convention on Climate Change Report issued by Pollutant Inventories and Reporting Division Environment Canada Ottawa Onthttpunfcccintnational_reportsannex_i_ghg_inventoriesnational_inventories_submissionsitems8108php (Accessed August 2014)
Food and Agriculture Organization 2006 2001 Global forest resources assessment 2000 main report United Nations Food and Agriculture Organization Rome Italy FAO Forestry Paper 140
Gillis M Omule A Brierley T 2005 Monitoring Canadarsquos forests The National Forest Inventory Forestry Chronicle 81(2)214ndash221
Intergovernmental Panel on Climate Change 2003 Good practice guidance for land use land-use change and forestry Penman J Gytarsky M Hiraishiet T et al (eds) Institute for Global Environmental Strategies Hayama Japan
Intergovernmental Panel on Climate Change 2006 2006 IPCC guidelines for national greenhouse gas inventories Egg-leston HS Buendia L Miwa K Ngara T Tanabe K (eds) Intergovernmental Panel on Climate Change National Green-house Gas Inventories Programme Institute for Global Environmental Strategies Hayama Japan httpwwwipcc-nggipigesorjppublic2006gl (Accessed January 2015)
Kurz W 2010 An ecosystem context for global forest cover loss estimates Proceedings National Academy of Sciences 107(20)9025ndash9026
Kurz W Apps M 2006 Developing Canadarsquos national forest carbon monitoring accounting and reporting system to meet the reporting requirements of the Kyoto Protocol Mitigation and Adaptation Strategies for Global Change 11(1)33ndash43
Kurz W Dymond C White T Stinson G Shaw C Rampley G Smyth C Simpson B Neilson E Trofymow J Metsaranta J Apps M 2009 CBM-CFS3 A model of carbon-dynamics in forestry and land-use change implementing IPCC standards Ecological Modelling 220(4)480ndash504
Kurz W Shaw C Boisvenue C Stinson G Metsaranta J Leckie D Dyk A Smyth C Neilson E 2013 Carbon in Canadarsquos boreal forest A synthesis Environmental Reviews 21260ndash292
Canadian Forest Service | Pacific Forestry Centre | nrcangccaforestsresearch-centrespfc1348922
Leckie D Dyk A Ortlepp S Tinis S 2010 Records of decision for Canadarsquos national deforestation estimate 2011 Natu-ral Resources Canada Canadian Forest Service Pacific Forestry Centre Victoria BC Report DRS-N-029
Leckie D Dyk A Paradine D Tammadge D Tinis S 2012 Deforestation interpretation guide Natural Resources Canada Canadian Forest Service Pacific Forestry Centre Victoria BC Report DRS-M-030
Leckie D Dyk A Tinis S 12009 Records of decision for Canadarsquos national deforestation estimate Natural Resources Canada Canadian Forest Service Pacific Forestry Centre Victoria BC Report DRS-N-026
Leckie D Paradine D Burt W 2006a Mapping sample coverage for Canadarsquos national deforestation estimate 2006 Natural Resources Canada Canadian Forest Service Pacific Forestry Centre Victoria BC Report DRS-N-002
Leckie D Paradine D Tinis S 2006b Geographic strata for Canadarsquos national deforestation estimates report Natural Resources Canada Canadian Forest Service Pacific Forestry Centre Victoria BC Report DRS-Q-003
Leckie D Paradine D Kurz W Magnussen S [2015] Deforestation mapping sampling designs for Canadian land-scapes Natural Resources Canada Canadian Forest Service Victoria BC In review
Lempriegravere T Kurz W Hogg E Schmoll C Rampley G Yemshanov D et al 2013 Canadian boreal forests and climate change mitigation Environmental Reviews 21(4)293ndash321
Le Queacutereacute C Peters G Andres R Andrew R Boden T et al 2014 Global carbon budget 2013 Earth System Science Data 6689ndash760
Masek J Cohen W Leckie D Wulder M Vargas R de Jong B Healey S Law B Birdsey R Houghton R Mildrexler D Goward S Smith W 2011 Recent rates of forest harvest and conversion in North America Journal of Geophysical Research 116G00K03
McGovern M 2008 Reporting zones GHG spatial reporting structure for Canada 2008 Environment Canada Greenhouse Gas Division Ottawa Ontario
Montreal Process 2009 Criteria and indicators for the conservation and sustainable management of temperate and boreal forests Fourth edition httpwwwmontrealprocessorgdocumentspublicationsgeneral2009p_4pdf (Accessed January 2015)
Pan Y Birdsey RA Fang J et al 2011 A large and persistent carbon sink in the Worldrsquos forests Science 333988ndash993
Paradine D 2007 National Inventory Report 2008 ACCESS database description GIS processing description and consoli-dated GIS database description Natural Resources Canada Canadian Forest Service Pacific Forestry Centre Victoria BC Report DRS-N-019
United Nations Framework Convention on Climate Change 2002 Conference of the PartiesndashReport of the Confer-ence of the Parties on its seventh session held at Marrakesh from 29 October to 10 November 2001 United Nations Office Geneva Switzerland httpunfcccintresourcedocscop713pdf (Accessed January 2015)
Wulder M Masek J Cohen W Loveland T Woodcock C 2012 Opening the archive How free data has enabled the science and monitoring promise of Landsat Remote Sensing of Environment 1222ndash10
Canadarsquos National Deforestation Monitoring System System DescriptionInformation Report BC-X-439
23
Appendix 1 Pretype Forest Conditions
The tables below list the approved forest type density and maturity values applied in deforestation mapping Note not all combinations are valid particularly those that include recent disturbance and regeneration terms Table A11 lists the ac-ceptable parameter combinations
The most common pretype groupings found are the 36 combinations of three Type classes (B C and M) three Density classes (D O and S) and four Maturity classes (R Y I and M) The two older Maturity classes (O and G) require additional verification to identify them Several classes identify recently disturbed forests (K X and R)
Table A11 Pre-change forest type descriptors
TYPE Definition Restrictions of use
B Broadleaf gt 75 of trees are broadleaf (Angiospermae)
C Conifer gt 75 of trees are conifer (Coniferae)
M Mixed gt 25 of both broadleaf and conifer present
K Clearcut Exposed ground and (or) ground vegetation No visible regeneration
Use only with S or N density and Q maturity
X Burn Exposed ground and (or) ground vegetation No visible regen-eration May have live residual trees up to 25 crown closure
Use only with S or N density and Q maturity
R Regen Regenerating areas with lt 25 crown closure where the forest composition (B C or M) is not identifiable
Table A12 Pre-change forest density descriptors
DENSITY Definition Restrictions of use
D Dense gt 60 crown closure
O Open 25ndash60 crown closure
S Sparse 5ndash25 crown closure
N Nil lt 5 crown closure Use only with K and X pretype
Table A13 Pre-change forest maturity descriptors-
MATURITY Definition Restrictions of use
Q Recent disturbance No visible regeneration Use only with K and X pretype
R Regen Forest stands 0ndash14 years old
Y Young Forest stands 15ndash25 years old
I Immature Forest stands 26ndash40 years old
M Mature Forest stands 41ndash80 years old
O Old Forest stands 81ndash200 years old
G Old-growth Forest stands over 200 years old Restricted to British Columbia only
Canadian Forest Service | Pacific Forestry Centre | nrcangccaforestsresearch-centrespfc1348924
Table A14 Valid combinations of pretype attributes (TypendashDensityndashMaturity)
Regen Broadleaf Mixed Coniferous
Dense RDR BDR MDR CDR
BDY MDY CDY
BDI MDI CDI
BDM MDM CDM
BDO MDO CDO
CDG
Open ROR BOR MOR COR
BOY MOY COY
BOI MOI COI
BOM MOM COM
BOO MOO COO
COG
Sparse RSR BSR MSR CSR
BSY MSY CSY
BSI MSI CSI
BSM MSM CSM
BSO MSO CSO
CSG
Burn Clearcut
Regen Broadleaf Mixed Coniferous
Disturbed XSQ KSQ
XNQ KNQ
Canadarsquos National Deforestation Monitoring System System DescriptionInformation Report BC-X-439
25
Appendix 2 Post-class Modifiers by Industrial Category
Table A21 lists all land use post-class deforestation modifiers They provide additional detail regarding what has occurred on the ground for each deforestation event These classes can be assigned to various industrial classes (see Table A22) Detailed definitions are provided in the Deforestation Interpretation Guide (Leckie et al 2012)
Table A21 Post class and post-class modifier codes and short descriptions grouped by industrial categorysector (in bold)
Post class Post class modifier
Agriculture
AG Agriculture ab bare
cp crop
fy farm yard
pa pasture
AL Artificial Lake aa agriculture pond
ea agriculture effluent pond
OF Open Field fa agriculture setting
Flooded Standing Forest
AL Artificial Lake ff flooded standing forest
Forestry
RD Road mf mainline forestry road
sf secondary forestry road
xf tertiary forestry road with width ge 20 m
SD Soil Disturbance ld logging landing
ss rock slide scar
Hydro Infrastructure
CR Corridor hm hydro linendashmain
hs hydro linendashsecondary
xy hydro linendashtertiary ge 20 m
IN Industrial ih hydro infrastructure
Hydro Reservoir
AL Artificial Lake hr hydroelectric flooding
Industry
AL Artificial Lake ei industrial effluent pond
IN Industrial hi heavy industrial
li light industrial
OF Open Field fi industrial
Canadian Forest Service | Pacific Forestry Centre | nrcangccaforestsresearch-centrespfc1348926
Post class Post class modifier
Mining
AL Artificial Lake em waste ponds for mining
IN Industrial mh mine heavy
ml mine light
OF Open Field fk mine facility
fm mine
fq pit and quarry
SD Soil Disturbance mn open pit mine
pq gravel pitquarry
Municipal
AL Artificial Lake ad pond urban setting
ar pond rural residential
ul other human caused
CR Corridor cl cut line
cu undifferentiated
OF Open Field fd urbansuburban
fr rural residential
uf undifferentiated field
RR Rural Residential rf few trees remaining
rm many trees remaining
SD Soil Disturbance lf landfill
su undifferentiated
UR Urban Residential df few trees remaining
dm many trees remaining
Oil and Gas
CR Corridor pp pipelinendashmain
ps pipelinendashsecondary
xp pipelinendashtertiary ge 20 m
IN Industrial oi oil sands industrial
op oil and gas industrial
wp well pad
OF Open Field fo oil and gas facility
fs oil sands open field
SD Soil Disturbance os oil sands
AL Artificial Lake eo oil and gas related pond
Canadarsquos National Deforestation Monitoring System System DescriptionInformation Report BC-X-439
27
Post class Post class modifier
Peat Mining
SD Soil Disturbance pm peat extraction
Recreation
AL Artificial Lake af golf course related
ap recreational water body
OF Open Field fc recreational field
RC Recreational ca campground
go golf course
ru other or undifferentiated
sk ski areas
Transportation
CR Corridor as airstrip
ry railway
RD Road mm main road clearly for a mine
mr main road
mo main road clearly for oil and gas
my main road clearly for hydroelectric
sm secondary mining road
so secondary oil and gas road
sr secondary road
sy secondary hydroelectric road
xm tertiary mining road with width ge 20 m
xo tertiary oil and gas road with width ge 20 m
xr tertiary road with width ge 20 m
xy tertiary hydroelectric road with width ge 20 m
Canadian Forest Service | Pacific Forestry Centre | nrcangccaforestsresearch-centrespfc1348928
Table A22 Aggregation of deforestation mapping classes to good practice guidance and industrial categories
Good practice guidance class
Crop-land (CL)
Wetlands (WL) Settlements (SL)
Industrial Categories
Agric
ultu
re
Floo
ded
stan
ding
fore
st
Hyd
ro re
serv
oir
Peat
min
ing
Fore
stry
Hyd
ro in
fras
truc
ture
Indu
stry
Min
ing
Mun
icip
al
Oil
and
gas
Recr
eatio
n
Tran
spor
tatio
n
Def
ores
tatio
n po
st c
lass
Agriculture AG ab cp pa fy
Artificial Lake AL aa ea ff hr ei emad ar of ul eo af ap
Corridor CR hm hs xy cl cu
pp ps xp as ry
Industrial IN ih hi li mh mloi op wp
Open Field OF fa fi fk fm fq fd fr uf fo fs fc
Recreational RC ca go fu sk
Road RDmf sf xf
mm mo mr my sm so sr sy xm
xo xr xy
Rural Residential RR rf rm
Soil Disturbance SD pm ld ss mn pq lf su os
Urban Residential UR df dm
Canadarsquos National Deforestation Monitoring System System DescriptionInformation Report BC-X-439
29
Appendix 3 Deforestation Strata Units and Reconciliation Unit InclusionTable A31 shows the names of the deforestation strata their area in kilohectares and the percentage of that area contained in each reconciliation unit that they overlap (sorted by reconciliation unit identification number see Figure 1 for unit loca-tion and name)
Table A31 Area of strata units and percent of strata unit area that is in each reconciliation unit
Deforestation strata unit name Strata unit area (kilohectares)
Reconciliation unit ( inclusion)
Newfoundland Eastern Woodlot 4 477 1 (100)
Newfoundland Forest Activity Zone 6 512 1 (100)
Newfoundland St Johns 55 1 (100)
Labrador Arctic 1 893 2 (100)
Labrador Northern Forest 23 238 3 (98) 4 (2)
Labrador Forest Activity Zone 4 620 4 (100)
Nova Scotia Eastern Woodlot 2 894 5 (100)
Nova Scotia Forest Activity Zone 2 396 5 (100)
Nova Scotia HalifaxDartmouth 182 5 (100)
Prince Edward Island 577 6 (100)
New Brunswick Eastern Woodlot 4 121 7 (100)
New Brunswick Forest Activity Zone 3 174 7 (100)
Quebec Arctic 20 443 10 (75) 9 (18) 8 (7)
Quebec Eastern Townships 3 948 11 (100)
Quebec Gaspe Forest Activity Zone 2 740 11 (100)
Quebec Southern RU12 2 968 12 (100)
Quebec Northern Forest 72 759 14 (73)15 (22) 13(5)
Quebec Forest Activity Zone 44 717 15 (100)
Quebec Ile DAnticosti 795 15 (100)
Quebec Lac St Jean 964 15 (100)
Quebec Southern RU15 1 687 15 (100)
Ontario Thunder Bay 225 16(100)
Ontario Southern 8 198 17 (100)
Ontario Manitoulin Island 326 17 (100)
Ontario Northern Forest 46 468 18 (56) 16 (43) 19 (1)
Ontario SudburyNorth Bay 874 19 (100)
Ontario Forest Activity Zone 42 398 19 (56) 16 (43) 18 (1)
Ontario Sault Ste Marie 536 19 (92) 17 (8)
Manitoba Forest Activity Zone RU22 East 2 405 22 (100)
Manitoba Forest Activity Zone RU22 North 6 109 22 (100)
Manitoba Prairie Fringe RU22 804 22 (100)
Manitoba Northern Forest 37 339 22 (43) 21 (35) 25 (19) 23 (3)
Manitoba Forest Activity Zone RU23 7 382 23 (100)
Manitoba Prairie Fringe RU23 3 970 23 (100)
Manitoba Hotspot 851 24 (100)
Manitoba North Prairie 6 117 24 (100)
Canadian Forest Service | Pacific Forestry Centre | nrcangccaforestsresearch-centrespfc1348930
Deforestation strata unit name Strata unit area (kilohectares)
Reconciliation unit ( inclusion)
Saskatchewan Northern Forest 21 224 27 (75) 26 (22) 28 (3)
Saskatchewan Prairie Fringe 5 509 28 (100)
Saskatchewan Inactive Forest Activity Zone 6 196 28 (58) 27 (42)
Saskatchewan Forest Activity Zone 8 189 28 (99) 27 (1)
Saskatchewan North Prairie 8 167 29 (100)
Saskatchewan Prairie 15 921 30 (100)
Alberta Northern Forest 10 862 31 (58) 34 (28) 32 (8) 33 (6)
Alberta Forest Activity Zone 22 066 34 (100)
Alberta Fort McMurray 807 34 (100)
Alberta High Level 789 34 (100)
Alberta Northwest Fringe 5 436 34 (100)
Alberta Prairie Fringe 6 038 34 (100)
Alberta North Prairie 7 397 35 (100)
Alberta RU 36 Forest Activity Zone 4 764 36 (100)
Alberta Palliser Triangle 3 689 37 (100)
Alberta Prairie West 4 522 37 (100)
British Columbia RU 38 6 759 38 (100)
British Columbia Prairie Fringe 2 333 39 (100)
British Columbia RU 40 19 220 40 (100)
British Columbia Lower Mainland East Vancouver Island
1 142 41 (100)
British Columbia RU 41 Forest Activity Zone 15 440 41 (100)
British Columbia VI QCI 3 813 41 (100)
British Columbia Okanagan 1 109 42 (100)
British Columbia Prince George 464 42 (100)
British Columbia RU 42 Forest Activity Zone 44 286 42 (96) 39 (4)
Yukon Arctic 496 43 (100)
Yukon Northern Forest 19 987 45 (91) 44 (9)
Yukon Whitehorse 417 46 (100)
Yukon Forest Activity Zone 27 440 46 (98) 47 (1)
Northwest Territories Arctic 42 788 48 (49) 49 (43) 50 (7)
Northwest Territories Northern Forest 91 972 50 (52) 51 (37) 53 (9) 52 (2)
Northwest Territories Yellowknife 176 51 (100)
Northwest Territories Forest Activity Zone 467 54 (100)
Nunavut Arctic 198 915 56 (64) 57 (25) 55 (11)
Nunavut Northern Forest 9 892 58 (100)
nrcangccaforests
For more information about the Canadian Forest Service visit our website at nrcangccaforests or contact any of the following Canadian Forest Service establishments
Canadian Forest Service Contacts
Atlantic Forestry Centre PO Box 4000 Fredericton NB E3B 5P7 Tel (506) 452-3500 Fax (506) 452-3525 nrcangccaforestsresearch-centresafc13447
Atlantic Forestry Centre ndash District Office Sir Wilfred Grenfell College Forestry Centre University Drive Corner Brook NF A2H 6P9 Tel (709) 637-4900 Fax (709) 637-4910
Laurentian Forestry Centre 1055 rue du PEPS PO Box 3800 Sainte-Foy PQ G1V 4C7 Tel (418) 648-5788 Fax (418) 648-5849 nrcangccaforestsresearch-centreslfc13473
Great Lakes Forestry Centre PO Box 490 1219 Queen St East Sault Ste Marie ON P6A 5M7 Tel (705) 949-9461 Fax (705) 759-5700 nrcangccaforestsresearch-centresglfc13459
Northern Forestry Centre 5320-122nd Street Edmonton AB T6H 3S5 Tel (403) 435-7210 Fax (403) 435-7359 nrcangccaforestsresearch-centresnofc13485
Pacific Forestry Centre 506 West Burnside Road Victoria BC V8Z 1M5 Tel (250) 363-0600 Fax (250) 363-0775 nrcangccaforestsresearch-centrespfc13489
Headquarters 580 Booth St 8th Fl Ottawa ON K1A 0E4 Tel (613) 947-7341 Fax (613) 947-7396
Canadian Wood Fibre Centre A virtual research centre of the Canadian Forest Service Natural Resources Canada nrcangccaforestsresearch-centrescwfc13457
1
2
3
5
6
4
1
25
3 6
4
1
To order publications online visit the Canadian Forest Service Publications website at
cfsnrcangccapublications
Canadarsquos National Deforestation Monitoring System System DescriptionInformation Report BC-X-439
1
1 Introduction Forest cover in Canada is estimated to be 35 million km2 Canadarsquos forests have long been managed to provide goods and services valued by society This management has included the temporary clearing for forest products and sometimes the permanent clearing of land for cultiva-tion settlement or other uses Deforestation is defined as ldquothe direct human-induced conversion of forested land to non-forested landrdquo (United Nations Framework Convention on Climate Change 2002)
Knowing the amount of deforestation and where when and why it occurs is important for several reasons Forests around the world are coming under increasing pressure as human populations grow and the footprint of human civili-zation expands This pressure is relatively modest in Canada but nevertheless must be taken into consideration
The need to rigorously monitor and report on deforesta-tion in Canada increased when Canada became party to the United Nations Framework Convention on Climate Change (UNFCCC) Deforestation releases carbon stored in forest vegetation as CO2 and other greenhouse gases (GHG) and is a globally significant source of greenhouse gas emissions especially in the tropics (Pan et al 2011 Le Queacutereacute et al 2014) The UNFCCC obliges countries to report their emissions on an annual basis The Montreal Process an international agreement on criteria and indicators for conservation and sustainability of forests also highlights the maintenance of forest area as an important criterion of sustainable forest management (Montreal Process 2009)
The Canadian Forest Service is the national and interna-tional voice for the Canadian forest sector The organiza-tion provides science and policy expertise and advice on national forest sector issues working in close collaboration with the provinces and territories As a part of this role the Canadian Forest Service develops information and knowledge of Canadarsquos forest resources Thus in 2000 work began on the design of a National Deforestation Monitor-ing System (NDMS) with pilot projects starting in 2002 At the same time a new plot-based National Forest Inven-tory (Gillis et al 2005) was being implemented It uses a systematic grid of sample cells and an approach similar to this was desirable for the NDMS The first national defores-tation monitoring results were produced in 2005 and the NDMS has been producing updated results on an annual basis ever since These results are published annually in Canadarsquos national greenhouse gas inventory reports to the UNFCCC (Environment Canada 2006 2014) are summa-rized in Canadarsquos State of the Forest Reports and have also contributed to reports published in the scientific literature (eg Masek et al 2011 Kurz et al 2013)
Although the NDMS is used to conduct Canadarsquos estima-tion process and maintain the national deforestation data-base other national and provincial-level initiatives have an interest in deforestation estimates (eg the National Forest Inventory the Canadian Forest Service Carbon Accounting Team Agriculture and Agri-Food Canada and Environment Canada) The NDMS has close links with these programs
This report provides an overview and description of the NDMS The system is described as it has been imple-mented for calculations of deforestation up to the annual report of 2015 The report also includes the original system requirements the overall system design and details of the system implementation
2 System Requirements and DefinitionsThe NDMS exists to serve information needs beyond national greenhouse gas inventory reporting but the strict reporting requirements of the UNFCCC guided the systemrsquos design and implementation The UNFCCC require-ments are set by good practice guidance (GPG) provided by the Intergovernmental Panel on Climate Change (IPCC) (Intergovernmental Panel on Climate Change 2003) which helps countries meet forest monitoring and reporting chal-lenges presented by the UNFCCC
21 Definitions
Several basic terms were given precise definitions fol-lowing the general guidelines provided by the UNFCCC including ldquoforestrdquo ldquodeforestationrdquo and ldquoland use categoriesrdquo
211 Forest
Forest is defined for the purposes of national monitoring in Canada as a minimum area of land of 1 ha with tree crown cover of more than 25 and with trees having the potential to reach a minimum height of 5 m at maturity in situ Young natural stands and all plantations that have yet to reach a crown density of 25 or tree height of 5 m are included as are areas that normally form part of the forest area which are temporarily un-stocked as a result of human intervention such as harvesting or natural causes but that are expected to revert to forest (United Nations Framework Convention on Climate Change 2002 Environment Canada 2006)
The above definition was adopted by Canada for UNFCCC reporting purposes in 2003 working within the parameters agreed to in the Marrakesh Accords (UNFCCC Decision 11CP7) This definition is different from that used by the Food and Agriculture Organization of the United Nations ldquoLand spanning more than 05 hectares with trees higher than 5 meters and a canopy cover of more than 10 per cent
Canadian Forest Service | Pacific Forestry Centre | nrcangccaforestsresearch-centrespfc134892
or trees able to reach these thresholds in situ It does not include land that is predominantly under agricultural or urban land userdquo (Food and Agriculture Organization 2001) The density parameter is the most important difference and Canada reports areas with 10ndash25 tree cover as ldquoother wooded landrdquo The difference is most relevant in Canadarsquos northern forest
212 Deforestation
Deforestation is defined by the UNFCCC as ldquothe direct human-induced conversion of forested land to non-forested landrdquo (United Nations Framework Convention on Climate Change 2002) The term ldquodeforestationrdquo is some-times used elsewhere to refer more broadly to forest cover loss whether temporary or permanent human-induced or natural The NDMS tracks direct human-induced forest land use change It provides clarity that is useful for policy analysis (eg Lempriegravere et al 2013) by identifying perma-nent conversion of forest land and distinguishing it from temporary forest cover loss related to forest management or natural forest cover dynamics such as wildfire or insect damage (Kurz 2010) Thus temporary change in land cover such as tree harvesting is not classified as deforestation Non-anthropogenic land cover changes such as naturally occurring landslides are also not considered deforesta-tion as these events are not caused by humans they are relatively rare in any case
Detailed specifications regarding shape size and configu-ration of forest and deforestation events used for deforesta-tion mapping are found in the Deforestation Interpretation Guide (Leckie et al 2012) For linear deforestation events (eg roads and right-of-ways) a minimum cleared width of 20 m is used Therefore narrow linear disturbances are not reported by the NDMS Also loss of areas having sparse tree cover is not reported because of the defined require-ment of 25 tree crown cover
213 Land Use Categories
The UNFCCC employs six land use categories defined under the IPCCrsquos good practice guidance (Intergovernmen-tal Panel on Climate Change 2003) to help report on and understand the dynamics of land use land use change and carbon emissions
1 forest land
2 cropland
3 grassland
4 wetlands
5 settlements
6 other land
Although more detailed information on land transitions is needed for other applications the NDMS must at a mini-mum be able to provide information on land use transi-tions from forest to the other five categories
3 System DesignThe NDMS uses a sampling approach with mapping and detection from satellite imagery informed by records-based information and expert knowledge to provide information about the amount of deforestation and why where and when it occurred in Canada Land use changes are interpreted manually by expert interpreters who use all available evidence to support their interpretation This design was adopted to provide the most detailed possible estimates of deforestation rates through time given avail-able resources
A full-area annual detection and mapping of all deforesta-tion events in Canada is neither practical nor necessary It is not practical because the task of finding on the order of 500 km2 of deforestation every year in a country with 35 million km2 of forest and up to 10 000 km2 of harvest per year would be prohibitively expensive and manual interpretation is needed to reliably distinguish deforesta-tion events from non-permanent forest cover change such as harvest Spatial and temporal sampling strategies can be used to provide the necessary information Practical implementation considerations associated with sampling were recognized early and factored into the NDMS
In addition to the amount of deforestation the NDMS was designed to provide three types of information
1 where deforestation occurred (spatial location shape and topology)
2 when deforestation occurred (the year or years during which forest clearing occurred) and
3 why deforestation occurred (the classes of post-deforestation land use)
It also provides information on the type of forest being re-moved The NDMS maintains a high level of detail in order to make its data as widely useful as possible
Canadarsquos National Deforestation Monitoring System System DescriptionInformation Report BC-X-439
3
31 Where Deforestation Has Occurred
The NDMS was designed to produce national and sub-national outputs Sub-national reporting units were cre-ated in collaboration with scientists involved in the design and implementation of Canadarsquos National Forest Carbon Monitoring Accounting and Reporting System (Kurz and Apps 2006) the Canadian Agricultural Greenhouse Gas Monitoring Accounting and Reporting System team of Agriculture and Agri-Food Canada and Canadarsquos national greenhouse gas inventory reporting system (Environment Canada 2006) This allows NDMS outputs to be integrated seamlessly by all of these systems
Deforestation mapping is done within sample cells The mapping data from all sample cells are compiled in an ArcGIS database and then input into an estimation process that produces data at the scale of reconciliation units and
reporting zones (see Figure 1) The reconciliation units are common areas that are used by the teams listed above to summarize information Environment Canada reports greenhouse gas emissions and removals in reporting zones The reporting zone boundaries follow the bound-aries of the Terrestrial Ecozones of Canada (Ecological Stratification Working Group 1996) with some additional stratification to distinguish eastern and western portions of the largest ecozones (Taiga Shield and Boreal Shield) and to distinguish two different portions of the Prairies ecozone (Subhumid Prairies and Semiarid Prairies) (McGov-ern 2008) The reconciliation unit boundaries follow the geographic intersection of the reporting zone boundaries with provincial and territorial borders National estimates are calculated by summing reporting zone deforestation estimates
Figure 1 Deforestation reconciliation units and reporting zones in Canada For international reporting purposes Environment Canada compiles NDMS results for each reconciliation unit (RU identified by number) and summarizes them for each reporting zone (RZ identified by colour)
Canadian Forest Service | Pacific Forestry Centre | nrcangccaforestsresearch-centrespfc134894
Table 1 Deforestation post-land use classes During interpretation deforestation events are attributed according to their post-deforestation land use type classes and subclasses (post classes and modifiers)
Post class Post-class modifiers
Agriculture (AG) Crop pasture farm yard
Artificial Lake (AL) Agriculture pond golf course related water body recreational water body pond in rural residen-tial setting pondsmall lake in developed urban setting agriculture effluent pond industrial efflu-ent pondholding pond mining tailingwaste pond oil and gas related water body hydroelectric floodingreservoir (cleared forest) hydroelectric floodingreservoir (standing forest)
Corridor (CR) Hydro line (mainsecondarytertiaryother minor) pipeline (mainsecondarytertiaryother minor) cut line railway airstrip undifferentiated corridor
Open Field (OF) Agricultural setting industrial setting recreational setting mine setting mine facility setting oil and gas facility setting pit and quarry setting oil sands setting rural residential setting urbansuburban setting undifferentiated field
Industrial (IN) Heavy industrial light industrial oil sands infrastructure oil and gas infrastructure mine heavy mine light well pad hydro infrastructure
Recreational (RC) Campground golf course ski areas playing field undifferentiated recreational
Road (RD) General road (mainsecondarytertiary) forestry road (mainsecondarytertiary) oil and gas road (mainsecondarytertiary) mine related road (mainsecondarytertiary) hydroelectric related road (mainsecondarytertiary)
Soil Disturbance (SD) Open pit mine logging landing landfill oil sands extraction peat extraction gravel pitquarry rock slide scar (human induced) undifferentiated soil disturbance
Rural Residential (RR) Many trees remaining (residual tree cover 25ndash75) few trees remaining (residual tree cover lt 25)
Urban Residential (UR) Many trees remaining (residual tree cover 25ndash75) few trees remaining (residual tree cover lt 25)
32 When Deforestation Has Occurred
The NDMS provides information about when deforestation occurred by establishing deforestation mapping periods Image data for deforestation mapping are obtained as close to the time period bounding dates as possible The dates of these images are considered ldquocore datesrdquo Defor-estation events are detected and mapped by interpreting changes between these core date images The mapped events are then used to compute deforestation rates for the period These rates are interpolated and in some cases extrapolated to produce estimates of annual deforestation trends When the timing of large deforestation events is known these are processed separately and added to the trend results after interpolation
The NDMS provides estimates of deforestation rates from 1970 onwards in part to accommodate the needs of Canadarsquos UNFCCC reporting Although international UN-FCCC reporting addresses greenhouse gas emissions and removals since 1990 deforestation events that occurred before 1990 contribute to emissions in 1990 and after Deforestation causes both immediate and delayed residual greenhouse gas emissions Immediate emissions are those that occur when forest cover is cleared such as the burn-
ing of discarded biomass and are accounted for in that year Residual emissions which can continue for up to 20 years after the deforestation event are the result of long-term decay of discarded biomass and dead organic matter (Intergovernmental Panel on Climate Change 2003) and are estimated and incorporated in each yearrsquos emissions for 20 years as forest land converted to the post-conversion category
33 Why Deforestation Has Occurred
The NDMS provides information about why deforestation occurred by recording the new land uses that are found where deforestation has been detected and mapped For each mapped deforestation event interpreters record both the type of forest that was present before the change (pre-type) and the new land use that followed (post class) The pretype is described in terms of forest age class density class and cover type (see Appendix 1) It provides insight into the type of forest being converted and is input into the Carbon Budget Model of the Canadian Forest Sector (CBM-CFS3 Kurz et al 2009) for calculating emissions The post class which identifies the new land use is recorded using the categories shown in Table 1
Canadarsquos National Deforestation Monitoring System System DescriptionInformation Report BC-X-439
5
These deforestation post classes can be aggregated in dif-ferent ways according to user need Table 2 provides an ex-ample of post class grouping into industrial categories and good practice guidance land use categories For example within the deforestation post class ldquocorridorrdquo (CR) the modi-fier code further distinguishes events such as hydroelectric lines (CRhm) from pipelines (CRpp) so that the former can
be aggregated into the ldquohydro infrastructurerdquo industrial category and the latter aggregated into the ldquooil and gasrdquo industrial category Both of these examples are classified as settlements (SL) under the good practice guidance land use categorization scheme Appendix 2 provides a detailed listing of all post classes and modifier codes and how they translate to good practice guidance land use categories
Table 2 Deforestation post class aggregation Post classes are cross-referenced to industrial and good practice guidance classes (Intergovernmental Panel on Climate Change 2006) by means of post-class modifiers ldquoXrdquo indicates the presence of modifiers available within each post class
Good practice guidance class
Crop-land (CL) Wetlands (WL) Settlements (SL)
Industrial categories
Agric
ultu
re
Floo
ded
stan
ding
fore
st
Hyd
ro re
serv
oir
Peat
min
ing
Fore
stry
Hyd
ro in
fras
truc
ture
Indu
stry
Min
ing
Mun
icip
al
Oil
and
gas
Recr
eatio
n
Tran
spor
tatio
n
Def
ores
tatio
n po
st c
lass
Agriculture AG X
Artificial Lake AL X X X X X X X X
Corridor CR X X X X
Industrial IN X X X X
Open Field OF X X X X X X
Recreational RC X
Road RD X X
Rural Residential RR X
Soil Disturbance SD X X X X X
Urban Residential UR X
Canadian Forest Service | Pacific Forestry Centre | nrcangccaforestsresearch-centrespfc134896
Figure 2 Deforestation strata units and sampling framework Canada is stratified into types of land that have distinct patterns and rates of deforestation Deforestation mapping has been completed in the areas indicated by shading
The pretype and post class attributes are used for a range of applications including the calculation of greenhouse gas emissions in the CBM-CFS3 (Kurz et al 2009) Because of different type and carbon density of the forest being removed and different treatment and fate of woody debris and soil carbon for deforestation to different land uses some land use transitions result in differing amounts and rates of greenhouse gas emissions than others even when removing similar forest Therefore it is important to have the pretype and post class information available for input into emissions estimation and analysis tools
4 ImplementationDeforestation monitoring begins with visual interpreta-tion of satellite imagery Data are collected from relevant sources to support the work of expert interpreters who use all available lines of evidence to map and attribute de-forestation events Mapped deforestation events in sample
cells within a stratified sampling approach are compiled in a GIS database and used to estimate deforestation rates by scaling from sample to national estimates
A systematic sequence of operational steps is followed whereby mapping work is broken up into work or project packages for completion by in-house Canadian Forest Service technical staff provincial partners or contractors and then passed through a series of quality control checks before being included in the compilation and estimation procedures (see Section 51 for more details)
41 Stratification and Sampling
Deforestation mapping is guided by the stratification of the Canadian landscape into units of land having similar patterns and rates of deforestation (Figure 2) This stratifica-tion is done so that sampling effort can be directed where it is most needed Sampling rates are set for each stratum according to intelligence about deforestation activity
Canadarsquos National Deforestation Monitoring System System DescriptionInformation Report BC-X-439
7
The deforestation strata were created incorporating infor-mation from ecozone locations forest tenure boundaries known and interpreted land use and landscape patterns and provincial and territorial boundaries The strata are fur-ther refined into ldquodeforestation strata unitsrdquo which are gen-erally the deforestation strata within a single reconciliation unit but sometimes within several adjacent reconciliation units Appendix 3 lists the deforestation strata units and gives their size and spatial relationship with reconciliation units More detailed discussion of the stratification process is provided by Leckie et al (2006a and 2006b) Hotspots are areas (strata units) of localized high deforestation activ-ity such as rapidly expanding urban areas Hotspots are delineated to exclude high-activity areas from the larger deforestation strata The deforestation rates in hotspots can be far greater than the levels observed in the larger strata and these areas should therefore be treated separately
The sampling density within each stratum varies depend-ing on a number of factors including the level of deforesta-tion activity and resource constraints A sampling rate of approximately 12 is obtained by establishing
35 times 35 km sample units (termed ldquocellsrdquo) at the intersec-tions of a regular 10 times 10 km grid This grid is aligned with the National Forest Inventoryrsquos 20 times 20 km grid A sampling rate of 6 is obtained by excluding every second cell as shown on the left side of red line in Figure 3 Higher sampling densities are used in strata where more precise estimates are needed When resources permit full-area mapping is conducted in some strata such as hotspots Leckie et al (in review) provide details on sample design considerations
The actual mapping is done on a scene basis and therefore gaps between scenes exist in some strata which reduces the sampling rate somewhat from the target rate These gaps are more common in some early mapping due to the fact that Landsat scenes were not free at that time In addition to focus efforts on regions of high deforestation a subset of some low-deforestation strata (eg forest activity strata of Quebec and Ontario (Figure 2)) was identified based on a systematic pattern of Landsat scene coverages and deforestation was then mapped in sample cells within the sub-area (eg for a 6 sample)
Figure 3 Sampling intensity in two different deforestation strata The sample cells in a stratum are collectively referred to as a sample ldquogridrdquo This example illustrates 6 sampling in the left stratum (blue grid) and 12 sampling in the right stratum (yellow grid)
Canadian Forest Service | Pacific Forestry Centre | nrcangccaforestsresearch-centrespfc134898
The sampling rate for a stratum is the proportion of the to-tal area examined divided by the total area of the stratum Total area examined is the area of the sample cells reduced by any area within them deemed non-interpretable owing to cloud shadow or lack of imagery which is generally less than 2 of the total area mapped
The sample coverage has been improving with more coverage in recent mapping periods in most deforestation strata (see Figures 4ndash6) The sample area is larger for map-
ping period P2 (1990ndash2000) and P3 (2000ndash2008) than for mapping period P1 (1975ndash1990) The P2 period has several large areas with full-area mapping The sample coverage for periods P1 P2 and P3 has likely stabilized at that shown in Figures 4 5 and 6 respectively This coverage was built up over time early national reporting of deforestation was derived from smaller sample coverages and indeed the P3 sample estimate was not introduced to the national deforestation report until 2010
Figure 4 Deforestation strata sampling rates for mapping period P1 (1975ndash1990)
Canadarsquos National Deforestation Monitoring System System DescriptionInformation Report BC-X-439
9
Figure 5 Deforestation strata sampling rates for mapping period P2 (1990ndash2000)
Figure 6 Deforestation strata sampling rates for mapping period P3 (2000ndash2008)
Canadian Forest Service | Pacific Forestry Centre | nrcangccaforestsresearch-centrespfc1348910
The total area of Canada covered by the sampled regions (ie the shaded area in Figure 2) in one or more time periods is 346 times 106 km2 This includes full-area map-ping for 56 times 105 km2 of hydro survey areas in northern Quebec and another 25 times 105 km2 in northern Manitoba in which only hydroelectric development deforestation was mapped Excluding hydro survey areas the area of the sample cells interpreted was 165 times 105 km2 in P1 409 times 105 km2 in P2 and 218 times 105 km2 in P3 The large sample area for P2 reflects the greater amount of full-area mapping
42 Data Sources and Information Collection
Remote sensing imagery is the most critical input to the process of deforestation monitoring In the NDMS image data are used to identify the location size and timing of events These data are also used to determine pre-existing forest types and subsequent post classes The NDMS em-ploys medium-resolution satellite imagery in combination with high-resolution satellite and air photo data wherever available Ancillary sources in the form of spatial data and non-spatial records are used to support the mapping process and act as supplementary sources for estimation and quality control
421 Core Image Data
Landsat is the primary data source for deforestation map-ping Landsat series satellites have been acquiring data since the early 1970s and provide a consistent data stream for all NDMS mapping periods with a spatial and spectral detail suitable for deforestation mapping The current Landsat instruments are medium-resolution sensors with 30 times 30 m pixels and a large image footprint (170 times 185 km) Each satellite has a return period of 16 days with continual image acquisition and scene sidelap that increases at higher latitudes
Landsat imagery formerly available for purchase was made freely available by the United States Geological Survey starting in January 2009 (Wulder et al 2012) For mapping done before 2009 data had to be purchased and thus image acquisition focussed on the basic summer data for core dates (circa 1975 1990 2000 and 2008) and winter imagery in more difficult-to-interpret regions For mapping done after 2009 more imagery was used and additional dates were added to help identify with more precision when deforestation events occurred and also help increase mapping confidence This new imagery was also used to review any previous mapping
422 Additional Image Data
Delineating deforestation boundaries can benefit from use of high-resolution imagery Higher-resolution data are also very useful in supporting the interpretation of pre-existing conditions and forest types and in confirming deforesta-tion and better identifying the post class and post-class modifier High-resolution imagery is therefore used to supplement core Landsat data wherever possible
Data are continuously being sought out by NDMS staff for example a 25 m resolution SPOT 5 panchromatic mosaic of the Prairies (circa 2006) was provided by Agriculture and Agri-Foods Canada and a 10 m SPOT 45 national coverage called GeoBase1 was obtained from the Centre for Topographic Information of Natural Resources Canada The SPOT 45 satellites offer a higher spatial resolution but provide fewer spectral bands than Landsat Various aerial photo data sets have been assembled through partner-ships with provincial governments and other agencies in-cluding National Air Photo Library imagery provincial aerial photography and high-resolution satellite image data sets
Google Earthtrade and Bing Mapstrade are a valuable resource with an ever-expanding selection of recent high-resolution imagery over population centres and many other regions of the country In some cases archives of older imagery (eg circa 2002) are also available and can be accessed through the Time Slider tool available in Google Earth Even current high-resolution imagery can help with the identification of events that occurred in an earlier time period
423 Ancillary Spatial Data
Ancillary data are also incorporated to support the inter-pretation process These data may be used to validate or confirm deforestation occurrence or to support the interpretation of prior forest type or post-change land use Some data types are available nationally whereas others are present only within limited extents Such data include GIS data sets of road networks hydrology wetlands wood-ed areas from provincial base maps pit and quarry licence areas forest inventories forest management tenure areas specialized oil and gas pipeline and well pad databases field oblique photos and other data
In addition to the satellite and aerial photo data described above Google Earthtrade offers further ancillary spatial data in the form of terrain display crowd-sourced Panoramiotrade photographs ground-based StreetViewtrade photography and other useful layers
1 See httpwwwgeobasecageobaseendataimageryimrindexhtml
Canadarsquos National Deforestation Monitoring System System DescriptionInformation Report BC-X-439
11
424 Records Data
Spatial and non-spatial records and activity data may also be incorporated into the estimation or quality control processes In early deforestation reports records and activity data were sometimes used to provide estimates of deforestation associated with a particular sector and area As more mapping was completed estimates from records were replaced by mapping-based information Records data used in the past have included hydroelectric clearing areas forestry road records and standard road class widths and oil and gas pipeline records
43 Mapping
Deforestation event mapping is done using core date im-agery and multi-band image products Mapping is broken up into units of mapping work called ldquoproject packagesrdquo to be completed by internal staff provincial partners or qualified private sector contractors All relevant images and supporting data are assembled as a package for mapping in a particular area Detection interpretation digitization and attribution of individual deforestation events is done manually by trained interpreters according to the estab-lished NDMS methods in a standardized ArcGIS geodata-base (Leckie et al 2012)
431 Data Handling
Interpretation of deforestation events requires the detec-tion of change between pairs of images acquired at two ldquocore datesrdquo chosen to best represent the mapping time period start and end year (ie 1975 1990 2000 and 2008) Forest cover changes or potential events are highlighted using a multi-temporal display or ldquochange enhancementrdquo image created using the visible red band from two core dates of imagery When the mapping period end date image is displayed using the red image colour gun and the mapping period start image is displayed using green and blue the resulting image shows areas of vegetation loss as red In addition possible deforestation events can be detected by comparing the two core images directly Many changes besides deforestation can cause a difference between the images (eg forest harvest forest fires beaver dam flooding wind blowdown agricultural field changes and avalanches) so it is critical that a change event be confirmed as deforestation before it is mapped
Individual deforestation events are manually interpreted and identified delineated and attributed Figures 7 and 8 illustrate some of the data that are used in this process Landsat multiple band combinations at both core dates change enhancement higher-resolution imagery and field oblique aerial photographs
Figure 7 Examples of various Landsat satellite band combinations and change enhancements that may be used in the mapping process Note the change enhancement at right shows red triggers where vegetation loss or change has occurred Band combinations shown are normal colour rendition on left with colour infrared in the middle The right-hand column shows Landsat Thematic Mapper (TM) and Enhanced Thematic Mapper (ETM) bands 453 (ie the two near infrared bands and a red band) displayed as red green blue
Canadian Forest Service | Pacific Forestry Centre | nrcangccaforestsresearch-centrespfc1348912
Figure 8 Examples of supplemental data use Left Example of confirmed and interpreted events (red and yellow lines) shown as polygons on the SPOT imagery (25 m resolution SPOT 5 top left and 10 m SPOT 4 bottom left) Right Example of flight path and oblique aerial photograph from a deforestation field verification campaign
Typically the interpretation process is conducted in a GIS environment where change enhancement and single-date images can be layered and compared by blinking or using the swipe tool Georeferenced ancillary imagery can be simultaneously displayed and a link between ArcGIS and Google Earth allows the synchronization of spatial display extents in both programs
432 Project Packages
Project packages are units of mapping work They include specification of the mapping area time period to be mapped and the sample cells to be used Each project package contains a standardized geodatabase with pre-defined sets of values for some of the attribute fields core date and change enhancement imagery other imagery in-cluding winter and overlapping scenes from east and west of the scene being mapped additional SPOT and aerial photographs (if available) and ancillary data sets
Once the mapping has been completed for a project and passed successfully through quality control the data are added to the national geodatabase which carries all defor-estation mapping data for the country including all time
periods The structure of the project geodatabases mirrors the structure of the national geodatabase
433 Interpretation
Image interpretation is done manually on a cell-by-cell ba-sis Typically the change enhancement is used first to iden-tify change events These are then confirmed or refuted as deforestation by the interpreter using the individual core date images supported by other image and ancillary data The supporting data are used to assess whether an event area was forested before the change and whether the event meets the deforestation definition Supporting data are also used to help interpret pretype and post class
The boundary of a deforestation event is identified in the Landsat images but higher-resolution imagery is used in a supporting role to improve event boundary delineation Interpreters follow specific digitizing guidelines provided in the Deforestation Interpretation Guide (Leckie et al 2012) that dictate how events shall be mapped (eg digitize smooth lines rather than following pixel boundaries avoid gaps and overlaps between adjacent events keep the mapping topology clean etc)
Canadarsquos National Deforestation Monitoring System System DescriptionInformation Report BC-X-439
13
Deforestation events may be linear in form (eg roads hydro lines) or polygonal They are digitized accordingly as lines or polygons in the project geodatabase Specific guidelines apply for each type of feature Delineation fol-lows clearly defined situational rules (eg for compositemixed use polygons roads in cutblocks tertiary versus more significant roads episodic clearing etc) all of which are addressed in detail in the Deforestation Interpretation Guide When events extend beyond the boundaries of a sample cell they are delineated to the full extent of the event but only the portion inside the cell is included in the estimation
Event attributes are interpreted and recorded using attri-bute values defined in the NDMS data dictionary Pretype attributes include forest type density and maturity (see Appendix 1 for details) Post class attributes are listed in Table 2 (see Appendix 2 for details) Interpreters also record their level of confidence about each deforestation event (ie how confident they are that it was forest before the change and that it is indeed a new land use) Comment fields are used extensively to record details specific to each event These may indicate uncertainty in an event a request by the interpreter for specific review by the qual-ity control person or the need for checking the event in a later time period The widths for linear events (such as roads or corridors) are also recorded as it is more efficient to map these as lines and later convert to polygons using the width data during a subsequent processing stage
If mapping already exists for an earlier time period in the area the interpreter reviews it in the context of recent imagery either to confirm the previous interpretations or to note whether corrections are required Points are used to flag areas for revision or later review by analysts such as where older mapping may require updating
In some cases imagery available for a core date is contami-nated by clouds shadows or missing data at image edges In such cases the interpreter digitizes the contaminated area within the sample cells and saves the polygon into a special geodatabase layer for ldquonon-interpretable areardquo poly-gons and notes the affected date The areas saved into this layer are removed from the sample during later processing to create what is termed the ldquointerpretable gridrdquo The open-ing of the Landsat archive through free access to geocor-rected imagery has substantially reduced the amount of
non-interpretable area entering the estimate calculations For example sometimes images outside the core date can be used to infer deforestation in the non-interpretable area In fact recently non-interpretable areas have been almost eliminated from the process
A series of quality checks has been built into the mapping process these are completed in every mapping project Canadian Forest Service analysts conduct quality control checks of the mapped data (see Section 5) and return a set of quality control points to the interpreters indicating where more work and specific changes are needed before the mapping can be loaded into the national geodata-base
44 Deforestation Estimation
The mapping data from deforestation sample cells are used to estimate the area of deforestation in each RU by scaling up from sample to population in each defor-estation stratum and then summing the deforestation estimate for each stratum in an RU Scaling up is done for each land use type (post-class modifier) in each time period Temporal interpolation is used to compute annual deforestation rates Lastly large event mapping records and activity data and intelligence are used to refine the estimates when appropriate
441 GIS processing
The national deforestation geodatabase contains all the mapped areas representing deforestation events sampled within each time period as lines and polygons The geo-database also contains layers required for the estimation calculations including the sample grids the non-interpre-table areas the Landsat image boundaries (which define the core dates and areas sampled) the deforestation strata boundaries and the RU boundaries
The spatial data are first processed to prepare them for the scaling up analysis which is conducted later in a non-spa-tial database program (Section 444) Figure 9 provides a schematic of the tasks involved in the GIS processing (Burt et al 2006) The two main calculated outputs produced are the event and grid tables shaded in red in Figure 9 The processing of the mapped GIS data for the national sum-mary is performed for each time period
Canadian Forest Service | Pacific Forestry Centre | nrcangccaforestsresearch-centrespfc1348914
Figure 9 Simplified deforestation GIS processing flow Input tables are in green processes in yellow and output tables in red Gold arrows denote updates to a table The term ldquolinesrdquo refers to linear deforestation events ArcGIS commands are underlined
Canadarsquos National Deforestation Monitoring System System DescriptionInformation Report BC-X-439
15
The first of the output tables the ldquointerpretable gridrdquo (labelled grd_ident in Figure 9) defines the actual area for which mapping was done As a result the full set of sample cells is clipped by the extent of the Landsat imagery (thus removing portions of the cells that fall outside the Landsat image boundary) and has the non-interpretable areas (eg clouds) removed
The second table the ldquoFinal Event Polygonsrdquo (labelled py_fn) is created from the intersection of many input lay-ers The post-class modifier code for each event is carried through in these deforestation calculations The linear de-forestation events are converted to polygons by applying a buffer according to the width attribute associated with each line then combined with the other deforestation polygon events to create a complete polygonal coverage of all deforestation events mapped The events are then intersected with the interpretable grid layer Further inter-sections are applied to the boundary RU and deforestation strata layers to identify which strata and RU are associ-ated with each event In the end the data for each event include attributes drawn from all the intersected layers including the deforestation stratum and RU of each event As well small slivers created during the GIS processing steps are removed
At this stage it is possible to calculate the rate of deforesta-tion for each time period All events are assigned to the time period in which they occur (ie P1 [1975ndash1990] P2 [1990ndash2000] or P3 [2000ndash2008]) based on the core dates of imagery used for mapping For each event an effective annual rate of deforestation (hectares per year) is calculat-ed by dividing the deforested area by the number of years between the core dates Later in the process the resulting per-event annual rates are summed for each stratum and divided by the area of grid cells interpreted to determine the average annual rate for each time period and post-class modifier (Section 444)
To provide flexibility the mapping activity captures forest clearings that meet a more inclusive definition of defor-estation than strictly required Land conversion of sparse forest does not constitute deforestation (unless it is conver-sion of a recently disturbed or regenerating area) but is mapped for completeness unless otherwise specified The GIS processing steps are used to exclude such mapped events with sparse forest density
442 Large Events and Records Data
Certain types of events that are large uncommon and iso-lated (eg hydroelectric reservoirs new surface mines long and major hydroelectric lines etc) are better represented by complete mapping and census rather than sampling (Leckie et al [in review]) Such events termed ldquolarge eventsrdquo are mapped separately and completely using either core date imagery or imagery captured as close to the actual event dates as possible When large events fall within sample cells and thus are also captured by the sampling
these are excluded from the processing of sample data to avoid double-counting
Records and activity data when used for a given type of deforestation in a region (eg stratum) are added to the database and removed from the processing of sample data similar to large events (see Section 424)
443 Expert Intervention
After the mapping and GIS processing steps have been completed the initial estimation results are analyzed to identify potential problems With the nature of deforesta-tion in Canada and intensity of the sample occasionally spurious estimates may occur
Canadian Forest Service deforestation monitoring ex-perts have accumulated familiarity with land use change patterns and activities in Canada over many years These experts scrutinize NDMS estimation process outputs and investigate questionable outputs that may be then modi-fied if a change is justified
When suspicious estimation outputs are encountered ex-perts intervene by evaluating available records information and reconnaissance data For example when a particular event type is rare and sampling produces estimates that are unexpectedly high or low expert reviewers may scan available imagery to see what is occurring outside the sample cell boundaries (ie in the non-sampled area) and use this to inform expert intervention Estimation outputs may be deemed suspicious when they contradict previous estimates or other available lines of evidence All expert interventions are documented for transparency and in case they need to be reassessed as new evidence emerges (eg Leckie et al 2009 Leckie et al 2010)
444 Database Processing
Annualized national deforestation estimates are produced for each industrial sector and RU by combining the GIS data and any large event or recordsactivity data and incorporating expert interventions These data are loaded into a non-spatial database environment (Paradine 2007) The resulting estimates are used to produce customized re-ports for NDMS data users such as provincial government agencies Canadarsquos National Forest Carbon Monitoring Accounting and Reporting System for input to greenhouse gas emission estimation and others
The non-spatial part of the processing follows the work flow shown in Figure 10 The ratio of the area sampled (the ldquointerpretable gridrdquo) to the area of the stratum is calculated (labelled ldquo1rdquo in Figure 10) The area of deforestation in the sample is then scaled up by this proportion (labelled ldquo2rdquo in Figure 10) to produce the deforestation estimate for the stratum This process is repeated for all strata time periods and post classes (including post-class modifiers) using the mapped sample data only
Canadian Forest Service | Pacific Forestry Centre | nrcangccaforestsresearch-centrespfc1348916
Figure 10 Schematic of the deforestation database process used to produce estimates
Canadarsquos National Deforestation Monitoring System System DescriptionInformation Report BC-X-439
17
The expert intervention can be added at the strata level for a particular time period as an adjustment factor (labelled ldquo3rdquo in Figure 10) or as replacements or additions (labelled ldquo4rdquo in Figure 10) to existing data It can also be applied at the RU level (labelled ldquo7rdquo in Figure 10) Early national deforesta-tion reporting had more expert interventions because of lower sample rates less availability of high-resolution imagery and more use of records data over the remote sensing sample Currently few expert interventions occur with most occurring for the 1975ndash1990 time period which has a smaller sample
At the strata level the updated deforestation estimates by time period and post-class modifier are proportioned (labelled ldquo5rdquo in Figure 10) into their respective RUs (see Ap-pendix 3)
The data are then annualized The deforestation estimates for each time period (by post class and RU) are assigned
to the middle year of the time period (ie 1983 for 1975ndash1990 1995 for 1990ndash2000 and 2004 for 2000ndash2008) Annual trends are produced by applying linear interpola-tion between midpoints and extrapolation from endpoints (labelled ldquo6rdquo in Figure 10) Figure 11 provides one example
Large event mapping data records and activity data and expert interventions are applied as shown by the various green boxes in Figure 10 Large event data have the year of the event attached to them and are added to the mapping data at the RU level (labelled ldquo7rdquo in Figure 10) Records data also generally have a date attached and are added to the annualized data in a similar fashion to large event data
Figure 12 shows the trend line calculated in Figure 11 and the large event data (purple) representing hydro reservoir flooding facility construction and associated transporta-tion and hydro line corridors
Figure 11 Example deforestation trend produced using data from three mapping periods
Canadian Forest Service | Pacific Forestry Centre | nrcangccaforestsresearch-centrespfc1348918
Figure 12 Example of a deforestation area trend from sample mapping (red) and large events data (purple)
The post-class modifier classes (Table 1 and Table A21 in Appendix 2) are aggregated (labelled ldquo8rdquo in Figure 10) to the appropriate industrial category and good practice guidance class using a lookup table The various modifiers within each deforestation post class provide flexibility to summarize to different industrial categories based on user requirements (eg the categories used by the National For-est Carbon Monitoring Accounting and Reporting System and shown in Tables A21 and A22)
The result of the processing is a series of database tables A major product among these is the list of annual deforesta-tion area per RU per industrial class (labelled ldquo9rdquo in Figure 10) Another product is the breakdown of forest pretype percentages by RU this is done by calculating the percent-age area of each pretype mapped in the RU Reporting for the UNFCCC requires separate estimates of deforestation and greenhouse gas emissions for managed and unman-aged forest thus a separate table is produced for unman-aged forest (labelled ldquo10rdquo in Figure 10)
5 Quality ControlThree major quality control stages are applied during the deforestation mapping process
1 initial mapping quality control
2 revision quality checks and
3 overall quality assurance or vetting where a check on the final mapping data is performed
This multi-stage approach reduces the likelihood of errors and increases consistency of and confidence in the final product The data processing stage has further checks for data integrity After the data are calculated in the esti-mate process the final numbers and trends are assessed for changes from previous year estimates Deforestation estimates are also scrutinized by external users before they incorporate the data into their applications For an over-view of quality control practices see Dyk et al (2011)
51 Quality Control at the Mapping Stage
The mapping process flow is illustrated in Figure 13 includ-ing the quality control steps Typical errors caught through quality control at the mapping stage include incorrect event interpretations or delineations event omissions or commissions missing field values typographical errors and topology problems During the quality control phase an internal Canadian Forest Service reviewer performs detailed checks to ensure consistency with mapping and interpretation rules and returns a set of points to flag and describe the problem areas to the interpreter or contrac-tor These quality control points are stored in the mapping geodatabase as a permanent layer
Canadarsquos National Deforestation Monitoring System System DescriptionInformation Report BC-X-439
19
Figure 13 The deforestation mapping and quality control process flow
The mapping interpreter reviews these points and applies the recommended corrections to the working database The quality control points are sent to the interpreter early and frequently in the project timeline to reduce or avoid propagation of persistent errors or misunderstandings through the duration of the project
The original line and polygon mapping is preserved and re-visions are performed in separate ldquorevised linerdquo and ldquorevised polygonrdquo layers in the project geodatabase Information about the changes including what was done by whom and the date is added for every revised event Any deleted events are also retained in what are termed the ldquodrop lay-ersrdquo to mark the area as a non-deforestation event which is reviewed during future mapping
When the revised data are resubmitted to the Canadian Forest Service the data layers make clear what changes were requested and what changes were made The re-viewer uses these layers to verify that appropriate revisions were properly applied at all quality control points Any further errors or misunderstandings are communicated to the interpreter immediately for resolution At this stage the interpreter can also open a dialogue regarding specific events using additional comment fields in the quality control point layer or personal communication
The next level of quality control is the final vetting This audit step is conducted internally by senior Canadian For-est Service interpreters to ensure consistency of mapping across all projects All aspects of the new data are reviewed during this stage omission and commission errors delinea-
tion and attribution In addition the older mapping data are scanned to ensure newer imagery confirms the original interpretation A set of ldquovet revisionrdquo points is created to mark all adjustments required in the database An analyst works through these point by point to make the necessary changes noting any complex or uncertain events and communicating directly with the vetting interpreter when necessary
Field validation is a desirable aspect of the revision process but is not included during the mapping stage In general field campaigns are conducted on an ongoing basis when resources permit Areas where local knowledge or ground truth information are needed to clarify the interpretation are identified from the interpreter confidence records or the revision point data Dedicated field programs schedule air or ground visits to high-impact and low- to moderate-confidence events Local experts sometimes provide information about ground conditions that can be used to verify and update the database
Throughout the entire mapping and revision process an internal ldquoproject storyrdquo is maintained by the Canadian For-est Service This document summarizes activity on a given project including staff and contractors involved dates and actions completed It also includes detailed explanation of any complex situations or vet revisions as well as notes on any issues raised by the quality control or vetting interpret-ers To maintain consistency analysts who are involved in revisions or who vet revisions read this project story before starting work
Canadian Forest Service | Pacific Forestry Centre | nrcangccaforestsresearch-centrespfc1348920
52 Quality Control at the Data Processing Stage
Once revisions are vetted final data integrity checks are conducted on the project database to find and correct any technical errors such as missing attributes mismatched post classes and modifiers incorrect or reversed event dates inappropriate line widths topology errors overlaps and duplicates and typos This stage is partially automated The final mapping layers can be loaded into the national database only after the integrity checks have been com-pleted
Data quality checks are built into the script that automates the data processing stages The script both delivers reports to the screen while running and dumps to log files which are reviewed by Canadian Forest Service staff to ensure the runs were successful
Transfer of the final GIS tables into the non-spatial defor-estation database is also automated The grid and event tables for each time period are checked before load-ing and the number of records loaded is recorded and compared with previous runs to highlight any potential discrepancies
The database queries and tables used to create the annual estimates by industrial category and RU are controlled by Microsoft Access macros to ensure consistency between the runs
53 Quality Control at the Output Analysis Stage
Following generation of the estimate tables the main out-puts (annualized deforestation by industrial class and RU pretype table and unmanaged forest table) are evaluated closely by Canadian Forest Service experts to ensure that estimates have been calculated properly and that discrep-ancies from previously calculated values can be explained To aid in this effort a comparison spreadsheet is created for each RU showing the deforestation estimates by indus-trial class for the current and previous yearrsquos national run together with illustrations and statistics The experts scru-tinize the data for changes and ensure the new estimates are consistent with the input mapping data Any specific issues and special adjustments required are documented in a report that becomes part of the record for each yearrsquos estimate
54 External Quality Control
Users of the deforestation estimates conduct their own reviews of the data prior to use in their systems and com-municate any issues before incorporating the data into their own business processes When new issues arise these are dealt with and the NDMS quality control processes are updated to catch similar issues in the future
6 ConclusionsDeforestation is the direct human-induced conversion of forested land to non-forested land use The NDMS was de-signed and implemented to provide information needed by Canada to meet its obligation under the UN Frame-work Convention on Climate Change to report the areas affected annually by deforestation Also considered was the need to provide information useful for policy analysis land management and forest stewardship applications Understanding why where and when deforestation occurs is a prerequisite to the development of appropriate policy instruments to optimize land use develop mitigation strat-egies and address cumulative impacts on forest resources
The NDMS uses manual mapping from a satellite remote sensing sampling system informed by records-based information and expert knowledge to provide information about deforestation in Canada The remote sensing map-ping is supported by available ancillary information such as high-resolution imagery forest inventory road networks and other industrial databases Certain types of events that are large and isolated (eg mine and hydroelectric devel-opments) are mapped and incorporated separately in the overall deforestation estimates Occasionally records and activity data on land use changes are incorporated when they are deemed more appropriate than the sampling es-timate The mapping results from the sample are scaled up to regional levels In the data processing stage these data are merged and annualized to produce national deforesta-tion estimates
The system has been used and improved over the last 10 years The flexibility of the NDMSrsquos design makes it possible to adapt to future changes in image sources ancillary data resource availability and user needs and positions the pro-gram well for long-term maintenance and improvement
Canadarsquos National Deforestation Monitoring System System DescriptionInformation Report BC-X-439
21
7 References
Burt W Paradine D Leckie D 2006 Geographic Information system processing of deforestation mapping data for estimating deforested area of Canada Natural Resources Canada Canadian Forest Service Pacific Forestry Centre Victoria BC Report DRS-P-001
Dyk A Tinis S Leckie D 2011 National Inventory Report 2011 Deforestation area estimation for Canada Quality con-trol overview Natural Resources Canada Canadian Forest Service Pacific Forestry Centre Victoria BC Report DRS-N-031
Ecological Stratification Working Group 1996 A national ecological framework for Canada Agriculture and Agri-Foods Canada Research Branch Centre for land and Biological Resources Research and Environment Canada State of the Environ-ment Directorate Ottawa Ont
Environment Canada 2006 National Inventory Report 1990ndash2004 Greenhouse gas sources and sinks in Canada Govern-ment of Canada Submission to the UN Framework Convention on Climate Change httpunfcccintnational_reportsannex_i_ghg_inventoriesnational_inventories_submissionsitems3734php (Accessed August 2014)
Environment Canada 2014 National Inventory Report 1990ndash2012 Greenhouse gas sources and sinks in Canada Govern-ment of Canada Submission to the UN Framework Convention on Climate Change Report issued by Pollutant Inventories and Reporting Division Environment Canada Ottawa Onthttpunfcccintnational_reportsannex_i_ghg_inventoriesnational_inventories_submissionsitems8108php (Accessed August 2014)
Food and Agriculture Organization 2006 2001 Global forest resources assessment 2000 main report United Nations Food and Agriculture Organization Rome Italy FAO Forestry Paper 140
Gillis M Omule A Brierley T 2005 Monitoring Canadarsquos forests The National Forest Inventory Forestry Chronicle 81(2)214ndash221
Intergovernmental Panel on Climate Change 2003 Good practice guidance for land use land-use change and forestry Penman J Gytarsky M Hiraishiet T et al (eds) Institute for Global Environmental Strategies Hayama Japan
Intergovernmental Panel on Climate Change 2006 2006 IPCC guidelines for national greenhouse gas inventories Egg-leston HS Buendia L Miwa K Ngara T Tanabe K (eds) Intergovernmental Panel on Climate Change National Green-house Gas Inventories Programme Institute for Global Environmental Strategies Hayama Japan httpwwwipcc-nggipigesorjppublic2006gl (Accessed January 2015)
Kurz W 2010 An ecosystem context for global forest cover loss estimates Proceedings National Academy of Sciences 107(20)9025ndash9026
Kurz W Apps M 2006 Developing Canadarsquos national forest carbon monitoring accounting and reporting system to meet the reporting requirements of the Kyoto Protocol Mitigation and Adaptation Strategies for Global Change 11(1)33ndash43
Kurz W Dymond C White T Stinson G Shaw C Rampley G Smyth C Simpson B Neilson E Trofymow J Metsaranta J Apps M 2009 CBM-CFS3 A model of carbon-dynamics in forestry and land-use change implementing IPCC standards Ecological Modelling 220(4)480ndash504
Kurz W Shaw C Boisvenue C Stinson G Metsaranta J Leckie D Dyk A Smyth C Neilson E 2013 Carbon in Canadarsquos boreal forest A synthesis Environmental Reviews 21260ndash292
Canadian Forest Service | Pacific Forestry Centre | nrcangccaforestsresearch-centrespfc1348922
Leckie D Dyk A Ortlepp S Tinis S 2010 Records of decision for Canadarsquos national deforestation estimate 2011 Natu-ral Resources Canada Canadian Forest Service Pacific Forestry Centre Victoria BC Report DRS-N-029
Leckie D Dyk A Paradine D Tammadge D Tinis S 2012 Deforestation interpretation guide Natural Resources Canada Canadian Forest Service Pacific Forestry Centre Victoria BC Report DRS-M-030
Leckie D Dyk A Tinis S 12009 Records of decision for Canadarsquos national deforestation estimate Natural Resources Canada Canadian Forest Service Pacific Forestry Centre Victoria BC Report DRS-N-026
Leckie D Paradine D Burt W 2006a Mapping sample coverage for Canadarsquos national deforestation estimate 2006 Natural Resources Canada Canadian Forest Service Pacific Forestry Centre Victoria BC Report DRS-N-002
Leckie D Paradine D Tinis S 2006b Geographic strata for Canadarsquos national deforestation estimates report Natural Resources Canada Canadian Forest Service Pacific Forestry Centre Victoria BC Report DRS-Q-003
Leckie D Paradine D Kurz W Magnussen S [2015] Deforestation mapping sampling designs for Canadian land-scapes Natural Resources Canada Canadian Forest Service Victoria BC In review
Lempriegravere T Kurz W Hogg E Schmoll C Rampley G Yemshanov D et al 2013 Canadian boreal forests and climate change mitigation Environmental Reviews 21(4)293ndash321
Le Queacutereacute C Peters G Andres R Andrew R Boden T et al 2014 Global carbon budget 2013 Earth System Science Data 6689ndash760
Masek J Cohen W Leckie D Wulder M Vargas R de Jong B Healey S Law B Birdsey R Houghton R Mildrexler D Goward S Smith W 2011 Recent rates of forest harvest and conversion in North America Journal of Geophysical Research 116G00K03
McGovern M 2008 Reporting zones GHG spatial reporting structure for Canada 2008 Environment Canada Greenhouse Gas Division Ottawa Ontario
Montreal Process 2009 Criteria and indicators for the conservation and sustainable management of temperate and boreal forests Fourth edition httpwwwmontrealprocessorgdocumentspublicationsgeneral2009p_4pdf (Accessed January 2015)
Pan Y Birdsey RA Fang J et al 2011 A large and persistent carbon sink in the Worldrsquos forests Science 333988ndash993
Paradine D 2007 National Inventory Report 2008 ACCESS database description GIS processing description and consoli-dated GIS database description Natural Resources Canada Canadian Forest Service Pacific Forestry Centre Victoria BC Report DRS-N-019
United Nations Framework Convention on Climate Change 2002 Conference of the PartiesndashReport of the Confer-ence of the Parties on its seventh session held at Marrakesh from 29 October to 10 November 2001 United Nations Office Geneva Switzerland httpunfcccintresourcedocscop713pdf (Accessed January 2015)
Wulder M Masek J Cohen W Loveland T Woodcock C 2012 Opening the archive How free data has enabled the science and monitoring promise of Landsat Remote Sensing of Environment 1222ndash10
Canadarsquos National Deforestation Monitoring System System DescriptionInformation Report BC-X-439
23
Appendix 1 Pretype Forest Conditions
The tables below list the approved forest type density and maturity values applied in deforestation mapping Note not all combinations are valid particularly those that include recent disturbance and regeneration terms Table A11 lists the ac-ceptable parameter combinations
The most common pretype groupings found are the 36 combinations of three Type classes (B C and M) three Density classes (D O and S) and four Maturity classes (R Y I and M) The two older Maturity classes (O and G) require additional verification to identify them Several classes identify recently disturbed forests (K X and R)
Table A11 Pre-change forest type descriptors
TYPE Definition Restrictions of use
B Broadleaf gt 75 of trees are broadleaf (Angiospermae)
C Conifer gt 75 of trees are conifer (Coniferae)
M Mixed gt 25 of both broadleaf and conifer present
K Clearcut Exposed ground and (or) ground vegetation No visible regeneration
Use only with S or N density and Q maturity
X Burn Exposed ground and (or) ground vegetation No visible regen-eration May have live residual trees up to 25 crown closure
Use only with S or N density and Q maturity
R Regen Regenerating areas with lt 25 crown closure where the forest composition (B C or M) is not identifiable
Table A12 Pre-change forest density descriptors
DENSITY Definition Restrictions of use
D Dense gt 60 crown closure
O Open 25ndash60 crown closure
S Sparse 5ndash25 crown closure
N Nil lt 5 crown closure Use only with K and X pretype
Table A13 Pre-change forest maturity descriptors-
MATURITY Definition Restrictions of use
Q Recent disturbance No visible regeneration Use only with K and X pretype
R Regen Forest stands 0ndash14 years old
Y Young Forest stands 15ndash25 years old
I Immature Forest stands 26ndash40 years old
M Mature Forest stands 41ndash80 years old
O Old Forest stands 81ndash200 years old
G Old-growth Forest stands over 200 years old Restricted to British Columbia only
Canadian Forest Service | Pacific Forestry Centre | nrcangccaforestsresearch-centrespfc1348924
Table A14 Valid combinations of pretype attributes (TypendashDensityndashMaturity)
Regen Broadleaf Mixed Coniferous
Dense RDR BDR MDR CDR
BDY MDY CDY
BDI MDI CDI
BDM MDM CDM
BDO MDO CDO
CDG
Open ROR BOR MOR COR
BOY MOY COY
BOI MOI COI
BOM MOM COM
BOO MOO COO
COG
Sparse RSR BSR MSR CSR
BSY MSY CSY
BSI MSI CSI
BSM MSM CSM
BSO MSO CSO
CSG
Burn Clearcut
Regen Broadleaf Mixed Coniferous
Disturbed XSQ KSQ
XNQ KNQ
Canadarsquos National Deforestation Monitoring System System DescriptionInformation Report BC-X-439
25
Appendix 2 Post-class Modifiers by Industrial Category
Table A21 lists all land use post-class deforestation modifiers They provide additional detail regarding what has occurred on the ground for each deforestation event These classes can be assigned to various industrial classes (see Table A22) Detailed definitions are provided in the Deforestation Interpretation Guide (Leckie et al 2012)
Table A21 Post class and post-class modifier codes and short descriptions grouped by industrial categorysector (in bold)
Post class Post class modifier
Agriculture
AG Agriculture ab bare
cp crop
fy farm yard
pa pasture
AL Artificial Lake aa agriculture pond
ea agriculture effluent pond
OF Open Field fa agriculture setting
Flooded Standing Forest
AL Artificial Lake ff flooded standing forest
Forestry
RD Road mf mainline forestry road
sf secondary forestry road
xf tertiary forestry road with width ge 20 m
SD Soil Disturbance ld logging landing
ss rock slide scar
Hydro Infrastructure
CR Corridor hm hydro linendashmain
hs hydro linendashsecondary
xy hydro linendashtertiary ge 20 m
IN Industrial ih hydro infrastructure
Hydro Reservoir
AL Artificial Lake hr hydroelectric flooding
Industry
AL Artificial Lake ei industrial effluent pond
IN Industrial hi heavy industrial
li light industrial
OF Open Field fi industrial
Canadian Forest Service | Pacific Forestry Centre | nrcangccaforestsresearch-centrespfc1348926
Post class Post class modifier
Mining
AL Artificial Lake em waste ponds for mining
IN Industrial mh mine heavy
ml mine light
OF Open Field fk mine facility
fm mine
fq pit and quarry
SD Soil Disturbance mn open pit mine
pq gravel pitquarry
Municipal
AL Artificial Lake ad pond urban setting
ar pond rural residential
ul other human caused
CR Corridor cl cut line
cu undifferentiated
OF Open Field fd urbansuburban
fr rural residential
uf undifferentiated field
RR Rural Residential rf few trees remaining
rm many trees remaining
SD Soil Disturbance lf landfill
su undifferentiated
UR Urban Residential df few trees remaining
dm many trees remaining
Oil and Gas
CR Corridor pp pipelinendashmain
ps pipelinendashsecondary
xp pipelinendashtertiary ge 20 m
IN Industrial oi oil sands industrial
op oil and gas industrial
wp well pad
OF Open Field fo oil and gas facility
fs oil sands open field
SD Soil Disturbance os oil sands
AL Artificial Lake eo oil and gas related pond
Canadarsquos National Deforestation Monitoring System System DescriptionInformation Report BC-X-439
27
Post class Post class modifier
Peat Mining
SD Soil Disturbance pm peat extraction
Recreation
AL Artificial Lake af golf course related
ap recreational water body
OF Open Field fc recreational field
RC Recreational ca campground
go golf course
ru other or undifferentiated
sk ski areas
Transportation
CR Corridor as airstrip
ry railway
RD Road mm main road clearly for a mine
mr main road
mo main road clearly for oil and gas
my main road clearly for hydroelectric
sm secondary mining road
so secondary oil and gas road
sr secondary road
sy secondary hydroelectric road
xm tertiary mining road with width ge 20 m
xo tertiary oil and gas road with width ge 20 m
xr tertiary road with width ge 20 m
xy tertiary hydroelectric road with width ge 20 m
Canadian Forest Service | Pacific Forestry Centre | nrcangccaforestsresearch-centrespfc1348928
Table A22 Aggregation of deforestation mapping classes to good practice guidance and industrial categories
Good practice guidance class
Crop-land (CL)
Wetlands (WL) Settlements (SL)
Industrial Categories
Agric
ultu
re
Floo
ded
stan
ding
fore
st
Hyd
ro re
serv
oir
Peat
min
ing
Fore
stry
Hyd
ro in
fras
truc
ture
Indu
stry
Min
ing
Mun
icip
al
Oil
and
gas
Recr
eatio
n
Tran
spor
tatio
n
Def
ores
tatio
n po
st c
lass
Agriculture AG ab cp pa fy
Artificial Lake AL aa ea ff hr ei emad ar of ul eo af ap
Corridor CR hm hs xy cl cu
pp ps xp as ry
Industrial IN ih hi li mh mloi op wp
Open Field OF fa fi fk fm fq fd fr uf fo fs fc
Recreational RC ca go fu sk
Road RDmf sf xf
mm mo mr my sm so sr sy xm
xo xr xy
Rural Residential RR rf rm
Soil Disturbance SD pm ld ss mn pq lf su os
Urban Residential UR df dm
Canadarsquos National Deforestation Monitoring System System DescriptionInformation Report BC-X-439
29
Appendix 3 Deforestation Strata Units and Reconciliation Unit InclusionTable A31 shows the names of the deforestation strata their area in kilohectares and the percentage of that area contained in each reconciliation unit that they overlap (sorted by reconciliation unit identification number see Figure 1 for unit loca-tion and name)
Table A31 Area of strata units and percent of strata unit area that is in each reconciliation unit
Deforestation strata unit name Strata unit area (kilohectares)
Reconciliation unit ( inclusion)
Newfoundland Eastern Woodlot 4 477 1 (100)
Newfoundland Forest Activity Zone 6 512 1 (100)
Newfoundland St Johns 55 1 (100)
Labrador Arctic 1 893 2 (100)
Labrador Northern Forest 23 238 3 (98) 4 (2)
Labrador Forest Activity Zone 4 620 4 (100)
Nova Scotia Eastern Woodlot 2 894 5 (100)
Nova Scotia Forest Activity Zone 2 396 5 (100)
Nova Scotia HalifaxDartmouth 182 5 (100)
Prince Edward Island 577 6 (100)
New Brunswick Eastern Woodlot 4 121 7 (100)
New Brunswick Forest Activity Zone 3 174 7 (100)
Quebec Arctic 20 443 10 (75) 9 (18) 8 (7)
Quebec Eastern Townships 3 948 11 (100)
Quebec Gaspe Forest Activity Zone 2 740 11 (100)
Quebec Southern RU12 2 968 12 (100)
Quebec Northern Forest 72 759 14 (73)15 (22) 13(5)
Quebec Forest Activity Zone 44 717 15 (100)
Quebec Ile DAnticosti 795 15 (100)
Quebec Lac St Jean 964 15 (100)
Quebec Southern RU15 1 687 15 (100)
Ontario Thunder Bay 225 16(100)
Ontario Southern 8 198 17 (100)
Ontario Manitoulin Island 326 17 (100)
Ontario Northern Forest 46 468 18 (56) 16 (43) 19 (1)
Ontario SudburyNorth Bay 874 19 (100)
Ontario Forest Activity Zone 42 398 19 (56) 16 (43) 18 (1)
Ontario Sault Ste Marie 536 19 (92) 17 (8)
Manitoba Forest Activity Zone RU22 East 2 405 22 (100)
Manitoba Forest Activity Zone RU22 North 6 109 22 (100)
Manitoba Prairie Fringe RU22 804 22 (100)
Manitoba Northern Forest 37 339 22 (43) 21 (35) 25 (19) 23 (3)
Manitoba Forest Activity Zone RU23 7 382 23 (100)
Manitoba Prairie Fringe RU23 3 970 23 (100)
Manitoba Hotspot 851 24 (100)
Manitoba North Prairie 6 117 24 (100)
Canadian Forest Service | Pacific Forestry Centre | nrcangccaforestsresearch-centrespfc1348930
Deforestation strata unit name Strata unit area (kilohectares)
Reconciliation unit ( inclusion)
Saskatchewan Northern Forest 21 224 27 (75) 26 (22) 28 (3)
Saskatchewan Prairie Fringe 5 509 28 (100)
Saskatchewan Inactive Forest Activity Zone 6 196 28 (58) 27 (42)
Saskatchewan Forest Activity Zone 8 189 28 (99) 27 (1)
Saskatchewan North Prairie 8 167 29 (100)
Saskatchewan Prairie 15 921 30 (100)
Alberta Northern Forest 10 862 31 (58) 34 (28) 32 (8) 33 (6)
Alberta Forest Activity Zone 22 066 34 (100)
Alberta Fort McMurray 807 34 (100)
Alberta High Level 789 34 (100)
Alberta Northwest Fringe 5 436 34 (100)
Alberta Prairie Fringe 6 038 34 (100)
Alberta North Prairie 7 397 35 (100)
Alberta RU 36 Forest Activity Zone 4 764 36 (100)
Alberta Palliser Triangle 3 689 37 (100)
Alberta Prairie West 4 522 37 (100)
British Columbia RU 38 6 759 38 (100)
British Columbia Prairie Fringe 2 333 39 (100)
British Columbia RU 40 19 220 40 (100)
British Columbia Lower Mainland East Vancouver Island
1 142 41 (100)
British Columbia RU 41 Forest Activity Zone 15 440 41 (100)
British Columbia VI QCI 3 813 41 (100)
British Columbia Okanagan 1 109 42 (100)
British Columbia Prince George 464 42 (100)
British Columbia RU 42 Forest Activity Zone 44 286 42 (96) 39 (4)
Yukon Arctic 496 43 (100)
Yukon Northern Forest 19 987 45 (91) 44 (9)
Yukon Whitehorse 417 46 (100)
Yukon Forest Activity Zone 27 440 46 (98) 47 (1)
Northwest Territories Arctic 42 788 48 (49) 49 (43) 50 (7)
Northwest Territories Northern Forest 91 972 50 (52) 51 (37) 53 (9) 52 (2)
Northwest Territories Yellowknife 176 51 (100)
Northwest Territories Forest Activity Zone 467 54 (100)
Nunavut Arctic 198 915 56 (64) 57 (25) 55 (11)
Nunavut Northern Forest 9 892 58 (100)
nrcangccaforests
For more information about the Canadian Forest Service visit our website at nrcangccaforests or contact any of the following Canadian Forest Service establishments
Canadian Forest Service Contacts
Atlantic Forestry Centre PO Box 4000 Fredericton NB E3B 5P7 Tel (506) 452-3500 Fax (506) 452-3525 nrcangccaforestsresearch-centresafc13447
Atlantic Forestry Centre ndash District Office Sir Wilfred Grenfell College Forestry Centre University Drive Corner Brook NF A2H 6P9 Tel (709) 637-4900 Fax (709) 637-4910
Laurentian Forestry Centre 1055 rue du PEPS PO Box 3800 Sainte-Foy PQ G1V 4C7 Tel (418) 648-5788 Fax (418) 648-5849 nrcangccaforestsresearch-centreslfc13473
Great Lakes Forestry Centre PO Box 490 1219 Queen St East Sault Ste Marie ON P6A 5M7 Tel (705) 949-9461 Fax (705) 759-5700 nrcangccaforestsresearch-centresglfc13459
Northern Forestry Centre 5320-122nd Street Edmonton AB T6H 3S5 Tel (403) 435-7210 Fax (403) 435-7359 nrcangccaforestsresearch-centresnofc13485
Pacific Forestry Centre 506 West Burnside Road Victoria BC V8Z 1M5 Tel (250) 363-0600 Fax (250) 363-0775 nrcangccaforestsresearch-centrespfc13489
Headquarters 580 Booth St 8th Fl Ottawa ON K1A 0E4 Tel (613) 947-7341 Fax (613) 947-7396
Canadian Wood Fibre Centre A virtual research centre of the Canadian Forest Service Natural Resources Canada nrcangccaforestsresearch-centrescwfc13457
1
2
3
5
6
4
1
25
3 6
4
1
To order publications online visit the Canadian Forest Service Publications website at
cfsnrcangccapublications

Canadarsquos National Deforestation Monitoring System System DescriptionInformation Report BC-X-439
3
31 Where Deforestation Has Occurred
The NDMS was designed to produce national and sub-national outputs Sub-national reporting units were cre-ated in collaboration with scientists involved in the design and implementation of Canadarsquos National Forest Carbon Monitoring Accounting and Reporting System (Kurz and Apps 2006) the Canadian Agricultural Greenhouse Gas Monitoring Accounting and Reporting System team of Agriculture and Agri-Food Canada and Canadarsquos national greenhouse gas inventory reporting system (Environment Canada 2006) This allows NDMS outputs to be integrated seamlessly by all of these systems
Deforestation mapping is done within sample cells The mapping data from all sample cells are compiled in an ArcGIS database and then input into an estimation process that produces data at the scale of reconciliation units and
reporting zones (see Figure 1) The reconciliation units are common areas that are used by the teams listed above to summarize information Environment Canada reports greenhouse gas emissions and removals in reporting zones The reporting zone boundaries follow the bound-aries of the Terrestrial Ecozones of Canada (Ecological Stratification Working Group 1996) with some additional stratification to distinguish eastern and western portions of the largest ecozones (Taiga Shield and Boreal Shield) and to distinguish two different portions of the Prairies ecozone (Subhumid Prairies and Semiarid Prairies) (McGov-ern 2008) The reconciliation unit boundaries follow the geographic intersection of the reporting zone boundaries with provincial and territorial borders National estimates are calculated by summing reporting zone deforestation estimates
Figure 1 Deforestation reconciliation units and reporting zones in Canada For international reporting purposes Environment Canada compiles NDMS results for each reconciliation unit (RU identified by number) and summarizes them for each reporting zone (RZ identified by colour)
Canadian Forest Service | Pacific Forestry Centre | nrcangccaforestsresearch-centrespfc134894
Table 1 Deforestation post-land use classes During interpretation deforestation events are attributed according to their post-deforestation land use type classes and subclasses (post classes and modifiers)
Post class Post-class modifiers
Agriculture (AG) Crop pasture farm yard
Artificial Lake (AL) Agriculture pond golf course related water body recreational water body pond in rural residen-tial setting pondsmall lake in developed urban setting agriculture effluent pond industrial efflu-ent pondholding pond mining tailingwaste pond oil and gas related water body hydroelectric floodingreservoir (cleared forest) hydroelectric floodingreservoir (standing forest)
Corridor (CR) Hydro line (mainsecondarytertiaryother minor) pipeline (mainsecondarytertiaryother minor) cut line railway airstrip undifferentiated corridor
Open Field (OF) Agricultural setting industrial setting recreational setting mine setting mine facility setting oil and gas facility setting pit and quarry setting oil sands setting rural residential setting urbansuburban setting undifferentiated field
Industrial (IN) Heavy industrial light industrial oil sands infrastructure oil and gas infrastructure mine heavy mine light well pad hydro infrastructure
Recreational (RC) Campground golf course ski areas playing field undifferentiated recreational
Road (RD) General road (mainsecondarytertiary) forestry road (mainsecondarytertiary) oil and gas road (mainsecondarytertiary) mine related road (mainsecondarytertiary) hydroelectric related road (mainsecondarytertiary)
Soil Disturbance (SD) Open pit mine logging landing landfill oil sands extraction peat extraction gravel pitquarry rock slide scar (human induced) undifferentiated soil disturbance
Rural Residential (RR) Many trees remaining (residual tree cover 25ndash75) few trees remaining (residual tree cover lt 25)
Urban Residential (UR) Many trees remaining (residual tree cover 25ndash75) few trees remaining (residual tree cover lt 25)
32 When Deforestation Has Occurred
The NDMS provides information about when deforestation occurred by establishing deforestation mapping periods Image data for deforestation mapping are obtained as close to the time period bounding dates as possible The dates of these images are considered ldquocore datesrdquo Defor-estation events are detected and mapped by interpreting changes between these core date images The mapped events are then used to compute deforestation rates for the period These rates are interpolated and in some cases extrapolated to produce estimates of annual deforestation trends When the timing of large deforestation events is known these are processed separately and added to the trend results after interpolation
The NDMS provides estimates of deforestation rates from 1970 onwards in part to accommodate the needs of Canadarsquos UNFCCC reporting Although international UN-FCCC reporting addresses greenhouse gas emissions and removals since 1990 deforestation events that occurred before 1990 contribute to emissions in 1990 and after Deforestation causes both immediate and delayed residual greenhouse gas emissions Immediate emissions are those that occur when forest cover is cleared such as the burn-
ing of discarded biomass and are accounted for in that year Residual emissions which can continue for up to 20 years after the deforestation event are the result of long-term decay of discarded biomass and dead organic matter (Intergovernmental Panel on Climate Change 2003) and are estimated and incorporated in each yearrsquos emissions for 20 years as forest land converted to the post-conversion category
33 Why Deforestation Has Occurred
The NDMS provides information about why deforestation occurred by recording the new land uses that are found where deforestation has been detected and mapped For each mapped deforestation event interpreters record both the type of forest that was present before the change (pre-type) and the new land use that followed (post class) The pretype is described in terms of forest age class density class and cover type (see Appendix 1) It provides insight into the type of forest being converted and is input into the Carbon Budget Model of the Canadian Forest Sector (CBM-CFS3 Kurz et al 2009) for calculating emissions The post class which identifies the new land use is recorded using the categories shown in Table 1
Canadarsquos National Deforestation Monitoring System System DescriptionInformation Report BC-X-439
5
These deforestation post classes can be aggregated in dif-ferent ways according to user need Table 2 provides an ex-ample of post class grouping into industrial categories and good practice guidance land use categories For example within the deforestation post class ldquocorridorrdquo (CR) the modi-fier code further distinguishes events such as hydroelectric lines (CRhm) from pipelines (CRpp) so that the former can
be aggregated into the ldquohydro infrastructurerdquo industrial category and the latter aggregated into the ldquooil and gasrdquo industrial category Both of these examples are classified as settlements (SL) under the good practice guidance land use categorization scheme Appendix 2 provides a detailed listing of all post classes and modifier codes and how they translate to good practice guidance land use categories
Table 2 Deforestation post class aggregation Post classes are cross-referenced to industrial and good practice guidance classes (Intergovernmental Panel on Climate Change 2006) by means of post-class modifiers ldquoXrdquo indicates the presence of modifiers available within each post class
Good practice guidance class
Crop-land (CL) Wetlands (WL) Settlements (SL)
Industrial categories
Agric
ultu
re
Floo
ded
stan
ding
fore
st
Hyd
ro re
serv
oir
Peat
min
ing
Fore
stry
Hyd
ro in
fras
truc
ture
Indu
stry
Min
ing
Mun
icip
al
Oil
and
gas
Recr
eatio
n
Tran
spor
tatio
n
Def
ores
tatio
n po
st c
lass
Agriculture AG X
Artificial Lake AL X X X X X X X X
Corridor CR X X X X
Industrial IN X X X X
Open Field OF X X X X X X
Recreational RC X
Road RD X X
Rural Residential RR X
Soil Disturbance SD X X X X X
Urban Residential UR X
Canadian Forest Service | Pacific Forestry Centre | nrcangccaforestsresearch-centrespfc134896
Figure 2 Deforestation strata units and sampling framework Canada is stratified into types of land that have distinct patterns and rates of deforestation Deforestation mapping has been completed in the areas indicated by shading
The pretype and post class attributes are used for a range of applications including the calculation of greenhouse gas emissions in the CBM-CFS3 (Kurz et al 2009) Because of different type and carbon density of the forest being removed and different treatment and fate of woody debris and soil carbon for deforestation to different land uses some land use transitions result in differing amounts and rates of greenhouse gas emissions than others even when removing similar forest Therefore it is important to have the pretype and post class information available for input into emissions estimation and analysis tools
4 ImplementationDeforestation monitoring begins with visual interpreta-tion of satellite imagery Data are collected from relevant sources to support the work of expert interpreters who use all available lines of evidence to map and attribute de-forestation events Mapped deforestation events in sample
cells within a stratified sampling approach are compiled in a GIS database and used to estimate deforestation rates by scaling from sample to national estimates
A systematic sequence of operational steps is followed whereby mapping work is broken up into work or project packages for completion by in-house Canadian Forest Service technical staff provincial partners or contractors and then passed through a series of quality control checks before being included in the compilation and estimation procedures (see Section 51 for more details)
41 Stratification and Sampling
Deforestation mapping is guided by the stratification of the Canadian landscape into units of land having similar patterns and rates of deforestation (Figure 2) This stratifica-tion is done so that sampling effort can be directed where it is most needed Sampling rates are set for each stratum according to intelligence about deforestation activity
Canadarsquos National Deforestation Monitoring System System DescriptionInformation Report BC-X-439
7
The deforestation strata were created incorporating infor-mation from ecozone locations forest tenure boundaries known and interpreted land use and landscape patterns and provincial and territorial boundaries The strata are fur-ther refined into ldquodeforestation strata unitsrdquo which are gen-erally the deforestation strata within a single reconciliation unit but sometimes within several adjacent reconciliation units Appendix 3 lists the deforestation strata units and gives their size and spatial relationship with reconciliation units More detailed discussion of the stratification process is provided by Leckie et al (2006a and 2006b) Hotspots are areas (strata units) of localized high deforestation activ-ity such as rapidly expanding urban areas Hotspots are delineated to exclude high-activity areas from the larger deforestation strata The deforestation rates in hotspots can be far greater than the levels observed in the larger strata and these areas should therefore be treated separately
The sampling density within each stratum varies depend-ing on a number of factors including the level of deforesta-tion activity and resource constraints A sampling rate of approximately 12 is obtained by establishing
35 times 35 km sample units (termed ldquocellsrdquo) at the intersec-tions of a regular 10 times 10 km grid This grid is aligned with the National Forest Inventoryrsquos 20 times 20 km grid A sampling rate of 6 is obtained by excluding every second cell as shown on the left side of red line in Figure 3 Higher sampling densities are used in strata where more precise estimates are needed When resources permit full-area mapping is conducted in some strata such as hotspots Leckie et al (in review) provide details on sample design considerations
The actual mapping is done on a scene basis and therefore gaps between scenes exist in some strata which reduces the sampling rate somewhat from the target rate These gaps are more common in some early mapping due to the fact that Landsat scenes were not free at that time In addition to focus efforts on regions of high deforestation a subset of some low-deforestation strata (eg forest activity strata of Quebec and Ontario (Figure 2)) was identified based on a systematic pattern of Landsat scene coverages and deforestation was then mapped in sample cells within the sub-area (eg for a 6 sample)
Figure 3 Sampling intensity in two different deforestation strata The sample cells in a stratum are collectively referred to as a sample ldquogridrdquo This example illustrates 6 sampling in the left stratum (blue grid) and 12 sampling in the right stratum (yellow grid)
Canadian Forest Service | Pacific Forestry Centre | nrcangccaforestsresearch-centrespfc134898
The sampling rate for a stratum is the proportion of the to-tal area examined divided by the total area of the stratum Total area examined is the area of the sample cells reduced by any area within them deemed non-interpretable owing to cloud shadow or lack of imagery which is generally less than 2 of the total area mapped
The sample coverage has been improving with more coverage in recent mapping periods in most deforestation strata (see Figures 4ndash6) The sample area is larger for map-
ping period P2 (1990ndash2000) and P3 (2000ndash2008) than for mapping period P1 (1975ndash1990) The P2 period has several large areas with full-area mapping The sample coverage for periods P1 P2 and P3 has likely stabilized at that shown in Figures 4 5 and 6 respectively This coverage was built up over time early national reporting of deforestation was derived from smaller sample coverages and indeed the P3 sample estimate was not introduced to the national deforestation report until 2010
Figure 4 Deforestation strata sampling rates for mapping period P1 (1975ndash1990)
Canadarsquos National Deforestation Monitoring System System DescriptionInformation Report BC-X-439
9
Figure 5 Deforestation strata sampling rates for mapping period P2 (1990ndash2000)
Figure 6 Deforestation strata sampling rates for mapping period P3 (2000ndash2008)
Canadian Forest Service | Pacific Forestry Centre | nrcangccaforestsresearch-centrespfc1348910
The total area of Canada covered by the sampled regions (ie the shaded area in Figure 2) in one or more time periods is 346 times 106 km2 This includes full-area map-ping for 56 times 105 km2 of hydro survey areas in northern Quebec and another 25 times 105 km2 in northern Manitoba in which only hydroelectric development deforestation was mapped Excluding hydro survey areas the area of the sample cells interpreted was 165 times 105 km2 in P1 409 times 105 km2 in P2 and 218 times 105 km2 in P3 The large sample area for P2 reflects the greater amount of full-area mapping
42 Data Sources and Information Collection
Remote sensing imagery is the most critical input to the process of deforestation monitoring In the NDMS image data are used to identify the location size and timing of events These data are also used to determine pre-existing forest types and subsequent post classes The NDMS em-ploys medium-resolution satellite imagery in combination with high-resolution satellite and air photo data wherever available Ancillary sources in the form of spatial data and non-spatial records are used to support the mapping process and act as supplementary sources for estimation and quality control
421 Core Image Data
Landsat is the primary data source for deforestation map-ping Landsat series satellites have been acquiring data since the early 1970s and provide a consistent data stream for all NDMS mapping periods with a spatial and spectral detail suitable for deforestation mapping The current Landsat instruments are medium-resolution sensors with 30 times 30 m pixels and a large image footprint (170 times 185 km) Each satellite has a return period of 16 days with continual image acquisition and scene sidelap that increases at higher latitudes
Landsat imagery formerly available for purchase was made freely available by the United States Geological Survey starting in January 2009 (Wulder et al 2012) For mapping done before 2009 data had to be purchased and thus image acquisition focussed on the basic summer data for core dates (circa 1975 1990 2000 and 2008) and winter imagery in more difficult-to-interpret regions For mapping done after 2009 more imagery was used and additional dates were added to help identify with more precision when deforestation events occurred and also help increase mapping confidence This new imagery was also used to review any previous mapping
422 Additional Image Data
Delineating deforestation boundaries can benefit from use of high-resolution imagery Higher-resolution data are also very useful in supporting the interpretation of pre-existing conditions and forest types and in confirming deforesta-tion and better identifying the post class and post-class modifier High-resolution imagery is therefore used to supplement core Landsat data wherever possible
Data are continuously being sought out by NDMS staff for example a 25 m resolution SPOT 5 panchromatic mosaic of the Prairies (circa 2006) was provided by Agriculture and Agri-Foods Canada and a 10 m SPOT 45 national coverage called GeoBase1 was obtained from the Centre for Topographic Information of Natural Resources Canada The SPOT 45 satellites offer a higher spatial resolution but provide fewer spectral bands than Landsat Various aerial photo data sets have been assembled through partner-ships with provincial governments and other agencies in-cluding National Air Photo Library imagery provincial aerial photography and high-resolution satellite image data sets
Google Earthtrade and Bing Mapstrade are a valuable resource with an ever-expanding selection of recent high-resolution imagery over population centres and many other regions of the country In some cases archives of older imagery (eg circa 2002) are also available and can be accessed through the Time Slider tool available in Google Earth Even current high-resolution imagery can help with the identification of events that occurred in an earlier time period
423 Ancillary Spatial Data
Ancillary data are also incorporated to support the inter-pretation process These data may be used to validate or confirm deforestation occurrence or to support the interpretation of prior forest type or post-change land use Some data types are available nationally whereas others are present only within limited extents Such data include GIS data sets of road networks hydrology wetlands wood-ed areas from provincial base maps pit and quarry licence areas forest inventories forest management tenure areas specialized oil and gas pipeline and well pad databases field oblique photos and other data
In addition to the satellite and aerial photo data described above Google Earthtrade offers further ancillary spatial data in the form of terrain display crowd-sourced Panoramiotrade photographs ground-based StreetViewtrade photography and other useful layers
1 See httpwwwgeobasecageobaseendataimageryimrindexhtml
Canadarsquos National Deforestation Monitoring System System DescriptionInformation Report BC-X-439
11
424 Records Data
Spatial and non-spatial records and activity data may also be incorporated into the estimation or quality control processes In early deforestation reports records and activity data were sometimes used to provide estimates of deforestation associated with a particular sector and area As more mapping was completed estimates from records were replaced by mapping-based information Records data used in the past have included hydroelectric clearing areas forestry road records and standard road class widths and oil and gas pipeline records
43 Mapping
Deforestation event mapping is done using core date im-agery and multi-band image products Mapping is broken up into units of mapping work called ldquoproject packagesrdquo to be completed by internal staff provincial partners or qualified private sector contractors All relevant images and supporting data are assembled as a package for mapping in a particular area Detection interpretation digitization and attribution of individual deforestation events is done manually by trained interpreters according to the estab-lished NDMS methods in a standardized ArcGIS geodata-base (Leckie et al 2012)
431 Data Handling
Interpretation of deforestation events requires the detec-tion of change between pairs of images acquired at two ldquocore datesrdquo chosen to best represent the mapping time period start and end year (ie 1975 1990 2000 and 2008) Forest cover changes or potential events are highlighted using a multi-temporal display or ldquochange enhancementrdquo image created using the visible red band from two core dates of imagery When the mapping period end date image is displayed using the red image colour gun and the mapping period start image is displayed using green and blue the resulting image shows areas of vegetation loss as red In addition possible deforestation events can be detected by comparing the two core images directly Many changes besides deforestation can cause a difference between the images (eg forest harvest forest fires beaver dam flooding wind blowdown agricultural field changes and avalanches) so it is critical that a change event be confirmed as deforestation before it is mapped
Individual deforestation events are manually interpreted and identified delineated and attributed Figures 7 and 8 illustrate some of the data that are used in this process Landsat multiple band combinations at both core dates change enhancement higher-resolution imagery and field oblique aerial photographs
Figure 7 Examples of various Landsat satellite band combinations and change enhancements that may be used in the mapping process Note the change enhancement at right shows red triggers where vegetation loss or change has occurred Band combinations shown are normal colour rendition on left with colour infrared in the middle The right-hand column shows Landsat Thematic Mapper (TM) and Enhanced Thematic Mapper (ETM) bands 453 (ie the two near infrared bands and a red band) displayed as red green blue
Canadian Forest Service | Pacific Forestry Centre | nrcangccaforestsresearch-centrespfc1348912
Figure 8 Examples of supplemental data use Left Example of confirmed and interpreted events (red and yellow lines) shown as polygons on the SPOT imagery (25 m resolution SPOT 5 top left and 10 m SPOT 4 bottom left) Right Example of flight path and oblique aerial photograph from a deforestation field verification campaign
Typically the interpretation process is conducted in a GIS environment where change enhancement and single-date images can be layered and compared by blinking or using the swipe tool Georeferenced ancillary imagery can be simultaneously displayed and a link between ArcGIS and Google Earth allows the synchronization of spatial display extents in both programs
432 Project Packages
Project packages are units of mapping work They include specification of the mapping area time period to be mapped and the sample cells to be used Each project package contains a standardized geodatabase with pre-defined sets of values for some of the attribute fields core date and change enhancement imagery other imagery in-cluding winter and overlapping scenes from east and west of the scene being mapped additional SPOT and aerial photographs (if available) and ancillary data sets
Once the mapping has been completed for a project and passed successfully through quality control the data are added to the national geodatabase which carries all defor-estation mapping data for the country including all time
periods The structure of the project geodatabases mirrors the structure of the national geodatabase
433 Interpretation
Image interpretation is done manually on a cell-by-cell ba-sis Typically the change enhancement is used first to iden-tify change events These are then confirmed or refuted as deforestation by the interpreter using the individual core date images supported by other image and ancillary data The supporting data are used to assess whether an event area was forested before the change and whether the event meets the deforestation definition Supporting data are also used to help interpret pretype and post class
The boundary of a deforestation event is identified in the Landsat images but higher-resolution imagery is used in a supporting role to improve event boundary delineation Interpreters follow specific digitizing guidelines provided in the Deforestation Interpretation Guide (Leckie et al 2012) that dictate how events shall be mapped (eg digitize smooth lines rather than following pixel boundaries avoid gaps and overlaps between adjacent events keep the mapping topology clean etc)
Canadarsquos National Deforestation Monitoring System System DescriptionInformation Report BC-X-439
13
Deforestation events may be linear in form (eg roads hydro lines) or polygonal They are digitized accordingly as lines or polygons in the project geodatabase Specific guidelines apply for each type of feature Delineation fol-lows clearly defined situational rules (eg for compositemixed use polygons roads in cutblocks tertiary versus more significant roads episodic clearing etc) all of which are addressed in detail in the Deforestation Interpretation Guide When events extend beyond the boundaries of a sample cell they are delineated to the full extent of the event but only the portion inside the cell is included in the estimation
Event attributes are interpreted and recorded using attri-bute values defined in the NDMS data dictionary Pretype attributes include forest type density and maturity (see Appendix 1 for details) Post class attributes are listed in Table 2 (see Appendix 2 for details) Interpreters also record their level of confidence about each deforestation event (ie how confident they are that it was forest before the change and that it is indeed a new land use) Comment fields are used extensively to record details specific to each event These may indicate uncertainty in an event a request by the interpreter for specific review by the qual-ity control person or the need for checking the event in a later time period The widths for linear events (such as roads or corridors) are also recorded as it is more efficient to map these as lines and later convert to polygons using the width data during a subsequent processing stage
If mapping already exists for an earlier time period in the area the interpreter reviews it in the context of recent imagery either to confirm the previous interpretations or to note whether corrections are required Points are used to flag areas for revision or later review by analysts such as where older mapping may require updating
In some cases imagery available for a core date is contami-nated by clouds shadows or missing data at image edges In such cases the interpreter digitizes the contaminated area within the sample cells and saves the polygon into a special geodatabase layer for ldquonon-interpretable areardquo poly-gons and notes the affected date The areas saved into this layer are removed from the sample during later processing to create what is termed the ldquointerpretable gridrdquo The open-ing of the Landsat archive through free access to geocor-rected imagery has substantially reduced the amount of
non-interpretable area entering the estimate calculations For example sometimes images outside the core date can be used to infer deforestation in the non-interpretable area In fact recently non-interpretable areas have been almost eliminated from the process
A series of quality checks has been built into the mapping process these are completed in every mapping project Canadian Forest Service analysts conduct quality control checks of the mapped data (see Section 5) and return a set of quality control points to the interpreters indicating where more work and specific changes are needed before the mapping can be loaded into the national geodata-base
44 Deforestation Estimation
The mapping data from deforestation sample cells are used to estimate the area of deforestation in each RU by scaling up from sample to population in each defor-estation stratum and then summing the deforestation estimate for each stratum in an RU Scaling up is done for each land use type (post-class modifier) in each time period Temporal interpolation is used to compute annual deforestation rates Lastly large event mapping records and activity data and intelligence are used to refine the estimates when appropriate
441 GIS processing
The national deforestation geodatabase contains all the mapped areas representing deforestation events sampled within each time period as lines and polygons The geo-database also contains layers required for the estimation calculations including the sample grids the non-interpre-table areas the Landsat image boundaries (which define the core dates and areas sampled) the deforestation strata boundaries and the RU boundaries
The spatial data are first processed to prepare them for the scaling up analysis which is conducted later in a non-spa-tial database program (Section 444) Figure 9 provides a schematic of the tasks involved in the GIS processing (Burt et al 2006) The two main calculated outputs produced are the event and grid tables shaded in red in Figure 9 The processing of the mapped GIS data for the national sum-mary is performed for each time period
Canadian Forest Service | Pacific Forestry Centre | nrcangccaforestsresearch-centrespfc1348914
Figure 9 Simplified deforestation GIS processing flow Input tables are in green processes in yellow and output tables in red Gold arrows denote updates to a table The term ldquolinesrdquo refers to linear deforestation events ArcGIS commands are underlined
Canadarsquos National Deforestation Monitoring System System DescriptionInformation Report BC-X-439
15
The first of the output tables the ldquointerpretable gridrdquo (labelled grd_ident in Figure 9) defines the actual area for which mapping was done As a result the full set of sample cells is clipped by the extent of the Landsat imagery (thus removing portions of the cells that fall outside the Landsat image boundary) and has the non-interpretable areas (eg clouds) removed
The second table the ldquoFinal Event Polygonsrdquo (labelled py_fn) is created from the intersection of many input lay-ers The post-class modifier code for each event is carried through in these deforestation calculations The linear de-forestation events are converted to polygons by applying a buffer according to the width attribute associated with each line then combined with the other deforestation polygon events to create a complete polygonal coverage of all deforestation events mapped The events are then intersected with the interpretable grid layer Further inter-sections are applied to the boundary RU and deforestation strata layers to identify which strata and RU are associ-ated with each event In the end the data for each event include attributes drawn from all the intersected layers including the deforestation stratum and RU of each event As well small slivers created during the GIS processing steps are removed
At this stage it is possible to calculate the rate of deforesta-tion for each time period All events are assigned to the time period in which they occur (ie P1 [1975ndash1990] P2 [1990ndash2000] or P3 [2000ndash2008]) based on the core dates of imagery used for mapping For each event an effective annual rate of deforestation (hectares per year) is calculat-ed by dividing the deforested area by the number of years between the core dates Later in the process the resulting per-event annual rates are summed for each stratum and divided by the area of grid cells interpreted to determine the average annual rate for each time period and post-class modifier (Section 444)
To provide flexibility the mapping activity captures forest clearings that meet a more inclusive definition of defor-estation than strictly required Land conversion of sparse forest does not constitute deforestation (unless it is conver-sion of a recently disturbed or regenerating area) but is mapped for completeness unless otherwise specified The GIS processing steps are used to exclude such mapped events with sparse forest density
442 Large Events and Records Data
Certain types of events that are large uncommon and iso-lated (eg hydroelectric reservoirs new surface mines long and major hydroelectric lines etc) are better represented by complete mapping and census rather than sampling (Leckie et al [in review]) Such events termed ldquolarge eventsrdquo are mapped separately and completely using either core date imagery or imagery captured as close to the actual event dates as possible When large events fall within sample cells and thus are also captured by the sampling
these are excluded from the processing of sample data to avoid double-counting
Records and activity data when used for a given type of deforestation in a region (eg stratum) are added to the database and removed from the processing of sample data similar to large events (see Section 424)
443 Expert Intervention
After the mapping and GIS processing steps have been completed the initial estimation results are analyzed to identify potential problems With the nature of deforesta-tion in Canada and intensity of the sample occasionally spurious estimates may occur
Canadian Forest Service deforestation monitoring ex-perts have accumulated familiarity with land use change patterns and activities in Canada over many years These experts scrutinize NDMS estimation process outputs and investigate questionable outputs that may be then modi-fied if a change is justified
When suspicious estimation outputs are encountered ex-perts intervene by evaluating available records information and reconnaissance data For example when a particular event type is rare and sampling produces estimates that are unexpectedly high or low expert reviewers may scan available imagery to see what is occurring outside the sample cell boundaries (ie in the non-sampled area) and use this to inform expert intervention Estimation outputs may be deemed suspicious when they contradict previous estimates or other available lines of evidence All expert interventions are documented for transparency and in case they need to be reassessed as new evidence emerges (eg Leckie et al 2009 Leckie et al 2010)
444 Database Processing
Annualized national deforestation estimates are produced for each industrial sector and RU by combining the GIS data and any large event or recordsactivity data and incorporating expert interventions These data are loaded into a non-spatial database environment (Paradine 2007) The resulting estimates are used to produce customized re-ports for NDMS data users such as provincial government agencies Canadarsquos National Forest Carbon Monitoring Accounting and Reporting System for input to greenhouse gas emission estimation and others
The non-spatial part of the processing follows the work flow shown in Figure 10 The ratio of the area sampled (the ldquointerpretable gridrdquo) to the area of the stratum is calculated (labelled ldquo1rdquo in Figure 10) The area of deforestation in the sample is then scaled up by this proportion (labelled ldquo2rdquo in Figure 10) to produce the deforestation estimate for the stratum This process is repeated for all strata time periods and post classes (including post-class modifiers) using the mapped sample data only
Canadian Forest Service | Pacific Forestry Centre | nrcangccaforestsresearch-centrespfc1348916
Figure 10 Schematic of the deforestation database process used to produce estimates
Canadarsquos National Deforestation Monitoring System System DescriptionInformation Report BC-X-439
17
The expert intervention can be added at the strata level for a particular time period as an adjustment factor (labelled ldquo3rdquo in Figure 10) or as replacements or additions (labelled ldquo4rdquo in Figure 10) to existing data It can also be applied at the RU level (labelled ldquo7rdquo in Figure 10) Early national deforesta-tion reporting had more expert interventions because of lower sample rates less availability of high-resolution imagery and more use of records data over the remote sensing sample Currently few expert interventions occur with most occurring for the 1975ndash1990 time period which has a smaller sample
At the strata level the updated deforestation estimates by time period and post-class modifier are proportioned (labelled ldquo5rdquo in Figure 10) into their respective RUs (see Ap-pendix 3)
The data are then annualized The deforestation estimates for each time period (by post class and RU) are assigned
to the middle year of the time period (ie 1983 for 1975ndash1990 1995 for 1990ndash2000 and 2004 for 2000ndash2008) Annual trends are produced by applying linear interpola-tion between midpoints and extrapolation from endpoints (labelled ldquo6rdquo in Figure 10) Figure 11 provides one example
Large event mapping data records and activity data and expert interventions are applied as shown by the various green boxes in Figure 10 Large event data have the year of the event attached to them and are added to the mapping data at the RU level (labelled ldquo7rdquo in Figure 10) Records data also generally have a date attached and are added to the annualized data in a similar fashion to large event data
Figure 12 shows the trend line calculated in Figure 11 and the large event data (purple) representing hydro reservoir flooding facility construction and associated transporta-tion and hydro line corridors
Figure 11 Example deforestation trend produced using data from three mapping periods
Canadian Forest Service | Pacific Forestry Centre | nrcangccaforestsresearch-centrespfc1348918
Figure 12 Example of a deforestation area trend from sample mapping (red) and large events data (purple)
The post-class modifier classes (Table 1 and Table A21 in Appendix 2) are aggregated (labelled ldquo8rdquo in Figure 10) to the appropriate industrial category and good practice guidance class using a lookup table The various modifiers within each deforestation post class provide flexibility to summarize to different industrial categories based on user requirements (eg the categories used by the National For-est Carbon Monitoring Accounting and Reporting System and shown in Tables A21 and A22)
The result of the processing is a series of database tables A major product among these is the list of annual deforesta-tion area per RU per industrial class (labelled ldquo9rdquo in Figure 10) Another product is the breakdown of forest pretype percentages by RU this is done by calculating the percent-age area of each pretype mapped in the RU Reporting for the UNFCCC requires separate estimates of deforestation and greenhouse gas emissions for managed and unman-aged forest thus a separate table is produced for unman-aged forest (labelled ldquo10rdquo in Figure 10)
5 Quality ControlThree major quality control stages are applied during the deforestation mapping process
1 initial mapping quality control
2 revision quality checks and
3 overall quality assurance or vetting where a check on the final mapping data is performed
This multi-stage approach reduces the likelihood of errors and increases consistency of and confidence in the final product The data processing stage has further checks for data integrity After the data are calculated in the esti-mate process the final numbers and trends are assessed for changes from previous year estimates Deforestation estimates are also scrutinized by external users before they incorporate the data into their applications For an over-view of quality control practices see Dyk et al (2011)
51 Quality Control at the Mapping Stage
The mapping process flow is illustrated in Figure 13 includ-ing the quality control steps Typical errors caught through quality control at the mapping stage include incorrect event interpretations or delineations event omissions or commissions missing field values typographical errors and topology problems During the quality control phase an internal Canadian Forest Service reviewer performs detailed checks to ensure consistency with mapping and interpretation rules and returns a set of points to flag and describe the problem areas to the interpreter or contrac-tor These quality control points are stored in the mapping geodatabase as a permanent layer
Canadarsquos National Deforestation Monitoring System System DescriptionInformation Report BC-X-439
19
Figure 13 The deforestation mapping and quality control process flow
The mapping interpreter reviews these points and applies the recommended corrections to the working database The quality control points are sent to the interpreter early and frequently in the project timeline to reduce or avoid propagation of persistent errors or misunderstandings through the duration of the project
The original line and polygon mapping is preserved and re-visions are performed in separate ldquorevised linerdquo and ldquorevised polygonrdquo layers in the project geodatabase Information about the changes including what was done by whom and the date is added for every revised event Any deleted events are also retained in what are termed the ldquodrop lay-ersrdquo to mark the area as a non-deforestation event which is reviewed during future mapping
When the revised data are resubmitted to the Canadian Forest Service the data layers make clear what changes were requested and what changes were made The re-viewer uses these layers to verify that appropriate revisions were properly applied at all quality control points Any further errors or misunderstandings are communicated to the interpreter immediately for resolution At this stage the interpreter can also open a dialogue regarding specific events using additional comment fields in the quality control point layer or personal communication
The next level of quality control is the final vetting This audit step is conducted internally by senior Canadian For-est Service interpreters to ensure consistency of mapping across all projects All aspects of the new data are reviewed during this stage omission and commission errors delinea-
tion and attribution In addition the older mapping data are scanned to ensure newer imagery confirms the original interpretation A set of ldquovet revisionrdquo points is created to mark all adjustments required in the database An analyst works through these point by point to make the necessary changes noting any complex or uncertain events and communicating directly with the vetting interpreter when necessary
Field validation is a desirable aspect of the revision process but is not included during the mapping stage In general field campaigns are conducted on an ongoing basis when resources permit Areas where local knowledge or ground truth information are needed to clarify the interpretation are identified from the interpreter confidence records or the revision point data Dedicated field programs schedule air or ground visits to high-impact and low- to moderate-confidence events Local experts sometimes provide information about ground conditions that can be used to verify and update the database
Throughout the entire mapping and revision process an internal ldquoproject storyrdquo is maintained by the Canadian For-est Service This document summarizes activity on a given project including staff and contractors involved dates and actions completed It also includes detailed explanation of any complex situations or vet revisions as well as notes on any issues raised by the quality control or vetting interpret-ers To maintain consistency analysts who are involved in revisions or who vet revisions read this project story before starting work
Canadian Forest Service | Pacific Forestry Centre | nrcangccaforestsresearch-centrespfc1348920
52 Quality Control at the Data Processing Stage
Once revisions are vetted final data integrity checks are conducted on the project database to find and correct any technical errors such as missing attributes mismatched post classes and modifiers incorrect or reversed event dates inappropriate line widths topology errors overlaps and duplicates and typos This stage is partially automated The final mapping layers can be loaded into the national database only after the integrity checks have been com-pleted
Data quality checks are built into the script that automates the data processing stages The script both delivers reports to the screen while running and dumps to log files which are reviewed by Canadian Forest Service staff to ensure the runs were successful
Transfer of the final GIS tables into the non-spatial defor-estation database is also automated The grid and event tables for each time period are checked before load-ing and the number of records loaded is recorded and compared with previous runs to highlight any potential discrepancies
The database queries and tables used to create the annual estimates by industrial category and RU are controlled by Microsoft Access macros to ensure consistency between the runs
53 Quality Control at the Output Analysis Stage
Following generation of the estimate tables the main out-puts (annualized deforestation by industrial class and RU pretype table and unmanaged forest table) are evaluated closely by Canadian Forest Service experts to ensure that estimates have been calculated properly and that discrep-ancies from previously calculated values can be explained To aid in this effort a comparison spreadsheet is created for each RU showing the deforestation estimates by indus-trial class for the current and previous yearrsquos national run together with illustrations and statistics The experts scru-tinize the data for changes and ensure the new estimates are consistent with the input mapping data Any specific issues and special adjustments required are documented in a report that becomes part of the record for each yearrsquos estimate
54 External Quality Control
Users of the deforestation estimates conduct their own reviews of the data prior to use in their systems and com-municate any issues before incorporating the data into their own business processes When new issues arise these are dealt with and the NDMS quality control processes are updated to catch similar issues in the future
6 ConclusionsDeforestation is the direct human-induced conversion of forested land to non-forested land use The NDMS was de-signed and implemented to provide information needed by Canada to meet its obligation under the UN Frame-work Convention on Climate Change to report the areas affected annually by deforestation Also considered was the need to provide information useful for policy analysis land management and forest stewardship applications Understanding why where and when deforestation occurs is a prerequisite to the development of appropriate policy instruments to optimize land use develop mitigation strat-egies and address cumulative impacts on forest resources
The NDMS uses manual mapping from a satellite remote sensing sampling system informed by records-based information and expert knowledge to provide information about deforestation in Canada The remote sensing map-ping is supported by available ancillary information such as high-resolution imagery forest inventory road networks and other industrial databases Certain types of events that are large and isolated (eg mine and hydroelectric devel-opments) are mapped and incorporated separately in the overall deforestation estimates Occasionally records and activity data on land use changes are incorporated when they are deemed more appropriate than the sampling es-timate The mapping results from the sample are scaled up to regional levels In the data processing stage these data are merged and annualized to produce national deforesta-tion estimates
The system has been used and improved over the last 10 years The flexibility of the NDMSrsquos design makes it possible to adapt to future changes in image sources ancillary data resource availability and user needs and positions the pro-gram well for long-term maintenance and improvement
Canadarsquos National Deforestation Monitoring System System DescriptionInformation Report BC-X-439
21
7 References
Burt W Paradine D Leckie D 2006 Geographic Information system processing of deforestation mapping data for estimating deforested area of Canada Natural Resources Canada Canadian Forest Service Pacific Forestry Centre Victoria BC Report DRS-P-001
Dyk A Tinis S Leckie D 2011 National Inventory Report 2011 Deforestation area estimation for Canada Quality con-trol overview Natural Resources Canada Canadian Forest Service Pacific Forestry Centre Victoria BC Report DRS-N-031
Ecological Stratification Working Group 1996 A national ecological framework for Canada Agriculture and Agri-Foods Canada Research Branch Centre for land and Biological Resources Research and Environment Canada State of the Environ-ment Directorate Ottawa Ont
Environment Canada 2006 National Inventory Report 1990ndash2004 Greenhouse gas sources and sinks in Canada Govern-ment of Canada Submission to the UN Framework Convention on Climate Change httpunfcccintnational_reportsannex_i_ghg_inventoriesnational_inventories_submissionsitems3734php (Accessed August 2014)
Environment Canada 2014 National Inventory Report 1990ndash2012 Greenhouse gas sources and sinks in Canada Govern-ment of Canada Submission to the UN Framework Convention on Climate Change Report issued by Pollutant Inventories and Reporting Division Environment Canada Ottawa Onthttpunfcccintnational_reportsannex_i_ghg_inventoriesnational_inventories_submissionsitems8108php (Accessed August 2014)
Food and Agriculture Organization 2006 2001 Global forest resources assessment 2000 main report United Nations Food and Agriculture Organization Rome Italy FAO Forestry Paper 140
Gillis M Omule A Brierley T 2005 Monitoring Canadarsquos forests The National Forest Inventory Forestry Chronicle 81(2)214ndash221
Intergovernmental Panel on Climate Change 2003 Good practice guidance for land use land-use change and forestry Penman J Gytarsky M Hiraishiet T et al (eds) Institute for Global Environmental Strategies Hayama Japan
Intergovernmental Panel on Climate Change 2006 2006 IPCC guidelines for national greenhouse gas inventories Egg-leston HS Buendia L Miwa K Ngara T Tanabe K (eds) Intergovernmental Panel on Climate Change National Green-house Gas Inventories Programme Institute for Global Environmental Strategies Hayama Japan httpwwwipcc-nggipigesorjppublic2006gl (Accessed January 2015)
Kurz W 2010 An ecosystem context for global forest cover loss estimates Proceedings National Academy of Sciences 107(20)9025ndash9026
Kurz W Apps M 2006 Developing Canadarsquos national forest carbon monitoring accounting and reporting system to meet the reporting requirements of the Kyoto Protocol Mitigation and Adaptation Strategies for Global Change 11(1)33ndash43
Kurz W Dymond C White T Stinson G Shaw C Rampley G Smyth C Simpson B Neilson E Trofymow J Metsaranta J Apps M 2009 CBM-CFS3 A model of carbon-dynamics in forestry and land-use change implementing IPCC standards Ecological Modelling 220(4)480ndash504
Kurz W Shaw C Boisvenue C Stinson G Metsaranta J Leckie D Dyk A Smyth C Neilson E 2013 Carbon in Canadarsquos boreal forest A synthesis Environmental Reviews 21260ndash292
Canadian Forest Service | Pacific Forestry Centre | nrcangccaforestsresearch-centrespfc1348922
Leckie D Dyk A Ortlepp S Tinis S 2010 Records of decision for Canadarsquos national deforestation estimate 2011 Natu-ral Resources Canada Canadian Forest Service Pacific Forestry Centre Victoria BC Report DRS-N-029
Leckie D Dyk A Paradine D Tammadge D Tinis S 2012 Deforestation interpretation guide Natural Resources Canada Canadian Forest Service Pacific Forestry Centre Victoria BC Report DRS-M-030
Leckie D Dyk A Tinis S 12009 Records of decision for Canadarsquos national deforestation estimate Natural Resources Canada Canadian Forest Service Pacific Forestry Centre Victoria BC Report DRS-N-026
Leckie D Paradine D Burt W 2006a Mapping sample coverage for Canadarsquos national deforestation estimate 2006 Natural Resources Canada Canadian Forest Service Pacific Forestry Centre Victoria BC Report DRS-N-002
Leckie D Paradine D Tinis S 2006b Geographic strata for Canadarsquos national deforestation estimates report Natural Resources Canada Canadian Forest Service Pacific Forestry Centre Victoria BC Report DRS-Q-003
Leckie D Paradine D Kurz W Magnussen S [2015] Deforestation mapping sampling designs for Canadian land-scapes Natural Resources Canada Canadian Forest Service Victoria BC In review
Lempriegravere T Kurz W Hogg E Schmoll C Rampley G Yemshanov D et al 2013 Canadian boreal forests and climate change mitigation Environmental Reviews 21(4)293ndash321
Le Queacutereacute C Peters G Andres R Andrew R Boden T et al 2014 Global carbon budget 2013 Earth System Science Data 6689ndash760
Masek J Cohen W Leckie D Wulder M Vargas R de Jong B Healey S Law B Birdsey R Houghton R Mildrexler D Goward S Smith W 2011 Recent rates of forest harvest and conversion in North America Journal of Geophysical Research 116G00K03
McGovern M 2008 Reporting zones GHG spatial reporting structure for Canada 2008 Environment Canada Greenhouse Gas Division Ottawa Ontario
Montreal Process 2009 Criteria and indicators for the conservation and sustainable management of temperate and boreal forests Fourth edition httpwwwmontrealprocessorgdocumentspublicationsgeneral2009p_4pdf (Accessed January 2015)
Pan Y Birdsey RA Fang J et al 2011 A large and persistent carbon sink in the Worldrsquos forests Science 333988ndash993
Paradine D 2007 National Inventory Report 2008 ACCESS database description GIS processing description and consoli-dated GIS database description Natural Resources Canada Canadian Forest Service Pacific Forestry Centre Victoria BC Report DRS-N-019
United Nations Framework Convention on Climate Change 2002 Conference of the PartiesndashReport of the Confer-ence of the Parties on its seventh session held at Marrakesh from 29 October to 10 November 2001 United Nations Office Geneva Switzerland httpunfcccintresourcedocscop713pdf (Accessed January 2015)
Wulder M Masek J Cohen W Loveland T Woodcock C 2012 Opening the archive How free data has enabled the science and monitoring promise of Landsat Remote Sensing of Environment 1222ndash10
Canadarsquos National Deforestation Monitoring System System DescriptionInformation Report BC-X-439
23
Appendix 1 Pretype Forest Conditions
The tables below list the approved forest type density and maturity values applied in deforestation mapping Note not all combinations are valid particularly those that include recent disturbance and regeneration terms Table A11 lists the ac-ceptable parameter combinations
The most common pretype groupings found are the 36 combinations of three Type classes (B C and M) three Density classes (D O and S) and four Maturity classes (R Y I and M) The two older Maturity classes (O and G) require additional verification to identify them Several classes identify recently disturbed forests (K X and R)
Table A11 Pre-change forest type descriptors
TYPE Definition Restrictions of use
B Broadleaf gt 75 of trees are broadleaf (Angiospermae)
C Conifer gt 75 of trees are conifer (Coniferae)
M Mixed gt 25 of both broadleaf and conifer present
K Clearcut Exposed ground and (or) ground vegetation No visible regeneration
Use only with S or N density and Q maturity
X Burn Exposed ground and (or) ground vegetation No visible regen-eration May have live residual trees up to 25 crown closure
Use only with S or N density and Q maturity
R Regen Regenerating areas with lt 25 crown closure where the forest composition (B C or M) is not identifiable
Table A12 Pre-change forest density descriptors
DENSITY Definition Restrictions of use
D Dense gt 60 crown closure
O Open 25ndash60 crown closure
S Sparse 5ndash25 crown closure
N Nil lt 5 crown closure Use only with K and X pretype
Table A13 Pre-change forest maturity descriptors-
MATURITY Definition Restrictions of use
Q Recent disturbance No visible regeneration Use only with K and X pretype
R Regen Forest stands 0ndash14 years old
Y Young Forest stands 15ndash25 years old
I Immature Forest stands 26ndash40 years old
M Mature Forest stands 41ndash80 years old
O Old Forest stands 81ndash200 years old
G Old-growth Forest stands over 200 years old Restricted to British Columbia only
Canadian Forest Service | Pacific Forestry Centre | nrcangccaforestsresearch-centrespfc1348924
Table A14 Valid combinations of pretype attributes (TypendashDensityndashMaturity)
Regen Broadleaf Mixed Coniferous
Dense RDR BDR MDR CDR
BDY MDY CDY
BDI MDI CDI
BDM MDM CDM
BDO MDO CDO
CDG
Open ROR BOR MOR COR
BOY MOY COY
BOI MOI COI
BOM MOM COM
BOO MOO COO
COG
Sparse RSR BSR MSR CSR
BSY MSY CSY
BSI MSI CSI
BSM MSM CSM
BSO MSO CSO
CSG
Burn Clearcut
Regen Broadleaf Mixed Coniferous
Disturbed XSQ KSQ
XNQ KNQ
Canadarsquos National Deforestation Monitoring System System DescriptionInformation Report BC-X-439
25
Appendix 2 Post-class Modifiers by Industrial Category
Table A21 lists all land use post-class deforestation modifiers They provide additional detail regarding what has occurred on the ground for each deforestation event These classes can be assigned to various industrial classes (see Table A22) Detailed definitions are provided in the Deforestation Interpretation Guide (Leckie et al 2012)
Table A21 Post class and post-class modifier codes and short descriptions grouped by industrial categorysector (in bold)
Post class Post class modifier
Agriculture
AG Agriculture ab bare
cp crop
fy farm yard
pa pasture
AL Artificial Lake aa agriculture pond
ea agriculture effluent pond
OF Open Field fa agriculture setting
Flooded Standing Forest
AL Artificial Lake ff flooded standing forest
Forestry
RD Road mf mainline forestry road
sf secondary forestry road
xf tertiary forestry road with width ge 20 m
SD Soil Disturbance ld logging landing
ss rock slide scar
Hydro Infrastructure
CR Corridor hm hydro linendashmain
hs hydro linendashsecondary
xy hydro linendashtertiary ge 20 m
IN Industrial ih hydro infrastructure
Hydro Reservoir
AL Artificial Lake hr hydroelectric flooding
Industry
AL Artificial Lake ei industrial effluent pond
IN Industrial hi heavy industrial
li light industrial
OF Open Field fi industrial
Canadian Forest Service | Pacific Forestry Centre | nrcangccaforestsresearch-centrespfc1348926
Post class Post class modifier
Mining
AL Artificial Lake em waste ponds for mining
IN Industrial mh mine heavy
ml mine light
OF Open Field fk mine facility
fm mine
fq pit and quarry
SD Soil Disturbance mn open pit mine
pq gravel pitquarry
Municipal
AL Artificial Lake ad pond urban setting
ar pond rural residential
ul other human caused
CR Corridor cl cut line
cu undifferentiated
OF Open Field fd urbansuburban
fr rural residential
uf undifferentiated field
RR Rural Residential rf few trees remaining
rm many trees remaining
SD Soil Disturbance lf landfill
su undifferentiated
UR Urban Residential df few trees remaining
dm many trees remaining
Oil and Gas
CR Corridor pp pipelinendashmain
ps pipelinendashsecondary
xp pipelinendashtertiary ge 20 m
IN Industrial oi oil sands industrial
op oil and gas industrial
wp well pad
OF Open Field fo oil and gas facility
fs oil sands open field
SD Soil Disturbance os oil sands
AL Artificial Lake eo oil and gas related pond
Canadarsquos National Deforestation Monitoring System System DescriptionInformation Report BC-X-439
27
Post class Post class modifier
Peat Mining
SD Soil Disturbance pm peat extraction
Recreation
AL Artificial Lake af golf course related
ap recreational water body
OF Open Field fc recreational field
RC Recreational ca campground
go golf course
ru other or undifferentiated
sk ski areas
Transportation
CR Corridor as airstrip
ry railway
RD Road mm main road clearly for a mine
mr main road
mo main road clearly for oil and gas
my main road clearly for hydroelectric
sm secondary mining road
so secondary oil and gas road
sr secondary road
sy secondary hydroelectric road
xm tertiary mining road with width ge 20 m
xo tertiary oil and gas road with width ge 20 m
xr tertiary road with width ge 20 m
xy tertiary hydroelectric road with width ge 20 m
Canadian Forest Service | Pacific Forestry Centre | nrcangccaforestsresearch-centrespfc1348928
Table A22 Aggregation of deforestation mapping classes to good practice guidance and industrial categories
Good practice guidance class
Crop-land (CL)
Wetlands (WL) Settlements (SL)
Industrial Categories
Agric
ultu
re
Floo
ded
stan
ding
fore
st
Hyd
ro re
serv
oir
Peat
min
ing
Fore
stry
Hyd
ro in
fras
truc
ture
Indu
stry
Min
ing
Mun
icip
al
Oil
and
gas
Recr
eatio
n
Tran
spor
tatio
n
Def
ores
tatio
n po
st c
lass
Agriculture AG ab cp pa fy
Artificial Lake AL aa ea ff hr ei emad ar of ul eo af ap
Corridor CR hm hs xy cl cu
pp ps xp as ry
Industrial IN ih hi li mh mloi op wp
Open Field OF fa fi fk fm fq fd fr uf fo fs fc
Recreational RC ca go fu sk
Road RDmf sf xf
mm mo mr my sm so sr sy xm
xo xr xy
Rural Residential RR rf rm
Soil Disturbance SD pm ld ss mn pq lf su os
Urban Residential UR df dm
Canadarsquos National Deforestation Monitoring System System DescriptionInformation Report BC-X-439
29
Appendix 3 Deforestation Strata Units and Reconciliation Unit InclusionTable A31 shows the names of the deforestation strata their area in kilohectares and the percentage of that area contained in each reconciliation unit that they overlap (sorted by reconciliation unit identification number see Figure 1 for unit loca-tion and name)
Table A31 Area of strata units and percent of strata unit area that is in each reconciliation unit
Deforestation strata unit name Strata unit area (kilohectares)
Reconciliation unit ( inclusion)
Newfoundland Eastern Woodlot 4 477 1 (100)
Newfoundland Forest Activity Zone 6 512 1 (100)
Newfoundland St Johns 55 1 (100)
Labrador Arctic 1 893 2 (100)
Labrador Northern Forest 23 238 3 (98) 4 (2)
Labrador Forest Activity Zone 4 620 4 (100)
Nova Scotia Eastern Woodlot 2 894 5 (100)
Nova Scotia Forest Activity Zone 2 396 5 (100)
Nova Scotia HalifaxDartmouth 182 5 (100)
Prince Edward Island 577 6 (100)
New Brunswick Eastern Woodlot 4 121 7 (100)
New Brunswick Forest Activity Zone 3 174 7 (100)
Quebec Arctic 20 443 10 (75) 9 (18) 8 (7)
Quebec Eastern Townships 3 948 11 (100)
Quebec Gaspe Forest Activity Zone 2 740 11 (100)
Quebec Southern RU12 2 968 12 (100)
Quebec Northern Forest 72 759 14 (73)15 (22) 13(5)
Quebec Forest Activity Zone 44 717 15 (100)
Quebec Ile DAnticosti 795 15 (100)
Quebec Lac St Jean 964 15 (100)
Quebec Southern RU15 1 687 15 (100)
Ontario Thunder Bay 225 16(100)
Ontario Southern 8 198 17 (100)
Ontario Manitoulin Island 326 17 (100)
Ontario Northern Forest 46 468 18 (56) 16 (43) 19 (1)
Ontario SudburyNorth Bay 874 19 (100)
Ontario Forest Activity Zone 42 398 19 (56) 16 (43) 18 (1)
Ontario Sault Ste Marie 536 19 (92) 17 (8)
Manitoba Forest Activity Zone RU22 East 2 405 22 (100)
Manitoba Forest Activity Zone RU22 North 6 109 22 (100)
Manitoba Prairie Fringe RU22 804 22 (100)
Manitoba Northern Forest 37 339 22 (43) 21 (35) 25 (19) 23 (3)
Manitoba Forest Activity Zone RU23 7 382 23 (100)
Manitoba Prairie Fringe RU23 3 970 23 (100)
Manitoba Hotspot 851 24 (100)
Manitoba North Prairie 6 117 24 (100)
Canadian Forest Service | Pacific Forestry Centre | nrcangccaforestsresearch-centrespfc1348930
Deforestation strata unit name Strata unit area (kilohectares)
Reconciliation unit ( inclusion)
Saskatchewan Northern Forest 21 224 27 (75) 26 (22) 28 (3)
Saskatchewan Prairie Fringe 5 509 28 (100)
Saskatchewan Inactive Forest Activity Zone 6 196 28 (58) 27 (42)
Saskatchewan Forest Activity Zone 8 189 28 (99) 27 (1)
Saskatchewan North Prairie 8 167 29 (100)
Saskatchewan Prairie 15 921 30 (100)
Alberta Northern Forest 10 862 31 (58) 34 (28) 32 (8) 33 (6)
Alberta Forest Activity Zone 22 066 34 (100)
Alberta Fort McMurray 807 34 (100)
Alberta High Level 789 34 (100)
Alberta Northwest Fringe 5 436 34 (100)
Alberta Prairie Fringe 6 038 34 (100)
Alberta North Prairie 7 397 35 (100)
Alberta RU 36 Forest Activity Zone 4 764 36 (100)
Alberta Palliser Triangle 3 689 37 (100)
Alberta Prairie West 4 522 37 (100)
British Columbia RU 38 6 759 38 (100)
British Columbia Prairie Fringe 2 333 39 (100)
British Columbia RU 40 19 220 40 (100)
British Columbia Lower Mainland East Vancouver Island
1 142 41 (100)
British Columbia RU 41 Forest Activity Zone 15 440 41 (100)
British Columbia VI QCI 3 813 41 (100)
British Columbia Okanagan 1 109 42 (100)
British Columbia Prince George 464 42 (100)
British Columbia RU 42 Forest Activity Zone 44 286 42 (96) 39 (4)
Yukon Arctic 496 43 (100)
Yukon Northern Forest 19 987 45 (91) 44 (9)
Yukon Whitehorse 417 46 (100)
Yukon Forest Activity Zone 27 440 46 (98) 47 (1)
Northwest Territories Arctic 42 788 48 (49) 49 (43) 50 (7)
Northwest Territories Northern Forest 91 972 50 (52) 51 (37) 53 (9) 52 (2)
Northwest Territories Yellowknife 176 51 (100)
Northwest Territories Forest Activity Zone 467 54 (100)
Nunavut Arctic 198 915 56 (64) 57 (25) 55 (11)
Nunavut Northern Forest 9 892 58 (100)
nrcangccaforests
For more information about the Canadian Forest Service visit our website at nrcangccaforests or contact any of the following Canadian Forest Service establishments
Canadian Forest Service Contacts
Atlantic Forestry Centre PO Box 4000 Fredericton NB E3B 5P7 Tel (506) 452-3500 Fax (506) 452-3525 nrcangccaforestsresearch-centresafc13447
Atlantic Forestry Centre ndash District Office Sir Wilfred Grenfell College Forestry Centre University Drive Corner Brook NF A2H 6P9 Tel (709) 637-4900 Fax (709) 637-4910
Laurentian Forestry Centre 1055 rue du PEPS PO Box 3800 Sainte-Foy PQ G1V 4C7 Tel (418) 648-5788 Fax (418) 648-5849 nrcangccaforestsresearch-centreslfc13473
Great Lakes Forestry Centre PO Box 490 1219 Queen St East Sault Ste Marie ON P6A 5M7 Tel (705) 949-9461 Fax (705) 759-5700 nrcangccaforestsresearch-centresglfc13459
Northern Forestry Centre 5320-122nd Street Edmonton AB T6H 3S5 Tel (403) 435-7210 Fax (403) 435-7359 nrcangccaforestsresearch-centresnofc13485
Pacific Forestry Centre 506 West Burnside Road Victoria BC V8Z 1M5 Tel (250) 363-0600 Fax (250) 363-0775 nrcangccaforestsresearch-centrespfc13489
Headquarters 580 Booth St 8th Fl Ottawa ON K1A 0E4 Tel (613) 947-7341 Fax (613) 947-7396
Canadian Wood Fibre Centre A virtual research centre of the Canadian Forest Service Natural Resources Canada nrcangccaforestsresearch-centrescwfc13457
1
2
3
5
6
4
1
25
3 6
4
1
To order publications online visit the Canadian Forest Service Publications website at
cfsnrcangccapublications
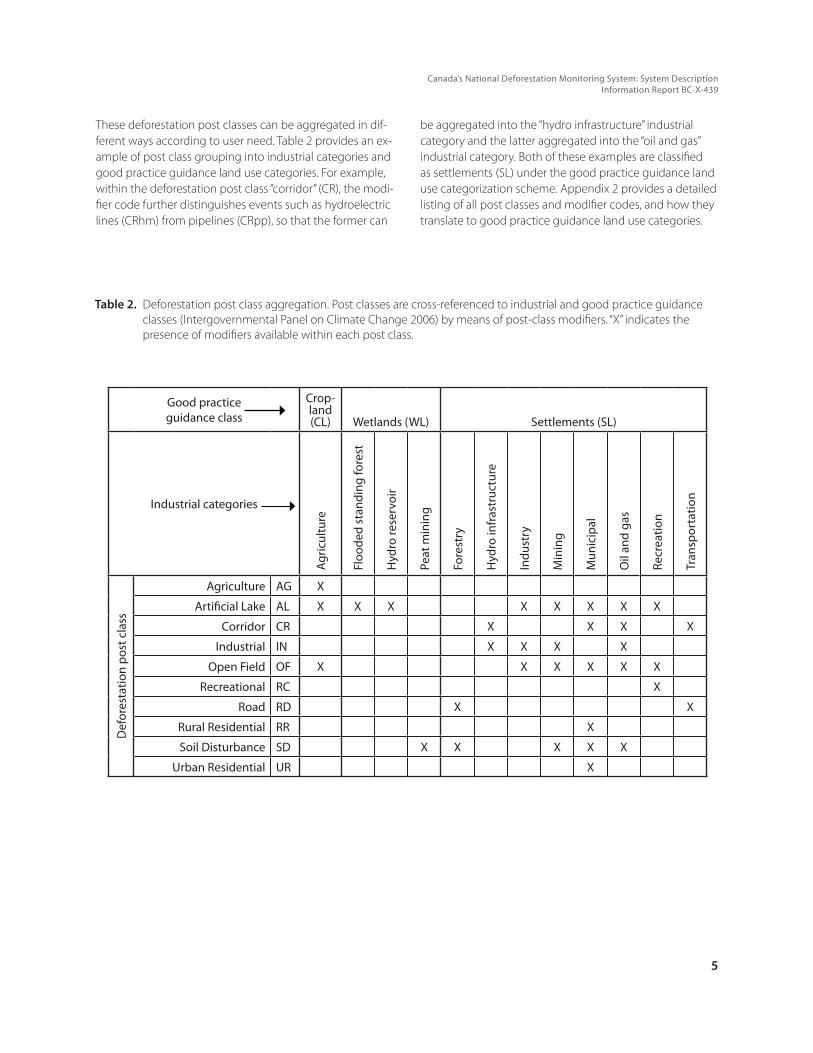
Canadarsquos National Deforestation Monitoring System System DescriptionInformation Report BC-X-439
5
These deforestation post classes can be aggregated in dif-ferent ways according to user need Table 2 provides an ex-ample of post class grouping into industrial categories and good practice guidance land use categories For example within the deforestation post class ldquocorridorrdquo (CR) the modi-fier code further distinguishes events such as hydroelectric lines (CRhm) from pipelines (CRpp) so that the former can
be aggregated into the ldquohydro infrastructurerdquo industrial category and the latter aggregated into the ldquooil and gasrdquo industrial category Both of these examples are classified as settlements (SL) under the good practice guidance land use categorization scheme Appendix 2 provides a detailed listing of all post classes and modifier codes and how they translate to good practice guidance land use categories
Table 2 Deforestation post class aggregation Post classes are cross-referenced to industrial and good practice guidance classes (Intergovernmental Panel on Climate Change 2006) by means of post-class modifiers ldquoXrdquo indicates the presence of modifiers available within each post class
Good practice guidance class
Crop-land (CL) Wetlands (WL) Settlements (SL)
Industrial categories
Agric
ultu
re
Floo
ded
stan
ding
fore
st
Hyd
ro re
serv
oir
Peat
min
ing
Fore
stry
Hyd
ro in
fras
truc
ture
Indu
stry
Min
ing
Mun
icip
al
Oil
and
gas
Recr
eatio
n
Tran
spor
tatio
n
Def
ores
tatio
n po
st c
lass
Agriculture AG X
Artificial Lake AL X X X X X X X X
Corridor CR X X X X
Industrial IN X X X X
Open Field OF X X X X X X
Recreational RC X
Road RD X X
Rural Residential RR X
Soil Disturbance SD X X X X X
Urban Residential UR X
Canadian Forest Service | Pacific Forestry Centre | nrcangccaforestsresearch-centrespfc134896
Figure 2 Deforestation strata units and sampling framework Canada is stratified into types of land that have distinct patterns and rates of deforestation Deforestation mapping has been completed in the areas indicated by shading
The pretype and post class attributes are used for a range of applications including the calculation of greenhouse gas emissions in the CBM-CFS3 (Kurz et al 2009) Because of different type and carbon density of the forest being removed and different treatment and fate of woody debris and soil carbon for deforestation to different land uses some land use transitions result in differing amounts and rates of greenhouse gas emissions than others even when removing similar forest Therefore it is important to have the pretype and post class information available for input into emissions estimation and analysis tools
4 ImplementationDeforestation monitoring begins with visual interpreta-tion of satellite imagery Data are collected from relevant sources to support the work of expert interpreters who use all available lines of evidence to map and attribute de-forestation events Mapped deforestation events in sample
cells within a stratified sampling approach are compiled in a GIS database and used to estimate deforestation rates by scaling from sample to national estimates
A systematic sequence of operational steps is followed whereby mapping work is broken up into work or project packages for completion by in-house Canadian Forest Service technical staff provincial partners or contractors and then passed through a series of quality control checks before being included in the compilation and estimation procedures (see Section 51 for more details)
41 Stratification and Sampling
Deforestation mapping is guided by the stratification of the Canadian landscape into units of land having similar patterns and rates of deforestation (Figure 2) This stratifica-tion is done so that sampling effort can be directed where it is most needed Sampling rates are set for each stratum according to intelligence about deforestation activity
Canadarsquos National Deforestation Monitoring System System DescriptionInformation Report BC-X-439
7
The deforestation strata were created incorporating infor-mation from ecozone locations forest tenure boundaries known and interpreted land use and landscape patterns and provincial and territorial boundaries The strata are fur-ther refined into ldquodeforestation strata unitsrdquo which are gen-erally the deforestation strata within a single reconciliation unit but sometimes within several adjacent reconciliation units Appendix 3 lists the deforestation strata units and gives their size and spatial relationship with reconciliation units More detailed discussion of the stratification process is provided by Leckie et al (2006a and 2006b) Hotspots are areas (strata units) of localized high deforestation activ-ity such as rapidly expanding urban areas Hotspots are delineated to exclude high-activity areas from the larger deforestation strata The deforestation rates in hotspots can be far greater than the levels observed in the larger strata and these areas should therefore be treated separately
The sampling density within each stratum varies depend-ing on a number of factors including the level of deforesta-tion activity and resource constraints A sampling rate of approximately 12 is obtained by establishing
35 times 35 km sample units (termed ldquocellsrdquo) at the intersec-tions of a regular 10 times 10 km grid This grid is aligned with the National Forest Inventoryrsquos 20 times 20 km grid A sampling rate of 6 is obtained by excluding every second cell as shown on the left side of red line in Figure 3 Higher sampling densities are used in strata where more precise estimates are needed When resources permit full-area mapping is conducted in some strata such as hotspots Leckie et al (in review) provide details on sample design considerations
The actual mapping is done on a scene basis and therefore gaps between scenes exist in some strata which reduces the sampling rate somewhat from the target rate These gaps are more common in some early mapping due to the fact that Landsat scenes were not free at that time In addition to focus efforts on regions of high deforestation a subset of some low-deforestation strata (eg forest activity strata of Quebec and Ontario (Figure 2)) was identified based on a systematic pattern of Landsat scene coverages and deforestation was then mapped in sample cells within the sub-area (eg for a 6 sample)
Figure 3 Sampling intensity in two different deforestation strata The sample cells in a stratum are collectively referred to as a sample ldquogridrdquo This example illustrates 6 sampling in the left stratum (blue grid) and 12 sampling in the right stratum (yellow grid)
Canadian Forest Service | Pacific Forestry Centre | nrcangccaforestsresearch-centrespfc134898
The sampling rate for a stratum is the proportion of the to-tal area examined divided by the total area of the stratum Total area examined is the area of the sample cells reduced by any area within them deemed non-interpretable owing to cloud shadow or lack of imagery which is generally less than 2 of the total area mapped
The sample coverage has been improving with more coverage in recent mapping periods in most deforestation strata (see Figures 4ndash6) The sample area is larger for map-
ping period P2 (1990ndash2000) and P3 (2000ndash2008) than for mapping period P1 (1975ndash1990) The P2 period has several large areas with full-area mapping The sample coverage for periods P1 P2 and P3 has likely stabilized at that shown in Figures 4 5 and 6 respectively This coverage was built up over time early national reporting of deforestation was derived from smaller sample coverages and indeed the P3 sample estimate was not introduced to the national deforestation report until 2010
Figure 4 Deforestation strata sampling rates for mapping period P1 (1975ndash1990)
Canadarsquos National Deforestation Monitoring System System DescriptionInformation Report BC-X-439
9
Figure 5 Deforestation strata sampling rates for mapping period P2 (1990ndash2000)
Figure 6 Deforestation strata sampling rates for mapping period P3 (2000ndash2008)
Canadian Forest Service | Pacific Forestry Centre | nrcangccaforestsresearch-centrespfc1348910
The total area of Canada covered by the sampled regions (ie the shaded area in Figure 2) in one or more time periods is 346 times 106 km2 This includes full-area map-ping for 56 times 105 km2 of hydro survey areas in northern Quebec and another 25 times 105 km2 in northern Manitoba in which only hydroelectric development deforestation was mapped Excluding hydro survey areas the area of the sample cells interpreted was 165 times 105 km2 in P1 409 times 105 km2 in P2 and 218 times 105 km2 in P3 The large sample area for P2 reflects the greater amount of full-area mapping
42 Data Sources and Information Collection
Remote sensing imagery is the most critical input to the process of deforestation monitoring In the NDMS image data are used to identify the location size and timing of events These data are also used to determine pre-existing forest types and subsequent post classes The NDMS em-ploys medium-resolution satellite imagery in combination with high-resolution satellite and air photo data wherever available Ancillary sources in the form of spatial data and non-spatial records are used to support the mapping process and act as supplementary sources for estimation and quality control
421 Core Image Data
Landsat is the primary data source for deforestation map-ping Landsat series satellites have been acquiring data since the early 1970s and provide a consistent data stream for all NDMS mapping periods with a spatial and spectral detail suitable for deforestation mapping The current Landsat instruments are medium-resolution sensors with 30 times 30 m pixels and a large image footprint (170 times 185 km) Each satellite has a return period of 16 days with continual image acquisition and scene sidelap that increases at higher latitudes
Landsat imagery formerly available for purchase was made freely available by the United States Geological Survey starting in January 2009 (Wulder et al 2012) For mapping done before 2009 data had to be purchased and thus image acquisition focussed on the basic summer data for core dates (circa 1975 1990 2000 and 2008) and winter imagery in more difficult-to-interpret regions For mapping done after 2009 more imagery was used and additional dates were added to help identify with more precision when deforestation events occurred and also help increase mapping confidence This new imagery was also used to review any previous mapping
422 Additional Image Data
Delineating deforestation boundaries can benefit from use of high-resolution imagery Higher-resolution data are also very useful in supporting the interpretation of pre-existing conditions and forest types and in confirming deforesta-tion and better identifying the post class and post-class modifier High-resolution imagery is therefore used to supplement core Landsat data wherever possible
Data are continuously being sought out by NDMS staff for example a 25 m resolution SPOT 5 panchromatic mosaic of the Prairies (circa 2006) was provided by Agriculture and Agri-Foods Canada and a 10 m SPOT 45 national coverage called GeoBase1 was obtained from the Centre for Topographic Information of Natural Resources Canada The SPOT 45 satellites offer a higher spatial resolution but provide fewer spectral bands than Landsat Various aerial photo data sets have been assembled through partner-ships with provincial governments and other agencies in-cluding National Air Photo Library imagery provincial aerial photography and high-resolution satellite image data sets
Google Earthtrade and Bing Mapstrade are a valuable resource with an ever-expanding selection of recent high-resolution imagery over population centres and many other regions of the country In some cases archives of older imagery (eg circa 2002) are also available and can be accessed through the Time Slider tool available in Google Earth Even current high-resolution imagery can help with the identification of events that occurred in an earlier time period
423 Ancillary Spatial Data
Ancillary data are also incorporated to support the inter-pretation process These data may be used to validate or confirm deforestation occurrence or to support the interpretation of prior forest type or post-change land use Some data types are available nationally whereas others are present only within limited extents Such data include GIS data sets of road networks hydrology wetlands wood-ed areas from provincial base maps pit and quarry licence areas forest inventories forest management tenure areas specialized oil and gas pipeline and well pad databases field oblique photos and other data
In addition to the satellite and aerial photo data described above Google Earthtrade offers further ancillary spatial data in the form of terrain display crowd-sourced Panoramiotrade photographs ground-based StreetViewtrade photography and other useful layers
1 See httpwwwgeobasecageobaseendataimageryimrindexhtml
Canadarsquos National Deforestation Monitoring System System DescriptionInformation Report BC-X-439
11
424 Records Data
Spatial and non-spatial records and activity data may also be incorporated into the estimation or quality control processes In early deforestation reports records and activity data were sometimes used to provide estimates of deforestation associated with a particular sector and area As more mapping was completed estimates from records were replaced by mapping-based information Records data used in the past have included hydroelectric clearing areas forestry road records and standard road class widths and oil and gas pipeline records
43 Mapping
Deforestation event mapping is done using core date im-agery and multi-band image products Mapping is broken up into units of mapping work called ldquoproject packagesrdquo to be completed by internal staff provincial partners or qualified private sector contractors All relevant images and supporting data are assembled as a package for mapping in a particular area Detection interpretation digitization and attribution of individual deforestation events is done manually by trained interpreters according to the estab-lished NDMS methods in a standardized ArcGIS geodata-base (Leckie et al 2012)
431 Data Handling
Interpretation of deforestation events requires the detec-tion of change between pairs of images acquired at two ldquocore datesrdquo chosen to best represent the mapping time period start and end year (ie 1975 1990 2000 and 2008) Forest cover changes or potential events are highlighted using a multi-temporal display or ldquochange enhancementrdquo image created using the visible red band from two core dates of imagery When the mapping period end date image is displayed using the red image colour gun and the mapping period start image is displayed using green and blue the resulting image shows areas of vegetation loss as red In addition possible deforestation events can be detected by comparing the two core images directly Many changes besides deforestation can cause a difference between the images (eg forest harvest forest fires beaver dam flooding wind blowdown agricultural field changes and avalanches) so it is critical that a change event be confirmed as deforestation before it is mapped
Individual deforestation events are manually interpreted and identified delineated and attributed Figures 7 and 8 illustrate some of the data that are used in this process Landsat multiple band combinations at both core dates change enhancement higher-resolution imagery and field oblique aerial photographs
Figure 7 Examples of various Landsat satellite band combinations and change enhancements that may be used in the mapping process Note the change enhancement at right shows red triggers where vegetation loss or change has occurred Band combinations shown are normal colour rendition on left with colour infrared in the middle The right-hand column shows Landsat Thematic Mapper (TM) and Enhanced Thematic Mapper (ETM) bands 453 (ie the two near infrared bands and a red band) displayed as red green blue
Canadian Forest Service | Pacific Forestry Centre | nrcangccaforestsresearch-centrespfc1348912
Figure 8 Examples of supplemental data use Left Example of confirmed and interpreted events (red and yellow lines) shown as polygons on the SPOT imagery (25 m resolution SPOT 5 top left and 10 m SPOT 4 bottom left) Right Example of flight path and oblique aerial photograph from a deforestation field verification campaign
Typically the interpretation process is conducted in a GIS environment where change enhancement and single-date images can be layered and compared by blinking or using the swipe tool Georeferenced ancillary imagery can be simultaneously displayed and a link between ArcGIS and Google Earth allows the synchronization of spatial display extents in both programs
432 Project Packages
Project packages are units of mapping work They include specification of the mapping area time period to be mapped and the sample cells to be used Each project package contains a standardized geodatabase with pre-defined sets of values for some of the attribute fields core date and change enhancement imagery other imagery in-cluding winter and overlapping scenes from east and west of the scene being mapped additional SPOT and aerial photographs (if available) and ancillary data sets
Once the mapping has been completed for a project and passed successfully through quality control the data are added to the national geodatabase which carries all defor-estation mapping data for the country including all time
periods The structure of the project geodatabases mirrors the structure of the national geodatabase
433 Interpretation
Image interpretation is done manually on a cell-by-cell ba-sis Typically the change enhancement is used first to iden-tify change events These are then confirmed or refuted as deforestation by the interpreter using the individual core date images supported by other image and ancillary data The supporting data are used to assess whether an event area was forested before the change and whether the event meets the deforestation definition Supporting data are also used to help interpret pretype and post class
The boundary of a deforestation event is identified in the Landsat images but higher-resolution imagery is used in a supporting role to improve event boundary delineation Interpreters follow specific digitizing guidelines provided in the Deforestation Interpretation Guide (Leckie et al 2012) that dictate how events shall be mapped (eg digitize smooth lines rather than following pixel boundaries avoid gaps and overlaps between adjacent events keep the mapping topology clean etc)
Canadarsquos National Deforestation Monitoring System System DescriptionInformation Report BC-X-439
13
Deforestation events may be linear in form (eg roads hydro lines) or polygonal They are digitized accordingly as lines or polygons in the project geodatabase Specific guidelines apply for each type of feature Delineation fol-lows clearly defined situational rules (eg for compositemixed use polygons roads in cutblocks tertiary versus more significant roads episodic clearing etc) all of which are addressed in detail in the Deforestation Interpretation Guide When events extend beyond the boundaries of a sample cell they are delineated to the full extent of the event but only the portion inside the cell is included in the estimation
Event attributes are interpreted and recorded using attri-bute values defined in the NDMS data dictionary Pretype attributes include forest type density and maturity (see Appendix 1 for details) Post class attributes are listed in Table 2 (see Appendix 2 for details) Interpreters also record their level of confidence about each deforestation event (ie how confident they are that it was forest before the change and that it is indeed a new land use) Comment fields are used extensively to record details specific to each event These may indicate uncertainty in an event a request by the interpreter for specific review by the qual-ity control person or the need for checking the event in a later time period The widths for linear events (such as roads or corridors) are also recorded as it is more efficient to map these as lines and later convert to polygons using the width data during a subsequent processing stage
If mapping already exists for an earlier time period in the area the interpreter reviews it in the context of recent imagery either to confirm the previous interpretations or to note whether corrections are required Points are used to flag areas for revision or later review by analysts such as where older mapping may require updating
In some cases imagery available for a core date is contami-nated by clouds shadows or missing data at image edges In such cases the interpreter digitizes the contaminated area within the sample cells and saves the polygon into a special geodatabase layer for ldquonon-interpretable areardquo poly-gons and notes the affected date The areas saved into this layer are removed from the sample during later processing to create what is termed the ldquointerpretable gridrdquo The open-ing of the Landsat archive through free access to geocor-rected imagery has substantially reduced the amount of
non-interpretable area entering the estimate calculations For example sometimes images outside the core date can be used to infer deforestation in the non-interpretable area In fact recently non-interpretable areas have been almost eliminated from the process
A series of quality checks has been built into the mapping process these are completed in every mapping project Canadian Forest Service analysts conduct quality control checks of the mapped data (see Section 5) and return a set of quality control points to the interpreters indicating where more work and specific changes are needed before the mapping can be loaded into the national geodata-base
44 Deforestation Estimation
The mapping data from deforestation sample cells are used to estimate the area of deforestation in each RU by scaling up from sample to population in each defor-estation stratum and then summing the deforestation estimate for each stratum in an RU Scaling up is done for each land use type (post-class modifier) in each time period Temporal interpolation is used to compute annual deforestation rates Lastly large event mapping records and activity data and intelligence are used to refine the estimates when appropriate
441 GIS processing
The national deforestation geodatabase contains all the mapped areas representing deforestation events sampled within each time period as lines and polygons The geo-database also contains layers required for the estimation calculations including the sample grids the non-interpre-table areas the Landsat image boundaries (which define the core dates and areas sampled) the deforestation strata boundaries and the RU boundaries
The spatial data are first processed to prepare them for the scaling up analysis which is conducted later in a non-spa-tial database program (Section 444) Figure 9 provides a schematic of the tasks involved in the GIS processing (Burt et al 2006) The two main calculated outputs produced are the event and grid tables shaded in red in Figure 9 The processing of the mapped GIS data for the national sum-mary is performed for each time period
Canadian Forest Service | Pacific Forestry Centre | nrcangccaforestsresearch-centrespfc1348914
Figure 9 Simplified deforestation GIS processing flow Input tables are in green processes in yellow and output tables in red Gold arrows denote updates to a table The term ldquolinesrdquo refers to linear deforestation events ArcGIS commands are underlined
Canadarsquos National Deforestation Monitoring System System DescriptionInformation Report BC-X-439
15
The first of the output tables the ldquointerpretable gridrdquo (labelled grd_ident in Figure 9) defines the actual area for which mapping was done As a result the full set of sample cells is clipped by the extent of the Landsat imagery (thus removing portions of the cells that fall outside the Landsat image boundary) and has the non-interpretable areas (eg clouds) removed
The second table the ldquoFinal Event Polygonsrdquo (labelled py_fn) is created from the intersection of many input lay-ers The post-class modifier code for each event is carried through in these deforestation calculations The linear de-forestation events are converted to polygons by applying a buffer according to the width attribute associated with each line then combined with the other deforestation polygon events to create a complete polygonal coverage of all deforestation events mapped The events are then intersected with the interpretable grid layer Further inter-sections are applied to the boundary RU and deforestation strata layers to identify which strata and RU are associ-ated with each event In the end the data for each event include attributes drawn from all the intersected layers including the deforestation stratum and RU of each event As well small slivers created during the GIS processing steps are removed
At this stage it is possible to calculate the rate of deforesta-tion for each time period All events are assigned to the time period in which they occur (ie P1 [1975ndash1990] P2 [1990ndash2000] or P3 [2000ndash2008]) based on the core dates of imagery used for mapping For each event an effective annual rate of deforestation (hectares per year) is calculat-ed by dividing the deforested area by the number of years between the core dates Later in the process the resulting per-event annual rates are summed for each stratum and divided by the area of grid cells interpreted to determine the average annual rate for each time period and post-class modifier (Section 444)
To provide flexibility the mapping activity captures forest clearings that meet a more inclusive definition of defor-estation than strictly required Land conversion of sparse forest does not constitute deforestation (unless it is conver-sion of a recently disturbed or regenerating area) but is mapped for completeness unless otherwise specified The GIS processing steps are used to exclude such mapped events with sparse forest density
442 Large Events and Records Data
Certain types of events that are large uncommon and iso-lated (eg hydroelectric reservoirs new surface mines long and major hydroelectric lines etc) are better represented by complete mapping and census rather than sampling (Leckie et al [in review]) Such events termed ldquolarge eventsrdquo are mapped separately and completely using either core date imagery or imagery captured as close to the actual event dates as possible When large events fall within sample cells and thus are also captured by the sampling
these are excluded from the processing of sample data to avoid double-counting
Records and activity data when used for a given type of deforestation in a region (eg stratum) are added to the database and removed from the processing of sample data similar to large events (see Section 424)
443 Expert Intervention
After the mapping and GIS processing steps have been completed the initial estimation results are analyzed to identify potential problems With the nature of deforesta-tion in Canada and intensity of the sample occasionally spurious estimates may occur
Canadian Forest Service deforestation monitoring ex-perts have accumulated familiarity with land use change patterns and activities in Canada over many years These experts scrutinize NDMS estimation process outputs and investigate questionable outputs that may be then modi-fied if a change is justified
When suspicious estimation outputs are encountered ex-perts intervene by evaluating available records information and reconnaissance data For example when a particular event type is rare and sampling produces estimates that are unexpectedly high or low expert reviewers may scan available imagery to see what is occurring outside the sample cell boundaries (ie in the non-sampled area) and use this to inform expert intervention Estimation outputs may be deemed suspicious when they contradict previous estimates or other available lines of evidence All expert interventions are documented for transparency and in case they need to be reassessed as new evidence emerges (eg Leckie et al 2009 Leckie et al 2010)
444 Database Processing
Annualized national deforestation estimates are produced for each industrial sector and RU by combining the GIS data and any large event or recordsactivity data and incorporating expert interventions These data are loaded into a non-spatial database environment (Paradine 2007) The resulting estimates are used to produce customized re-ports for NDMS data users such as provincial government agencies Canadarsquos National Forest Carbon Monitoring Accounting and Reporting System for input to greenhouse gas emission estimation and others
The non-spatial part of the processing follows the work flow shown in Figure 10 The ratio of the area sampled (the ldquointerpretable gridrdquo) to the area of the stratum is calculated (labelled ldquo1rdquo in Figure 10) The area of deforestation in the sample is then scaled up by this proportion (labelled ldquo2rdquo in Figure 10) to produce the deforestation estimate for the stratum This process is repeated for all strata time periods and post classes (including post-class modifiers) using the mapped sample data only
Canadian Forest Service | Pacific Forestry Centre | nrcangccaforestsresearch-centrespfc1348916
Figure 10 Schematic of the deforestation database process used to produce estimates
Canadarsquos National Deforestation Monitoring System System DescriptionInformation Report BC-X-439
17
The expert intervention can be added at the strata level for a particular time period as an adjustment factor (labelled ldquo3rdquo in Figure 10) or as replacements or additions (labelled ldquo4rdquo in Figure 10) to existing data It can also be applied at the RU level (labelled ldquo7rdquo in Figure 10) Early national deforesta-tion reporting had more expert interventions because of lower sample rates less availability of high-resolution imagery and more use of records data over the remote sensing sample Currently few expert interventions occur with most occurring for the 1975ndash1990 time period which has a smaller sample
At the strata level the updated deforestation estimates by time period and post-class modifier are proportioned (labelled ldquo5rdquo in Figure 10) into their respective RUs (see Ap-pendix 3)
The data are then annualized The deforestation estimates for each time period (by post class and RU) are assigned
to the middle year of the time period (ie 1983 for 1975ndash1990 1995 for 1990ndash2000 and 2004 for 2000ndash2008) Annual trends are produced by applying linear interpola-tion between midpoints and extrapolation from endpoints (labelled ldquo6rdquo in Figure 10) Figure 11 provides one example
Large event mapping data records and activity data and expert interventions are applied as shown by the various green boxes in Figure 10 Large event data have the year of the event attached to them and are added to the mapping data at the RU level (labelled ldquo7rdquo in Figure 10) Records data also generally have a date attached and are added to the annualized data in a similar fashion to large event data
Figure 12 shows the trend line calculated in Figure 11 and the large event data (purple) representing hydro reservoir flooding facility construction and associated transporta-tion and hydro line corridors
Figure 11 Example deforestation trend produced using data from three mapping periods
Canadian Forest Service | Pacific Forestry Centre | nrcangccaforestsresearch-centrespfc1348918
Figure 12 Example of a deforestation area trend from sample mapping (red) and large events data (purple)
The post-class modifier classes (Table 1 and Table A21 in Appendix 2) are aggregated (labelled ldquo8rdquo in Figure 10) to the appropriate industrial category and good practice guidance class using a lookup table The various modifiers within each deforestation post class provide flexibility to summarize to different industrial categories based on user requirements (eg the categories used by the National For-est Carbon Monitoring Accounting and Reporting System and shown in Tables A21 and A22)
The result of the processing is a series of database tables A major product among these is the list of annual deforesta-tion area per RU per industrial class (labelled ldquo9rdquo in Figure 10) Another product is the breakdown of forest pretype percentages by RU this is done by calculating the percent-age area of each pretype mapped in the RU Reporting for the UNFCCC requires separate estimates of deforestation and greenhouse gas emissions for managed and unman-aged forest thus a separate table is produced for unman-aged forest (labelled ldquo10rdquo in Figure 10)
5 Quality ControlThree major quality control stages are applied during the deforestation mapping process
1 initial mapping quality control
2 revision quality checks and
3 overall quality assurance or vetting where a check on the final mapping data is performed
This multi-stage approach reduces the likelihood of errors and increases consistency of and confidence in the final product The data processing stage has further checks for data integrity After the data are calculated in the esti-mate process the final numbers and trends are assessed for changes from previous year estimates Deforestation estimates are also scrutinized by external users before they incorporate the data into their applications For an over-view of quality control practices see Dyk et al (2011)
51 Quality Control at the Mapping Stage
The mapping process flow is illustrated in Figure 13 includ-ing the quality control steps Typical errors caught through quality control at the mapping stage include incorrect event interpretations or delineations event omissions or commissions missing field values typographical errors and topology problems During the quality control phase an internal Canadian Forest Service reviewer performs detailed checks to ensure consistency with mapping and interpretation rules and returns a set of points to flag and describe the problem areas to the interpreter or contrac-tor These quality control points are stored in the mapping geodatabase as a permanent layer
Canadarsquos National Deforestation Monitoring System System DescriptionInformation Report BC-X-439
19
Figure 13 The deforestation mapping and quality control process flow
The mapping interpreter reviews these points and applies the recommended corrections to the working database The quality control points are sent to the interpreter early and frequently in the project timeline to reduce or avoid propagation of persistent errors or misunderstandings through the duration of the project
The original line and polygon mapping is preserved and re-visions are performed in separate ldquorevised linerdquo and ldquorevised polygonrdquo layers in the project geodatabase Information about the changes including what was done by whom and the date is added for every revised event Any deleted events are also retained in what are termed the ldquodrop lay-ersrdquo to mark the area as a non-deforestation event which is reviewed during future mapping
When the revised data are resubmitted to the Canadian Forest Service the data layers make clear what changes were requested and what changes were made The re-viewer uses these layers to verify that appropriate revisions were properly applied at all quality control points Any further errors or misunderstandings are communicated to the interpreter immediately for resolution At this stage the interpreter can also open a dialogue regarding specific events using additional comment fields in the quality control point layer or personal communication
The next level of quality control is the final vetting This audit step is conducted internally by senior Canadian For-est Service interpreters to ensure consistency of mapping across all projects All aspects of the new data are reviewed during this stage omission and commission errors delinea-
tion and attribution In addition the older mapping data are scanned to ensure newer imagery confirms the original interpretation A set of ldquovet revisionrdquo points is created to mark all adjustments required in the database An analyst works through these point by point to make the necessary changes noting any complex or uncertain events and communicating directly with the vetting interpreter when necessary
Field validation is a desirable aspect of the revision process but is not included during the mapping stage In general field campaigns are conducted on an ongoing basis when resources permit Areas where local knowledge or ground truth information are needed to clarify the interpretation are identified from the interpreter confidence records or the revision point data Dedicated field programs schedule air or ground visits to high-impact and low- to moderate-confidence events Local experts sometimes provide information about ground conditions that can be used to verify and update the database
Throughout the entire mapping and revision process an internal ldquoproject storyrdquo is maintained by the Canadian For-est Service This document summarizes activity on a given project including staff and contractors involved dates and actions completed It also includes detailed explanation of any complex situations or vet revisions as well as notes on any issues raised by the quality control or vetting interpret-ers To maintain consistency analysts who are involved in revisions or who vet revisions read this project story before starting work
Canadian Forest Service | Pacific Forestry Centre | nrcangccaforestsresearch-centrespfc1348920
52 Quality Control at the Data Processing Stage
Once revisions are vetted final data integrity checks are conducted on the project database to find and correct any technical errors such as missing attributes mismatched post classes and modifiers incorrect or reversed event dates inappropriate line widths topology errors overlaps and duplicates and typos This stage is partially automated The final mapping layers can be loaded into the national database only after the integrity checks have been com-pleted
Data quality checks are built into the script that automates the data processing stages The script both delivers reports to the screen while running and dumps to log files which are reviewed by Canadian Forest Service staff to ensure the runs were successful
Transfer of the final GIS tables into the non-spatial defor-estation database is also automated The grid and event tables for each time period are checked before load-ing and the number of records loaded is recorded and compared with previous runs to highlight any potential discrepancies
The database queries and tables used to create the annual estimates by industrial category and RU are controlled by Microsoft Access macros to ensure consistency between the runs
53 Quality Control at the Output Analysis Stage
Following generation of the estimate tables the main out-puts (annualized deforestation by industrial class and RU pretype table and unmanaged forest table) are evaluated closely by Canadian Forest Service experts to ensure that estimates have been calculated properly and that discrep-ancies from previously calculated values can be explained To aid in this effort a comparison spreadsheet is created for each RU showing the deforestation estimates by indus-trial class for the current and previous yearrsquos national run together with illustrations and statistics The experts scru-tinize the data for changes and ensure the new estimates are consistent with the input mapping data Any specific issues and special adjustments required are documented in a report that becomes part of the record for each yearrsquos estimate
54 External Quality Control
Users of the deforestation estimates conduct their own reviews of the data prior to use in their systems and com-municate any issues before incorporating the data into their own business processes When new issues arise these are dealt with and the NDMS quality control processes are updated to catch similar issues in the future
6 ConclusionsDeforestation is the direct human-induced conversion of forested land to non-forested land use The NDMS was de-signed and implemented to provide information needed by Canada to meet its obligation under the UN Frame-work Convention on Climate Change to report the areas affected annually by deforestation Also considered was the need to provide information useful for policy analysis land management and forest stewardship applications Understanding why where and when deforestation occurs is a prerequisite to the development of appropriate policy instruments to optimize land use develop mitigation strat-egies and address cumulative impacts on forest resources
The NDMS uses manual mapping from a satellite remote sensing sampling system informed by records-based information and expert knowledge to provide information about deforestation in Canada The remote sensing map-ping is supported by available ancillary information such as high-resolution imagery forest inventory road networks and other industrial databases Certain types of events that are large and isolated (eg mine and hydroelectric devel-opments) are mapped and incorporated separately in the overall deforestation estimates Occasionally records and activity data on land use changes are incorporated when they are deemed more appropriate than the sampling es-timate The mapping results from the sample are scaled up to regional levels In the data processing stage these data are merged and annualized to produce national deforesta-tion estimates
The system has been used and improved over the last 10 years The flexibility of the NDMSrsquos design makes it possible to adapt to future changes in image sources ancillary data resource availability and user needs and positions the pro-gram well for long-term maintenance and improvement
Canadarsquos National Deforestation Monitoring System System DescriptionInformation Report BC-X-439
21
7 References
Burt W Paradine D Leckie D 2006 Geographic Information system processing of deforestation mapping data for estimating deforested area of Canada Natural Resources Canada Canadian Forest Service Pacific Forestry Centre Victoria BC Report DRS-P-001
Dyk A Tinis S Leckie D 2011 National Inventory Report 2011 Deforestation area estimation for Canada Quality con-trol overview Natural Resources Canada Canadian Forest Service Pacific Forestry Centre Victoria BC Report DRS-N-031
Ecological Stratification Working Group 1996 A national ecological framework for Canada Agriculture and Agri-Foods Canada Research Branch Centre for land and Biological Resources Research and Environment Canada State of the Environ-ment Directorate Ottawa Ont
Environment Canada 2006 National Inventory Report 1990ndash2004 Greenhouse gas sources and sinks in Canada Govern-ment of Canada Submission to the UN Framework Convention on Climate Change httpunfcccintnational_reportsannex_i_ghg_inventoriesnational_inventories_submissionsitems3734php (Accessed August 2014)
Environment Canada 2014 National Inventory Report 1990ndash2012 Greenhouse gas sources and sinks in Canada Govern-ment of Canada Submission to the UN Framework Convention on Climate Change Report issued by Pollutant Inventories and Reporting Division Environment Canada Ottawa Onthttpunfcccintnational_reportsannex_i_ghg_inventoriesnational_inventories_submissionsitems8108php (Accessed August 2014)
Food and Agriculture Organization 2006 2001 Global forest resources assessment 2000 main report United Nations Food and Agriculture Organization Rome Italy FAO Forestry Paper 140
Gillis M Omule A Brierley T 2005 Monitoring Canadarsquos forests The National Forest Inventory Forestry Chronicle 81(2)214ndash221
Intergovernmental Panel on Climate Change 2003 Good practice guidance for land use land-use change and forestry Penman J Gytarsky M Hiraishiet T et al (eds) Institute for Global Environmental Strategies Hayama Japan
Intergovernmental Panel on Climate Change 2006 2006 IPCC guidelines for national greenhouse gas inventories Egg-leston HS Buendia L Miwa K Ngara T Tanabe K (eds) Intergovernmental Panel on Climate Change National Green-house Gas Inventories Programme Institute for Global Environmental Strategies Hayama Japan httpwwwipcc-nggipigesorjppublic2006gl (Accessed January 2015)
Kurz W 2010 An ecosystem context for global forest cover loss estimates Proceedings National Academy of Sciences 107(20)9025ndash9026
Kurz W Apps M 2006 Developing Canadarsquos national forest carbon monitoring accounting and reporting system to meet the reporting requirements of the Kyoto Protocol Mitigation and Adaptation Strategies for Global Change 11(1)33ndash43
Kurz W Dymond C White T Stinson G Shaw C Rampley G Smyth C Simpson B Neilson E Trofymow J Metsaranta J Apps M 2009 CBM-CFS3 A model of carbon-dynamics in forestry and land-use change implementing IPCC standards Ecological Modelling 220(4)480ndash504
Kurz W Shaw C Boisvenue C Stinson G Metsaranta J Leckie D Dyk A Smyth C Neilson E 2013 Carbon in Canadarsquos boreal forest A synthesis Environmental Reviews 21260ndash292
Canadian Forest Service | Pacific Forestry Centre | nrcangccaforestsresearch-centrespfc1348922
Leckie D Dyk A Ortlepp S Tinis S 2010 Records of decision for Canadarsquos national deforestation estimate 2011 Natu-ral Resources Canada Canadian Forest Service Pacific Forestry Centre Victoria BC Report DRS-N-029
Leckie D Dyk A Paradine D Tammadge D Tinis S 2012 Deforestation interpretation guide Natural Resources Canada Canadian Forest Service Pacific Forestry Centre Victoria BC Report DRS-M-030
Leckie D Dyk A Tinis S 12009 Records of decision for Canadarsquos national deforestation estimate Natural Resources Canada Canadian Forest Service Pacific Forestry Centre Victoria BC Report DRS-N-026
Leckie D Paradine D Burt W 2006a Mapping sample coverage for Canadarsquos national deforestation estimate 2006 Natural Resources Canada Canadian Forest Service Pacific Forestry Centre Victoria BC Report DRS-N-002
Leckie D Paradine D Tinis S 2006b Geographic strata for Canadarsquos national deforestation estimates report Natural Resources Canada Canadian Forest Service Pacific Forestry Centre Victoria BC Report DRS-Q-003
Leckie D Paradine D Kurz W Magnussen S [2015] Deforestation mapping sampling designs for Canadian land-scapes Natural Resources Canada Canadian Forest Service Victoria BC In review
Lempriegravere T Kurz W Hogg E Schmoll C Rampley G Yemshanov D et al 2013 Canadian boreal forests and climate change mitigation Environmental Reviews 21(4)293ndash321
Le Queacutereacute C Peters G Andres R Andrew R Boden T et al 2014 Global carbon budget 2013 Earth System Science Data 6689ndash760
Masek J Cohen W Leckie D Wulder M Vargas R de Jong B Healey S Law B Birdsey R Houghton R Mildrexler D Goward S Smith W 2011 Recent rates of forest harvest and conversion in North America Journal of Geophysical Research 116G00K03
McGovern M 2008 Reporting zones GHG spatial reporting structure for Canada 2008 Environment Canada Greenhouse Gas Division Ottawa Ontario
Montreal Process 2009 Criteria and indicators for the conservation and sustainable management of temperate and boreal forests Fourth edition httpwwwmontrealprocessorgdocumentspublicationsgeneral2009p_4pdf (Accessed January 2015)
Pan Y Birdsey RA Fang J et al 2011 A large and persistent carbon sink in the Worldrsquos forests Science 333988ndash993
Paradine D 2007 National Inventory Report 2008 ACCESS database description GIS processing description and consoli-dated GIS database description Natural Resources Canada Canadian Forest Service Pacific Forestry Centre Victoria BC Report DRS-N-019
United Nations Framework Convention on Climate Change 2002 Conference of the PartiesndashReport of the Confer-ence of the Parties on its seventh session held at Marrakesh from 29 October to 10 November 2001 United Nations Office Geneva Switzerland httpunfcccintresourcedocscop713pdf (Accessed January 2015)
Wulder M Masek J Cohen W Loveland T Woodcock C 2012 Opening the archive How free data has enabled the science and monitoring promise of Landsat Remote Sensing of Environment 1222ndash10
Canadarsquos National Deforestation Monitoring System System DescriptionInformation Report BC-X-439
23
Appendix 1 Pretype Forest Conditions
The tables below list the approved forest type density and maturity values applied in deforestation mapping Note not all combinations are valid particularly those that include recent disturbance and regeneration terms Table A11 lists the ac-ceptable parameter combinations
The most common pretype groupings found are the 36 combinations of three Type classes (B C and M) three Density classes (D O and S) and four Maturity classes (R Y I and M) The two older Maturity classes (O and G) require additional verification to identify them Several classes identify recently disturbed forests (K X and R)
Table A11 Pre-change forest type descriptors
TYPE Definition Restrictions of use
B Broadleaf gt 75 of trees are broadleaf (Angiospermae)
C Conifer gt 75 of trees are conifer (Coniferae)
M Mixed gt 25 of both broadleaf and conifer present
K Clearcut Exposed ground and (or) ground vegetation No visible regeneration
Use only with S or N density and Q maturity
X Burn Exposed ground and (or) ground vegetation No visible regen-eration May have live residual trees up to 25 crown closure
Use only with S or N density and Q maturity
R Regen Regenerating areas with lt 25 crown closure where the forest composition (B C or M) is not identifiable
Table A12 Pre-change forest density descriptors
DENSITY Definition Restrictions of use
D Dense gt 60 crown closure
O Open 25ndash60 crown closure
S Sparse 5ndash25 crown closure
N Nil lt 5 crown closure Use only with K and X pretype
Table A13 Pre-change forest maturity descriptors-
MATURITY Definition Restrictions of use
Q Recent disturbance No visible regeneration Use only with K and X pretype
R Regen Forest stands 0ndash14 years old
Y Young Forest stands 15ndash25 years old
I Immature Forest stands 26ndash40 years old
M Mature Forest stands 41ndash80 years old
O Old Forest stands 81ndash200 years old
G Old-growth Forest stands over 200 years old Restricted to British Columbia only
Canadian Forest Service | Pacific Forestry Centre | nrcangccaforestsresearch-centrespfc1348924
Table A14 Valid combinations of pretype attributes (TypendashDensityndashMaturity)
Regen Broadleaf Mixed Coniferous
Dense RDR BDR MDR CDR
BDY MDY CDY
BDI MDI CDI
BDM MDM CDM
BDO MDO CDO
CDG
Open ROR BOR MOR COR
BOY MOY COY
BOI MOI COI
BOM MOM COM
BOO MOO COO
COG
Sparse RSR BSR MSR CSR
BSY MSY CSY
BSI MSI CSI
BSM MSM CSM
BSO MSO CSO
CSG
Burn Clearcut
Regen Broadleaf Mixed Coniferous
Disturbed XSQ KSQ
XNQ KNQ
Canadarsquos National Deforestation Monitoring System System DescriptionInformation Report BC-X-439
25
Appendix 2 Post-class Modifiers by Industrial Category
Table A21 lists all land use post-class deforestation modifiers They provide additional detail regarding what has occurred on the ground for each deforestation event These classes can be assigned to various industrial classes (see Table A22) Detailed definitions are provided in the Deforestation Interpretation Guide (Leckie et al 2012)
Table A21 Post class and post-class modifier codes and short descriptions grouped by industrial categorysector (in bold)
Post class Post class modifier
Agriculture
AG Agriculture ab bare
cp crop
fy farm yard
pa pasture
AL Artificial Lake aa agriculture pond
ea agriculture effluent pond
OF Open Field fa agriculture setting
Flooded Standing Forest
AL Artificial Lake ff flooded standing forest
Forestry
RD Road mf mainline forestry road
sf secondary forestry road
xf tertiary forestry road with width ge 20 m
SD Soil Disturbance ld logging landing
ss rock slide scar
Hydro Infrastructure
CR Corridor hm hydro linendashmain
hs hydro linendashsecondary
xy hydro linendashtertiary ge 20 m
IN Industrial ih hydro infrastructure
Hydro Reservoir
AL Artificial Lake hr hydroelectric flooding
Industry
AL Artificial Lake ei industrial effluent pond
IN Industrial hi heavy industrial
li light industrial
OF Open Field fi industrial
Canadian Forest Service | Pacific Forestry Centre | nrcangccaforestsresearch-centrespfc1348926
Post class Post class modifier
Mining
AL Artificial Lake em waste ponds for mining
IN Industrial mh mine heavy
ml mine light
OF Open Field fk mine facility
fm mine
fq pit and quarry
SD Soil Disturbance mn open pit mine
pq gravel pitquarry
Municipal
AL Artificial Lake ad pond urban setting
ar pond rural residential
ul other human caused
CR Corridor cl cut line
cu undifferentiated
OF Open Field fd urbansuburban
fr rural residential
uf undifferentiated field
RR Rural Residential rf few trees remaining
rm many trees remaining
SD Soil Disturbance lf landfill
su undifferentiated
UR Urban Residential df few trees remaining
dm many trees remaining
Oil and Gas
CR Corridor pp pipelinendashmain
ps pipelinendashsecondary
xp pipelinendashtertiary ge 20 m
IN Industrial oi oil sands industrial
op oil and gas industrial
wp well pad
OF Open Field fo oil and gas facility
fs oil sands open field
SD Soil Disturbance os oil sands
AL Artificial Lake eo oil and gas related pond
Canadarsquos National Deforestation Monitoring System System DescriptionInformation Report BC-X-439
27
Post class Post class modifier
Peat Mining
SD Soil Disturbance pm peat extraction
Recreation
AL Artificial Lake af golf course related
ap recreational water body
OF Open Field fc recreational field
RC Recreational ca campground
go golf course
ru other or undifferentiated
sk ski areas
Transportation
CR Corridor as airstrip
ry railway
RD Road mm main road clearly for a mine
mr main road
mo main road clearly for oil and gas
my main road clearly for hydroelectric
sm secondary mining road
so secondary oil and gas road
sr secondary road
sy secondary hydroelectric road
xm tertiary mining road with width ge 20 m
xo tertiary oil and gas road with width ge 20 m
xr tertiary road with width ge 20 m
xy tertiary hydroelectric road with width ge 20 m
Canadian Forest Service | Pacific Forestry Centre | nrcangccaforestsresearch-centrespfc1348928
Table A22 Aggregation of deforestation mapping classes to good practice guidance and industrial categories
Good practice guidance class
Crop-land (CL)
Wetlands (WL) Settlements (SL)
Industrial Categories
Agric
ultu
re
Floo
ded
stan
ding
fore
st
Hyd
ro re
serv
oir
Peat
min
ing
Fore
stry
Hyd
ro in
fras
truc
ture
Indu
stry
Min
ing
Mun
icip
al
Oil
and
gas
Recr
eatio
n
Tran
spor
tatio
n
Def
ores
tatio
n po
st c
lass
Agriculture AG ab cp pa fy
Artificial Lake AL aa ea ff hr ei emad ar of ul eo af ap
Corridor CR hm hs xy cl cu
pp ps xp as ry
Industrial IN ih hi li mh mloi op wp
Open Field OF fa fi fk fm fq fd fr uf fo fs fc
Recreational RC ca go fu sk
Road RDmf sf xf
mm mo mr my sm so sr sy xm
xo xr xy
Rural Residential RR rf rm
Soil Disturbance SD pm ld ss mn pq lf su os
Urban Residential UR df dm
Canadarsquos National Deforestation Monitoring System System DescriptionInformation Report BC-X-439
29
Appendix 3 Deforestation Strata Units and Reconciliation Unit InclusionTable A31 shows the names of the deforestation strata their area in kilohectares and the percentage of that area contained in each reconciliation unit that they overlap (sorted by reconciliation unit identification number see Figure 1 for unit loca-tion and name)
Table A31 Area of strata units and percent of strata unit area that is in each reconciliation unit
Deforestation strata unit name Strata unit area (kilohectares)
Reconciliation unit ( inclusion)
Newfoundland Eastern Woodlot 4 477 1 (100)
Newfoundland Forest Activity Zone 6 512 1 (100)
Newfoundland St Johns 55 1 (100)
Labrador Arctic 1 893 2 (100)
Labrador Northern Forest 23 238 3 (98) 4 (2)
Labrador Forest Activity Zone 4 620 4 (100)
Nova Scotia Eastern Woodlot 2 894 5 (100)
Nova Scotia Forest Activity Zone 2 396 5 (100)
Nova Scotia HalifaxDartmouth 182 5 (100)
Prince Edward Island 577 6 (100)
New Brunswick Eastern Woodlot 4 121 7 (100)
New Brunswick Forest Activity Zone 3 174 7 (100)
Quebec Arctic 20 443 10 (75) 9 (18) 8 (7)
Quebec Eastern Townships 3 948 11 (100)
Quebec Gaspe Forest Activity Zone 2 740 11 (100)
Quebec Southern RU12 2 968 12 (100)
Quebec Northern Forest 72 759 14 (73)15 (22) 13(5)
Quebec Forest Activity Zone 44 717 15 (100)
Quebec Ile DAnticosti 795 15 (100)
Quebec Lac St Jean 964 15 (100)
Quebec Southern RU15 1 687 15 (100)
Ontario Thunder Bay 225 16(100)
Ontario Southern 8 198 17 (100)
Ontario Manitoulin Island 326 17 (100)
Ontario Northern Forest 46 468 18 (56) 16 (43) 19 (1)
Ontario SudburyNorth Bay 874 19 (100)
Ontario Forest Activity Zone 42 398 19 (56) 16 (43) 18 (1)
Ontario Sault Ste Marie 536 19 (92) 17 (8)
Manitoba Forest Activity Zone RU22 East 2 405 22 (100)
Manitoba Forest Activity Zone RU22 North 6 109 22 (100)
Manitoba Prairie Fringe RU22 804 22 (100)
Manitoba Northern Forest 37 339 22 (43) 21 (35) 25 (19) 23 (3)
Manitoba Forest Activity Zone RU23 7 382 23 (100)
Manitoba Prairie Fringe RU23 3 970 23 (100)
Manitoba Hotspot 851 24 (100)
Manitoba North Prairie 6 117 24 (100)
Canadian Forest Service | Pacific Forestry Centre | nrcangccaforestsresearch-centrespfc1348930
Deforestation strata unit name Strata unit area (kilohectares)
Reconciliation unit ( inclusion)
Saskatchewan Northern Forest 21 224 27 (75) 26 (22) 28 (3)
Saskatchewan Prairie Fringe 5 509 28 (100)
Saskatchewan Inactive Forest Activity Zone 6 196 28 (58) 27 (42)
Saskatchewan Forest Activity Zone 8 189 28 (99) 27 (1)
Saskatchewan North Prairie 8 167 29 (100)
Saskatchewan Prairie 15 921 30 (100)
Alberta Northern Forest 10 862 31 (58) 34 (28) 32 (8) 33 (6)
Alberta Forest Activity Zone 22 066 34 (100)
Alberta Fort McMurray 807 34 (100)
Alberta High Level 789 34 (100)
Alberta Northwest Fringe 5 436 34 (100)
Alberta Prairie Fringe 6 038 34 (100)
Alberta North Prairie 7 397 35 (100)
Alberta RU 36 Forest Activity Zone 4 764 36 (100)
Alberta Palliser Triangle 3 689 37 (100)
Alberta Prairie West 4 522 37 (100)
British Columbia RU 38 6 759 38 (100)
British Columbia Prairie Fringe 2 333 39 (100)
British Columbia RU 40 19 220 40 (100)
British Columbia Lower Mainland East Vancouver Island
1 142 41 (100)
British Columbia RU 41 Forest Activity Zone 15 440 41 (100)
British Columbia VI QCI 3 813 41 (100)
British Columbia Okanagan 1 109 42 (100)
British Columbia Prince George 464 42 (100)
British Columbia RU 42 Forest Activity Zone 44 286 42 (96) 39 (4)
Yukon Arctic 496 43 (100)
Yukon Northern Forest 19 987 45 (91) 44 (9)
Yukon Whitehorse 417 46 (100)
Yukon Forest Activity Zone 27 440 46 (98) 47 (1)
Northwest Territories Arctic 42 788 48 (49) 49 (43) 50 (7)
Northwest Territories Northern Forest 91 972 50 (52) 51 (37) 53 (9) 52 (2)
Northwest Territories Yellowknife 176 51 (100)
Northwest Territories Forest Activity Zone 467 54 (100)
Nunavut Arctic 198 915 56 (64) 57 (25) 55 (11)
Nunavut Northern Forest 9 892 58 (100)
nrcangccaforests
For more information about the Canadian Forest Service visit our website at nrcangccaforests or contact any of the following Canadian Forest Service establishments
Canadian Forest Service Contacts
Atlantic Forestry Centre PO Box 4000 Fredericton NB E3B 5P7 Tel (506) 452-3500 Fax (506) 452-3525 nrcangccaforestsresearch-centresafc13447
Atlantic Forestry Centre ndash District Office Sir Wilfred Grenfell College Forestry Centre University Drive Corner Brook NF A2H 6P9 Tel (709) 637-4900 Fax (709) 637-4910
Laurentian Forestry Centre 1055 rue du PEPS PO Box 3800 Sainte-Foy PQ G1V 4C7 Tel (418) 648-5788 Fax (418) 648-5849 nrcangccaforestsresearch-centreslfc13473
Great Lakes Forestry Centre PO Box 490 1219 Queen St East Sault Ste Marie ON P6A 5M7 Tel (705) 949-9461 Fax (705) 759-5700 nrcangccaforestsresearch-centresglfc13459
Northern Forestry Centre 5320-122nd Street Edmonton AB T6H 3S5 Tel (403) 435-7210 Fax (403) 435-7359 nrcangccaforestsresearch-centresnofc13485
Pacific Forestry Centre 506 West Burnside Road Victoria BC V8Z 1M5 Tel (250) 363-0600 Fax (250) 363-0775 nrcangccaforestsresearch-centrespfc13489
Headquarters 580 Booth St 8th Fl Ottawa ON K1A 0E4 Tel (613) 947-7341 Fax (613) 947-7396
Canadian Wood Fibre Centre A virtual research centre of the Canadian Forest Service Natural Resources Canada nrcangccaforestsresearch-centrescwfc13457
1
2
3
5
6
4
1
25
3 6
4
1
To order publications online visit the Canadian Forest Service Publications website at
cfsnrcangccapublications

Canadarsquos National Deforestation Monitoring System System DescriptionInformation Report BC-X-439
7
The deforestation strata were created incorporating infor-mation from ecozone locations forest tenure boundaries known and interpreted land use and landscape patterns and provincial and territorial boundaries The strata are fur-ther refined into ldquodeforestation strata unitsrdquo which are gen-erally the deforestation strata within a single reconciliation unit but sometimes within several adjacent reconciliation units Appendix 3 lists the deforestation strata units and gives their size and spatial relationship with reconciliation units More detailed discussion of the stratification process is provided by Leckie et al (2006a and 2006b) Hotspots are areas (strata units) of localized high deforestation activ-ity such as rapidly expanding urban areas Hotspots are delineated to exclude high-activity areas from the larger deforestation strata The deforestation rates in hotspots can be far greater than the levels observed in the larger strata and these areas should therefore be treated separately
The sampling density within each stratum varies depend-ing on a number of factors including the level of deforesta-tion activity and resource constraints A sampling rate of approximately 12 is obtained by establishing
35 times 35 km sample units (termed ldquocellsrdquo) at the intersec-tions of a regular 10 times 10 km grid This grid is aligned with the National Forest Inventoryrsquos 20 times 20 km grid A sampling rate of 6 is obtained by excluding every second cell as shown on the left side of red line in Figure 3 Higher sampling densities are used in strata where more precise estimates are needed When resources permit full-area mapping is conducted in some strata such as hotspots Leckie et al (in review) provide details on sample design considerations
The actual mapping is done on a scene basis and therefore gaps between scenes exist in some strata which reduces the sampling rate somewhat from the target rate These gaps are more common in some early mapping due to the fact that Landsat scenes were not free at that time In addition to focus efforts on regions of high deforestation a subset of some low-deforestation strata (eg forest activity strata of Quebec and Ontario (Figure 2)) was identified based on a systematic pattern of Landsat scene coverages and deforestation was then mapped in sample cells within the sub-area (eg for a 6 sample)
Figure 3 Sampling intensity in two different deforestation strata The sample cells in a stratum are collectively referred to as a sample ldquogridrdquo This example illustrates 6 sampling in the left stratum (blue grid) and 12 sampling in the right stratum (yellow grid)
Canadian Forest Service | Pacific Forestry Centre | nrcangccaforestsresearch-centrespfc134898
The sampling rate for a stratum is the proportion of the to-tal area examined divided by the total area of the stratum Total area examined is the area of the sample cells reduced by any area within them deemed non-interpretable owing to cloud shadow or lack of imagery which is generally less than 2 of the total area mapped
The sample coverage has been improving with more coverage in recent mapping periods in most deforestation strata (see Figures 4ndash6) The sample area is larger for map-
ping period P2 (1990ndash2000) and P3 (2000ndash2008) than for mapping period P1 (1975ndash1990) The P2 period has several large areas with full-area mapping The sample coverage for periods P1 P2 and P3 has likely stabilized at that shown in Figures 4 5 and 6 respectively This coverage was built up over time early national reporting of deforestation was derived from smaller sample coverages and indeed the P3 sample estimate was not introduced to the national deforestation report until 2010
Figure 4 Deforestation strata sampling rates for mapping period P1 (1975ndash1990)
Canadarsquos National Deforestation Monitoring System System DescriptionInformation Report BC-X-439
9
Figure 5 Deforestation strata sampling rates for mapping period P2 (1990ndash2000)
Figure 6 Deforestation strata sampling rates for mapping period P3 (2000ndash2008)
Canadian Forest Service | Pacific Forestry Centre | nrcangccaforestsresearch-centrespfc1348910
The total area of Canada covered by the sampled regions (ie the shaded area in Figure 2) in one or more time periods is 346 times 106 km2 This includes full-area map-ping for 56 times 105 km2 of hydro survey areas in northern Quebec and another 25 times 105 km2 in northern Manitoba in which only hydroelectric development deforestation was mapped Excluding hydro survey areas the area of the sample cells interpreted was 165 times 105 km2 in P1 409 times 105 km2 in P2 and 218 times 105 km2 in P3 The large sample area for P2 reflects the greater amount of full-area mapping
42 Data Sources and Information Collection
Remote sensing imagery is the most critical input to the process of deforestation monitoring In the NDMS image data are used to identify the location size and timing of events These data are also used to determine pre-existing forest types and subsequent post classes The NDMS em-ploys medium-resolution satellite imagery in combination with high-resolution satellite and air photo data wherever available Ancillary sources in the form of spatial data and non-spatial records are used to support the mapping process and act as supplementary sources for estimation and quality control
421 Core Image Data
Landsat is the primary data source for deforestation map-ping Landsat series satellites have been acquiring data since the early 1970s and provide a consistent data stream for all NDMS mapping periods with a spatial and spectral detail suitable for deforestation mapping The current Landsat instruments are medium-resolution sensors with 30 times 30 m pixels and a large image footprint (170 times 185 km) Each satellite has a return period of 16 days with continual image acquisition and scene sidelap that increases at higher latitudes
Landsat imagery formerly available for purchase was made freely available by the United States Geological Survey starting in January 2009 (Wulder et al 2012) For mapping done before 2009 data had to be purchased and thus image acquisition focussed on the basic summer data for core dates (circa 1975 1990 2000 and 2008) and winter imagery in more difficult-to-interpret regions For mapping done after 2009 more imagery was used and additional dates were added to help identify with more precision when deforestation events occurred and also help increase mapping confidence This new imagery was also used to review any previous mapping
422 Additional Image Data
Delineating deforestation boundaries can benefit from use of high-resolution imagery Higher-resolution data are also very useful in supporting the interpretation of pre-existing conditions and forest types and in confirming deforesta-tion and better identifying the post class and post-class modifier High-resolution imagery is therefore used to supplement core Landsat data wherever possible
Data are continuously being sought out by NDMS staff for example a 25 m resolution SPOT 5 panchromatic mosaic of the Prairies (circa 2006) was provided by Agriculture and Agri-Foods Canada and a 10 m SPOT 45 national coverage called GeoBase1 was obtained from the Centre for Topographic Information of Natural Resources Canada The SPOT 45 satellites offer a higher spatial resolution but provide fewer spectral bands than Landsat Various aerial photo data sets have been assembled through partner-ships with provincial governments and other agencies in-cluding National Air Photo Library imagery provincial aerial photography and high-resolution satellite image data sets
Google Earthtrade and Bing Mapstrade are a valuable resource with an ever-expanding selection of recent high-resolution imagery over population centres and many other regions of the country In some cases archives of older imagery (eg circa 2002) are also available and can be accessed through the Time Slider tool available in Google Earth Even current high-resolution imagery can help with the identification of events that occurred in an earlier time period
423 Ancillary Spatial Data
Ancillary data are also incorporated to support the inter-pretation process These data may be used to validate or confirm deforestation occurrence or to support the interpretation of prior forest type or post-change land use Some data types are available nationally whereas others are present only within limited extents Such data include GIS data sets of road networks hydrology wetlands wood-ed areas from provincial base maps pit and quarry licence areas forest inventories forest management tenure areas specialized oil and gas pipeline and well pad databases field oblique photos and other data
In addition to the satellite and aerial photo data described above Google Earthtrade offers further ancillary spatial data in the form of terrain display crowd-sourced Panoramiotrade photographs ground-based StreetViewtrade photography and other useful layers
1 See httpwwwgeobasecageobaseendataimageryimrindexhtml
Canadarsquos National Deforestation Monitoring System System DescriptionInformation Report BC-X-439
11
424 Records Data
Spatial and non-spatial records and activity data may also be incorporated into the estimation or quality control processes In early deforestation reports records and activity data were sometimes used to provide estimates of deforestation associated with a particular sector and area As more mapping was completed estimates from records were replaced by mapping-based information Records data used in the past have included hydroelectric clearing areas forestry road records and standard road class widths and oil and gas pipeline records
43 Mapping
Deforestation event mapping is done using core date im-agery and multi-band image products Mapping is broken up into units of mapping work called ldquoproject packagesrdquo to be completed by internal staff provincial partners or qualified private sector contractors All relevant images and supporting data are assembled as a package for mapping in a particular area Detection interpretation digitization and attribution of individual deforestation events is done manually by trained interpreters according to the estab-lished NDMS methods in a standardized ArcGIS geodata-base (Leckie et al 2012)
431 Data Handling
Interpretation of deforestation events requires the detec-tion of change between pairs of images acquired at two ldquocore datesrdquo chosen to best represent the mapping time period start and end year (ie 1975 1990 2000 and 2008) Forest cover changes or potential events are highlighted using a multi-temporal display or ldquochange enhancementrdquo image created using the visible red band from two core dates of imagery When the mapping period end date image is displayed using the red image colour gun and the mapping period start image is displayed using green and blue the resulting image shows areas of vegetation loss as red In addition possible deforestation events can be detected by comparing the two core images directly Many changes besides deforestation can cause a difference between the images (eg forest harvest forest fires beaver dam flooding wind blowdown agricultural field changes and avalanches) so it is critical that a change event be confirmed as deforestation before it is mapped
Individual deforestation events are manually interpreted and identified delineated and attributed Figures 7 and 8 illustrate some of the data that are used in this process Landsat multiple band combinations at both core dates change enhancement higher-resolution imagery and field oblique aerial photographs
Figure 7 Examples of various Landsat satellite band combinations and change enhancements that may be used in the mapping process Note the change enhancement at right shows red triggers where vegetation loss or change has occurred Band combinations shown are normal colour rendition on left with colour infrared in the middle The right-hand column shows Landsat Thematic Mapper (TM) and Enhanced Thematic Mapper (ETM) bands 453 (ie the two near infrared bands and a red band) displayed as red green blue
Canadian Forest Service | Pacific Forestry Centre | nrcangccaforestsresearch-centrespfc1348912
Figure 8 Examples of supplemental data use Left Example of confirmed and interpreted events (red and yellow lines) shown as polygons on the SPOT imagery (25 m resolution SPOT 5 top left and 10 m SPOT 4 bottom left) Right Example of flight path and oblique aerial photograph from a deforestation field verification campaign
Typically the interpretation process is conducted in a GIS environment where change enhancement and single-date images can be layered and compared by blinking or using the swipe tool Georeferenced ancillary imagery can be simultaneously displayed and a link between ArcGIS and Google Earth allows the synchronization of spatial display extents in both programs
432 Project Packages
Project packages are units of mapping work They include specification of the mapping area time period to be mapped and the sample cells to be used Each project package contains a standardized geodatabase with pre-defined sets of values for some of the attribute fields core date and change enhancement imagery other imagery in-cluding winter and overlapping scenes from east and west of the scene being mapped additional SPOT and aerial photographs (if available) and ancillary data sets
Once the mapping has been completed for a project and passed successfully through quality control the data are added to the national geodatabase which carries all defor-estation mapping data for the country including all time
periods The structure of the project geodatabases mirrors the structure of the national geodatabase
433 Interpretation
Image interpretation is done manually on a cell-by-cell ba-sis Typically the change enhancement is used first to iden-tify change events These are then confirmed or refuted as deforestation by the interpreter using the individual core date images supported by other image and ancillary data The supporting data are used to assess whether an event area was forested before the change and whether the event meets the deforestation definition Supporting data are also used to help interpret pretype and post class
The boundary of a deforestation event is identified in the Landsat images but higher-resolution imagery is used in a supporting role to improve event boundary delineation Interpreters follow specific digitizing guidelines provided in the Deforestation Interpretation Guide (Leckie et al 2012) that dictate how events shall be mapped (eg digitize smooth lines rather than following pixel boundaries avoid gaps and overlaps between adjacent events keep the mapping topology clean etc)
Canadarsquos National Deforestation Monitoring System System DescriptionInformation Report BC-X-439
13
Deforestation events may be linear in form (eg roads hydro lines) or polygonal They are digitized accordingly as lines or polygons in the project geodatabase Specific guidelines apply for each type of feature Delineation fol-lows clearly defined situational rules (eg for compositemixed use polygons roads in cutblocks tertiary versus more significant roads episodic clearing etc) all of which are addressed in detail in the Deforestation Interpretation Guide When events extend beyond the boundaries of a sample cell they are delineated to the full extent of the event but only the portion inside the cell is included in the estimation
Event attributes are interpreted and recorded using attri-bute values defined in the NDMS data dictionary Pretype attributes include forest type density and maturity (see Appendix 1 for details) Post class attributes are listed in Table 2 (see Appendix 2 for details) Interpreters also record their level of confidence about each deforestation event (ie how confident they are that it was forest before the change and that it is indeed a new land use) Comment fields are used extensively to record details specific to each event These may indicate uncertainty in an event a request by the interpreter for specific review by the qual-ity control person or the need for checking the event in a later time period The widths for linear events (such as roads or corridors) are also recorded as it is more efficient to map these as lines and later convert to polygons using the width data during a subsequent processing stage
If mapping already exists for an earlier time period in the area the interpreter reviews it in the context of recent imagery either to confirm the previous interpretations or to note whether corrections are required Points are used to flag areas for revision or later review by analysts such as where older mapping may require updating
In some cases imagery available for a core date is contami-nated by clouds shadows or missing data at image edges In such cases the interpreter digitizes the contaminated area within the sample cells and saves the polygon into a special geodatabase layer for ldquonon-interpretable areardquo poly-gons and notes the affected date The areas saved into this layer are removed from the sample during later processing to create what is termed the ldquointerpretable gridrdquo The open-ing of the Landsat archive through free access to geocor-rected imagery has substantially reduced the amount of
non-interpretable area entering the estimate calculations For example sometimes images outside the core date can be used to infer deforestation in the non-interpretable area In fact recently non-interpretable areas have been almost eliminated from the process
A series of quality checks has been built into the mapping process these are completed in every mapping project Canadian Forest Service analysts conduct quality control checks of the mapped data (see Section 5) and return a set of quality control points to the interpreters indicating where more work and specific changes are needed before the mapping can be loaded into the national geodata-base
44 Deforestation Estimation
The mapping data from deforestation sample cells are used to estimate the area of deforestation in each RU by scaling up from sample to population in each defor-estation stratum and then summing the deforestation estimate for each stratum in an RU Scaling up is done for each land use type (post-class modifier) in each time period Temporal interpolation is used to compute annual deforestation rates Lastly large event mapping records and activity data and intelligence are used to refine the estimates when appropriate
441 GIS processing
The national deforestation geodatabase contains all the mapped areas representing deforestation events sampled within each time period as lines and polygons The geo-database also contains layers required for the estimation calculations including the sample grids the non-interpre-table areas the Landsat image boundaries (which define the core dates and areas sampled) the deforestation strata boundaries and the RU boundaries
The spatial data are first processed to prepare them for the scaling up analysis which is conducted later in a non-spa-tial database program (Section 444) Figure 9 provides a schematic of the tasks involved in the GIS processing (Burt et al 2006) The two main calculated outputs produced are the event and grid tables shaded in red in Figure 9 The processing of the mapped GIS data for the national sum-mary is performed for each time period
Canadian Forest Service | Pacific Forestry Centre | nrcangccaforestsresearch-centrespfc1348914
Figure 9 Simplified deforestation GIS processing flow Input tables are in green processes in yellow and output tables in red Gold arrows denote updates to a table The term ldquolinesrdquo refers to linear deforestation events ArcGIS commands are underlined
Canadarsquos National Deforestation Monitoring System System DescriptionInformation Report BC-X-439
15
The first of the output tables the ldquointerpretable gridrdquo (labelled grd_ident in Figure 9) defines the actual area for which mapping was done As a result the full set of sample cells is clipped by the extent of the Landsat imagery (thus removing portions of the cells that fall outside the Landsat image boundary) and has the non-interpretable areas (eg clouds) removed
The second table the ldquoFinal Event Polygonsrdquo (labelled py_fn) is created from the intersection of many input lay-ers The post-class modifier code for each event is carried through in these deforestation calculations The linear de-forestation events are converted to polygons by applying a buffer according to the width attribute associated with each line then combined with the other deforestation polygon events to create a complete polygonal coverage of all deforestation events mapped The events are then intersected with the interpretable grid layer Further inter-sections are applied to the boundary RU and deforestation strata layers to identify which strata and RU are associ-ated with each event In the end the data for each event include attributes drawn from all the intersected layers including the deforestation stratum and RU of each event As well small slivers created during the GIS processing steps are removed
At this stage it is possible to calculate the rate of deforesta-tion for each time period All events are assigned to the time period in which they occur (ie P1 [1975ndash1990] P2 [1990ndash2000] or P3 [2000ndash2008]) based on the core dates of imagery used for mapping For each event an effective annual rate of deforestation (hectares per year) is calculat-ed by dividing the deforested area by the number of years between the core dates Later in the process the resulting per-event annual rates are summed for each stratum and divided by the area of grid cells interpreted to determine the average annual rate for each time period and post-class modifier (Section 444)
To provide flexibility the mapping activity captures forest clearings that meet a more inclusive definition of defor-estation than strictly required Land conversion of sparse forest does not constitute deforestation (unless it is conver-sion of a recently disturbed or regenerating area) but is mapped for completeness unless otherwise specified The GIS processing steps are used to exclude such mapped events with sparse forest density
442 Large Events and Records Data
Certain types of events that are large uncommon and iso-lated (eg hydroelectric reservoirs new surface mines long and major hydroelectric lines etc) are better represented by complete mapping and census rather than sampling (Leckie et al [in review]) Such events termed ldquolarge eventsrdquo are mapped separately and completely using either core date imagery or imagery captured as close to the actual event dates as possible When large events fall within sample cells and thus are also captured by the sampling
these are excluded from the processing of sample data to avoid double-counting
Records and activity data when used for a given type of deforestation in a region (eg stratum) are added to the database and removed from the processing of sample data similar to large events (see Section 424)
443 Expert Intervention
After the mapping and GIS processing steps have been completed the initial estimation results are analyzed to identify potential problems With the nature of deforesta-tion in Canada and intensity of the sample occasionally spurious estimates may occur
Canadian Forest Service deforestation monitoring ex-perts have accumulated familiarity with land use change patterns and activities in Canada over many years These experts scrutinize NDMS estimation process outputs and investigate questionable outputs that may be then modi-fied if a change is justified
When suspicious estimation outputs are encountered ex-perts intervene by evaluating available records information and reconnaissance data For example when a particular event type is rare and sampling produces estimates that are unexpectedly high or low expert reviewers may scan available imagery to see what is occurring outside the sample cell boundaries (ie in the non-sampled area) and use this to inform expert intervention Estimation outputs may be deemed suspicious when they contradict previous estimates or other available lines of evidence All expert interventions are documented for transparency and in case they need to be reassessed as new evidence emerges (eg Leckie et al 2009 Leckie et al 2010)
444 Database Processing
Annualized national deforestation estimates are produced for each industrial sector and RU by combining the GIS data and any large event or recordsactivity data and incorporating expert interventions These data are loaded into a non-spatial database environment (Paradine 2007) The resulting estimates are used to produce customized re-ports for NDMS data users such as provincial government agencies Canadarsquos National Forest Carbon Monitoring Accounting and Reporting System for input to greenhouse gas emission estimation and others
The non-spatial part of the processing follows the work flow shown in Figure 10 The ratio of the area sampled (the ldquointerpretable gridrdquo) to the area of the stratum is calculated (labelled ldquo1rdquo in Figure 10) The area of deforestation in the sample is then scaled up by this proportion (labelled ldquo2rdquo in Figure 10) to produce the deforestation estimate for the stratum This process is repeated for all strata time periods and post classes (including post-class modifiers) using the mapped sample data only
Canadian Forest Service | Pacific Forestry Centre | nrcangccaforestsresearch-centrespfc1348916
Figure 10 Schematic of the deforestation database process used to produce estimates
Canadarsquos National Deforestation Monitoring System System DescriptionInformation Report BC-X-439
17
The expert intervention can be added at the strata level for a particular time period as an adjustment factor (labelled ldquo3rdquo in Figure 10) or as replacements or additions (labelled ldquo4rdquo in Figure 10) to existing data It can also be applied at the RU level (labelled ldquo7rdquo in Figure 10) Early national deforesta-tion reporting had more expert interventions because of lower sample rates less availability of high-resolution imagery and more use of records data over the remote sensing sample Currently few expert interventions occur with most occurring for the 1975ndash1990 time period which has a smaller sample
At the strata level the updated deforestation estimates by time period and post-class modifier are proportioned (labelled ldquo5rdquo in Figure 10) into their respective RUs (see Ap-pendix 3)
The data are then annualized The deforestation estimates for each time period (by post class and RU) are assigned
to the middle year of the time period (ie 1983 for 1975ndash1990 1995 for 1990ndash2000 and 2004 for 2000ndash2008) Annual trends are produced by applying linear interpola-tion between midpoints and extrapolation from endpoints (labelled ldquo6rdquo in Figure 10) Figure 11 provides one example
Large event mapping data records and activity data and expert interventions are applied as shown by the various green boxes in Figure 10 Large event data have the year of the event attached to them and are added to the mapping data at the RU level (labelled ldquo7rdquo in Figure 10) Records data also generally have a date attached and are added to the annualized data in a similar fashion to large event data
Figure 12 shows the trend line calculated in Figure 11 and the large event data (purple) representing hydro reservoir flooding facility construction and associated transporta-tion and hydro line corridors
Figure 11 Example deforestation trend produced using data from three mapping periods
Canadian Forest Service | Pacific Forestry Centre | nrcangccaforestsresearch-centrespfc1348918
Figure 12 Example of a deforestation area trend from sample mapping (red) and large events data (purple)
The post-class modifier classes (Table 1 and Table A21 in Appendix 2) are aggregated (labelled ldquo8rdquo in Figure 10) to the appropriate industrial category and good practice guidance class using a lookup table The various modifiers within each deforestation post class provide flexibility to summarize to different industrial categories based on user requirements (eg the categories used by the National For-est Carbon Monitoring Accounting and Reporting System and shown in Tables A21 and A22)
The result of the processing is a series of database tables A major product among these is the list of annual deforesta-tion area per RU per industrial class (labelled ldquo9rdquo in Figure 10) Another product is the breakdown of forest pretype percentages by RU this is done by calculating the percent-age area of each pretype mapped in the RU Reporting for the UNFCCC requires separate estimates of deforestation and greenhouse gas emissions for managed and unman-aged forest thus a separate table is produced for unman-aged forest (labelled ldquo10rdquo in Figure 10)
5 Quality ControlThree major quality control stages are applied during the deforestation mapping process
1 initial mapping quality control
2 revision quality checks and
3 overall quality assurance or vetting where a check on the final mapping data is performed
This multi-stage approach reduces the likelihood of errors and increases consistency of and confidence in the final product The data processing stage has further checks for data integrity After the data are calculated in the esti-mate process the final numbers and trends are assessed for changes from previous year estimates Deforestation estimates are also scrutinized by external users before they incorporate the data into their applications For an over-view of quality control practices see Dyk et al (2011)
51 Quality Control at the Mapping Stage
The mapping process flow is illustrated in Figure 13 includ-ing the quality control steps Typical errors caught through quality control at the mapping stage include incorrect event interpretations or delineations event omissions or commissions missing field values typographical errors and topology problems During the quality control phase an internal Canadian Forest Service reviewer performs detailed checks to ensure consistency with mapping and interpretation rules and returns a set of points to flag and describe the problem areas to the interpreter or contrac-tor These quality control points are stored in the mapping geodatabase as a permanent layer
Canadarsquos National Deforestation Monitoring System System DescriptionInformation Report BC-X-439
19
Figure 13 The deforestation mapping and quality control process flow
The mapping interpreter reviews these points and applies the recommended corrections to the working database The quality control points are sent to the interpreter early and frequently in the project timeline to reduce or avoid propagation of persistent errors or misunderstandings through the duration of the project
The original line and polygon mapping is preserved and re-visions are performed in separate ldquorevised linerdquo and ldquorevised polygonrdquo layers in the project geodatabase Information about the changes including what was done by whom and the date is added for every revised event Any deleted events are also retained in what are termed the ldquodrop lay-ersrdquo to mark the area as a non-deforestation event which is reviewed during future mapping
When the revised data are resubmitted to the Canadian Forest Service the data layers make clear what changes were requested and what changes were made The re-viewer uses these layers to verify that appropriate revisions were properly applied at all quality control points Any further errors or misunderstandings are communicated to the interpreter immediately for resolution At this stage the interpreter can also open a dialogue regarding specific events using additional comment fields in the quality control point layer or personal communication
The next level of quality control is the final vetting This audit step is conducted internally by senior Canadian For-est Service interpreters to ensure consistency of mapping across all projects All aspects of the new data are reviewed during this stage omission and commission errors delinea-
tion and attribution In addition the older mapping data are scanned to ensure newer imagery confirms the original interpretation A set of ldquovet revisionrdquo points is created to mark all adjustments required in the database An analyst works through these point by point to make the necessary changes noting any complex or uncertain events and communicating directly with the vetting interpreter when necessary
Field validation is a desirable aspect of the revision process but is not included during the mapping stage In general field campaigns are conducted on an ongoing basis when resources permit Areas where local knowledge or ground truth information are needed to clarify the interpretation are identified from the interpreter confidence records or the revision point data Dedicated field programs schedule air or ground visits to high-impact and low- to moderate-confidence events Local experts sometimes provide information about ground conditions that can be used to verify and update the database
Throughout the entire mapping and revision process an internal ldquoproject storyrdquo is maintained by the Canadian For-est Service This document summarizes activity on a given project including staff and contractors involved dates and actions completed It also includes detailed explanation of any complex situations or vet revisions as well as notes on any issues raised by the quality control or vetting interpret-ers To maintain consistency analysts who are involved in revisions or who vet revisions read this project story before starting work
Canadian Forest Service | Pacific Forestry Centre | nrcangccaforestsresearch-centrespfc1348920
52 Quality Control at the Data Processing Stage
Once revisions are vetted final data integrity checks are conducted on the project database to find and correct any technical errors such as missing attributes mismatched post classes and modifiers incorrect or reversed event dates inappropriate line widths topology errors overlaps and duplicates and typos This stage is partially automated The final mapping layers can be loaded into the national database only after the integrity checks have been com-pleted
Data quality checks are built into the script that automates the data processing stages The script both delivers reports to the screen while running and dumps to log files which are reviewed by Canadian Forest Service staff to ensure the runs were successful
Transfer of the final GIS tables into the non-spatial defor-estation database is also automated The grid and event tables for each time period are checked before load-ing and the number of records loaded is recorded and compared with previous runs to highlight any potential discrepancies
The database queries and tables used to create the annual estimates by industrial category and RU are controlled by Microsoft Access macros to ensure consistency between the runs
53 Quality Control at the Output Analysis Stage
Following generation of the estimate tables the main out-puts (annualized deforestation by industrial class and RU pretype table and unmanaged forest table) are evaluated closely by Canadian Forest Service experts to ensure that estimates have been calculated properly and that discrep-ancies from previously calculated values can be explained To aid in this effort a comparison spreadsheet is created for each RU showing the deforestation estimates by indus-trial class for the current and previous yearrsquos national run together with illustrations and statistics The experts scru-tinize the data for changes and ensure the new estimates are consistent with the input mapping data Any specific issues and special adjustments required are documented in a report that becomes part of the record for each yearrsquos estimate
54 External Quality Control
Users of the deforestation estimates conduct their own reviews of the data prior to use in their systems and com-municate any issues before incorporating the data into their own business processes When new issues arise these are dealt with and the NDMS quality control processes are updated to catch similar issues in the future
6 ConclusionsDeforestation is the direct human-induced conversion of forested land to non-forested land use The NDMS was de-signed and implemented to provide information needed by Canada to meet its obligation under the UN Frame-work Convention on Climate Change to report the areas affected annually by deforestation Also considered was the need to provide information useful for policy analysis land management and forest stewardship applications Understanding why where and when deforestation occurs is a prerequisite to the development of appropriate policy instruments to optimize land use develop mitigation strat-egies and address cumulative impacts on forest resources
The NDMS uses manual mapping from a satellite remote sensing sampling system informed by records-based information and expert knowledge to provide information about deforestation in Canada The remote sensing map-ping is supported by available ancillary information such as high-resolution imagery forest inventory road networks and other industrial databases Certain types of events that are large and isolated (eg mine and hydroelectric devel-opments) are mapped and incorporated separately in the overall deforestation estimates Occasionally records and activity data on land use changes are incorporated when they are deemed more appropriate than the sampling es-timate The mapping results from the sample are scaled up to regional levels In the data processing stage these data are merged and annualized to produce national deforesta-tion estimates
The system has been used and improved over the last 10 years The flexibility of the NDMSrsquos design makes it possible to adapt to future changes in image sources ancillary data resource availability and user needs and positions the pro-gram well for long-term maintenance and improvement
Canadarsquos National Deforestation Monitoring System System DescriptionInformation Report BC-X-439
21
7 References
Burt W Paradine D Leckie D 2006 Geographic Information system processing of deforestation mapping data for estimating deforested area of Canada Natural Resources Canada Canadian Forest Service Pacific Forestry Centre Victoria BC Report DRS-P-001
Dyk A Tinis S Leckie D 2011 National Inventory Report 2011 Deforestation area estimation for Canada Quality con-trol overview Natural Resources Canada Canadian Forest Service Pacific Forestry Centre Victoria BC Report DRS-N-031
Ecological Stratification Working Group 1996 A national ecological framework for Canada Agriculture and Agri-Foods Canada Research Branch Centre for land and Biological Resources Research and Environment Canada State of the Environ-ment Directorate Ottawa Ont
Environment Canada 2006 National Inventory Report 1990ndash2004 Greenhouse gas sources and sinks in Canada Govern-ment of Canada Submission to the UN Framework Convention on Climate Change httpunfcccintnational_reportsannex_i_ghg_inventoriesnational_inventories_submissionsitems3734php (Accessed August 2014)
Environment Canada 2014 National Inventory Report 1990ndash2012 Greenhouse gas sources and sinks in Canada Govern-ment of Canada Submission to the UN Framework Convention on Climate Change Report issued by Pollutant Inventories and Reporting Division Environment Canada Ottawa Onthttpunfcccintnational_reportsannex_i_ghg_inventoriesnational_inventories_submissionsitems8108php (Accessed August 2014)
Food and Agriculture Organization 2006 2001 Global forest resources assessment 2000 main report United Nations Food and Agriculture Organization Rome Italy FAO Forestry Paper 140
Gillis M Omule A Brierley T 2005 Monitoring Canadarsquos forests The National Forest Inventory Forestry Chronicle 81(2)214ndash221
Intergovernmental Panel on Climate Change 2003 Good practice guidance for land use land-use change and forestry Penman J Gytarsky M Hiraishiet T et al (eds) Institute for Global Environmental Strategies Hayama Japan
Intergovernmental Panel on Climate Change 2006 2006 IPCC guidelines for national greenhouse gas inventories Egg-leston HS Buendia L Miwa K Ngara T Tanabe K (eds) Intergovernmental Panel on Climate Change National Green-house Gas Inventories Programme Institute for Global Environmental Strategies Hayama Japan httpwwwipcc-nggipigesorjppublic2006gl (Accessed January 2015)
Kurz W 2010 An ecosystem context for global forest cover loss estimates Proceedings National Academy of Sciences 107(20)9025ndash9026
Kurz W Apps M 2006 Developing Canadarsquos national forest carbon monitoring accounting and reporting system to meet the reporting requirements of the Kyoto Protocol Mitigation and Adaptation Strategies for Global Change 11(1)33ndash43
Kurz W Dymond C White T Stinson G Shaw C Rampley G Smyth C Simpson B Neilson E Trofymow J Metsaranta J Apps M 2009 CBM-CFS3 A model of carbon-dynamics in forestry and land-use change implementing IPCC standards Ecological Modelling 220(4)480ndash504
Kurz W Shaw C Boisvenue C Stinson G Metsaranta J Leckie D Dyk A Smyth C Neilson E 2013 Carbon in Canadarsquos boreal forest A synthesis Environmental Reviews 21260ndash292
Canadian Forest Service | Pacific Forestry Centre | nrcangccaforestsresearch-centrespfc1348922
Leckie D Dyk A Ortlepp S Tinis S 2010 Records of decision for Canadarsquos national deforestation estimate 2011 Natu-ral Resources Canada Canadian Forest Service Pacific Forestry Centre Victoria BC Report DRS-N-029
Leckie D Dyk A Paradine D Tammadge D Tinis S 2012 Deforestation interpretation guide Natural Resources Canada Canadian Forest Service Pacific Forestry Centre Victoria BC Report DRS-M-030
Leckie D Dyk A Tinis S 12009 Records of decision for Canadarsquos national deforestation estimate Natural Resources Canada Canadian Forest Service Pacific Forestry Centre Victoria BC Report DRS-N-026
Leckie D Paradine D Burt W 2006a Mapping sample coverage for Canadarsquos national deforestation estimate 2006 Natural Resources Canada Canadian Forest Service Pacific Forestry Centre Victoria BC Report DRS-N-002
Leckie D Paradine D Tinis S 2006b Geographic strata for Canadarsquos national deforestation estimates report Natural Resources Canada Canadian Forest Service Pacific Forestry Centre Victoria BC Report DRS-Q-003
Leckie D Paradine D Kurz W Magnussen S [2015] Deforestation mapping sampling designs for Canadian land-scapes Natural Resources Canada Canadian Forest Service Victoria BC In review
Lempriegravere T Kurz W Hogg E Schmoll C Rampley G Yemshanov D et al 2013 Canadian boreal forests and climate change mitigation Environmental Reviews 21(4)293ndash321
Le Queacutereacute C Peters G Andres R Andrew R Boden T et al 2014 Global carbon budget 2013 Earth System Science Data 6689ndash760
Masek J Cohen W Leckie D Wulder M Vargas R de Jong B Healey S Law B Birdsey R Houghton R Mildrexler D Goward S Smith W 2011 Recent rates of forest harvest and conversion in North America Journal of Geophysical Research 116G00K03
McGovern M 2008 Reporting zones GHG spatial reporting structure for Canada 2008 Environment Canada Greenhouse Gas Division Ottawa Ontario
Montreal Process 2009 Criteria and indicators for the conservation and sustainable management of temperate and boreal forests Fourth edition httpwwwmontrealprocessorgdocumentspublicationsgeneral2009p_4pdf (Accessed January 2015)
Pan Y Birdsey RA Fang J et al 2011 A large and persistent carbon sink in the Worldrsquos forests Science 333988ndash993
Paradine D 2007 National Inventory Report 2008 ACCESS database description GIS processing description and consoli-dated GIS database description Natural Resources Canada Canadian Forest Service Pacific Forestry Centre Victoria BC Report DRS-N-019
United Nations Framework Convention on Climate Change 2002 Conference of the PartiesndashReport of the Confer-ence of the Parties on its seventh session held at Marrakesh from 29 October to 10 November 2001 United Nations Office Geneva Switzerland httpunfcccintresourcedocscop713pdf (Accessed January 2015)
Wulder M Masek J Cohen W Loveland T Woodcock C 2012 Opening the archive How free data has enabled the science and monitoring promise of Landsat Remote Sensing of Environment 1222ndash10
Canadarsquos National Deforestation Monitoring System System DescriptionInformation Report BC-X-439
23
Appendix 1 Pretype Forest Conditions
The tables below list the approved forest type density and maturity values applied in deforestation mapping Note not all combinations are valid particularly those that include recent disturbance and regeneration terms Table A11 lists the ac-ceptable parameter combinations
The most common pretype groupings found are the 36 combinations of three Type classes (B C and M) three Density classes (D O and S) and four Maturity classes (R Y I and M) The two older Maturity classes (O and G) require additional verification to identify them Several classes identify recently disturbed forests (K X and R)
Table A11 Pre-change forest type descriptors
TYPE Definition Restrictions of use
B Broadleaf gt 75 of trees are broadleaf (Angiospermae)
C Conifer gt 75 of trees are conifer (Coniferae)
M Mixed gt 25 of both broadleaf and conifer present
K Clearcut Exposed ground and (or) ground vegetation No visible regeneration
Use only with S or N density and Q maturity
X Burn Exposed ground and (or) ground vegetation No visible regen-eration May have live residual trees up to 25 crown closure
Use only with S or N density and Q maturity
R Regen Regenerating areas with lt 25 crown closure where the forest composition (B C or M) is not identifiable
Table A12 Pre-change forest density descriptors
DENSITY Definition Restrictions of use
D Dense gt 60 crown closure
O Open 25ndash60 crown closure
S Sparse 5ndash25 crown closure
N Nil lt 5 crown closure Use only with K and X pretype
Table A13 Pre-change forest maturity descriptors-
MATURITY Definition Restrictions of use
Q Recent disturbance No visible regeneration Use only with K and X pretype
R Regen Forest stands 0ndash14 years old
Y Young Forest stands 15ndash25 years old
I Immature Forest stands 26ndash40 years old
M Mature Forest stands 41ndash80 years old
O Old Forest stands 81ndash200 years old
G Old-growth Forest stands over 200 years old Restricted to British Columbia only
Canadian Forest Service | Pacific Forestry Centre | nrcangccaforestsresearch-centrespfc1348924
Table A14 Valid combinations of pretype attributes (TypendashDensityndashMaturity)
Regen Broadleaf Mixed Coniferous
Dense RDR BDR MDR CDR
BDY MDY CDY
BDI MDI CDI
BDM MDM CDM
BDO MDO CDO
CDG
Open ROR BOR MOR COR
BOY MOY COY
BOI MOI COI
BOM MOM COM
BOO MOO COO
COG
Sparse RSR BSR MSR CSR
BSY MSY CSY
BSI MSI CSI
BSM MSM CSM
BSO MSO CSO
CSG
Burn Clearcut
Regen Broadleaf Mixed Coniferous
Disturbed XSQ KSQ
XNQ KNQ
Canadarsquos National Deforestation Monitoring System System DescriptionInformation Report BC-X-439
25
Appendix 2 Post-class Modifiers by Industrial Category
Table A21 lists all land use post-class deforestation modifiers They provide additional detail regarding what has occurred on the ground for each deforestation event These classes can be assigned to various industrial classes (see Table A22) Detailed definitions are provided in the Deforestation Interpretation Guide (Leckie et al 2012)
Table A21 Post class and post-class modifier codes and short descriptions grouped by industrial categorysector (in bold)
Post class Post class modifier
Agriculture
AG Agriculture ab bare
cp crop
fy farm yard
pa pasture
AL Artificial Lake aa agriculture pond
ea agriculture effluent pond
OF Open Field fa agriculture setting
Flooded Standing Forest
AL Artificial Lake ff flooded standing forest
Forestry
RD Road mf mainline forestry road
sf secondary forestry road
xf tertiary forestry road with width ge 20 m
SD Soil Disturbance ld logging landing
ss rock slide scar
Hydro Infrastructure
CR Corridor hm hydro linendashmain
hs hydro linendashsecondary
xy hydro linendashtertiary ge 20 m
IN Industrial ih hydro infrastructure
Hydro Reservoir
AL Artificial Lake hr hydroelectric flooding
Industry
AL Artificial Lake ei industrial effluent pond
IN Industrial hi heavy industrial
li light industrial
OF Open Field fi industrial
Canadian Forest Service | Pacific Forestry Centre | nrcangccaforestsresearch-centrespfc1348926
Post class Post class modifier
Mining
AL Artificial Lake em waste ponds for mining
IN Industrial mh mine heavy
ml mine light
OF Open Field fk mine facility
fm mine
fq pit and quarry
SD Soil Disturbance mn open pit mine
pq gravel pitquarry
Municipal
AL Artificial Lake ad pond urban setting
ar pond rural residential
ul other human caused
CR Corridor cl cut line
cu undifferentiated
OF Open Field fd urbansuburban
fr rural residential
uf undifferentiated field
RR Rural Residential rf few trees remaining
rm many trees remaining
SD Soil Disturbance lf landfill
su undifferentiated
UR Urban Residential df few trees remaining
dm many trees remaining
Oil and Gas
CR Corridor pp pipelinendashmain
ps pipelinendashsecondary
xp pipelinendashtertiary ge 20 m
IN Industrial oi oil sands industrial
op oil and gas industrial
wp well pad
OF Open Field fo oil and gas facility
fs oil sands open field
SD Soil Disturbance os oil sands
AL Artificial Lake eo oil and gas related pond
Canadarsquos National Deforestation Monitoring System System DescriptionInformation Report BC-X-439
27
Post class Post class modifier
Peat Mining
SD Soil Disturbance pm peat extraction
Recreation
AL Artificial Lake af golf course related
ap recreational water body
OF Open Field fc recreational field
RC Recreational ca campground
go golf course
ru other or undifferentiated
sk ski areas
Transportation
CR Corridor as airstrip
ry railway
RD Road mm main road clearly for a mine
mr main road
mo main road clearly for oil and gas
my main road clearly for hydroelectric
sm secondary mining road
so secondary oil and gas road
sr secondary road
sy secondary hydroelectric road
xm tertiary mining road with width ge 20 m
xo tertiary oil and gas road with width ge 20 m
xr tertiary road with width ge 20 m
xy tertiary hydroelectric road with width ge 20 m
Canadian Forest Service | Pacific Forestry Centre | nrcangccaforestsresearch-centrespfc1348928
Table A22 Aggregation of deforestation mapping classes to good practice guidance and industrial categories
Good practice guidance class
Crop-land (CL)
Wetlands (WL) Settlements (SL)
Industrial Categories
Agric
ultu
re
Floo
ded
stan
ding
fore
st
Hyd
ro re
serv
oir
Peat
min
ing
Fore
stry
Hyd
ro in
fras
truc
ture
Indu
stry
Min
ing
Mun
icip
al
Oil
and
gas
Recr
eatio
n
Tran
spor
tatio
n
Def
ores
tatio
n po
st c
lass
Agriculture AG ab cp pa fy
Artificial Lake AL aa ea ff hr ei emad ar of ul eo af ap
Corridor CR hm hs xy cl cu
pp ps xp as ry
Industrial IN ih hi li mh mloi op wp
Open Field OF fa fi fk fm fq fd fr uf fo fs fc
Recreational RC ca go fu sk
Road RDmf sf xf
mm mo mr my sm so sr sy xm
xo xr xy
Rural Residential RR rf rm
Soil Disturbance SD pm ld ss mn pq lf su os
Urban Residential UR df dm
Canadarsquos National Deforestation Monitoring System System DescriptionInformation Report BC-X-439
29
Appendix 3 Deforestation Strata Units and Reconciliation Unit InclusionTable A31 shows the names of the deforestation strata their area in kilohectares and the percentage of that area contained in each reconciliation unit that they overlap (sorted by reconciliation unit identification number see Figure 1 for unit loca-tion and name)
Table A31 Area of strata units and percent of strata unit area that is in each reconciliation unit
Deforestation strata unit name Strata unit area (kilohectares)
Reconciliation unit ( inclusion)
Newfoundland Eastern Woodlot 4 477 1 (100)
Newfoundland Forest Activity Zone 6 512 1 (100)
Newfoundland St Johns 55 1 (100)
Labrador Arctic 1 893 2 (100)
Labrador Northern Forest 23 238 3 (98) 4 (2)
Labrador Forest Activity Zone 4 620 4 (100)
Nova Scotia Eastern Woodlot 2 894 5 (100)
Nova Scotia Forest Activity Zone 2 396 5 (100)
Nova Scotia HalifaxDartmouth 182 5 (100)
Prince Edward Island 577 6 (100)
New Brunswick Eastern Woodlot 4 121 7 (100)
New Brunswick Forest Activity Zone 3 174 7 (100)
Quebec Arctic 20 443 10 (75) 9 (18) 8 (7)
Quebec Eastern Townships 3 948 11 (100)
Quebec Gaspe Forest Activity Zone 2 740 11 (100)
Quebec Southern RU12 2 968 12 (100)
Quebec Northern Forest 72 759 14 (73)15 (22) 13(5)
Quebec Forest Activity Zone 44 717 15 (100)
Quebec Ile DAnticosti 795 15 (100)
Quebec Lac St Jean 964 15 (100)
Quebec Southern RU15 1 687 15 (100)
Ontario Thunder Bay 225 16(100)
Ontario Southern 8 198 17 (100)
Ontario Manitoulin Island 326 17 (100)
Ontario Northern Forest 46 468 18 (56) 16 (43) 19 (1)
Ontario SudburyNorth Bay 874 19 (100)
Ontario Forest Activity Zone 42 398 19 (56) 16 (43) 18 (1)
Ontario Sault Ste Marie 536 19 (92) 17 (8)
Manitoba Forest Activity Zone RU22 East 2 405 22 (100)
Manitoba Forest Activity Zone RU22 North 6 109 22 (100)
Manitoba Prairie Fringe RU22 804 22 (100)
Manitoba Northern Forest 37 339 22 (43) 21 (35) 25 (19) 23 (3)
Manitoba Forest Activity Zone RU23 7 382 23 (100)
Manitoba Prairie Fringe RU23 3 970 23 (100)
Manitoba Hotspot 851 24 (100)
Manitoba North Prairie 6 117 24 (100)
Canadian Forest Service | Pacific Forestry Centre | nrcangccaforestsresearch-centrespfc1348930
Deforestation strata unit name Strata unit area (kilohectares)
Reconciliation unit ( inclusion)
Saskatchewan Northern Forest 21 224 27 (75) 26 (22) 28 (3)
Saskatchewan Prairie Fringe 5 509 28 (100)
Saskatchewan Inactive Forest Activity Zone 6 196 28 (58) 27 (42)
Saskatchewan Forest Activity Zone 8 189 28 (99) 27 (1)
Saskatchewan North Prairie 8 167 29 (100)
Saskatchewan Prairie 15 921 30 (100)
Alberta Northern Forest 10 862 31 (58) 34 (28) 32 (8) 33 (6)
Alberta Forest Activity Zone 22 066 34 (100)
Alberta Fort McMurray 807 34 (100)
Alberta High Level 789 34 (100)
Alberta Northwest Fringe 5 436 34 (100)
Alberta Prairie Fringe 6 038 34 (100)
Alberta North Prairie 7 397 35 (100)
Alberta RU 36 Forest Activity Zone 4 764 36 (100)
Alberta Palliser Triangle 3 689 37 (100)
Alberta Prairie West 4 522 37 (100)
British Columbia RU 38 6 759 38 (100)
British Columbia Prairie Fringe 2 333 39 (100)
British Columbia RU 40 19 220 40 (100)
British Columbia Lower Mainland East Vancouver Island
1 142 41 (100)
British Columbia RU 41 Forest Activity Zone 15 440 41 (100)
British Columbia VI QCI 3 813 41 (100)
British Columbia Okanagan 1 109 42 (100)
British Columbia Prince George 464 42 (100)
British Columbia RU 42 Forest Activity Zone 44 286 42 (96) 39 (4)
Yukon Arctic 496 43 (100)
Yukon Northern Forest 19 987 45 (91) 44 (9)
Yukon Whitehorse 417 46 (100)
Yukon Forest Activity Zone 27 440 46 (98) 47 (1)
Northwest Territories Arctic 42 788 48 (49) 49 (43) 50 (7)
Northwest Territories Northern Forest 91 972 50 (52) 51 (37) 53 (9) 52 (2)
Northwest Territories Yellowknife 176 51 (100)
Northwest Territories Forest Activity Zone 467 54 (100)
Nunavut Arctic 198 915 56 (64) 57 (25) 55 (11)
Nunavut Northern Forest 9 892 58 (100)
nrcangccaforests
For more information about the Canadian Forest Service visit our website at nrcangccaforests or contact any of the following Canadian Forest Service establishments
Canadian Forest Service Contacts
Atlantic Forestry Centre PO Box 4000 Fredericton NB E3B 5P7 Tel (506) 452-3500 Fax (506) 452-3525 nrcangccaforestsresearch-centresafc13447
Atlantic Forestry Centre ndash District Office Sir Wilfred Grenfell College Forestry Centre University Drive Corner Brook NF A2H 6P9 Tel (709) 637-4900 Fax (709) 637-4910
Laurentian Forestry Centre 1055 rue du PEPS PO Box 3800 Sainte-Foy PQ G1V 4C7 Tel (418) 648-5788 Fax (418) 648-5849 nrcangccaforestsresearch-centreslfc13473
Great Lakes Forestry Centre PO Box 490 1219 Queen St East Sault Ste Marie ON P6A 5M7 Tel (705) 949-9461 Fax (705) 759-5700 nrcangccaforestsresearch-centresglfc13459
Northern Forestry Centre 5320-122nd Street Edmonton AB T6H 3S5 Tel (403) 435-7210 Fax (403) 435-7359 nrcangccaforestsresearch-centresnofc13485
Pacific Forestry Centre 506 West Burnside Road Victoria BC V8Z 1M5 Tel (250) 363-0600 Fax (250) 363-0775 nrcangccaforestsresearch-centrespfc13489
Headquarters 580 Booth St 8th Fl Ottawa ON K1A 0E4 Tel (613) 947-7341 Fax (613) 947-7396
Canadian Wood Fibre Centre A virtual research centre of the Canadian Forest Service Natural Resources Canada nrcangccaforestsresearch-centrescwfc13457
1
2
3
5
6
4
1
25
3 6
4
1
To order publications online visit the Canadian Forest Service Publications website at
cfsnrcangccapublications

Canadarsquos National Deforestation Monitoring System System DescriptionInformation Report BC-X-439
9
Figure 5 Deforestation strata sampling rates for mapping period P2 (1990ndash2000)
Figure 6 Deforestation strata sampling rates for mapping period P3 (2000ndash2008)
Canadian Forest Service | Pacific Forestry Centre | nrcangccaforestsresearch-centrespfc1348910
The total area of Canada covered by the sampled regions (ie the shaded area in Figure 2) in one or more time periods is 346 times 106 km2 This includes full-area map-ping for 56 times 105 km2 of hydro survey areas in northern Quebec and another 25 times 105 km2 in northern Manitoba in which only hydroelectric development deforestation was mapped Excluding hydro survey areas the area of the sample cells interpreted was 165 times 105 km2 in P1 409 times 105 km2 in P2 and 218 times 105 km2 in P3 The large sample area for P2 reflects the greater amount of full-area mapping
42 Data Sources and Information Collection
Remote sensing imagery is the most critical input to the process of deforestation monitoring In the NDMS image data are used to identify the location size and timing of events These data are also used to determine pre-existing forest types and subsequent post classes The NDMS em-ploys medium-resolution satellite imagery in combination with high-resolution satellite and air photo data wherever available Ancillary sources in the form of spatial data and non-spatial records are used to support the mapping process and act as supplementary sources for estimation and quality control
421 Core Image Data
Landsat is the primary data source for deforestation map-ping Landsat series satellites have been acquiring data since the early 1970s and provide a consistent data stream for all NDMS mapping periods with a spatial and spectral detail suitable for deforestation mapping The current Landsat instruments are medium-resolution sensors with 30 times 30 m pixels and a large image footprint (170 times 185 km) Each satellite has a return period of 16 days with continual image acquisition and scene sidelap that increases at higher latitudes
Landsat imagery formerly available for purchase was made freely available by the United States Geological Survey starting in January 2009 (Wulder et al 2012) For mapping done before 2009 data had to be purchased and thus image acquisition focussed on the basic summer data for core dates (circa 1975 1990 2000 and 2008) and winter imagery in more difficult-to-interpret regions For mapping done after 2009 more imagery was used and additional dates were added to help identify with more precision when deforestation events occurred and also help increase mapping confidence This new imagery was also used to review any previous mapping
422 Additional Image Data
Delineating deforestation boundaries can benefit from use of high-resolution imagery Higher-resolution data are also very useful in supporting the interpretation of pre-existing conditions and forest types and in confirming deforesta-tion and better identifying the post class and post-class modifier High-resolution imagery is therefore used to supplement core Landsat data wherever possible
Data are continuously being sought out by NDMS staff for example a 25 m resolution SPOT 5 panchromatic mosaic of the Prairies (circa 2006) was provided by Agriculture and Agri-Foods Canada and a 10 m SPOT 45 national coverage called GeoBase1 was obtained from the Centre for Topographic Information of Natural Resources Canada The SPOT 45 satellites offer a higher spatial resolution but provide fewer spectral bands than Landsat Various aerial photo data sets have been assembled through partner-ships with provincial governments and other agencies in-cluding National Air Photo Library imagery provincial aerial photography and high-resolution satellite image data sets
Google Earthtrade and Bing Mapstrade are a valuable resource with an ever-expanding selection of recent high-resolution imagery over population centres and many other regions of the country In some cases archives of older imagery (eg circa 2002) are also available and can be accessed through the Time Slider tool available in Google Earth Even current high-resolution imagery can help with the identification of events that occurred in an earlier time period
423 Ancillary Spatial Data
Ancillary data are also incorporated to support the inter-pretation process These data may be used to validate or confirm deforestation occurrence or to support the interpretation of prior forest type or post-change land use Some data types are available nationally whereas others are present only within limited extents Such data include GIS data sets of road networks hydrology wetlands wood-ed areas from provincial base maps pit and quarry licence areas forest inventories forest management tenure areas specialized oil and gas pipeline and well pad databases field oblique photos and other data
In addition to the satellite and aerial photo data described above Google Earthtrade offers further ancillary spatial data in the form of terrain display crowd-sourced Panoramiotrade photographs ground-based StreetViewtrade photography and other useful layers
1 See httpwwwgeobasecageobaseendataimageryimrindexhtml
Canadarsquos National Deforestation Monitoring System System DescriptionInformation Report BC-X-439
11
424 Records Data
Spatial and non-spatial records and activity data may also be incorporated into the estimation or quality control processes In early deforestation reports records and activity data were sometimes used to provide estimates of deforestation associated with a particular sector and area As more mapping was completed estimates from records were replaced by mapping-based information Records data used in the past have included hydroelectric clearing areas forestry road records and standard road class widths and oil and gas pipeline records
43 Mapping
Deforestation event mapping is done using core date im-agery and multi-band image products Mapping is broken up into units of mapping work called ldquoproject packagesrdquo to be completed by internal staff provincial partners or qualified private sector contractors All relevant images and supporting data are assembled as a package for mapping in a particular area Detection interpretation digitization and attribution of individual deforestation events is done manually by trained interpreters according to the estab-lished NDMS methods in a standardized ArcGIS geodata-base (Leckie et al 2012)
431 Data Handling
Interpretation of deforestation events requires the detec-tion of change between pairs of images acquired at two ldquocore datesrdquo chosen to best represent the mapping time period start and end year (ie 1975 1990 2000 and 2008) Forest cover changes or potential events are highlighted using a multi-temporal display or ldquochange enhancementrdquo image created using the visible red band from two core dates of imagery When the mapping period end date image is displayed using the red image colour gun and the mapping period start image is displayed using green and blue the resulting image shows areas of vegetation loss as red In addition possible deforestation events can be detected by comparing the two core images directly Many changes besides deforestation can cause a difference between the images (eg forest harvest forest fires beaver dam flooding wind blowdown agricultural field changes and avalanches) so it is critical that a change event be confirmed as deforestation before it is mapped
Individual deforestation events are manually interpreted and identified delineated and attributed Figures 7 and 8 illustrate some of the data that are used in this process Landsat multiple band combinations at both core dates change enhancement higher-resolution imagery and field oblique aerial photographs
Figure 7 Examples of various Landsat satellite band combinations and change enhancements that may be used in the mapping process Note the change enhancement at right shows red triggers where vegetation loss or change has occurred Band combinations shown are normal colour rendition on left with colour infrared in the middle The right-hand column shows Landsat Thematic Mapper (TM) and Enhanced Thematic Mapper (ETM) bands 453 (ie the two near infrared bands and a red band) displayed as red green blue
Canadian Forest Service | Pacific Forestry Centre | nrcangccaforestsresearch-centrespfc1348912
Figure 8 Examples of supplemental data use Left Example of confirmed and interpreted events (red and yellow lines) shown as polygons on the SPOT imagery (25 m resolution SPOT 5 top left and 10 m SPOT 4 bottom left) Right Example of flight path and oblique aerial photograph from a deforestation field verification campaign
Typically the interpretation process is conducted in a GIS environment where change enhancement and single-date images can be layered and compared by blinking or using the swipe tool Georeferenced ancillary imagery can be simultaneously displayed and a link between ArcGIS and Google Earth allows the synchronization of spatial display extents in both programs
432 Project Packages
Project packages are units of mapping work They include specification of the mapping area time period to be mapped and the sample cells to be used Each project package contains a standardized geodatabase with pre-defined sets of values for some of the attribute fields core date and change enhancement imagery other imagery in-cluding winter and overlapping scenes from east and west of the scene being mapped additional SPOT and aerial photographs (if available) and ancillary data sets
Once the mapping has been completed for a project and passed successfully through quality control the data are added to the national geodatabase which carries all defor-estation mapping data for the country including all time
periods The structure of the project geodatabases mirrors the structure of the national geodatabase
433 Interpretation
Image interpretation is done manually on a cell-by-cell ba-sis Typically the change enhancement is used first to iden-tify change events These are then confirmed or refuted as deforestation by the interpreter using the individual core date images supported by other image and ancillary data The supporting data are used to assess whether an event area was forested before the change and whether the event meets the deforestation definition Supporting data are also used to help interpret pretype and post class
The boundary of a deforestation event is identified in the Landsat images but higher-resolution imagery is used in a supporting role to improve event boundary delineation Interpreters follow specific digitizing guidelines provided in the Deforestation Interpretation Guide (Leckie et al 2012) that dictate how events shall be mapped (eg digitize smooth lines rather than following pixel boundaries avoid gaps and overlaps between adjacent events keep the mapping topology clean etc)
Canadarsquos National Deforestation Monitoring System System DescriptionInformation Report BC-X-439
13
Deforestation events may be linear in form (eg roads hydro lines) or polygonal They are digitized accordingly as lines or polygons in the project geodatabase Specific guidelines apply for each type of feature Delineation fol-lows clearly defined situational rules (eg for compositemixed use polygons roads in cutblocks tertiary versus more significant roads episodic clearing etc) all of which are addressed in detail in the Deforestation Interpretation Guide When events extend beyond the boundaries of a sample cell they are delineated to the full extent of the event but only the portion inside the cell is included in the estimation
Event attributes are interpreted and recorded using attri-bute values defined in the NDMS data dictionary Pretype attributes include forest type density and maturity (see Appendix 1 for details) Post class attributes are listed in Table 2 (see Appendix 2 for details) Interpreters also record their level of confidence about each deforestation event (ie how confident they are that it was forest before the change and that it is indeed a new land use) Comment fields are used extensively to record details specific to each event These may indicate uncertainty in an event a request by the interpreter for specific review by the qual-ity control person or the need for checking the event in a later time period The widths for linear events (such as roads or corridors) are also recorded as it is more efficient to map these as lines and later convert to polygons using the width data during a subsequent processing stage
If mapping already exists for an earlier time period in the area the interpreter reviews it in the context of recent imagery either to confirm the previous interpretations or to note whether corrections are required Points are used to flag areas for revision or later review by analysts such as where older mapping may require updating
In some cases imagery available for a core date is contami-nated by clouds shadows or missing data at image edges In such cases the interpreter digitizes the contaminated area within the sample cells and saves the polygon into a special geodatabase layer for ldquonon-interpretable areardquo poly-gons and notes the affected date The areas saved into this layer are removed from the sample during later processing to create what is termed the ldquointerpretable gridrdquo The open-ing of the Landsat archive through free access to geocor-rected imagery has substantially reduced the amount of
non-interpretable area entering the estimate calculations For example sometimes images outside the core date can be used to infer deforestation in the non-interpretable area In fact recently non-interpretable areas have been almost eliminated from the process
A series of quality checks has been built into the mapping process these are completed in every mapping project Canadian Forest Service analysts conduct quality control checks of the mapped data (see Section 5) and return a set of quality control points to the interpreters indicating where more work and specific changes are needed before the mapping can be loaded into the national geodata-base
44 Deforestation Estimation
The mapping data from deforestation sample cells are used to estimate the area of deforestation in each RU by scaling up from sample to population in each defor-estation stratum and then summing the deforestation estimate for each stratum in an RU Scaling up is done for each land use type (post-class modifier) in each time period Temporal interpolation is used to compute annual deforestation rates Lastly large event mapping records and activity data and intelligence are used to refine the estimates when appropriate
441 GIS processing
The national deforestation geodatabase contains all the mapped areas representing deforestation events sampled within each time period as lines and polygons The geo-database also contains layers required for the estimation calculations including the sample grids the non-interpre-table areas the Landsat image boundaries (which define the core dates and areas sampled) the deforestation strata boundaries and the RU boundaries
The spatial data are first processed to prepare them for the scaling up analysis which is conducted later in a non-spa-tial database program (Section 444) Figure 9 provides a schematic of the tasks involved in the GIS processing (Burt et al 2006) The two main calculated outputs produced are the event and grid tables shaded in red in Figure 9 The processing of the mapped GIS data for the national sum-mary is performed for each time period
Canadian Forest Service | Pacific Forestry Centre | nrcangccaforestsresearch-centrespfc1348914
Figure 9 Simplified deforestation GIS processing flow Input tables are in green processes in yellow and output tables in red Gold arrows denote updates to a table The term ldquolinesrdquo refers to linear deforestation events ArcGIS commands are underlined
Canadarsquos National Deforestation Monitoring System System DescriptionInformation Report BC-X-439
15
The first of the output tables the ldquointerpretable gridrdquo (labelled grd_ident in Figure 9) defines the actual area for which mapping was done As a result the full set of sample cells is clipped by the extent of the Landsat imagery (thus removing portions of the cells that fall outside the Landsat image boundary) and has the non-interpretable areas (eg clouds) removed
The second table the ldquoFinal Event Polygonsrdquo (labelled py_fn) is created from the intersection of many input lay-ers The post-class modifier code for each event is carried through in these deforestation calculations The linear de-forestation events are converted to polygons by applying a buffer according to the width attribute associated with each line then combined with the other deforestation polygon events to create a complete polygonal coverage of all deforestation events mapped The events are then intersected with the interpretable grid layer Further inter-sections are applied to the boundary RU and deforestation strata layers to identify which strata and RU are associ-ated with each event In the end the data for each event include attributes drawn from all the intersected layers including the deforestation stratum and RU of each event As well small slivers created during the GIS processing steps are removed
At this stage it is possible to calculate the rate of deforesta-tion for each time period All events are assigned to the time period in which they occur (ie P1 [1975ndash1990] P2 [1990ndash2000] or P3 [2000ndash2008]) based on the core dates of imagery used for mapping For each event an effective annual rate of deforestation (hectares per year) is calculat-ed by dividing the deforested area by the number of years between the core dates Later in the process the resulting per-event annual rates are summed for each stratum and divided by the area of grid cells interpreted to determine the average annual rate for each time period and post-class modifier (Section 444)
To provide flexibility the mapping activity captures forest clearings that meet a more inclusive definition of defor-estation than strictly required Land conversion of sparse forest does not constitute deforestation (unless it is conver-sion of a recently disturbed or regenerating area) but is mapped for completeness unless otherwise specified The GIS processing steps are used to exclude such mapped events with sparse forest density
442 Large Events and Records Data
Certain types of events that are large uncommon and iso-lated (eg hydroelectric reservoirs new surface mines long and major hydroelectric lines etc) are better represented by complete mapping and census rather than sampling (Leckie et al [in review]) Such events termed ldquolarge eventsrdquo are mapped separately and completely using either core date imagery or imagery captured as close to the actual event dates as possible When large events fall within sample cells and thus are also captured by the sampling
these are excluded from the processing of sample data to avoid double-counting
Records and activity data when used for a given type of deforestation in a region (eg stratum) are added to the database and removed from the processing of sample data similar to large events (see Section 424)
443 Expert Intervention
After the mapping and GIS processing steps have been completed the initial estimation results are analyzed to identify potential problems With the nature of deforesta-tion in Canada and intensity of the sample occasionally spurious estimates may occur
Canadian Forest Service deforestation monitoring ex-perts have accumulated familiarity with land use change patterns and activities in Canada over many years These experts scrutinize NDMS estimation process outputs and investigate questionable outputs that may be then modi-fied if a change is justified
When suspicious estimation outputs are encountered ex-perts intervene by evaluating available records information and reconnaissance data For example when a particular event type is rare and sampling produces estimates that are unexpectedly high or low expert reviewers may scan available imagery to see what is occurring outside the sample cell boundaries (ie in the non-sampled area) and use this to inform expert intervention Estimation outputs may be deemed suspicious when they contradict previous estimates or other available lines of evidence All expert interventions are documented for transparency and in case they need to be reassessed as new evidence emerges (eg Leckie et al 2009 Leckie et al 2010)
444 Database Processing
Annualized national deforestation estimates are produced for each industrial sector and RU by combining the GIS data and any large event or recordsactivity data and incorporating expert interventions These data are loaded into a non-spatial database environment (Paradine 2007) The resulting estimates are used to produce customized re-ports for NDMS data users such as provincial government agencies Canadarsquos National Forest Carbon Monitoring Accounting and Reporting System for input to greenhouse gas emission estimation and others
The non-spatial part of the processing follows the work flow shown in Figure 10 The ratio of the area sampled (the ldquointerpretable gridrdquo) to the area of the stratum is calculated (labelled ldquo1rdquo in Figure 10) The area of deforestation in the sample is then scaled up by this proportion (labelled ldquo2rdquo in Figure 10) to produce the deforestation estimate for the stratum This process is repeated for all strata time periods and post classes (including post-class modifiers) using the mapped sample data only
Canadian Forest Service | Pacific Forestry Centre | nrcangccaforestsresearch-centrespfc1348916
Figure 10 Schematic of the deforestation database process used to produce estimates
Canadarsquos National Deforestation Monitoring System System DescriptionInformation Report BC-X-439
17
The expert intervention can be added at the strata level for a particular time period as an adjustment factor (labelled ldquo3rdquo in Figure 10) or as replacements or additions (labelled ldquo4rdquo in Figure 10) to existing data It can also be applied at the RU level (labelled ldquo7rdquo in Figure 10) Early national deforesta-tion reporting had more expert interventions because of lower sample rates less availability of high-resolution imagery and more use of records data over the remote sensing sample Currently few expert interventions occur with most occurring for the 1975ndash1990 time period which has a smaller sample
At the strata level the updated deforestation estimates by time period and post-class modifier are proportioned (labelled ldquo5rdquo in Figure 10) into their respective RUs (see Ap-pendix 3)
The data are then annualized The deforestation estimates for each time period (by post class and RU) are assigned
to the middle year of the time period (ie 1983 for 1975ndash1990 1995 for 1990ndash2000 and 2004 for 2000ndash2008) Annual trends are produced by applying linear interpola-tion between midpoints and extrapolation from endpoints (labelled ldquo6rdquo in Figure 10) Figure 11 provides one example
Large event mapping data records and activity data and expert interventions are applied as shown by the various green boxes in Figure 10 Large event data have the year of the event attached to them and are added to the mapping data at the RU level (labelled ldquo7rdquo in Figure 10) Records data also generally have a date attached and are added to the annualized data in a similar fashion to large event data
Figure 12 shows the trend line calculated in Figure 11 and the large event data (purple) representing hydro reservoir flooding facility construction and associated transporta-tion and hydro line corridors
Figure 11 Example deforestation trend produced using data from three mapping periods
Canadian Forest Service | Pacific Forestry Centre | nrcangccaforestsresearch-centrespfc1348918
Figure 12 Example of a deforestation area trend from sample mapping (red) and large events data (purple)
The post-class modifier classes (Table 1 and Table A21 in Appendix 2) are aggregated (labelled ldquo8rdquo in Figure 10) to the appropriate industrial category and good practice guidance class using a lookup table The various modifiers within each deforestation post class provide flexibility to summarize to different industrial categories based on user requirements (eg the categories used by the National For-est Carbon Monitoring Accounting and Reporting System and shown in Tables A21 and A22)
The result of the processing is a series of database tables A major product among these is the list of annual deforesta-tion area per RU per industrial class (labelled ldquo9rdquo in Figure 10) Another product is the breakdown of forest pretype percentages by RU this is done by calculating the percent-age area of each pretype mapped in the RU Reporting for the UNFCCC requires separate estimates of deforestation and greenhouse gas emissions for managed and unman-aged forest thus a separate table is produced for unman-aged forest (labelled ldquo10rdquo in Figure 10)
5 Quality ControlThree major quality control stages are applied during the deforestation mapping process
1 initial mapping quality control
2 revision quality checks and
3 overall quality assurance or vetting where a check on the final mapping data is performed
This multi-stage approach reduces the likelihood of errors and increases consistency of and confidence in the final product The data processing stage has further checks for data integrity After the data are calculated in the esti-mate process the final numbers and trends are assessed for changes from previous year estimates Deforestation estimates are also scrutinized by external users before they incorporate the data into their applications For an over-view of quality control practices see Dyk et al (2011)
51 Quality Control at the Mapping Stage
The mapping process flow is illustrated in Figure 13 includ-ing the quality control steps Typical errors caught through quality control at the mapping stage include incorrect event interpretations or delineations event omissions or commissions missing field values typographical errors and topology problems During the quality control phase an internal Canadian Forest Service reviewer performs detailed checks to ensure consistency with mapping and interpretation rules and returns a set of points to flag and describe the problem areas to the interpreter or contrac-tor These quality control points are stored in the mapping geodatabase as a permanent layer
Canadarsquos National Deforestation Monitoring System System DescriptionInformation Report BC-X-439
19
Figure 13 The deforestation mapping and quality control process flow
The mapping interpreter reviews these points and applies the recommended corrections to the working database The quality control points are sent to the interpreter early and frequently in the project timeline to reduce or avoid propagation of persistent errors or misunderstandings through the duration of the project
The original line and polygon mapping is preserved and re-visions are performed in separate ldquorevised linerdquo and ldquorevised polygonrdquo layers in the project geodatabase Information about the changes including what was done by whom and the date is added for every revised event Any deleted events are also retained in what are termed the ldquodrop lay-ersrdquo to mark the area as a non-deforestation event which is reviewed during future mapping
When the revised data are resubmitted to the Canadian Forest Service the data layers make clear what changes were requested and what changes were made The re-viewer uses these layers to verify that appropriate revisions were properly applied at all quality control points Any further errors or misunderstandings are communicated to the interpreter immediately for resolution At this stage the interpreter can also open a dialogue regarding specific events using additional comment fields in the quality control point layer or personal communication
The next level of quality control is the final vetting This audit step is conducted internally by senior Canadian For-est Service interpreters to ensure consistency of mapping across all projects All aspects of the new data are reviewed during this stage omission and commission errors delinea-
tion and attribution In addition the older mapping data are scanned to ensure newer imagery confirms the original interpretation A set of ldquovet revisionrdquo points is created to mark all adjustments required in the database An analyst works through these point by point to make the necessary changes noting any complex or uncertain events and communicating directly with the vetting interpreter when necessary
Field validation is a desirable aspect of the revision process but is not included during the mapping stage In general field campaigns are conducted on an ongoing basis when resources permit Areas where local knowledge or ground truth information are needed to clarify the interpretation are identified from the interpreter confidence records or the revision point data Dedicated field programs schedule air or ground visits to high-impact and low- to moderate-confidence events Local experts sometimes provide information about ground conditions that can be used to verify and update the database
Throughout the entire mapping and revision process an internal ldquoproject storyrdquo is maintained by the Canadian For-est Service This document summarizes activity on a given project including staff and contractors involved dates and actions completed It also includes detailed explanation of any complex situations or vet revisions as well as notes on any issues raised by the quality control or vetting interpret-ers To maintain consistency analysts who are involved in revisions or who vet revisions read this project story before starting work
Canadian Forest Service | Pacific Forestry Centre | nrcangccaforestsresearch-centrespfc1348920
52 Quality Control at the Data Processing Stage
Once revisions are vetted final data integrity checks are conducted on the project database to find and correct any technical errors such as missing attributes mismatched post classes and modifiers incorrect or reversed event dates inappropriate line widths topology errors overlaps and duplicates and typos This stage is partially automated The final mapping layers can be loaded into the national database only after the integrity checks have been com-pleted
Data quality checks are built into the script that automates the data processing stages The script both delivers reports to the screen while running and dumps to log files which are reviewed by Canadian Forest Service staff to ensure the runs were successful
Transfer of the final GIS tables into the non-spatial defor-estation database is also automated The grid and event tables for each time period are checked before load-ing and the number of records loaded is recorded and compared with previous runs to highlight any potential discrepancies
The database queries and tables used to create the annual estimates by industrial category and RU are controlled by Microsoft Access macros to ensure consistency between the runs
53 Quality Control at the Output Analysis Stage
Following generation of the estimate tables the main out-puts (annualized deforestation by industrial class and RU pretype table and unmanaged forest table) are evaluated closely by Canadian Forest Service experts to ensure that estimates have been calculated properly and that discrep-ancies from previously calculated values can be explained To aid in this effort a comparison spreadsheet is created for each RU showing the deforestation estimates by indus-trial class for the current and previous yearrsquos national run together with illustrations and statistics The experts scru-tinize the data for changes and ensure the new estimates are consistent with the input mapping data Any specific issues and special adjustments required are documented in a report that becomes part of the record for each yearrsquos estimate
54 External Quality Control
Users of the deforestation estimates conduct their own reviews of the data prior to use in their systems and com-municate any issues before incorporating the data into their own business processes When new issues arise these are dealt with and the NDMS quality control processes are updated to catch similar issues in the future
6 ConclusionsDeforestation is the direct human-induced conversion of forested land to non-forested land use The NDMS was de-signed and implemented to provide information needed by Canada to meet its obligation under the UN Frame-work Convention on Climate Change to report the areas affected annually by deforestation Also considered was the need to provide information useful for policy analysis land management and forest stewardship applications Understanding why where and when deforestation occurs is a prerequisite to the development of appropriate policy instruments to optimize land use develop mitigation strat-egies and address cumulative impacts on forest resources
The NDMS uses manual mapping from a satellite remote sensing sampling system informed by records-based information and expert knowledge to provide information about deforestation in Canada The remote sensing map-ping is supported by available ancillary information such as high-resolution imagery forest inventory road networks and other industrial databases Certain types of events that are large and isolated (eg mine and hydroelectric devel-opments) are mapped and incorporated separately in the overall deforestation estimates Occasionally records and activity data on land use changes are incorporated when they are deemed more appropriate than the sampling es-timate The mapping results from the sample are scaled up to regional levels In the data processing stage these data are merged and annualized to produce national deforesta-tion estimates
The system has been used and improved over the last 10 years The flexibility of the NDMSrsquos design makes it possible to adapt to future changes in image sources ancillary data resource availability and user needs and positions the pro-gram well for long-term maintenance and improvement
Canadarsquos National Deforestation Monitoring System System DescriptionInformation Report BC-X-439
21
7 References
Burt W Paradine D Leckie D 2006 Geographic Information system processing of deforestation mapping data for estimating deforested area of Canada Natural Resources Canada Canadian Forest Service Pacific Forestry Centre Victoria BC Report DRS-P-001
Dyk A Tinis S Leckie D 2011 National Inventory Report 2011 Deforestation area estimation for Canada Quality con-trol overview Natural Resources Canada Canadian Forest Service Pacific Forestry Centre Victoria BC Report DRS-N-031
Ecological Stratification Working Group 1996 A national ecological framework for Canada Agriculture and Agri-Foods Canada Research Branch Centre for land and Biological Resources Research and Environment Canada State of the Environ-ment Directorate Ottawa Ont
Environment Canada 2006 National Inventory Report 1990ndash2004 Greenhouse gas sources and sinks in Canada Govern-ment of Canada Submission to the UN Framework Convention on Climate Change httpunfcccintnational_reportsannex_i_ghg_inventoriesnational_inventories_submissionsitems3734php (Accessed August 2014)
Environment Canada 2014 National Inventory Report 1990ndash2012 Greenhouse gas sources and sinks in Canada Govern-ment of Canada Submission to the UN Framework Convention on Climate Change Report issued by Pollutant Inventories and Reporting Division Environment Canada Ottawa Onthttpunfcccintnational_reportsannex_i_ghg_inventoriesnational_inventories_submissionsitems8108php (Accessed August 2014)
Food and Agriculture Organization 2006 2001 Global forest resources assessment 2000 main report United Nations Food and Agriculture Organization Rome Italy FAO Forestry Paper 140
Gillis M Omule A Brierley T 2005 Monitoring Canadarsquos forests The National Forest Inventory Forestry Chronicle 81(2)214ndash221
Intergovernmental Panel on Climate Change 2003 Good practice guidance for land use land-use change and forestry Penman J Gytarsky M Hiraishiet T et al (eds) Institute for Global Environmental Strategies Hayama Japan
Intergovernmental Panel on Climate Change 2006 2006 IPCC guidelines for national greenhouse gas inventories Egg-leston HS Buendia L Miwa K Ngara T Tanabe K (eds) Intergovernmental Panel on Climate Change National Green-house Gas Inventories Programme Institute for Global Environmental Strategies Hayama Japan httpwwwipcc-nggipigesorjppublic2006gl (Accessed January 2015)
Kurz W 2010 An ecosystem context for global forest cover loss estimates Proceedings National Academy of Sciences 107(20)9025ndash9026
Kurz W Apps M 2006 Developing Canadarsquos national forest carbon monitoring accounting and reporting system to meet the reporting requirements of the Kyoto Protocol Mitigation and Adaptation Strategies for Global Change 11(1)33ndash43
Kurz W Dymond C White T Stinson G Shaw C Rampley G Smyth C Simpson B Neilson E Trofymow J Metsaranta J Apps M 2009 CBM-CFS3 A model of carbon-dynamics in forestry and land-use change implementing IPCC standards Ecological Modelling 220(4)480ndash504
Kurz W Shaw C Boisvenue C Stinson G Metsaranta J Leckie D Dyk A Smyth C Neilson E 2013 Carbon in Canadarsquos boreal forest A synthesis Environmental Reviews 21260ndash292
Canadian Forest Service | Pacific Forestry Centre | nrcangccaforestsresearch-centrespfc1348922
Leckie D Dyk A Ortlepp S Tinis S 2010 Records of decision for Canadarsquos national deforestation estimate 2011 Natu-ral Resources Canada Canadian Forest Service Pacific Forestry Centre Victoria BC Report DRS-N-029
Leckie D Dyk A Paradine D Tammadge D Tinis S 2012 Deforestation interpretation guide Natural Resources Canada Canadian Forest Service Pacific Forestry Centre Victoria BC Report DRS-M-030
Leckie D Dyk A Tinis S 12009 Records of decision for Canadarsquos national deforestation estimate Natural Resources Canada Canadian Forest Service Pacific Forestry Centre Victoria BC Report DRS-N-026
Leckie D Paradine D Burt W 2006a Mapping sample coverage for Canadarsquos national deforestation estimate 2006 Natural Resources Canada Canadian Forest Service Pacific Forestry Centre Victoria BC Report DRS-N-002
Leckie D Paradine D Tinis S 2006b Geographic strata for Canadarsquos national deforestation estimates report Natural Resources Canada Canadian Forest Service Pacific Forestry Centre Victoria BC Report DRS-Q-003
Leckie D Paradine D Kurz W Magnussen S [2015] Deforestation mapping sampling designs for Canadian land-scapes Natural Resources Canada Canadian Forest Service Victoria BC In review
Lempriegravere T Kurz W Hogg E Schmoll C Rampley G Yemshanov D et al 2013 Canadian boreal forests and climate change mitigation Environmental Reviews 21(4)293ndash321
Le Queacutereacute C Peters G Andres R Andrew R Boden T et al 2014 Global carbon budget 2013 Earth System Science Data 6689ndash760
Masek J Cohen W Leckie D Wulder M Vargas R de Jong B Healey S Law B Birdsey R Houghton R Mildrexler D Goward S Smith W 2011 Recent rates of forest harvest and conversion in North America Journal of Geophysical Research 116G00K03
McGovern M 2008 Reporting zones GHG spatial reporting structure for Canada 2008 Environment Canada Greenhouse Gas Division Ottawa Ontario
Montreal Process 2009 Criteria and indicators for the conservation and sustainable management of temperate and boreal forests Fourth edition httpwwwmontrealprocessorgdocumentspublicationsgeneral2009p_4pdf (Accessed January 2015)
Pan Y Birdsey RA Fang J et al 2011 A large and persistent carbon sink in the Worldrsquos forests Science 333988ndash993
Paradine D 2007 National Inventory Report 2008 ACCESS database description GIS processing description and consoli-dated GIS database description Natural Resources Canada Canadian Forest Service Pacific Forestry Centre Victoria BC Report DRS-N-019
United Nations Framework Convention on Climate Change 2002 Conference of the PartiesndashReport of the Confer-ence of the Parties on its seventh session held at Marrakesh from 29 October to 10 November 2001 United Nations Office Geneva Switzerland httpunfcccintresourcedocscop713pdf (Accessed January 2015)
Wulder M Masek J Cohen W Loveland T Woodcock C 2012 Opening the archive How free data has enabled the science and monitoring promise of Landsat Remote Sensing of Environment 1222ndash10
Canadarsquos National Deforestation Monitoring System System DescriptionInformation Report BC-X-439
23
Appendix 1 Pretype Forest Conditions
The tables below list the approved forest type density and maturity values applied in deforestation mapping Note not all combinations are valid particularly those that include recent disturbance and regeneration terms Table A11 lists the ac-ceptable parameter combinations
The most common pretype groupings found are the 36 combinations of three Type classes (B C and M) three Density classes (D O and S) and four Maturity classes (R Y I and M) The two older Maturity classes (O and G) require additional verification to identify them Several classes identify recently disturbed forests (K X and R)
Table A11 Pre-change forest type descriptors
TYPE Definition Restrictions of use
B Broadleaf gt 75 of trees are broadleaf (Angiospermae)
C Conifer gt 75 of trees are conifer (Coniferae)
M Mixed gt 25 of both broadleaf and conifer present
K Clearcut Exposed ground and (or) ground vegetation No visible regeneration
Use only with S or N density and Q maturity
X Burn Exposed ground and (or) ground vegetation No visible regen-eration May have live residual trees up to 25 crown closure
Use only with S or N density and Q maturity
R Regen Regenerating areas with lt 25 crown closure where the forest composition (B C or M) is not identifiable
Table A12 Pre-change forest density descriptors
DENSITY Definition Restrictions of use
D Dense gt 60 crown closure
O Open 25ndash60 crown closure
S Sparse 5ndash25 crown closure
N Nil lt 5 crown closure Use only with K and X pretype
Table A13 Pre-change forest maturity descriptors-
MATURITY Definition Restrictions of use
Q Recent disturbance No visible regeneration Use only with K and X pretype
R Regen Forest stands 0ndash14 years old
Y Young Forest stands 15ndash25 years old
I Immature Forest stands 26ndash40 years old
M Mature Forest stands 41ndash80 years old
O Old Forest stands 81ndash200 years old
G Old-growth Forest stands over 200 years old Restricted to British Columbia only
Canadian Forest Service | Pacific Forestry Centre | nrcangccaforestsresearch-centrespfc1348924
Table A14 Valid combinations of pretype attributes (TypendashDensityndashMaturity)
Regen Broadleaf Mixed Coniferous
Dense RDR BDR MDR CDR
BDY MDY CDY
BDI MDI CDI
BDM MDM CDM
BDO MDO CDO
CDG
Open ROR BOR MOR COR
BOY MOY COY
BOI MOI COI
BOM MOM COM
BOO MOO COO
COG
Sparse RSR BSR MSR CSR
BSY MSY CSY
BSI MSI CSI
BSM MSM CSM
BSO MSO CSO
CSG
Burn Clearcut
Regen Broadleaf Mixed Coniferous
Disturbed XSQ KSQ
XNQ KNQ
Canadarsquos National Deforestation Monitoring System System DescriptionInformation Report BC-X-439
25
Appendix 2 Post-class Modifiers by Industrial Category
Table A21 lists all land use post-class deforestation modifiers They provide additional detail regarding what has occurred on the ground for each deforestation event These classes can be assigned to various industrial classes (see Table A22) Detailed definitions are provided in the Deforestation Interpretation Guide (Leckie et al 2012)
Table A21 Post class and post-class modifier codes and short descriptions grouped by industrial categorysector (in bold)
Post class Post class modifier
Agriculture
AG Agriculture ab bare
cp crop
fy farm yard
pa pasture
AL Artificial Lake aa agriculture pond
ea agriculture effluent pond
OF Open Field fa agriculture setting
Flooded Standing Forest
AL Artificial Lake ff flooded standing forest
Forestry
RD Road mf mainline forestry road
sf secondary forestry road
xf tertiary forestry road with width ge 20 m
SD Soil Disturbance ld logging landing
ss rock slide scar
Hydro Infrastructure
CR Corridor hm hydro linendashmain
hs hydro linendashsecondary
xy hydro linendashtertiary ge 20 m
IN Industrial ih hydro infrastructure
Hydro Reservoir
AL Artificial Lake hr hydroelectric flooding
Industry
AL Artificial Lake ei industrial effluent pond
IN Industrial hi heavy industrial
li light industrial
OF Open Field fi industrial
Canadian Forest Service | Pacific Forestry Centre | nrcangccaforestsresearch-centrespfc1348926
Post class Post class modifier
Mining
AL Artificial Lake em waste ponds for mining
IN Industrial mh mine heavy
ml mine light
OF Open Field fk mine facility
fm mine
fq pit and quarry
SD Soil Disturbance mn open pit mine
pq gravel pitquarry
Municipal
AL Artificial Lake ad pond urban setting
ar pond rural residential
ul other human caused
CR Corridor cl cut line
cu undifferentiated
OF Open Field fd urbansuburban
fr rural residential
uf undifferentiated field
RR Rural Residential rf few trees remaining
rm many trees remaining
SD Soil Disturbance lf landfill
su undifferentiated
UR Urban Residential df few trees remaining
dm many trees remaining
Oil and Gas
CR Corridor pp pipelinendashmain
ps pipelinendashsecondary
xp pipelinendashtertiary ge 20 m
IN Industrial oi oil sands industrial
op oil and gas industrial
wp well pad
OF Open Field fo oil and gas facility
fs oil sands open field
SD Soil Disturbance os oil sands
AL Artificial Lake eo oil and gas related pond
Canadarsquos National Deforestation Monitoring System System DescriptionInformation Report BC-X-439
27
Post class Post class modifier
Peat Mining
SD Soil Disturbance pm peat extraction
Recreation
AL Artificial Lake af golf course related
ap recreational water body
OF Open Field fc recreational field
RC Recreational ca campground
go golf course
ru other or undifferentiated
sk ski areas
Transportation
CR Corridor as airstrip
ry railway
RD Road mm main road clearly for a mine
mr main road
mo main road clearly for oil and gas
my main road clearly for hydroelectric
sm secondary mining road
so secondary oil and gas road
sr secondary road
sy secondary hydroelectric road
xm tertiary mining road with width ge 20 m
xo tertiary oil and gas road with width ge 20 m
xr tertiary road with width ge 20 m
xy tertiary hydroelectric road with width ge 20 m
Canadian Forest Service | Pacific Forestry Centre | nrcangccaforestsresearch-centrespfc1348928
Table A22 Aggregation of deforestation mapping classes to good practice guidance and industrial categories
Good practice guidance class
Crop-land (CL)
Wetlands (WL) Settlements (SL)
Industrial Categories
Agric
ultu
re
Floo
ded
stan
ding
fore
st
Hyd
ro re
serv
oir
Peat
min
ing
Fore
stry
Hyd
ro in
fras
truc
ture
Indu
stry
Min
ing
Mun
icip
al
Oil
and
gas
Recr
eatio
n
Tran
spor
tatio
n
Def
ores
tatio
n po
st c
lass
Agriculture AG ab cp pa fy
Artificial Lake AL aa ea ff hr ei emad ar of ul eo af ap
Corridor CR hm hs xy cl cu
pp ps xp as ry
Industrial IN ih hi li mh mloi op wp
Open Field OF fa fi fk fm fq fd fr uf fo fs fc
Recreational RC ca go fu sk
Road RDmf sf xf
mm mo mr my sm so sr sy xm
xo xr xy
Rural Residential RR rf rm
Soil Disturbance SD pm ld ss mn pq lf su os
Urban Residential UR df dm
Canadarsquos National Deforestation Monitoring System System DescriptionInformation Report BC-X-439
29
Appendix 3 Deforestation Strata Units and Reconciliation Unit InclusionTable A31 shows the names of the deforestation strata their area in kilohectares and the percentage of that area contained in each reconciliation unit that they overlap (sorted by reconciliation unit identification number see Figure 1 for unit loca-tion and name)
Table A31 Area of strata units and percent of strata unit area that is in each reconciliation unit
Deforestation strata unit name Strata unit area (kilohectares)
Reconciliation unit ( inclusion)
Newfoundland Eastern Woodlot 4 477 1 (100)
Newfoundland Forest Activity Zone 6 512 1 (100)
Newfoundland St Johns 55 1 (100)
Labrador Arctic 1 893 2 (100)
Labrador Northern Forest 23 238 3 (98) 4 (2)
Labrador Forest Activity Zone 4 620 4 (100)
Nova Scotia Eastern Woodlot 2 894 5 (100)
Nova Scotia Forest Activity Zone 2 396 5 (100)
Nova Scotia HalifaxDartmouth 182 5 (100)
Prince Edward Island 577 6 (100)
New Brunswick Eastern Woodlot 4 121 7 (100)
New Brunswick Forest Activity Zone 3 174 7 (100)
Quebec Arctic 20 443 10 (75) 9 (18) 8 (7)
Quebec Eastern Townships 3 948 11 (100)
Quebec Gaspe Forest Activity Zone 2 740 11 (100)
Quebec Southern RU12 2 968 12 (100)
Quebec Northern Forest 72 759 14 (73)15 (22) 13(5)
Quebec Forest Activity Zone 44 717 15 (100)
Quebec Ile DAnticosti 795 15 (100)
Quebec Lac St Jean 964 15 (100)
Quebec Southern RU15 1 687 15 (100)
Ontario Thunder Bay 225 16(100)
Ontario Southern 8 198 17 (100)
Ontario Manitoulin Island 326 17 (100)
Ontario Northern Forest 46 468 18 (56) 16 (43) 19 (1)
Ontario SudburyNorth Bay 874 19 (100)
Ontario Forest Activity Zone 42 398 19 (56) 16 (43) 18 (1)
Ontario Sault Ste Marie 536 19 (92) 17 (8)
Manitoba Forest Activity Zone RU22 East 2 405 22 (100)
Manitoba Forest Activity Zone RU22 North 6 109 22 (100)
Manitoba Prairie Fringe RU22 804 22 (100)
Manitoba Northern Forest 37 339 22 (43) 21 (35) 25 (19) 23 (3)
Manitoba Forest Activity Zone RU23 7 382 23 (100)
Manitoba Prairie Fringe RU23 3 970 23 (100)
Manitoba Hotspot 851 24 (100)
Manitoba North Prairie 6 117 24 (100)
Canadian Forest Service | Pacific Forestry Centre | nrcangccaforestsresearch-centrespfc1348930
Deforestation strata unit name Strata unit area (kilohectares)
Reconciliation unit ( inclusion)
Saskatchewan Northern Forest 21 224 27 (75) 26 (22) 28 (3)
Saskatchewan Prairie Fringe 5 509 28 (100)
Saskatchewan Inactive Forest Activity Zone 6 196 28 (58) 27 (42)
Saskatchewan Forest Activity Zone 8 189 28 (99) 27 (1)
Saskatchewan North Prairie 8 167 29 (100)
Saskatchewan Prairie 15 921 30 (100)
Alberta Northern Forest 10 862 31 (58) 34 (28) 32 (8) 33 (6)
Alberta Forest Activity Zone 22 066 34 (100)
Alberta Fort McMurray 807 34 (100)
Alberta High Level 789 34 (100)
Alberta Northwest Fringe 5 436 34 (100)
Alberta Prairie Fringe 6 038 34 (100)
Alberta North Prairie 7 397 35 (100)
Alberta RU 36 Forest Activity Zone 4 764 36 (100)
Alberta Palliser Triangle 3 689 37 (100)
Alberta Prairie West 4 522 37 (100)
British Columbia RU 38 6 759 38 (100)
British Columbia Prairie Fringe 2 333 39 (100)
British Columbia RU 40 19 220 40 (100)
British Columbia Lower Mainland East Vancouver Island
1 142 41 (100)
British Columbia RU 41 Forest Activity Zone 15 440 41 (100)
British Columbia VI QCI 3 813 41 (100)
British Columbia Okanagan 1 109 42 (100)
British Columbia Prince George 464 42 (100)
British Columbia RU 42 Forest Activity Zone 44 286 42 (96) 39 (4)
Yukon Arctic 496 43 (100)
Yukon Northern Forest 19 987 45 (91) 44 (9)
Yukon Whitehorse 417 46 (100)
Yukon Forest Activity Zone 27 440 46 (98) 47 (1)
Northwest Territories Arctic 42 788 48 (49) 49 (43) 50 (7)
Northwest Territories Northern Forest 91 972 50 (52) 51 (37) 53 (9) 52 (2)
Northwest Territories Yellowknife 176 51 (100)
Northwest Territories Forest Activity Zone 467 54 (100)
Nunavut Arctic 198 915 56 (64) 57 (25) 55 (11)
Nunavut Northern Forest 9 892 58 (100)
nrcangccaforests
For more information about the Canadian Forest Service visit our website at nrcangccaforests or contact any of the following Canadian Forest Service establishments
Canadian Forest Service Contacts
Atlantic Forestry Centre PO Box 4000 Fredericton NB E3B 5P7 Tel (506) 452-3500 Fax (506) 452-3525 nrcangccaforestsresearch-centresafc13447
Atlantic Forestry Centre ndash District Office Sir Wilfred Grenfell College Forestry Centre University Drive Corner Brook NF A2H 6P9 Tel (709) 637-4900 Fax (709) 637-4910
Laurentian Forestry Centre 1055 rue du PEPS PO Box 3800 Sainte-Foy PQ G1V 4C7 Tel (418) 648-5788 Fax (418) 648-5849 nrcangccaforestsresearch-centreslfc13473
Great Lakes Forestry Centre PO Box 490 1219 Queen St East Sault Ste Marie ON P6A 5M7 Tel (705) 949-9461 Fax (705) 759-5700 nrcangccaforestsresearch-centresglfc13459
Northern Forestry Centre 5320-122nd Street Edmonton AB T6H 3S5 Tel (403) 435-7210 Fax (403) 435-7359 nrcangccaforestsresearch-centresnofc13485
Pacific Forestry Centre 506 West Burnside Road Victoria BC V8Z 1M5 Tel (250) 363-0600 Fax (250) 363-0775 nrcangccaforestsresearch-centrespfc13489
Headquarters 580 Booth St 8th Fl Ottawa ON K1A 0E4 Tel (613) 947-7341 Fax (613) 947-7396
Canadian Wood Fibre Centre A virtual research centre of the Canadian Forest Service Natural Resources Canada nrcangccaforestsresearch-centrescwfc13457
1
2
3
5
6
4
1
25
3 6
4
1
To order publications online visit the Canadian Forest Service Publications website at
cfsnrcangccapublications

Canadarsquos National Deforestation Monitoring System System DescriptionInformation Report BC-X-439
11
424 Records Data
Spatial and non-spatial records and activity data may also be incorporated into the estimation or quality control processes In early deforestation reports records and activity data were sometimes used to provide estimates of deforestation associated with a particular sector and area As more mapping was completed estimates from records were replaced by mapping-based information Records data used in the past have included hydroelectric clearing areas forestry road records and standard road class widths and oil and gas pipeline records
43 Mapping
Deforestation event mapping is done using core date im-agery and multi-band image products Mapping is broken up into units of mapping work called ldquoproject packagesrdquo to be completed by internal staff provincial partners or qualified private sector contractors All relevant images and supporting data are assembled as a package for mapping in a particular area Detection interpretation digitization and attribution of individual deforestation events is done manually by trained interpreters according to the estab-lished NDMS methods in a standardized ArcGIS geodata-base (Leckie et al 2012)
431 Data Handling
Interpretation of deforestation events requires the detec-tion of change between pairs of images acquired at two ldquocore datesrdquo chosen to best represent the mapping time period start and end year (ie 1975 1990 2000 and 2008) Forest cover changes or potential events are highlighted using a multi-temporal display or ldquochange enhancementrdquo image created using the visible red band from two core dates of imagery When the mapping period end date image is displayed using the red image colour gun and the mapping period start image is displayed using green and blue the resulting image shows areas of vegetation loss as red In addition possible deforestation events can be detected by comparing the two core images directly Many changes besides deforestation can cause a difference between the images (eg forest harvest forest fires beaver dam flooding wind blowdown agricultural field changes and avalanches) so it is critical that a change event be confirmed as deforestation before it is mapped
Individual deforestation events are manually interpreted and identified delineated and attributed Figures 7 and 8 illustrate some of the data that are used in this process Landsat multiple band combinations at both core dates change enhancement higher-resolution imagery and field oblique aerial photographs
Figure 7 Examples of various Landsat satellite band combinations and change enhancements that may be used in the mapping process Note the change enhancement at right shows red triggers where vegetation loss or change has occurred Band combinations shown are normal colour rendition on left with colour infrared in the middle The right-hand column shows Landsat Thematic Mapper (TM) and Enhanced Thematic Mapper (ETM) bands 453 (ie the two near infrared bands and a red band) displayed as red green blue
Canadian Forest Service | Pacific Forestry Centre | nrcangccaforestsresearch-centrespfc1348912
Figure 8 Examples of supplemental data use Left Example of confirmed and interpreted events (red and yellow lines) shown as polygons on the SPOT imagery (25 m resolution SPOT 5 top left and 10 m SPOT 4 bottom left) Right Example of flight path and oblique aerial photograph from a deforestation field verification campaign
Typically the interpretation process is conducted in a GIS environment where change enhancement and single-date images can be layered and compared by blinking or using the swipe tool Georeferenced ancillary imagery can be simultaneously displayed and a link between ArcGIS and Google Earth allows the synchronization of spatial display extents in both programs
432 Project Packages
Project packages are units of mapping work They include specification of the mapping area time period to be mapped and the sample cells to be used Each project package contains a standardized geodatabase with pre-defined sets of values for some of the attribute fields core date and change enhancement imagery other imagery in-cluding winter and overlapping scenes from east and west of the scene being mapped additional SPOT and aerial photographs (if available) and ancillary data sets
Once the mapping has been completed for a project and passed successfully through quality control the data are added to the national geodatabase which carries all defor-estation mapping data for the country including all time
periods The structure of the project geodatabases mirrors the structure of the national geodatabase
433 Interpretation
Image interpretation is done manually on a cell-by-cell ba-sis Typically the change enhancement is used first to iden-tify change events These are then confirmed or refuted as deforestation by the interpreter using the individual core date images supported by other image and ancillary data The supporting data are used to assess whether an event area was forested before the change and whether the event meets the deforestation definition Supporting data are also used to help interpret pretype and post class
The boundary of a deforestation event is identified in the Landsat images but higher-resolution imagery is used in a supporting role to improve event boundary delineation Interpreters follow specific digitizing guidelines provided in the Deforestation Interpretation Guide (Leckie et al 2012) that dictate how events shall be mapped (eg digitize smooth lines rather than following pixel boundaries avoid gaps and overlaps between adjacent events keep the mapping topology clean etc)
Canadarsquos National Deforestation Monitoring System System DescriptionInformation Report BC-X-439
13
Deforestation events may be linear in form (eg roads hydro lines) or polygonal They are digitized accordingly as lines or polygons in the project geodatabase Specific guidelines apply for each type of feature Delineation fol-lows clearly defined situational rules (eg for compositemixed use polygons roads in cutblocks tertiary versus more significant roads episodic clearing etc) all of which are addressed in detail in the Deforestation Interpretation Guide When events extend beyond the boundaries of a sample cell they are delineated to the full extent of the event but only the portion inside the cell is included in the estimation
Event attributes are interpreted and recorded using attri-bute values defined in the NDMS data dictionary Pretype attributes include forest type density and maturity (see Appendix 1 for details) Post class attributes are listed in Table 2 (see Appendix 2 for details) Interpreters also record their level of confidence about each deforestation event (ie how confident they are that it was forest before the change and that it is indeed a new land use) Comment fields are used extensively to record details specific to each event These may indicate uncertainty in an event a request by the interpreter for specific review by the qual-ity control person or the need for checking the event in a later time period The widths for linear events (such as roads or corridors) are also recorded as it is more efficient to map these as lines and later convert to polygons using the width data during a subsequent processing stage
If mapping already exists for an earlier time period in the area the interpreter reviews it in the context of recent imagery either to confirm the previous interpretations or to note whether corrections are required Points are used to flag areas for revision or later review by analysts such as where older mapping may require updating
In some cases imagery available for a core date is contami-nated by clouds shadows or missing data at image edges In such cases the interpreter digitizes the contaminated area within the sample cells and saves the polygon into a special geodatabase layer for ldquonon-interpretable areardquo poly-gons and notes the affected date The areas saved into this layer are removed from the sample during later processing to create what is termed the ldquointerpretable gridrdquo The open-ing of the Landsat archive through free access to geocor-rected imagery has substantially reduced the amount of
non-interpretable area entering the estimate calculations For example sometimes images outside the core date can be used to infer deforestation in the non-interpretable area In fact recently non-interpretable areas have been almost eliminated from the process
A series of quality checks has been built into the mapping process these are completed in every mapping project Canadian Forest Service analysts conduct quality control checks of the mapped data (see Section 5) and return a set of quality control points to the interpreters indicating where more work and specific changes are needed before the mapping can be loaded into the national geodata-base
44 Deforestation Estimation
The mapping data from deforestation sample cells are used to estimate the area of deforestation in each RU by scaling up from sample to population in each defor-estation stratum and then summing the deforestation estimate for each stratum in an RU Scaling up is done for each land use type (post-class modifier) in each time period Temporal interpolation is used to compute annual deforestation rates Lastly large event mapping records and activity data and intelligence are used to refine the estimates when appropriate
441 GIS processing
The national deforestation geodatabase contains all the mapped areas representing deforestation events sampled within each time period as lines and polygons The geo-database also contains layers required for the estimation calculations including the sample grids the non-interpre-table areas the Landsat image boundaries (which define the core dates and areas sampled) the deforestation strata boundaries and the RU boundaries
The spatial data are first processed to prepare them for the scaling up analysis which is conducted later in a non-spa-tial database program (Section 444) Figure 9 provides a schematic of the tasks involved in the GIS processing (Burt et al 2006) The two main calculated outputs produced are the event and grid tables shaded in red in Figure 9 The processing of the mapped GIS data for the national sum-mary is performed for each time period
Canadian Forest Service | Pacific Forestry Centre | nrcangccaforestsresearch-centrespfc1348914
Figure 9 Simplified deforestation GIS processing flow Input tables are in green processes in yellow and output tables in red Gold arrows denote updates to a table The term ldquolinesrdquo refers to linear deforestation events ArcGIS commands are underlined
Canadarsquos National Deforestation Monitoring System System DescriptionInformation Report BC-X-439
15
The first of the output tables the ldquointerpretable gridrdquo (labelled grd_ident in Figure 9) defines the actual area for which mapping was done As a result the full set of sample cells is clipped by the extent of the Landsat imagery (thus removing portions of the cells that fall outside the Landsat image boundary) and has the non-interpretable areas (eg clouds) removed
The second table the ldquoFinal Event Polygonsrdquo (labelled py_fn) is created from the intersection of many input lay-ers The post-class modifier code for each event is carried through in these deforestation calculations The linear de-forestation events are converted to polygons by applying a buffer according to the width attribute associated with each line then combined with the other deforestation polygon events to create a complete polygonal coverage of all deforestation events mapped The events are then intersected with the interpretable grid layer Further inter-sections are applied to the boundary RU and deforestation strata layers to identify which strata and RU are associ-ated with each event In the end the data for each event include attributes drawn from all the intersected layers including the deforestation stratum and RU of each event As well small slivers created during the GIS processing steps are removed
At this stage it is possible to calculate the rate of deforesta-tion for each time period All events are assigned to the time period in which they occur (ie P1 [1975ndash1990] P2 [1990ndash2000] or P3 [2000ndash2008]) based on the core dates of imagery used for mapping For each event an effective annual rate of deforestation (hectares per year) is calculat-ed by dividing the deforested area by the number of years between the core dates Later in the process the resulting per-event annual rates are summed for each stratum and divided by the area of grid cells interpreted to determine the average annual rate for each time period and post-class modifier (Section 444)
To provide flexibility the mapping activity captures forest clearings that meet a more inclusive definition of defor-estation than strictly required Land conversion of sparse forest does not constitute deforestation (unless it is conver-sion of a recently disturbed or regenerating area) but is mapped for completeness unless otherwise specified The GIS processing steps are used to exclude such mapped events with sparse forest density
442 Large Events and Records Data
Certain types of events that are large uncommon and iso-lated (eg hydroelectric reservoirs new surface mines long and major hydroelectric lines etc) are better represented by complete mapping and census rather than sampling (Leckie et al [in review]) Such events termed ldquolarge eventsrdquo are mapped separately and completely using either core date imagery or imagery captured as close to the actual event dates as possible When large events fall within sample cells and thus are also captured by the sampling
these are excluded from the processing of sample data to avoid double-counting
Records and activity data when used for a given type of deforestation in a region (eg stratum) are added to the database and removed from the processing of sample data similar to large events (see Section 424)
443 Expert Intervention
After the mapping and GIS processing steps have been completed the initial estimation results are analyzed to identify potential problems With the nature of deforesta-tion in Canada and intensity of the sample occasionally spurious estimates may occur
Canadian Forest Service deforestation monitoring ex-perts have accumulated familiarity with land use change patterns and activities in Canada over many years These experts scrutinize NDMS estimation process outputs and investigate questionable outputs that may be then modi-fied if a change is justified
When suspicious estimation outputs are encountered ex-perts intervene by evaluating available records information and reconnaissance data For example when a particular event type is rare and sampling produces estimates that are unexpectedly high or low expert reviewers may scan available imagery to see what is occurring outside the sample cell boundaries (ie in the non-sampled area) and use this to inform expert intervention Estimation outputs may be deemed suspicious when they contradict previous estimates or other available lines of evidence All expert interventions are documented for transparency and in case they need to be reassessed as new evidence emerges (eg Leckie et al 2009 Leckie et al 2010)
444 Database Processing
Annualized national deforestation estimates are produced for each industrial sector and RU by combining the GIS data and any large event or recordsactivity data and incorporating expert interventions These data are loaded into a non-spatial database environment (Paradine 2007) The resulting estimates are used to produce customized re-ports for NDMS data users such as provincial government agencies Canadarsquos National Forest Carbon Monitoring Accounting and Reporting System for input to greenhouse gas emission estimation and others
The non-spatial part of the processing follows the work flow shown in Figure 10 The ratio of the area sampled (the ldquointerpretable gridrdquo) to the area of the stratum is calculated (labelled ldquo1rdquo in Figure 10) The area of deforestation in the sample is then scaled up by this proportion (labelled ldquo2rdquo in Figure 10) to produce the deforestation estimate for the stratum This process is repeated for all strata time periods and post classes (including post-class modifiers) using the mapped sample data only
Canadian Forest Service | Pacific Forestry Centre | nrcangccaforestsresearch-centrespfc1348916
Figure 10 Schematic of the deforestation database process used to produce estimates
Canadarsquos National Deforestation Monitoring System System DescriptionInformation Report BC-X-439
17
The expert intervention can be added at the strata level for a particular time period as an adjustment factor (labelled ldquo3rdquo in Figure 10) or as replacements or additions (labelled ldquo4rdquo in Figure 10) to existing data It can also be applied at the RU level (labelled ldquo7rdquo in Figure 10) Early national deforesta-tion reporting had more expert interventions because of lower sample rates less availability of high-resolution imagery and more use of records data over the remote sensing sample Currently few expert interventions occur with most occurring for the 1975ndash1990 time period which has a smaller sample
At the strata level the updated deforestation estimates by time period and post-class modifier are proportioned (labelled ldquo5rdquo in Figure 10) into their respective RUs (see Ap-pendix 3)
The data are then annualized The deforestation estimates for each time period (by post class and RU) are assigned
to the middle year of the time period (ie 1983 for 1975ndash1990 1995 for 1990ndash2000 and 2004 for 2000ndash2008) Annual trends are produced by applying linear interpola-tion between midpoints and extrapolation from endpoints (labelled ldquo6rdquo in Figure 10) Figure 11 provides one example
Large event mapping data records and activity data and expert interventions are applied as shown by the various green boxes in Figure 10 Large event data have the year of the event attached to them and are added to the mapping data at the RU level (labelled ldquo7rdquo in Figure 10) Records data also generally have a date attached and are added to the annualized data in a similar fashion to large event data
Figure 12 shows the trend line calculated in Figure 11 and the large event data (purple) representing hydro reservoir flooding facility construction and associated transporta-tion and hydro line corridors
Figure 11 Example deforestation trend produced using data from three mapping periods
Canadian Forest Service | Pacific Forestry Centre | nrcangccaforestsresearch-centrespfc1348918
Figure 12 Example of a deforestation area trend from sample mapping (red) and large events data (purple)
The post-class modifier classes (Table 1 and Table A21 in Appendix 2) are aggregated (labelled ldquo8rdquo in Figure 10) to the appropriate industrial category and good practice guidance class using a lookup table The various modifiers within each deforestation post class provide flexibility to summarize to different industrial categories based on user requirements (eg the categories used by the National For-est Carbon Monitoring Accounting and Reporting System and shown in Tables A21 and A22)
The result of the processing is a series of database tables A major product among these is the list of annual deforesta-tion area per RU per industrial class (labelled ldquo9rdquo in Figure 10) Another product is the breakdown of forest pretype percentages by RU this is done by calculating the percent-age area of each pretype mapped in the RU Reporting for the UNFCCC requires separate estimates of deforestation and greenhouse gas emissions for managed and unman-aged forest thus a separate table is produced for unman-aged forest (labelled ldquo10rdquo in Figure 10)
5 Quality ControlThree major quality control stages are applied during the deforestation mapping process
1 initial mapping quality control
2 revision quality checks and
3 overall quality assurance or vetting where a check on the final mapping data is performed
This multi-stage approach reduces the likelihood of errors and increases consistency of and confidence in the final product The data processing stage has further checks for data integrity After the data are calculated in the esti-mate process the final numbers and trends are assessed for changes from previous year estimates Deforestation estimates are also scrutinized by external users before they incorporate the data into their applications For an over-view of quality control practices see Dyk et al (2011)
51 Quality Control at the Mapping Stage
The mapping process flow is illustrated in Figure 13 includ-ing the quality control steps Typical errors caught through quality control at the mapping stage include incorrect event interpretations or delineations event omissions or commissions missing field values typographical errors and topology problems During the quality control phase an internal Canadian Forest Service reviewer performs detailed checks to ensure consistency with mapping and interpretation rules and returns a set of points to flag and describe the problem areas to the interpreter or contrac-tor These quality control points are stored in the mapping geodatabase as a permanent layer
Canadarsquos National Deforestation Monitoring System System DescriptionInformation Report BC-X-439
19
Figure 13 The deforestation mapping and quality control process flow
The mapping interpreter reviews these points and applies the recommended corrections to the working database The quality control points are sent to the interpreter early and frequently in the project timeline to reduce or avoid propagation of persistent errors or misunderstandings through the duration of the project
The original line and polygon mapping is preserved and re-visions are performed in separate ldquorevised linerdquo and ldquorevised polygonrdquo layers in the project geodatabase Information about the changes including what was done by whom and the date is added for every revised event Any deleted events are also retained in what are termed the ldquodrop lay-ersrdquo to mark the area as a non-deforestation event which is reviewed during future mapping
When the revised data are resubmitted to the Canadian Forest Service the data layers make clear what changes were requested and what changes were made The re-viewer uses these layers to verify that appropriate revisions were properly applied at all quality control points Any further errors or misunderstandings are communicated to the interpreter immediately for resolution At this stage the interpreter can also open a dialogue regarding specific events using additional comment fields in the quality control point layer or personal communication
The next level of quality control is the final vetting This audit step is conducted internally by senior Canadian For-est Service interpreters to ensure consistency of mapping across all projects All aspects of the new data are reviewed during this stage omission and commission errors delinea-
tion and attribution In addition the older mapping data are scanned to ensure newer imagery confirms the original interpretation A set of ldquovet revisionrdquo points is created to mark all adjustments required in the database An analyst works through these point by point to make the necessary changes noting any complex or uncertain events and communicating directly with the vetting interpreter when necessary
Field validation is a desirable aspect of the revision process but is not included during the mapping stage In general field campaigns are conducted on an ongoing basis when resources permit Areas where local knowledge or ground truth information are needed to clarify the interpretation are identified from the interpreter confidence records or the revision point data Dedicated field programs schedule air or ground visits to high-impact and low- to moderate-confidence events Local experts sometimes provide information about ground conditions that can be used to verify and update the database
Throughout the entire mapping and revision process an internal ldquoproject storyrdquo is maintained by the Canadian For-est Service This document summarizes activity on a given project including staff and contractors involved dates and actions completed It also includes detailed explanation of any complex situations or vet revisions as well as notes on any issues raised by the quality control or vetting interpret-ers To maintain consistency analysts who are involved in revisions or who vet revisions read this project story before starting work
Canadian Forest Service | Pacific Forestry Centre | nrcangccaforestsresearch-centrespfc1348920
52 Quality Control at the Data Processing Stage
Once revisions are vetted final data integrity checks are conducted on the project database to find and correct any technical errors such as missing attributes mismatched post classes and modifiers incorrect or reversed event dates inappropriate line widths topology errors overlaps and duplicates and typos This stage is partially automated The final mapping layers can be loaded into the national database only after the integrity checks have been com-pleted
Data quality checks are built into the script that automates the data processing stages The script both delivers reports to the screen while running and dumps to log files which are reviewed by Canadian Forest Service staff to ensure the runs were successful
Transfer of the final GIS tables into the non-spatial defor-estation database is also automated The grid and event tables for each time period are checked before load-ing and the number of records loaded is recorded and compared with previous runs to highlight any potential discrepancies
The database queries and tables used to create the annual estimates by industrial category and RU are controlled by Microsoft Access macros to ensure consistency between the runs
53 Quality Control at the Output Analysis Stage
Following generation of the estimate tables the main out-puts (annualized deforestation by industrial class and RU pretype table and unmanaged forest table) are evaluated closely by Canadian Forest Service experts to ensure that estimates have been calculated properly and that discrep-ancies from previously calculated values can be explained To aid in this effort a comparison spreadsheet is created for each RU showing the deforestation estimates by indus-trial class for the current and previous yearrsquos national run together with illustrations and statistics The experts scru-tinize the data for changes and ensure the new estimates are consistent with the input mapping data Any specific issues and special adjustments required are documented in a report that becomes part of the record for each yearrsquos estimate
54 External Quality Control
Users of the deforestation estimates conduct their own reviews of the data prior to use in their systems and com-municate any issues before incorporating the data into their own business processes When new issues arise these are dealt with and the NDMS quality control processes are updated to catch similar issues in the future
6 ConclusionsDeforestation is the direct human-induced conversion of forested land to non-forested land use The NDMS was de-signed and implemented to provide information needed by Canada to meet its obligation under the UN Frame-work Convention on Climate Change to report the areas affected annually by deforestation Also considered was the need to provide information useful for policy analysis land management and forest stewardship applications Understanding why where and when deforestation occurs is a prerequisite to the development of appropriate policy instruments to optimize land use develop mitigation strat-egies and address cumulative impacts on forest resources
The NDMS uses manual mapping from a satellite remote sensing sampling system informed by records-based information and expert knowledge to provide information about deforestation in Canada The remote sensing map-ping is supported by available ancillary information such as high-resolution imagery forest inventory road networks and other industrial databases Certain types of events that are large and isolated (eg mine and hydroelectric devel-opments) are mapped and incorporated separately in the overall deforestation estimates Occasionally records and activity data on land use changes are incorporated when they are deemed more appropriate than the sampling es-timate The mapping results from the sample are scaled up to regional levels In the data processing stage these data are merged and annualized to produce national deforesta-tion estimates
The system has been used and improved over the last 10 years The flexibility of the NDMSrsquos design makes it possible to adapt to future changes in image sources ancillary data resource availability and user needs and positions the pro-gram well for long-term maintenance and improvement
Canadarsquos National Deforestation Monitoring System System DescriptionInformation Report BC-X-439
21
7 References
Burt W Paradine D Leckie D 2006 Geographic Information system processing of deforestation mapping data for estimating deforested area of Canada Natural Resources Canada Canadian Forest Service Pacific Forestry Centre Victoria BC Report DRS-P-001
Dyk A Tinis S Leckie D 2011 National Inventory Report 2011 Deforestation area estimation for Canada Quality con-trol overview Natural Resources Canada Canadian Forest Service Pacific Forestry Centre Victoria BC Report DRS-N-031
Ecological Stratification Working Group 1996 A national ecological framework for Canada Agriculture and Agri-Foods Canada Research Branch Centre for land and Biological Resources Research and Environment Canada State of the Environ-ment Directorate Ottawa Ont
Environment Canada 2006 National Inventory Report 1990ndash2004 Greenhouse gas sources and sinks in Canada Govern-ment of Canada Submission to the UN Framework Convention on Climate Change httpunfcccintnational_reportsannex_i_ghg_inventoriesnational_inventories_submissionsitems3734php (Accessed August 2014)
Environment Canada 2014 National Inventory Report 1990ndash2012 Greenhouse gas sources and sinks in Canada Govern-ment of Canada Submission to the UN Framework Convention on Climate Change Report issued by Pollutant Inventories and Reporting Division Environment Canada Ottawa Onthttpunfcccintnational_reportsannex_i_ghg_inventoriesnational_inventories_submissionsitems8108php (Accessed August 2014)
Food and Agriculture Organization 2006 2001 Global forest resources assessment 2000 main report United Nations Food and Agriculture Organization Rome Italy FAO Forestry Paper 140
Gillis M Omule A Brierley T 2005 Monitoring Canadarsquos forests The National Forest Inventory Forestry Chronicle 81(2)214ndash221
Intergovernmental Panel on Climate Change 2003 Good practice guidance for land use land-use change and forestry Penman J Gytarsky M Hiraishiet T et al (eds) Institute for Global Environmental Strategies Hayama Japan
Intergovernmental Panel on Climate Change 2006 2006 IPCC guidelines for national greenhouse gas inventories Egg-leston HS Buendia L Miwa K Ngara T Tanabe K (eds) Intergovernmental Panel on Climate Change National Green-house Gas Inventories Programme Institute for Global Environmental Strategies Hayama Japan httpwwwipcc-nggipigesorjppublic2006gl (Accessed January 2015)
Kurz W 2010 An ecosystem context for global forest cover loss estimates Proceedings National Academy of Sciences 107(20)9025ndash9026
Kurz W Apps M 2006 Developing Canadarsquos national forest carbon monitoring accounting and reporting system to meet the reporting requirements of the Kyoto Protocol Mitigation and Adaptation Strategies for Global Change 11(1)33ndash43
Kurz W Dymond C White T Stinson G Shaw C Rampley G Smyth C Simpson B Neilson E Trofymow J Metsaranta J Apps M 2009 CBM-CFS3 A model of carbon-dynamics in forestry and land-use change implementing IPCC standards Ecological Modelling 220(4)480ndash504
Kurz W Shaw C Boisvenue C Stinson G Metsaranta J Leckie D Dyk A Smyth C Neilson E 2013 Carbon in Canadarsquos boreal forest A synthesis Environmental Reviews 21260ndash292
Canadian Forest Service | Pacific Forestry Centre | nrcangccaforestsresearch-centrespfc1348922
Leckie D Dyk A Ortlepp S Tinis S 2010 Records of decision for Canadarsquos national deforestation estimate 2011 Natu-ral Resources Canada Canadian Forest Service Pacific Forestry Centre Victoria BC Report DRS-N-029
Leckie D Dyk A Paradine D Tammadge D Tinis S 2012 Deforestation interpretation guide Natural Resources Canada Canadian Forest Service Pacific Forestry Centre Victoria BC Report DRS-M-030
Leckie D Dyk A Tinis S 12009 Records of decision for Canadarsquos national deforestation estimate Natural Resources Canada Canadian Forest Service Pacific Forestry Centre Victoria BC Report DRS-N-026
Leckie D Paradine D Burt W 2006a Mapping sample coverage for Canadarsquos national deforestation estimate 2006 Natural Resources Canada Canadian Forest Service Pacific Forestry Centre Victoria BC Report DRS-N-002
Leckie D Paradine D Tinis S 2006b Geographic strata for Canadarsquos national deforestation estimates report Natural Resources Canada Canadian Forest Service Pacific Forestry Centre Victoria BC Report DRS-Q-003
Leckie D Paradine D Kurz W Magnussen S [2015] Deforestation mapping sampling designs for Canadian land-scapes Natural Resources Canada Canadian Forest Service Victoria BC In review
Lempriegravere T Kurz W Hogg E Schmoll C Rampley G Yemshanov D et al 2013 Canadian boreal forests and climate change mitigation Environmental Reviews 21(4)293ndash321
Le Queacutereacute C Peters G Andres R Andrew R Boden T et al 2014 Global carbon budget 2013 Earth System Science Data 6689ndash760
Masek J Cohen W Leckie D Wulder M Vargas R de Jong B Healey S Law B Birdsey R Houghton R Mildrexler D Goward S Smith W 2011 Recent rates of forest harvest and conversion in North America Journal of Geophysical Research 116G00K03
McGovern M 2008 Reporting zones GHG spatial reporting structure for Canada 2008 Environment Canada Greenhouse Gas Division Ottawa Ontario
Montreal Process 2009 Criteria and indicators for the conservation and sustainable management of temperate and boreal forests Fourth edition httpwwwmontrealprocessorgdocumentspublicationsgeneral2009p_4pdf (Accessed January 2015)
Pan Y Birdsey RA Fang J et al 2011 A large and persistent carbon sink in the Worldrsquos forests Science 333988ndash993
Paradine D 2007 National Inventory Report 2008 ACCESS database description GIS processing description and consoli-dated GIS database description Natural Resources Canada Canadian Forest Service Pacific Forestry Centre Victoria BC Report DRS-N-019
United Nations Framework Convention on Climate Change 2002 Conference of the PartiesndashReport of the Confer-ence of the Parties on its seventh session held at Marrakesh from 29 October to 10 November 2001 United Nations Office Geneva Switzerland httpunfcccintresourcedocscop713pdf (Accessed January 2015)
Wulder M Masek J Cohen W Loveland T Woodcock C 2012 Opening the archive How free data has enabled the science and monitoring promise of Landsat Remote Sensing of Environment 1222ndash10
Canadarsquos National Deforestation Monitoring System System DescriptionInformation Report BC-X-439
23
Appendix 1 Pretype Forest Conditions
The tables below list the approved forest type density and maturity values applied in deforestation mapping Note not all combinations are valid particularly those that include recent disturbance and regeneration terms Table A11 lists the ac-ceptable parameter combinations
The most common pretype groupings found are the 36 combinations of three Type classes (B C and M) three Density classes (D O and S) and four Maturity classes (R Y I and M) The two older Maturity classes (O and G) require additional verification to identify them Several classes identify recently disturbed forests (K X and R)
Table A11 Pre-change forest type descriptors
TYPE Definition Restrictions of use
B Broadleaf gt 75 of trees are broadleaf (Angiospermae)
C Conifer gt 75 of trees are conifer (Coniferae)
M Mixed gt 25 of both broadleaf and conifer present
K Clearcut Exposed ground and (or) ground vegetation No visible regeneration
Use only with S or N density and Q maturity
X Burn Exposed ground and (or) ground vegetation No visible regen-eration May have live residual trees up to 25 crown closure
Use only with S or N density and Q maturity
R Regen Regenerating areas with lt 25 crown closure where the forest composition (B C or M) is not identifiable
Table A12 Pre-change forest density descriptors
DENSITY Definition Restrictions of use
D Dense gt 60 crown closure
O Open 25ndash60 crown closure
S Sparse 5ndash25 crown closure
N Nil lt 5 crown closure Use only with K and X pretype
Table A13 Pre-change forest maturity descriptors-
MATURITY Definition Restrictions of use
Q Recent disturbance No visible regeneration Use only with K and X pretype
R Regen Forest stands 0ndash14 years old
Y Young Forest stands 15ndash25 years old
I Immature Forest stands 26ndash40 years old
M Mature Forest stands 41ndash80 years old
O Old Forest stands 81ndash200 years old
G Old-growth Forest stands over 200 years old Restricted to British Columbia only
Canadian Forest Service | Pacific Forestry Centre | nrcangccaforestsresearch-centrespfc1348924
Table A14 Valid combinations of pretype attributes (TypendashDensityndashMaturity)
Regen Broadleaf Mixed Coniferous
Dense RDR BDR MDR CDR
BDY MDY CDY
BDI MDI CDI
BDM MDM CDM
BDO MDO CDO
CDG
Open ROR BOR MOR COR
BOY MOY COY
BOI MOI COI
BOM MOM COM
BOO MOO COO
COG
Sparse RSR BSR MSR CSR
BSY MSY CSY
BSI MSI CSI
BSM MSM CSM
BSO MSO CSO
CSG
Burn Clearcut
Regen Broadleaf Mixed Coniferous
Disturbed XSQ KSQ
XNQ KNQ
Canadarsquos National Deforestation Monitoring System System DescriptionInformation Report BC-X-439
25
Appendix 2 Post-class Modifiers by Industrial Category
Table A21 lists all land use post-class deforestation modifiers They provide additional detail regarding what has occurred on the ground for each deforestation event These classes can be assigned to various industrial classes (see Table A22) Detailed definitions are provided in the Deforestation Interpretation Guide (Leckie et al 2012)
Table A21 Post class and post-class modifier codes and short descriptions grouped by industrial categorysector (in bold)
Post class Post class modifier
Agriculture
AG Agriculture ab bare
cp crop
fy farm yard
pa pasture
AL Artificial Lake aa agriculture pond
ea agriculture effluent pond
OF Open Field fa agriculture setting
Flooded Standing Forest
AL Artificial Lake ff flooded standing forest
Forestry
RD Road mf mainline forestry road
sf secondary forestry road
xf tertiary forestry road with width ge 20 m
SD Soil Disturbance ld logging landing
ss rock slide scar
Hydro Infrastructure
CR Corridor hm hydro linendashmain
hs hydro linendashsecondary
xy hydro linendashtertiary ge 20 m
IN Industrial ih hydro infrastructure
Hydro Reservoir
AL Artificial Lake hr hydroelectric flooding
Industry
AL Artificial Lake ei industrial effluent pond
IN Industrial hi heavy industrial
li light industrial
OF Open Field fi industrial
Canadian Forest Service | Pacific Forestry Centre | nrcangccaforestsresearch-centrespfc1348926
Post class Post class modifier
Mining
AL Artificial Lake em waste ponds for mining
IN Industrial mh mine heavy
ml mine light
OF Open Field fk mine facility
fm mine
fq pit and quarry
SD Soil Disturbance mn open pit mine
pq gravel pitquarry
Municipal
AL Artificial Lake ad pond urban setting
ar pond rural residential
ul other human caused
CR Corridor cl cut line
cu undifferentiated
OF Open Field fd urbansuburban
fr rural residential
uf undifferentiated field
RR Rural Residential rf few trees remaining
rm many trees remaining
SD Soil Disturbance lf landfill
su undifferentiated
UR Urban Residential df few trees remaining
dm many trees remaining
Oil and Gas
CR Corridor pp pipelinendashmain
ps pipelinendashsecondary
xp pipelinendashtertiary ge 20 m
IN Industrial oi oil sands industrial
op oil and gas industrial
wp well pad
OF Open Field fo oil and gas facility
fs oil sands open field
SD Soil Disturbance os oil sands
AL Artificial Lake eo oil and gas related pond
Canadarsquos National Deforestation Monitoring System System DescriptionInformation Report BC-X-439
27
Post class Post class modifier
Peat Mining
SD Soil Disturbance pm peat extraction
Recreation
AL Artificial Lake af golf course related
ap recreational water body
OF Open Field fc recreational field
RC Recreational ca campground
go golf course
ru other or undifferentiated
sk ski areas
Transportation
CR Corridor as airstrip
ry railway
RD Road mm main road clearly for a mine
mr main road
mo main road clearly for oil and gas
my main road clearly for hydroelectric
sm secondary mining road
so secondary oil and gas road
sr secondary road
sy secondary hydroelectric road
xm tertiary mining road with width ge 20 m
xo tertiary oil and gas road with width ge 20 m
xr tertiary road with width ge 20 m
xy tertiary hydroelectric road with width ge 20 m
Canadian Forest Service | Pacific Forestry Centre | nrcangccaforestsresearch-centrespfc1348928
Table A22 Aggregation of deforestation mapping classes to good practice guidance and industrial categories
Good practice guidance class
Crop-land (CL)
Wetlands (WL) Settlements (SL)
Industrial Categories
Agric
ultu
re
Floo
ded
stan
ding
fore
st
Hyd
ro re
serv
oir
Peat
min
ing
Fore
stry
Hyd
ro in
fras
truc
ture
Indu
stry
Min
ing
Mun
icip
al
Oil
and
gas
Recr
eatio
n
Tran
spor
tatio
n
Def
ores
tatio
n po
st c
lass
Agriculture AG ab cp pa fy
Artificial Lake AL aa ea ff hr ei emad ar of ul eo af ap
Corridor CR hm hs xy cl cu
pp ps xp as ry
Industrial IN ih hi li mh mloi op wp
Open Field OF fa fi fk fm fq fd fr uf fo fs fc
Recreational RC ca go fu sk
Road RDmf sf xf
mm mo mr my sm so sr sy xm
xo xr xy
Rural Residential RR rf rm
Soil Disturbance SD pm ld ss mn pq lf su os
Urban Residential UR df dm
Canadarsquos National Deforestation Monitoring System System DescriptionInformation Report BC-X-439
29
Appendix 3 Deforestation Strata Units and Reconciliation Unit InclusionTable A31 shows the names of the deforestation strata their area in kilohectares and the percentage of that area contained in each reconciliation unit that they overlap (sorted by reconciliation unit identification number see Figure 1 for unit loca-tion and name)
Table A31 Area of strata units and percent of strata unit area that is in each reconciliation unit
Deforestation strata unit name Strata unit area (kilohectares)
Reconciliation unit ( inclusion)
Newfoundland Eastern Woodlot 4 477 1 (100)
Newfoundland Forest Activity Zone 6 512 1 (100)
Newfoundland St Johns 55 1 (100)
Labrador Arctic 1 893 2 (100)
Labrador Northern Forest 23 238 3 (98) 4 (2)
Labrador Forest Activity Zone 4 620 4 (100)
Nova Scotia Eastern Woodlot 2 894 5 (100)
Nova Scotia Forest Activity Zone 2 396 5 (100)
Nova Scotia HalifaxDartmouth 182 5 (100)
Prince Edward Island 577 6 (100)
New Brunswick Eastern Woodlot 4 121 7 (100)
New Brunswick Forest Activity Zone 3 174 7 (100)
Quebec Arctic 20 443 10 (75) 9 (18) 8 (7)
Quebec Eastern Townships 3 948 11 (100)
Quebec Gaspe Forest Activity Zone 2 740 11 (100)
Quebec Southern RU12 2 968 12 (100)
Quebec Northern Forest 72 759 14 (73)15 (22) 13(5)
Quebec Forest Activity Zone 44 717 15 (100)
Quebec Ile DAnticosti 795 15 (100)
Quebec Lac St Jean 964 15 (100)
Quebec Southern RU15 1 687 15 (100)
Ontario Thunder Bay 225 16(100)
Ontario Southern 8 198 17 (100)
Ontario Manitoulin Island 326 17 (100)
Ontario Northern Forest 46 468 18 (56) 16 (43) 19 (1)
Ontario SudburyNorth Bay 874 19 (100)
Ontario Forest Activity Zone 42 398 19 (56) 16 (43) 18 (1)
Ontario Sault Ste Marie 536 19 (92) 17 (8)
Manitoba Forest Activity Zone RU22 East 2 405 22 (100)
Manitoba Forest Activity Zone RU22 North 6 109 22 (100)
Manitoba Prairie Fringe RU22 804 22 (100)
Manitoba Northern Forest 37 339 22 (43) 21 (35) 25 (19) 23 (3)
Manitoba Forest Activity Zone RU23 7 382 23 (100)
Manitoba Prairie Fringe RU23 3 970 23 (100)
Manitoba Hotspot 851 24 (100)
Manitoba North Prairie 6 117 24 (100)
Canadian Forest Service | Pacific Forestry Centre | nrcangccaforestsresearch-centrespfc1348930
Deforestation strata unit name Strata unit area (kilohectares)
Reconciliation unit ( inclusion)
Saskatchewan Northern Forest 21 224 27 (75) 26 (22) 28 (3)
Saskatchewan Prairie Fringe 5 509 28 (100)
Saskatchewan Inactive Forest Activity Zone 6 196 28 (58) 27 (42)
Saskatchewan Forest Activity Zone 8 189 28 (99) 27 (1)
Saskatchewan North Prairie 8 167 29 (100)
Saskatchewan Prairie 15 921 30 (100)
Alberta Northern Forest 10 862 31 (58) 34 (28) 32 (8) 33 (6)
Alberta Forest Activity Zone 22 066 34 (100)
Alberta Fort McMurray 807 34 (100)
Alberta High Level 789 34 (100)
Alberta Northwest Fringe 5 436 34 (100)
Alberta Prairie Fringe 6 038 34 (100)
Alberta North Prairie 7 397 35 (100)
Alberta RU 36 Forest Activity Zone 4 764 36 (100)
Alberta Palliser Triangle 3 689 37 (100)
Alberta Prairie West 4 522 37 (100)
British Columbia RU 38 6 759 38 (100)
British Columbia Prairie Fringe 2 333 39 (100)
British Columbia RU 40 19 220 40 (100)
British Columbia Lower Mainland East Vancouver Island
1 142 41 (100)
British Columbia RU 41 Forest Activity Zone 15 440 41 (100)
British Columbia VI QCI 3 813 41 (100)
British Columbia Okanagan 1 109 42 (100)
British Columbia Prince George 464 42 (100)
British Columbia RU 42 Forest Activity Zone 44 286 42 (96) 39 (4)
Yukon Arctic 496 43 (100)
Yukon Northern Forest 19 987 45 (91) 44 (9)
Yukon Whitehorse 417 46 (100)
Yukon Forest Activity Zone 27 440 46 (98) 47 (1)
Northwest Territories Arctic 42 788 48 (49) 49 (43) 50 (7)
Northwest Territories Northern Forest 91 972 50 (52) 51 (37) 53 (9) 52 (2)
Northwest Territories Yellowknife 176 51 (100)
Northwest Territories Forest Activity Zone 467 54 (100)
Nunavut Arctic 198 915 56 (64) 57 (25) 55 (11)
Nunavut Northern Forest 9 892 58 (100)
nrcangccaforests
For more information about the Canadian Forest Service visit our website at nrcangccaforests or contact any of the following Canadian Forest Service establishments
Canadian Forest Service Contacts
Atlantic Forestry Centre PO Box 4000 Fredericton NB E3B 5P7 Tel (506) 452-3500 Fax (506) 452-3525 nrcangccaforestsresearch-centresafc13447
Atlantic Forestry Centre ndash District Office Sir Wilfred Grenfell College Forestry Centre University Drive Corner Brook NF A2H 6P9 Tel (709) 637-4900 Fax (709) 637-4910
Laurentian Forestry Centre 1055 rue du PEPS PO Box 3800 Sainte-Foy PQ G1V 4C7 Tel (418) 648-5788 Fax (418) 648-5849 nrcangccaforestsresearch-centreslfc13473
Great Lakes Forestry Centre PO Box 490 1219 Queen St East Sault Ste Marie ON P6A 5M7 Tel (705) 949-9461 Fax (705) 759-5700 nrcangccaforestsresearch-centresglfc13459
Northern Forestry Centre 5320-122nd Street Edmonton AB T6H 3S5 Tel (403) 435-7210 Fax (403) 435-7359 nrcangccaforestsresearch-centresnofc13485
Pacific Forestry Centre 506 West Burnside Road Victoria BC V8Z 1M5 Tel (250) 363-0600 Fax (250) 363-0775 nrcangccaforestsresearch-centrespfc13489
Headquarters 580 Booth St 8th Fl Ottawa ON K1A 0E4 Tel (613) 947-7341 Fax (613) 947-7396
Canadian Wood Fibre Centre A virtual research centre of the Canadian Forest Service Natural Resources Canada nrcangccaforestsresearch-centrescwfc13457
1
2
3
5
6
4
1
25
3 6
4
1
To order publications online visit the Canadian Forest Service Publications website at
cfsnrcangccapublications
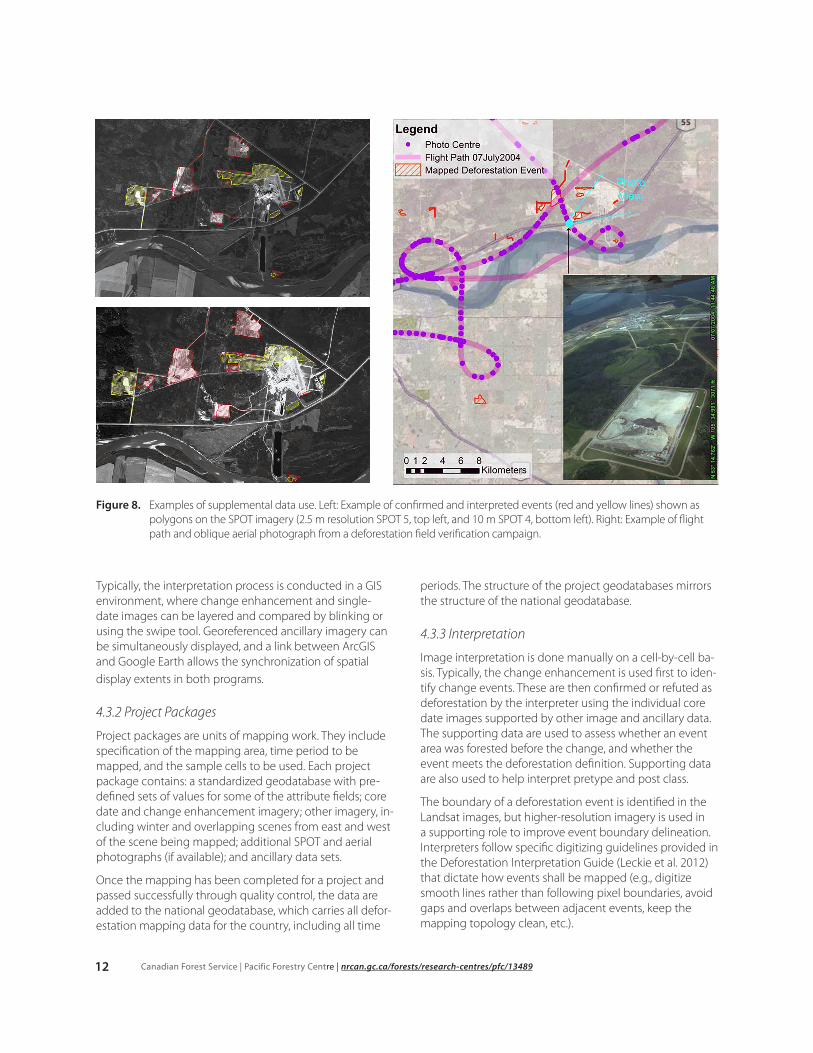

Canadarsquos National Deforestation Monitoring System System DescriptionInformation Report BC-X-439
13
Deforestation events may be linear in form (eg roads hydro lines) or polygonal They are digitized accordingly as lines or polygons in the project geodatabase Specific guidelines apply for each type of feature Delineation fol-lows clearly defined situational rules (eg for compositemixed use polygons roads in cutblocks tertiary versus more significant roads episodic clearing etc) all of which are addressed in detail in the Deforestation Interpretation Guide When events extend beyond the boundaries of a sample cell they are delineated to the full extent of the event but only the portion inside the cell is included in the estimation
Event attributes are interpreted and recorded using attri-bute values defined in the NDMS data dictionary Pretype attributes include forest type density and maturity (see Appendix 1 for details) Post class attributes are listed in Table 2 (see Appendix 2 for details) Interpreters also record their level of confidence about each deforestation event (ie how confident they are that it was forest before the change and that it is indeed a new land use) Comment fields are used extensively to record details specific to each event These may indicate uncertainty in an event a request by the interpreter for specific review by the qual-ity control person or the need for checking the event in a later time period The widths for linear events (such as roads or corridors) are also recorded as it is more efficient to map these as lines and later convert to polygons using the width data during a subsequent processing stage
If mapping already exists for an earlier time period in the area the interpreter reviews it in the context of recent imagery either to confirm the previous interpretations or to note whether corrections are required Points are used to flag areas for revision or later review by analysts such as where older mapping may require updating
In some cases imagery available for a core date is contami-nated by clouds shadows or missing data at image edges In such cases the interpreter digitizes the contaminated area within the sample cells and saves the polygon into a special geodatabase layer for ldquonon-interpretable areardquo poly-gons and notes the affected date The areas saved into this layer are removed from the sample during later processing to create what is termed the ldquointerpretable gridrdquo The open-ing of the Landsat archive through free access to geocor-rected imagery has substantially reduced the amount of
non-interpretable area entering the estimate calculations For example sometimes images outside the core date can be used to infer deforestation in the non-interpretable area In fact recently non-interpretable areas have been almost eliminated from the process
A series of quality checks has been built into the mapping process these are completed in every mapping project Canadian Forest Service analysts conduct quality control checks of the mapped data (see Section 5) and return a set of quality control points to the interpreters indicating where more work and specific changes are needed before the mapping can be loaded into the national geodata-base
44 Deforestation Estimation
The mapping data from deforestation sample cells are used to estimate the area of deforestation in each RU by scaling up from sample to population in each defor-estation stratum and then summing the deforestation estimate for each stratum in an RU Scaling up is done for each land use type (post-class modifier) in each time period Temporal interpolation is used to compute annual deforestation rates Lastly large event mapping records and activity data and intelligence are used to refine the estimates when appropriate
441 GIS processing
The national deforestation geodatabase contains all the mapped areas representing deforestation events sampled within each time period as lines and polygons The geo-database also contains layers required for the estimation calculations including the sample grids the non-interpre-table areas the Landsat image boundaries (which define the core dates and areas sampled) the deforestation strata boundaries and the RU boundaries
The spatial data are first processed to prepare them for the scaling up analysis which is conducted later in a non-spa-tial database program (Section 444) Figure 9 provides a schematic of the tasks involved in the GIS processing (Burt et al 2006) The two main calculated outputs produced are the event and grid tables shaded in red in Figure 9 The processing of the mapped GIS data for the national sum-mary is performed for each time period
Canadian Forest Service | Pacific Forestry Centre | nrcangccaforestsresearch-centrespfc1348914
Figure 9 Simplified deforestation GIS processing flow Input tables are in green processes in yellow and output tables in red Gold arrows denote updates to a table The term ldquolinesrdquo refers to linear deforestation events ArcGIS commands are underlined
Canadarsquos National Deforestation Monitoring System System DescriptionInformation Report BC-X-439
15
The first of the output tables the ldquointerpretable gridrdquo (labelled grd_ident in Figure 9) defines the actual area for which mapping was done As a result the full set of sample cells is clipped by the extent of the Landsat imagery (thus removing portions of the cells that fall outside the Landsat image boundary) and has the non-interpretable areas (eg clouds) removed
The second table the ldquoFinal Event Polygonsrdquo (labelled py_fn) is created from the intersection of many input lay-ers The post-class modifier code for each event is carried through in these deforestation calculations The linear de-forestation events are converted to polygons by applying a buffer according to the width attribute associated with each line then combined with the other deforestation polygon events to create a complete polygonal coverage of all deforestation events mapped The events are then intersected with the interpretable grid layer Further inter-sections are applied to the boundary RU and deforestation strata layers to identify which strata and RU are associ-ated with each event In the end the data for each event include attributes drawn from all the intersected layers including the deforestation stratum and RU of each event As well small slivers created during the GIS processing steps are removed
At this stage it is possible to calculate the rate of deforesta-tion for each time period All events are assigned to the time period in which they occur (ie P1 [1975ndash1990] P2 [1990ndash2000] or P3 [2000ndash2008]) based on the core dates of imagery used for mapping For each event an effective annual rate of deforestation (hectares per year) is calculat-ed by dividing the deforested area by the number of years between the core dates Later in the process the resulting per-event annual rates are summed for each stratum and divided by the area of grid cells interpreted to determine the average annual rate for each time period and post-class modifier (Section 444)
To provide flexibility the mapping activity captures forest clearings that meet a more inclusive definition of defor-estation than strictly required Land conversion of sparse forest does not constitute deforestation (unless it is conver-sion of a recently disturbed or regenerating area) but is mapped for completeness unless otherwise specified The GIS processing steps are used to exclude such mapped events with sparse forest density
442 Large Events and Records Data
Certain types of events that are large uncommon and iso-lated (eg hydroelectric reservoirs new surface mines long and major hydroelectric lines etc) are better represented by complete mapping and census rather than sampling (Leckie et al [in review]) Such events termed ldquolarge eventsrdquo are mapped separately and completely using either core date imagery or imagery captured as close to the actual event dates as possible When large events fall within sample cells and thus are also captured by the sampling
these are excluded from the processing of sample data to avoid double-counting
Records and activity data when used for a given type of deforestation in a region (eg stratum) are added to the database and removed from the processing of sample data similar to large events (see Section 424)
443 Expert Intervention
After the mapping and GIS processing steps have been completed the initial estimation results are analyzed to identify potential problems With the nature of deforesta-tion in Canada and intensity of the sample occasionally spurious estimates may occur
Canadian Forest Service deforestation monitoring ex-perts have accumulated familiarity with land use change patterns and activities in Canada over many years These experts scrutinize NDMS estimation process outputs and investigate questionable outputs that may be then modi-fied if a change is justified
When suspicious estimation outputs are encountered ex-perts intervene by evaluating available records information and reconnaissance data For example when a particular event type is rare and sampling produces estimates that are unexpectedly high or low expert reviewers may scan available imagery to see what is occurring outside the sample cell boundaries (ie in the non-sampled area) and use this to inform expert intervention Estimation outputs may be deemed suspicious when they contradict previous estimates or other available lines of evidence All expert interventions are documented for transparency and in case they need to be reassessed as new evidence emerges (eg Leckie et al 2009 Leckie et al 2010)
444 Database Processing
Annualized national deforestation estimates are produced for each industrial sector and RU by combining the GIS data and any large event or recordsactivity data and incorporating expert interventions These data are loaded into a non-spatial database environment (Paradine 2007) The resulting estimates are used to produce customized re-ports for NDMS data users such as provincial government agencies Canadarsquos National Forest Carbon Monitoring Accounting and Reporting System for input to greenhouse gas emission estimation and others
The non-spatial part of the processing follows the work flow shown in Figure 10 The ratio of the area sampled (the ldquointerpretable gridrdquo) to the area of the stratum is calculated (labelled ldquo1rdquo in Figure 10) The area of deforestation in the sample is then scaled up by this proportion (labelled ldquo2rdquo in Figure 10) to produce the deforestation estimate for the stratum This process is repeated for all strata time periods and post classes (including post-class modifiers) using the mapped sample data only
Canadian Forest Service | Pacific Forestry Centre | nrcangccaforestsresearch-centrespfc1348916
Figure 10 Schematic of the deforestation database process used to produce estimates
Canadarsquos National Deforestation Monitoring System System DescriptionInformation Report BC-X-439
17
The expert intervention can be added at the strata level for a particular time period as an adjustment factor (labelled ldquo3rdquo in Figure 10) or as replacements or additions (labelled ldquo4rdquo in Figure 10) to existing data It can also be applied at the RU level (labelled ldquo7rdquo in Figure 10) Early national deforesta-tion reporting had more expert interventions because of lower sample rates less availability of high-resolution imagery and more use of records data over the remote sensing sample Currently few expert interventions occur with most occurring for the 1975ndash1990 time period which has a smaller sample
At the strata level the updated deforestation estimates by time period and post-class modifier are proportioned (labelled ldquo5rdquo in Figure 10) into their respective RUs (see Ap-pendix 3)
The data are then annualized The deforestation estimates for each time period (by post class and RU) are assigned
to the middle year of the time period (ie 1983 for 1975ndash1990 1995 for 1990ndash2000 and 2004 for 2000ndash2008) Annual trends are produced by applying linear interpola-tion between midpoints and extrapolation from endpoints (labelled ldquo6rdquo in Figure 10) Figure 11 provides one example
Large event mapping data records and activity data and expert interventions are applied as shown by the various green boxes in Figure 10 Large event data have the year of the event attached to them and are added to the mapping data at the RU level (labelled ldquo7rdquo in Figure 10) Records data also generally have a date attached and are added to the annualized data in a similar fashion to large event data
Figure 12 shows the trend line calculated in Figure 11 and the large event data (purple) representing hydro reservoir flooding facility construction and associated transporta-tion and hydro line corridors
Figure 11 Example deforestation trend produced using data from three mapping periods
Canadian Forest Service | Pacific Forestry Centre | nrcangccaforestsresearch-centrespfc1348918
Figure 12 Example of a deforestation area trend from sample mapping (red) and large events data (purple)
The post-class modifier classes (Table 1 and Table A21 in Appendix 2) are aggregated (labelled ldquo8rdquo in Figure 10) to the appropriate industrial category and good practice guidance class using a lookup table The various modifiers within each deforestation post class provide flexibility to summarize to different industrial categories based on user requirements (eg the categories used by the National For-est Carbon Monitoring Accounting and Reporting System and shown in Tables A21 and A22)
The result of the processing is a series of database tables A major product among these is the list of annual deforesta-tion area per RU per industrial class (labelled ldquo9rdquo in Figure 10) Another product is the breakdown of forest pretype percentages by RU this is done by calculating the percent-age area of each pretype mapped in the RU Reporting for the UNFCCC requires separate estimates of deforestation and greenhouse gas emissions for managed and unman-aged forest thus a separate table is produced for unman-aged forest (labelled ldquo10rdquo in Figure 10)
5 Quality ControlThree major quality control stages are applied during the deforestation mapping process
1 initial mapping quality control
2 revision quality checks and
3 overall quality assurance or vetting where a check on the final mapping data is performed
This multi-stage approach reduces the likelihood of errors and increases consistency of and confidence in the final product The data processing stage has further checks for data integrity After the data are calculated in the esti-mate process the final numbers and trends are assessed for changes from previous year estimates Deforestation estimates are also scrutinized by external users before they incorporate the data into their applications For an over-view of quality control practices see Dyk et al (2011)
51 Quality Control at the Mapping Stage
The mapping process flow is illustrated in Figure 13 includ-ing the quality control steps Typical errors caught through quality control at the mapping stage include incorrect event interpretations or delineations event omissions or commissions missing field values typographical errors and topology problems During the quality control phase an internal Canadian Forest Service reviewer performs detailed checks to ensure consistency with mapping and interpretation rules and returns a set of points to flag and describe the problem areas to the interpreter or contrac-tor These quality control points are stored in the mapping geodatabase as a permanent layer
Canadarsquos National Deforestation Monitoring System System DescriptionInformation Report BC-X-439
19
Figure 13 The deforestation mapping and quality control process flow
The mapping interpreter reviews these points and applies the recommended corrections to the working database The quality control points are sent to the interpreter early and frequently in the project timeline to reduce or avoid propagation of persistent errors or misunderstandings through the duration of the project
The original line and polygon mapping is preserved and re-visions are performed in separate ldquorevised linerdquo and ldquorevised polygonrdquo layers in the project geodatabase Information about the changes including what was done by whom and the date is added for every revised event Any deleted events are also retained in what are termed the ldquodrop lay-ersrdquo to mark the area as a non-deforestation event which is reviewed during future mapping
When the revised data are resubmitted to the Canadian Forest Service the data layers make clear what changes were requested and what changes were made The re-viewer uses these layers to verify that appropriate revisions were properly applied at all quality control points Any further errors or misunderstandings are communicated to the interpreter immediately for resolution At this stage the interpreter can also open a dialogue regarding specific events using additional comment fields in the quality control point layer or personal communication
The next level of quality control is the final vetting This audit step is conducted internally by senior Canadian For-est Service interpreters to ensure consistency of mapping across all projects All aspects of the new data are reviewed during this stage omission and commission errors delinea-
tion and attribution In addition the older mapping data are scanned to ensure newer imagery confirms the original interpretation A set of ldquovet revisionrdquo points is created to mark all adjustments required in the database An analyst works through these point by point to make the necessary changes noting any complex or uncertain events and communicating directly with the vetting interpreter when necessary
Field validation is a desirable aspect of the revision process but is not included during the mapping stage In general field campaigns are conducted on an ongoing basis when resources permit Areas where local knowledge or ground truth information are needed to clarify the interpretation are identified from the interpreter confidence records or the revision point data Dedicated field programs schedule air or ground visits to high-impact and low- to moderate-confidence events Local experts sometimes provide information about ground conditions that can be used to verify and update the database
Throughout the entire mapping and revision process an internal ldquoproject storyrdquo is maintained by the Canadian For-est Service This document summarizes activity on a given project including staff and contractors involved dates and actions completed It also includes detailed explanation of any complex situations or vet revisions as well as notes on any issues raised by the quality control or vetting interpret-ers To maintain consistency analysts who are involved in revisions or who vet revisions read this project story before starting work
Canadian Forest Service | Pacific Forestry Centre | nrcangccaforestsresearch-centrespfc1348920
52 Quality Control at the Data Processing Stage
Once revisions are vetted final data integrity checks are conducted on the project database to find and correct any technical errors such as missing attributes mismatched post classes and modifiers incorrect or reversed event dates inappropriate line widths topology errors overlaps and duplicates and typos This stage is partially automated The final mapping layers can be loaded into the national database only after the integrity checks have been com-pleted
Data quality checks are built into the script that automates the data processing stages The script both delivers reports to the screen while running and dumps to log files which are reviewed by Canadian Forest Service staff to ensure the runs were successful
Transfer of the final GIS tables into the non-spatial defor-estation database is also automated The grid and event tables for each time period are checked before load-ing and the number of records loaded is recorded and compared with previous runs to highlight any potential discrepancies
The database queries and tables used to create the annual estimates by industrial category and RU are controlled by Microsoft Access macros to ensure consistency between the runs
53 Quality Control at the Output Analysis Stage
Following generation of the estimate tables the main out-puts (annualized deforestation by industrial class and RU pretype table and unmanaged forest table) are evaluated closely by Canadian Forest Service experts to ensure that estimates have been calculated properly and that discrep-ancies from previously calculated values can be explained To aid in this effort a comparison spreadsheet is created for each RU showing the deforestation estimates by indus-trial class for the current and previous yearrsquos national run together with illustrations and statistics The experts scru-tinize the data for changes and ensure the new estimates are consistent with the input mapping data Any specific issues and special adjustments required are documented in a report that becomes part of the record for each yearrsquos estimate
54 External Quality Control
Users of the deforestation estimates conduct their own reviews of the data prior to use in their systems and com-municate any issues before incorporating the data into their own business processes When new issues arise these are dealt with and the NDMS quality control processes are updated to catch similar issues in the future
6 ConclusionsDeforestation is the direct human-induced conversion of forested land to non-forested land use The NDMS was de-signed and implemented to provide information needed by Canada to meet its obligation under the UN Frame-work Convention on Climate Change to report the areas affected annually by deforestation Also considered was the need to provide information useful for policy analysis land management and forest stewardship applications Understanding why where and when deforestation occurs is a prerequisite to the development of appropriate policy instruments to optimize land use develop mitigation strat-egies and address cumulative impacts on forest resources
The NDMS uses manual mapping from a satellite remote sensing sampling system informed by records-based information and expert knowledge to provide information about deforestation in Canada The remote sensing map-ping is supported by available ancillary information such as high-resolution imagery forest inventory road networks and other industrial databases Certain types of events that are large and isolated (eg mine and hydroelectric devel-opments) are mapped and incorporated separately in the overall deforestation estimates Occasionally records and activity data on land use changes are incorporated when they are deemed more appropriate than the sampling es-timate The mapping results from the sample are scaled up to regional levels In the data processing stage these data are merged and annualized to produce national deforesta-tion estimates
The system has been used and improved over the last 10 years The flexibility of the NDMSrsquos design makes it possible to adapt to future changes in image sources ancillary data resource availability and user needs and positions the pro-gram well for long-term maintenance and improvement
Canadarsquos National Deforestation Monitoring System System DescriptionInformation Report BC-X-439
21
7 References
Burt W Paradine D Leckie D 2006 Geographic Information system processing of deforestation mapping data for estimating deforested area of Canada Natural Resources Canada Canadian Forest Service Pacific Forestry Centre Victoria BC Report DRS-P-001
Dyk A Tinis S Leckie D 2011 National Inventory Report 2011 Deforestation area estimation for Canada Quality con-trol overview Natural Resources Canada Canadian Forest Service Pacific Forestry Centre Victoria BC Report DRS-N-031
Ecological Stratification Working Group 1996 A national ecological framework for Canada Agriculture and Agri-Foods Canada Research Branch Centre for land and Biological Resources Research and Environment Canada State of the Environ-ment Directorate Ottawa Ont
Environment Canada 2006 National Inventory Report 1990ndash2004 Greenhouse gas sources and sinks in Canada Govern-ment of Canada Submission to the UN Framework Convention on Climate Change httpunfcccintnational_reportsannex_i_ghg_inventoriesnational_inventories_submissionsitems3734php (Accessed August 2014)
Environment Canada 2014 National Inventory Report 1990ndash2012 Greenhouse gas sources and sinks in Canada Govern-ment of Canada Submission to the UN Framework Convention on Climate Change Report issued by Pollutant Inventories and Reporting Division Environment Canada Ottawa Onthttpunfcccintnational_reportsannex_i_ghg_inventoriesnational_inventories_submissionsitems8108php (Accessed August 2014)
Food and Agriculture Organization 2006 2001 Global forest resources assessment 2000 main report United Nations Food and Agriculture Organization Rome Italy FAO Forestry Paper 140
Gillis M Omule A Brierley T 2005 Monitoring Canadarsquos forests The National Forest Inventory Forestry Chronicle 81(2)214ndash221
Intergovernmental Panel on Climate Change 2003 Good practice guidance for land use land-use change and forestry Penman J Gytarsky M Hiraishiet T et al (eds) Institute for Global Environmental Strategies Hayama Japan
Intergovernmental Panel on Climate Change 2006 2006 IPCC guidelines for national greenhouse gas inventories Egg-leston HS Buendia L Miwa K Ngara T Tanabe K (eds) Intergovernmental Panel on Climate Change National Green-house Gas Inventories Programme Institute for Global Environmental Strategies Hayama Japan httpwwwipcc-nggipigesorjppublic2006gl (Accessed January 2015)
Kurz W 2010 An ecosystem context for global forest cover loss estimates Proceedings National Academy of Sciences 107(20)9025ndash9026
Kurz W Apps M 2006 Developing Canadarsquos national forest carbon monitoring accounting and reporting system to meet the reporting requirements of the Kyoto Protocol Mitigation and Adaptation Strategies for Global Change 11(1)33ndash43
Kurz W Dymond C White T Stinson G Shaw C Rampley G Smyth C Simpson B Neilson E Trofymow J Metsaranta J Apps M 2009 CBM-CFS3 A model of carbon-dynamics in forestry and land-use change implementing IPCC standards Ecological Modelling 220(4)480ndash504
Kurz W Shaw C Boisvenue C Stinson G Metsaranta J Leckie D Dyk A Smyth C Neilson E 2013 Carbon in Canadarsquos boreal forest A synthesis Environmental Reviews 21260ndash292
Canadian Forest Service | Pacific Forestry Centre | nrcangccaforestsresearch-centrespfc1348922
Leckie D Dyk A Ortlepp S Tinis S 2010 Records of decision for Canadarsquos national deforestation estimate 2011 Natu-ral Resources Canada Canadian Forest Service Pacific Forestry Centre Victoria BC Report DRS-N-029
Leckie D Dyk A Paradine D Tammadge D Tinis S 2012 Deforestation interpretation guide Natural Resources Canada Canadian Forest Service Pacific Forestry Centre Victoria BC Report DRS-M-030
Leckie D Dyk A Tinis S 12009 Records of decision for Canadarsquos national deforestation estimate Natural Resources Canada Canadian Forest Service Pacific Forestry Centre Victoria BC Report DRS-N-026
Leckie D Paradine D Burt W 2006a Mapping sample coverage for Canadarsquos national deforestation estimate 2006 Natural Resources Canada Canadian Forest Service Pacific Forestry Centre Victoria BC Report DRS-N-002
Leckie D Paradine D Tinis S 2006b Geographic strata for Canadarsquos national deforestation estimates report Natural Resources Canada Canadian Forest Service Pacific Forestry Centre Victoria BC Report DRS-Q-003
Leckie D Paradine D Kurz W Magnussen S [2015] Deforestation mapping sampling designs for Canadian land-scapes Natural Resources Canada Canadian Forest Service Victoria BC In review
Lempriegravere T Kurz W Hogg E Schmoll C Rampley G Yemshanov D et al 2013 Canadian boreal forests and climate change mitigation Environmental Reviews 21(4)293ndash321
Le Queacutereacute C Peters G Andres R Andrew R Boden T et al 2014 Global carbon budget 2013 Earth System Science Data 6689ndash760
Masek J Cohen W Leckie D Wulder M Vargas R de Jong B Healey S Law B Birdsey R Houghton R Mildrexler D Goward S Smith W 2011 Recent rates of forest harvest and conversion in North America Journal of Geophysical Research 116G00K03
McGovern M 2008 Reporting zones GHG spatial reporting structure for Canada 2008 Environment Canada Greenhouse Gas Division Ottawa Ontario
Montreal Process 2009 Criteria and indicators for the conservation and sustainable management of temperate and boreal forests Fourth edition httpwwwmontrealprocessorgdocumentspublicationsgeneral2009p_4pdf (Accessed January 2015)
Pan Y Birdsey RA Fang J et al 2011 A large and persistent carbon sink in the Worldrsquos forests Science 333988ndash993
Paradine D 2007 National Inventory Report 2008 ACCESS database description GIS processing description and consoli-dated GIS database description Natural Resources Canada Canadian Forest Service Pacific Forestry Centre Victoria BC Report DRS-N-019
United Nations Framework Convention on Climate Change 2002 Conference of the PartiesndashReport of the Confer-ence of the Parties on its seventh session held at Marrakesh from 29 October to 10 November 2001 United Nations Office Geneva Switzerland httpunfcccintresourcedocscop713pdf (Accessed January 2015)
Wulder M Masek J Cohen W Loveland T Woodcock C 2012 Opening the archive How free data has enabled the science and monitoring promise of Landsat Remote Sensing of Environment 1222ndash10
Canadarsquos National Deforestation Monitoring System System DescriptionInformation Report BC-X-439
23
Appendix 1 Pretype Forest Conditions
The tables below list the approved forest type density and maturity values applied in deforestation mapping Note not all combinations are valid particularly those that include recent disturbance and regeneration terms Table A11 lists the ac-ceptable parameter combinations
The most common pretype groupings found are the 36 combinations of three Type classes (B C and M) three Density classes (D O and S) and four Maturity classes (R Y I and M) The two older Maturity classes (O and G) require additional verification to identify them Several classes identify recently disturbed forests (K X and R)
Table A11 Pre-change forest type descriptors
TYPE Definition Restrictions of use
B Broadleaf gt 75 of trees are broadleaf (Angiospermae)
C Conifer gt 75 of trees are conifer (Coniferae)
M Mixed gt 25 of both broadleaf and conifer present
K Clearcut Exposed ground and (or) ground vegetation No visible regeneration
Use only with S or N density and Q maturity
X Burn Exposed ground and (or) ground vegetation No visible regen-eration May have live residual trees up to 25 crown closure
Use only with S or N density and Q maturity
R Regen Regenerating areas with lt 25 crown closure where the forest composition (B C or M) is not identifiable
Table A12 Pre-change forest density descriptors
DENSITY Definition Restrictions of use
D Dense gt 60 crown closure
O Open 25ndash60 crown closure
S Sparse 5ndash25 crown closure
N Nil lt 5 crown closure Use only with K and X pretype
Table A13 Pre-change forest maturity descriptors-
MATURITY Definition Restrictions of use
Q Recent disturbance No visible regeneration Use only with K and X pretype
R Regen Forest stands 0ndash14 years old
Y Young Forest stands 15ndash25 years old
I Immature Forest stands 26ndash40 years old
M Mature Forest stands 41ndash80 years old
O Old Forest stands 81ndash200 years old
G Old-growth Forest stands over 200 years old Restricted to British Columbia only
Canadian Forest Service | Pacific Forestry Centre | nrcangccaforestsresearch-centrespfc1348924
Table A14 Valid combinations of pretype attributes (TypendashDensityndashMaturity)
Regen Broadleaf Mixed Coniferous
Dense RDR BDR MDR CDR
BDY MDY CDY
BDI MDI CDI
BDM MDM CDM
BDO MDO CDO
CDG
Open ROR BOR MOR COR
BOY MOY COY
BOI MOI COI
BOM MOM COM
BOO MOO COO
COG
Sparse RSR BSR MSR CSR
BSY MSY CSY
BSI MSI CSI
BSM MSM CSM
BSO MSO CSO
CSG
Burn Clearcut
Regen Broadleaf Mixed Coniferous
Disturbed XSQ KSQ
XNQ KNQ
Canadarsquos National Deforestation Monitoring System System DescriptionInformation Report BC-X-439
25
Appendix 2 Post-class Modifiers by Industrial Category
Table A21 lists all land use post-class deforestation modifiers They provide additional detail regarding what has occurred on the ground for each deforestation event These classes can be assigned to various industrial classes (see Table A22) Detailed definitions are provided in the Deforestation Interpretation Guide (Leckie et al 2012)
Table A21 Post class and post-class modifier codes and short descriptions grouped by industrial categorysector (in bold)
Post class Post class modifier
Agriculture
AG Agriculture ab bare
cp crop
fy farm yard
pa pasture
AL Artificial Lake aa agriculture pond
ea agriculture effluent pond
OF Open Field fa agriculture setting
Flooded Standing Forest
AL Artificial Lake ff flooded standing forest
Forestry
RD Road mf mainline forestry road
sf secondary forestry road
xf tertiary forestry road with width ge 20 m
SD Soil Disturbance ld logging landing
ss rock slide scar
Hydro Infrastructure
CR Corridor hm hydro linendashmain
hs hydro linendashsecondary
xy hydro linendashtertiary ge 20 m
IN Industrial ih hydro infrastructure
Hydro Reservoir
AL Artificial Lake hr hydroelectric flooding
Industry
AL Artificial Lake ei industrial effluent pond
IN Industrial hi heavy industrial
li light industrial
OF Open Field fi industrial
Canadian Forest Service | Pacific Forestry Centre | nrcangccaforestsresearch-centrespfc1348926
Post class Post class modifier
Mining
AL Artificial Lake em waste ponds for mining
IN Industrial mh mine heavy
ml mine light
OF Open Field fk mine facility
fm mine
fq pit and quarry
SD Soil Disturbance mn open pit mine
pq gravel pitquarry
Municipal
AL Artificial Lake ad pond urban setting
ar pond rural residential
ul other human caused
CR Corridor cl cut line
cu undifferentiated
OF Open Field fd urbansuburban
fr rural residential
uf undifferentiated field
RR Rural Residential rf few trees remaining
rm many trees remaining
SD Soil Disturbance lf landfill
su undifferentiated
UR Urban Residential df few trees remaining
dm many trees remaining
Oil and Gas
CR Corridor pp pipelinendashmain
ps pipelinendashsecondary
xp pipelinendashtertiary ge 20 m
IN Industrial oi oil sands industrial
op oil and gas industrial
wp well pad
OF Open Field fo oil and gas facility
fs oil sands open field
SD Soil Disturbance os oil sands
AL Artificial Lake eo oil and gas related pond
Canadarsquos National Deforestation Monitoring System System DescriptionInformation Report BC-X-439
27
Post class Post class modifier
Peat Mining
SD Soil Disturbance pm peat extraction
Recreation
AL Artificial Lake af golf course related
ap recreational water body
OF Open Field fc recreational field
RC Recreational ca campground
go golf course
ru other or undifferentiated
sk ski areas
Transportation
CR Corridor as airstrip
ry railway
RD Road mm main road clearly for a mine
mr main road
mo main road clearly for oil and gas
my main road clearly for hydroelectric
sm secondary mining road
so secondary oil and gas road
sr secondary road
sy secondary hydroelectric road
xm tertiary mining road with width ge 20 m
xo tertiary oil and gas road with width ge 20 m
xr tertiary road with width ge 20 m
xy tertiary hydroelectric road with width ge 20 m
Canadian Forest Service | Pacific Forestry Centre | nrcangccaforestsresearch-centrespfc1348928
Table A22 Aggregation of deforestation mapping classes to good practice guidance and industrial categories
Good practice guidance class
Crop-land (CL)
Wetlands (WL) Settlements (SL)
Industrial Categories
Agric
ultu
re
Floo
ded
stan
ding
fore
st
Hyd
ro re
serv
oir
Peat
min
ing
Fore
stry
Hyd
ro in
fras
truc
ture
Indu
stry
Min
ing
Mun
icip
al
Oil
and
gas
Recr
eatio
n
Tran
spor
tatio
n
Def
ores
tatio
n po
st c
lass
Agriculture AG ab cp pa fy
Artificial Lake AL aa ea ff hr ei emad ar of ul eo af ap
Corridor CR hm hs xy cl cu
pp ps xp as ry
Industrial IN ih hi li mh mloi op wp
Open Field OF fa fi fk fm fq fd fr uf fo fs fc
Recreational RC ca go fu sk
Road RDmf sf xf
mm mo mr my sm so sr sy xm
xo xr xy
Rural Residential RR rf rm
Soil Disturbance SD pm ld ss mn pq lf su os
Urban Residential UR df dm
Canadarsquos National Deforestation Monitoring System System DescriptionInformation Report BC-X-439
29
Appendix 3 Deforestation Strata Units and Reconciliation Unit InclusionTable A31 shows the names of the deforestation strata their area in kilohectares and the percentage of that area contained in each reconciliation unit that they overlap (sorted by reconciliation unit identification number see Figure 1 for unit loca-tion and name)
Table A31 Area of strata units and percent of strata unit area that is in each reconciliation unit
Deforestation strata unit name Strata unit area (kilohectares)
Reconciliation unit ( inclusion)
Newfoundland Eastern Woodlot 4 477 1 (100)
Newfoundland Forest Activity Zone 6 512 1 (100)
Newfoundland St Johns 55 1 (100)
Labrador Arctic 1 893 2 (100)
Labrador Northern Forest 23 238 3 (98) 4 (2)
Labrador Forest Activity Zone 4 620 4 (100)
Nova Scotia Eastern Woodlot 2 894 5 (100)
Nova Scotia Forest Activity Zone 2 396 5 (100)
Nova Scotia HalifaxDartmouth 182 5 (100)
Prince Edward Island 577 6 (100)
New Brunswick Eastern Woodlot 4 121 7 (100)
New Brunswick Forest Activity Zone 3 174 7 (100)
Quebec Arctic 20 443 10 (75) 9 (18) 8 (7)
Quebec Eastern Townships 3 948 11 (100)
Quebec Gaspe Forest Activity Zone 2 740 11 (100)
Quebec Southern RU12 2 968 12 (100)
Quebec Northern Forest 72 759 14 (73)15 (22) 13(5)
Quebec Forest Activity Zone 44 717 15 (100)
Quebec Ile DAnticosti 795 15 (100)
Quebec Lac St Jean 964 15 (100)
Quebec Southern RU15 1 687 15 (100)
Ontario Thunder Bay 225 16(100)
Ontario Southern 8 198 17 (100)
Ontario Manitoulin Island 326 17 (100)
Ontario Northern Forest 46 468 18 (56) 16 (43) 19 (1)
Ontario SudburyNorth Bay 874 19 (100)
Ontario Forest Activity Zone 42 398 19 (56) 16 (43) 18 (1)
Ontario Sault Ste Marie 536 19 (92) 17 (8)
Manitoba Forest Activity Zone RU22 East 2 405 22 (100)
Manitoba Forest Activity Zone RU22 North 6 109 22 (100)
Manitoba Prairie Fringe RU22 804 22 (100)
Manitoba Northern Forest 37 339 22 (43) 21 (35) 25 (19) 23 (3)
Manitoba Forest Activity Zone RU23 7 382 23 (100)
Manitoba Prairie Fringe RU23 3 970 23 (100)
Manitoba Hotspot 851 24 (100)
Manitoba North Prairie 6 117 24 (100)
Canadian Forest Service | Pacific Forestry Centre | nrcangccaforestsresearch-centrespfc1348930
Deforestation strata unit name Strata unit area (kilohectares)
Reconciliation unit ( inclusion)
Saskatchewan Northern Forest 21 224 27 (75) 26 (22) 28 (3)
Saskatchewan Prairie Fringe 5 509 28 (100)
Saskatchewan Inactive Forest Activity Zone 6 196 28 (58) 27 (42)
Saskatchewan Forest Activity Zone 8 189 28 (99) 27 (1)
Saskatchewan North Prairie 8 167 29 (100)
Saskatchewan Prairie 15 921 30 (100)
Alberta Northern Forest 10 862 31 (58) 34 (28) 32 (8) 33 (6)
Alberta Forest Activity Zone 22 066 34 (100)
Alberta Fort McMurray 807 34 (100)
Alberta High Level 789 34 (100)
Alberta Northwest Fringe 5 436 34 (100)
Alberta Prairie Fringe 6 038 34 (100)
Alberta North Prairie 7 397 35 (100)
Alberta RU 36 Forest Activity Zone 4 764 36 (100)
Alberta Palliser Triangle 3 689 37 (100)
Alberta Prairie West 4 522 37 (100)
British Columbia RU 38 6 759 38 (100)
British Columbia Prairie Fringe 2 333 39 (100)
British Columbia RU 40 19 220 40 (100)
British Columbia Lower Mainland East Vancouver Island
1 142 41 (100)
British Columbia RU 41 Forest Activity Zone 15 440 41 (100)
British Columbia VI QCI 3 813 41 (100)
British Columbia Okanagan 1 109 42 (100)
British Columbia Prince George 464 42 (100)
British Columbia RU 42 Forest Activity Zone 44 286 42 (96) 39 (4)
Yukon Arctic 496 43 (100)
Yukon Northern Forest 19 987 45 (91) 44 (9)
Yukon Whitehorse 417 46 (100)
Yukon Forest Activity Zone 27 440 46 (98) 47 (1)
Northwest Territories Arctic 42 788 48 (49) 49 (43) 50 (7)
Northwest Territories Northern Forest 91 972 50 (52) 51 (37) 53 (9) 52 (2)
Northwest Territories Yellowknife 176 51 (100)
Northwest Territories Forest Activity Zone 467 54 (100)
Nunavut Arctic 198 915 56 (64) 57 (25) 55 (11)
Nunavut Northern Forest 9 892 58 (100)
nrcangccaforests
For more information about the Canadian Forest Service visit our website at nrcangccaforests or contact any of the following Canadian Forest Service establishments
Canadian Forest Service Contacts
Atlantic Forestry Centre PO Box 4000 Fredericton NB E3B 5P7 Tel (506) 452-3500 Fax (506) 452-3525 nrcangccaforestsresearch-centresafc13447
Atlantic Forestry Centre ndash District Office Sir Wilfred Grenfell College Forestry Centre University Drive Corner Brook NF A2H 6P9 Tel (709) 637-4900 Fax (709) 637-4910
Laurentian Forestry Centre 1055 rue du PEPS PO Box 3800 Sainte-Foy PQ G1V 4C7 Tel (418) 648-5788 Fax (418) 648-5849 nrcangccaforestsresearch-centreslfc13473
Great Lakes Forestry Centre PO Box 490 1219 Queen St East Sault Ste Marie ON P6A 5M7 Tel (705) 949-9461 Fax (705) 759-5700 nrcangccaforestsresearch-centresglfc13459
Northern Forestry Centre 5320-122nd Street Edmonton AB T6H 3S5 Tel (403) 435-7210 Fax (403) 435-7359 nrcangccaforestsresearch-centresnofc13485
Pacific Forestry Centre 506 West Burnside Road Victoria BC V8Z 1M5 Tel (250) 363-0600 Fax (250) 363-0775 nrcangccaforestsresearch-centrespfc13489
Headquarters 580 Booth St 8th Fl Ottawa ON K1A 0E4 Tel (613) 947-7341 Fax (613) 947-7396
Canadian Wood Fibre Centre A virtual research centre of the Canadian Forest Service Natural Resources Canada nrcangccaforestsresearch-centrescwfc13457
1
2
3
5
6
4
1
25
3 6
4
1
To order publications online visit the Canadian Forest Service Publications website at
cfsnrcangccapublications
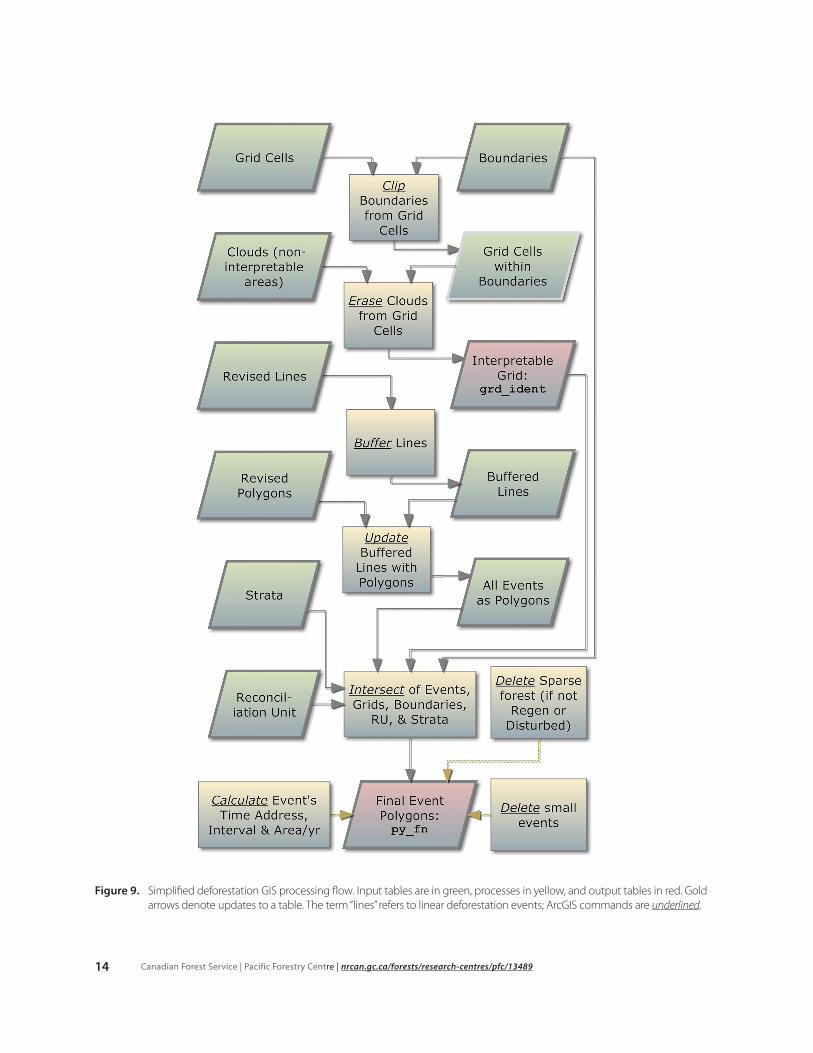

Canadarsquos National Deforestation Monitoring System System DescriptionInformation Report BC-X-439
15
The first of the output tables the ldquointerpretable gridrdquo (labelled grd_ident in Figure 9) defines the actual area for which mapping was done As a result the full set of sample cells is clipped by the extent of the Landsat imagery (thus removing portions of the cells that fall outside the Landsat image boundary) and has the non-interpretable areas (eg clouds) removed
The second table the ldquoFinal Event Polygonsrdquo (labelled py_fn) is created from the intersection of many input lay-ers The post-class modifier code for each event is carried through in these deforestation calculations The linear de-forestation events are converted to polygons by applying a buffer according to the width attribute associated with each line then combined with the other deforestation polygon events to create a complete polygonal coverage of all deforestation events mapped The events are then intersected with the interpretable grid layer Further inter-sections are applied to the boundary RU and deforestation strata layers to identify which strata and RU are associ-ated with each event In the end the data for each event include attributes drawn from all the intersected layers including the deforestation stratum and RU of each event As well small slivers created during the GIS processing steps are removed
At this stage it is possible to calculate the rate of deforesta-tion for each time period All events are assigned to the time period in which they occur (ie P1 [1975ndash1990] P2 [1990ndash2000] or P3 [2000ndash2008]) based on the core dates of imagery used for mapping For each event an effective annual rate of deforestation (hectares per year) is calculat-ed by dividing the deforested area by the number of years between the core dates Later in the process the resulting per-event annual rates are summed for each stratum and divided by the area of grid cells interpreted to determine the average annual rate for each time period and post-class modifier (Section 444)
To provide flexibility the mapping activity captures forest clearings that meet a more inclusive definition of defor-estation than strictly required Land conversion of sparse forest does not constitute deforestation (unless it is conver-sion of a recently disturbed or regenerating area) but is mapped for completeness unless otherwise specified The GIS processing steps are used to exclude such mapped events with sparse forest density
442 Large Events and Records Data
Certain types of events that are large uncommon and iso-lated (eg hydroelectric reservoirs new surface mines long and major hydroelectric lines etc) are better represented by complete mapping and census rather than sampling (Leckie et al [in review]) Such events termed ldquolarge eventsrdquo are mapped separately and completely using either core date imagery or imagery captured as close to the actual event dates as possible When large events fall within sample cells and thus are also captured by the sampling
these are excluded from the processing of sample data to avoid double-counting
Records and activity data when used for a given type of deforestation in a region (eg stratum) are added to the database and removed from the processing of sample data similar to large events (see Section 424)
443 Expert Intervention
After the mapping and GIS processing steps have been completed the initial estimation results are analyzed to identify potential problems With the nature of deforesta-tion in Canada and intensity of the sample occasionally spurious estimates may occur
Canadian Forest Service deforestation monitoring ex-perts have accumulated familiarity with land use change patterns and activities in Canada over many years These experts scrutinize NDMS estimation process outputs and investigate questionable outputs that may be then modi-fied if a change is justified
When suspicious estimation outputs are encountered ex-perts intervene by evaluating available records information and reconnaissance data For example when a particular event type is rare and sampling produces estimates that are unexpectedly high or low expert reviewers may scan available imagery to see what is occurring outside the sample cell boundaries (ie in the non-sampled area) and use this to inform expert intervention Estimation outputs may be deemed suspicious when they contradict previous estimates or other available lines of evidence All expert interventions are documented for transparency and in case they need to be reassessed as new evidence emerges (eg Leckie et al 2009 Leckie et al 2010)
444 Database Processing
Annualized national deforestation estimates are produced for each industrial sector and RU by combining the GIS data and any large event or recordsactivity data and incorporating expert interventions These data are loaded into a non-spatial database environment (Paradine 2007) The resulting estimates are used to produce customized re-ports for NDMS data users such as provincial government agencies Canadarsquos National Forest Carbon Monitoring Accounting and Reporting System for input to greenhouse gas emission estimation and others
The non-spatial part of the processing follows the work flow shown in Figure 10 The ratio of the area sampled (the ldquointerpretable gridrdquo) to the area of the stratum is calculated (labelled ldquo1rdquo in Figure 10) The area of deforestation in the sample is then scaled up by this proportion (labelled ldquo2rdquo in Figure 10) to produce the deforestation estimate for the stratum This process is repeated for all strata time periods and post classes (including post-class modifiers) using the mapped sample data only
Canadian Forest Service | Pacific Forestry Centre | nrcangccaforestsresearch-centrespfc1348916
Figure 10 Schematic of the deforestation database process used to produce estimates
Canadarsquos National Deforestation Monitoring System System DescriptionInformation Report BC-X-439
17
The expert intervention can be added at the strata level for a particular time period as an adjustment factor (labelled ldquo3rdquo in Figure 10) or as replacements or additions (labelled ldquo4rdquo in Figure 10) to existing data It can also be applied at the RU level (labelled ldquo7rdquo in Figure 10) Early national deforesta-tion reporting had more expert interventions because of lower sample rates less availability of high-resolution imagery and more use of records data over the remote sensing sample Currently few expert interventions occur with most occurring for the 1975ndash1990 time period which has a smaller sample
At the strata level the updated deforestation estimates by time period and post-class modifier are proportioned (labelled ldquo5rdquo in Figure 10) into their respective RUs (see Ap-pendix 3)
The data are then annualized The deforestation estimates for each time period (by post class and RU) are assigned
to the middle year of the time period (ie 1983 for 1975ndash1990 1995 for 1990ndash2000 and 2004 for 2000ndash2008) Annual trends are produced by applying linear interpola-tion between midpoints and extrapolation from endpoints (labelled ldquo6rdquo in Figure 10) Figure 11 provides one example
Large event mapping data records and activity data and expert interventions are applied as shown by the various green boxes in Figure 10 Large event data have the year of the event attached to them and are added to the mapping data at the RU level (labelled ldquo7rdquo in Figure 10) Records data also generally have a date attached and are added to the annualized data in a similar fashion to large event data
Figure 12 shows the trend line calculated in Figure 11 and the large event data (purple) representing hydro reservoir flooding facility construction and associated transporta-tion and hydro line corridors
Figure 11 Example deforestation trend produced using data from three mapping periods
Canadian Forest Service | Pacific Forestry Centre | nrcangccaforestsresearch-centrespfc1348918
Figure 12 Example of a deforestation area trend from sample mapping (red) and large events data (purple)
The post-class modifier classes (Table 1 and Table A21 in Appendix 2) are aggregated (labelled ldquo8rdquo in Figure 10) to the appropriate industrial category and good practice guidance class using a lookup table The various modifiers within each deforestation post class provide flexibility to summarize to different industrial categories based on user requirements (eg the categories used by the National For-est Carbon Monitoring Accounting and Reporting System and shown in Tables A21 and A22)
The result of the processing is a series of database tables A major product among these is the list of annual deforesta-tion area per RU per industrial class (labelled ldquo9rdquo in Figure 10) Another product is the breakdown of forest pretype percentages by RU this is done by calculating the percent-age area of each pretype mapped in the RU Reporting for the UNFCCC requires separate estimates of deforestation and greenhouse gas emissions for managed and unman-aged forest thus a separate table is produced for unman-aged forest (labelled ldquo10rdquo in Figure 10)
5 Quality ControlThree major quality control stages are applied during the deforestation mapping process
1 initial mapping quality control
2 revision quality checks and
3 overall quality assurance or vetting where a check on the final mapping data is performed
This multi-stage approach reduces the likelihood of errors and increases consistency of and confidence in the final product The data processing stage has further checks for data integrity After the data are calculated in the esti-mate process the final numbers and trends are assessed for changes from previous year estimates Deforestation estimates are also scrutinized by external users before they incorporate the data into their applications For an over-view of quality control practices see Dyk et al (2011)
51 Quality Control at the Mapping Stage
The mapping process flow is illustrated in Figure 13 includ-ing the quality control steps Typical errors caught through quality control at the mapping stage include incorrect event interpretations or delineations event omissions or commissions missing field values typographical errors and topology problems During the quality control phase an internal Canadian Forest Service reviewer performs detailed checks to ensure consistency with mapping and interpretation rules and returns a set of points to flag and describe the problem areas to the interpreter or contrac-tor These quality control points are stored in the mapping geodatabase as a permanent layer
Canadarsquos National Deforestation Monitoring System System DescriptionInformation Report BC-X-439
19
Figure 13 The deforestation mapping and quality control process flow
The mapping interpreter reviews these points and applies the recommended corrections to the working database The quality control points are sent to the interpreter early and frequently in the project timeline to reduce or avoid propagation of persistent errors or misunderstandings through the duration of the project
The original line and polygon mapping is preserved and re-visions are performed in separate ldquorevised linerdquo and ldquorevised polygonrdquo layers in the project geodatabase Information about the changes including what was done by whom and the date is added for every revised event Any deleted events are also retained in what are termed the ldquodrop lay-ersrdquo to mark the area as a non-deforestation event which is reviewed during future mapping
When the revised data are resubmitted to the Canadian Forest Service the data layers make clear what changes were requested and what changes were made The re-viewer uses these layers to verify that appropriate revisions were properly applied at all quality control points Any further errors or misunderstandings are communicated to the interpreter immediately for resolution At this stage the interpreter can also open a dialogue regarding specific events using additional comment fields in the quality control point layer or personal communication
The next level of quality control is the final vetting This audit step is conducted internally by senior Canadian For-est Service interpreters to ensure consistency of mapping across all projects All aspects of the new data are reviewed during this stage omission and commission errors delinea-
tion and attribution In addition the older mapping data are scanned to ensure newer imagery confirms the original interpretation A set of ldquovet revisionrdquo points is created to mark all adjustments required in the database An analyst works through these point by point to make the necessary changes noting any complex or uncertain events and communicating directly with the vetting interpreter when necessary
Field validation is a desirable aspect of the revision process but is not included during the mapping stage In general field campaigns are conducted on an ongoing basis when resources permit Areas where local knowledge or ground truth information are needed to clarify the interpretation are identified from the interpreter confidence records or the revision point data Dedicated field programs schedule air or ground visits to high-impact and low- to moderate-confidence events Local experts sometimes provide information about ground conditions that can be used to verify and update the database
Throughout the entire mapping and revision process an internal ldquoproject storyrdquo is maintained by the Canadian For-est Service This document summarizes activity on a given project including staff and contractors involved dates and actions completed It also includes detailed explanation of any complex situations or vet revisions as well as notes on any issues raised by the quality control or vetting interpret-ers To maintain consistency analysts who are involved in revisions or who vet revisions read this project story before starting work
Canadian Forest Service | Pacific Forestry Centre | nrcangccaforestsresearch-centrespfc1348920
52 Quality Control at the Data Processing Stage
Once revisions are vetted final data integrity checks are conducted on the project database to find and correct any technical errors such as missing attributes mismatched post classes and modifiers incorrect or reversed event dates inappropriate line widths topology errors overlaps and duplicates and typos This stage is partially automated The final mapping layers can be loaded into the national database only after the integrity checks have been com-pleted
Data quality checks are built into the script that automates the data processing stages The script both delivers reports to the screen while running and dumps to log files which are reviewed by Canadian Forest Service staff to ensure the runs were successful
Transfer of the final GIS tables into the non-spatial defor-estation database is also automated The grid and event tables for each time period are checked before load-ing and the number of records loaded is recorded and compared with previous runs to highlight any potential discrepancies
The database queries and tables used to create the annual estimates by industrial category and RU are controlled by Microsoft Access macros to ensure consistency between the runs
53 Quality Control at the Output Analysis Stage
Following generation of the estimate tables the main out-puts (annualized deforestation by industrial class and RU pretype table and unmanaged forest table) are evaluated closely by Canadian Forest Service experts to ensure that estimates have been calculated properly and that discrep-ancies from previously calculated values can be explained To aid in this effort a comparison spreadsheet is created for each RU showing the deforestation estimates by indus-trial class for the current and previous yearrsquos national run together with illustrations and statistics The experts scru-tinize the data for changes and ensure the new estimates are consistent with the input mapping data Any specific issues and special adjustments required are documented in a report that becomes part of the record for each yearrsquos estimate
54 External Quality Control
Users of the deforestation estimates conduct their own reviews of the data prior to use in their systems and com-municate any issues before incorporating the data into their own business processes When new issues arise these are dealt with and the NDMS quality control processes are updated to catch similar issues in the future
6 ConclusionsDeforestation is the direct human-induced conversion of forested land to non-forested land use The NDMS was de-signed and implemented to provide information needed by Canada to meet its obligation under the UN Frame-work Convention on Climate Change to report the areas affected annually by deforestation Also considered was the need to provide information useful for policy analysis land management and forest stewardship applications Understanding why where and when deforestation occurs is a prerequisite to the development of appropriate policy instruments to optimize land use develop mitigation strat-egies and address cumulative impacts on forest resources
The NDMS uses manual mapping from a satellite remote sensing sampling system informed by records-based information and expert knowledge to provide information about deforestation in Canada The remote sensing map-ping is supported by available ancillary information such as high-resolution imagery forest inventory road networks and other industrial databases Certain types of events that are large and isolated (eg mine and hydroelectric devel-opments) are mapped and incorporated separately in the overall deforestation estimates Occasionally records and activity data on land use changes are incorporated when they are deemed more appropriate than the sampling es-timate The mapping results from the sample are scaled up to regional levels In the data processing stage these data are merged and annualized to produce national deforesta-tion estimates
The system has been used and improved over the last 10 years The flexibility of the NDMSrsquos design makes it possible to adapt to future changes in image sources ancillary data resource availability and user needs and positions the pro-gram well for long-term maintenance and improvement
Canadarsquos National Deforestation Monitoring System System DescriptionInformation Report BC-X-439
21
7 References
Burt W Paradine D Leckie D 2006 Geographic Information system processing of deforestation mapping data for estimating deforested area of Canada Natural Resources Canada Canadian Forest Service Pacific Forestry Centre Victoria BC Report DRS-P-001
Dyk A Tinis S Leckie D 2011 National Inventory Report 2011 Deforestation area estimation for Canada Quality con-trol overview Natural Resources Canada Canadian Forest Service Pacific Forestry Centre Victoria BC Report DRS-N-031
Ecological Stratification Working Group 1996 A national ecological framework for Canada Agriculture and Agri-Foods Canada Research Branch Centre for land and Biological Resources Research and Environment Canada State of the Environ-ment Directorate Ottawa Ont
Environment Canada 2006 National Inventory Report 1990ndash2004 Greenhouse gas sources and sinks in Canada Govern-ment of Canada Submission to the UN Framework Convention on Climate Change httpunfcccintnational_reportsannex_i_ghg_inventoriesnational_inventories_submissionsitems3734php (Accessed August 2014)
Environment Canada 2014 National Inventory Report 1990ndash2012 Greenhouse gas sources and sinks in Canada Govern-ment of Canada Submission to the UN Framework Convention on Climate Change Report issued by Pollutant Inventories and Reporting Division Environment Canada Ottawa Onthttpunfcccintnational_reportsannex_i_ghg_inventoriesnational_inventories_submissionsitems8108php (Accessed August 2014)
Food and Agriculture Organization 2006 2001 Global forest resources assessment 2000 main report United Nations Food and Agriculture Organization Rome Italy FAO Forestry Paper 140
Gillis M Omule A Brierley T 2005 Monitoring Canadarsquos forests The National Forest Inventory Forestry Chronicle 81(2)214ndash221
Intergovernmental Panel on Climate Change 2003 Good practice guidance for land use land-use change and forestry Penman J Gytarsky M Hiraishiet T et al (eds) Institute for Global Environmental Strategies Hayama Japan
Intergovernmental Panel on Climate Change 2006 2006 IPCC guidelines for national greenhouse gas inventories Egg-leston HS Buendia L Miwa K Ngara T Tanabe K (eds) Intergovernmental Panel on Climate Change National Green-house Gas Inventories Programme Institute for Global Environmental Strategies Hayama Japan httpwwwipcc-nggipigesorjppublic2006gl (Accessed January 2015)
Kurz W 2010 An ecosystem context for global forest cover loss estimates Proceedings National Academy of Sciences 107(20)9025ndash9026
Kurz W Apps M 2006 Developing Canadarsquos national forest carbon monitoring accounting and reporting system to meet the reporting requirements of the Kyoto Protocol Mitigation and Adaptation Strategies for Global Change 11(1)33ndash43
Kurz W Dymond C White T Stinson G Shaw C Rampley G Smyth C Simpson B Neilson E Trofymow J Metsaranta J Apps M 2009 CBM-CFS3 A model of carbon-dynamics in forestry and land-use change implementing IPCC standards Ecological Modelling 220(4)480ndash504
Kurz W Shaw C Boisvenue C Stinson G Metsaranta J Leckie D Dyk A Smyth C Neilson E 2013 Carbon in Canadarsquos boreal forest A synthesis Environmental Reviews 21260ndash292
Canadian Forest Service | Pacific Forestry Centre | nrcangccaforestsresearch-centrespfc1348922
Leckie D Dyk A Ortlepp S Tinis S 2010 Records of decision for Canadarsquos national deforestation estimate 2011 Natu-ral Resources Canada Canadian Forest Service Pacific Forestry Centre Victoria BC Report DRS-N-029
Leckie D Dyk A Paradine D Tammadge D Tinis S 2012 Deforestation interpretation guide Natural Resources Canada Canadian Forest Service Pacific Forestry Centre Victoria BC Report DRS-M-030
Leckie D Dyk A Tinis S 12009 Records of decision for Canadarsquos national deforestation estimate Natural Resources Canada Canadian Forest Service Pacific Forestry Centre Victoria BC Report DRS-N-026
Leckie D Paradine D Burt W 2006a Mapping sample coverage for Canadarsquos national deforestation estimate 2006 Natural Resources Canada Canadian Forest Service Pacific Forestry Centre Victoria BC Report DRS-N-002
Leckie D Paradine D Tinis S 2006b Geographic strata for Canadarsquos national deforestation estimates report Natural Resources Canada Canadian Forest Service Pacific Forestry Centre Victoria BC Report DRS-Q-003
Leckie D Paradine D Kurz W Magnussen S [2015] Deforestation mapping sampling designs for Canadian land-scapes Natural Resources Canada Canadian Forest Service Victoria BC In review
Lempriegravere T Kurz W Hogg E Schmoll C Rampley G Yemshanov D et al 2013 Canadian boreal forests and climate change mitigation Environmental Reviews 21(4)293ndash321
Le Queacutereacute C Peters G Andres R Andrew R Boden T et al 2014 Global carbon budget 2013 Earth System Science Data 6689ndash760
Masek J Cohen W Leckie D Wulder M Vargas R de Jong B Healey S Law B Birdsey R Houghton R Mildrexler D Goward S Smith W 2011 Recent rates of forest harvest and conversion in North America Journal of Geophysical Research 116G00K03
McGovern M 2008 Reporting zones GHG spatial reporting structure for Canada 2008 Environment Canada Greenhouse Gas Division Ottawa Ontario
Montreal Process 2009 Criteria and indicators for the conservation and sustainable management of temperate and boreal forests Fourth edition httpwwwmontrealprocessorgdocumentspublicationsgeneral2009p_4pdf (Accessed January 2015)
Pan Y Birdsey RA Fang J et al 2011 A large and persistent carbon sink in the Worldrsquos forests Science 333988ndash993
Paradine D 2007 National Inventory Report 2008 ACCESS database description GIS processing description and consoli-dated GIS database description Natural Resources Canada Canadian Forest Service Pacific Forestry Centre Victoria BC Report DRS-N-019
United Nations Framework Convention on Climate Change 2002 Conference of the PartiesndashReport of the Confer-ence of the Parties on its seventh session held at Marrakesh from 29 October to 10 November 2001 United Nations Office Geneva Switzerland httpunfcccintresourcedocscop713pdf (Accessed January 2015)
Wulder M Masek J Cohen W Loveland T Woodcock C 2012 Opening the archive How free data has enabled the science and monitoring promise of Landsat Remote Sensing of Environment 1222ndash10
Canadarsquos National Deforestation Monitoring System System DescriptionInformation Report BC-X-439
23
Appendix 1 Pretype Forest Conditions
The tables below list the approved forest type density and maturity values applied in deforestation mapping Note not all combinations are valid particularly those that include recent disturbance and regeneration terms Table A11 lists the ac-ceptable parameter combinations
The most common pretype groupings found are the 36 combinations of three Type classes (B C and M) three Density classes (D O and S) and four Maturity classes (R Y I and M) The two older Maturity classes (O and G) require additional verification to identify them Several classes identify recently disturbed forests (K X and R)
Table A11 Pre-change forest type descriptors
TYPE Definition Restrictions of use
B Broadleaf gt 75 of trees are broadleaf (Angiospermae)
C Conifer gt 75 of trees are conifer (Coniferae)
M Mixed gt 25 of both broadleaf and conifer present
K Clearcut Exposed ground and (or) ground vegetation No visible regeneration
Use only with S or N density and Q maturity
X Burn Exposed ground and (or) ground vegetation No visible regen-eration May have live residual trees up to 25 crown closure
Use only with S or N density and Q maturity
R Regen Regenerating areas with lt 25 crown closure where the forest composition (B C or M) is not identifiable
Table A12 Pre-change forest density descriptors
DENSITY Definition Restrictions of use
D Dense gt 60 crown closure
O Open 25ndash60 crown closure
S Sparse 5ndash25 crown closure
N Nil lt 5 crown closure Use only with K and X pretype
Table A13 Pre-change forest maturity descriptors-
MATURITY Definition Restrictions of use
Q Recent disturbance No visible regeneration Use only with K and X pretype
R Regen Forest stands 0ndash14 years old
Y Young Forest stands 15ndash25 years old
I Immature Forest stands 26ndash40 years old
M Mature Forest stands 41ndash80 years old
O Old Forest stands 81ndash200 years old
G Old-growth Forest stands over 200 years old Restricted to British Columbia only
Canadian Forest Service | Pacific Forestry Centre | nrcangccaforestsresearch-centrespfc1348924
Table A14 Valid combinations of pretype attributes (TypendashDensityndashMaturity)
Regen Broadleaf Mixed Coniferous
Dense RDR BDR MDR CDR
BDY MDY CDY
BDI MDI CDI
BDM MDM CDM
BDO MDO CDO
CDG
Open ROR BOR MOR COR
BOY MOY COY
BOI MOI COI
BOM MOM COM
BOO MOO COO
COG
Sparse RSR BSR MSR CSR
BSY MSY CSY
BSI MSI CSI
BSM MSM CSM
BSO MSO CSO
CSG
Burn Clearcut
Regen Broadleaf Mixed Coniferous
Disturbed XSQ KSQ
XNQ KNQ
Canadarsquos National Deforestation Monitoring System System DescriptionInformation Report BC-X-439
25
Appendix 2 Post-class Modifiers by Industrial Category
Table A21 lists all land use post-class deforestation modifiers They provide additional detail regarding what has occurred on the ground for each deforestation event These classes can be assigned to various industrial classes (see Table A22) Detailed definitions are provided in the Deforestation Interpretation Guide (Leckie et al 2012)
Table A21 Post class and post-class modifier codes and short descriptions grouped by industrial categorysector (in bold)
Post class Post class modifier
Agriculture
AG Agriculture ab bare
cp crop
fy farm yard
pa pasture
AL Artificial Lake aa agriculture pond
ea agriculture effluent pond
OF Open Field fa agriculture setting
Flooded Standing Forest
AL Artificial Lake ff flooded standing forest
Forestry
RD Road mf mainline forestry road
sf secondary forestry road
xf tertiary forestry road with width ge 20 m
SD Soil Disturbance ld logging landing
ss rock slide scar
Hydro Infrastructure
CR Corridor hm hydro linendashmain
hs hydro linendashsecondary
xy hydro linendashtertiary ge 20 m
IN Industrial ih hydro infrastructure
Hydro Reservoir
AL Artificial Lake hr hydroelectric flooding
Industry
AL Artificial Lake ei industrial effluent pond
IN Industrial hi heavy industrial
li light industrial
OF Open Field fi industrial
Canadian Forest Service | Pacific Forestry Centre | nrcangccaforestsresearch-centrespfc1348926
Post class Post class modifier
Mining
AL Artificial Lake em waste ponds for mining
IN Industrial mh mine heavy
ml mine light
OF Open Field fk mine facility
fm mine
fq pit and quarry
SD Soil Disturbance mn open pit mine
pq gravel pitquarry
Municipal
AL Artificial Lake ad pond urban setting
ar pond rural residential
ul other human caused
CR Corridor cl cut line
cu undifferentiated
OF Open Field fd urbansuburban
fr rural residential
uf undifferentiated field
RR Rural Residential rf few trees remaining
rm many trees remaining
SD Soil Disturbance lf landfill
su undifferentiated
UR Urban Residential df few trees remaining
dm many trees remaining
Oil and Gas
CR Corridor pp pipelinendashmain
ps pipelinendashsecondary
xp pipelinendashtertiary ge 20 m
IN Industrial oi oil sands industrial
op oil and gas industrial
wp well pad
OF Open Field fo oil and gas facility
fs oil sands open field
SD Soil Disturbance os oil sands
AL Artificial Lake eo oil and gas related pond
Canadarsquos National Deforestation Monitoring System System DescriptionInformation Report BC-X-439
27
Post class Post class modifier
Peat Mining
SD Soil Disturbance pm peat extraction
Recreation
AL Artificial Lake af golf course related
ap recreational water body
OF Open Field fc recreational field
RC Recreational ca campground
go golf course
ru other or undifferentiated
sk ski areas
Transportation
CR Corridor as airstrip
ry railway
RD Road mm main road clearly for a mine
mr main road
mo main road clearly for oil and gas
my main road clearly for hydroelectric
sm secondary mining road
so secondary oil and gas road
sr secondary road
sy secondary hydroelectric road
xm tertiary mining road with width ge 20 m
xo tertiary oil and gas road with width ge 20 m
xr tertiary road with width ge 20 m
xy tertiary hydroelectric road with width ge 20 m
Canadian Forest Service | Pacific Forestry Centre | nrcangccaforestsresearch-centrespfc1348928
Table A22 Aggregation of deforestation mapping classes to good practice guidance and industrial categories
Good practice guidance class
Crop-land (CL)
Wetlands (WL) Settlements (SL)
Industrial Categories
Agric
ultu
re
Floo
ded
stan
ding
fore
st
Hyd
ro re
serv
oir
Peat
min
ing
Fore
stry
Hyd
ro in
fras
truc
ture
Indu
stry
Min
ing
Mun
icip
al
Oil
and
gas
Recr
eatio
n
Tran
spor
tatio
n
Def
ores
tatio
n po
st c
lass
Agriculture AG ab cp pa fy
Artificial Lake AL aa ea ff hr ei emad ar of ul eo af ap
Corridor CR hm hs xy cl cu
pp ps xp as ry
Industrial IN ih hi li mh mloi op wp
Open Field OF fa fi fk fm fq fd fr uf fo fs fc
Recreational RC ca go fu sk
Road RDmf sf xf
mm mo mr my sm so sr sy xm
xo xr xy
Rural Residential RR rf rm
Soil Disturbance SD pm ld ss mn pq lf su os
Urban Residential UR df dm
Canadarsquos National Deforestation Monitoring System System DescriptionInformation Report BC-X-439
29
Appendix 3 Deforestation Strata Units and Reconciliation Unit InclusionTable A31 shows the names of the deforestation strata their area in kilohectares and the percentage of that area contained in each reconciliation unit that they overlap (sorted by reconciliation unit identification number see Figure 1 for unit loca-tion and name)
Table A31 Area of strata units and percent of strata unit area that is in each reconciliation unit
Deforestation strata unit name Strata unit area (kilohectares)
Reconciliation unit ( inclusion)
Newfoundland Eastern Woodlot 4 477 1 (100)
Newfoundland Forest Activity Zone 6 512 1 (100)
Newfoundland St Johns 55 1 (100)
Labrador Arctic 1 893 2 (100)
Labrador Northern Forest 23 238 3 (98) 4 (2)
Labrador Forest Activity Zone 4 620 4 (100)
Nova Scotia Eastern Woodlot 2 894 5 (100)
Nova Scotia Forest Activity Zone 2 396 5 (100)
Nova Scotia HalifaxDartmouth 182 5 (100)
Prince Edward Island 577 6 (100)
New Brunswick Eastern Woodlot 4 121 7 (100)
New Brunswick Forest Activity Zone 3 174 7 (100)
Quebec Arctic 20 443 10 (75) 9 (18) 8 (7)
Quebec Eastern Townships 3 948 11 (100)
Quebec Gaspe Forest Activity Zone 2 740 11 (100)
Quebec Southern RU12 2 968 12 (100)
Quebec Northern Forest 72 759 14 (73)15 (22) 13(5)
Quebec Forest Activity Zone 44 717 15 (100)
Quebec Ile DAnticosti 795 15 (100)
Quebec Lac St Jean 964 15 (100)
Quebec Southern RU15 1 687 15 (100)
Ontario Thunder Bay 225 16(100)
Ontario Southern 8 198 17 (100)
Ontario Manitoulin Island 326 17 (100)
Ontario Northern Forest 46 468 18 (56) 16 (43) 19 (1)
Ontario SudburyNorth Bay 874 19 (100)
Ontario Forest Activity Zone 42 398 19 (56) 16 (43) 18 (1)
Ontario Sault Ste Marie 536 19 (92) 17 (8)
Manitoba Forest Activity Zone RU22 East 2 405 22 (100)
Manitoba Forest Activity Zone RU22 North 6 109 22 (100)
Manitoba Prairie Fringe RU22 804 22 (100)
Manitoba Northern Forest 37 339 22 (43) 21 (35) 25 (19) 23 (3)
Manitoba Forest Activity Zone RU23 7 382 23 (100)
Manitoba Prairie Fringe RU23 3 970 23 (100)
Manitoba Hotspot 851 24 (100)
Manitoba North Prairie 6 117 24 (100)
Canadian Forest Service | Pacific Forestry Centre | nrcangccaforestsresearch-centrespfc1348930
Deforestation strata unit name Strata unit area (kilohectares)
Reconciliation unit ( inclusion)
Saskatchewan Northern Forest 21 224 27 (75) 26 (22) 28 (3)
Saskatchewan Prairie Fringe 5 509 28 (100)
Saskatchewan Inactive Forest Activity Zone 6 196 28 (58) 27 (42)
Saskatchewan Forest Activity Zone 8 189 28 (99) 27 (1)
Saskatchewan North Prairie 8 167 29 (100)
Saskatchewan Prairie 15 921 30 (100)
Alberta Northern Forest 10 862 31 (58) 34 (28) 32 (8) 33 (6)
Alberta Forest Activity Zone 22 066 34 (100)
Alberta Fort McMurray 807 34 (100)
Alberta High Level 789 34 (100)
Alberta Northwest Fringe 5 436 34 (100)
Alberta Prairie Fringe 6 038 34 (100)
Alberta North Prairie 7 397 35 (100)
Alberta RU 36 Forest Activity Zone 4 764 36 (100)
Alberta Palliser Triangle 3 689 37 (100)
Alberta Prairie West 4 522 37 (100)
British Columbia RU 38 6 759 38 (100)
British Columbia Prairie Fringe 2 333 39 (100)
British Columbia RU 40 19 220 40 (100)
British Columbia Lower Mainland East Vancouver Island
1 142 41 (100)
British Columbia RU 41 Forest Activity Zone 15 440 41 (100)
British Columbia VI QCI 3 813 41 (100)
British Columbia Okanagan 1 109 42 (100)
British Columbia Prince George 464 42 (100)
British Columbia RU 42 Forest Activity Zone 44 286 42 (96) 39 (4)
Yukon Arctic 496 43 (100)
Yukon Northern Forest 19 987 45 (91) 44 (9)
Yukon Whitehorse 417 46 (100)
Yukon Forest Activity Zone 27 440 46 (98) 47 (1)
Northwest Territories Arctic 42 788 48 (49) 49 (43) 50 (7)
Northwest Territories Northern Forest 91 972 50 (52) 51 (37) 53 (9) 52 (2)
Northwest Territories Yellowknife 176 51 (100)
Northwest Territories Forest Activity Zone 467 54 (100)
Nunavut Arctic 198 915 56 (64) 57 (25) 55 (11)
Nunavut Northern Forest 9 892 58 (100)
nrcangccaforests
For more information about the Canadian Forest Service visit our website at nrcangccaforests or contact any of the following Canadian Forest Service establishments
Canadian Forest Service Contacts
Atlantic Forestry Centre PO Box 4000 Fredericton NB E3B 5P7 Tel (506) 452-3500 Fax (506) 452-3525 nrcangccaforestsresearch-centresafc13447
Atlantic Forestry Centre ndash District Office Sir Wilfred Grenfell College Forestry Centre University Drive Corner Brook NF A2H 6P9 Tel (709) 637-4900 Fax (709) 637-4910
Laurentian Forestry Centre 1055 rue du PEPS PO Box 3800 Sainte-Foy PQ G1V 4C7 Tel (418) 648-5788 Fax (418) 648-5849 nrcangccaforestsresearch-centreslfc13473
Great Lakes Forestry Centre PO Box 490 1219 Queen St East Sault Ste Marie ON P6A 5M7 Tel (705) 949-9461 Fax (705) 759-5700 nrcangccaforestsresearch-centresglfc13459
Northern Forestry Centre 5320-122nd Street Edmonton AB T6H 3S5 Tel (403) 435-7210 Fax (403) 435-7359 nrcangccaforestsresearch-centresnofc13485
Pacific Forestry Centre 506 West Burnside Road Victoria BC V8Z 1M5 Tel (250) 363-0600 Fax (250) 363-0775 nrcangccaforestsresearch-centrespfc13489
Headquarters 580 Booth St 8th Fl Ottawa ON K1A 0E4 Tel (613) 947-7341 Fax (613) 947-7396
Canadian Wood Fibre Centre A virtual research centre of the Canadian Forest Service Natural Resources Canada nrcangccaforestsresearch-centrescwfc13457
1
2
3
5
6
4
1
25
3 6
4
1
To order publications online visit the Canadian Forest Service Publications website at
cfsnrcangccapublications

Canadarsquos National Deforestation Monitoring System System DescriptionInformation Report BC-X-439
17
The expert intervention can be added at the strata level for a particular time period as an adjustment factor (labelled ldquo3rdquo in Figure 10) or as replacements or additions (labelled ldquo4rdquo in Figure 10) to existing data It can also be applied at the RU level (labelled ldquo7rdquo in Figure 10) Early national deforesta-tion reporting had more expert interventions because of lower sample rates less availability of high-resolution imagery and more use of records data over the remote sensing sample Currently few expert interventions occur with most occurring for the 1975ndash1990 time period which has a smaller sample
At the strata level the updated deforestation estimates by time period and post-class modifier are proportioned (labelled ldquo5rdquo in Figure 10) into their respective RUs (see Ap-pendix 3)
The data are then annualized The deforestation estimates for each time period (by post class and RU) are assigned
to the middle year of the time period (ie 1983 for 1975ndash1990 1995 for 1990ndash2000 and 2004 for 2000ndash2008) Annual trends are produced by applying linear interpola-tion between midpoints and extrapolation from endpoints (labelled ldquo6rdquo in Figure 10) Figure 11 provides one example
Large event mapping data records and activity data and expert interventions are applied as shown by the various green boxes in Figure 10 Large event data have the year of the event attached to them and are added to the mapping data at the RU level (labelled ldquo7rdquo in Figure 10) Records data also generally have a date attached and are added to the annualized data in a similar fashion to large event data
Figure 12 shows the trend line calculated in Figure 11 and the large event data (purple) representing hydro reservoir flooding facility construction and associated transporta-tion and hydro line corridors
Figure 11 Example deforestation trend produced using data from three mapping periods
Canadian Forest Service | Pacific Forestry Centre | nrcangccaforestsresearch-centrespfc1348918
Figure 12 Example of a deforestation area trend from sample mapping (red) and large events data (purple)
The post-class modifier classes (Table 1 and Table A21 in Appendix 2) are aggregated (labelled ldquo8rdquo in Figure 10) to the appropriate industrial category and good practice guidance class using a lookup table The various modifiers within each deforestation post class provide flexibility to summarize to different industrial categories based on user requirements (eg the categories used by the National For-est Carbon Monitoring Accounting and Reporting System and shown in Tables A21 and A22)
The result of the processing is a series of database tables A major product among these is the list of annual deforesta-tion area per RU per industrial class (labelled ldquo9rdquo in Figure 10) Another product is the breakdown of forest pretype percentages by RU this is done by calculating the percent-age area of each pretype mapped in the RU Reporting for the UNFCCC requires separate estimates of deforestation and greenhouse gas emissions for managed and unman-aged forest thus a separate table is produced for unman-aged forest (labelled ldquo10rdquo in Figure 10)
5 Quality ControlThree major quality control stages are applied during the deforestation mapping process
1 initial mapping quality control
2 revision quality checks and
3 overall quality assurance or vetting where a check on the final mapping data is performed
This multi-stage approach reduces the likelihood of errors and increases consistency of and confidence in the final product The data processing stage has further checks for data integrity After the data are calculated in the esti-mate process the final numbers and trends are assessed for changes from previous year estimates Deforestation estimates are also scrutinized by external users before they incorporate the data into their applications For an over-view of quality control practices see Dyk et al (2011)
51 Quality Control at the Mapping Stage
The mapping process flow is illustrated in Figure 13 includ-ing the quality control steps Typical errors caught through quality control at the mapping stage include incorrect event interpretations or delineations event omissions or commissions missing field values typographical errors and topology problems During the quality control phase an internal Canadian Forest Service reviewer performs detailed checks to ensure consistency with mapping and interpretation rules and returns a set of points to flag and describe the problem areas to the interpreter or contrac-tor These quality control points are stored in the mapping geodatabase as a permanent layer
Canadarsquos National Deforestation Monitoring System System DescriptionInformation Report BC-X-439
19
Figure 13 The deforestation mapping and quality control process flow
The mapping interpreter reviews these points and applies the recommended corrections to the working database The quality control points are sent to the interpreter early and frequently in the project timeline to reduce or avoid propagation of persistent errors or misunderstandings through the duration of the project
The original line and polygon mapping is preserved and re-visions are performed in separate ldquorevised linerdquo and ldquorevised polygonrdquo layers in the project geodatabase Information about the changes including what was done by whom and the date is added for every revised event Any deleted events are also retained in what are termed the ldquodrop lay-ersrdquo to mark the area as a non-deforestation event which is reviewed during future mapping
When the revised data are resubmitted to the Canadian Forest Service the data layers make clear what changes were requested and what changes were made The re-viewer uses these layers to verify that appropriate revisions were properly applied at all quality control points Any further errors or misunderstandings are communicated to the interpreter immediately for resolution At this stage the interpreter can also open a dialogue regarding specific events using additional comment fields in the quality control point layer or personal communication
The next level of quality control is the final vetting This audit step is conducted internally by senior Canadian For-est Service interpreters to ensure consistency of mapping across all projects All aspects of the new data are reviewed during this stage omission and commission errors delinea-
tion and attribution In addition the older mapping data are scanned to ensure newer imagery confirms the original interpretation A set of ldquovet revisionrdquo points is created to mark all adjustments required in the database An analyst works through these point by point to make the necessary changes noting any complex or uncertain events and communicating directly with the vetting interpreter when necessary
Field validation is a desirable aspect of the revision process but is not included during the mapping stage In general field campaigns are conducted on an ongoing basis when resources permit Areas where local knowledge or ground truth information are needed to clarify the interpretation are identified from the interpreter confidence records or the revision point data Dedicated field programs schedule air or ground visits to high-impact and low- to moderate-confidence events Local experts sometimes provide information about ground conditions that can be used to verify and update the database
Throughout the entire mapping and revision process an internal ldquoproject storyrdquo is maintained by the Canadian For-est Service This document summarizes activity on a given project including staff and contractors involved dates and actions completed It also includes detailed explanation of any complex situations or vet revisions as well as notes on any issues raised by the quality control or vetting interpret-ers To maintain consistency analysts who are involved in revisions or who vet revisions read this project story before starting work
Canadian Forest Service | Pacific Forestry Centre | nrcangccaforestsresearch-centrespfc1348920
52 Quality Control at the Data Processing Stage
Once revisions are vetted final data integrity checks are conducted on the project database to find and correct any technical errors such as missing attributes mismatched post classes and modifiers incorrect or reversed event dates inappropriate line widths topology errors overlaps and duplicates and typos This stage is partially automated The final mapping layers can be loaded into the national database only after the integrity checks have been com-pleted
Data quality checks are built into the script that automates the data processing stages The script both delivers reports to the screen while running and dumps to log files which are reviewed by Canadian Forest Service staff to ensure the runs were successful
Transfer of the final GIS tables into the non-spatial defor-estation database is also automated The grid and event tables for each time period are checked before load-ing and the number of records loaded is recorded and compared with previous runs to highlight any potential discrepancies
The database queries and tables used to create the annual estimates by industrial category and RU are controlled by Microsoft Access macros to ensure consistency between the runs
53 Quality Control at the Output Analysis Stage
Following generation of the estimate tables the main out-puts (annualized deforestation by industrial class and RU pretype table and unmanaged forest table) are evaluated closely by Canadian Forest Service experts to ensure that estimates have been calculated properly and that discrep-ancies from previously calculated values can be explained To aid in this effort a comparison spreadsheet is created for each RU showing the deforestation estimates by indus-trial class for the current and previous yearrsquos national run together with illustrations and statistics The experts scru-tinize the data for changes and ensure the new estimates are consistent with the input mapping data Any specific issues and special adjustments required are documented in a report that becomes part of the record for each yearrsquos estimate
54 External Quality Control
Users of the deforestation estimates conduct their own reviews of the data prior to use in their systems and com-municate any issues before incorporating the data into their own business processes When new issues arise these are dealt with and the NDMS quality control processes are updated to catch similar issues in the future
6 ConclusionsDeforestation is the direct human-induced conversion of forested land to non-forested land use The NDMS was de-signed and implemented to provide information needed by Canada to meet its obligation under the UN Frame-work Convention on Climate Change to report the areas affected annually by deforestation Also considered was the need to provide information useful for policy analysis land management and forest stewardship applications Understanding why where and when deforestation occurs is a prerequisite to the development of appropriate policy instruments to optimize land use develop mitigation strat-egies and address cumulative impacts on forest resources
The NDMS uses manual mapping from a satellite remote sensing sampling system informed by records-based information and expert knowledge to provide information about deforestation in Canada The remote sensing map-ping is supported by available ancillary information such as high-resolution imagery forest inventory road networks and other industrial databases Certain types of events that are large and isolated (eg mine and hydroelectric devel-opments) are mapped and incorporated separately in the overall deforestation estimates Occasionally records and activity data on land use changes are incorporated when they are deemed more appropriate than the sampling es-timate The mapping results from the sample are scaled up to regional levels In the data processing stage these data are merged and annualized to produce national deforesta-tion estimates
The system has been used and improved over the last 10 years The flexibility of the NDMSrsquos design makes it possible to adapt to future changes in image sources ancillary data resource availability and user needs and positions the pro-gram well for long-term maintenance and improvement
Canadarsquos National Deforestation Monitoring System System DescriptionInformation Report BC-X-439
21
7 References
Burt W Paradine D Leckie D 2006 Geographic Information system processing of deforestation mapping data for estimating deforested area of Canada Natural Resources Canada Canadian Forest Service Pacific Forestry Centre Victoria BC Report DRS-P-001
Dyk A Tinis S Leckie D 2011 National Inventory Report 2011 Deforestation area estimation for Canada Quality con-trol overview Natural Resources Canada Canadian Forest Service Pacific Forestry Centre Victoria BC Report DRS-N-031
Ecological Stratification Working Group 1996 A national ecological framework for Canada Agriculture and Agri-Foods Canada Research Branch Centre for land and Biological Resources Research and Environment Canada State of the Environ-ment Directorate Ottawa Ont
Environment Canada 2006 National Inventory Report 1990ndash2004 Greenhouse gas sources and sinks in Canada Govern-ment of Canada Submission to the UN Framework Convention on Climate Change httpunfcccintnational_reportsannex_i_ghg_inventoriesnational_inventories_submissionsitems3734php (Accessed August 2014)
Environment Canada 2014 National Inventory Report 1990ndash2012 Greenhouse gas sources and sinks in Canada Govern-ment of Canada Submission to the UN Framework Convention on Climate Change Report issued by Pollutant Inventories and Reporting Division Environment Canada Ottawa Onthttpunfcccintnational_reportsannex_i_ghg_inventoriesnational_inventories_submissionsitems8108php (Accessed August 2014)
Food and Agriculture Organization 2006 2001 Global forest resources assessment 2000 main report United Nations Food and Agriculture Organization Rome Italy FAO Forestry Paper 140
Gillis M Omule A Brierley T 2005 Monitoring Canadarsquos forests The National Forest Inventory Forestry Chronicle 81(2)214ndash221
Intergovernmental Panel on Climate Change 2003 Good practice guidance for land use land-use change and forestry Penman J Gytarsky M Hiraishiet T et al (eds) Institute for Global Environmental Strategies Hayama Japan
Intergovernmental Panel on Climate Change 2006 2006 IPCC guidelines for national greenhouse gas inventories Egg-leston HS Buendia L Miwa K Ngara T Tanabe K (eds) Intergovernmental Panel on Climate Change National Green-house Gas Inventories Programme Institute for Global Environmental Strategies Hayama Japan httpwwwipcc-nggipigesorjppublic2006gl (Accessed January 2015)
Kurz W 2010 An ecosystem context for global forest cover loss estimates Proceedings National Academy of Sciences 107(20)9025ndash9026
Kurz W Apps M 2006 Developing Canadarsquos national forest carbon monitoring accounting and reporting system to meet the reporting requirements of the Kyoto Protocol Mitigation and Adaptation Strategies for Global Change 11(1)33ndash43
Kurz W Dymond C White T Stinson G Shaw C Rampley G Smyth C Simpson B Neilson E Trofymow J Metsaranta J Apps M 2009 CBM-CFS3 A model of carbon-dynamics in forestry and land-use change implementing IPCC standards Ecological Modelling 220(4)480ndash504
Kurz W Shaw C Boisvenue C Stinson G Metsaranta J Leckie D Dyk A Smyth C Neilson E 2013 Carbon in Canadarsquos boreal forest A synthesis Environmental Reviews 21260ndash292
Canadian Forest Service | Pacific Forestry Centre | nrcangccaforestsresearch-centrespfc1348922
Leckie D Dyk A Ortlepp S Tinis S 2010 Records of decision for Canadarsquos national deforestation estimate 2011 Natu-ral Resources Canada Canadian Forest Service Pacific Forestry Centre Victoria BC Report DRS-N-029
Leckie D Dyk A Paradine D Tammadge D Tinis S 2012 Deforestation interpretation guide Natural Resources Canada Canadian Forest Service Pacific Forestry Centre Victoria BC Report DRS-M-030
Leckie D Dyk A Tinis S 12009 Records of decision for Canadarsquos national deforestation estimate Natural Resources Canada Canadian Forest Service Pacific Forestry Centre Victoria BC Report DRS-N-026
Leckie D Paradine D Burt W 2006a Mapping sample coverage for Canadarsquos national deforestation estimate 2006 Natural Resources Canada Canadian Forest Service Pacific Forestry Centre Victoria BC Report DRS-N-002
Leckie D Paradine D Tinis S 2006b Geographic strata for Canadarsquos national deforestation estimates report Natural Resources Canada Canadian Forest Service Pacific Forestry Centre Victoria BC Report DRS-Q-003
Leckie D Paradine D Kurz W Magnussen S [2015] Deforestation mapping sampling designs for Canadian land-scapes Natural Resources Canada Canadian Forest Service Victoria BC In review
Lempriegravere T Kurz W Hogg E Schmoll C Rampley G Yemshanov D et al 2013 Canadian boreal forests and climate change mitigation Environmental Reviews 21(4)293ndash321
Le Queacutereacute C Peters G Andres R Andrew R Boden T et al 2014 Global carbon budget 2013 Earth System Science Data 6689ndash760
Masek J Cohen W Leckie D Wulder M Vargas R de Jong B Healey S Law B Birdsey R Houghton R Mildrexler D Goward S Smith W 2011 Recent rates of forest harvest and conversion in North America Journal of Geophysical Research 116G00K03
McGovern M 2008 Reporting zones GHG spatial reporting structure for Canada 2008 Environment Canada Greenhouse Gas Division Ottawa Ontario
Montreal Process 2009 Criteria and indicators for the conservation and sustainable management of temperate and boreal forests Fourth edition httpwwwmontrealprocessorgdocumentspublicationsgeneral2009p_4pdf (Accessed January 2015)
Pan Y Birdsey RA Fang J et al 2011 A large and persistent carbon sink in the Worldrsquos forests Science 333988ndash993
Paradine D 2007 National Inventory Report 2008 ACCESS database description GIS processing description and consoli-dated GIS database description Natural Resources Canada Canadian Forest Service Pacific Forestry Centre Victoria BC Report DRS-N-019
United Nations Framework Convention on Climate Change 2002 Conference of the PartiesndashReport of the Confer-ence of the Parties on its seventh session held at Marrakesh from 29 October to 10 November 2001 United Nations Office Geneva Switzerland httpunfcccintresourcedocscop713pdf (Accessed January 2015)
Wulder M Masek J Cohen W Loveland T Woodcock C 2012 Opening the archive How free data has enabled the science and monitoring promise of Landsat Remote Sensing of Environment 1222ndash10
Canadarsquos National Deforestation Monitoring System System DescriptionInformation Report BC-X-439
23
Appendix 1 Pretype Forest Conditions
The tables below list the approved forest type density and maturity values applied in deforestation mapping Note not all combinations are valid particularly those that include recent disturbance and regeneration terms Table A11 lists the ac-ceptable parameter combinations
The most common pretype groupings found are the 36 combinations of three Type classes (B C and M) three Density classes (D O and S) and four Maturity classes (R Y I and M) The two older Maturity classes (O and G) require additional verification to identify them Several classes identify recently disturbed forests (K X and R)
Table A11 Pre-change forest type descriptors
TYPE Definition Restrictions of use
B Broadleaf gt 75 of trees are broadleaf (Angiospermae)
C Conifer gt 75 of trees are conifer (Coniferae)
M Mixed gt 25 of both broadleaf and conifer present
K Clearcut Exposed ground and (or) ground vegetation No visible regeneration
Use only with S or N density and Q maturity
X Burn Exposed ground and (or) ground vegetation No visible regen-eration May have live residual trees up to 25 crown closure
Use only with S or N density and Q maturity
R Regen Regenerating areas with lt 25 crown closure where the forest composition (B C or M) is not identifiable
Table A12 Pre-change forest density descriptors
DENSITY Definition Restrictions of use
D Dense gt 60 crown closure
O Open 25ndash60 crown closure
S Sparse 5ndash25 crown closure
N Nil lt 5 crown closure Use only with K and X pretype
Table A13 Pre-change forest maturity descriptors-
MATURITY Definition Restrictions of use
Q Recent disturbance No visible regeneration Use only with K and X pretype
R Regen Forest stands 0ndash14 years old
Y Young Forest stands 15ndash25 years old
I Immature Forest stands 26ndash40 years old
M Mature Forest stands 41ndash80 years old
O Old Forest stands 81ndash200 years old
G Old-growth Forest stands over 200 years old Restricted to British Columbia only
Canadian Forest Service | Pacific Forestry Centre | nrcangccaforestsresearch-centrespfc1348924
Table A14 Valid combinations of pretype attributes (TypendashDensityndashMaturity)
Regen Broadleaf Mixed Coniferous
Dense RDR BDR MDR CDR
BDY MDY CDY
BDI MDI CDI
BDM MDM CDM
BDO MDO CDO
CDG
Open ROR BOR MOR COR
BOY MOY COY
BOI MOI COI
BOM MOM COM
BOO MOO COO
COG
Sparse RSR BSR MSR CSR
BSY MSY CSY
BSI MSI CSI
BSM MSM CSM
BSO MSO CSO
CSG
Burn Clearcut
Regen Broadleaf Mixed Coniferous
Disturbed XSQ KSQ
XNQ KNQ
Canadarsquos National Deforestation Monitoring System System DescriptionInformation Report BC-X-439
25
Appendix 2 Post-class Modifiers by Industrial Category
Table A21 lists all land use post-class deforestation modifiers They provide additional detail regarding what has occurred on the ground for each deforestation event These classes can be assigned to various industrial classes (see Table A22) Detailed definitions are provided in the Deforestation Interpretation Guide (Leckie et al 2012)
Table A21 Post class and post-class modifier codes and short descriptions grouped by industrial categorysector (in bold)
Post class Post class modifier
Agriculture
AG Agriculture ab bare
cp crop
fy farm yard
pa pasture
AL Artificial Lake aa agriculture pond
ea agriculture effluent pond
OF Open Field fa agriculture setting
Flooded Standing Forest
AL Artificial Lake ff flooded standing forest
Forestry
RD Road mf mainline forestry road
sf secondary forestry road
xf tertiary forestry road with width ge 20 m
SD Soil Disturbance ld logging landing
ss rock slide scar
Hydro Infrastructure
CR Corridor hm hydro linendashmain
hs hydro linendashsecondary
xy hydro linendashtertiary ge 20 m
IN Industrial ih hydro infrastructure
Hydro Reservoir
AL Artificial Lake hr hydroelectric flooding
Industry
AL Artificial Lake ei industrial effluent pond
IN Industrial hi heavy industrial
li light industrial
OF Open Field fi industrial
Canadian Forest Service | Pacific Forestry Centre | nrcangccaforestsresearch-centrespfc1348926
Post class Post class modifier
Mining
AL Artificial Lake em waste ponds for mining
IN Industrial mh mine heavy
ml mine light
OF Open Field fk mine facility
fm mine
fq pit and quarry
SD Soil Disturbance mn open pit mine
pq gravel pitquarry
Municipal
AL Artificial Lake ad pond urban setting
ar pond rural residential
ul other human caused
CR Corridor cl cut line
cu undifferentiated
OF Open Field fd urbansuburban
fr rural residential
uf undifferentiated field
RR Rural Residential rf few trees remaining
rm many trees remaining
SD Soil Disturbance lf landfill
su undifferentiated
UR Urban Residential df few trees remaining
dm many trees remaining
Oil and Gas
CR Corridor pp pipelinendashmain
ps pipelinendashsecondary
xp pipelinendashtertiary ge 20 m
IN Industrial oi oil sands industrial
op oil and gas industrial
wp well pad
OF Open Field fo oil and gas facility
fs oil sands open field
SD Soil Disturbance os oil sands
AL Artificial Lake eo oil and gas related pond
Canadarsquos National Deforestation Monitoring System System DescriptionInformation Report BC-X-439
27
Post class Post class modifier
Peat Mining
SD Soil Disturbance pm peat extraction
Recreation
AL Artificial Lake af golf course related
ap recreational water body
OF Open Field fc recreational field
RC Recreational ca campground
go golf course
ru other or undifferentiated
sk ski areas
Transportation
CR Corridor as airstrip
ry railway
RD Road mm main road clearly for a mine
mr main road
mo main road clearly for oil and gas
my main road clearly for hydroelectric
sm secondary mining road
so secondary oil and gas road
sr secondary road
sy secondary hydroelectric road
xm tertiary mining road with width ge 20 m
xo tertiary oil and gas road with width ge 20 m
xr tertiary road with width ge 20 m
xy tertiary hydroelectric road with width ge 20 m
Canadian Forest Service | Pacific Forestry Centre | nrcangccaforestsresearch-centrespfc1348928
Table A22 Aggregation of deforestation mapping classes to good practice guidance and industrial categories
Good practice guidance class
Crop-land (CL)
Wetlands (WL) Settlements (SL)
Industrial Categories
Agric
ultu
re
Floo
ded
stan
ding
fore
st
Hyd
ro re
serv
oir
Peat
min
ing
Fore
stry
Hyd
ro in
fras
truc
ture
Indu
stry
Min
ing
Mun
icip
al
Oil
and
gas
Recr
eatio
n
Tran
spor
tatio
n
Def
ores
tatio
n po
st c
lass
Agriculture AG ab cp pa fy
Artificial Lake AL aa ea ff hr ei emad ar of ul eo af ap
Corridor CR hm hs xy cl cu
pp ps xp as ry
Industrial IN ih hi li mh mloi op wp
Open Field OF fa fi fk fm fq fd fr uf fo fs fc
Recreational RC ca go fu sk
Road RDmf sf xf
mm mo mr my sm so sr sy xm
xo xr xy
Rural Residential RR rf rm
Soil Disturbance SD pm ld ss mn pq lf su os
Urban Residential UR df dm
Canadarsquos National Deforestation Monitoring System System DescriptionInformation Report BC-X-439
29
Appendix 3 Deforestation Strata Units and Reconciliation Unit InclusionTable A31 shows the names of the deforestation strata their area in kilohectares and the percentage of that area contained in each reconciliation unit that they overlap (sorted by reconciliation unit identification number see Figure 1 for unit loca-tion and name)
Table A31 Area of strata units and percent of strata unit area that is in each reconciliation unit
Deforestation strata unit name Strata unit area (kilohectares)
Reconciliation unit ( inclusion)
Newfoundland Eastern Woodlot 4 477 1 (100)
Newfoundland Forest Activity Zone 6 512 1 (100)
Newfoundland St Johns 55 1 (100)
Labrador Arctic 1 893 2 (100)
Labrador Northern Forest 23 238 3 (98) 4 (2)
Labrador Forest Activity Zone 4 620 4 (100)
Nova Scotia Eastern Woodlot 2 894 5 (100)
Nova Scotia Forest Activity Zone 2 396 5 (100)
Nova Scotia HalifaxDartmouth 182 5 (100)
Prince Edward Island 577 6 (100)
New Brunswick Eastern Woodlot 4 121 7 (100)
New Brunswick Forest Activity Zone 3 174 7 (100)
Quebec Arctic 20 443 10 (75) 9 (18) 8 (7)
Quebec Eastern Townships 3 948 11 (100)
Quebec Gaspe Forest Activity Zone 2 740 11 (100)
Quebec Southern RU12 2 968 12 (100)
Quebec Northern Forest 72 759 14 (73)15 (22) 13(5)
Quebec Forest Activity Zone 44 717 15 (100)
Quebec Ile DAnticosti 795 15 (100)
Quebec Lac St Jean 964 15 (100)
Quebec Southern RU15 1 687 15 (100)
Ontario Thunder Bay 225 16(100)
Ontario Southern 8 198 17 (100)
Ontario Manitoulin Island 326 17 (100)
Ontario Northern Forest 46 468 18 (56) 16 (43) 19 (1)
Ontario SudburyNorth Bay 874 19 (100)
Ontario Forest Activity Zone 42 398 19 (56) 16 (43) 18 (1)
Ontario Sault Ste Marie 536 19 (92) 17 (8)
Manitoba Forest Activity Zone RU22 East 2 405 22 (100)
Manitoba Forest Activity Zone RU22 North 6 109 22 (100)
Manitoba Prairie Fringe RU22 804 22 (100)
Manitoba Northern Forest 37 339 22 (43) 21 (35) 25 (19) 23 (3)
Manitoba Forest Activity Zone RU23 7 382 23 (100)
Manitoba Prairie Fringe RU23 3 970 23 (100)
Manitoba Hotspot 851 24 (100)
Manitoba North Prairie 6 117 24 (100)
Canadian Forest Service | Pacific Forestry Centre | nrcangccaforestsresearch-centrespfc1348930
Deforestation strata unit name Strata unit area (kilohectares)
Reconciliation unit ( inclusion)
Saskatchewan Northern Forest 21 224 27 (75) 26 (22) 28 (3)
Saskatchewan Prairie Fringe 5 509 28 (100)
Saskatchewan Inactive Forest Activity Zone 6 196 28 (58) 27 (42)
Saskatchewan Forest Activity Zone 8 189 28 (99) 27 (1)
Saskatchewan North Prairie 8 167 29 (100)
Saskatchewan Prairie 15 921 30 (100)
Alberta Northern Forest 10 862 31 (58) 34 (28) 32 (8) 33 (6)
Alberta Forest Activity Zone 22 066 34 (100)
Alberta Fort McMurray 807 34 (100)
Alberta High Level 789 34 (100)
Alberta Northwest Fringe 5 436 34 (100)
Alberta Prairie Fringe 6 038 34 (100)
Alberta North Prairie 7 397 35 (100)
Alberta RU 36 Forest Activity Zone 4 764 36 (100)
Alberta Palliser Triangle 3 689 37 (100)
Alberta Prairie West 4 522 37 (100)
British Columbia RU 38 6 759 38 (100)
British Columbia Prairie Fringe 2 333 39 (100)
British Columbia RU 40 19 220 40 (100)
British Columbia Lower Mainland East Vancouver Island
1 142 41 (100)
British Columbia RU 41 Forest Activity Zone 15 440 41 (100)
British Columbia VI QCI 3 813 41 (100)
British Columbia Okanagan 1 109 42 (100)
British Columbia Prince George 464 42 (100)
British Columbia RU 42 Forest Activity Zone 44 286 42 (96) 39 (4)
Yukon Arctic 496 43 (100)
Yukon Northern Forest 19 987 45 (91) 44 (9)
Yukon Whitehorse 417 46 (100)
Yukon Forest Activity Zone 27 440 46 (98) 47 (1)
Northwest Territories Arctic 42 788 48 (49) 49 (43) 50 (7)
Northwest Territories Northern Forest 91 972 50 (52) 51 (37) 53 (9) 52 (2)
Northwest Territories Yellowknife 176 51 (100)
Northwest Territories Forest Activity Zone 467 54 (100)
Nunavut Arctic 198 915 56 (64) 57 (25) 55 (11)
Nunavut Northern Forest 9 892 58 (100)
nrcangccaforests
For more information about the Canadian Forest Service visit our website at nrcangccaforests or contact any of the following Canadian Forest Service establishments
Canadian Forest Service Contacts
Atlantic Forestry Centre PO Box 4000 Fredericton NB E3B 5P7 Tel (506) 452-3500 Fax (506) 452-3525 nrcangccaforestsresearch-centresafc13447
Atlantic Forestry Centre ndash District Office Sir Wilfred Grenfell College Forestry Centre University Drive Corner Brook NF A2H 6P9 Tel (709) 637-4900 Fax (709) 637-4910
Laurentian Forestry Centre 1055 rue du PEPS PO Box 3800 Sainte-Foy PQ G1V 4C7 Tel (418) 648-5788 Fax (418) 648-5849 nrcangccaforestsresearch-centreslfc13473
Great Lakes Forestry Centre PO Box 490 1219 Queen St East Sault Ste Marie ON P6A 5M7 Tel (705) 949-9461 Fax (705) 759-5700 nrcangccaforestsresearch-centresglfc13459
Northern Forestry Centre 5320-122nd Street Edmonton AB T6H 3S5 Tel (403) 435-7210 Fax (403) 435-7359 nrcangccaforestsresearch-centresnofc13485
Pacific Forestry Centre 506 West Burnside Road Victoria BC V8Z 1M5 Tel (250) 363-0600 Fax (250) 363-0775 nrcangccaforestsresearch-centrespfc13489
Headquarters 580 Booth St 8th Fl Ottawa ON K1A 0E4 Tel (613) 947-7341 Fax (613) 947-7396
Canadian Wood Fibre Centre A virtual research centre of the Canadian Forest Service Natural Resources Canada nrcangccaforestsresearch-centrescwfc13457
1
2
3
5
6
4
1
25
3 6
4
1
To order publications online visit the Canadian Forest Service Publications website at
cfsnrcangccapublications
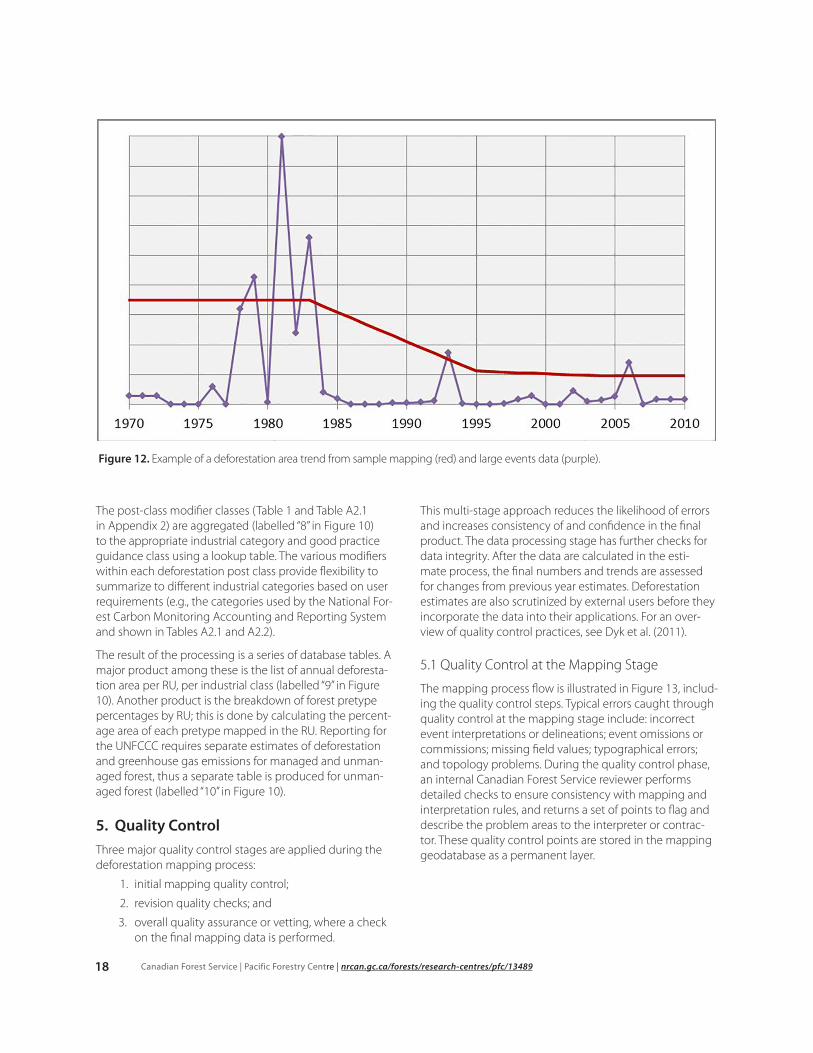

Canadarsquos National Deforestation Monitoring System System DescriptionInformation Report BC-X-439
19
Figure 13 The deforestation mapping and quality control process flow
The mapping interpreter reviews these points and applies the recommended corrections to the working database The quality control points are sent to the interpreter early and frequently in the project timeline to reduce or avoid propagation of persistent errors or misunderstandings through the duration of the project
The original line and polygon mapping is preserved and re-visions are performed in separate ldquorevised linerdquo and ldquorevised polygonrdquo layers in the project geodatabase Information about the changes including what was done by whom and the date is added for every revised event Any deleted events are also retained in what are termed the ldquodrop lay-ersrdquo to mark the area as a non-deforestation event which is reviewed during future mapping
When the revised data are resubmitted to the Canadian Forest Service the data layers make clear what changes were requested and what changes were made The re-viewer uses these layers to verify that appropriate revisions were properly applied at all quality control points Any further errors or misunderstandings are communicated to the interpreter immediately for resolution At this stage the interpreter can also open a dialogue regarding specific events using additional comment fields in the quality control point layer or personal communication
The next level of quality control is the final vetting This audit step is conducted internally by senior Canadian For-est Service interpreters to ensure consistency of mapping across all projects All aspects of the new data are reviewed during this stage omission and commission errors delinea-
tion and attribution In addition the older mapping data are scanned to ensure newer imagery confirms the original interpretation A set of ldquovet revisionrdquo points is created to mark all adjustments required in the database An analyst works through these point by point to make the necessary changes noting any complex or uncertain events and communicating directly with the vetting interpreter when necessary
Field validation is a desirable aspect of the revision process but is not included during the mapping stage In general field campaigns are conducted on an ongoing basis when resources permit Areas where local knowledge or ground truth information are needed to clarify the interpretation are identified from the interpreter confidence records or the revision point data Dedicated field programs schedule air or ground visits to high-impact and low- to moderate-confidence events Local experts sometimes provide information about ground conditions that can be used to verify and update the database
Throughout the entire mapping and revision process an internal ldquoproject storyrdquo is maintained by the Canadian For-est Service This document summarizes activity on a given project including staff and contractors involved dates and actions completed It also includes detailed explanation of any complex situations or vet revisions as well as notes on any issues raised by the quality control or vetting interpret-ers To maintain consistency analysts who are involved in revisions or who vet revisions read this project story before starting work
Canadian Forest Service | Pacific Forestry Centre | nrcangccaforestsresearch-centrespfc1348920
52 Quality Control at the Data Processing Stage
Once revisions are vetted final data integrity checks are conducted on the project database to find and correct any technical errors such as missing attributes mismatched post classes and modifiers incorrect or reversed event dates inappropriate line widths topology errors overlaps and duplicates and typos This stage is partially automated The final mapping layers can be loaded into the national database only after the integrity checks have been com-pleted
Data quality checks are built into the script that automates the data processing stages The script both delivers reports to the screen while running and dumps to log files which are reviewed by Canadian Forest Service staff to ensure the runs were successful
Transfer of the final GIS tables into the non-spatial defor-estation database is also automated The grid and event tables for each time period are checked before load-ing and the number of records loaded is recorded and compared with previous runs to highlight any potential discrepancies
The database queries and tables used to create the annual estimates by industrial category and RU are controlled by Microsoft Access macros to ensure consistency between the runs
53 Quality Control at the Output Analysis Stage
Following generation of the estimate tables the main out-puts (annualized deforestation by industrial class and RU pretype table and unmanaged forest table) are evaluated closely by Canadian Forest Service experts to ensure that estimates have been calculated properly and that discrep-ancies from previously calculated values can be explained To aid in this effort a comparison spreadsheet is created for each RU showing the deforestation estimates by indus-trial class for the current and previous yearrsquos national run together with illustrations and statistics The experts scru-tinize the data for changes and ensure the new estimates are consistent with the input mapping data Any specific issues and special adjustments required are documented in a report that becomes part of the record for each yearrsquos estimate
54 External Quality Control
Users of the deforestation estimates conduct their own reviews of the data prior to use in their systems and com-municate any issues before incorporating the data into their own business processes When new issues arise these are dealt with and the NDMS quality control processes are updated to catch similar issues in the future
6 ConclusionsDeforestation is the direct human-induced conversion of forested land to non-forested land use The NDMS was de-signed and implemented to provide information needed by Canada to meet its obligation under the UN Frame-work Convention on Climate Change to report the areas affected annually by deforestation Also considered was the need to provide information useful for policy analysis land management and forest stewardship applications Understanding why where and when deforestation occurs is a prerequisite to the development of appropriate policy instruments to optimize land use develop mitigation strat-egies and address cumulative impacts on forest resources
The NDMS uses manual mapping from a satellite remote sensing sampling system informed by records-based information and expert knowledge to provide information about deforestation in Canada The remote sensing map-ping is supported by available ancillary information such as high-resolution imagery forest inventory road networks and other industrial databases Certain types of events that are large and isolated (eg mine and hydroelectric devel-opments) are mapped and incorporated separately in the overall deforestation estimates Occasionally records and activity data on land use changes are incorporated when they are deemed more appropriate than the sampling es-timate The mapping results from the sample are scaled up to regional levels In the data processing stage these data are merged and annualized to produce national deforesta-tion estimates
The system has been used and improved over the last 10 years The flexibility of the NDMSrsquos design makes it possible to adapt to future changes in image sources ancillary data resource availability and user needs and positions the pro-gram well for long-term maintenance and improvement
Canadarsquos National Deforestation Monitoring System System DescriptionInformation Report BC-X-439
21
7 References
Burt W Paradine D Leckie D 2006 Geographic Information system processing of deforestation mapping data for estimating deforested area of Canada Natural Resources Canada Canadian Forest Service Pacific Forestry Centre Victoria BC Report DRS-P-001
Dyk A Tinis S Leckie D 2011 National Inventory Report 2011 Deforestation area estimation for Canada Quality con-trol overview Natural Resources Canada Canadian Forest Service Pacific Forestry Centre Victoria BC Report DRS-N-031
Ecological Stratification Working Group 1996 A national ecological framework for Canada Agriculture and Agri-Foods Canada Research Branch Centre for land and Biological Resources Research and Environment Canada State of the Environ-ment Directorate Ottawa Ont
Environment Canada 2006 National Inventory Report 1990ndash2004 Greenhouse gas sources and sinks in Canada Govern-ment of Canada Submission to the UN Framework Convention on Climate Change httpunfcccintnational_reportsannex_i_ghg_inventoriesnational_inventories_submissionsitems3734php (Accessed August 2014)
Environment Canada 2014 National Inventory Report 1990ndash2012 Greenhouse gas sources and sinks in Canada Govern-ment of Canada Submission to the UN Framework Convention on Climate Change Report issued by Pollutant Inventories and Reporting Division Environment Canada Ottawa Onthttpunfcccintnational_reportsannex_i_ghg_inventoriesnational_inventories_submissionsitems8108php (Accessed August 2014)
Food and Agriculture Organization 2006 2001 Global forest resources assessment 2000 main report United Nations Food and Agriculture Organization Rome Italy FAO Forestry Paper 140
Gillis M Omule A Brierley T 2005 Monitoring Canadarsquos forests The National Forest Inventory Forestry Chronicle 81(2)214ndash221
Intergovernmental Panel on Climate Change 2003 Good practice guidance for land use land-use change and forestry Penman J Gytarsky M Hiraishiet T et al (eds) Institute for Global Environmental Strategies Hayama Japan
Intergovernmental Panel on Climate Change 2006 2006 IPCC guidelines for national greenhouse gas inventories Egg-leston HS Buendia L Miwa K Ngara T Tanabe K (eds) Intergovernmental Panel on Climate Change National Green-house Gas Inventories Programme Institute for Global Environmental Strategies Hayama Japan httpwwwipcc-nggipigesorjppublic2006gl (Accessed January 2015)
Kurz W 2010 An ecosystem context for global forest cover loss estimates Proceedings National Academy of Sciences 107(20)9025ndash9026
Kurz W Apps M 2006 Developing Canadarsquos national forest carbon monitoring accounting and reporting system to meet the reporting requirements of the Kyoto Protocol Mitigation and Adaptation Strategies for Global Change 11(1)33ndash43
Kurz W Dymond C White T Stinson G Shaw C Rampley G Smyth C Simpson B Neilson E Trofymow J Metsaranta J Apps M 2009 CBM-CFS3 A model of carbon-dynamics in forestry and land-use change implementing IPCC standards Ecological Modelling 220(4)480ndash504
Kurz W Shaw C Boisvenue C Stinson G Metsaranta J Leckie D Dyk A Smyth C Neilson E 2013 Carbon in Canadarsquos boreal forest A synthesis Environmental Reviews 21260ndash292
Canadian Forest Service | Pacific Forestry Centre | nrcangccaforestsresearch-centrespfc1348922
Leckie D Dyk A Ortlepp S Tinis S 2010 Records of decision for Canadarsquos national deforestation estimate 2011 Natu-ral Resources Canada Canadian Forest Service Pacific Forestry Centre Victoria BC Report DRS-N-029
Leckie D Dyk A Paradine D Tammadge D Tinis S 2012 Deforestation interpretation guide Natural Resources Canada Canadian Forest Service Pacific Forestry Centre Victoria BC Report DRS-M-030
Leckie D Dyk A Tinis S 12009 Records of decision for Canadarsquos national deforestation estimate Natural Resources Canada Canadian Forest Service Pacific Forestry Centre Victoria BC Report DRS-N-026
Leckie D Paradine D Burt W 2006a Mapping sample coverage for Canadarsquos national deforestation estimate 2006 Natural Resources Canada Canadian Forest Service Pacific Forestry Centre Victoria BC Report DRS-N-002
Leckie D Paradine D Tinis S 2006b Geographic strata for Canadarsquos national deforestation estimates report Natural Resources Canada Canadian Forest Service Pacific Forestry Centre Victoria BC Report DRS-Q-003
Leckie D Paradine D Kurz W Magnussen S [2015] Deforestation mapping sampling designs for Canadian land-scapes Natural Resources Canada Canadian Forest Service Victoria BC In review
Lempriegravere T Kurz W Hogg E Schmoll C Rampley G Yemshanov D et al 2013 Canadian boreal forests and climate change mitigation Environmental Reviews 21(4)293ndash321
Le Queacutereacute C Peters G Andres R Andrew R Boden T et al 2014 Global carbon budget 2013 Earth System Science Data 6689ndash760
Masek J Cohen W Leckie D Wulder M Vargas R de Jong B Healey S Law B Birdsey R Houghton R Mildrexler D Goward S Smith W 2011 Recent rates of forest harvest and conversion in North America Journal of Geophysical Research 116G00K03
McGovern M 2008 Reporting zones GHG spatial reporting structure for Canada 2008 Environment Canada Greenhouse Gas Division Ottawa Ontario
Montreal Process 2009 Criteria and indicators for the conservation and sustainable management of temperate and boreal forests Fourth edition httpwwwmontrealprocessorgdocumentspublicationsgeneral2009p_4pdf (Accessed January 2015)
Pan Y Birdsey RA Fang J et al 2011 A large and persistent carbon sink in the Worldrsquos forests Science 333988ndash993
Paradine D 2007 National Inventory Report 2008 ACCESS database description GIS processing description and consoli-dated GIS database description Natural Resources Canada Canadian Forest Service Pacific Forestry Centre Victoria BC Report DRS-N-019
United Nations Framework Convention on Climate Change 2002 Conference of the PartiesndashReport of the Confer-ence of the Parties on its seventh session held at Marrakesh from 29 October to 10 November 2001 United Nations Office Geneva Switzerland httpunfcccintresourcedocscop713pdf (Accessed January 2015)
Wulder M Masek J Cohen W Loveland T Woodcock C 2012 Opening the archive How free data has enabled the science and monitoring promise of Landsat Remote Sensing of Environment 1222ndash10
Canadarsquos National Deforestation Monitoring System System DescriptionInformation Report BC-X-439
23
Appendix 1 Pretype Forest Conditions
The tables below list the approved forest type density and maturity values applied in deforestation mapping Note not all combinations are valid particularly those that include recent disturbance and regeneration terms Table A11 lists the ac-ceptable parameter combinations
The most common pretype groupings found are the 36 combinations of three Type classes (B C and M) three Density classes (D O and S) and four Maturity classes (R Y I and M) The two older Maturity classes (O and G) require additional verification to identify them Several classes identify recently disturbed forests (K X and R)
Table A11 Pre-change forest type descriptors
TYPE Definition Restrictions of use
B Broadleaf gt 75 of trees are broadleaf (Angiospermae)
C Conifer gt 75 of trees are conifer (Coniferae)
M Mixed gt 25 of both broadleaf and conifer present
K Clearcut Exposed ground and (or) ground vegetation No visible regeneration
Use only with S or N density and Q maturity
X Burn Exposed ground and (or) ground vegetation No visible regen-eration May have live residual trees up to 25 crown closure
Use only with S or N density and Q maturity
R Regen Regenerating areas with lt 25 crown closure where the forest composition (B C or M) is not identifiable
Table A12 Pre-change forest density descriptors
DENSITY Definition Restrictions of use
D Dense gt 60 crown closure
O Open 25ndash60 crown closure
S Sparse 5ndash25 crown closure
N Nil lt 5 crown closure Use only with K and X pretype
Table A13 Pre-change forest maturity descriptors-
MATURITY Definition Restrictions of use
Q Recent disturbance No visible regeneration Use only with K and X pretype
R Regen Forest stands 0ndash14 years old
Y Young Forest stands 15ndash25 years old
I Immature Forest stands 26ndash40 years old
M Mature Forest stands 41ndash80 years old
O Old Forest stands 81ndash200 years old
G Old-growth Forest stands over 200 years old Restricted to British Columbia only
Canadian Forest Service | Pacific Forestry Centre | nrcangccaforestsresearch-centrespfc1348924
Table A14 Valid combinations of pretype attributes (TypendashDensityndashMaturity)
Regen Broadleaf Mixed Coniferous
Dense RDR BDR MDR CDR
BDY MDY CDY
BDI MDI CDI
BDM MDM CDM
BDO MDO CDO
CDG
Open ROR BOR MOR COR
BOY MOY COY
BOI MOI COI
BOM MOM COM
BOO MOO COO
COG
Sparse RSR BSR MSR CSR
BSY MSY CSY
BSI MSI CSI
BSM MSM CSM
BSO MSO CSO
CSG
Burn Clearcut
Regen Broadleaf Mixed Coniferous
Disturbed XSQ KSQ
XNQ KNQ
Canadarsquos National Deforestation Monitoring System System DescriptionInformation Report BC-X-439
25
Appendix 2 Post-class Modifiers by Industrial Category
Table A21 lists all land use post-class deforestation modifiers They provide additional detail regarding what has occurred on the ground for each deforestation event These classes can be assigned to various industrial classes (see Table A22) Detailed definitions are provided in the Deforestation Interpretation Guide (Leckie et al 2012)
Table A21 Post class and post-class modifier codes and short descriptions grouped by industrial categorysector (in bold)
Post class Post class modifier
Agriculture
AG Agriculture ab bare
cp crop
fy farm yard
pa pasture
AL Artificial Lake aa agriculture pond
ea agriculture effluent pond
OF Open Field fa agriculture setting
Flooded Standing Forest
AL Artificial Lake ff flooded standing forest
Forestry
RD Road mf mainline forestry road
sf secondary forestry road
xf tertiary forestry road with width ge 20 m
SD Soil Disturbance ld logging landing
ss rock slide scar
Hydro Infrastructure
CR Corridor hm hydro linendashmain
hs hydro linendashsecondary
xy hydro linendashtertiary ge 20 m
IN Industrial ih hydro infrastructure
Hydro Reservoir
AL Artificial Lake hr hydroelectric flooding
Industry
AL Artificial Lake ei industrial effluent pond
IN Industrial hi heavy industrial
li light industrial
OF Open Field fi industrial
Canadian Forest Service | Pacific Forestry Centre | nrcangccaforestsresearch-centrespfc1348926
Post class Post class modifier
Mining
AL Artificial Lake em waste ponds for mining
IN Industrial mh mine heavy
ml mine light
OF Open Field fk mine facility
fm mine
fq pit and quarry
SD Soil Disturbance mn open pit mine
pq gravel pitquarry
Municipal
AL Artificial Lake ad pond urban setting
ar pond rural residential
ul other human caused
CR Corridor cl cut line
cu undifferentiated
OF Open Field fd urbansuburban
fr rural residential
uf undifferentiated field
RR Rural Residential rf few trees remaining
rm many trees remaining
SD Soil Disturbance lf landfill
su undifferentiated
UR Urban Residential df few trees remaining
dm many trees remaining
Oil and Gas
CR Corridor pp pipelinendashmain
ps pipelinendashsecondary
xp pipelinendashtertiary ge 20 m
IN Industrial oi oil sands industrial
op oil and gas industrial
wp well pad
OF Open Field fo oil and gas facility
fs oil sands open field
SD Soil Disturbance os oil sands
AL Artificial Lake eo oil and gas related pond
Canadarsquos National Deforestation Monitoring System System DescriptionInformation Report BC-X-439
27
Post class Post class modifier
Peat Mining
SD Soil Disturbance pm peat extraction
Recreation
AL Artificial Lake af golf course related
ap recreational water body
OF Open Field fc recreational field
RC Recreational ca campground
go golf course
ru other or undifferentiated
sk ski areas
Transportation
CR Corridor as airstrip
ry railway
RD Road mm main road clearly for a mine
mr main road
mo main road clearly for oil and gas
my main road clearly for hydroelectric
sm secondary mining road
so secondary oil and gas road
sr secondary road
sy secondary hydroelectric road
xm tertiary mining road with width ge 20 m
xo tertiary oil and gas road with width ge 20 m
xr tertiary road with width ge 20 m
xy tertiary hydroelectric road with width ge 20 m
Canadian Forest Service | Pacific Forestry Centre | nrcangccaforestsresearch-centrespfc1348928
Table A22 Aggregation of deforestation mapping classes to good practice guidance and industrial categories
Good practice guidance class
Crop-land (CL)
Wetlands (WL) Settlements (SL)
Industrial Categories
Agric
ultu
re
Floo
ded
stan
ding
fore
st
Hyd
ro re
serv
oir
Peat
min
ing
Fore
stry
Hyd
ro in
fras
truc
ture
Indu
stry
Min
ing
Mun
icip
al
Oil
and
gas
Recr
eatio
n
Tran
spor
tatio
n
Def
ores
tatio
n po
st c
lass
Agriculture AG ab cp pa fy
Artificial Lake AL aa ea ff hr ei emad ar of ul eo af ap
Corridor CR hm hs xy cl cu
pp ps xp as ry
Industrial IN ih hi li mh mloi op wp
Open Field OF fa fi fk fm fq fd fr uf fo fs fc
Recreational RC ca go fu sk
Road RDmf sf xf
mm mo mr my sm so sr sy xm
xo xr xy
Rural Residential RR rf rm
Soil Disturbance SD pm ld ss mn pq lf su os
Urban Residential UR df dm
Canadarsquos National Deforestation Monitoring System System DescriptionInformation Report BC-X-439
29
Appendix 3 Deforestation Strata Units and Reconciliation Unit InclusionTable A31 shows the names of the deforestation strata their area in kilohectares and the percentage of that area contained in each reconciliation unit that they overlap (sorted by reconciliation unit identification number see Figure 1 for unit loca-tion and name)
Table A31 Area of strata units and percent of strata unit area that is in each reconciliation unit
Deforestation strata unit name Strata unit area (kilohectares)
Reconciliation unit ( inclusion)
Newfoundland Eastern Woodlot 4 477 1 (100)
Newfoundland Forest Activity Zone 6 512 1 (100)
Newfoundland St Johns 55 1 (100)
Labrador Arctic 1 893 2 (100)
Labrador Northern Forest 23 238 3 (98) 4 (2)
Labrador Forest Activity Zone 4 620 4 (100)
Nova Scotia Eastern Woodlot 2 894 5 (100)
Nova Scotia Forest Activity Zone 2 396 5 (100)
Nova Scotia HalifaxDartmouth 182 5 (100)
Prince Edward Island 577 6 (100)
New Brunswick Eastern Woodlot 4 121 7 (100)
New Brunswick Forest Activity Zone 3 174 7 (100)
Quebec Arctic 20 443 10 (75) 9 (18) 8 (7)
Quebec Eastern Townships 3 948 11 (100)
Quebec Gaspe Forest Activity Zone 2 740 11 (100)
Quebec Southern RU12 2 968 12 (100)
Quebec Northern Forest 72 759 14 (73)15 (22) 13(5)
Quebec Forest Activity Zone 44 717 15 (100)
Quebec Ile DAnticosti 795 15 (100)
Quebec Lac St Jean 964 15 (100)
Quebec Southern RU15 1 687 15 (100)
Ontario Thunder Bay 225 16(100)
Ontario Southern 8 198 17 (100)
Ontario Manitoulin Island 326 17 (100)
Ontario Northern Forest 46 468 18 (56) 16 (43) 19 (1)
Ontario SudburyNorth Bay 874 19 (100)
Ontario Forest Activity Zone 42 398 19 (56) 16 (43) 18 (1)
Ontario Sault Ste Marie 536 19 (92) 17 (8)
Manitoba Forest Activity Zone RU22 East 2 405 22 (100)
Manitoba Forest Activity Zone RU22 North 6 109 22 (100)
Manitoba Prairie Fringe RU22 804 22 (100)
Manitoba Northern Forest 37 339 22 (43) 21 (35) 25 (19) 23 (3)
Manitoba Forest Activity Zone RU23 7 382 23 (100)
Manitoba Prairie Fringe RU23 3 970 23 (100)
Manitoba Hotspot 851 24 (100)
Manitoba North Prairie 6 117 24 (100)
Canadian Forest Service | Pacific Forestry Centre | nrcangccaforestsresearch-centrespfc1348930
Deforestation strata unit name Strata unit area (kilohectares)
Reconciliation unit ( inclusion)
Saskatchewan Northern Forest 21 224 27 (75) 26 (22) 28 (3)
Saskatchewan Prairie Fringe 5 509 28 (100)
Saskatchewan Inactive Forest Activity Zone 6 196 28 (58) 27 (42)
Saskatchewan Forest Activity Zone 8 189 28 (99) 27 (1)
Saskatchewan North Prairie 8 167 29 (100)
Saskatchewan Prairie 15 921 30 (100)
Alberta Northern Forest 10 862 31 (58) 34 (28) 32 (8) 33 (6)
Alberta Forest Activity Zone 22 066 34 (100)
Alberta Fort McMurray 807 34 (100)
Alberta High Level 789 34 (100)
Alberta Northwest Fringe 5 436 34 (100)
Alberta Prairie Fringe 6 038 34 (100)
Alberta North Prairie 7 397 35 (100)
Alberta RU 36 Forest Activity Zone 4 764 36 (100)
Alberta Palliser Triangle 3 689 37 (100)
Alberta Prairie West 4 522 37 (100)
British Columbia RU 38 6 759 38 (100)
British Columbia Prairie Fringe 2 333 39 (100)
British Columbia RU 40 19 220 40 (100)
British Columbia Lower Mainland East Vancouver Island
1 142 41 (100)
British Columbia RU 41 Forest Activity Zone 15 440 41 (100)
British Columbia VI QCI 3 813 41 (100)
British Columbia Okanagan 1 109 42 (100)
British Columbia Prince George 464 42 (100)
British Columbia RU 42 Forest Activity Zone 44 286 42 (96) 39 (4)
Yukon Arctic 496 43 (100)
Yukon Northern Forest 19 987 45 (91) 44 (9)
Yukon Whitehorse 417 46 (100)
Yukon Forest Activity Zone 27 440 46 (98) 47 (1)
Northwest Territories Arctic 42 788 48 (49) 49 (43) 50 (7)
Northwest Territories Northern Forest 91 972 50 (52) 51 (37) 53 (9) 52 (2)
Northwest Territories Yellowknife 176 51 (100)
Northwest Territories Forest Activity Zone 467 54 (100)
Nunavut Arctic 198 915 56 (64) 57 (25) 55 (11)
Nunavut Northern Forest 9 892 58 (100)
nrcangccaforests
For more information about the Canadian Forest Service visit our website at nrcangccaforests or contact any of the following Canadian Forest Service establishments
Canadian Forest Service Contacts
Atlantic Forestry Centre PO Box 4000 Fredericton NB E3B 5P7 Tel (506) 452-3500 Fax (506) 452-3525 nrcangccaforestsresearch-centresafc13447
Atlantic Forestry Centre ndash District Office Sir Wilfred Grenfell College Forestry Centre University Drive Corner Brook NF A2H 6P9 Tel (709) 637-4900 Fax (709) 637-4910
Laurentian Forestry Centre 1055 rue du PEPS PO Box 3800 Sainte-Foy PQ G1V 4C7 Tel (418) 648-5788 Fax (418) 648-5849 nrcangccaforestsresearch-centreslfc13473
Great Lakes Forestry Centre PO Box 490 1219 Queen St East Sault Ste Marie ON P6A 5M7 Tel (705) 949-9461 Fax (705) 759-5700 nrcangccaforestsresearch-centresglfc13459
Northern Forestry Centre 5320-122nd Street Edmonton AB T6H 3S5 Tel (403) 435-7210 Fax (403) 435-7359 nrcangccaforestsresearch-centresnofc13485
Pacific Forestry Centre 506 West Burnside Road Victoria BC V8Z 1M5 Tel (250) 363-0600 Fax (250) 363-0775 nrcangccaforestsresearch-centrespfc13489
Headquarters 580 Booth St 8th Fl Ottawa ON K1A 0E4 Tel (613) 947-7341 Fax (613) 947-7396
Canadian Wood Fibre Centre A virtual research centre of the Canadian Forest Service Natural Resources Canada nrcangccaforestsresearch-centrescwfc13457
1
2
3
5
6
4
1
25
3 6
4
1
To order publications online visit the Canadian Forest Service Publications website at
cfsnrcangccapublications

Canadarsquos National Deforestation Monitoring System System DescriptionInformation Report BC-X-439
21
7 References
Burt W Paradine D Leckie D 2006 Geographic Information system processing of deforestation mapping data for estimating deforested area of Canada Natural Resources Canada Canadian Forest Service Pacific Forestry Centre Victoria BC Report DRS-P-001
Dyk A Tinis S Leckie D 2011 National Inventory Report 2011 Deforestation area estimation for Canada Quality con-trol overview Natural Resources Canada Canadian Forest Service Pacific Forestry Centre Victoria BC Report DRS-N-031
Ecological Stratification Working Group 1996 A national ecological framework for Canada Agriculture and Agri-Foods Canada Research Branch Centre for land and Biological Resources Research and Environment Canada State of the Environ-ment Directorate Ottawa Ont
Environment Canada 2006 National Inventory Report 1990ndash2004 Greenhouse gas sources and sinks in Canada Govern-ment of Canada Submission to the UN Framework Convention on Climate Change httpunfcccintnational_reportsannex_i_ghg_inventoriesnational_inventories_submissionsitems3734php (Accessed August 2014)
Environment Canada 2014 National Inventory Report 1990ndash2012 Greenhouse gas sources and sinks in Canada Govern-ment of Canada Submission to the UN Framework Convention on Climate Change Report issued by Pollutant Inventories and Reporting Division Environment Canada Ottawa Onthttpunfcccintnational_reportsannex_i_ghg_inventoriesnational_inventories_submissionsitems8108php (Accessed August 2014)
Food and Agriculture Organization 2006 2001 Global forest resources assessment 2000 main report United Nations Food and Agriculture Organization Rome Italy FAO Forestry Paper 140
Gillis M Omule A Brierley T 2005 Monitoring Canadarsquos forests The National Forest Inventory Forestry Chronicle 81(2)214ndash221
Intergovernmental Panel on Climate Change 2003 Good practice guidance for land use land-use change and forestry Penman J Gytarsky M Hiraishiet T et al (eds) Institute for Global Environmental Strategies Hayama Japan
Intergovernmental Panel on Climate Change 2006 2006 IPCC guidelines for national greenhouse gas inventories Egg-leston HS Buendia L Miwa K Ngara T Tanabe K (eds) Intergovernmental Panel on Climate Change National Green-house Gas Inventories Programme Institute for Global Environmental Strategies Hayama Japan httpwwwipcc-nggipigesorjppublic2006gl (Accessed January 2015)
Kurz W 2010 An ecosystem context for global forest cover loss estimates Proceedings National Academy of Sciences 107(20)9025ndash9026
Kurz W Apps M 2006 Developing Canadarsquos national forest carbon monitoring accounting and reporting system to meet the reporting requirements of the Kyoto Protocol Mitigation and Adaptation Strategies for Global Change 11(1)33ndash43
Kurz W Dymond C White T Stinson G Shaw C Rampley G Smyth C Simpson B Neilson E Trofymow J Metsaranta J Apps M 2009 CBM-CFS3 A model of carbon-dynamics in forestry and land-use change implementing IPCC standards Ecological Modelling 220(4)480ndash504
Kurz W Shaw C Boisvenue C Stinson G Metsaranta J Leckie D Dyk A Smyth C Neilson E 2013 Carbon in Canadarsquos boreal forest A synthesis Environmental Reviews 21260ndash292
Canadian Forest Service | Pacific Forestry Centre | nrcangccaforestsresearch-centrespfc1348922
Leckie D Dyk A Ortlepp S Tinis S 2010 Records of decision for Canadarsquos national deforestation estimate 2011 Natu-ral Resources Canada Canadian Forest Service Pacific Forestry Centre Victoria BC Report DRS-N-029
Leckie D Dyk A Paradine D Tammadge D Tinis S 2012 Deforestation interpretation guide Natural Resources Canada Canadian Forest Service Pacific Forestry Centre Victoria BC Report DRS-M-030
Leckie D Dyk A Tinis S 12009 Records of decision for Canadarsquos national deforestation estimate Natural Resources Canada Canadian Forest Service Pacific Forestry Centre Victoria BC Report DRS-N-026
Leckie D Paradine D Burt W 2006a Mapping sample coverage for Canadarsquos national deforestation estimate 2006 Natural Resources Canada Canadian Forest Service Pacific Forestry Centre Victoria BC Report DRS-N-002
Leckie D Paradine D Tinis S 2006b Geographic strata for Canadarsquos national deforestation estimates report Natural Resources Canada Canadian Forest Service Pacific Forestry Centre Victoria BC Report DRS-Q-003
Leckie D Paradine D Kurz W Magnussen S [2015] Deforestation mapping sampling designs for Canadian land-scapes Natural Resources Canada Canadian Forest Service Victoria BC In review
Lempriegravere T Kurz W Hogg E Schmoll C Rampley G Yemshanov D et al 2013 Canadian boreal forests and climate change mitigation Environmental Reviews 21(4)293ndash321
Le Queacutereacute C Peters G Andres R Andrew R Boden T et al 2014 Global carbon budget 2013 Earth System Science Data 6689ndash760
Masek J Cohen W Leckie D Wulder M Vargas R de Jong B Healey S Law B Birdsey R Houghton R Mildrexler D Goward S Smith W 2011 Recent rates of forest harvest and conversion in North America Journal of Geophysical Research 116G00K03
McGovern M 2008 Reporting zones GHG spatial reporting structure for Canada 2008 Environment Canada Greenhouse Gas Division Ottawa Ontario
Montreal Process 2009 Criteria and indicators for the conservation and sustainable management of temperate and boreal forests Fourth edition httpwwwmontrealprocessorgdocumentspublicationsgeneral2009p_4pdf (Accessed January 2015)
Pan Y Birdsey RA Fang J et al 2011 A large and persistent carbon sink in the Worldrsquos forests Science 333988ndash993
Paradine D 2007 National Inventory Report 2008 ACCESS database description GIS processing description and consoli-dated GIS database description Natural Resources Canada Canadian Forest Service Pacific Forestry Centre Victoria BC Report DRS-N-019
United Nations Framework Convention on Climate Change 2002 Conference of the PartiesndashReport of the Confer-ence of the Parties on its seventh session held at Marrakesh from 29 October to 10 November 2001 United Nations Office Geneva Switzerland httpunfcccintresourcedocscop713pdf (Accessed January 2015)
Wulder M Masek J Cohen W Loveland T Woodcock C 2012 Opening the archive How free data has enabled the science and monitoring promise of Landsat Remote Sensing of Environment 1222ndash10
Canadarsquos National Deforestation Monitoring System System DescriptionInformation Report BC-X-439
23
Appendix 1 Pretype Forest Conditions
The tables below list the approved forest type density and maturity values applied in deforestation mapping Note not all combinations are valid particularly those that include recent disturbance and regeneration terms Table A11 lists the ac-ceptable parameter combinations
The most common pretype groupings found are the 36 combinations of three Type classes (B C and M) three Density classes (D O and S) and four Maturity classes (R Y I and M) The two older Maturity classes (O and G) require additional verification to identify them Several classes identify recently disturbed forests (K X and R)
Table A11 Pre-change forest type descriptors
TYPE Definition Restrictions of use
B Broadleaf gt 75 of trees are broadleaf (Angiospermae)
C Conifer gt 75 of trees are conifer (Coniferae)
M Mixed gt 25 of both broadleaf and conifer present
K Clearcut Exposed ground and (or) ground vegetation No visible regeneration
Use only with S or N density and Q maturity
X Burn Exposed ground and (or) ground vegetation No visible regen-eration May have live residual trees up to 25 crown closure
Use only with S or N density and Q maturity
R Regen Regenerating areas with lt 25 crown closure where the forest composition (B C or M) is not identifiable
Table A12 Pre-change forest density descriptors
DENSITY Definition Restrictions of use
D Dense gt 60 crown closure
O Open 25ndash60 crown closure
S Sparse 5ndash25 crown closure
N Nil lt 5 crown closure Use only with K and X pretype
Table A13 Pre-change forest maturity descriptors-
MATURITY Definition Restrictions of use
Q Recent disturbance No visible regeneration Use only with K and X pretype
R Regen Forest stands 0ndash14 years old
Y Young Forest stands 15ndash25 years old
I Immature Forest stands 26ndash40 years old
M Mature Forest stands 41ndash80 years old
O Old Forest stands 81ndash200 years old
G Old-growth Forest stands over 200 years old Restricted to British Columbia only
Canadian Forest Service | Pacific Forestry Centre | nrcangccaforestsresearch-centrespfc1348924
Table A14 Valid combinations of pretype attributes (TypendashDensityndashMaturity)
Regen Broadleaf Mixed Coniferous
Dense RDR BDR MDR CDR
BDY MDY CDY
BDI MDI CDI
BDM MDM CDM
BDO MDO CDO
CDG
Open ROR BOR MOR COR
BOY MOY COY
BOI MOI COI
BOM MOM COM
BOO MOO COO
COG
Sparse RSR BSR MSR CSR
BSY MSY CSY
BSI MSI CSI
BSM MSM CSM
BSO MSO CSO
CSG
Burn Clearcut
Regen Broadleaf Mixed Coniferous
Disturbed XSQ KSQ
XNQ KNQ
Canadarsquos National Deforestation Monitoring System System DescriptionInformation Report BC-X-439
25
Appendix 2 Post-class Modifiers by Industrial Category
Table A21 lists all land use post-class deforestation modifiers They provide additional detail regarding what has occurred on the ground for each deforestation event These classes can be assigned to various industrial classes (see Table A22) Detailed definitions are provided in the Deforestation Interpretation Guide (Leckie et al 2012)
Table A21 Post class and post-class modifier codes and short descriptions grouped by industrial categorysector (in bold)
Post class Post class modifier
Agriculture
AG Agriculture ab bare
cp crop
fy farm yard
pa pasture
AL Artificial Lake aa agriculture pond
ea agriculture effluent pond
OF Open Field fa agriculture setting
Flooded Standing Forest
AL Artificial Lake ff flooded standing forest
Forestry
RD Road mf mainline forestry road
sf secondary forestry road
xf tertiary forestry road with width ge 20 m
SD Soil Disturbance ld logging landing
ss rock slide scar
Hydro Infrastructure
CR Corridor hm hydro linendashmain
hs hydro linendashsecondary
xy hydro linendashtertiary ge 20 m
IN Industrial ih hydro infrastructure
Hydro Reservoir
AL Artificial Lake hr hydroelectric flooding
Industry
AL Artificial Lake ei industrial effluent pond
IN Industrial hi heavy industrial
li light industrial
OF Open Field fi industrial
Canadian Forest Service | Pacific Forestry Centre | nrcangccaforestsresearch-centrespfc1348926
Post class Post class modifier
Mining
AL Artificial Lake em waste ponds for mining
IN Industrial mh mine heavy
ml mine light
OF Open Field fk mine facility
fm mine
fq pit and quarry
SD Soil Disturbance mn open pit mine
pq gravel pitquarry
Municipal
AL Artificial Lake ad pond urban setting
ar pond rural residential
ul other human caused
CR Corridor cl cut line
cu undifferentiated
OF Open Field fd urbansuburban
fr rural residential
uf undifferentiated field
RR Rural Residential rf few trees remaining
rm many trees remaining
SD Soil Disturbance lf landfill
su undifferentiated
UR Urban Residential df few trees remaining
dm many trees remaining
Oil and Gas
CR Corridor pp pipelinendashmain
ps pipelinendashsecondary
xp pipelinendashtertiary ge 20 m
IN Industrial oi oil sands industrial
op oil and gas industrial
wp well pad
OF Open Field fo oil and gas facility
fs oil sands open field
SD Soil Disturbance os oil sands
AL Artificial Lake eo oil and gas related pond
Canadarsquos National Deforestation Monitoring System System DescriptionInformation Report BC-X-439
27
Post class Post class modifier
Peat Mining
SD Soil Disturbance pm peat extraction
Recreation
AL Artificial Lake af golf course related
ap recreational water body
OF Open Field fc recreational field
RC Recreational ca campground
go golf course
ru other or undifferentiated
sk ski areas
Transportation
CR Corridor as airstrip
ry railway
RD Road mm main road clearly for a mine
mr main road
mo main road clearly for oil and gas
my main road clearly for hydroelectric
sm secondary mining road
so secondary oil and gas road
sr secondary road
sy secondary hydroelectric road
xm tertiary mining road with width ge 20 m
xo tertiary oil and gas road with width ge 20 m
xr tertiary road with width ge 20 m
xy tertiary hydroelectric road with width ge 20 m
Canadian Forest Service | Pacific Forestry Centre | nrcangccaforestsresearch-centrespfc1348928
Table A22 Aggregation of deforestation mapping classes to good practice guidance and industrial categories
Good practice guidance class
Crop-land (CL)
Wetlands (WL) Settlements (SL)
Industrial Categories
Agric
ultu
re
Floo
ded
stan
ding
fore
st
Hyd
ro re
serv
oir
Peat
min
ing
Fore
stry
Hyd
ro in
fras
truc
ture
Indu
stry
Min
ing
Mun
icip
al
Oil
and
gas
Recr
eatio
n
Tran
spor
tatio
n
Def
ores
tatio
n po
st c
lass
Agriculture AG ab cp pa fy
Artificial Lake AL aa ea ff hr ei emad ar of ul eo af ap
Corridor CR hm hs xy cl cu
pp ps xp as ry
Industrial IN ih hi li mh mloi op wp
Open Field OF fa fi fk fm fq fd fr uf fo fs fc
Recreational RC ca go fu sk
Road RDmf sf xf
mm mo mr my sm so sr sy xm
xo xr xy
Rural Residential RR rf rm
Soil Disturbance SD pm ld ss mn pq lf su os
Urban Residential UR df dm
Canadarsquos National Deforestation Monitoring System System DescriptionInformation Report BC-X-439
29
Appendix 3 Deforestation Strata Units and Reconciliation Unit InclusionTable A31 shows the names of the deforestation strata their area in kilohectares and the percentage of that area contained in each reconciliation unit that they overlap (sorted by reconciliation unit identification number see Figure 1 for unit loca-tion and name)
Table A31 Area of strata units and percent of strata unit area that is in each reconciliation unit
Deforestation strata unit name Strata unit area (kilohectares)
Reconciliation unit ( inclusion)
Newfoundland Eastern Woodlot 4 477 1 (100)
Newfoundland Forest Activity Zone 6 512 1 (100)
Newfoundland St Johns 55 1 (100)
Labrador Arctic 1 893 2 (100)
Labrador Northern Forest 23 238 3 (98) 4 (2)
Labrador Forest Activity Zone 4 620 4 (100)
Nova Scotia Eastern Woodlot 2 894 5 (100)
Nova Scotia Forest Activity Zone 2 396 5 (100)
Nova Scotia HalifaxDartmouth 182 5 (100)
Prince Edward Island 577 6 (100)
New Brunswick Eastern Woodlot 4 121 7 (100)
New Brunswick Forest Activity Zone 3 174 7 (100)
Quebec Arctic 20 443 10 (75) 9 (18) 8 (7)
Quebec Eastern Townships 3 948 11 (100)
Quebec Gaspe Forest Activity Zone 2 740 11 (100)
Quebec Southern RU12 2 968 12 (100)
Quebec Northern Forest 72 759 14 (73)15 (22) 13(5)
Quebec Forest Activity Zone 44 717 15 (100)
Quebec Ile DAnticosti 795 15 (100)
Quebec Lac St Jean 964 15 (100)
Quebec Southern RU15 1 687 15 (100)
Ontario Thunder Bay 225 16(100)
Ontario Southern 8 198 17 (100)
Ontario Manitoulin Island 326 17 (100)
Ontario Northern Forest 46 468 18 (56) 16 (43) 19 (1)
Ontario SudburyNorth Bay 874 19 (100)
Ontario Forest Activity Zone 42 398 19 (56) 16 (43) 18 (1)
Ontario Sault Ste Marie 536 19 (92) 17 (8)
Manitoba Forest Activity Zone RU22 East 2 405 22 (100)
Manitoba Forest Activity Zone RU22 North 6 109 22 (100)
Manitoba Prairie Fringe RU22 804 22 (100)
Manitoba Northern Forest 37 339 22 (43) 21 (35) 25 (19) 23 (3)
Manitoba Forest Activity Zone RU23 7 382 23 (100)
Manitoba Prairie Fringe RU23 3 970 23 (100)
Manitoba Hotspot 851 24 (100)
Manitoba North Prairie 6 117 24 (100)
Canadian Forest Service | Pacific Forestry Centre | nrcangccaforestsresearch-centrespfc1348930
Deforestation strata unit name Strata unit area (kilohectares)
Reconciliation unit ( inclusion)
Saskatchewan Northern Forest 21 224 27 (75) 26 (22) 28 (3)
Saskatchewan Prairie Fringe 5 509 28 (100)
Saskatchewan Inactive Forest Activity Zone 6 196 28 (58) 27 (42)
Saskatchewan Forest Activity Zone 8 189 28 (99) 27 (1)
Saskatchewan North Prairie 8 167 29 (100)
Saskatchewan Prairie 15 921 30 (100)
Alberta Northern Forest 10 862 31 (58) 34 (28) 32 (8) 33 (6)
Alberta Forest Activity Zone 22 066 34 (100)
Alberta Fort McMurray 807 34 (100)
Alberta High Level 789 34 (100)
Alberta Northwest Fringe 5 436 34 (100)
Alberta Prairie Fringe 6 038 34 (100)
Alberta North Prairie 7 397 35 (100)
Alberta RU 36 Forest Activity Zone 4 764 36 (100)
Alberta Palliser Triangle 3 689 37 (100)
Alberta Prairie West 4 522 37 (100)
British Columbia RU 38 6 759 38 (100)
British Columbia Prairie Fringe 2 333 39 (100)
British Columbia RU 40 19 220 40 (100)
British Columbia Lower Mainland East Vancouver Island
1 142 41 (100)
British Columbia RU 41 Forest Activity Zone 15 440 41 (100)
British Columbia VI QCI 3 813 41 (100)
British Columbia Okanagan 1 109 42 (100)
British Columbia Prince George 464 42 (100)
British Columbia RU 42 Forest Activity Zone 44 286 42 (96) 39 (4)
Yukon Arctic 496 43 (100)
Yukon Northern Forest 19 987 45 (91) 44 (9)
Yukon Whitehorse 417 46 (100)
Yukon Forest Activity Zone 27 440 46 (98) 47 (1)
Northwest Territories Arctic 42 788 48 (49) 49 (43) 50 (7)
Northwest Territories Northern Forest 91 972 50 (52) 51 (37) 53 (9) 52 (2)
Northwest Territories Yellowknife 176 51 (100)
Northwest Territories Forest Activity Zone 467 54 (100)
Nunavut Arctic 198 915 56 (64) 57 (25) 55 (11)
Nunavut Northern Forest 9 892 58 (100)
nrcangccaforests
For more information about the Canadian Forest Service visit our website at nrcangccaforests or contact any of the following Canadian Forest Service establishments
Canadian Forest Service Contacts
Atlantic Forestry Centre PO Box 4000 Fredericton NB E3B 5P7 Tel (506) 452-3500 Fax (506) 452-3525 nrcangccaforestsresearch-centresafc13447
Atlantic Forestry Centre ndash District Office Sir Wilfred Grenfell College Forestry Centre University Drive Corner Brook NF A2H 6P9 Tel (709) 637-4900 Fax (709) 637-4910
Laurentian Forestry Centre 1055 rue du PEPS PO Box 3800 Sainte-Foy PQ G1V 4C7 Tel (418) 648-5788 Fax (418) 648-5849 nrcangccaforestsresearch-centreslfc13473
Great Lakes Forestry Centre PO Box 490 1219 Queen St East Sault Ste Marie ON P6A 5M7 Tel (705) 949-9461 Fax (705) 759-5700 nrcangccaforestsresearch-centresglfc13459
Northern Forestry Centre 5320-122nd Street Edmonton AB T6H 3S5 Tel (403) 435-7210 Fax (403) 435-7359 nrcangccaforestsresearch-centresnofc13485
Pacific Forestry Centre 506 West Burnside Road Victoria BC V8Z 1M5 Tel (250) 363-0600 Fax (250) 363-0775 nrcangccaforestsresearch-centrespfc13489
Headquarters 580 Booth St 8th Fl Ottawa ON K1A 0E4 Tel (613) 947-7341 Fax (613) 947-7396
Canadian Wood Fibre Centre A virtual research centre of the Canadian Forest Service Natural Resources Canada nrcangccaforestsresearch-centrescwfc13457
1
2
3
5
6
4
1
25
3 6
4
1
To order publications online visit the Canadian Forest Service Publications website at
cfsnrcangccapublications
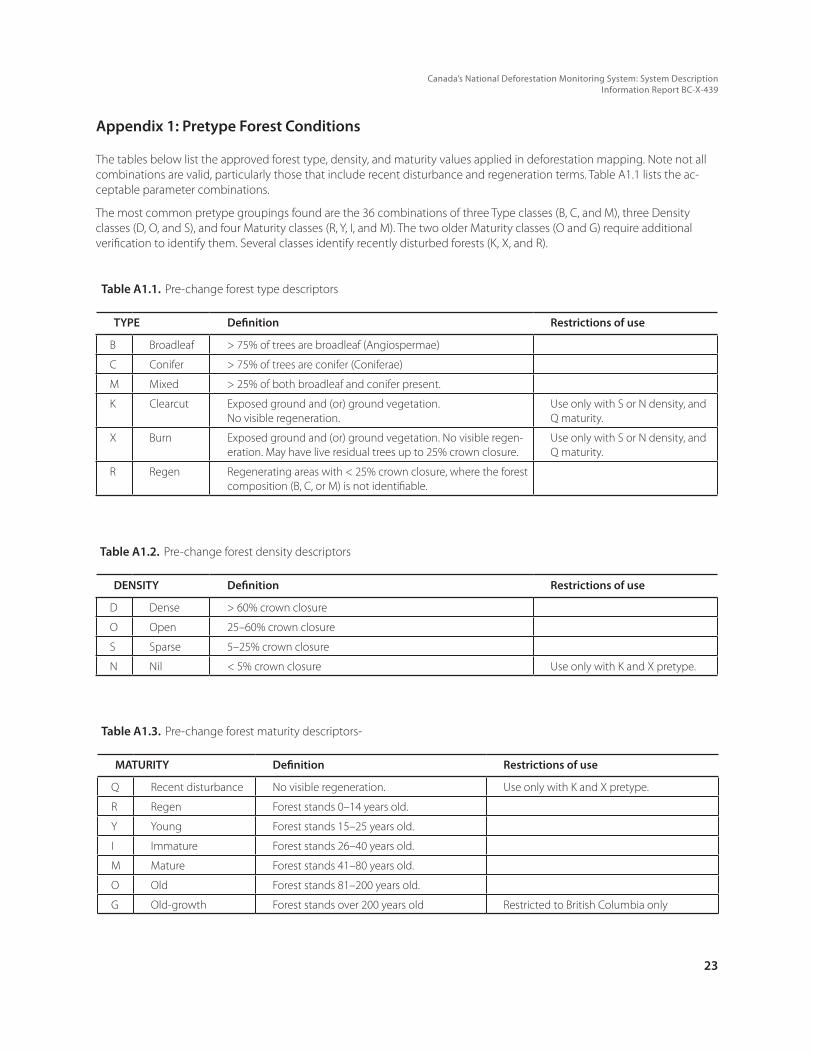
Canadarsquos National Deforestation Monitoring System System DescriptionInformation Report BC-X-439
23
Appendix 1 Pretype Forest Conditions
The tables below list the approved forest type density and maturity values applied in deforestation mapping Note not all combinations are valid particularly those that include recent disturbance and regeneration terms Table A11 lists the ac-ceptable parameter combinations
The most common pretype groupings found are the 36 combinations of three Type classes (B C and M) three Density classes (D O and S) and four Maturity classes (R Y I and M) The two older Maturity classes (O and G) require additional verification to identify them Several classes identify recently disturbed forests (K X and R)
Table A11 Pre-change forest type descriptors
TYPE Definition Restrictions of use
B Broadleaf gt 75 of trees are broadleaf (Angiospermae)
C Conifer gt 75 of trees are conifer (Coniferae)
M Mixed gt 25 of both broadleaf and conifer present
K Clearcut Exposed ground and (or) ground vegetation No visible regeneration
Use only with S or N density and Q maturity
X Burn Exposed ground and (or) ground vegetation No visible regen-eration May have live residual trees up to 25 crown closure
Use only with S or N density and Q maturity
R Regen Regenerating areas with lt 25 crown closure where the forest composition (B C or M) is not identifiable
Table A12 Pre-change forest density descriptors
DENSITY Definition Restrictions of use
D Dense gt 60 crown closure
O Open 25ndash60 crown closure
S Sparse 5ndash25 crown closure
N Nil lt 5 crown closure Use only with K and X pretype
Table A13 Pre-change forest maturity descriptors-
MATURITY Definition Restrictions of use
Q Recent disturbance No visible regeneration Use only with K and X pretype
R Regen Forest stands 0ndash14 years old
Y Young Forest stands 15ndash25 years old
I Immature Forest stands 26ndash40 years old
M Mature Forest stands 41ndash80 years old
O Old Forest stands 81ndash200 years old
G Old-growth Forest stands over 200 years old Restricted to British Columbia only
Canadian Forest Service | Pacific Forestry Centre | nrcangccaforestsresearch-centrespfc1348924
Table A14 Valid combinations of pretype attributes (TypendashDensityndashMaturity)
Regen Broadleaf Mixed Coniferous
Dense RDR BDR MDR CDR
BDY MDY CDY
BDI MDI CDI
BDM MDM CDM
BDO MDO CDO
CDG
Open ROR BOR MOR COR
BOY MOY COY
BOI MOI COI
BOM MOM COM
BOO MOO COO
COG
Sparse RSR BSR MSR CSR
BSY MSY CSY
BSI MSI CSI
BSM MSM CSM
BSO MSO CSO
CSG
Burn Clearcut
Regen Broadleaf Mixed Coniferous
Disturbed XSQ KSQ
XNQ KNQ
Canadarsquos National Deforestation Monitoring System System DescriptionInformation Report BC-X-439
25
Appendix 2 Post-class Modifiers by Industrial Category
Table A21 lists all land use post-class deforestation modifiers They provide additional detail regarding what has occurred on the ground for each deforestation event These classes can be assigned to various industrial classes (see Table A22) Detailed definitions are provided in the Deforestation Interpretation Guide (Leckie et al 2012)
Table A21 Post class and post-class modifier codes and short descriptions grouped by industrial categorysector (in bold)
Post class Post class modifier
Agriculture
AG Agriculture ab bare
cp crop
fy farm yard
pa pasture
AL Artificial Lake aa agriculture pond
ea agriculture effluent pond
OF Open Field fa agriculture setting
Flooded Standing Forest
AL Artificial Lake ff flooded standing forest
Forestry
RD Road mf mainline forestry road
sf secondary forestry road
xf tertiary forestry road with width ge 20 m
SD Soil Disturbance ld logging landing
ss rock slide scar
Hydro Infrastructure
CR Corridor hm hydro linendashmain
hs hydro linendashsecondary
xy hydro linendashtertiary ge 20 m
IN Industrial ih hydro infrastructure
Hydro Reservoir
AL Artificial Lake hr hydroelectric flooding
Industry
AL Artificial Lake ei industrial effluent pond
IN Industrial hi heavy industrial
li light industrial
OF Open Field fi industrial
Canadian Forest Service | Pacific Forestry Centre | nrcangccaforestsresearch-centrespfc1348926
Post class Post class modifier
Mining
AL Artificial Lake em waste ponds for mining
IN Industrial mh mine heavy
ml mine light
OF Open Field fk mine facility
fm mine
fq pit and quarry
SD Soil Disturbance mn open pit mine
pq gravel pitquarry
Municipal
AL Artificial Lake ad pond urban setting
ar pond rural residential
ul other human caused
CR Corridor cl cut line
cu undifferentiated
OF Open Field fd urbansuburban
fr rural residential
uf undifferentiated field
RR Rural Residential rf few trees remaining
rm many trees remaining
SD Soil Disturbance lf landfill
su undifferentiated
UR Urban Residential df few trees remaining
dm many trees remaining
Oil and Gas
CR Corridor pp pipelinendashmain
ps pipelinendashsecondary
xp pipelinendashtertiary ge 20 m
IN Industrial oi oil sands industrial
op oil and gas industrial
wp well pad
OF Open Field fo oil and gas facility
fs oil sands open field
SD Soil Disturbance os oil sands
AL Artificial Lake eo oil and gas related pond
Canadarsquos National Deforestation Monitoring System System DescriptionInformation Report BC-X-439
27
Post class Post class modifier
Peat Mining
SD Soil Disturbance pm peat extraction
Recreation
AL Artificial Lake af golf course related
ap recreational water body
OF Open Field fc recreational field
RC Recreational ca campground
go golf course
ru other or undifferentiated
sk ski areas
Transportation
CR Corridor as airstrip
ry railway
RD Road mm main road clearly for a mine
mr main road
mo main road clearly for oil and gas
my main road clearly for hydroelectric
sm secondary mining road
so secondary oil and gas road
sr secondary road
sy secondary hydroelectric road
xm tertiary mining road with width ge 20 m
xo tertiary oil and gas road with width ge 20 m
xr tertiary road with width ge 20 m
xy tertiary hydroelectric road with width ge 20 m
Canadian Forest Service | Pacific Forestry Centre | nrcangccaforestsresearch-centrespfc1348928
Table A22 Aggregation of deforestation mapping classes to good practice guidance and industrial categories
Good practice guidance class
Crop-land (CL)
Wetlands (WL) Settlements (SL)
Industrial Categories
Agric
ultu
re
Floo
ded
stan
ding
fore
st
Hyd
ro re
serv
oir
Peat
min
ing
Fore
stry
Hyd
ro in
fras
truc
ture
Indu
stry
Min
ing
Mun
icip
al
Oil
and
gas
Recr
eatio
n
Tran
spor
tatio
n
Def
ores
tatio
n po
st c
lass
Agriculture AG ab cp pa fy
Artificial Lake AL aa ea ff hr ei emad ar of ul eo af ap
Corridor CR hm hs xy cl cu
pp ps xp as ry
Industrial IN ih hi li mh mloi op wp
Open Field OF fa fi fk fm fq fd fr uf fo fs fc
Recreational RC ca go fu sk
Road RDmf sf xf
mm mo mr my sm so sr sy xm
xo xr xy
Rural Residential RR rf rm
Soil Disturbance SD pm ld ss mn pq lf su os
Urban Residential UR df dm
Canadarsquos National Deforestation Monitoring System System DescriptionInformation Report BC-X-439
29
Appendix 3 Deforestation Strata Units and Reconciliation Unit InclusionTable A31 shows the names of the deforestation strata their area in kilohectares and the percentage of that area contained in each reconciliation unit that they overlap (sorted by reconciliation unit identification number see Figure 1 for unit loca-tion and name)
Table A31 Area of strata units and percent of strata unit area that is in each reconciliation unit
Deforestation strata unit name Strata unit area (kilohectares)
Reconciliation unit ( inclusion)
Newfoundland Eastern Woodlot 4 477 1 (100)
Newfoundland Forest Activity Zone 6 512 1 (100)
Newfoundland St Johns 55 1 (100)
Labrador Arctic 1 893 2 (100)
Labrador Northern Forest 23 238 3 (98) 4 (2)
Labrador Forest Activity Zone 4 620 4 (100)
Nova Scotia Eastern Woodlot 2 894 5 (100)
Nova Scotia Forest Activity Zone 2 396 5 (100)
Nova Scotia HalifaxDartmouth 182 5 (100)
Prince Edward Island 577 6 (100)
New Brunswick Eastern Woodlot 4 121 7 (100)
New Brunswick Forest Activity Zone 3 174 7 (100)
Quebec Arctic 20 443 10 (75) 9 (18) 8 (7)
Quebec Eastern Townships 3 948 11 (100)
Quebec Gaspe Forest Activity Zone 2 740 11 (100)
Quebec Southern RU12 2 968 12 (100)
Quebec Northern Forest 72 759 14 (73)15 (22) 13(5)
Quebec Forest Activity Zone 44 717 15 (100)
Quebec Ile DAnticosti 795 15 (100)
Quebec Lac St Jean 964 15 (100)
Quebec Southern RU15 1 687 15 (100)
Ontario Thunder Bay 225 16(100)
Ontario Southern 8 198 17 (100)
Ontario Manitoulin Island 326 17 (100)
Ontario Northern Forest 46 468 18 (56) 16 (43) 19 (1)
Ontario SudburyNorth Bay 874 19 (100)
Ontario Forest Activity Zone 42 398 19 (56) 16 (43) 18 (1)
Ontario Sault Ste Marie 536 19 (92) 17 (8)
Manitoba Forest Activity Zone RU22 East 2 405 22 (100)
Manitoba Forest Activity Zone RU22 North 6 109 22 (100)
Manitoba Prairie Fringe RU22 804 22 (100)
Manitoba Northern Forest 37 339 22 (43) 21 (35) 25 (19) 23 (3)
Manitoba Forest Activity Zone RU23 7 382 23 (100)
Manitoba Prairie Fringe RU23 3 970 23 (100)
Manitoba Hotspot 851 24 (100)
Manitoba North Prairie 6 117 24 (100)
Canadian Forest Service | Pacific Forestry Centre | nrcangccaforestsresearch-centrespfc1348930
Deforestation strata unit name Strata unit area (kilohectares)
Reconciliation unit ( inclusion)
Saskatchewan Northern Forest 21 224 27 (75) 26 (22) 28 (3)
Saskatchewan Prairie Fringe 5 509 28 (100)
Saskatchewan Inactive Forest Activity Zone 6 196 28 (58) 27 (42)
Saskatchewan Forest Activity Zone 8 189 28 (99) 27 (1)
Saskatchewan North Prairie 8 167 29 (100)
Saskatchewan Prairie 15 921 30 (100)
Alberta Northern Forest 10 862 31 (58) 34 (28) 32 (8) 33 (6)
Alberta Forest Activity Zone 22 066 34 (100)
Alberta Fort McMurray 807 34 (100)
Alberta High Level 789 34 (100)
Alberta Northwest Fringe 5 436 34 (100)
Alberta Prairie Fringe 6 038 34 (100)
Alberta North Prairie 7 397 35 (100)
Alberta RU 36 Forest Activity Zone 4 764 36 (100)
Alberta Palliser Triangle 3 689 37 (100)
Alberta Prairie West 4 522 37 (100)
British Columbia RU 38 6 759 38 (100)
British Columbia Prairie Fringe 2 333 39 (100)
British Columbia RU 40 19 220 40 (100)
British Columbia Lower Mainland East Vancouver Island
1 142 41 (100)
British Columbia RU 41 Forest Activity Zone 15 440 41 (100)
British Columbia VI QCI 3 813 41 (100)
British Columbia Okanagan 1 109 42 (100)
British Columbia Prince George 464 42 (100)
British Columbia RU 42 Forest Activity Zone 44 286 42 (96) 39 (4)
Yukon Arctic 496 43 (100)
Yukon Northern Forest 19 987 45 (91) 44 (9)
Yukon Whitehorse 417 46 (100)
Yukon Forest Activity Zone 27 440 46 (98) 47 (1)
Northwest Territories Arctic 42 788 48 (49) 49 (43) 50 (7)
Northwest Territories Northern Forest 91 972 50 (52) 51 (37) 53 (9) 52 (2)
Northwest Territories Yellowknife 176 51 (100)
Northwest Territories Forest Activity Zone 467 54 (100)
Nunavut Arctic 198 915 56 (64) 57 (25) 55 (11)
Nunavut Northern Forest 9 892 58 (100)
nrcangccaforests
For more information about the Canadian Forest Service visit our website at nrcangccaforests or contact any of the following Canadian Forest Service establishments
Canadian Forest Service Contacts
Atlantic Forestry Centre PO Box 4000 Fredericton NB E3B 5P7 Tel (506) 452-3500 Fax (506) 452-3525 nrcangccaforestsresearch-centresafc13447
Atlantic Forestry Centre ndash District Office Sir Wilfred Grenfell College Forestry Centre University Drive Corner Brook NF A2H 6P9 Tel (709) 637-4900 Fax (709) 637-4910
Laurentian Forestry Centre 1055 rue du PEPS PO Box 3800 Sainte-Foy PQ G1V 4C7 Tel (418) 648-5788 Fax (418) 648-5849 nrcangccaforestsresearch-centreslfc13473
Great Lakes Forestry Centre PO Box 490 1219 Queen St East Sault Ste Marie ON P6A 5M7 Tel (705) 949-9461 Fax (705) 759-5700 nrcangccaforestsresearch-centresglfc13459
Northern Forestry Centre 5320-122nd Street Edmonton AB T6H 3S5 Tel (403) 435-7210 Fax (403) 435-7359 nrcangccaforestsresearch-centresnofc13485
Pacific Forestry Centre 506 West Burnside Road Victoria BC V8Z 1M5 Tel (250) 363-0600 Fax (250) 363-0775 nrcangccaforestsresearch-centrespfc13489
Headquarters 580 Booth St 8th Fl Ottawa ON K1A 0E4 Tel (613) 947-7341 Fax (613) 947-7396
Canadian Wood Fibre Centre A virtual research centre of the Canadian Forest Service Natural Resources Canada nrcangccaforestsresearch-centrescwfc13457
1
2
3
5
6
4
1
25
3 6
4
1
To order publications online visit the Canadian Forest Service Publications website at
cfsnrcangccapublications

Canadarsquos National Deforestation Monitoring System System DescriptionInformation Report BC-X-439
25
Appendix 2 Post-class Modifiers by Industrial Category
Table A21 lists all land use post-class deforestation modifiers They provide additional detail regarding what has occurred on the ground for each deforestation event These classes can be assigned to various industrial classes (see Table A22) Detailed definitions are provided in the Deforestation Interpretation Guide (Leckie et al 2012)
Table A21 Post class and post-class modifier codes and short descriptions grouped by industrial categorysector (in bold)
Post class Post class modifier
Agriculture
AG Agriculture ab bare
cp crop
fy farm yard
pa pasture
AL Artificial Lake aa agriculture pond
ea agriculture effluent pond
OF Open Field fa agriculture setting
Flooded Standing Forest
AL Artificial Lake ff flooded standing forest
Forestry
RD Road mf mainline forestry road
sf secondary forestry road
xf tertiary forestry road with width ge 20 m
SD Soil Disturbance ld logging landing
ss rock slide scar
Hydro Infrastructure
CR Corridor hm hydro linendashmain
hs hydro linendashsecondary
xy hydro linendashtertiary ge 20 m
IN Industrial ih hydro infrastructure
Hydro Reservoir
AL Artificial Lake hr hydroelectric flooding
Industry
AL Artificial Lake ei industrial effluent pond
IN Industrial hi heavy industrial
li light industrial
OF Open Field fi industrial
Canadian Forest Service | Pacific Forestry Centre | nrcangccaforestsresearch-centrespfc1348926
Post class Post class modifier
Mining
AL Artificial Lake em waste ponds for mining
IN Industrial mh mine heavy
ml mine light
OF Open Field fk mine facility
fm mine
fq pit and quarry
SD Soil Disturbance mn open pit mine
pq gravel pitquarry
Municipal
AL Artificial Lake ad pond urban setting
ar pond rural residential
ul other human caused
CR Corridor cl cut line
cu undifferentiated
OF Open Field fd urbansuburban
fr rural residential
uf undifferentiated field
RR Rural Residential rf few trees remaining
rm many trees remaining
SD Soil Disturbance lf landfill
su undifferentiated
UR Urban Residential df few trees remaining
dm many trees remaining
Oil and Gas
CR Corridor pp pipelinendashmain
ps pipelinendashsecondary
xp pipelinendashtertiary ge 20 m
IN Industrial oi oil sands industrial
op oil and gas industrial
wp well pad
OF Open Field fo oil and gas facility
fs oil sands open field
SD Soil Disturbance os oil sands
AL Artificial Lake eo oil and gas related pond
Canadarsquos National Deforestation Monitoring System System DescriptionInformation Report BC-X-439
27
Post class Post class modifier
Peat Mining
SD Soil Disturbance pm peat extraction
Recreation
AL Artificial Lake af golf course related
ap recreational water body
OF Open Field fc recreational field
RC Recreational ca campground
go golf course
ru other or undifferentiated
sk ski areas
Transportation
CR Corridor as airstrip
ry railway
RD Road mm main road clearly for a mine
mr main road
mo main road clearly for oil and gas
my main road clearly for hydroelectric
sm secondary mining road
so secondary oil and gas road
sr secondary road
sy secondary hydroelectric road
xm tertiary mining road with width ge 20 m
xo tertiary oil and gas road with width ge 20 m
xr tertiary road with width ge 20 m
xy tertiary hydroelectric road with width ge 20 m
Canadian Forest Service | Pacific Forestry Centre | nrcangccaforestsresearch-centrespfc1348928
Table A22 Aggregation of deforestation mapping classes to good practice guidance and industrial categories
Good practice guidance class
Crop-land (CL)
Wetlands (WL) Settlements (SL)
Industrial Categories
Agric
ultu
re
Floo
ded
stan
ding
fore
st
Hyd
ro re
serv
oir
Peat
min
ing
Fore
stry
Hyd
ro in
fras
truc
ture
Indu
stry
Min
ing
Mun
icip
al
Oil
and
gas
Recr
eatio
n
Tran
spor
tatio
n
Def
ores
tatio
n po
st c
lass
Agriculture AG ab cp pa fy
Artificial Lake AL aa ea ff hr ei emad ar of ul eo af ap
Corridor CR hm hs xy cl cu
pp ps xp as ry
Industrial IN ih hi li mh mloi op wp
Open Field OF fa fi fk fm fq fd fr uf fo fs fc
Recreational RC ca go fu sk
Road RDmf sf xf
mm mo mr my sm so sr sy xm
xo xr xy
Rural Residential RR rf rm
Soil Disturbance SD pm ld ss mn pq lf su os
Urban Residential UR df dm
Canadarsquos National Deforestation Monitoring System System DescriptionInformation Report BC-X-439
29
Appendix 3 Deforestation Strata Units and Reconciliation Unit InclusionTable A31 shows the names of the deforestation strata their area in kilohectares and the percentage of that area contained in each reconciliation unit that they overlap (sorted by reconciliation unit identification number see Figure 1 for unit loca-tion and name)
Table A31 Area of strata units and percent of strata unit area that is in each reconciliation unit
Deforestation strata unit name Strata unit area (kilohectares)
Reconciliation unit ( inclusion)
Newfoundland Eastern Woodlot 4 477 1 (100)
Newfoundland Forest Activity Zone 6 512 1 (100)
Newfoundland St Johns 55 1 (100)
Labrador Arctic 1 893 2 (100)
Labrador Northern Forest 23 238 3 (98) 4 (2)
Labrador Forest Activity Zone 4 620 4 (100)
Nova Scotia Eastern Woodlot 2 894 5 (100)
Nova Scotia Forest Activity Zone 2 396 5 (100)
Nova Scotia HalifaxDartmouth 182 5 (100)
Prince Edward Island 577 6 (100)
New Brunswick Eastern Woodlot 4 121 7 (100)
New Brunswick Forest Activity Zone 3 174 7 (100)
Quebec Arctic 20 443 10 (75) 9 (18) 8 (7)
Quebec Eastern Townships 3 948 11 (100)
Quebec Gaspe Forest Activity Zone 2 740 11 (100)
Quebec Southern RU12 2 968 12 (100)
Quebec Northern Forest 72 759 14 (73)15 (22) 13(5)
Quebec Forest Activity Zone 44 717 15 (100)
Quebec Ile DAnticosti 795 15 (100)
Quebec Lac St Jean 964 15 (100)
Quebec Southern RU15 1 687 15 (100)
Ontario Thunder Bay 225 16(100)
Ontario Southern 8 198 17 (100)
Ontario Manitoulin Island 326 17 (100)
Ontario Northern Forest 46 468 18 (56) 16 (43) 19 (1)
Ontario SudburyNorth Bay 874 19 (100)
Ontario Forest Activity Zone 42 398 19 (56) 16 (43) 18 (1)
Ontario Sault Ste Marie 536 19 (92) 17 (8)
Manitoba Forest Activity Zone RU22 East 2 405 22 (100)
Manitoba Forest Activity Zone RU22 North 6 109 22 (100)
Manitoba Prairie Fringe RU22 804 22 (100)
Manitoba Northern Forest 37 339 22 (43) 21 (35) 25 (19) 23 (3)
Manitoba Forest Activity Zone RU23 7 382 23 (100)
Manitoba Prairie Fringe RU23 3 970 23 (100)
Manitoba Hotspot 851 24 (100)
Manitoba North Prairie 6 117 24 (100)
Canadian Forest Service | Pacific Forestry Centre | nrcangccaforestsresearch-centrespfc1348930
Deforestation strata unit name Strata unit area (kilohectares)
Reconciliation unit ( inclusion)
Saskatchewan Northern Forest 21 224 27 (75) 26 (22) 28 (3)
Saskatchewan Prairie Fringe 5 509 28 (100)
Saskatchewan Inactive Forest Activity Zone 6 196 28 (58) 27 (42)
Saskatchewan Forest Activity Zone 8 189 28 (99) 27 (1)
Saskatchewan North Prairie 8 167 29 (100)
Saskatchewan Prairie 15 921 30 (100)
Alberta Northern Forest 10 862 31 (58) 34 (28) 32 (8) 33 (6)
Alberta Forest Activity Zone 22 066 34 (100)
Alberta Fort McMurray 807 34 (100)
Alberta High Level 789 34 (100)
Alberta Northwest Fringe 5 436 34 (100)
Alberta Prairie Fringe 6 038 34 (100)
Alberta North Prairie 7 397 35 (100)
Alberta RU 36 Forest Activity Zone 4 764 36 (100)
Alberta Palliser Triangle 3 689 37 (100)
Alberta Prairie West 4 522 37 (100)
British Columbia RU 38 6 759 38 (100)
British Columbia Prairie Fringe 2 333 39 (100)
British Columbia RU 40 19 220 40 (100)
British Columbia Lower Mainland East Vancouver Island
1 142 41 (100)
British Columbia RU 41 Forest Activity Zone 15 440 41 (100)
British Columbia VI QCI 3 813 41 (100)
British Columbia Okanagan 1 109 42 (100)
British Columbia Prince George 464 42 (100)
British Columbia RU 42 Forest Activity Zone 44 286 42 (96) 39 (4)
Yukon Arctic 496 43 (100)
Yukon Northern Forest 19 987 45 (91) 44 (9)
Yukon Whitehorse 417 46 (100)
Yukon Forest Activity Zone 27 440 46 (98) 47 (1)
Northwest Territories Arctic 42 788 48 (49) 49 (43) 50 (7)
Northwest Territories Northern Forest 91 972 50 (52) 51 (37) 53 (9) 52 (2)
Northwest Territories Yellowknife 176 51 (100)
Northwest Territories Forest Activity Zone 467 54 (100)
Nunavut Arctic 198 915 56 (64) 57 (25) 55 (11)
Nunavut Northern Forest 9 892 58 (100)
nrcangccaforests
For more information about the Canadian Forest Service visit our website at nrcangccaforests or contact any of the following Canadian Forest Service establishments
Canadian Forest Service Contacts
Atlantic Forestry Centre PO Box 4000 Fredericton NB E3B 5P7 Tel (506) 452-3500 Fax (506) 452-3525 nrcangccaforestsresearch-centresafc13447
Atlantic Forestry Centre ndash District Office Sir Wilfred Grenfell College Forestry Centre University Drive Corner Brook NF A2H 6P9 Tel (709) 637-4900 Fax (709) 637-4910
Laurentian Forestry Centre 1055 rue du PEPS PO Box 3800 Sainte-Foy PQ G1V 4C7 Tel (418) 648-5788 Fax (418) 648-5849 nrcangccaforestsresearch-centreslfc13473
Great Lakes Forestry Centre PO Box 490 1219 Queen St East Sault Ste Marie ON P6A 5M7 Tel (705) 949-9461 Fax (705) 759-5700 nrcangccaforestsresearch-centresglfc13459
Northern Forestry Centre 5320-122nd Street Edmonton AB T6H 3S5 Tel (403) 435-7210 Fax (403) 435-7359 nrcangccaforestsresearch-centresnofc13485
Pacific Forestry Centre 506 West Burnside Road Victoria BC V8Z 1M5 Tel (250) 363-0600 Fax (250) 363-0775 nrcangccaforestsresearch-centrespfc13489
Headquarters 580 Booth St 8th Fl Ottawa ON K1A 0E4 Tel (613) 947-7341 Fax (613) 947-7396
Canadian Wood Fibre Centre A virtual research centre of the Canadian Forest Service Natural Resources Canada nrcangccaforestsresearch-centrescwfc13457
1
2
3
5
6
4
1
25
3 6
4
1
To order publications online visit the Canadian Forest Service Publications website at
cfsnrcangccapublications
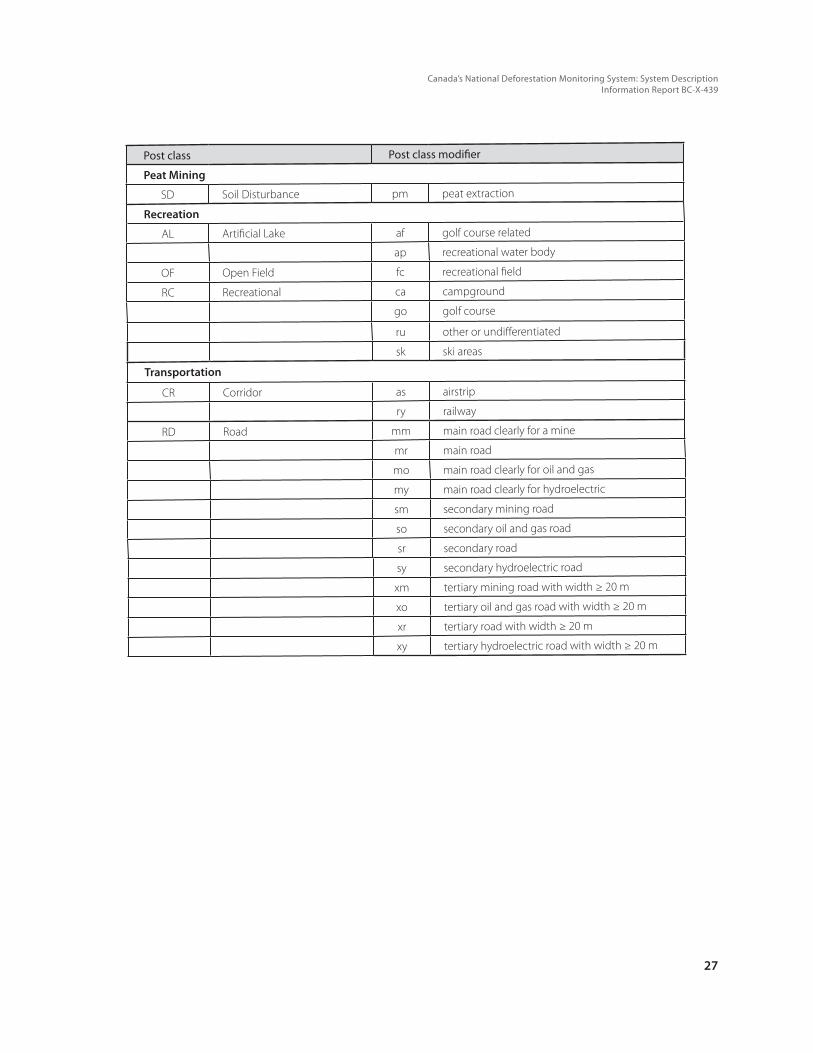
Canadarsquos National Deforestation Monitoring System System DescriptionInformation Report BC-X-439
27
Post class Post class modifier
Peat Mining
SD Soil Disturbance pm peat extraction
Recreation
AL Artificial Lake af golf course related
ap recreational water body
OF Open Field fc recreational field
RC Recreational ca campground
go golf course
ru other or undifferentiated
sk ski areas
Transportation
CR Corridor as airstrip
ry railway
RD Road mm main road clearly for a mine
mr main road
mo main road clearly for oil and gas
my main road clearly for hydroelectric
sm secondary mining road
so secondary oil and gas road
sr secondary road
sy secondary hydroelectric road
xm tertiary mining road with width ge 20 m
xo tertiary oil and gas road with width ge 20 m
xr tertiary road with width ge 20 m
xy tertiary hydroelectric road with width ge 20 m
Canadian Forest Service | Pacific Forestry Centre | nrcangccaforestsresearch-centrespfc1348928
Table A22 Aggregation of deforestation mapping classes to good practice guidance and industrial categories
Good practice guidance class
Crop-land (CL)
Wetlands (WL) Settlements (SL)
Industrial Categories
Agric
ultu
re
Floo
ded
stan
ding
fore
st
Hyd
ro re
serv
oir
Peat
min
ing
Fore
stry
Hyd
ro in
fras
truc
ture
Indu
stry
Min
ing
Mun
icip
al
Oil
and
gas
Recr
eatio
n
Tran
spor
tatio
n
Def
ores
tatio
n po
st c
lass
Agriculture AG ab cp pa fy
Artificial Lake AL aa ea ff hr ei emad ar of ul eo af ap
Corridor CR hm hs xy cl cu
pp ps xp as ry
Industrial IN ih hi li mh mloi op wp
Open Field OF fa fi fk fm fq fd fr uf fo fs fc
Recreational RC ca go fu sk
Road RDmf sf xf
mm mo mr my sm so sr sy xm
xo xr xy
Rural Residential RR rf rm
Soil Disturbance SD pm ld ss mn pq lf su os
Urban Residential UR df dm
Canadarsquos National Deforestation Monitoring System System DescriptionInformation Report BC-X-439
29
Appendix 3 Deforestation Strata Units and Reconciliation Unit InclusionTable A31 shows the names of the deforestation strata their area in kilohectares and the percentage of that area contained in each reconciliation unit that they overlap (sorted by reconciliation unit identification number see Figure 1 for unit loca-tion and name)
Table A31 Area of strata units and percent of strata unit area that is in each reconciliation unit
Deforestation strata unit name Strata unit area (kilohectares)
Reconciliation unit ( inclusion)
Newfoundland Eastern Woodlot 4 477 1 (100)
Newfoundland Forest Activity Zone 6 512 1 (100)
Newfoundland St Johns 55 1 (100)
Labrador Arctic 1 893 2 (100)
Labrador Northern Forest 23 238 3 (98) 4 (2)
Labrador Forest Activity Zone 4 620 4 (100)
Nova Scotia Eastern Woodlot 2 894 5 (100)
Nova Scotia Forest Activity Zone 2 396 5 (100)
Nova Scotia HalifaxDartmouth 182 5 (100)
Prince Edward Island 577 6 (100)
New Brunswick Eastern Woodlot 4 121 7 (100)
New Brunswick Forest Activity Zone 3 174 7 (100)
Quebec Arctic 20 443 10 (75) 9 (18) 8 (7)
Quebec Eastern Townships 3 948 11 (100)
Quebec Gaspe Forest Activity Zone 2 740 11 (100)
Quebec Southern RU12 2 968 12 (100)
Quebec Northern Forest 72 759 14 (73)15 (22) 13(5)
Quebec Forest Activity Zone 44 717 15 (100)
Quebec Ile DAnticosti 795 15 (100)
Quebec Lac St Jean 964 15 (100)
Quebec Southern RU15 1 687 15 (100)
Ontario Thunder Bay 225 16(100)
Ontario Southern 8 198 17 (100)
Ontario Manitoulin Island 326 17 (100)
Ontario Northern Forest 46 468 18 (56) 16 (43) 19 (1)
Ontario SudburyNorth Bay 874 19 (100)
Ontario Forest Activity Zone 42 398 19 (56) 16 (43) 18 (1)
Ontario Sault Ste Marie 536 19 (92) 17 (8)
Manitoba Forest Activity Zone RU22 East 2 405 22 (100)
Manitoba Forest Activity Zone RU22 North 6 109 22 (100)
Manitoba Prairie Fringe RU22 804 22 (100)
Manitoba Northern Forest 37 339 22 (43) 21 (35) 25 (19) 23 (3)
Manitoba Forest Activity Zone RU23 7 382 23 (100)
Manitoba Prairie Fringe RU23 3 970 23 (100)
Manitoba Hotspot 851 24 (100)
Manitoba North Prairie 6 117 24 (100)
Canadian Forest Service | Pacific Forestry Centre | nrcangccaforestsresearch-centrespfc1348930
Deforestation strata unit name Strata unit area (kilohectares)
Reconciliation unit ( inclusion)
Saskatchewan Northern Forest 21 224 27 (75) 26 (22) 28 (3)
Saskatchewan Prairie Fringe 5 509 28 (100)
Saskatchewan Inactive Forest Activity Zone 6 196 28 (58) 27 (42)
Saskatchewan Forest Activity Zone 8 189 28 (99) 27 (1)
Saskatchewan North Prairie 8 167 29 (100)
Saskatchewan Prairie 15 921 30 (100)
Alberta Northern Forest 10 862 31 (58) 34 (28) 32 (8) 33 (6)
Alberta Forest Activity Zone 22 066 34 (100)
Alberta Fort McMurray 807 34 (100)
Alberta High Level 789 34 (100)
Alberta Northwest Fringe 5 436 34 (100)
Alberta Prairie Fringe 6 038 34 (100)
Alberta North Prairie 7 397 35 (100)
Alberta RU 36 Forest Activity Zone 4 764 36 (100)
Alberta Palliser Triangle 3 689 37 (100)
Alberta Prairie West 4 522 37 (100)
British Columbia RU 38 6 759 38 (100)
British Columbia Prairie Fringe 2 333 39 (100)
British Columbia RU 40 19 220 40 (100)
British Columbia Lower Mainland East Vancouver Island
1 142 41 (100)
British Columbia RU 41 Forest Activity Zone 15 440 41 (100)
British Columbia VI QCI 3 813 41 (100)
British Columbia Okanagan 1 109 42 (100)
British Columbia Prince George 464 42 (100)
British Columbia RU 42 Forest Activity Zone 44 286 42 (96) 39 (4)
Yukon Arctic 496 43 (100)
Yukon Northern Forest 19 987 45 (91) 44 (9)
Yukon Whitehorse 417 46 (100)
Yukon Forest Activity Zone 27 440 46 (98) 47 (1)
Northwest Territories Arctic 42 788 48 (49) 49 (43) 50 (7)
Northwest Territories Northern Forest 91 972 50 (52) 51 (37) 53 (9) 52 (2)
Northwest Territories Yellowknife 176 51 (100)
Northwest Territories Forest Activity Zone 467 54 (100)
Nunavut Arctic 198 915 56 (64) 57 (25) 55 (11)
Nunavut Northern Forest 9 892 58 (100)
nrcangccaforests
For more information about the Canadian Forest Service visit our website at nrcangccaforests or contact any of the following Canadian Forest Service establishments
Canadian Forest Service Contacts
Atlantic Forestry Centre PO Box 4000 Fredericton NB E3B 5P7 Tel (506) 452-3500 Fax (506) 452-3525 nrcangccaforestsresearch-centresafc13447
Atlantic Forestry Centre ndash District Office Sir Wilfred Grenfell College Forestry Centre University Drive Corner Brook NF A2H 6P9 Tel (709) 637-4900 Fax (709) 637-4910
Laurentian Forestry Centre 1055 rue du PEPS PO Box 3800 Sainte-Foy PQ G1V 4C7 Tel (418) 648-5788 Fax (418) 648-5849 nrcangccaforestsresearch-centreslfc13473
Great Lakes Forestry Centre PO Box 490 1219 Queen St East Sault Ste Marie ON P6A 5M7 Tel (705) 949-9461 Fax (705) 759-5700 nrcangccaforestsresearch-centresglfc13459
Northern Forestry Centre 5320-122nd Street Edmonton AB T6H 3S5 Tel (403) 435-7210 Fax (403) 435-7359 nrcangccaforestsresearch-centresnofc13485
Pacific Forestry Centre 506 West Burnside Road Victoria BC V8Z 1M5 Tel (250) 363-0600 Fax (250) 363-0775 nrcangccaforestsresearch-centrespfc13489
Headquarters 580 Booth St 8th Fl Ottawa ON K1A 0E4 Tel (613) 947-7341 Fax (613) 947-7396
Canadian Wood Fibre Centre A virtual research centre of the Canadian Forest Service Natural Resources Canada nrcangccaforestsresearch-centrescwfc13457
1
2
3
5
6
4
1
25
3 6
4
1
To order publications online visit the Canadian Forest Service Publications website at
cfsnrcangccapublications
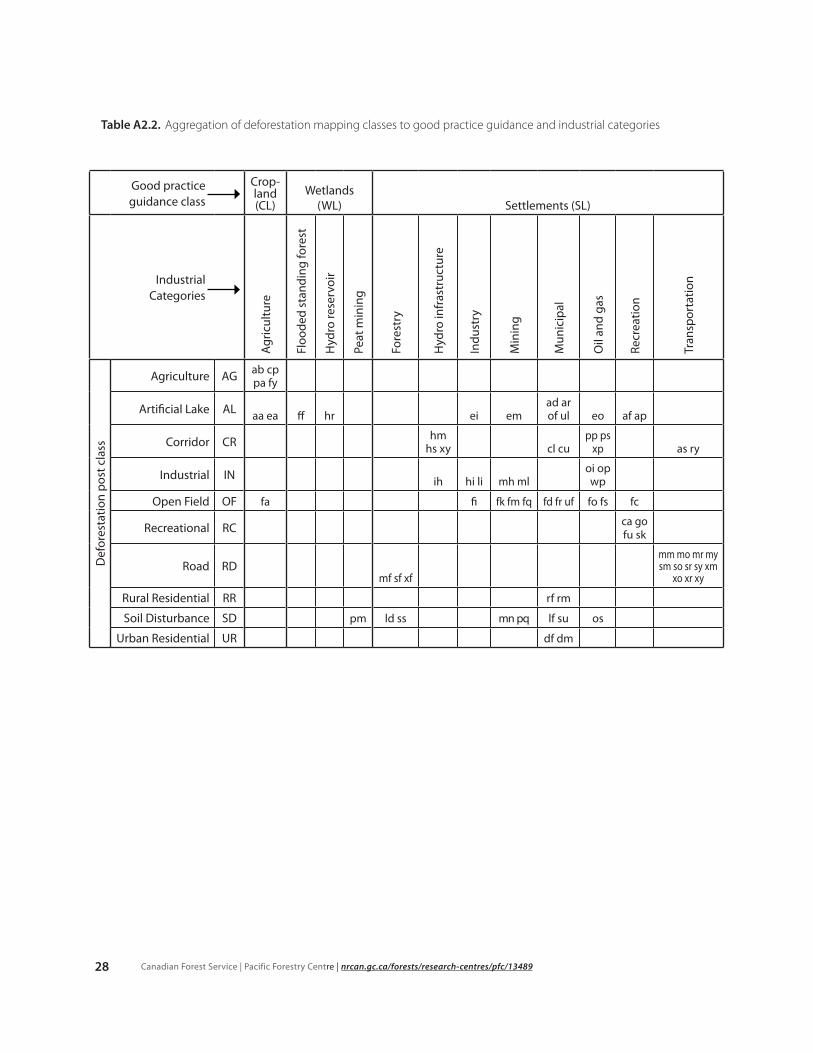

To order publications online visit the Canadian Forest Service Publications website at
cfsnrcangccapublications