Embed Size (px)
Citation preview
Canadian Geography 1202
Canada’s Natural Systems
Canada’s Natural Systems
• Natural System: A system found in nature
• Here are the four natural systems that we will explore in the next few weeks
1. Canada’s Climate Systems
2. Canada’s Natural Vegetation Systems
3. Canada’s Water Systems
4. Canada’s Soil Systems
Canada’s Climate Systems
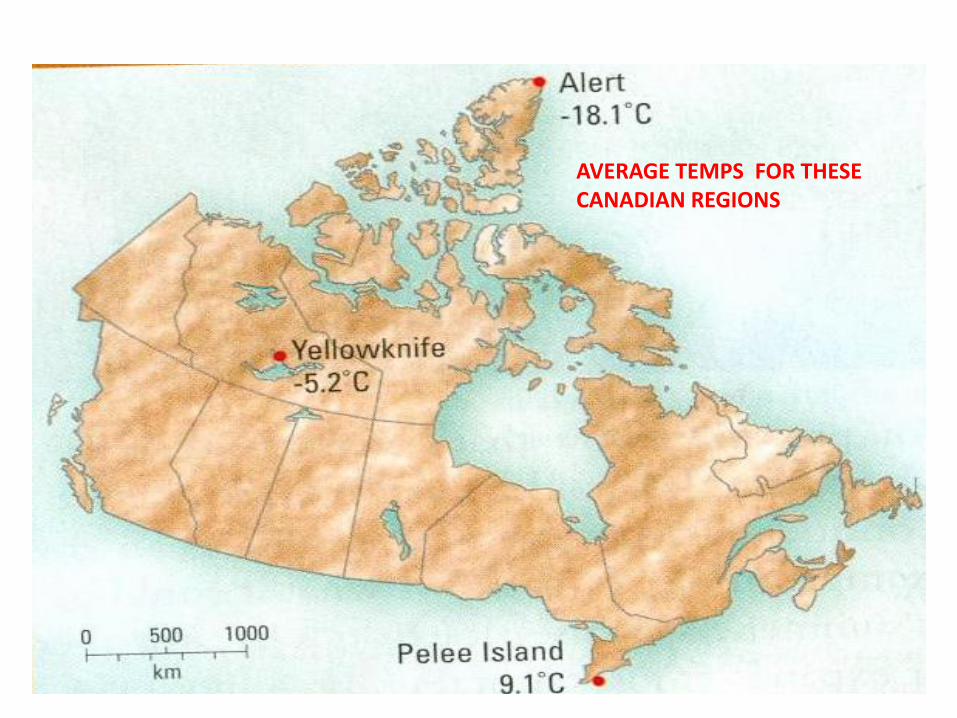
• Weather & climate in Canada vary greatly from place to place and from season to season
– Canada extends for a great distance north to south
– Different elevations produce different climate conditions
– Coastal regions have different climates from inland regions
– Wind & pressure systems move weather conditions from one part of the country to another
AVERAGE TEMPS FOR THESE CANADIAN REGIONS
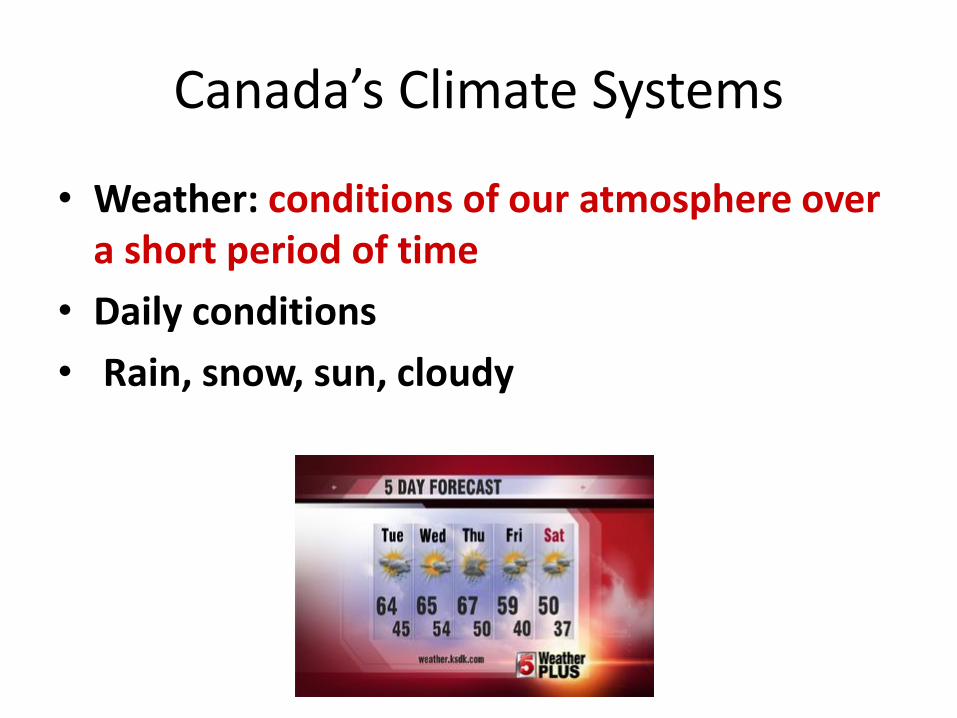
Canada’s Climate Systems
• Weather: conditions of our atmosphere over a short period of time
• Daily conditions
• Rain, snow, sun, cloudy

Canada’s Climate Systems
• Climate: conditions of our atmosphere over a long period of time
• Months, seasons
• Average annual precipitation
Canada’s Climate Systems
• Discuss some examples of how both weather & climate affect our lives
• Complete the handout – “Identifying weather and climate statements” (Take 10 minutes)
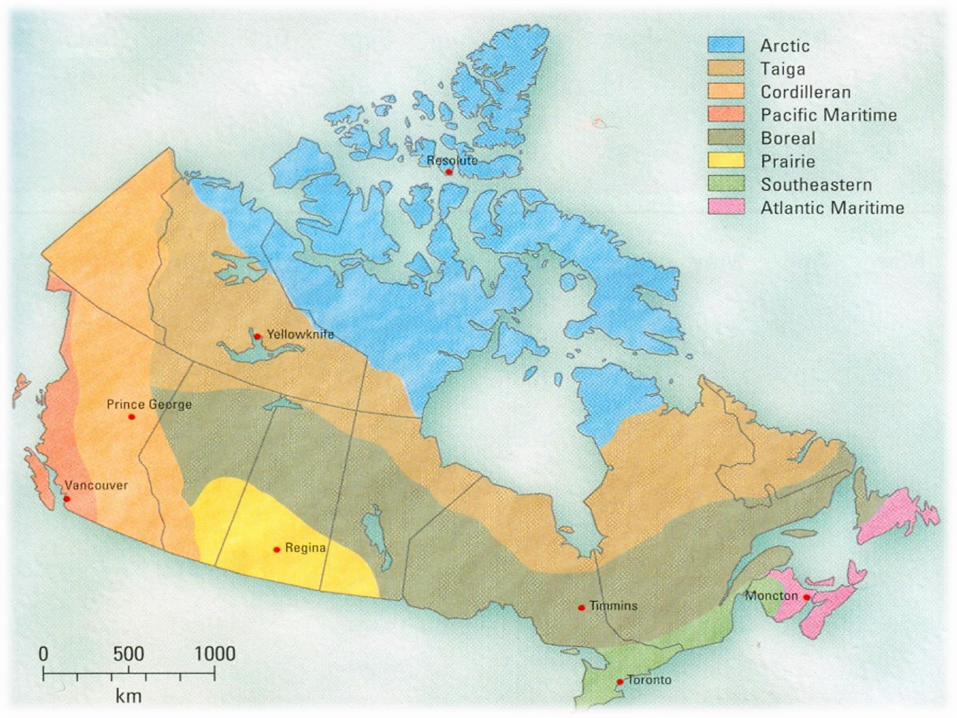
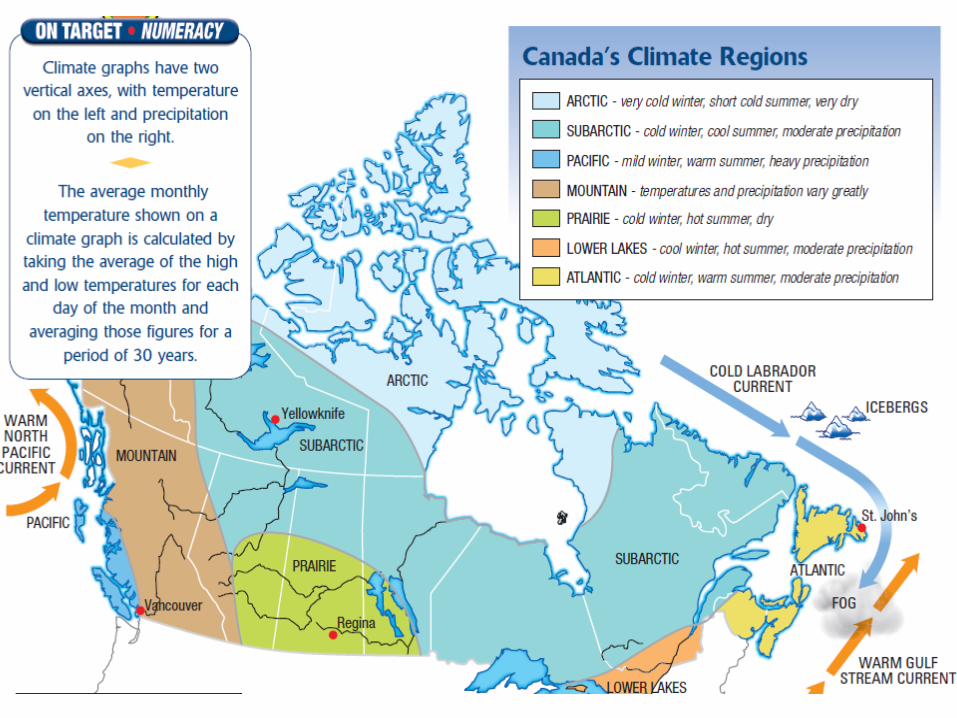
Canada’s Climate Regions
• Within Canada, areas with similar climates can be grouped together to form a climate region
• There are a total of eight climate regions found within our country
Canada’s Climate Systems
• What factors influence the climate across Canada?
Latitude
Ocean Currents
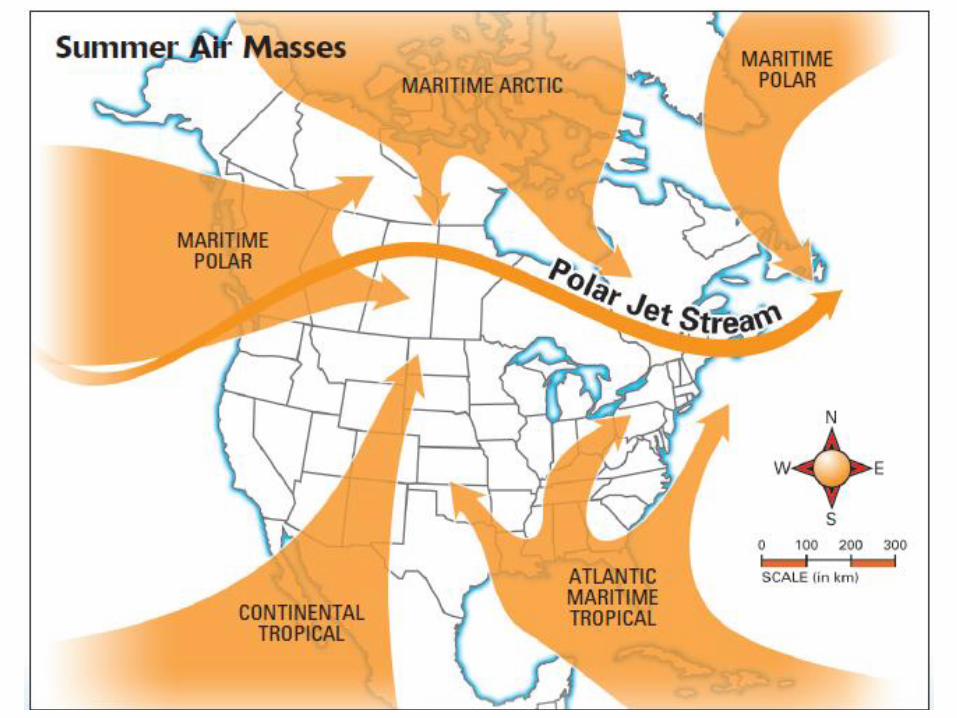
Wind & Air Masses
Polar Jet Stream
Elevation
Large bodies of water
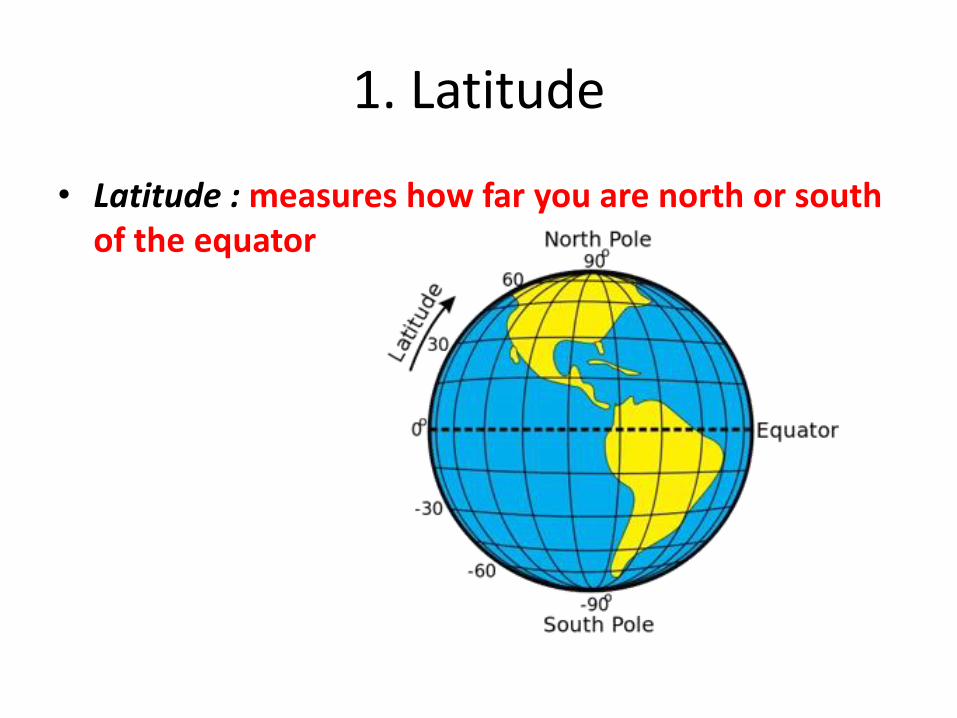
1. Latitude
• Latitude : measures how far you are north or south of the equator
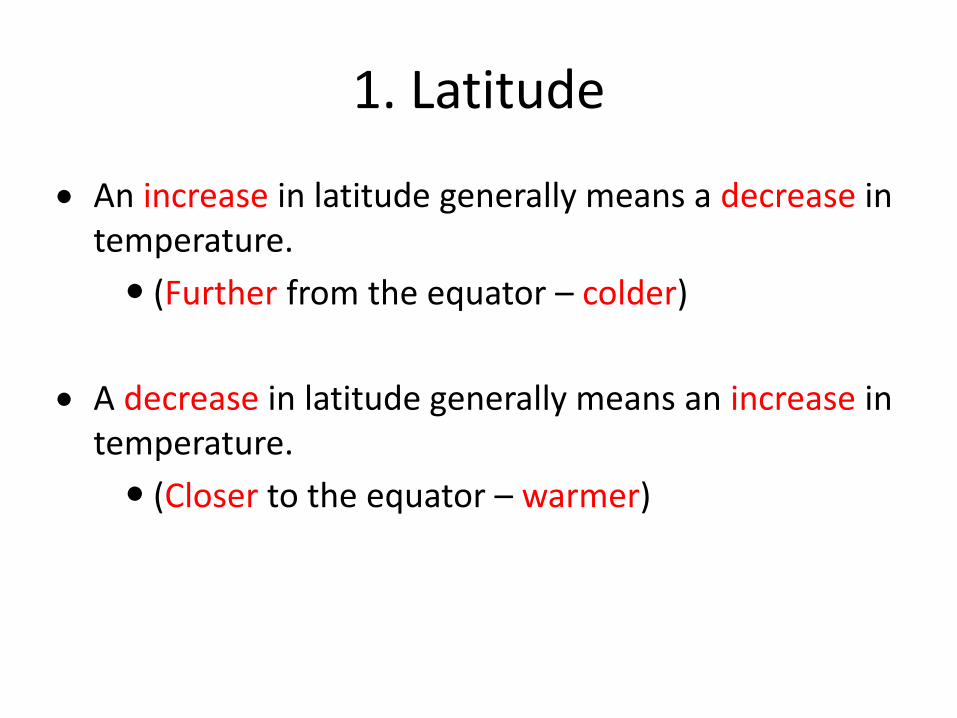
1. Latitude
An increase in latitude generally means a decrease in temperature.
(Further from the equator – colder)
A decrease in latitude generally means an increase in temperature.
(Closer to the equator – warmer)
1. Latitude
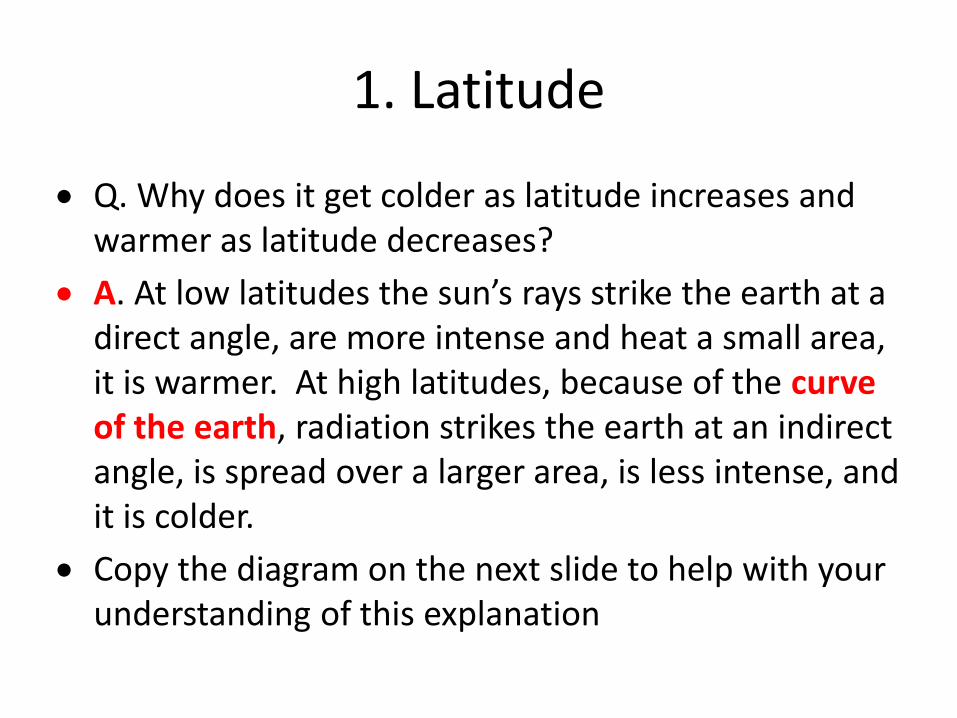
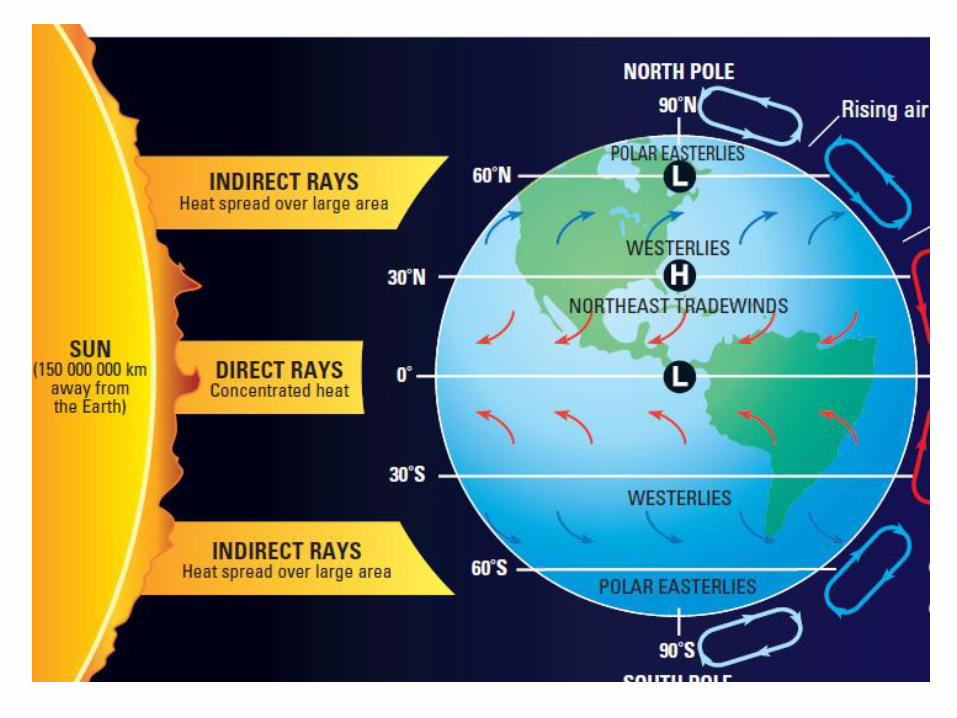
Q. Why does it get colder as latitude increases and warmer as latitude decreases?
A. At low latitudes the sun’s rays strike the earth at a direct angle, are more intense and heat a small area, it is warmer. At high latitudes, because of the curve of the earth, radiation strikes the earth at an indirect angle, is spread over a larger area, is less intense, and it is colder.
Copy the diagram on the next slide to help with your understanding of this explanation
2. Ocean Currents
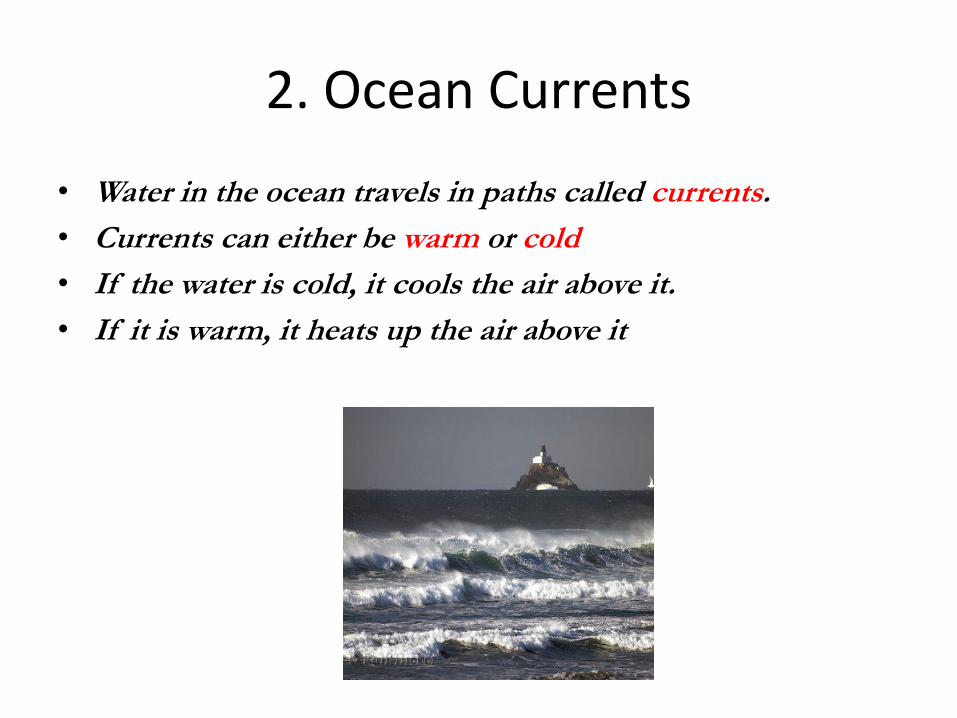
• Water in the ocean travels in paths called currents.
• Currents can either be warm or cold
• If the water is cold, it cools the air above it.
• If it is warm, it heats up the air above it
2. Ocean Currents
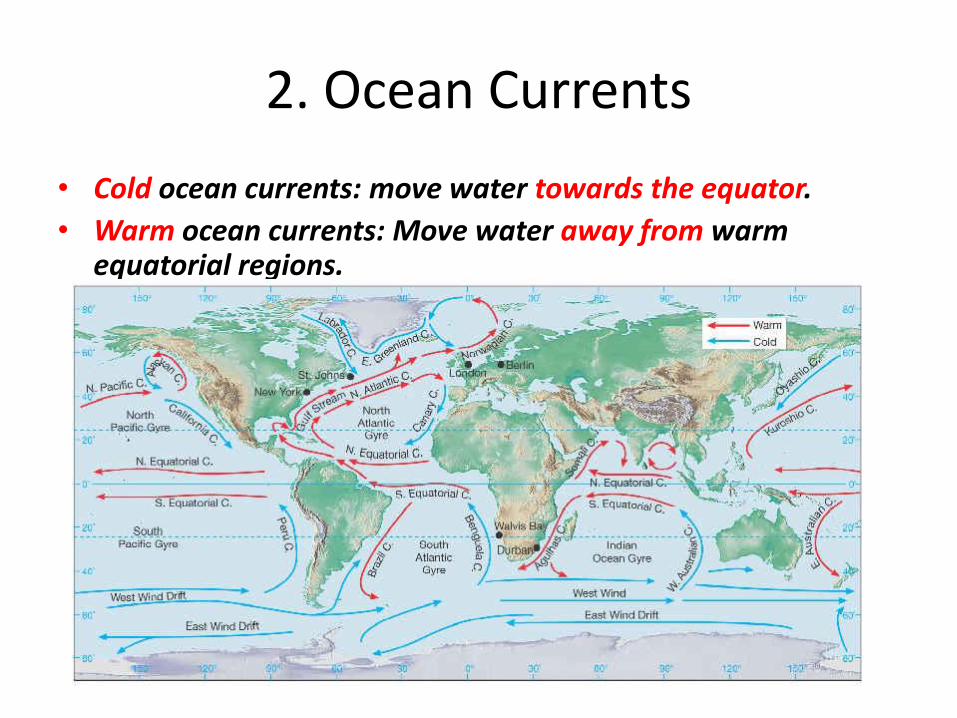
• Cold ocean currents: move water towards the equator.
• Warm ocean currents: Move water away from warm equatorial regions.
2. Ocean Currents
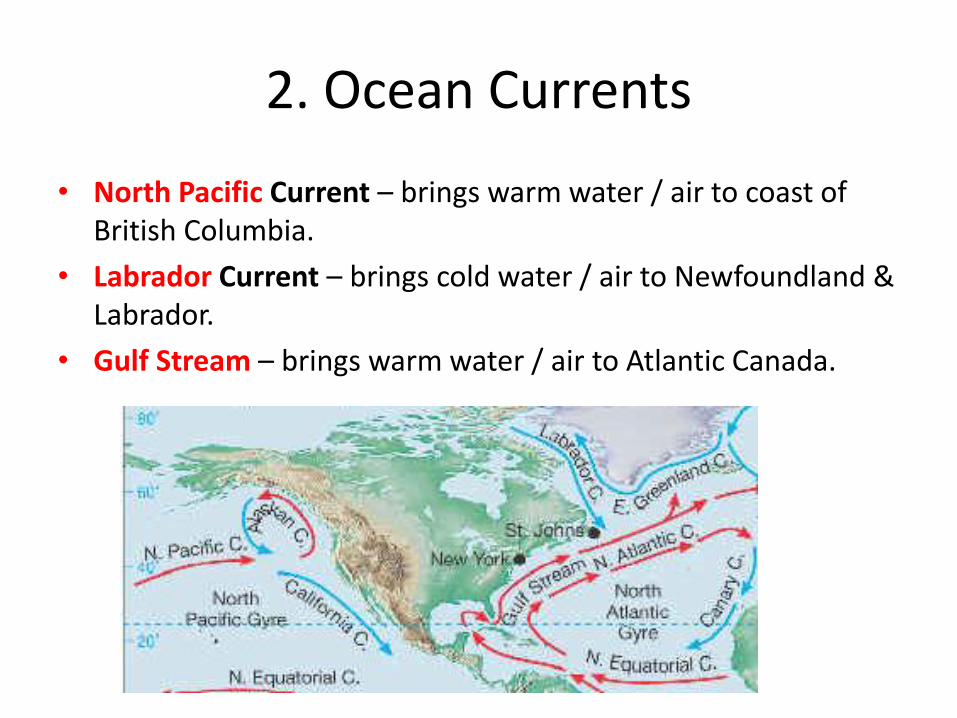
• North Pacific Current – brings warm water / air to coast of British Columbia.
• Labrador Current – brings cold water / air to Newfoundland & Labrador.
• Gulf Stream – brings warm water / air to Atlantic Canada.
2. Ocean Currents
• Complete the ocean currents handout to finish this section
3. Wind & Air Masses
• Air mass – A huge body of air with the same temperature and moisture conditions throughout.
• Wind – air moving from one place to another.
• High pressure – cold air sinking. (cold air is heavier)
• Low pressure – warm air rising. (warm air is lighter)
• Air always moves from high pressure areas to lowpressure areas.
• Warm air masses originate in the south. (equator)
• Cold air masses originate in the north. (poles)
3. Wind & Air Masses
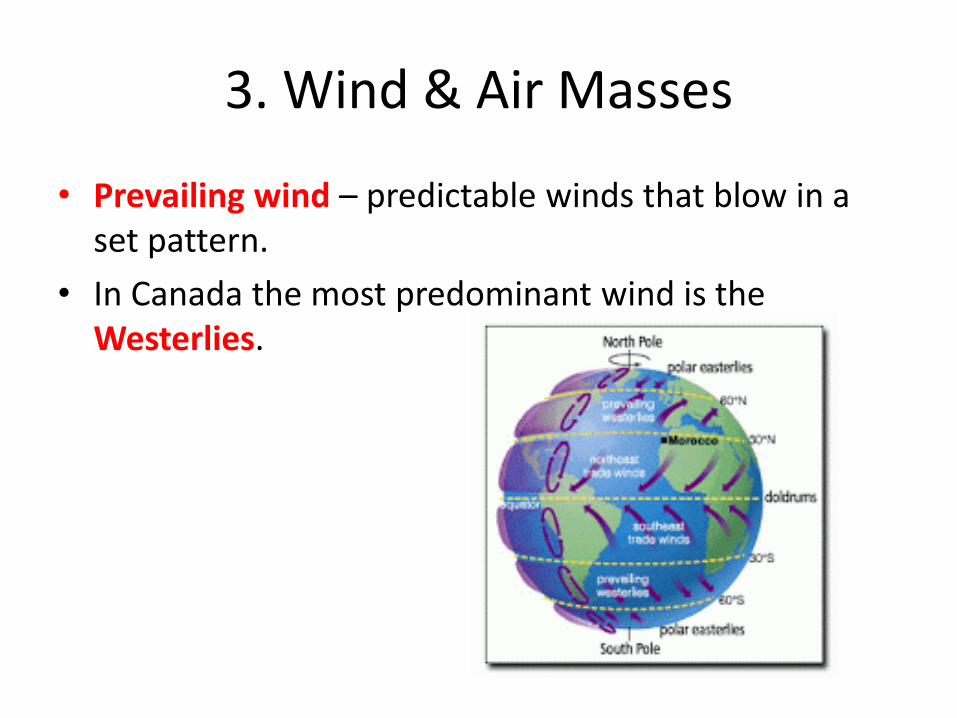
• Prevailing wind – predictable winds that blow in a set pattern.
• In Canada the most predominant wind is the Westerlies.
3. Wind & Air Masses
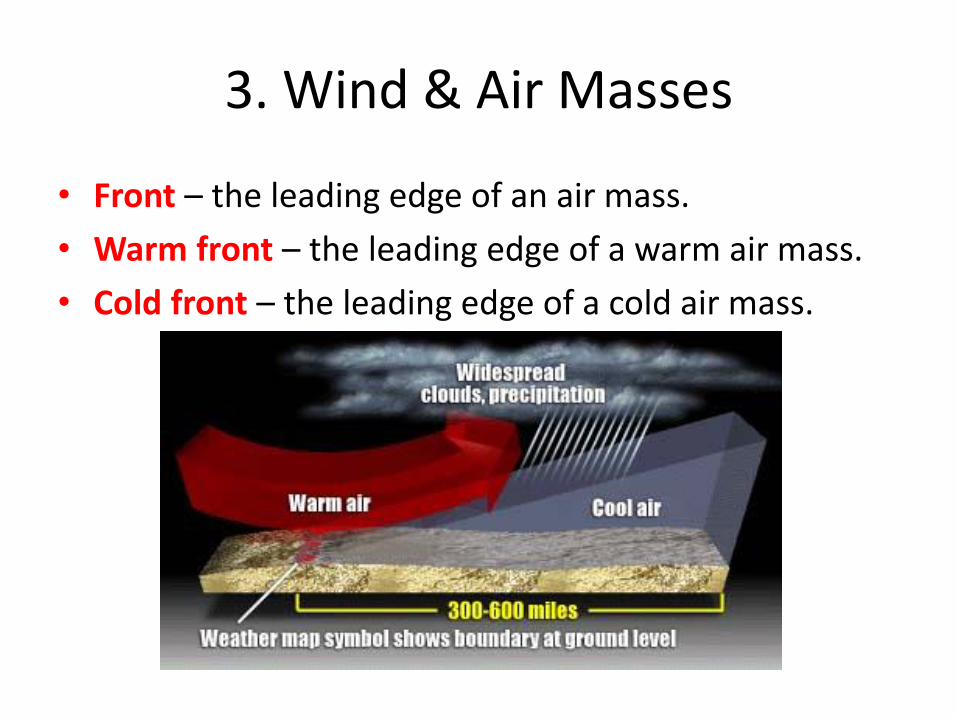
• Front – the leading edge of an air mass.
• Warm front – the leading edge of a warm air mass.
• Cold front – the leading edge of a cold air mass.
3. Wind & Air Masses
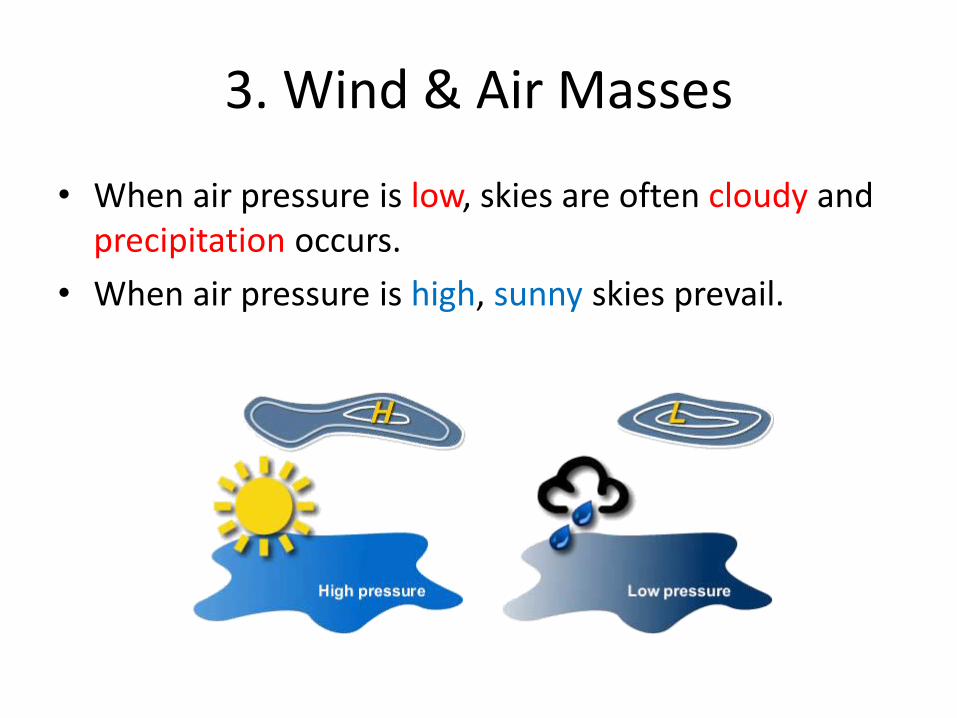
• When air pressure is low, skies are often cloudy and precipitation occurs.
• When air pressure is high, sunny skies prevail.
3. Wind & Air Masses
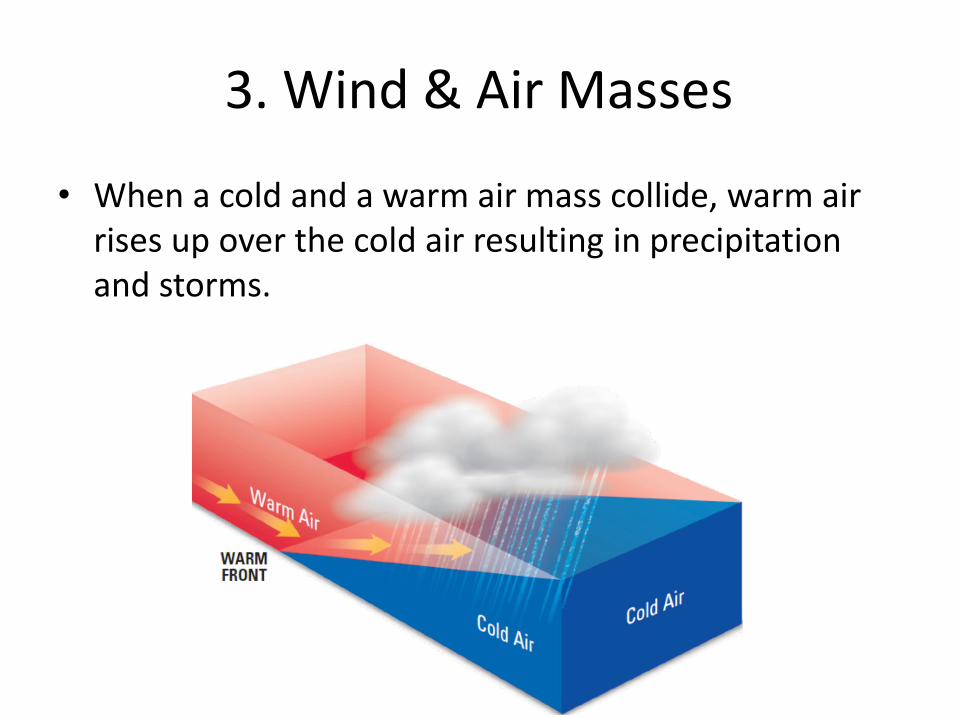
• When a cold and a warm air mass collide, warm air rises up over the cold air resulting in precipitation and storms.
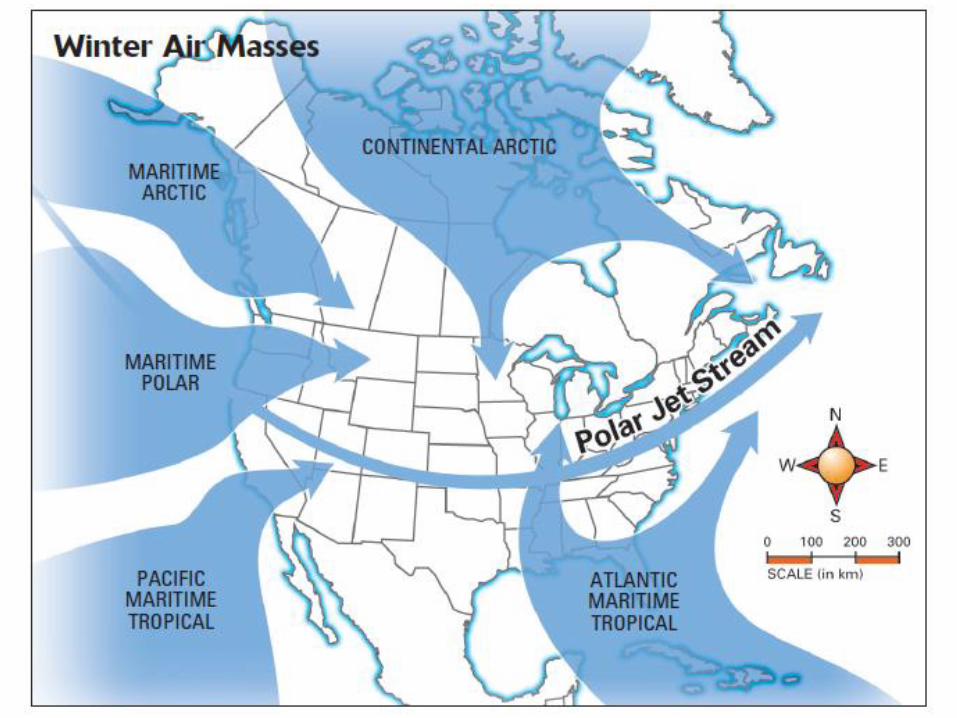
4. Polar Jet Stream
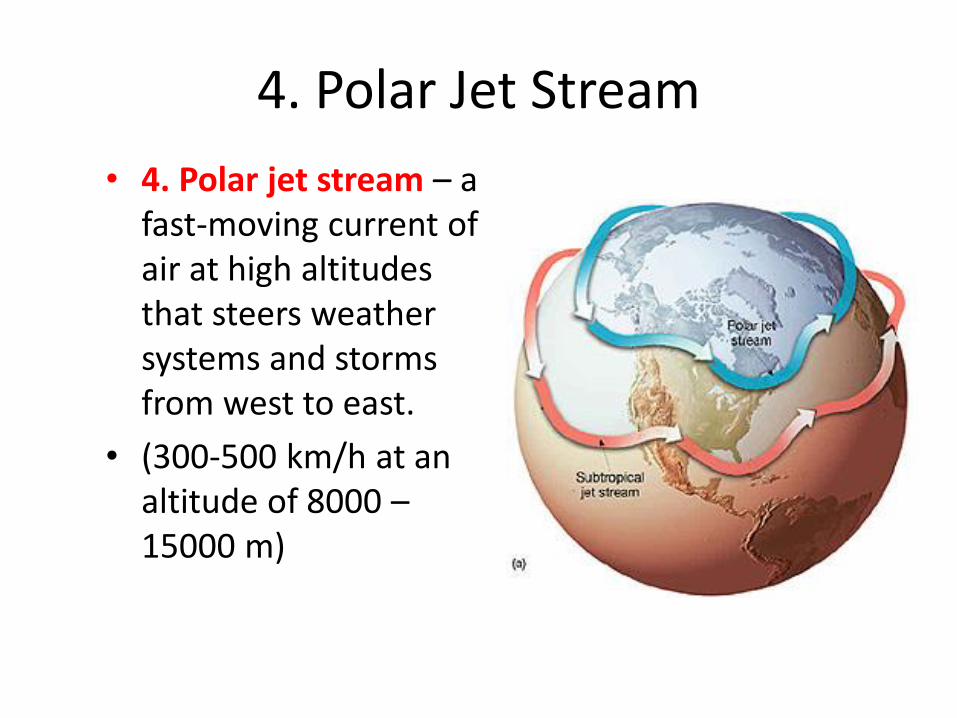
• 4. Polar jet stream – a fast-moving current of air at high altitudes that steers weather systems and storms from west to east.
• (300-500 km/h at an altitude of 8000 –15000 m)
4. Polar Jet Stream
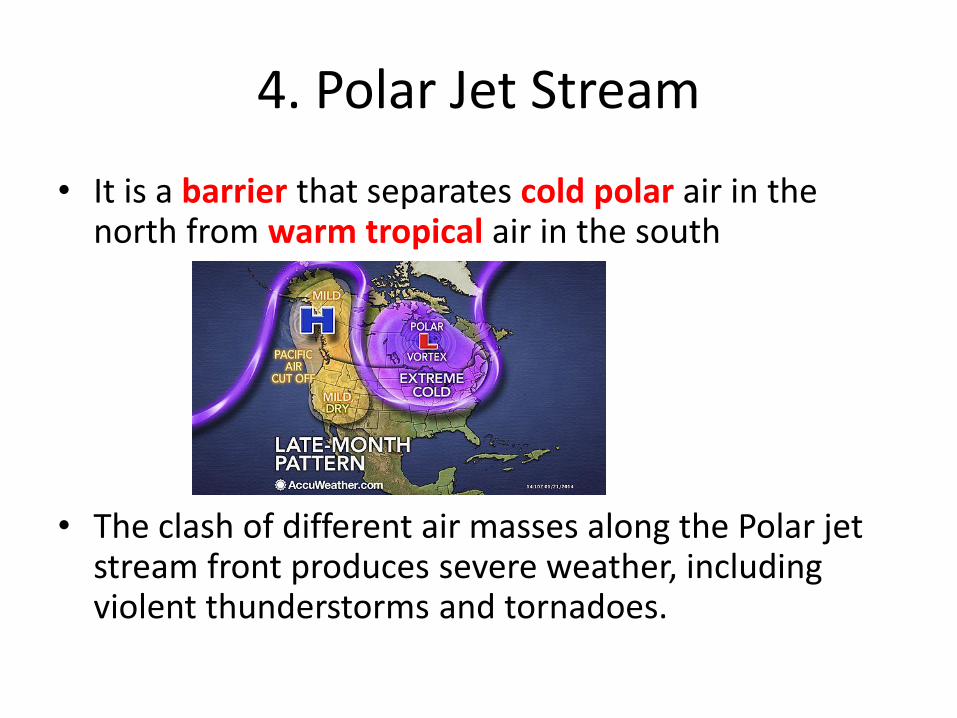
• It is a barrier that separates cold polar air in the north from warm tropical air in the south
• The clash of different air masses along the Polar jet stream front produces severe weather, including violent thunderstorms and tornadoes.
5. Elevation
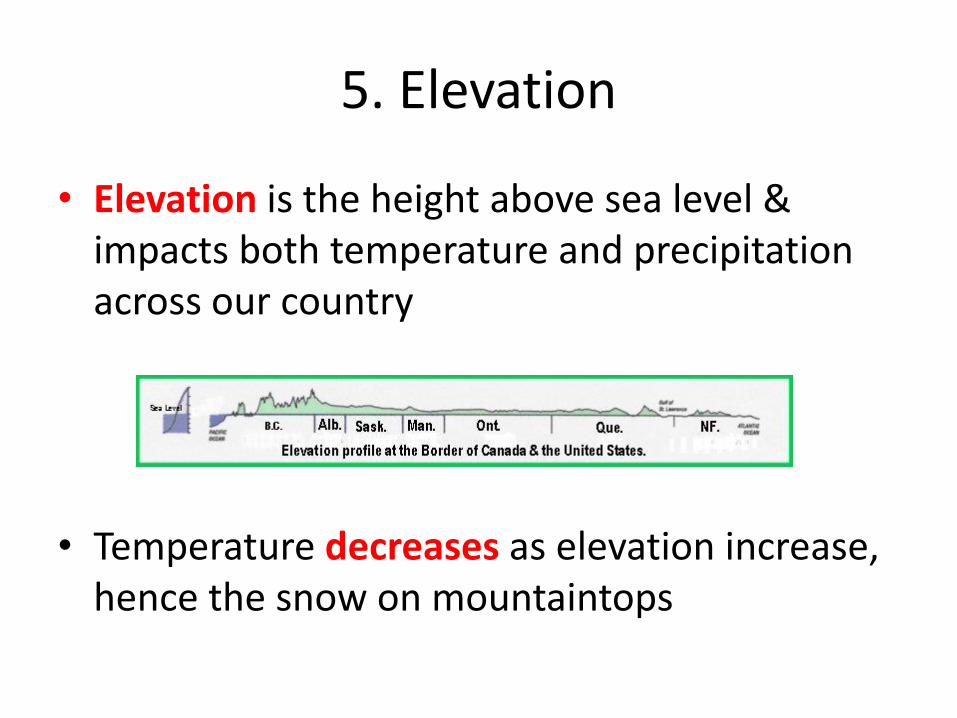
• Elevation is the height above sea level & impacts both temperature and precipitation across our country
• Temperature decreases as elevation increase, hence the snow on mountaintops
5. Elevation
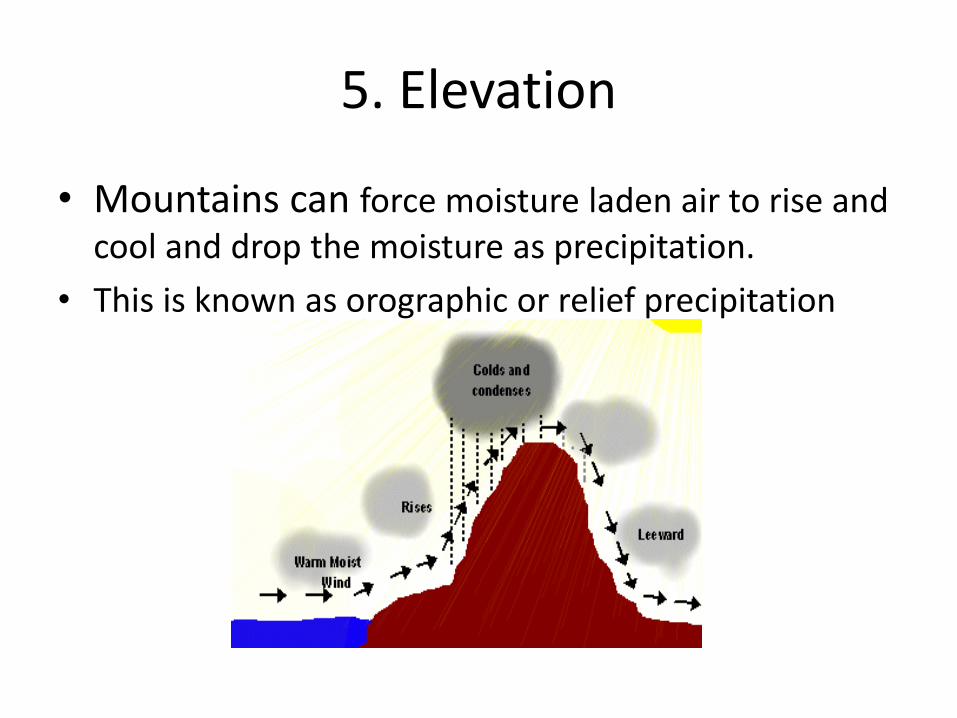
• Mountains can force moisture laden air to rise and cool and drop the moisture as precipitation.
• This is known as orographic or relief precipitation
5. Elevation: Orographic Precip
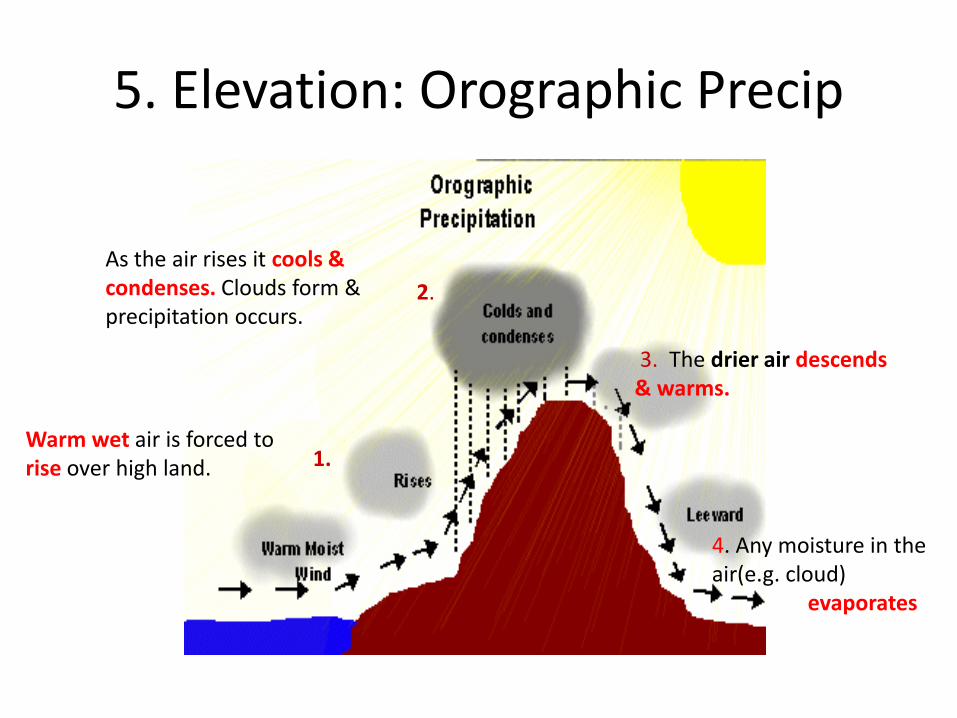
1.Warm wet air is forced to rise over high land.
2.
As the air rises it cools & condenses. Clouds form & precipitation occurs.
3. The drier air descends & warms.
4. Any moisture in the air(e.g. cloud)
evaporates
5. Elevation: Orographic Precip
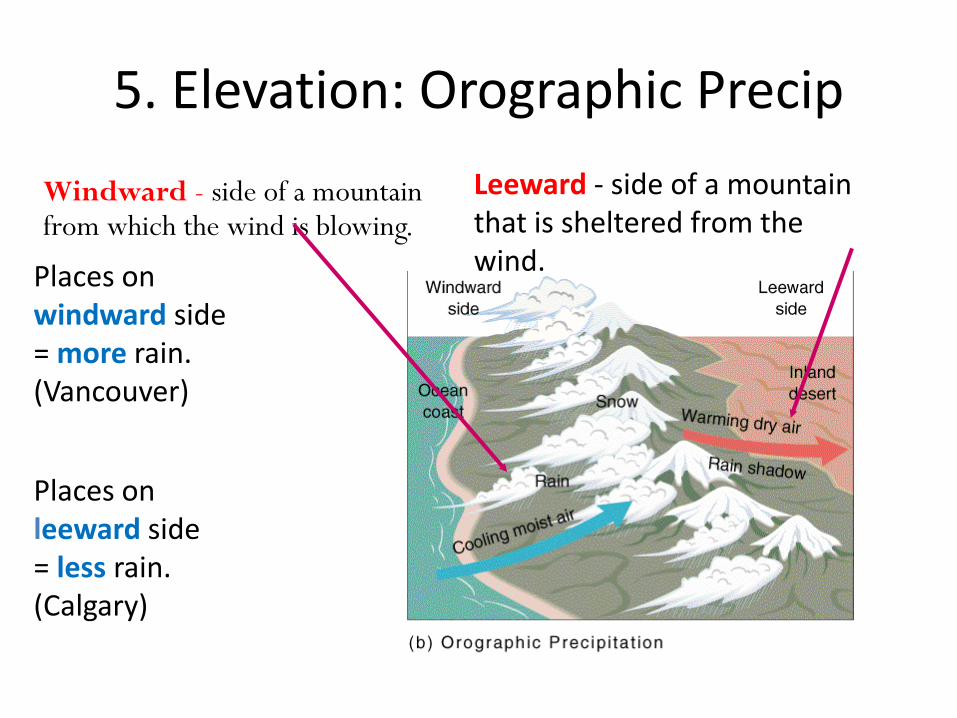
Windward - side of a mountain from which the wind is blowing.
Leeward - side of a mountain that is sheltered from the wind.Places on
windward side = more rain. (Vancouver)
Places on leeward side = less rain. (Calgary)
6. Large Bodies of Water
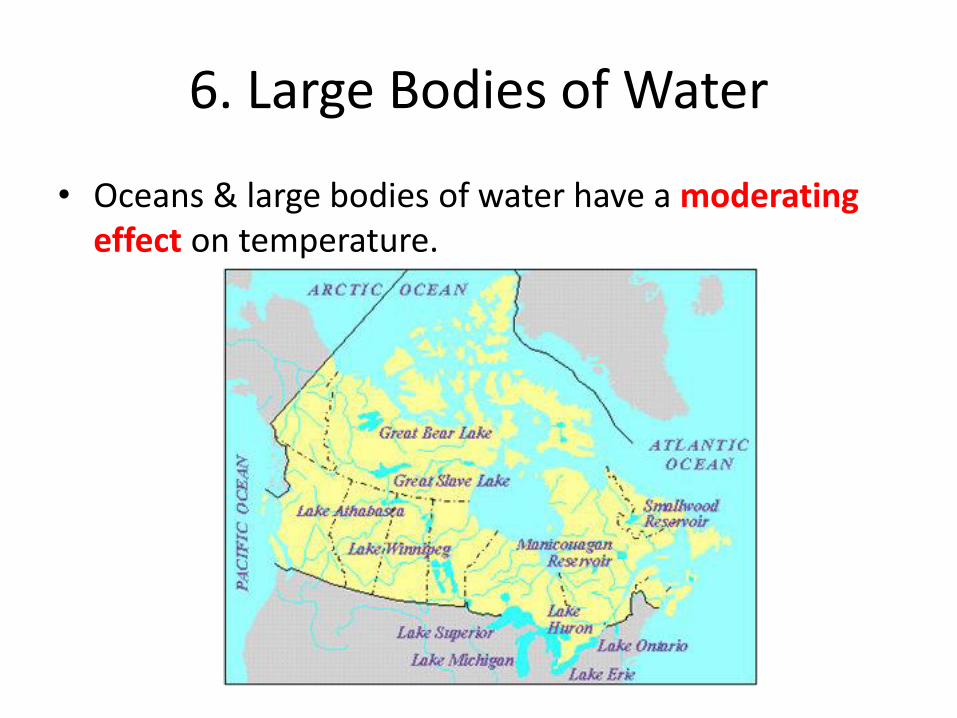
• Oceans & large bodies of water have a moderating effect on temperature.
6. Large Bodies of Water
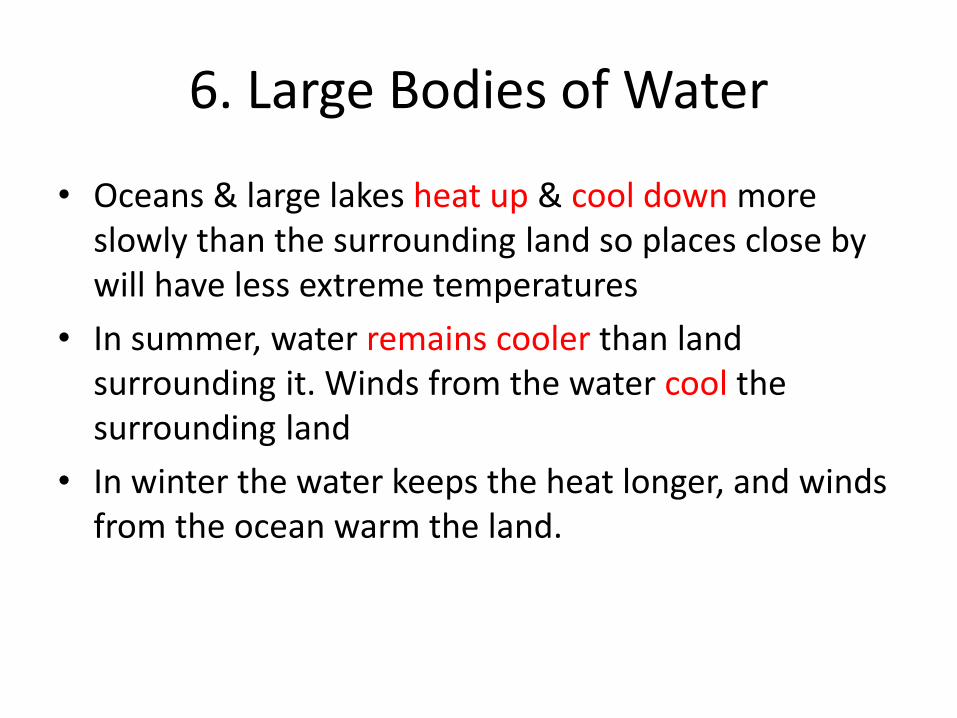
• Oceans & large lakes heat up & cool down more slowly than the surrounding land so places close by will have less extreme temperatures
• In summer, water remains cooler than land surrounding it. Winds from the water cool the surrounding land
• In winter the water keeps the heat longer, and winds from the ocean warm the land.
6. Large Bodies of Water
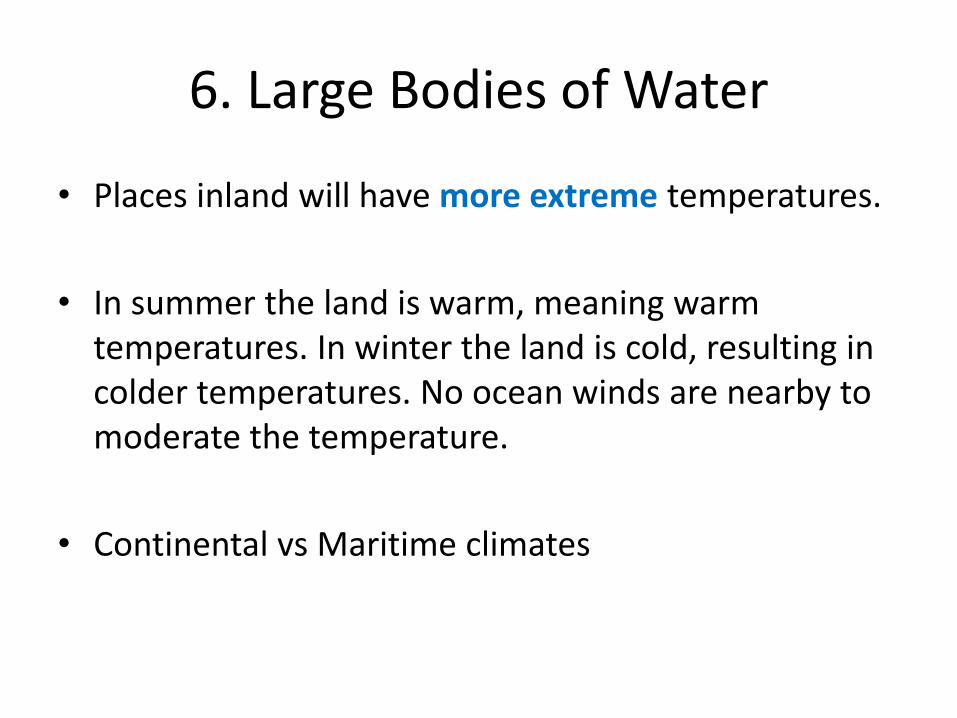
• Places inland will have more extreme temperatures.
• In summer the land is warm, meaning warm temperatures. In winter the land is cold, resulting in colder temperatures. No ocean winds are nearby to moderate the temperature.
• Continental vs Maritime climates
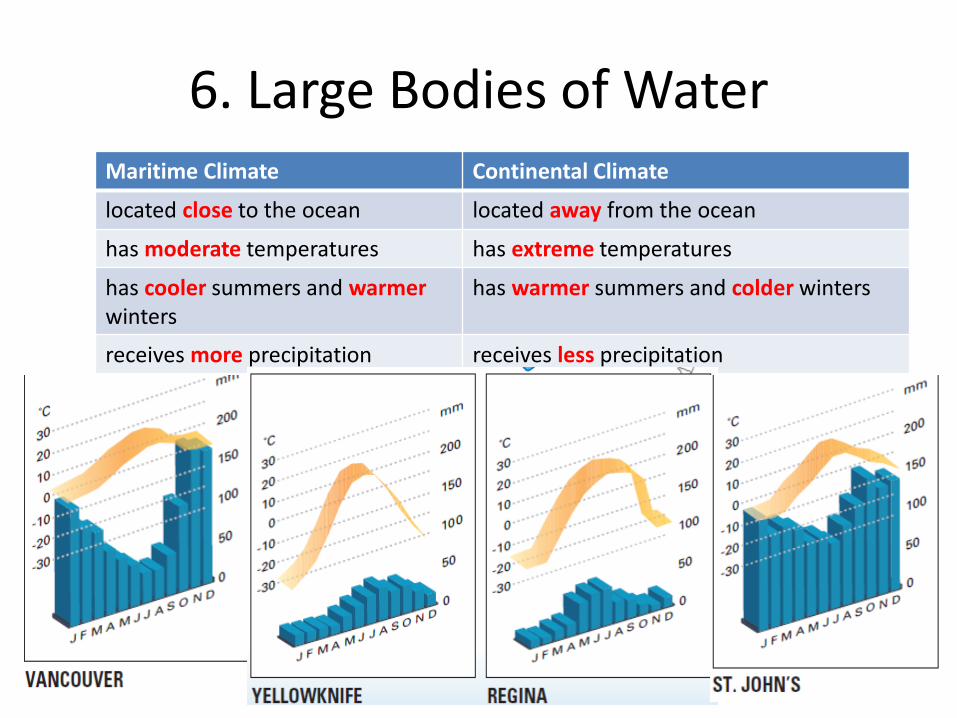
6. Large Bodies of Water Maritime Climate Continental Climate
located close to the ocean located away from the ocean
has moderate temperatures has extreme temperatures
has cooler summers and warmerwinters
has warmer summers and colder winters
receives more precipitation receives less precipitation
Canadian Climate Analysis: Designing Climate Graphs
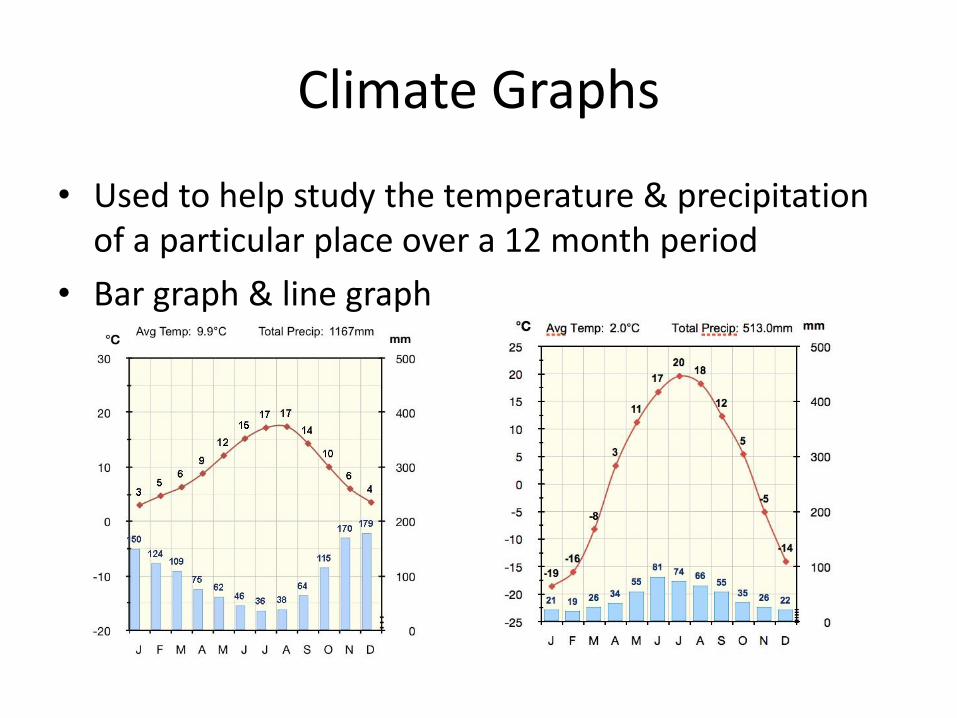
Climate Graphs
• Used to help study the temperature & precipitation of a particular place over a 12 month period
• Bar graph & line graph
Climate graph Features
• Precipitation
• Temperature
• Months
• Title
• Labels
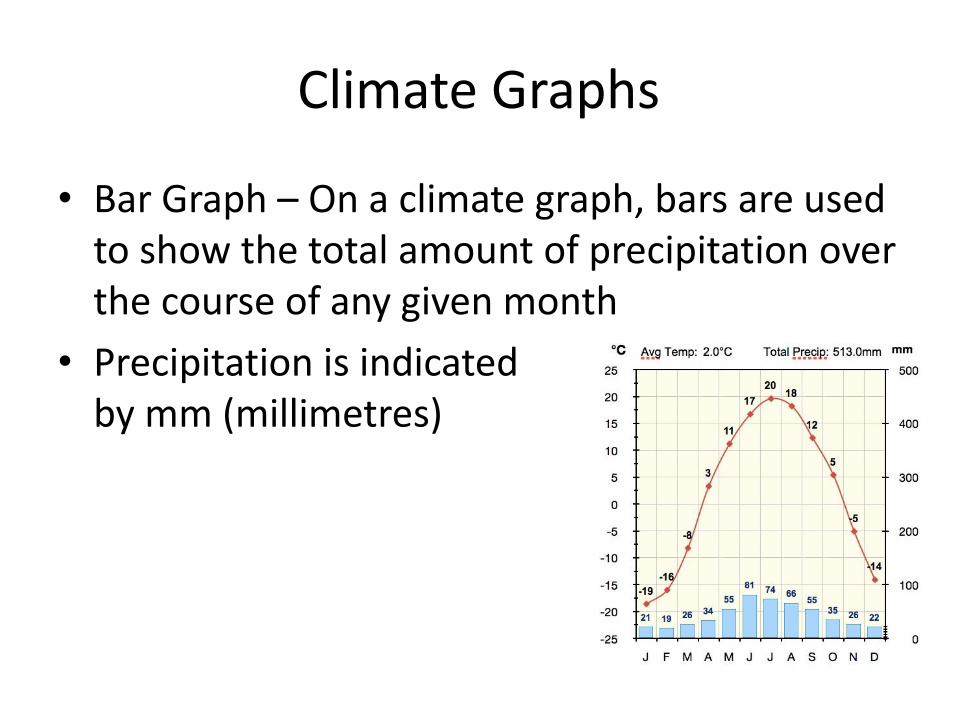
Climate Graphs
• Bar Graph – On a climate graph, bars are used to show the total amount of precipitation over the course of any given month
• Precipitation is indicated by mm (millimetres)
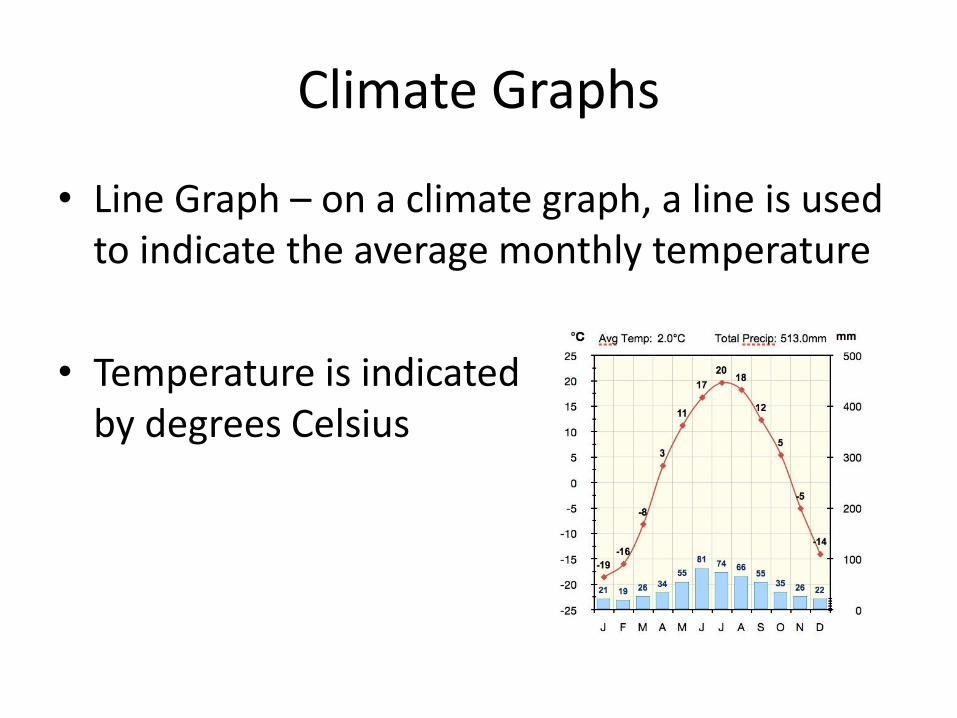
Climate Graphs
• Line Graph – on a climate graph, a line is used to indicate the average monthly temperature
• Temperature is indicated by degrees Celsius
Canada’s Natural Vegetation Systems
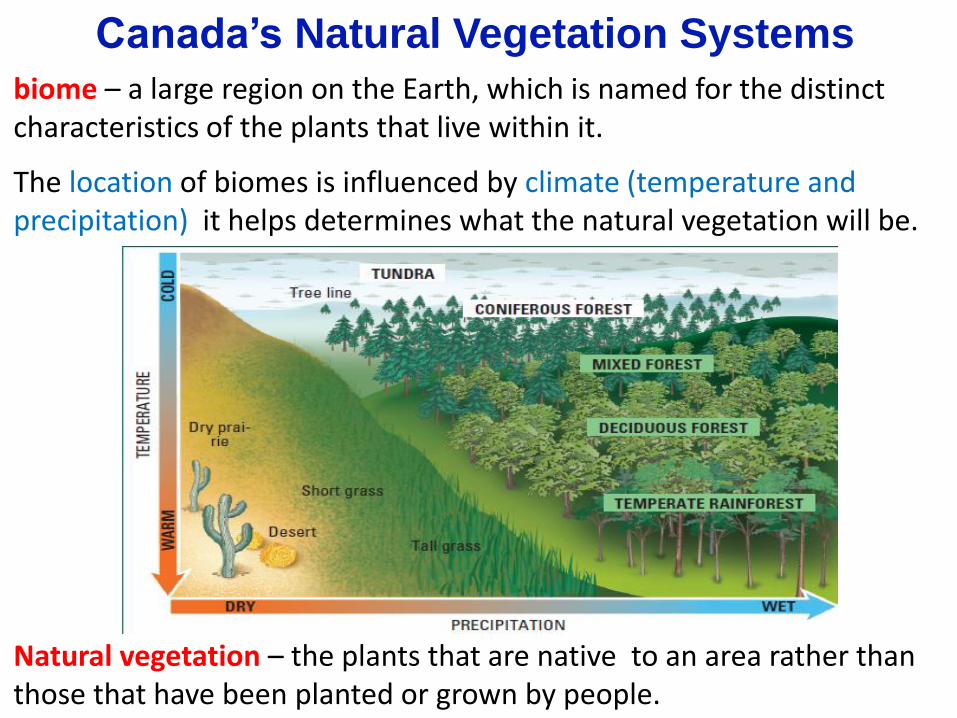
biome – a large region on the Earth, which is named for the distinct characteristics of the plants that live within it.
The location of biomes is influenced by climate (temperature and precipitation) it helps determines what the natural vegetation will be.
Natural vegetation – the plants that are native to an area rather than those that have been planted or grown by people.
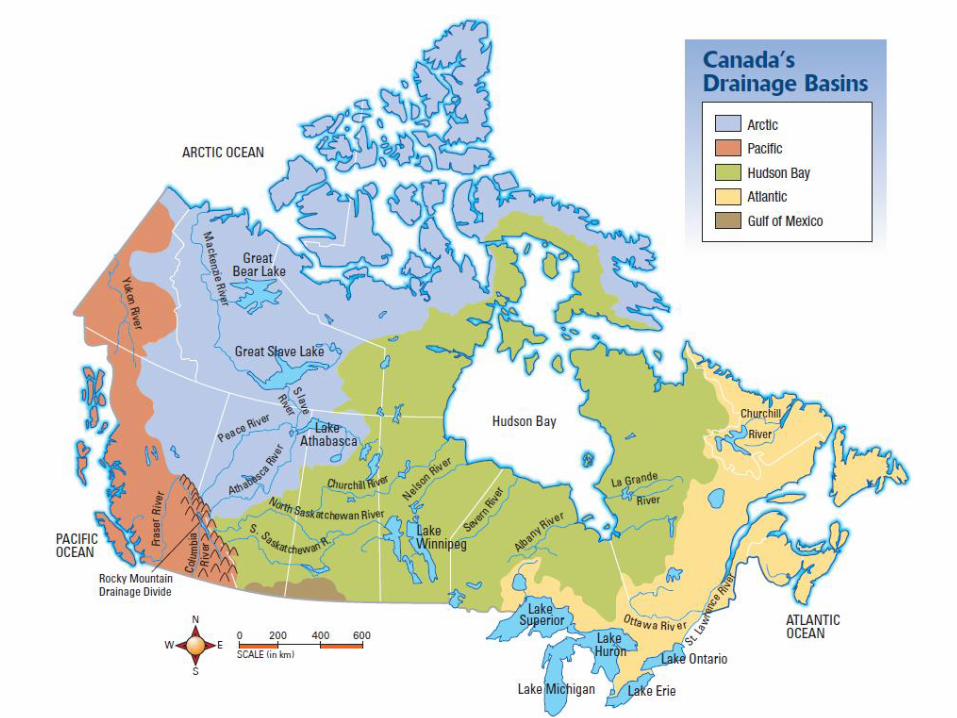
Canada’s Water Systems
Much of the water that falls in Canada ends up in an interconnected network of waterways that include:• Lakes Rivers Wetlands Groundwater
Wetlands – a place where the water table is at ground level.
Groundwater – water found beneath the earth’s surface in the spaces in soil and bedrock.
Runoff – water that runs off the land in rivers and lakes.
Drainage basin - the area of land from which all water received as precipitation flows to a particular ocean.
Watershed – the area of land that drains into a particular river system or body of water.
Drainage divide – a narrow place of high land that separates one drainage basin from another.
• Canada has about two million lakes!• Great Lakes system is the largest of the Atlantic Ocean drainage basin• 9 million Canadians and 31 million Americans depend on the water• Toronto alone uses about 540 billion litres of water per year• Used for agriculture, industry, manufacturing, fishing, hydroelectric
and thermal power, and recreation

Which parts of this river system would be labelled youthful, mature, or old?
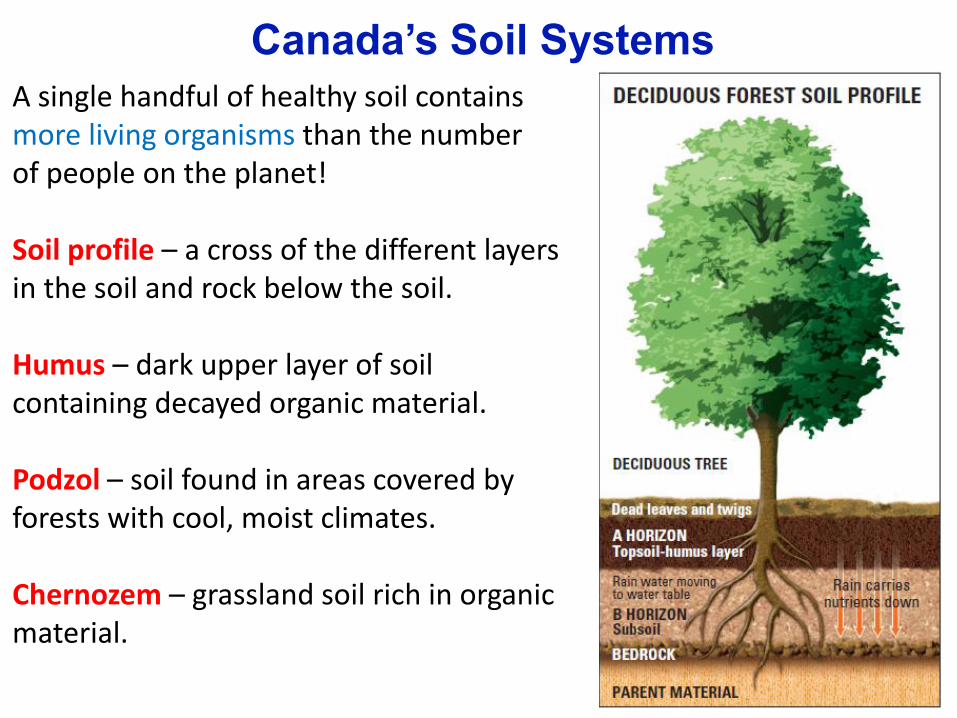
Canada’s Soil Systems
A single handful of healthy soil contains more living organisms than the numberof people on the planet!
Soil profile – a cross of the different layers in the soil and rock below the soil.
Humus – dark upper layer of soil containing decayed organic material.
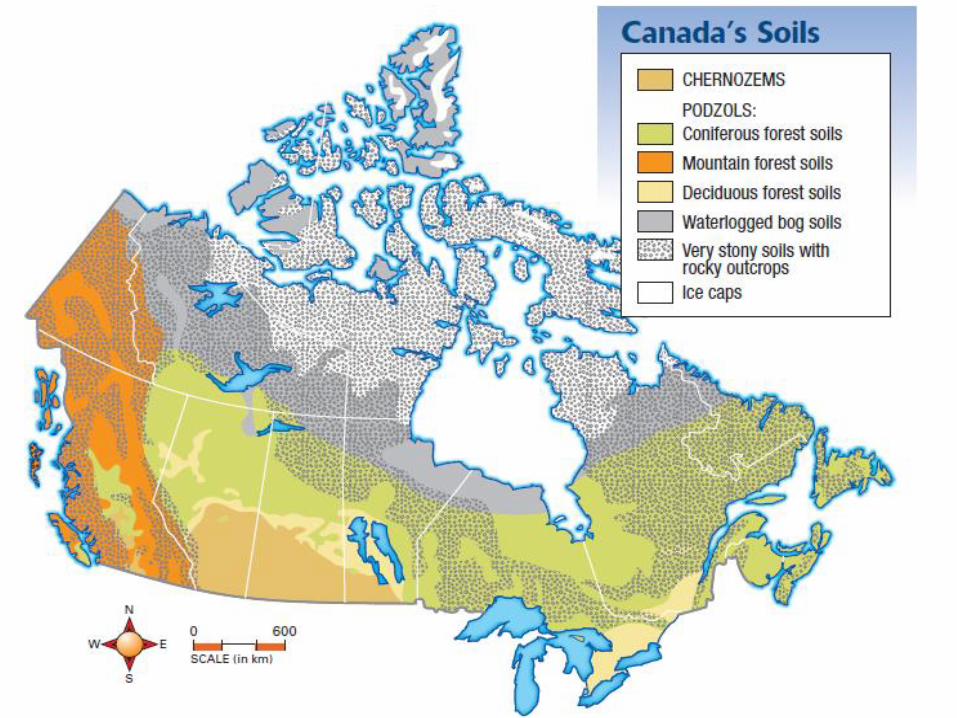
Podzol – soil found in areas covered by forests with cool, moist climates.
Chernozem – grassland soil rich in organic material.
Functions of soil include:
• A place to grow food• Supports trees that provide oxygen• Soaks up and purifies water
People have increased the use of fertilizers to enrich soils, and pesticides to kill pests that harm crops.
However fertilizers can get into water and encourage plant growth. As the plants die and decompose it reduces the oxygen in the water that fish need.
Pesticides kill many of the creatures that make the soil system work well.
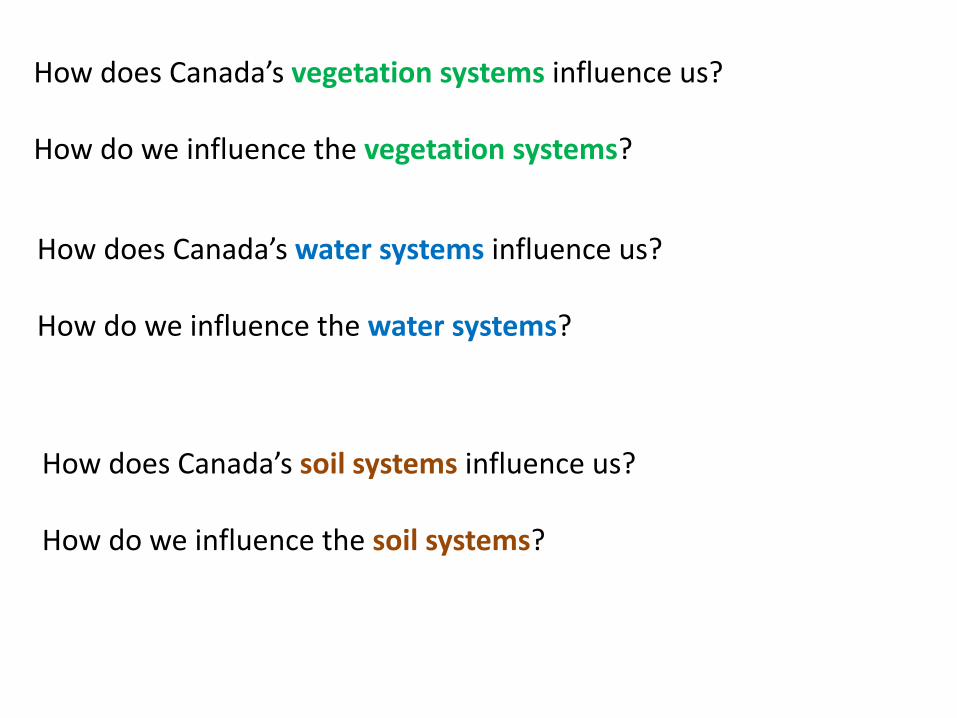
How does Canada’s vegetation systems influence us?
How do we influence the vegetation systems?
How does Canada’s water systems influence us?
How do we influence the water systems?
How does Canada’s soil systems influence us?
How do we influence the soil systems?
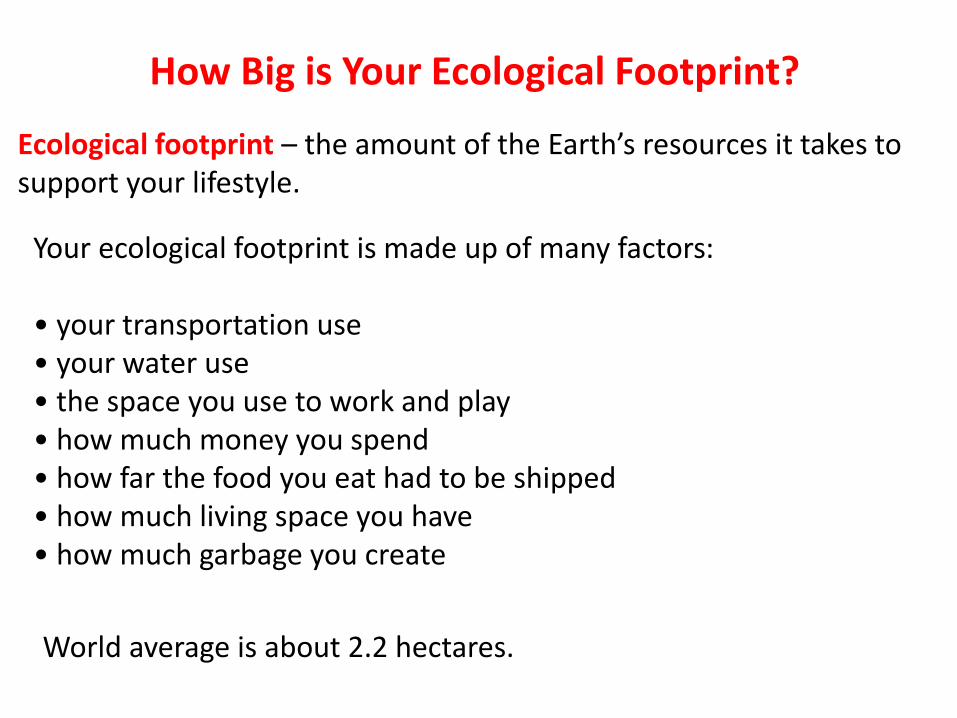
How Big is Your Ecological Footprint?
Ecological footprint – the amount of the Earth’s resources it takes to support your lifestyle.
Your ecological footprint is made up of many factors:
• your transportation use• your water use• the space you use to work and play• how much money you spend• how far the food you eat had to be shipped• how much living space you have• how much garbage you create
World average is about 2.2 hectares.
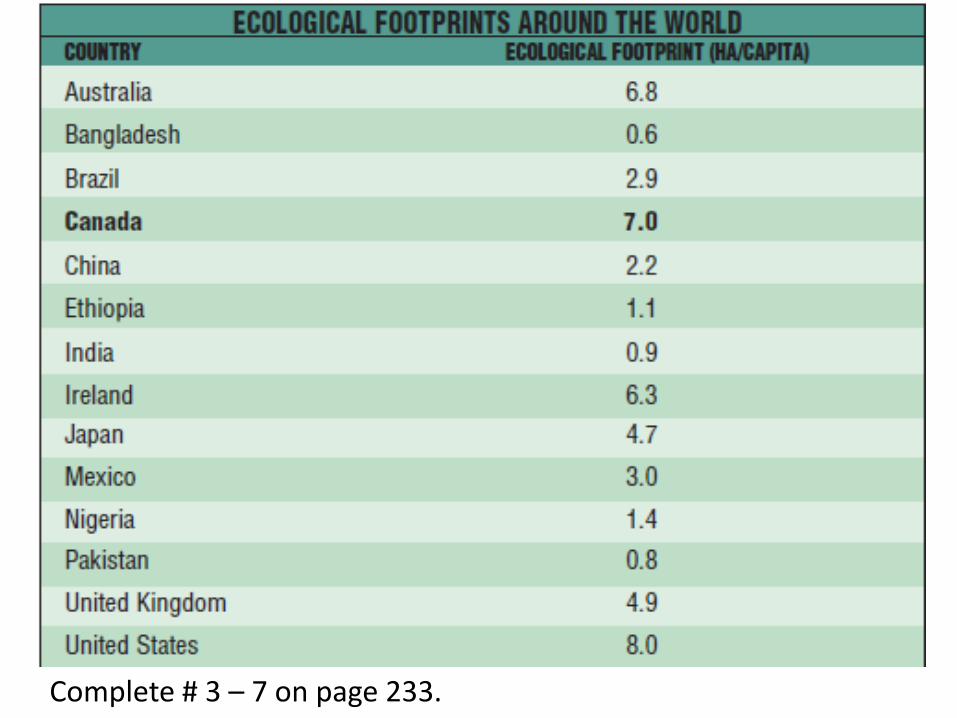
Complete # 3 – 7 on page 233.