Embed Size (px)
Citation preview

CANADIAN MANUFACTURING In a Global Context
THE FUTURE OF CANADIANMANUFACTURING:LEARNING FROM LEADING FIRMS
Canadian Manufacturing: In a Global Context
Andrew Dooner
Lawrence National Centre for Policy and Management
Lawrence National Centre for Policy and Management
Lawrence National Centre for Policy and Management
Lawrence National Centre for Policy and Management
Lawrence National Centre for Policy and Management
Lawrence National Centre for Policy and Management
Unit logo examples
Unit full signature examples
PMS 3308PMS 268
PMS 3308PMS 268 Lawrence National Centre
for Policy and Management
CMYK
100% K
Cool Grey 9
Reverse Reference
Reverse Version
Light GreyPMS Cool Grey 7
C 0M 0 Y 0K 47
Warm GreyPMS 416
C 28M 185 Y 29K 51
Light Warm GreyPMS 414
C 13M 8 Y 17K 26
SandPMS 4525
C 9M 12 Y 47K 18
CANADIAN MANUFACTURING In a Global Context
CANADIAN MANUFACTURING: IN A GLOBAL CONTEXT
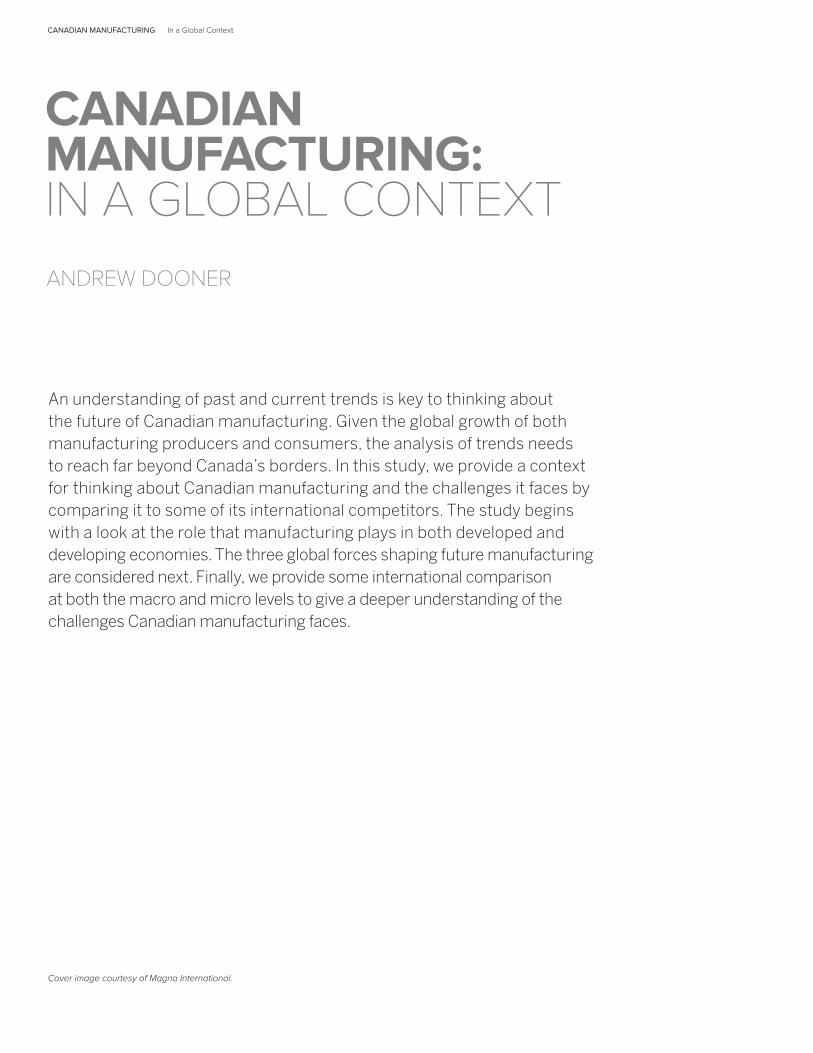
An understanding of past and current trends is key to thinking about the future of Canadian manufacturing. Given the global growth of both manufacturing producers and consumers, the analysis of trends needs to reach far beyond Canada’s borders. In this study, we provide a context for thinking about Canadian manufacturing and the challenges it faces by comparing it to some of its international competitors. The study begins with a look at the role that manufacturing plays in both developed and developing economies. The three global forces shaping future manufacturing are considered next. Finally, we provide some international comparison at both the macro and micro levels to give a deeper understanding of the challenges Canadian manufacturing faces.
ANDREW DOONER
Cover image courtesy of Magna International.
CANADIAN MANUFACTURING In a Global Context
Figure 1.1 Manufacturing in the global context World GDP growth and mix by sector (nominal USD, billions)!
Source: World Development Indicators Database (2013)"
Industry"
Services"
Manufacturing"
Agriculture"
2012"
71,918!
70%"
17%"
10%"3%"
2000"
32,347!
67%"
19%"10%" 4%"
CAGR %!6.9
4.4
6.9
5.9
7.3
1. The World Bank (2013). World Databank, World Development Indicators. Available at: http://databank.worldbank.org/data/views/variableSelection/selectvariables.aspx?source=world-development-indicators.
2. The World Bank (2013). World Databank, World Development Indicators. Available at: http://databank.worldbank.org/data/views/variableSelection/selectvariables.aspx?source=world-development-indicators.
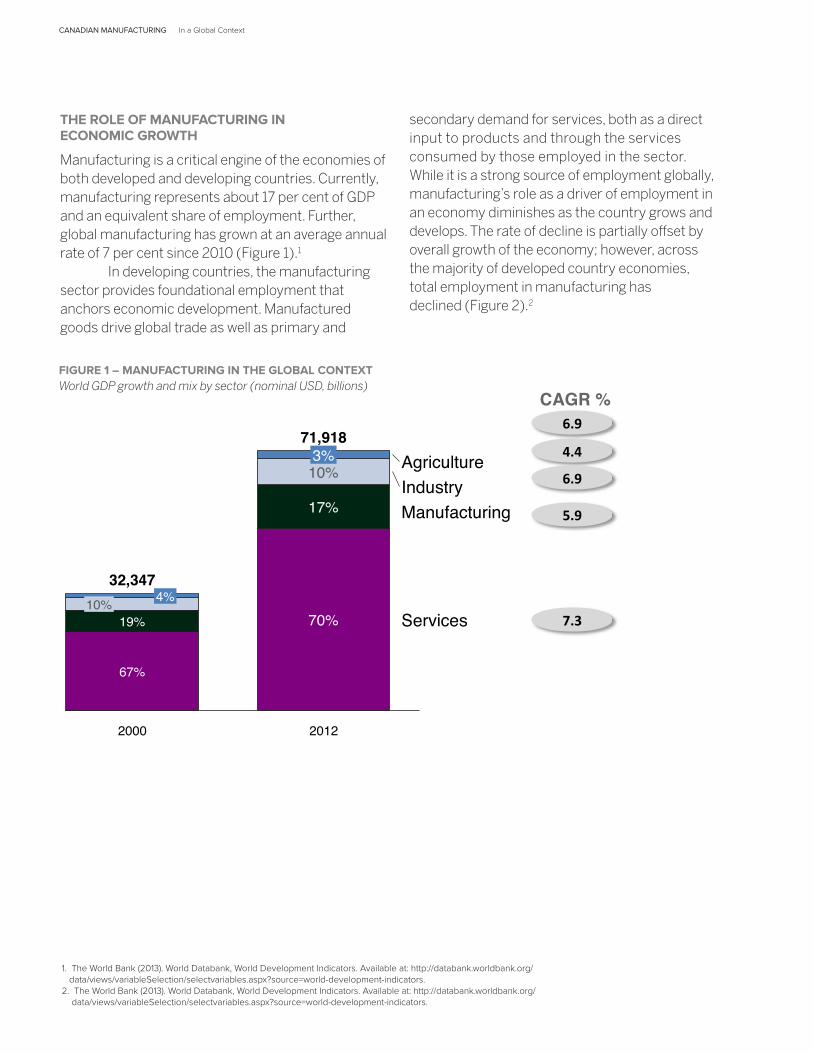
FIGURE 1 – MANUFACTURING IN THE GLOBAL CONTEXT World GDP growth and mix by sector (nominal USD, billions)
THE ROLE OF MANUFACTURING IN ECONOMIC GROWTH
Manufacturing is a critical engine of the economies of both developed and developing countries. Currently, manufacturing represents about 17 per cent of GDP and an equivalent share of employment. Further, global manufacturing has grown at an average annual rate of 7 per cent since 2010 (Figure 1).1
In developing countries, the manufacturing sector provides foundational employment that anchors economic development. Manufactured goods drive global trade as well as primary and
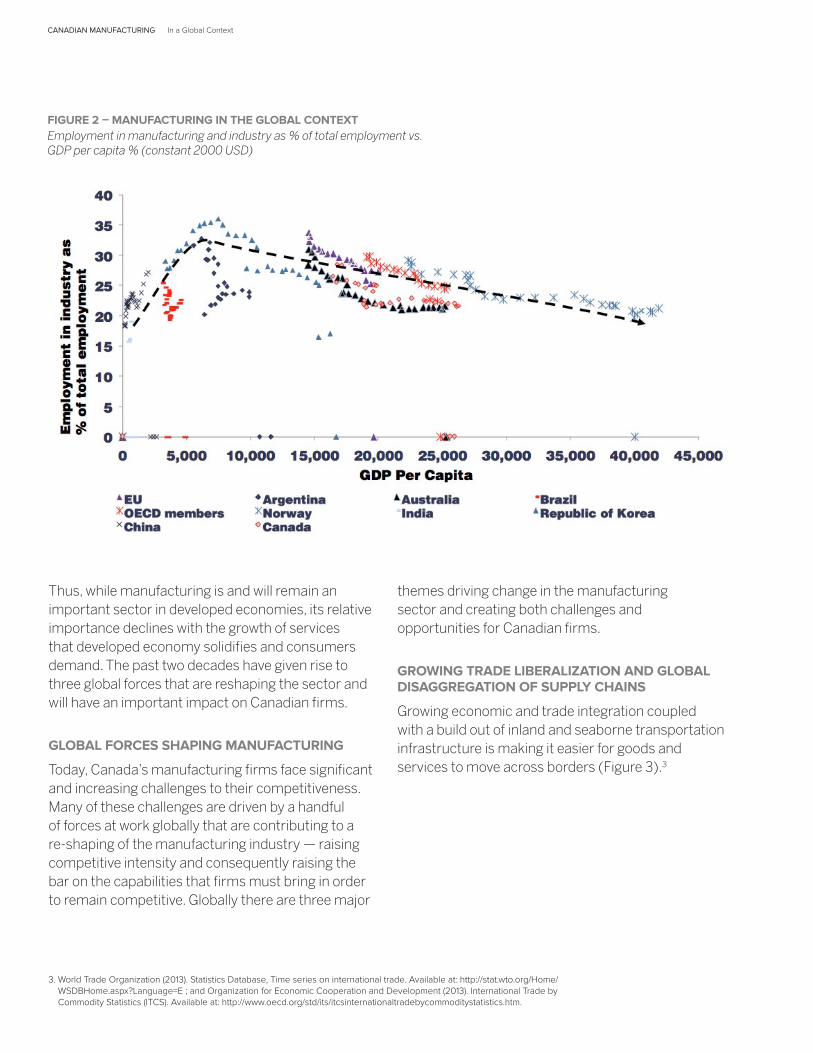
secondary demand for services, both as a direct input to products and through the services consumed by those employed in the sector. While it is a strong source of employment globally, manufacturing’s role as a driver of employment in an economy diminishes as the country grows and develops. The rate of decline is partially offset by overall growth of the economy; however, across the majority of developed country economies, total employment in manufacturing has declined (Figure 2).2
CANADIAN MANUFACTURING In a Global Context
3. World Trade Organization (2013). Statistics Database, Time series on international trade. Available at: http://stat.wto.org/Home/WSDBHome.aspx?Language=E ; and Organization for Economic Cooperation and Development (2013). International Trade by Commodity Statistics (ITCS). Available at: http://www.oecd.org/std/its/itcsinternationaltradebycommoditystatistics.htm.
FIGURE 2 – MANUFACTURING IN THE GLOBAL CONTEXT Employment in manufacturing and industry as % of total employment vs. GDP per capita % (constant 2000 USD)
Thus, while manufacturing is and will remain an important sector in developed economies, its relative importance declines with the growth of services that developed economy solidifies and consumers demand. The past two decades have given rise to three global forces that are reshaping the sector and will have an important impact on Canadian firms.
GLOBAL FORCES SHAPING MANUFACTURING
Today, Canada’s manufacturing firms face significant and increasing challenges to their competitiveness. Many of these challenges are driven by a handful of forces at work globally that are contributing to a re-shaping of the manufacturing industry — raising competitive intensity and consequently raising the bar on the capabilities that firms must bring in order to remain competitive. Globally there are three major
themes driving change in the manufacturing sector and creating both challenges and opportunities for Canadian firms.
GROWING TRADE LIBERALIZATION AND GLOBAL DISAGGREGATION OF SUPPLY CHAINS
Growing economic and trade integration coupled with a build out of inland and seaborne transportation infrastructure is making it easier for goods and services to move across borders (Figure 3).3
CANADIAN MANUFACTURING In a Global Context
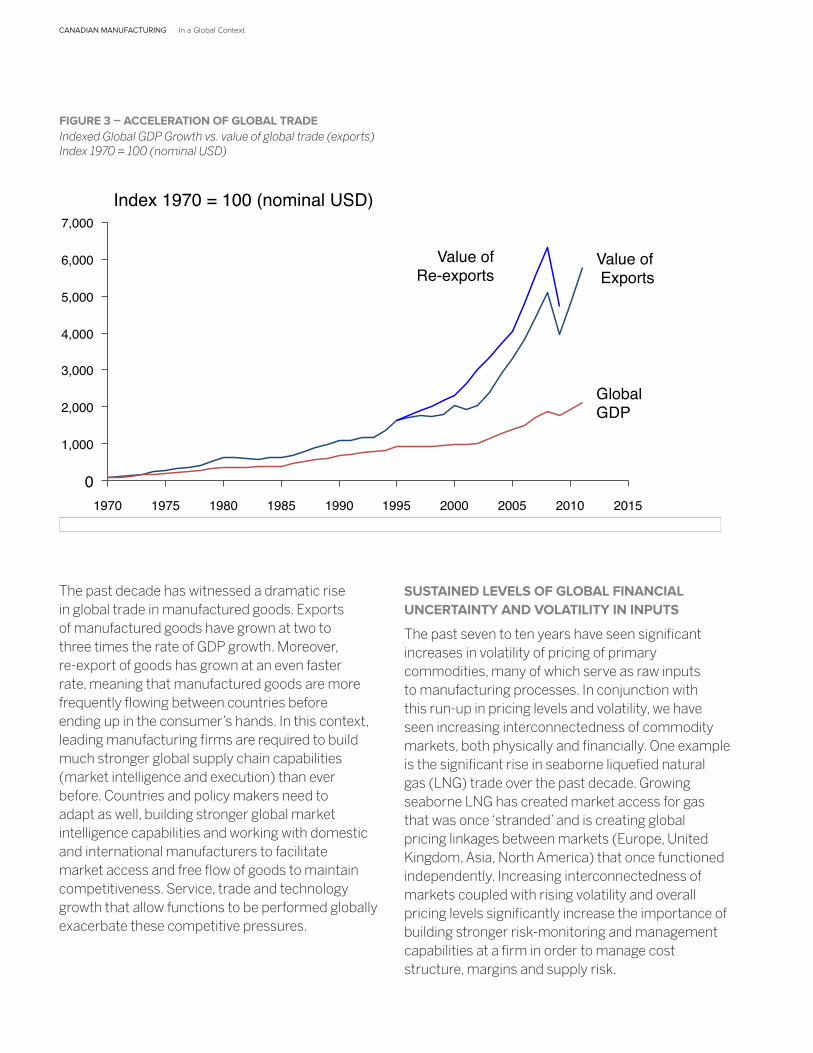
The past decade has witnessed a dramatic rise in global trade in manufactured goods. Exports of manufactured goods have grown at two to three times the rate of GDP growth. Moreover, re-export of goods has grown at an even faster rate, meaning that manufactured goods are more frequently flowing between countries before ending up in the consumer’s hands. In this context, leading manufacturing firms are required to build much stronger global supply chain capabilities (market intelligence and execution) than ever before. Countries and policy makers need to adapt as well, building stronger global market intelligence capabilities and working with domestic and international manufacturers to facilitate market access and free flow of goods to maintain competitiveness. Service, trade and technology growth that allow functions to be performed globally exacerbate these competitive pressures.
FIGURE 3 – ACCELERATION OF GLOBAL TRADEIndexed Global GDP Growth vs. value of global trade (exports)Index 1970 = 100 (nominal USD)
Figure 1.3 Acceleration of global trade"
1975"
5,000"
6,000"
4,000"
3,000"
2,000"
1,000"
0"1985" 2010"
7,000"
2000" 2015"1990" 1995"1980" 2005"1970"
Global "GDP"
Value of" Exports"
Value ofRe-exports"
Source: WTO Trade Database; OECD Trade Statistics (2013)"
Indexed Global GDP Growth vs. value of global trade (exports) "Index 1970 = 100 (nominal USD)"
SUSTAINED LEVELS OF GLOBAL FINANCIAL UNCERTAINTY AND VOLATILITY IN INPUTS
The past seven to ten years have seen significant increases in volatility of pricing of primary commodities, many of which serve as raw inputs to manufacturing processes. In conjunction with this run-up in pricing levels and volatility, we have seen increasing interconnectedness of commodity markets, both physically and financially. One example is the significant rise in seaborne liquefied natural gas (LNG) trade over the past decade. Growing seaborne LNG has created market access for gas that was once ‘stranded’ and is creating global pricing linkages between markets (Europe, United Kingdom, Asia, North America) that once functioned independently. Increasing interconnectedness of markets coupled with rising volatility and overall pricing levels significantly increase the importance of building stronger risk-monitoring and management capabilities at a firm in order to manage cost structure, margins and supply risk.
CANADIAN MANUFACTURING In a Global Context
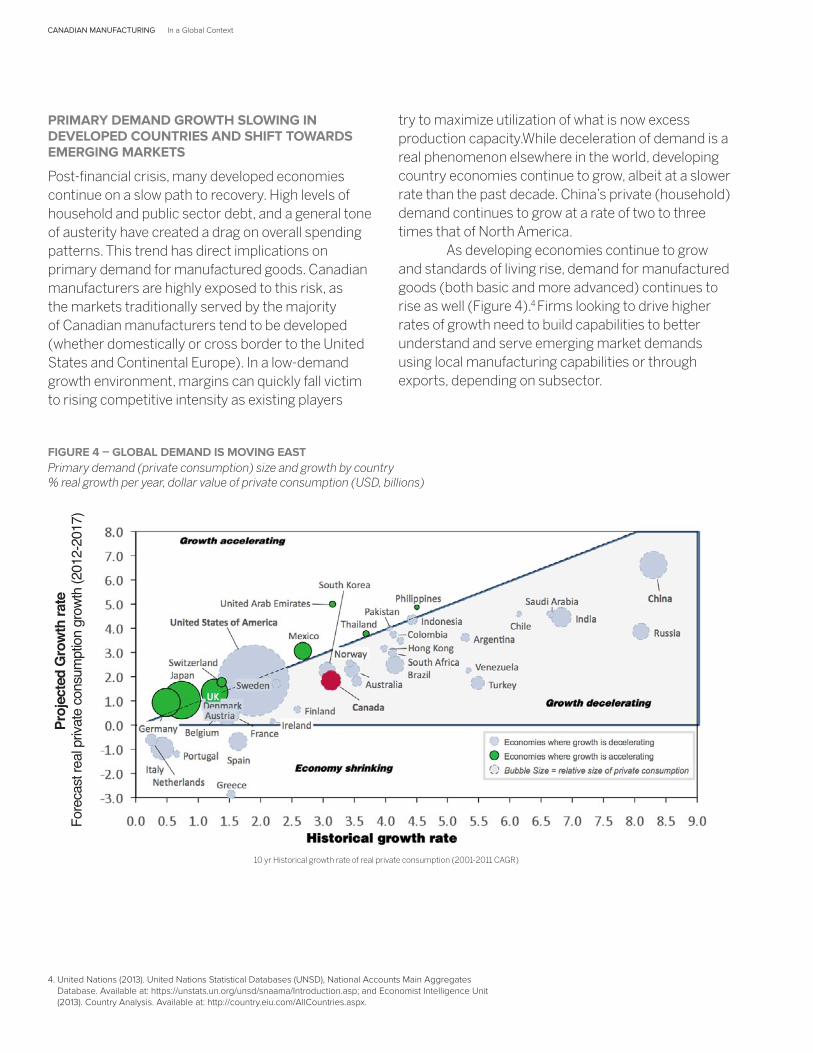
PRIMARY DEMAND GROWTH SLOWING IN DEVELOPED COUNTRIES AND SHIFT TOWARDS EMERGING MARKETS
Post-financial crisis, many developed economies continue on a slow path to recovery. High levels of household and public sector debt, and a general tone of austerity have created a drag on overall spending patterns. This trend has direct implications on primary demand for manufactured goods. Canadian manufacturers are highly exposed to this risk, as the markets traditionally served by the majority of Canadian manufacturers tend to be developed (whether domestically or cross border to the United States and Continental Europe). In a low-demand growth environment, margins can quickly fall victim to rising competitive intensity as existing players
4. United Nations (2013). United Nations Statistical Databases (UNSD), National Accounts Main Aggregates Database. Available at: https://unstats.un.org/unsd/snaama/Introduction.asp; and Economist Intelligence Unit (2013). Country Analysis. Available at: http://country.eiu.com/AllCountries.aspx.
FIGURE 4 – GLOBAL DEMAND IS MOVING EAST Primary demand (private consumption) size and growth by country % real growth per year, dollar value of private consumption (USD, billions)
10 yr Historical growth rate of real private consumption (2001-2011 CAGR)
try to maximize utilization of what is now excess production capacity.While deceleration of demand is a real phenomenon elsewhere in the world, developing country economies continue to grow, albeit at a slower rate than the past decade. China’s private (household) demand continues to grow at a rate of two to three times that of North America. As developing economies continue to grow and standards of living rise, demand for manufactured goods (both basic and more advanced) continues to rise as well (Figure 4).4 Firms looking to drive higher rates of growth need to build capabilities to better understand and serve emerging market demands using local manufacturing capabilities or through exports, depending on subsector.
CANADIAN MANUFACTURING In a Global Context
CANADA’S MANUFACTURING SECTOR IN COMPARISON
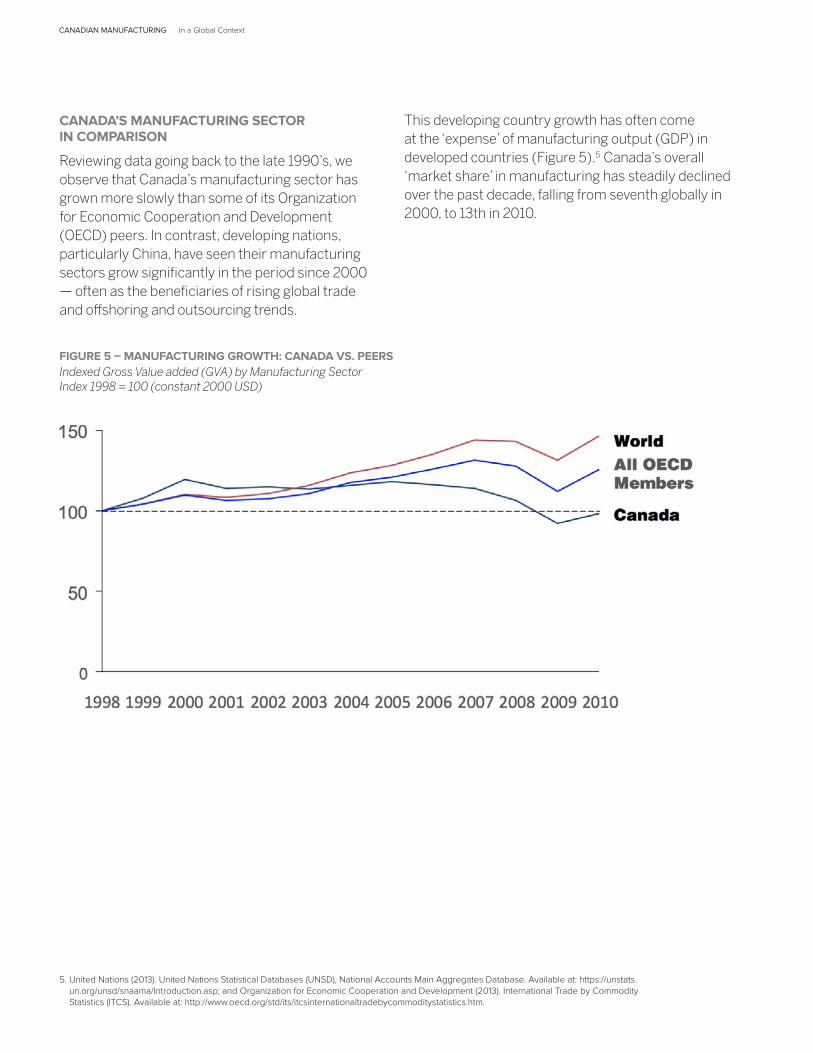
Reviewing data going back to the late 1990’s, we observe that Canada’s manufacturing sector has grown more slowly than some of its Organization for Economic Cooperation and Development (OECD) peers. In contrast, developing nations, particularly China, have seen their manufacturing sectors grow significantly in the period since 2000 — often as the beneficiaries of rising global trade and offshoring and outsourcing trends.
FIGURE 5 – MANUFACTURING GROWTH: CANADA VS. PEERSIndexed Gross Value added (GVA) by Manufacturing Sector Index 1998 = 100 (constant 2000 USD)
This developing country growth has often come at the ‘expense’ of manufacturing output (GDP) in developed countries (Figure 5).5 Canada’s overall ‘market share’ in manufacturing has steadily declined over the past decade, falling from seventh globally in 2000, to 13th in 2010.
5. United Nations (2013). United Nations Statistical Databases (UNSD), National Accounts Main Aggregates Database. Available at: https://unstats.un.org/unsd/snaama/Introduction.asp; and Organization for Economic Cooperation and Development (2013). International Trade by Commodity Statistics (ITCS). Available at: http://www.oecd.org/std/its/itcsinternationaltradebycommoditystatistics.htm.
CANADIAN MANUFACTURING In a Global Context
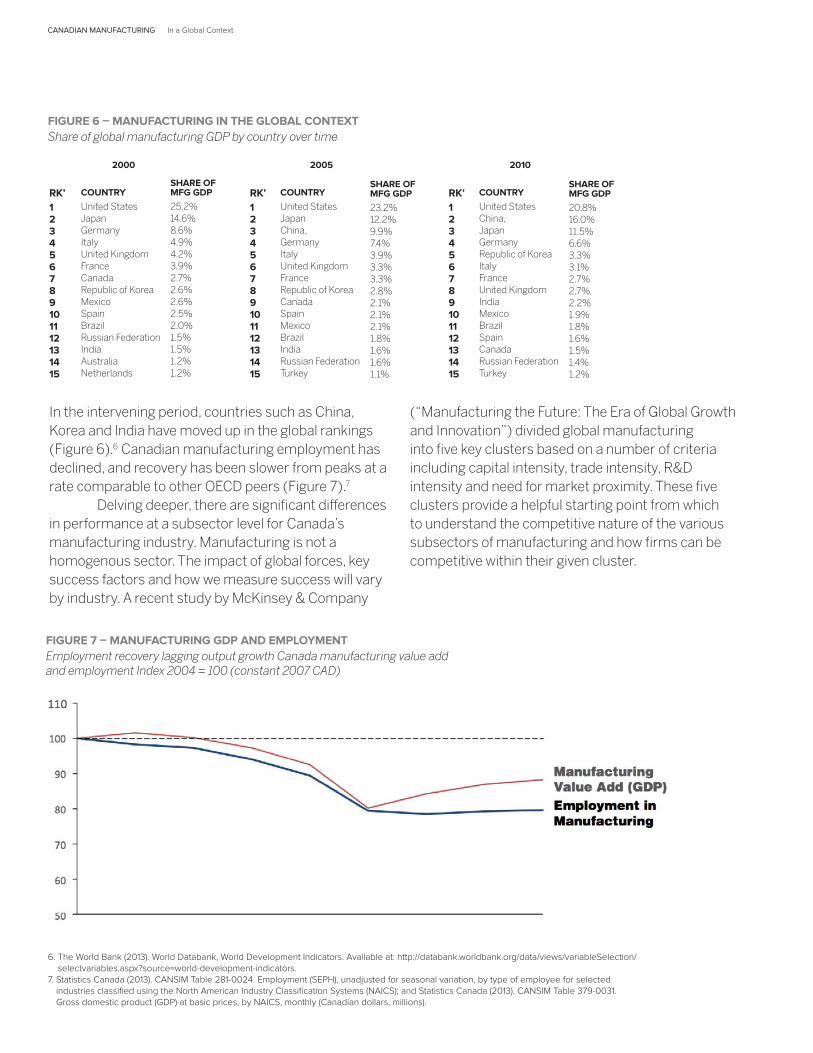
In the intervening period, countries such as China, Korea and India have moved up in the global rankings (Figure 6).6 Canadian manufacturing employment has declined, and recovery has been slower from peaks at a rate comparable to other OECD peers (Figure 7).7
Delving deeper, there are significant differences in performance at a subsector level for Canada’s manufacturing industry. Manufacturing is not a homogenous sector. The impact of global forces, key success factors and how we measure success will vary by industry. A recent study by McKinsey & Company
(“Manufacturing the Future: The Era of Global Growth and Innovation”) divided global manufacturing into five key clusters based on a number of criteria including capital intensity, trade intensity, R&D intensity and need for market proximity. These five clusters provide a helpful starting point from which to understand the competitive nature of the various subsectors of manufacturing and how firms can be competitive within their given cluster.
FIGURE 6 – MANUFACTURING IN THE GLOBAL CONTEXTShare of global manufacturing GDP by country over time
RK’123456789101112131415
COUNTRY
United StatesJapanGermanyItalyUnited KingdomFranceCanadaRepublic of KoreaMexicoSpainBrazilRussian FederationIndiaAustraliaNetherlands
2000
SHARE OFMFG GDP
25.2%14.6%8.6%4.9%4.2%3.9%2.7%2.6%2.6%2.5%2.0%1.5%1.5%1.2%1.2%
RK’123456789101112131415
COUNTRY
United StatesJapanChina,GermanyItalyUnited KingdomFranceRepublic of KoreaCanadaSpainMexicoBrazilIndiaRussian FederationTurkey
2005
SHARE OFMFG GDP
23.2%12.2%9.9%7.4%3.9%3.3%3.3%2.8%2.1%2.1%2.1%1.8%1.6%1.6%1.1%
RK’123456789101112131415
COUNTRY
United StatesChina,JapanGermanyRepublic of KoreaItalyFranceUnited KingdomIndiaMexicoBrazilSpainCanadaRussian FederationTurkey
2010
SHARE OFMFG GDP
20.8%16.0%11.5%6.6%3.3%3.1%2.7%2.7%2.2%1.9%1.8%1.6%1.5%1.4%1.2%
6. The World Bank (2013). World Databank, World Development Indicators. Available at: http://databank.worldbank.org/data/views/variableSelection/selectvariables.aspx?source=world-development-indicators.
7. Statistics Canada (2013). CANSIM Table 281-0024. Employment (SEPH), unadjusted for seasonal variation, by type of employee for selected industries classified using the North American Industry Classification Systems (NAICS); and Statistics Canada (2013). CANSIM Table 379-0031. Gross domestic product (GDP) at basic prices, by NAICS, monthly (Canadian dollars, millions).
FIGURE 7 – MANUFACTURING GDP AND EMPLOYMENTEmployment recovery lagging output growth Canada manufacturing value add and employment Index 2004 = 100 (constant 2007 CAD)
CANADIAN MANUFACTURING In a Global Context
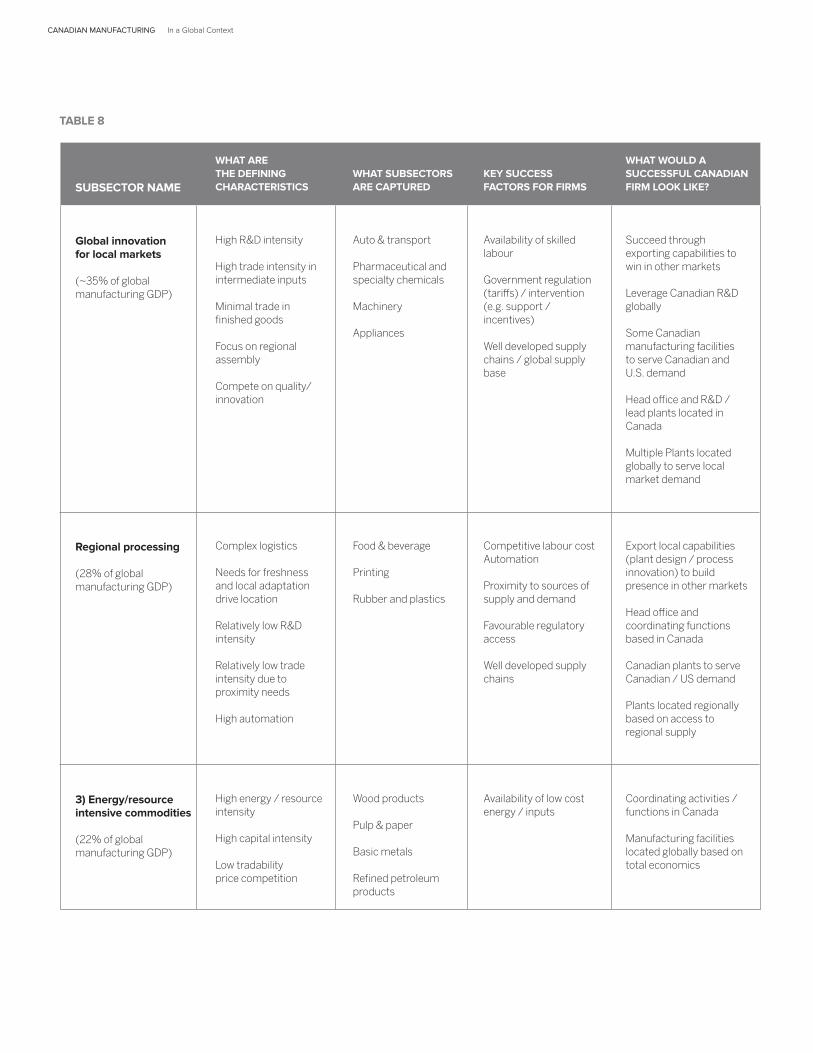
Adapting Mckinsey & Company’s key clusters, (Table 8)8 shows that Canada’s manufacturing base is concentrated in three subsectors and is therefore heavily weighted towards regionally competitive industries and exposed to swings in commodity pricing. Given this location and sectorial concentration, Canada’s domestic manufacturing base is largely oriented towards serving U.S. demand. This has exposed Canadian manufacturing firms to significant challenges in the current economic climate. Low future U.S. demand growth could place continued pressure on Canadian exporters. The combined weight of these challenges raises the competitive bar for Canadian firms looking to drive future growth. To remain relevant, they must simultaneously overcome potentially significant U.S. demand challenges while looking to expand their physical market presence in markets with more growth potential (Figure 8).9
8. Lawrence Centre (2013). Adapted from McKinsey & Company’s Global Institute report, Manufacturing the Future: The era of Global Growth and Innovation. Available at: http://www.mckinsey.com/insights/manufacturing/the_future_of_manufacturing
9. Organization for Economic Cooperation and Development (2013). STAN Database for Structural Analysis (ISIC Rev. 4). Available at: https://stats.oecd.org/Index.aspx?DataSetCode=STANI4; Statistics Canada (2013). CANSIM Table 379-0031. Gross domestic product (GDP) at basic prices, by NAICS, monthly (Canadian dollars, millions). ; and Lawrence Centre (2013). Adapted from McKinsey & Company’s Global Institute report, Manufacturing the Future: The era of Global Growth and Innovation. Available at: http://www.mckinsey.com/insights/manufacturing/the_future_of_manufacturing. Future of Canadian Manufacturing researcher team analysis.
Accurately measuring the performance and health of Canada’s manufacturing sector requires going beyond conventional methods and metrics. As Canada looks to grow successful manufacturing firms, it is important to acknowledge the inherent challenges in the measurement tools that we traditionally use to evaluate the success of Canadian firms and the policies oriented towards supporting them. It is increasingly clear that ‘traditional’ employment and value-add measures do not capture the full picture for Canadian manufacturers. Depending on the subsector, it is quite possible — and in fact, likely desirable — that much of the ‘manufacturing value-add’ and employment driven by a Canadian manufacturing firm will exist outside of Canada’s borders.
CANADIAN MANUFACTURING In a Global Context
SUBSECTOR NAME
Global innovation for local markets
(~35% of global manufacturing GDP)
Regional processing
(28% of global manufacturing GDP)
3) Energy/resource intensive commodities
(22% of global manufacturing GDP)
WHAT ARE THE DEFINING CHARACTERISTICS
High R&D intensity
High trade intensity in intermediate inputs
Minimal trade in finished goods
Focus on regional assembly
Compete on quality/ innovation
Complex logistics
Needs for freshness and local adaptation drive location
Relatively low R&D intensity
Relatively low trade intensity due to proximity needs
High automation
High energy / resource intensity
High capital intensity
Low tradabilityprice competition
WHAT SUBSECTORS ARE CAPTURED
Auto & transport
Pharmaceutical and specialty chemicals
Machinery
Appliances
Food & beverage
Printing
Rubber and plastics
Wood products
Pulp & paper
Basic metals
Refined petroleum products
KEY SUCCESS FACTORS FOR FIRMS
Availability of skilled labour
Government regulation (tariffs) / intervention (e.g. support / incentives)
Well developed supply chains / global supply base
Competitive labour cost Automation
Proximity to sources of supply and demand
Favourable regulatory access
Well developed supply chains
Availability of low cost energy / inputs
WHAT WOULD A SUCCESSFUL CANADIAN FIRM LOOK LIKE?
Succeed through exporting capabilities to win in other markets
Leverage Canadian R&D globally
Some Canadian manufacturing facilities to serve Canadian and U.S. demand
Head office and R&D / lead plants located in Canada
Multiple Plants located globally to serve local market demand
Export local capabilities (plant design / process innovation) to build presence in other markets
Head office and coordinating functions based in Canada
Canadian plants to serve Canadian / US demand
Plants located regionally based on access to regional supply
Coordinating activities / functions in Canada
Manufacturing facilities located globally based on total economics
TABLE 8
CANADIAN MANUFACTURING In a Global Context
SUBSECTOR NAME
(4) Global technologies / innovators
(9% of global manufacturing GDP)
(5) Labour-intensive tradable goods
(7% of global manufacturing GDP)
WHAT ARE THE DEFINING CHARACTERISTICS
High margin / high value density
High capital intensity
High trade intensity in both components and end products
High R&D and technology intensity
High labour content
Globally tradable
WHAT SUBSECTORS ARE CAPTURED
Fabricated metals
Semi-conductors
Computers & office machineryMedical devices
Textiles
Furniture
Jewellery
KEY SUCCESS FACTORS FOR FIRMS
Efficient manufacturing scale
World class talent
Trade terms and market access
Availability of global shipping infrastructure
Low labour cost
Access to deep labour pool
Favourable trade terms
WHAT WOULD A SUCCESSFUL CANADIAN FIRM LOOK LIKE?
HQ located in Canada
R&D / intellectual property located in Canada
Selected component manufacturing located in Canada (where Canada has unique capabilities, etc.)
Design / coordinating functions located in Canada
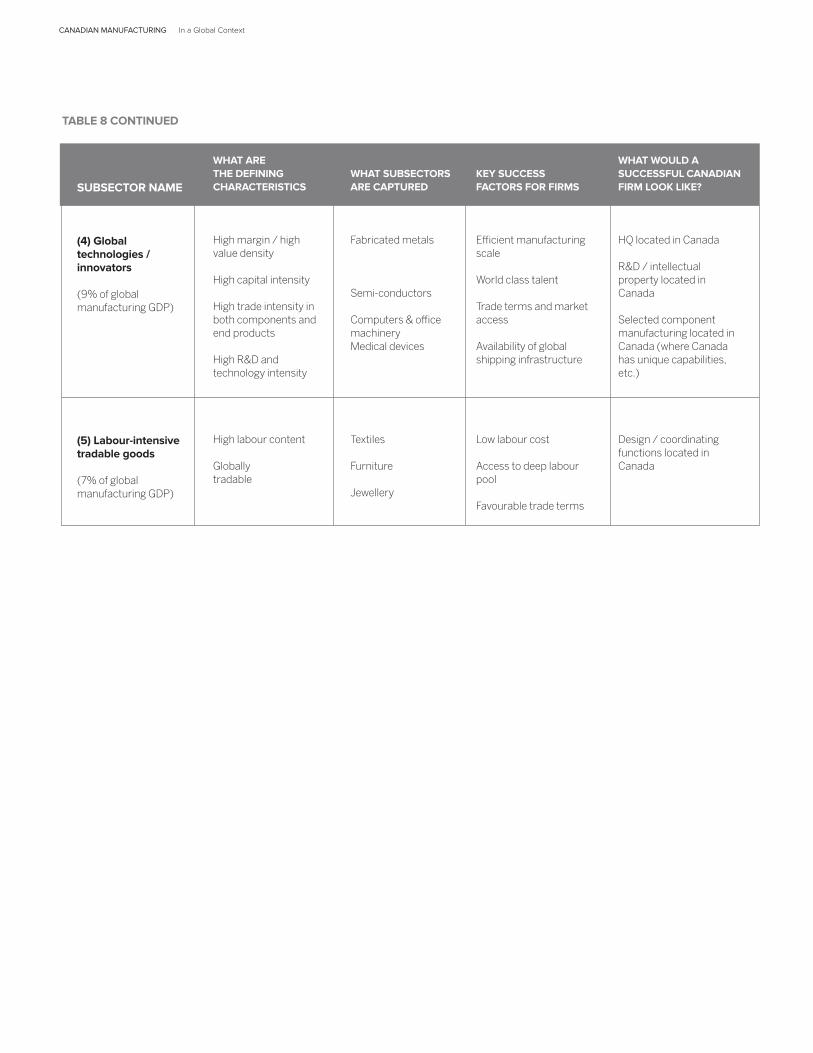
TABLE 8 CONTINUED
CANADIAN MANUFACTURING In a Global Context
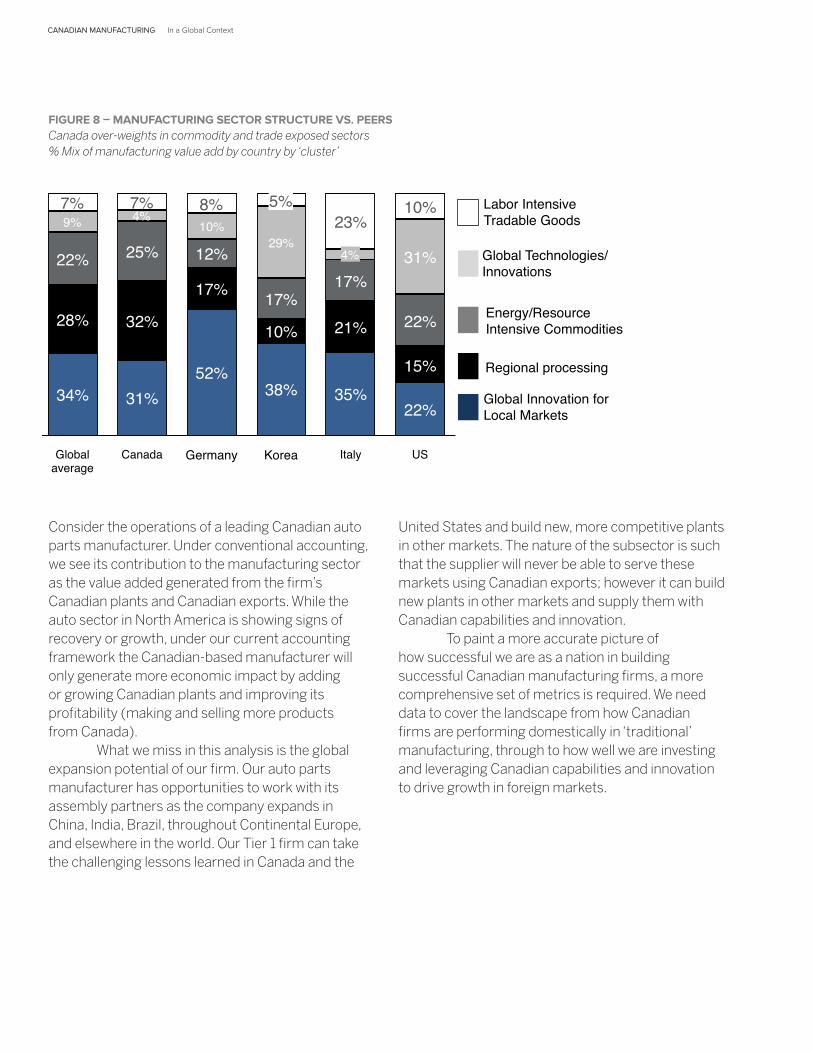
Consider the operations of a leading Canadian auto parts manufacturer. Under conventional accounting, we see its contribution to the manufacturing sector as the value added generated from the firm’s Canadian plants and Canadian exports. While the auto sector in North America is showing signs of recovery or growth, under our current accounting framework the Canadian-based manufacturer will only generate more economic impact by adding or growing Canadian plants and improving its profitability (making and selling more products from Canada). What we miss in this analysis is the global expansion potential of our firm. Our auto parts manufacturer has opportunities to work with its assembly partners as the company expands in China, India, Brazil, throughout Continental Europe, and elsewhere in the world. Our Tier 1 firm can take the challenging lessons learned in Canada and the
United States and build new, more competitive plants in other markets. The nature of the subsector is such that the supplier will never be able to serve these markets using Canadian exports; however it can build new plants in other markets and supply them with Canadian capabilities and innovation. To paint a more accurate picture of how successful we are as a nation in building successful Canadian manufacturing firms, a more comprehensive set of metrics is required. We need data to cover the landscape from how Canadian firms are performing domestically in ‘traditional’ manufacturing, through to how well we are investing and leveraging Canadian capabilities and innovation to drive growth in foreign markets.
FIGURE 8 – MANUFACTURING SECTOR STRUCTURE VS. PEERSCanada over-weights in commodity and trade exposed sectors% Mix of manufacturing value add by country by ‘cluster’
Figure 1.8 Manufacturing sector structure vs. peers"Canada over-weights in commodity and trade exposed sectors!
Source: OECD STAN Rev 4; CANSIM; McKinsey & Company; Team Analysis"
% Mix of manufacturing value add by country by ‘cluster’
Italy"
31%"
Korea"
15%"
22%"
22%"
Canada"
4%"
Global average"
23%"
Global Technologies/"Innovations"
7%"4%"
Germany"
10%"
Global Innovation for "Local Markets"
12%"
Regional processing"
9%"8%"
Energy/Resource "Intensive Commodities "
35%"
21%"
38%"52%"
17%"
25%"
32%"
10%"10%"
22%"
28%"
34%"
US"
31%"
Labor Intensive "Tradable Goods "
5%"
29%"
17%"
7%"
17%"
CANADIAN MANUFACTURING In a Global Context
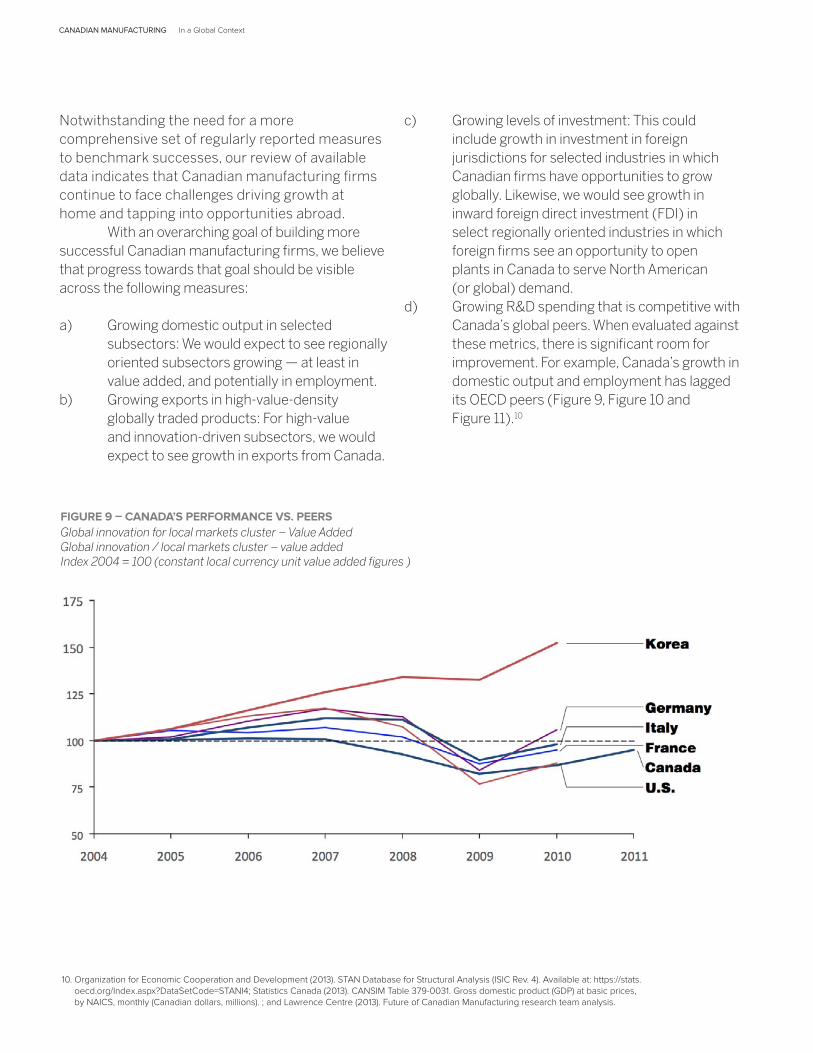
Notwithstanding the need for a more comprehensive set of regularly reported measures to benchmark successes, our review of available data indicates that Canadian manufacturing firms continue to face challenges driving growth at home and tapping into opportunities abroad. With an overarching goal of building more successful Canadian manufacturing firms, we believe that progress towards that goal should be visible across the following measures:
a) Growing domestic output in selected subsectors: We would expect to see regionally oriented subsectors growing — at least in value added, and potentially in employment.
b) Growing exports in high-value-density globally traded products: For high-value and innovation-driven subsectors, we would expect to see growth in exports from Canada.
FIGURE 9 – CANADA’S PERFORMANCE VS. PEERSGlobal innovation for local markets cluster – Value AddedGlobal innovation / local markets cluster – value added Index 2004 = 100 (constant local currency unit value added figures )
c) Growing levels of investment: This could include growth in investment in foreign jurisdictions for selected industries in which Canadian firms have opportunities to grow globally. Likewise, we would see growth in inward foreign direct investment (FDI) in select regionally oriented industries in which foreign firms see an opportunity to open plants in Canada to serve North American (or global) demand.
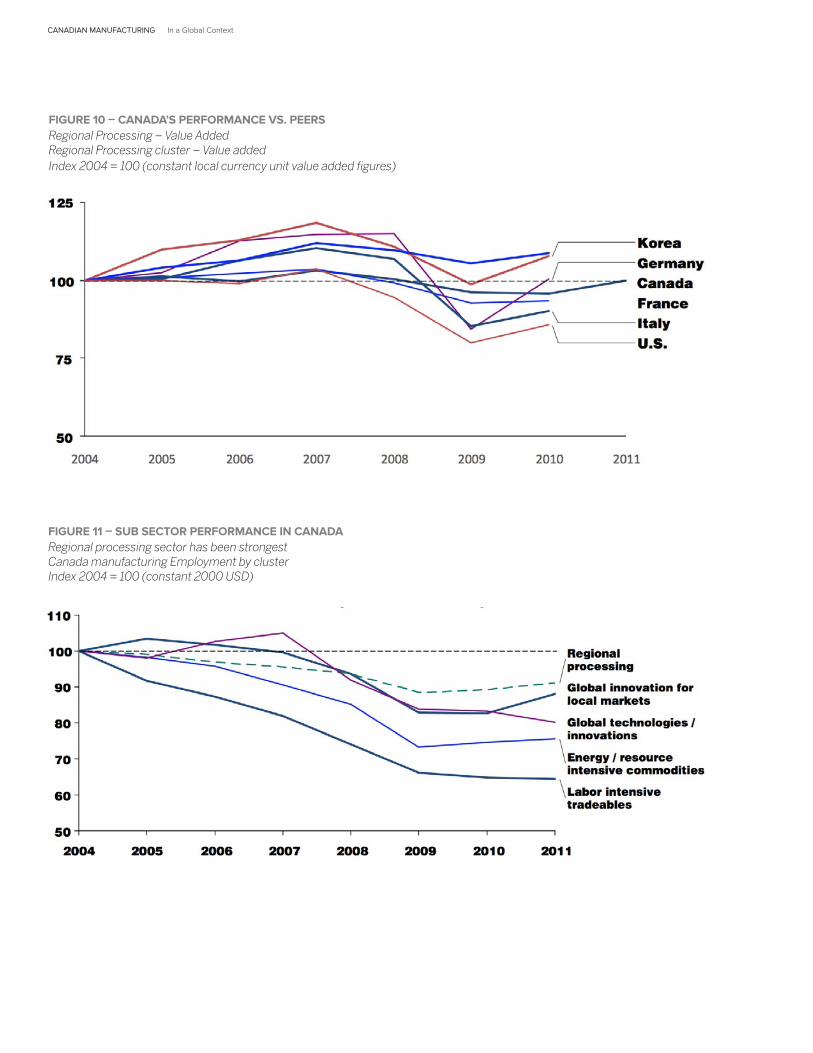
d) Growing R&D spending that is competitive with Canada’s global peers. When evaluated against these metrics, there is significant room for improvement. For example, Canada’s growth in domestic output and employment has lagged its OECD peers (Figure 9, Figure 10 and Figure 11).10
10. Organization for Economic Cooperation and Development (2013). STAN Database for Structural Analysis (ISIC Rev. 4). Available at: https://stats.oecd.org/Index.aspx?DataSetCode=STANI4; Statistics Canada (2013). CANSIM Table 379-0031. Gross domestic product (GDP) at basic prices, by NAICS, monthly (Canadian dollars, millions). ; and Lawrence Centre (2013). Future of Canadian Manufacturing research team analysis.
CANADIAN MANUFACTURING In a Global Context
FIGURE 10 – CANADA’S PERFORMANCE VS. PEERSRegional Processing – Value AddedRegional Processing cluster – Value addedIndex 2004 = 100 (constant local currency unit value added figures)
FIGURE 11 – SUB SECTOR PERFORMANCE IN CANADARegional processing sector has been strongestCanada manufacturing Employment by cluster Index 2004 = 100 (constant 2000 USD)
CANADIAN MANUFACTURING In a Global Context
11. Organization for Economic Cooperation and Development (2013). Innovation in science, technology and industry. Research and Development Statistics (RDS), 2014 edition. Available at: http://www.oecd.org/science/inno/researchanddevelopmentstatisticsrds.htm.
12. Organization for Economic Cooperation and Development (2013). Innovation in science, technology and industry. Research and Development Statistics (RDS), 2014 edition. Available at: http://www.oecd.org/science/inno/researchanddevelopmentstatisticsrds.htm.
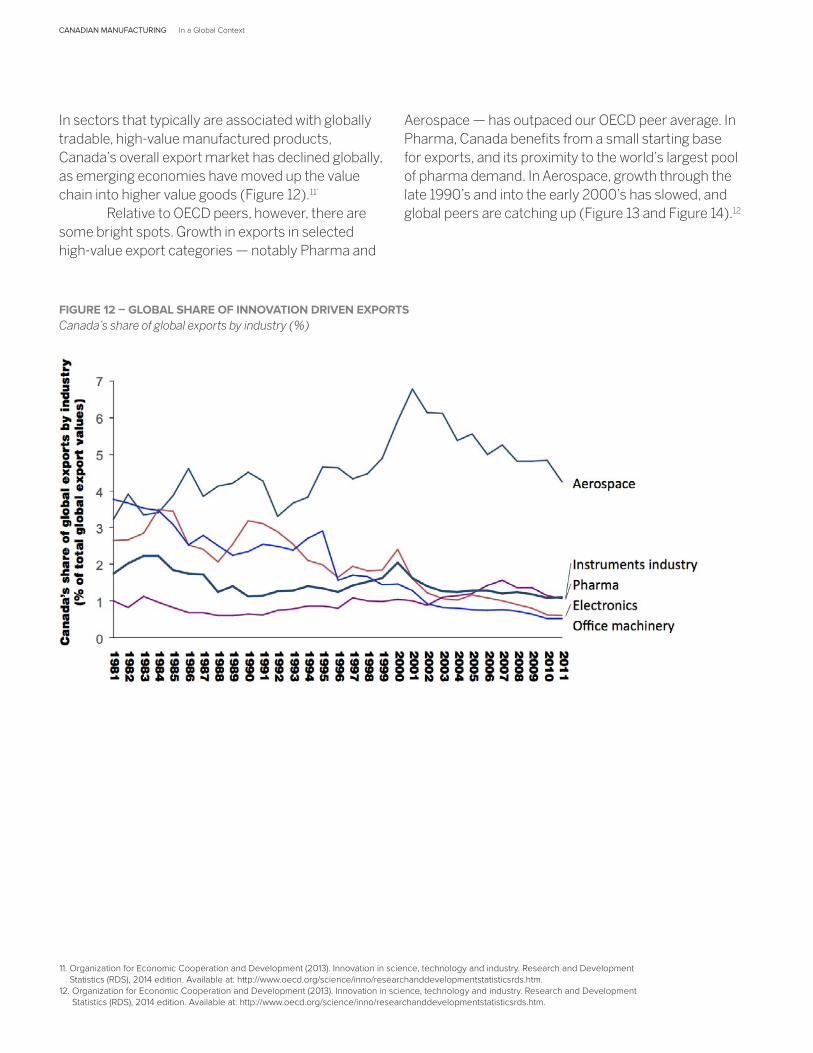
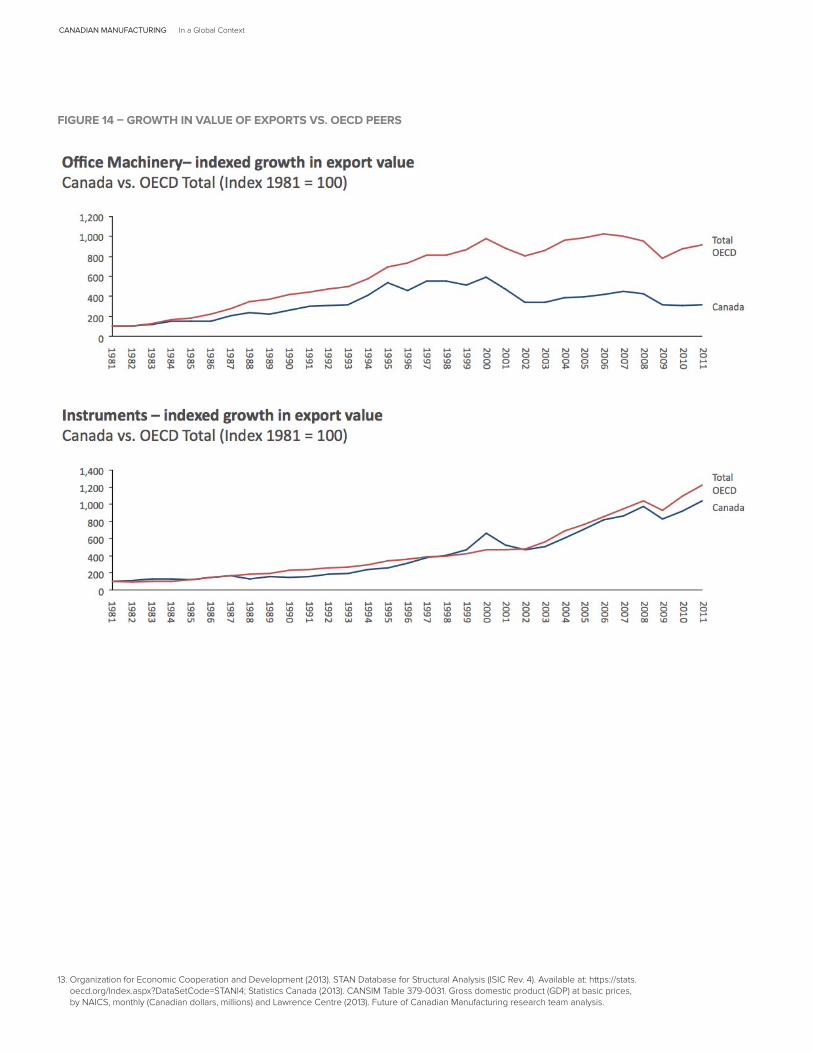
In sectors that typically are associated with globally tradable, high-value manufactured products, Canada’s overall export market has declined globally, as emerging economies have moved up the value chain into higher value goods (Figure 12).11’
Relative to OECD peers, however, there are some bright spots. Growth in exports in selected high-value export categories — notably Pharma and
FIGURE 12 – GLOBAL SHARE OF INNOVATION DRIVEN EXPORTSCanada’s share of global exports by industry (%)
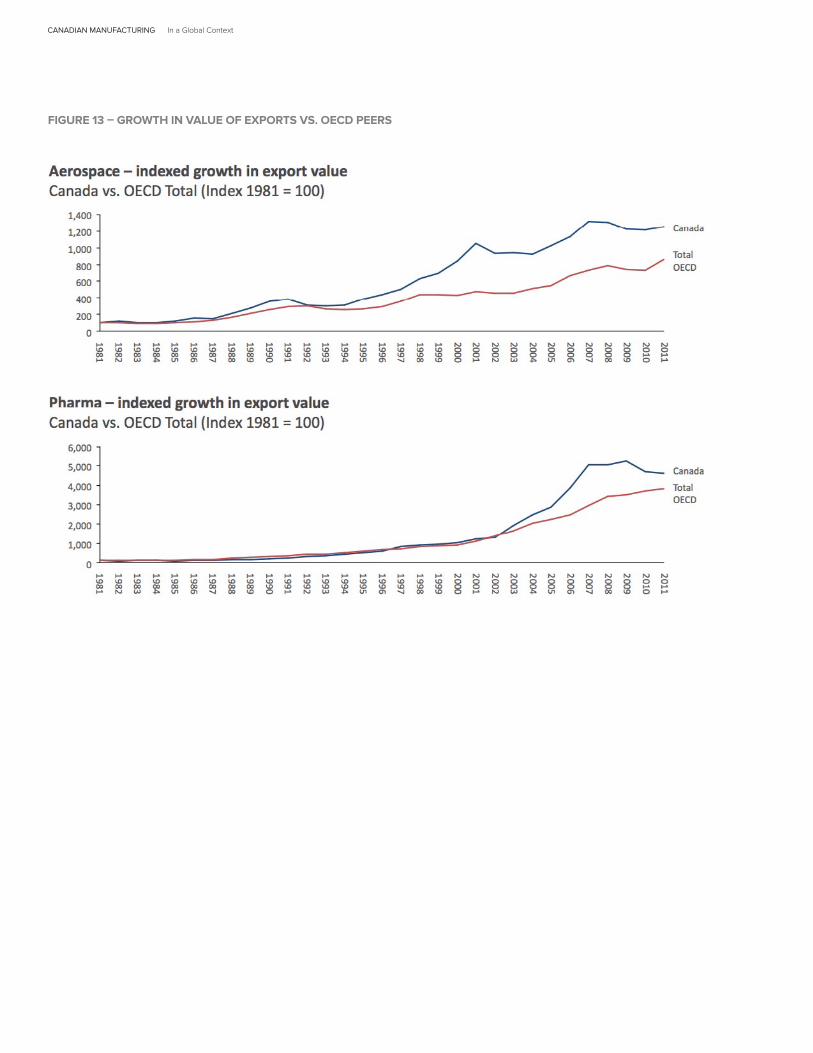
Aerospace — has outpaced our OECD peer average. In Pharma, Canada benefits from a small starting base for exports, and its proximity to the world’s largest pool of pharma demand. In Aerospace, growth through the late 1990’s and into the early 2000’s has slowed, and global peers are catching up (Figure 13 and Figure 14).12
CANADIAN MANUFACTURING In a Global Context
FIGURE 13 – GROWTH IN VALUE OF EXPORTS VS. OECD PEERS
CANADIAN MANUFACTURING In a Global Context
FIGURE 14 – GROWTH IN VALUE OF EXPORTS VS. OECD PEERS
13. Organization for Economic Cooperation and Development (2013). STAN Database for Structural Analysis (ISIC Rev. 4). Available at: https://stats.oecd.org/Index.aspx?DataSetCode=STANI4; Statistics Canada (2013). CANSIM Table 379-0031. Gross domestic product (GDP) at basic prices, by NAICS, monthly (Canadian dollars, millions) and Lawrence Centre (2013). Future of Canadian Manufacturing research team analysis.
CANADIAN MANUFACTURING In a Global Context
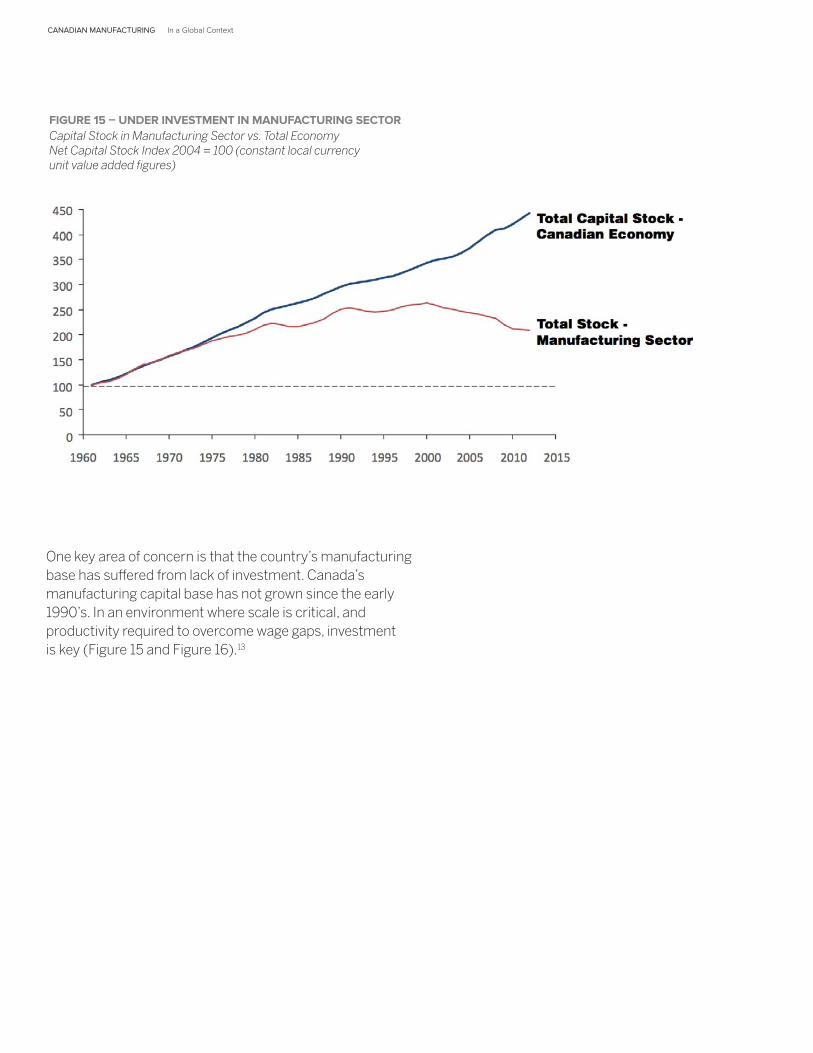
FIGURE 15 – UNDER INVESTMENT IN MANUFACTURING SECTORCapital Stock in Manufacturing Sector vs. Total EconomyNet Capital Stock Index 2004 = 100 (constant local currency unit value added figures)
One key area of concern is that the country’s manufacturing base has suffered from lack of investment. Canada’s manufacturing capital base has not grown since the early 1990’s. In an environment where scale is critical, and productivity required to overcome wage gaps, investment is key (Figure 15 and Figure 16).13
CANADIAN MANUFACTURING In a Global Context
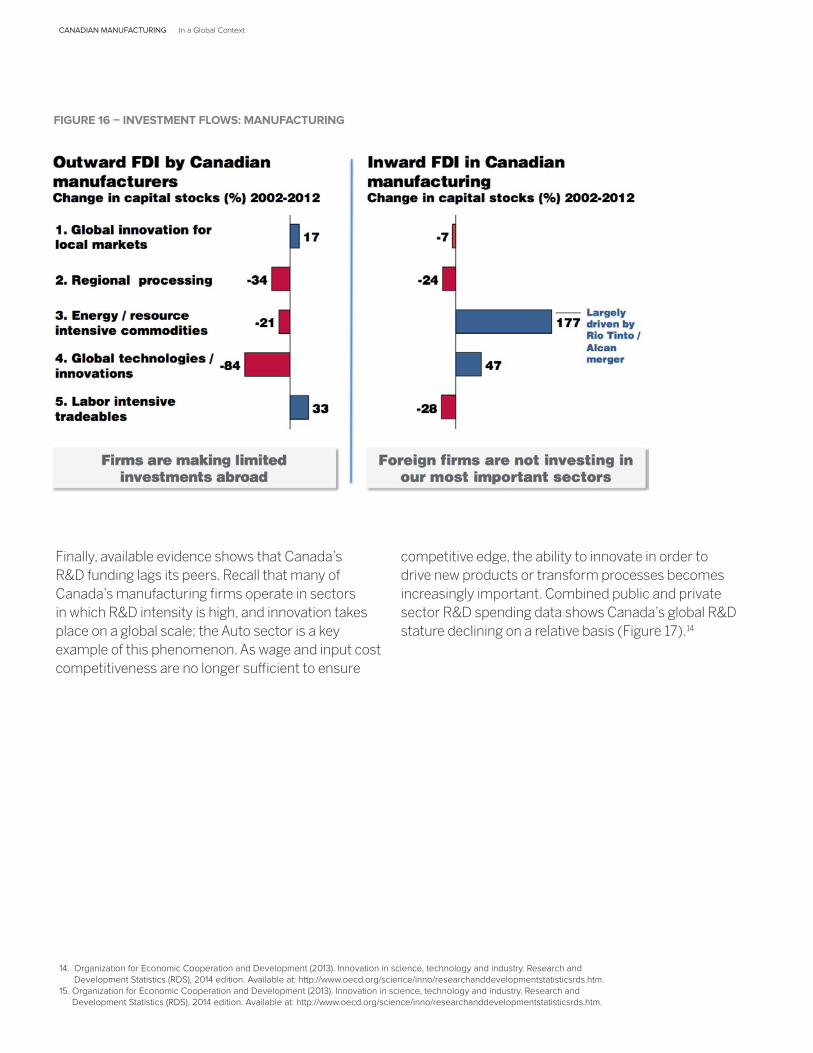
FIGURE 16 – INVESTMENT FLOWS: MANUFACTURING
14. Organization for Economic Cooperation and Development (2013). Innovation in science, technology and industry. Research and Development Statistics (RDS), 2014 edition. Available at: http://www.oecd.org/science/inno/researchanddevelopmentstatisticsrds.htm.
15. Organization for Economic Cooperation and Development (2013). Innovation in science, technology and industry. Research and Development Statistics (RDS), 2014 edition. Available at: http://www.oecd.org/science/inno/researchanddevelopmentstatisticsrds.htm.
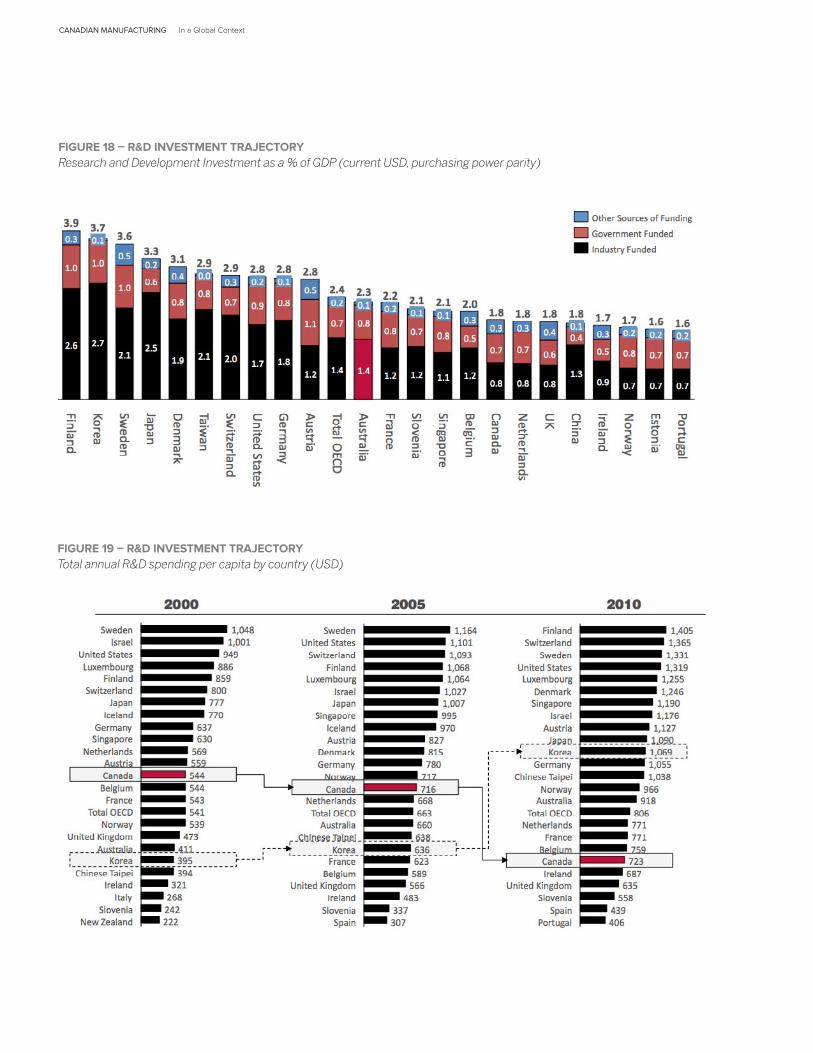
Finally, available evidence shows that Canada’s R&D funding lags its peers. Recall that many of Canada’s manufacturing firms operate in sectors in which R&D intensity is high, and innovation takes place on a global scale; the Auto sector is a key example of this phenomenon. As wage and input cost competitiveness are no longer sufficient to ensure
competitive edge, the ability to innovate in order to drive new products or transform processes becomes increasingly important. Combined public and private sector R&D spending data shows Canada’s global R&D stature declining on a relative basis (Figure 17).14
CANADIAN MANUFACTURING In a Global Context
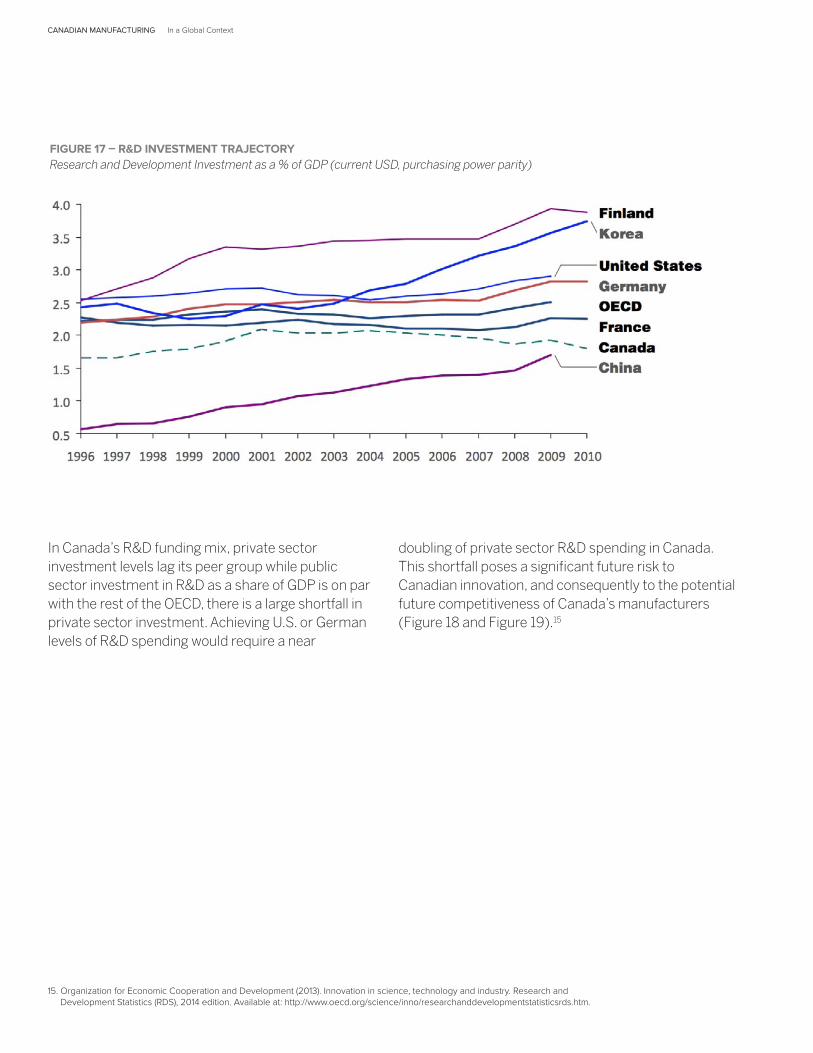
In Canada’s R&D funding mix, private sector investment levels lag its peer group while public sector investment in R&D as a share of GDP is on par with the rest of the OECD, there is a large shortfall in private sector investment. Achieving U.S. or German levels of R&D spending would require a near
doubling of private sector R&D spending in Canada. This shortfall poses a significant future risk to Canadian innovation, and consequently to the potential future competitiveness of Canada’s manufacturers (Figure 18 and Figure 19).15
15. Organization for Economic Cooperation and Development (2013). Innovation in science, technology and industry. Research and Development Statistics (RDS), 2014 edition. Available at: http://www.oecd.org/science/inno/researchanddevelopmentstatisticsrds.htm.
FIGURE 17 – R&D INVESTMENT TRAJECTORY Research and Development Investment as a % of GDP (current USD, purchasing power parity)
CANADIAN MANUFACTURING In a Global Context
FIGURE 18 – R&D INVESTMENT TRAJECTORYResearch and Development Investment as a % of GDP (current USD, purchasing power parity)
FIGURE 19 – R&D INVESTMENT TRAJECTORYTotal annual R&D spending per capita by country (USD)

CANADIAN MANUFACTURING In a Global Context
ABOUTTHE AUTHOR
ANDREW DOONER DIRECTOR, STRATEGY & OPERATIONS, KPMG
Andrew Dooner is currently a Director in KPMG’s Strategy & Operations consulting practice, based in Toronto. Andrew is focused on working with both public and private sector clients to develop and execute growth strategy, and tackle
large scale, customer centered transformations. Andrew has over 12 years of experience working globally as an advisor to senior leaders in both public and private enterprises. He has held leadership roles in strategy consulting at McKinsey & Company in Canada and Europe; as well as senior corporate strategy roles at a number of medium and large sized Canadian institutions including BMO Financial Group, Sears Canada, and the Pacific Carbon Trust.
CANADIAN MANUFACTURING In a Global Context
ABOUT THE LAWRENCE CENTREThe Lawrence National Centre for Policy and Management aims to bridge the gap between business strategy and government policy by providing a forum for business and government to discuss policy development and implementation. As a policy and management centre within a world-class business school, the Lawrence Centre is uniquely positioned to explore the areas of public policy that have the greatest impact on business. The Lawrence Centre educates future business leaders in public policy and government leaders in business strategy and conducts leading-edge research on major issues that involve business-government coordination. The Centre was established in 2001 with a generous gift from Canadian businessman, Jack Lawrence, HBA ’56, who was a strong proponent of business playing an active role in Canadian public policy.
PROJECT PARTNERS

CANADIAN MANUFACTURING In a Global Context
Ivey Business SchoolWestern University1255 Western RoadLondon, Ontario N6G 0N1Telephone: 519.661.4253
lawrencecentre.ca
Lawrence National Centre for Policy and Management
Lawrence National Centre for Policy and Management
Lawrence National Centre for Policy and Management
Lawrence National Centre for Policy and Management
Lawrence National Centre for Policy and Management
Lawrence National Centre for Policy and Management
Unit logo examples
Unit full signature examples
PMS 3308PMS 268
PMS 3308PMS 268 Lawrence National Centre
for Policy and Management
CMYK
100% K
Cool Grey 9
Reverse Reference
Reverse Version
Light GreyPMS Cool Grey 7
C 0M 0 Y 0K 47
Warm GreyPMS 416
C 28M 185 Y 29K 51
Light Warm GreyPMS 414
C 13M 8 Y 17K 26
SandPMS 4525
C 9M 12 Y 47K 18