Embed Size (px)
Citation preview

CANADIAN MOVIEGOING STATISTICS
June 2015
June 2015
Moviegoers 66%
16%
29%
21%
Non-Moviegoers 34%
TICKETS SOLD PER
MOVIEGOER
CANADIAN MOVIE TICKET CONSUMPTION BY MOVIEGOER SEGMENT
There are 20.3 million moviegoers in Canada over the age of 13, which represents roughly two-thirds of the population. Moviegoers have seen an average of 5.1 movies in the past 12 months and can be broken down as follows:
• 21% are light moviegoers who attendedone or two movies in the past 12 months
• 29% are moderate moviegoers whoattended three to nine movies in the past12 months
• 16% are heavy moviegoers who attendedten or more movies in the past 12 months
While heavy moviegoers represent the smallest segment, they purchased the majority of tickets—60%—in the past 12 months. Moderate moviegoers purchased roughly a third of tickets and light moviegoers account for only 7% of all ticket purchases.
MOVIE TICKET CONSUMPTION, PAST 12 MONTHS
(AGE 13+)
Canadian Moviegoer Statistics
60%
32%
7%
Q: Over the past 12 months, how many times have you been to the movies at a theatre? Numbers may not add up to 100 due to rounding.
TICKETS PURCHASED BY FREQUENCY, PAST 12 MONTHS
(AGE 13+)
Never (0) Moderate (3–9) Light (1–2) Heavy (10+)
5.1

June 2015
DEMOGRAPHICS OF MOVIEGOERS COMPARED TO THE CANADIAN POPULATION
The demographic profile of Canadian moviegoers as they index against the general population of Canada is as follows:
• Moviegoers are nearly equally represented among males and females
• Moviegoers over index among the following younger age segments: 13 to 17, 18 to 24, 25 to 34 and 35 to 44
0 50 100 150 200
Male
Female
9%
14%
21%
18%
14%
12%
12%
0 20 40 60 80 100 120 140
13-17
18-24
25-34
35-44
45-54
55-64
65+
7%
22%
43%
6%
11%
12%
0 50 100 150
Eastern Provinces
Quebec
Ontario
Manitoba, Sask, Nunavut
Alberta, Northwest Territories
British Columbia, Yukon
49%
51%
Numbers may not add up to 100 due to rounding.
Canadian Moviegoer Statistics
June 2015
HEAVY MOVIEGOERS COMPARED TO THE CANADIAN POPULATION
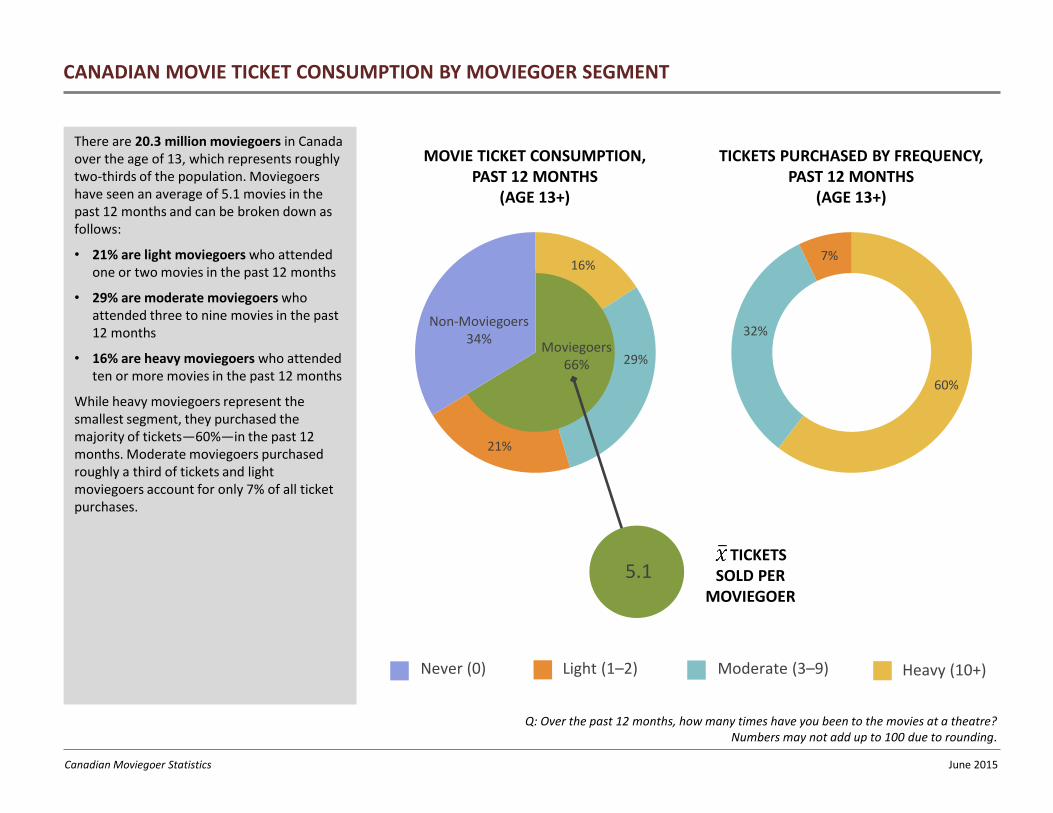
Among heavy moviegoers, the following segments over index:
• Males
• 25 to 34 year olds at the highest level, followed by 13 to 17 year olds, 18 to 24 year olds and 35 to 44 year olds
• By province, heavy moviegoers over index in Ontario (where 49% of all heavy moviegoers in the country reside)
53%
47%
0 50 100 150 200
Male
Female
10%
16%
28%
19%
8%
13%
7%
0 20 40 60 80 100 120 140 160 180
13-17
18-24
25-34
35-44
45-54
55-64
65+
6%
21%
49%
5%
8%
11%
0 50 100 150
Eastern Provinces
Quebec
Ontario
Manitoba, Sask, Nunavut
Alberta, Northwest Territories
British Columbia, Yukon
Numbers may not add up to 100 due to rounding.
Canadian Moviegoer Statistics
June 2015
16% 9%
15%
27%
25%
14%
27%
35%
60%
78%
59%
38%
AllMoviegoers
Light Moderate Heavy
WHEN MOVIEGOERS GO TO THE MOVIES (URGENCY)
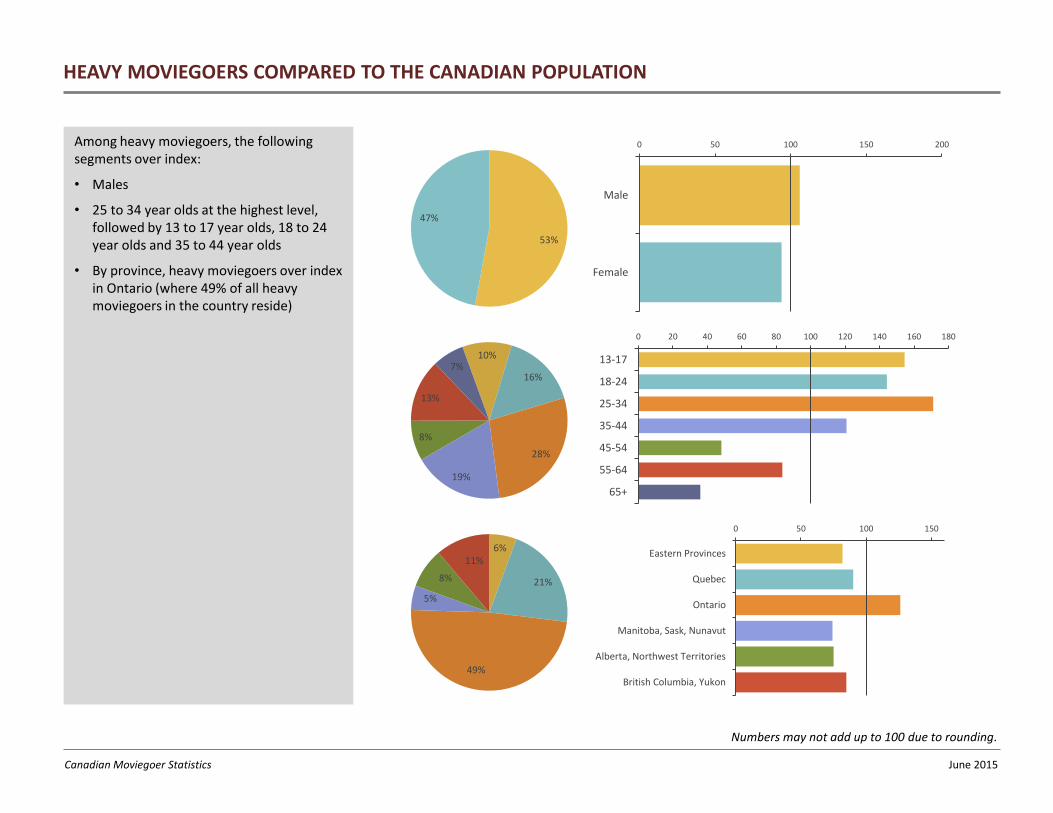
On the whole, 60% of moviegoers generally see a movie after the week it opens; 16% attend on opening weekend and a quarter attend during opening week.
Urgency is highest among heavy moviegoers, with the majority typically attending during opening week (62%), comprising 27% who usually attend on opening weekend and 35% who usually attend some other time during opening week (with 15% attend on the first Tuesday the film is in theatres).
Opening day/night
Opening weekend other
Opening Tuesday
First week other
Opening weekend > First week Opening week
7%
21%
15%
21%
Q: Which of the statements below best describes when you generally see movies in a theatre? Numbers may not add up to 100 due to rounding.
Canadian Moviegoer Statistics
June 2015
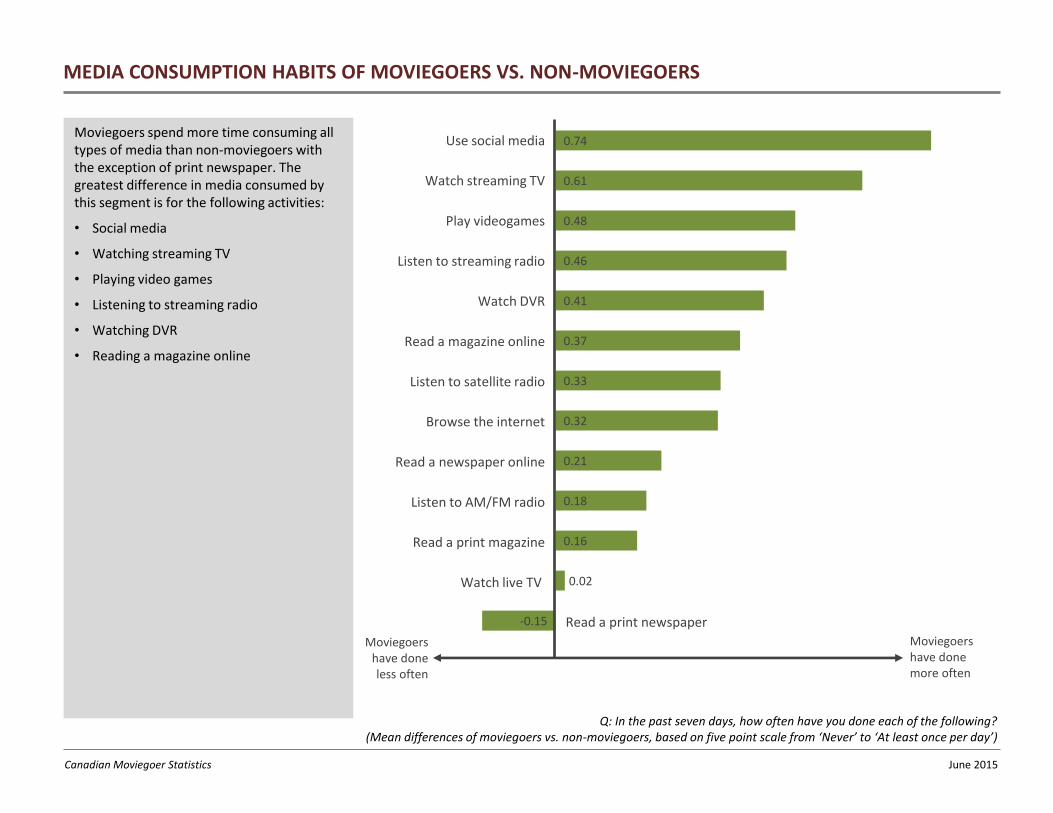
MEDIA CONSUMPTION HABITS OF MOVIEGOERS VS. NON-MOVIEGOERS
Moviegoers spend more time consuming all types of media than non-moviegoers with the exception of print newspaper. The greatest difference in media consumed by this segment is for the following activities:
• Social media
• Watching streaming TV
• Playing video games
• Listening to streaming radio
• Watching DVR
• Reading a magazine online
Q: In the past seven days, how often have you done each of the following? (Mean differences of moviegoers vs. non-moviegoers, based on five point scale from ‘Never’ to ‘At least once per day’)
-0.15
0.02
0.16
0.18
0.21
0.32
0.33
0.37
0.41
0.46
0.48
0.61
0.74 Use social media
Watch streaming TV
Play videogames
Listen to streaming radio
Watch DVR
Read a magazine online
Listen to satellite radio
Browse the internet
Read a newspaper online
Listen to AM/FM radio
Read a print magazine
Watch live TV
Read a print newspaper
Moviegoers have done more often
Moviegoers have done less often
Canadian Moviegoer Statistics
June 2015
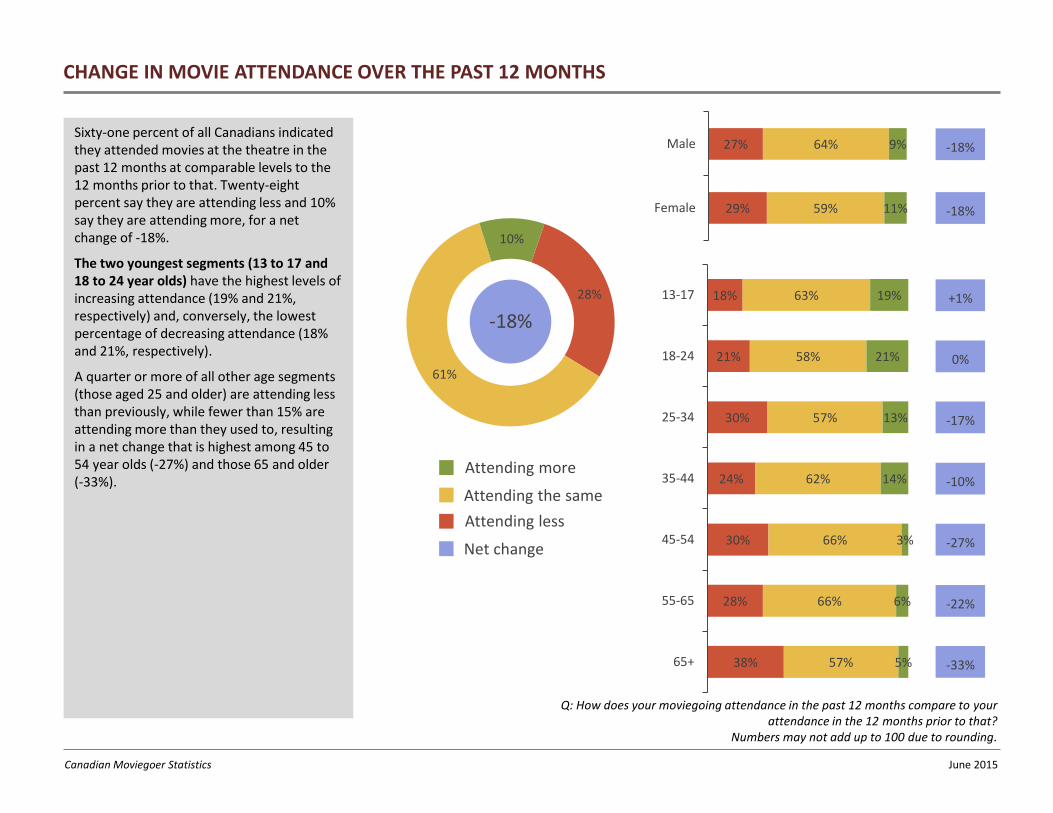
CHANGE IN MOVIE ATTENDANCE OVER THE PAST 12 MONTHS
Sixty-one percent of all Canadians indicated they attended movies at the theatre in the past 12 months at comparable levels to the 12 months prior to that. Twenty-eight percent say they are attending less and 10% say they are attending more, for a net change of -18%.
The two youngest segments (13 to 17 and 18 to 24 year olds) have the highest levels of increasing attendance (19% and 21%, respectively) and, conversely, the lowest percentage of decreasing attendance (18% and 21%, respectively).
A quarter or more of all other age segments (those aged 25 and older) are attending less than previously, while fewer than 15% are attending more than they used to, resulting in a net change that is highest among 45 to 54 year olds (-27%) and those 65 and older (-33%).
28%
61%
10%
-18%
Attending more
Attending the same
Attending less
Net change
18%
21%
30%
24%
30%
28%
38%
63%
58%
57%
62%
66%
66%
57%
19%
21%
13%
14%
3%
6%
5%
13-17
18-24
25-34
35-44
45-54
55-65
65+
27%
29%
64%
59%
9%
11%
Male
Female
-18%
-18%
+1%
0%
-17%
-10%
-27%
-22%
-33%
Q: How does your moviegoing attendance in the past 12 months compare to your attendance in the 12 months prior to that?
Numbers may not add up to 100 due to rounding.
Canadian Moviegoer Statistics

June 2015
63%
27%
23%
67%
29%
25%
40%
3%
59%
38%
33%
39%
33% 31% 31%
4%
59%
35%
31% 29%
27% 24% 24%
10%
43%
25%
17%
10%
21%
16% 15%
30%
The cost Not enoughmovies
interested in
Not enoughmovies that need
to be seen onscreen
I prefer to watchmovies at home
Want to avoidthe crowds
Not enoughtime
So many optionsat home
I go as oftenas I like
REASONS FOR NOT SEEING MORE MOVIES IN THE THEATRE IN PAST 12 MONTHS
The leading reason for not attending more movies at the theatre among non-moviegoers is a preference for watching movies at home (67%), followed at lower levels by the cost of seeing movies at the theatre (63%) and the fact that there are so many movie viewing options at home (40%).
Among all movie-going segments, cost is the leading reason for not seeing more movies at the theatre, selected by 59% each of light and moderate moviegoers and 43% of heavy moviegoers.
After cost, light moviegoers indicate a preference for watching movies at home (39%) and a lack of movies they’re interested in seeing at the theatre (38%).
Moderate moviegoers also indicate a lack of movies they’re interested in seeing at the theatre (35%) after cost, followed by perceptions that there aren’t enough movies that need to be seen on a big screen (31%).
Only 30% of heavy moviegoers indicate that they attend movies as often as they want.
Q: Below are some reasons others have given as to why they don't go to see movies in a theatre as much as they'd like and/or reasons they don't go as frequently as they used to. Which, if any, apply to you?
Columns appear at different heights for the same numbers due to rounding.
Non-moviegoers Moderate (2–9) Light (1–2) Heavy (10+) All moviegoers
Canadian Moviegoer Statistics
June 2015
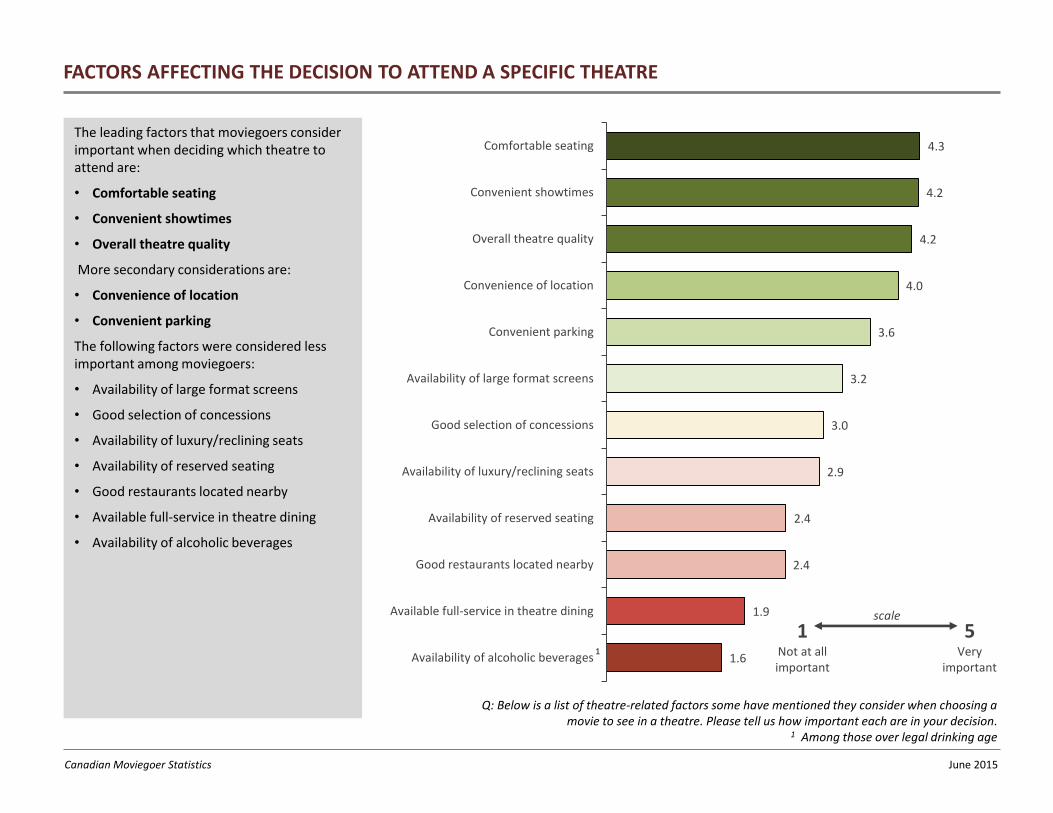
FACTORS AFFECTING THE DECISION TO ATTEND A SPECIFIC THEATRE
The leading factors that moviegoers consider important when deciding which theatre to attend are:
• Comfortable seating
• Convenient showtimes
• Overall theatre quality
More secondary considerations are:
• Convenience of location
• Convenient parking
The following factors were considered less important among moviegoers:
• Availability of large format screens
• Good selection of concessions
• Availability of luxury/reclining seats
• Availability of reserved seating
• Good restaurants located nearby
• Available full-service in theatre dining
• Availability of alcoholic beverages
4.3
4.2
4.2
4.0
3.6
3.2
3.0
2.9
2.4
2.4
1.9
1.6
Comfortable seating
Convenient showtimes
Overall theatre quality
Convenience of location
Convenient parking
Availability of large format screens
Good selection of concessions
Availability of luxury/reclining seats
Availability of reserved seating
Good restaurants located nearby
Available full-service in theatre dining
Availability of alcoholic beverages
5 Very
important
1 Not at all important
scale
Q: Below is a list of theatre-related factors some have mentioned they consider when choosing a movie to see in a theatre. Please tell us how important each are in your decision.
1 Among those over legal drinking age
1
Canadian Moviegoer Statistics

June 2015
DAY AND DATE VOD PURCHASERS HIGHLIGHTS
Nine percent of Canadians have purchased a movie to view at home while the movie was still in theatres.
Purchasers of day and date movies indicate their movie attendance has increased in the past 12 months at a greater level (17%) compared to non-purchasers (10%).
Furthermore, heavy moviegoers are more likely to have purchased a day-and-date movie in their home than the other moviegoing segments.
91%
9%
Canadian population
Attending more Attending the same
Attending less Net change Purchasers Non-purchasers
30%
28%
52%
62%
17%
10%
-13%
-18%
94%
6%
Non-moviegoers
90%
10%
Light moviegoers
93%
7%
Moderate moviegoers
82%
18%
Heavy moviegoers
Q: Do you recall ever paying to see a movie at home that you knew to be still playing at local theatres? Numbers may not add up to 100 due to rounding.
Canadian Moviegoer Statistics

June 2015
IN-HOME MOVIE CONSUMPTION IN THE PAST 12 MONTHS BY PLATFORM USED
The platforms used most often for in-home movie viewing are:
• DVD/Blu-ray
• Netflix
• Standard cable
Heavy moviegoers watch on DVD/Blu-ray and Netflix at statistically similar levels, while moderate and light moviegoers watch on discs at higher levels than on Netflix.
39%
42%
16%
30%
22%
14%
55%
52%
41%
18%
33%
24%
18%
60% 61%
39%
18%
29%
25%
22%
58%
3.3 3.0 2.8
2.5
1.4
2.1
2.9
4.0
3.0 2.7 2.3
1.4
2.4 3.0
5.2
3.3 3.1 3.2
1.9
2.8 3.1
0.0
5.0
10.0
15.0
20.0
25.0
0%
10%
20%
30%
40%
50%
60%
70%
Netflix On standardcable
On premiumcable
On demand(free)
On demand(paid)
Digitaldownload
DVDor Blu-ray
Moderate (3–9) Light (1–2) Heavy (10+)
% w
ho
ha
ve w
atc
hed
a m
ovi
e in
fo
rma
t in
pa
st 1
2 m
on
ths M
ean
nu
mb
er of m
ovies w
atch
ed in
an
avera
ge m
on
th
Q: In which of the following ways do you watch movies at home? Q: For each of the ways you indicated you watch movies at home, how many movies do you watch in the average month?
Columns appear at different heights for the same numbers due to rounding.
Canadian Moviegoer Statistics
June 2015
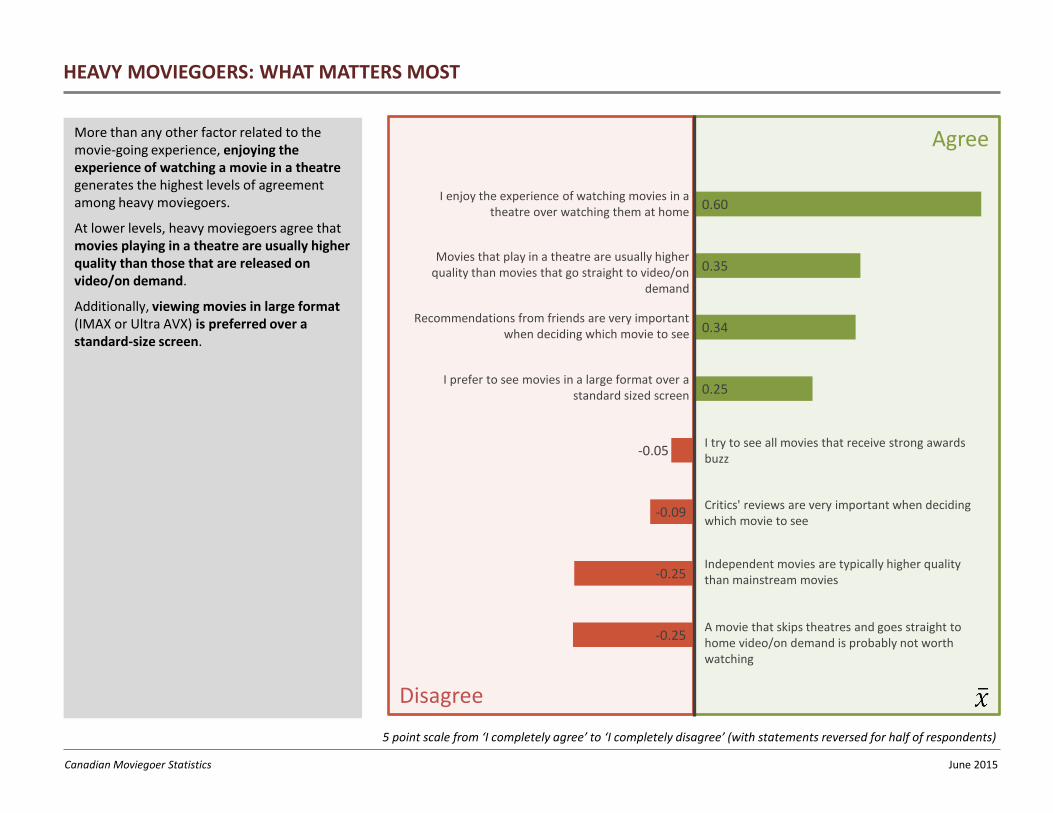
HEAVY MOVIEGOERS: WHAT MATTERS MOST
More than any other factor related to the movie-going experience, enjoying the experience of watching a movie in a theatre generates the highest levels of agreement among heavy moviegoers.
At lower levels, heavy moviegoers agree that movies playing in a theatre are usually higher quality than those that are released on video/on demand.
Additionally, viewing movies in large format (IMAX or Ultra AVX) is preferred over a standard-size screen.
-0.25
-0.25
-0.09
-0.05
0.25
0.34
0.35
0.60
Agree
Disagree
I enjoy the experience of watching movies in a theatre over watching them at home
Movies that play in a theatre are usually higher quality than movies that go straight to video/on
demand
Recommendations from friends are very important when deciding which movie to see
I prefer to see movies in a large format over a
standard sized screen
I try to see all movies that receive strong awards buzz
Critics' reviews are very important when deciding which movie to see
Independent movies are typically higher quality than mainstream movies
A movie that skips theatres and goes straight to home video/on demand is probably not worth watching
5 point scale from ‘I completely agree’ to ‘I completely disagree’ (with statements reversed for half of respondents)
Canadian Moviegoer Statistics

June 2015
METHODOLOGY
Segment Sample Size Margin of Error1
Total 1,870 +/- 2.3
Non-Moviegoers 587 +/- 4.0
Moviegoers 1,283 +/- 2.7
Light 389 +/- 5.0
Moderate 577 +/- 4.1
Heavy 317 +/- 5.5
Male 909 +/- 3.3
Female 961 +/- 3.2
13-17 178 +/- 7.4
18-24 237 +/- 6.4
25-34 306 +/- 5.6
35-44 327 +/- 5.4
45-54 259 +/- 6.1
55-64 324 +/- 5.4
65 + 239 +/- 6.3
1 95% confidence level
The survey was conducted among a sample of 1,870 Canadians aged 13 and older, comprising 909 men and 961 women. Interviewing was conducted beginning May 11, 2015 and ending May 26, 2015. Respondents were recruited via email and completed the survey online. Prior to analysis, any respondent who did not pass a stringent series of quality control checks was removed from the data set. The margin of error for the total sample (at a 95% confidence level) is +/- 2.3.
Data was balanced by demographics (age, gender, province and ethnicity) to match the population of Canada.
The survey collected data on the frequency of motion picture attendance in the past 12 months using the following question: “Over the past twelve months, how many times have you been to the movies at a theatre?”
The raw data collected from this survey reflect self-reported theatre attendance. Self-reported attendance/usage frequencies are typically over-estimated by respondents. This is indeed the case for this dataset, so an adjustment constant is calculated and applied (to the total sample as well as the segments).
Canadian Moviegoer Statistics