Embed Size (px)
DESCRIPTION
Solution of the case "Canadian Occidental Petroleum Limited: The Wascana Energy Inc. Decision" Ivey Publishing
Citation preview
Page 11
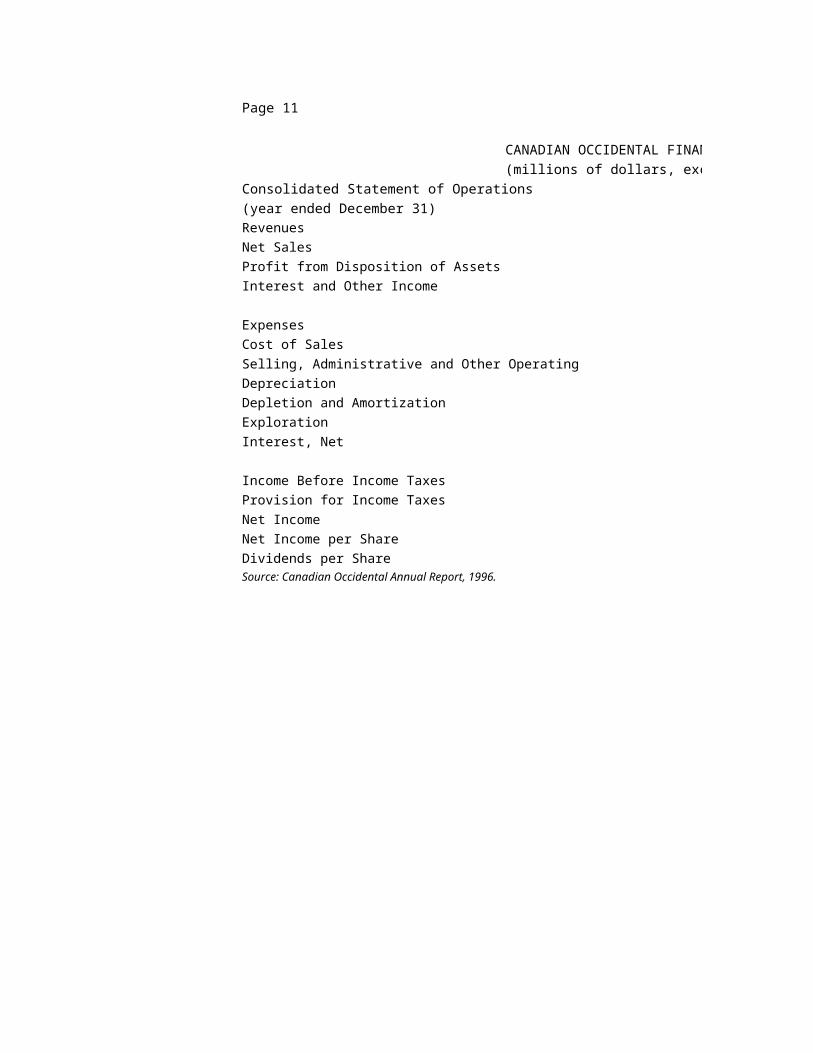
Exhibit 1CANADIAN OCCIDENTAL FINANCIAL STATEMENTS
(millions of dollars, except per share data)
Consolidated Statement of Operations
(year ended December 31)
Revenues
Net Sales
Profit from Disposition of Assets
Interest and Other Income
Expenses
Cost of Sales
Selling, Administrative and Other Operating
Depreciation
Depletion and Amortization
Exploration
Interest, Net
Income Before Income Taxes
Provision for Income Taxes
Net Income
Net Income per Share
Dividends per ShareSource: Canadian Occidental Annual Report, 1996.
9A97N014
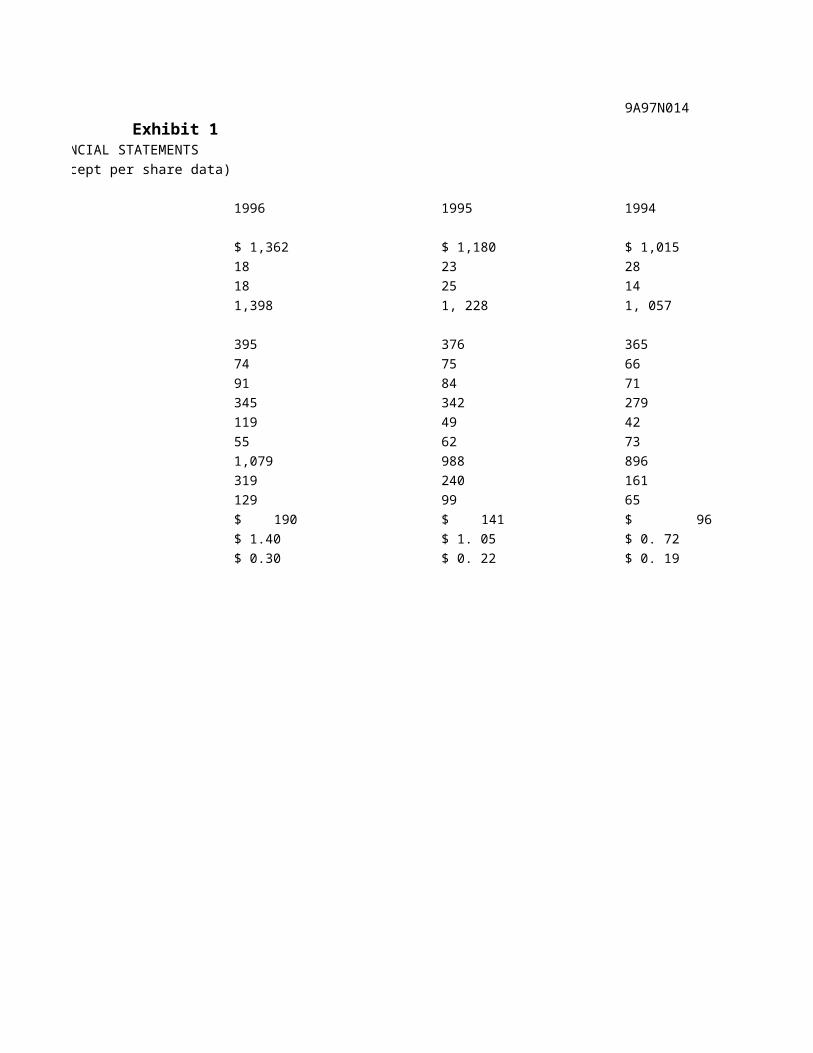
Exhibit 1CANADIAN OCCIDENTAL FINANCIAL STATEMENTS
(millions of dollars, except per share data)
1996 1995 1994
$ 1,362 $ 1,180 $ 1,015
18 23 28
18 25 14
1,398 1, 228 1, 057
395 376 365
74 75 66
91 84 71
345 342 279
119 49 42
55 62 73
1,079 988 896
319 240 161
129 99 65
$ 190 $ 141 $ 96
$ 1.40 $ 1. 05 $ 0. 72
$ 0.30 $ 0. 22 $ 0. 19
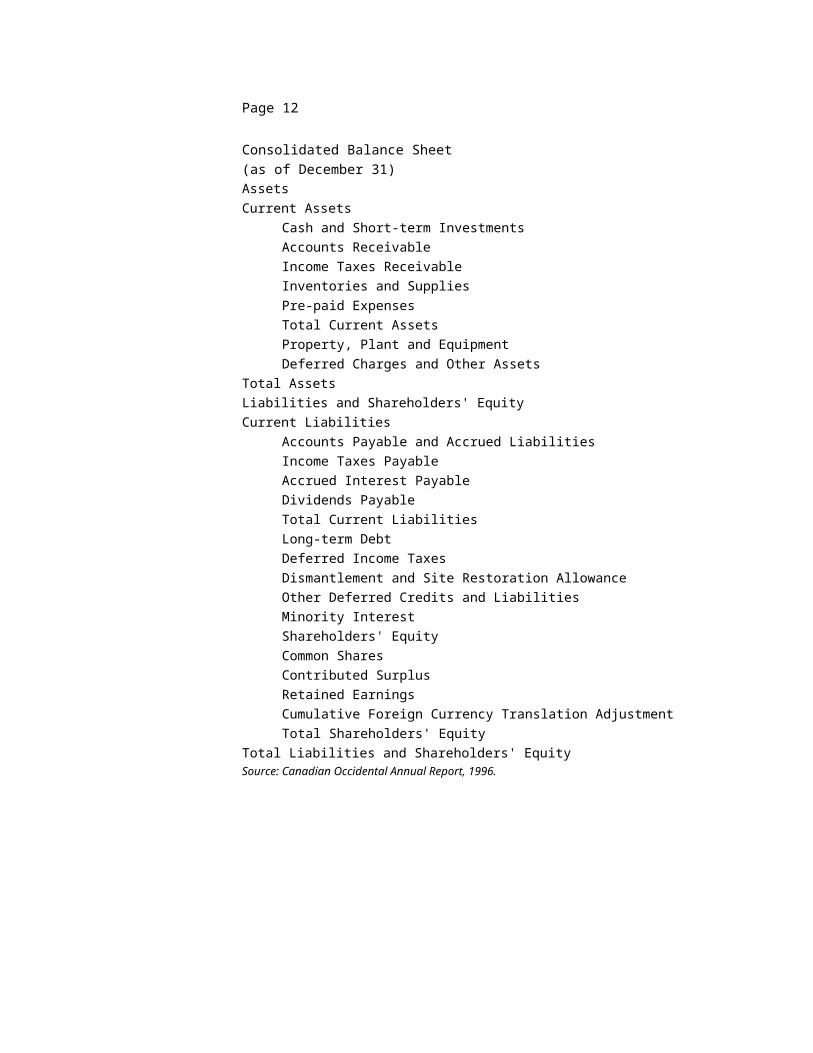
Page 12
Consolidated Balance Sheet
(as of December 31)
Assets
Current Assets
Cash and Short-term Investments
Accounts Receivable
Income Taxes Receivable
Inventories and Supplies
Pre-paid Expenses
Total Current Assets
Property, Plant and Equipment
Deferred Charges and Other Assets
Total Assets
Liabilities and Shareholders' Equity
Current Liabilities
Accounts Payable and Accrued Liabilities
Income Taxes Payable
Accrued Interest Payable
Dividends Payable
Total Current Liabilities
Long-term Debt
Deferred Income Taxes
Dismantlement and Site Restoration Allowance
Other Deferred Credits and Liabilities
Minority Interest
Shareholders' Equity
Common Shares
Contributed Surplus
Retained Earnings
Cumulative Foreign Currency Translation Adjustment
Total Shareholders' Equity
Total Liabilities and Shareholders' EquitySource: Canadian Occidental Annual Report, 1996.
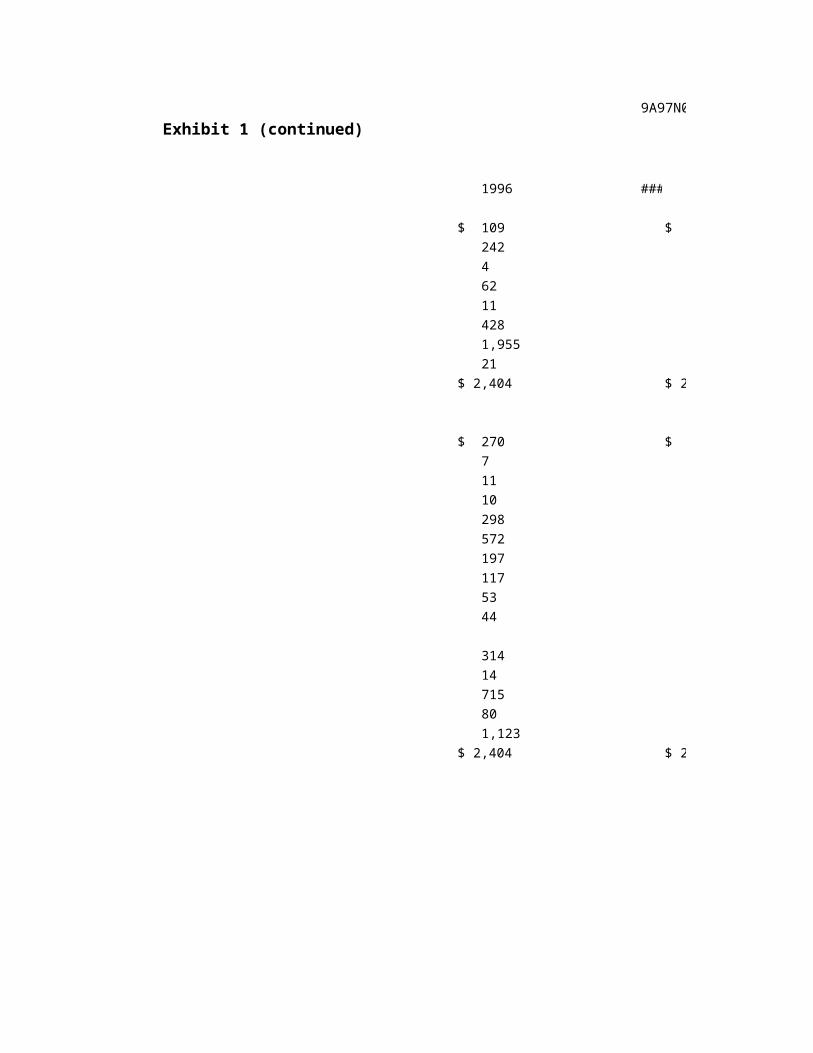
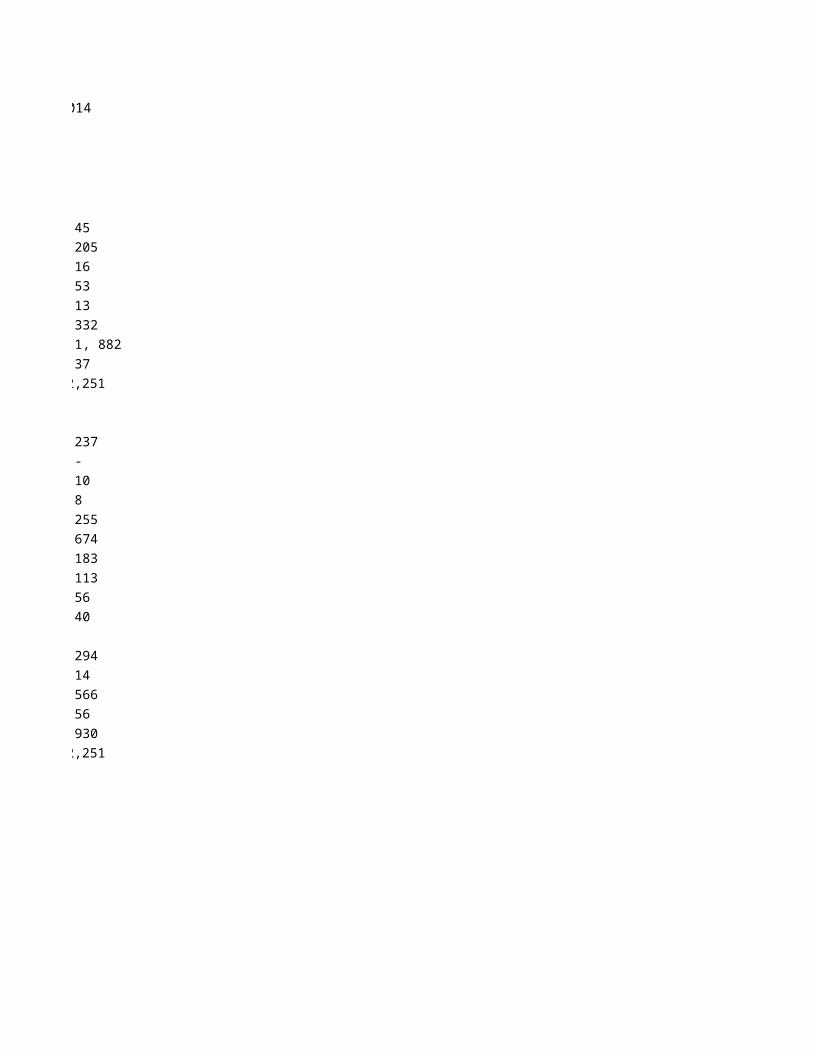
9A97N014
Exhibit 1 (continued)
1996 ###
$ 109 $ 45
242 205
4 16
62 53
11 13
428 332
1,955 1, 882
21 37
$ 2,404 $ 2,251
$ 270 $ 237
7 -
11 10
10 8
298 255
572 674
197 183
117 113
53 56
44 40
314 294
14 14
715 566
80 56
1,123 930
$ 2,404 $ 2,251
Page 13
Consolidated Statement of Operations
(year ending December 31)
R ev enue
Royalty expense
Operating and administrative expense
Restructuring expense
Interest expense
Depletion, depreciation, and amortization
Exploration expense
Gain (loss) on property dispositions
Earnings before taxes
Capital and large corporation taxes
Earnings
Earnings per share
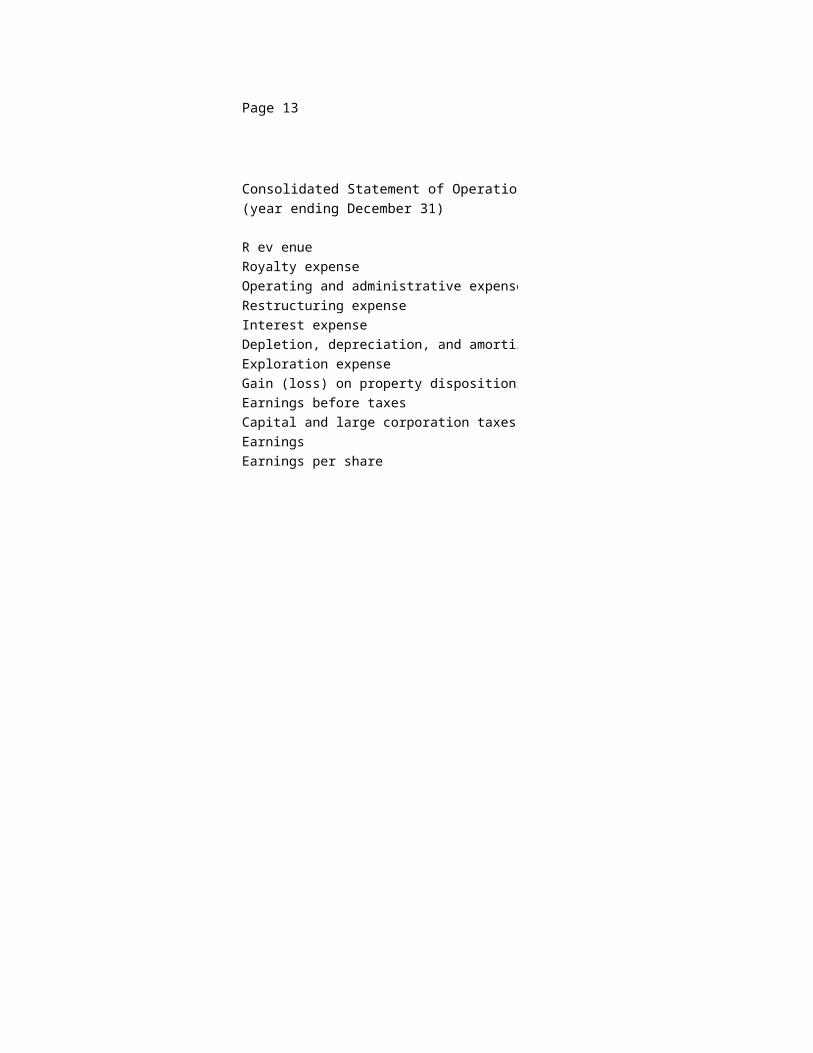
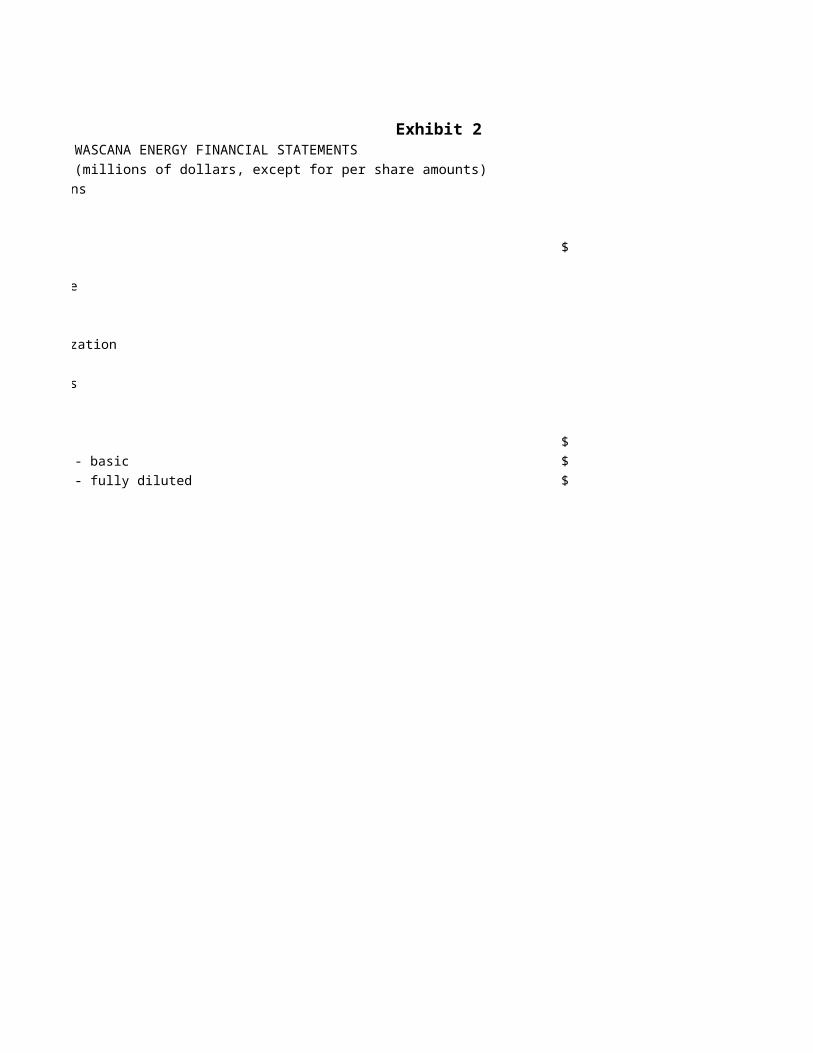
Exhibit 2WASCANA ENERGY FINANCIAL STATEMENTS
(millions of dollars, except for per share amounts)
$
$
- basic $
- fully diluted $
9A97N014
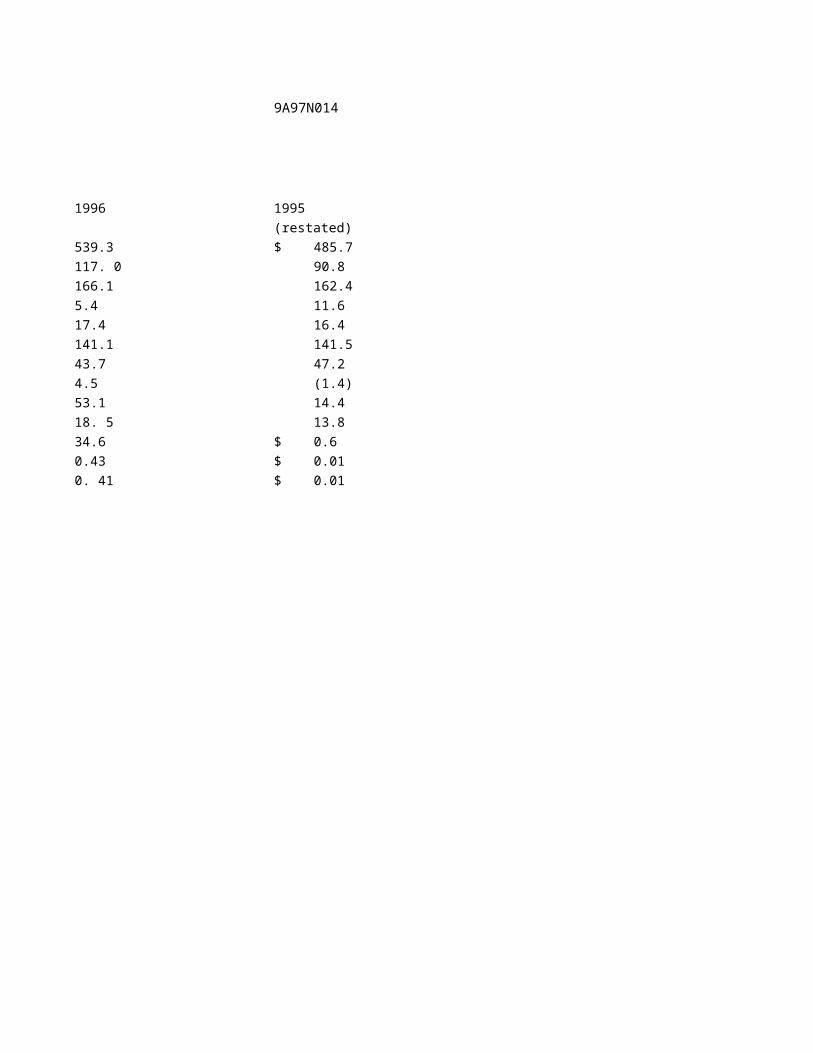
Exhibit 2
1996 1995
(restated)
539.3 $ 485.7
117. 0 90.8
166.1 162.4
5.4 11.6
17.4 16.4
141.1 141.5
43.7 47.2
4.5 (1.4)
53.1 14.4
18. 5 13.8
34.6 $ 0.6
0.43 $ 0.01
0. 41 $ 0.01
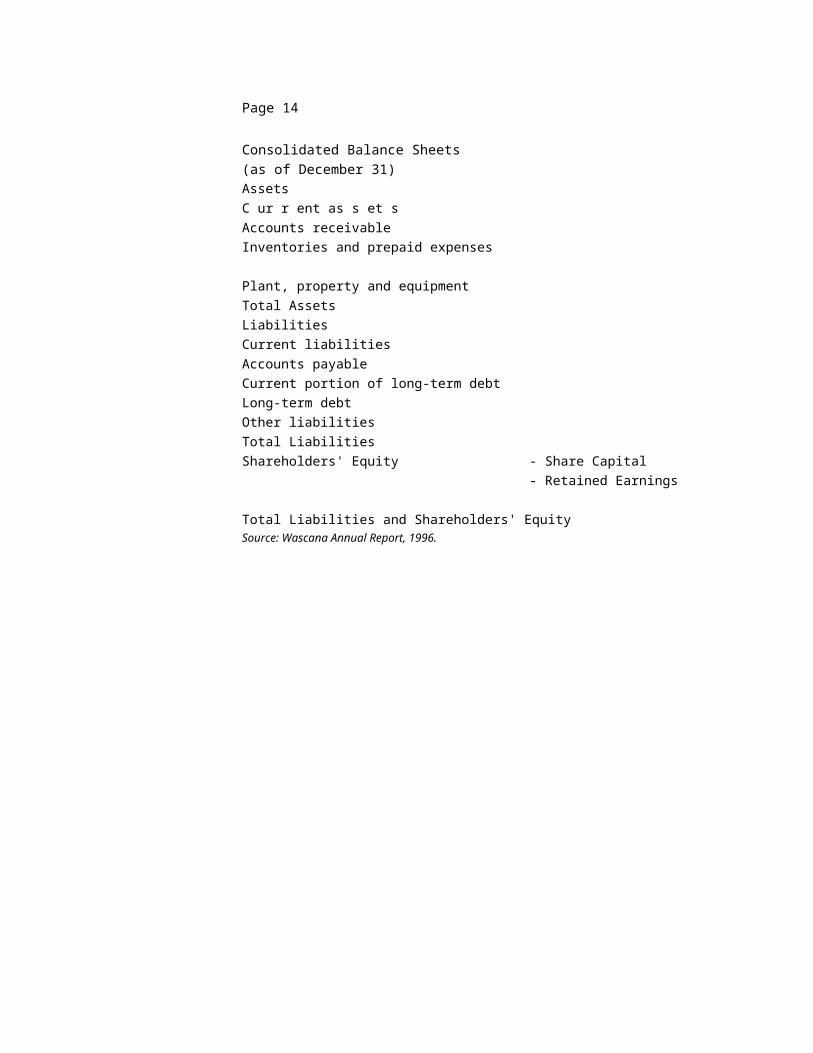
Page 14
Consolidated Balance Sheets
(as of December 31)
Assets
C ur r ent as s et s
Accounts receivable
Inventories and prepaid expenses
Plant, property and equipment
Total Assets
Liabilities
Current liabilities
Accounts payable
Current portion of long-term debt
Long-term debt
Other liabilities
Total Liabilities
Shareholders' Equity - Share Capital
- Retained Earnings
Total Liabilities and Shareholders' EquitySource: Wascana Annual Report, 1996.
9A97N014
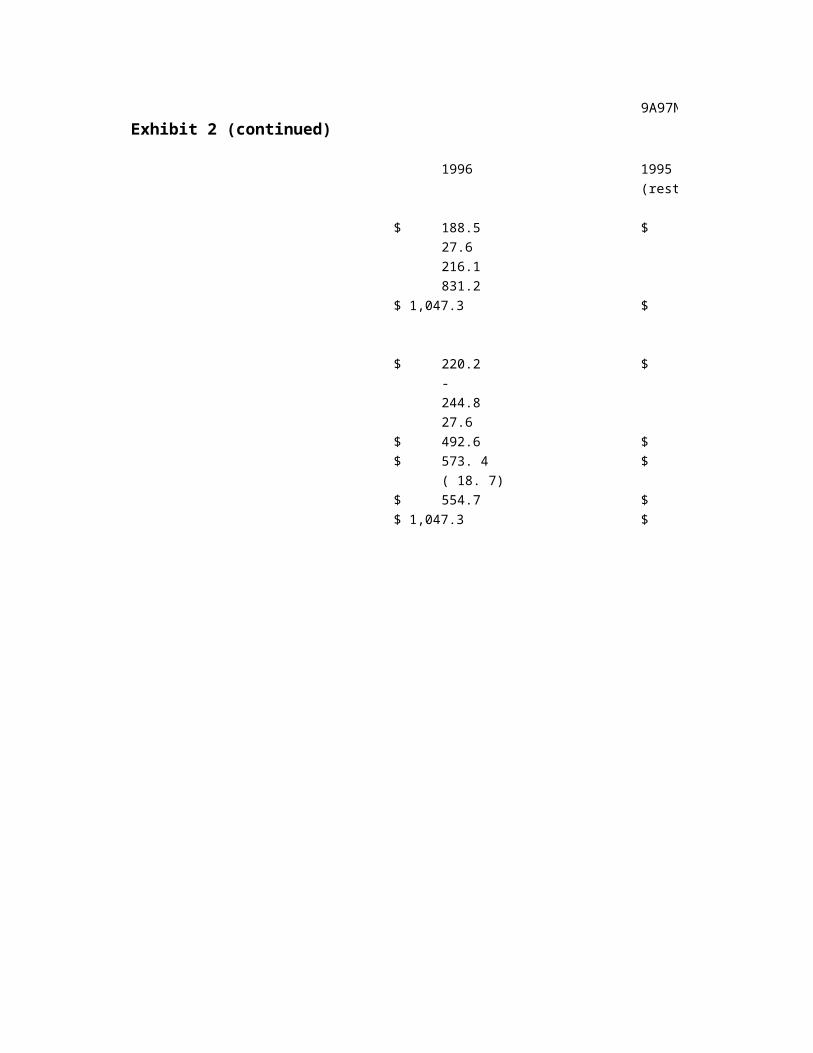
Exhibit 2 (continued)
1996 1995
(restated)
$ 188.5 $ 182.1
27.6 26.5
216.1 208.6
831.2 713.5
$ 1,047.3 $ 922.1
$ 220.2 $ 192.2
- 2.5
244.8 185.2
27.6 26.5
$ 492.6 $ 406.4
$ 573. 4 $ 569
( 18. 7) (53.3)
$ 554.7 $ 515.7
$ 1,047.3 $ 922.1
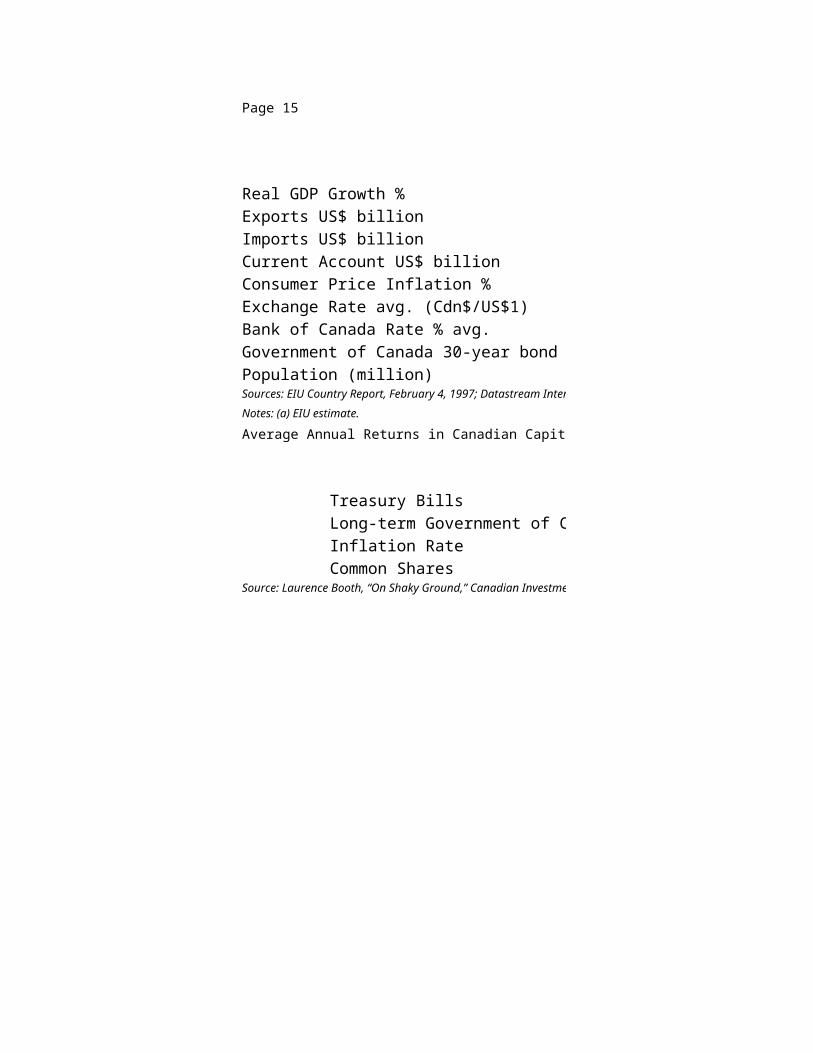
Page 15
Real GDP Growth %
Exports US$ billion
Imports US$ billion
Current Account US$ billion
Consumer Price Inflation %
Exchange Rate avg. (Cdn$/US$1)
Bank of Canada Rate % avg.
Government of Canada 30-year bond rate % avg.
Population (million)Sources: EIU Country Report, February 4, 1997; Datastream International.
Notes: (a) EIU estimate.
Average Annual Returns in Canadian Capital Markets: (1924–1994)
Treasury Bills
Long-term Government of Canada Bonds
Inflation Rate
Common SharesSource: Laurence Booth, “On Shaky Ground,” Canadian Investment Review, Spring, 1995.
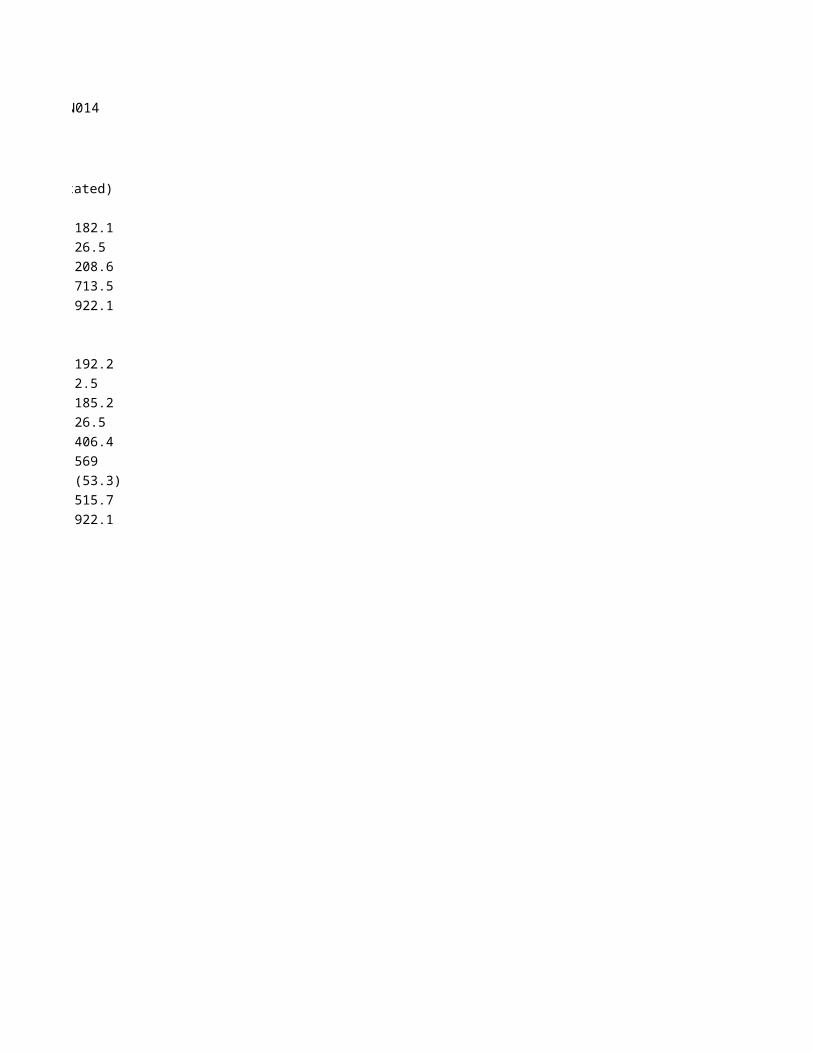
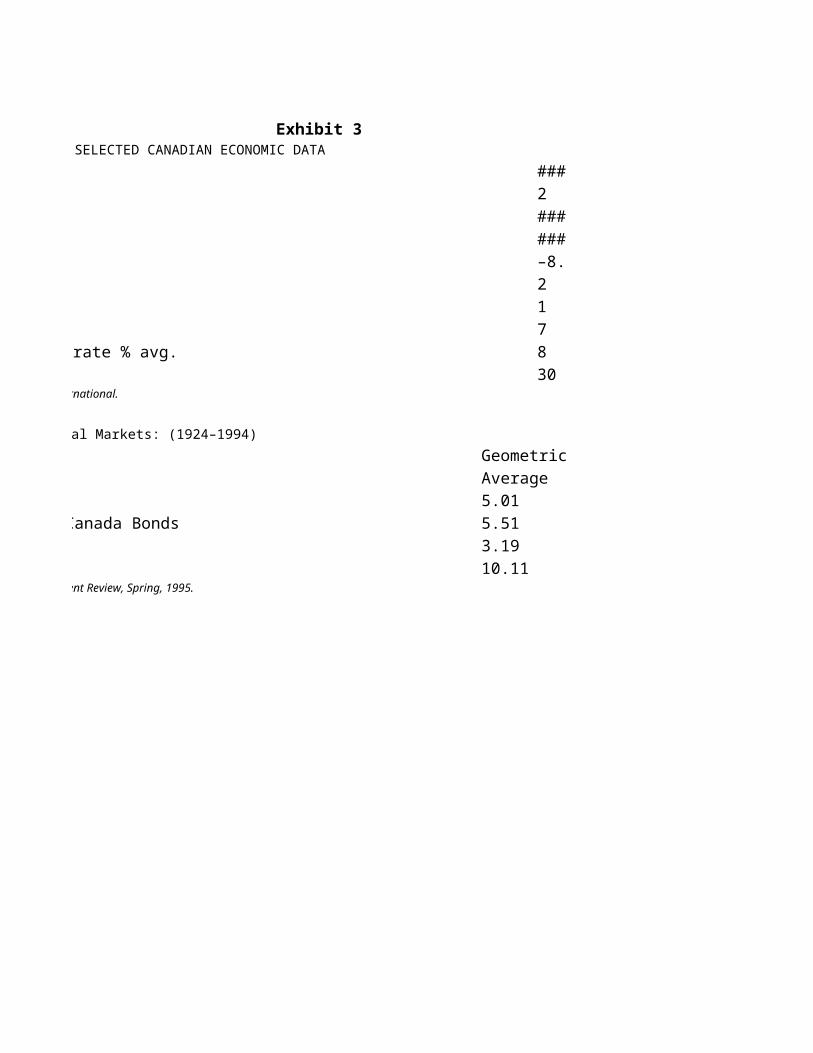
Exhibit 3SELECTED CANADIAN ECONOMIC DATA
###
2.3
###
###
–8.7
2.1
1
7
Government of Canada 30-year bond rate % avg. 8
30Sources: EIU Country Report, February 4, 1997; Datastream International.
Average Annual Returns in Canadian Capital Markets: (1924–1994)
Geometric Arithmetic
Average Average
5.01 5.11
Long-term Government of Canada Bonds 5.51 5.84
3.19 3.29
10.11 11.79Source: Laurence Booth, “On Shaky Ground,” Canadian Investment Review, Spring, 1995.
9A97N014
1996
1.4 a
213.3 a
178.8 a
3.4 a
1.6
1.36
4.67
7.23
30.1
Page 17
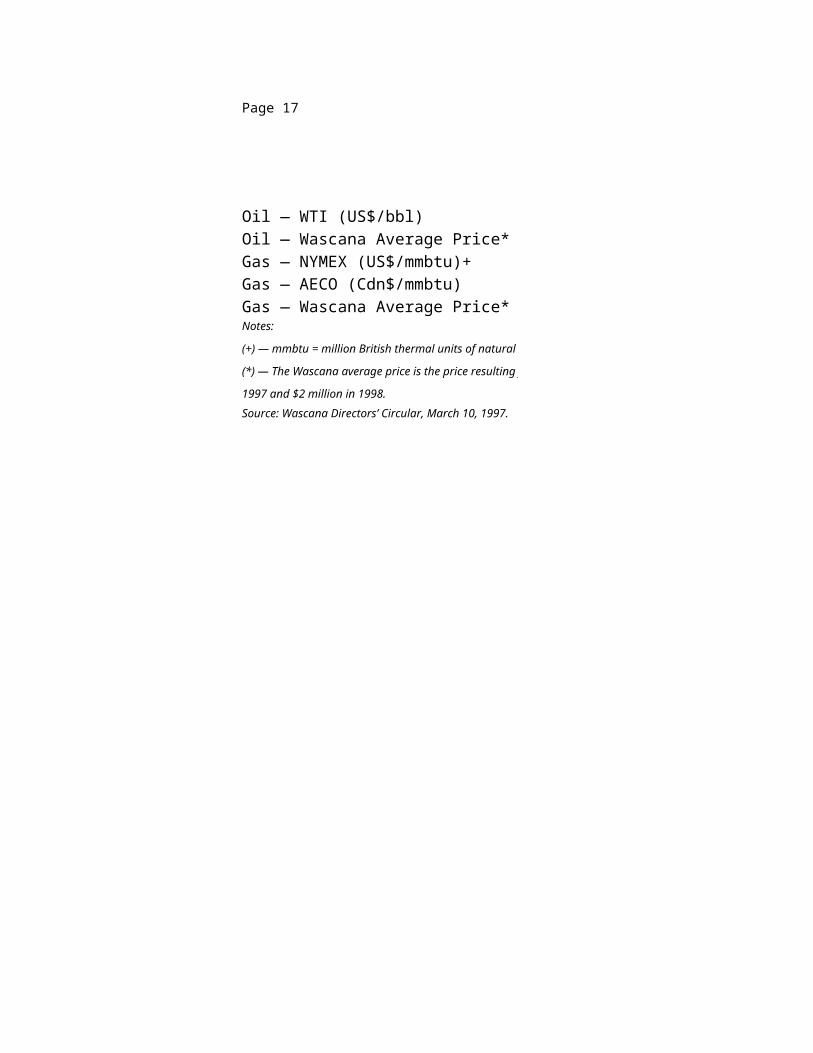
Oil — WTI (US$/bbl)
Oil — Wascana Average Price* (Cdn$/bbl)
Gas — NYMEX (US$/mmbtu)+
Gas — AECO (Cdn$/mmbtu)
Gas — Wascana Average Price* (Cdn$/mcf)Notes:
(+) — mmbtu = million British thermal units of natural gas
(*) — The Wascana average price is the price resulting from hedging. The forecast predicts hedging losses of $29 million in
1997 and $2 million in 1998.
Source: Wascana Directors’ Circular, March 10, 1997.
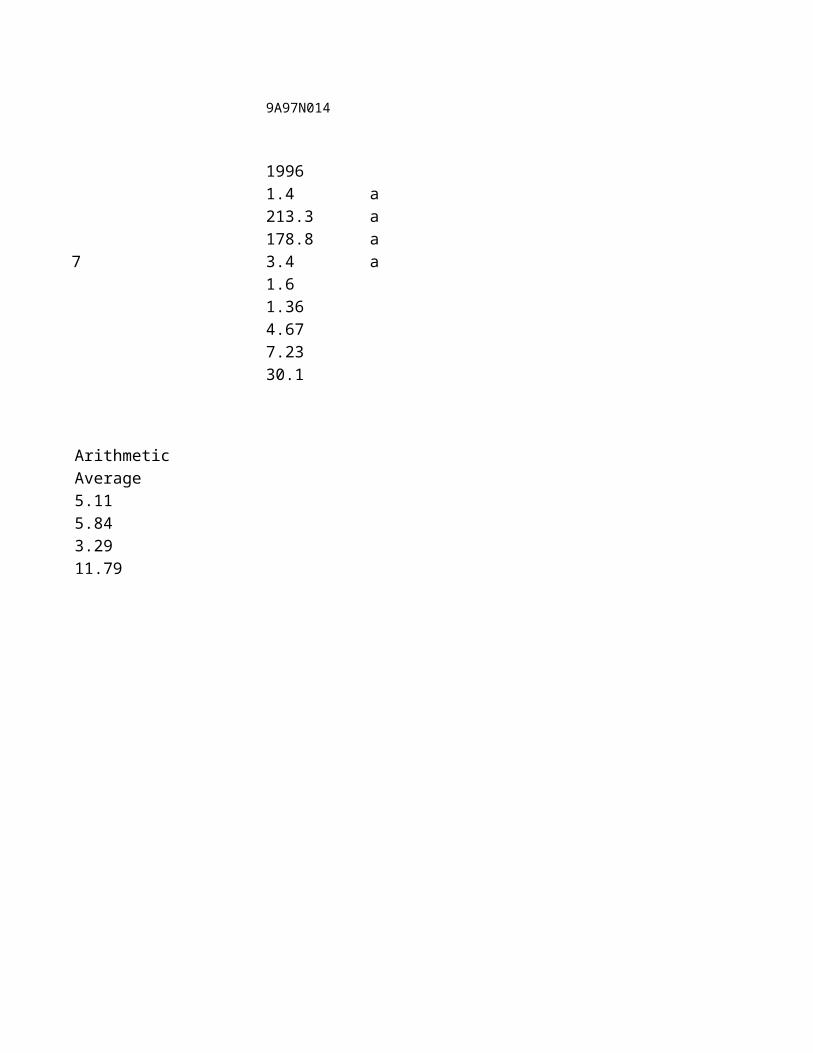
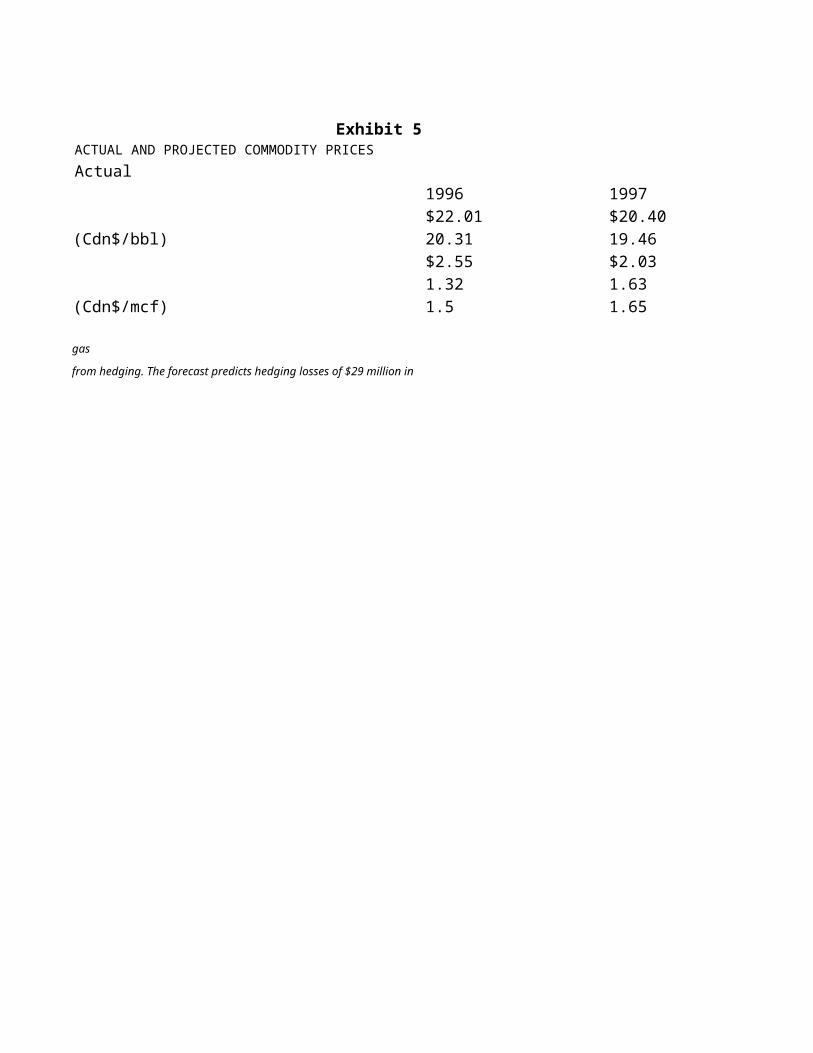
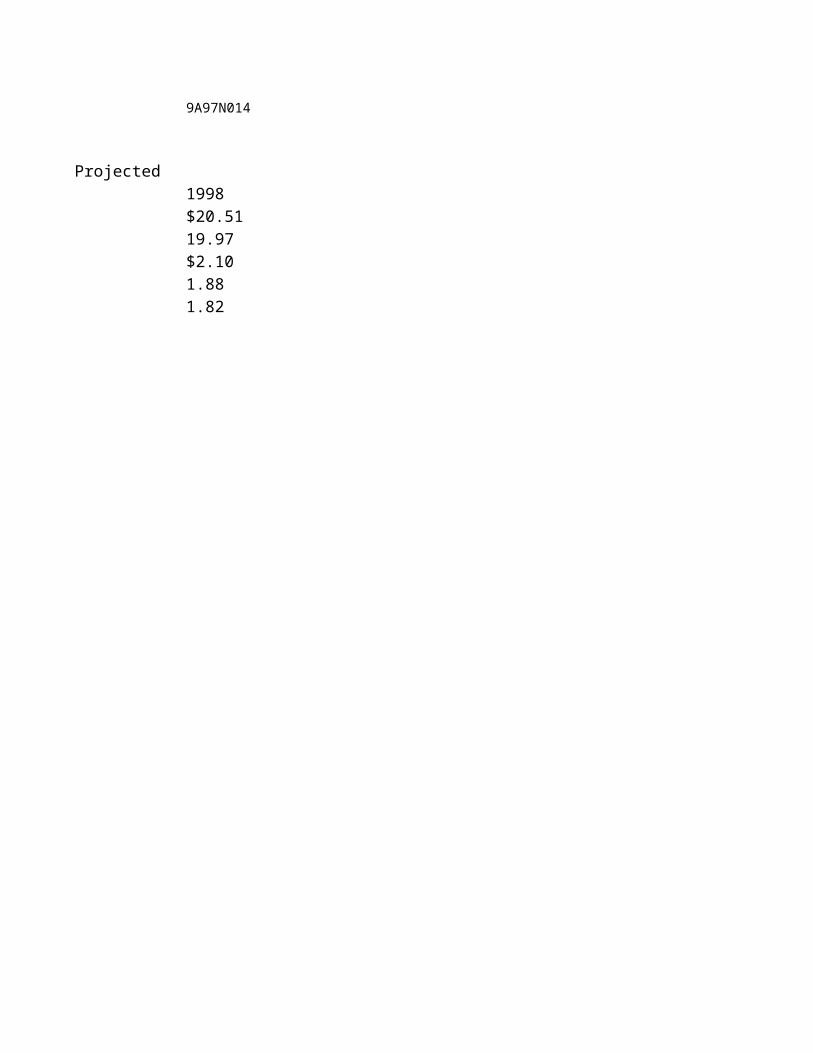
Exhibit 5ACTUAL AND PROJECTED COMMODITY PRICES
Actual
1996 1997
$22.01 $20.40
Oil — Wascana Average Price* (Cdn$/bbl) 20.31 19.46
$2.55 $2.03
1.32 1.63
Gas — Wascana Average Price* (Cdn$/mcf) 1.5 1.65
(+) — mmbtu = million British thermal units of natural gas
(*) — The Wascana average price is the price resulting from hedging. The forecast predicts hedging losses of $29 million in
Source: Wascana Directors’ Circular, March 10, 1997.
9A97N014
Projected
1998
$20.51
19.97
$2.10
1.88
1.82
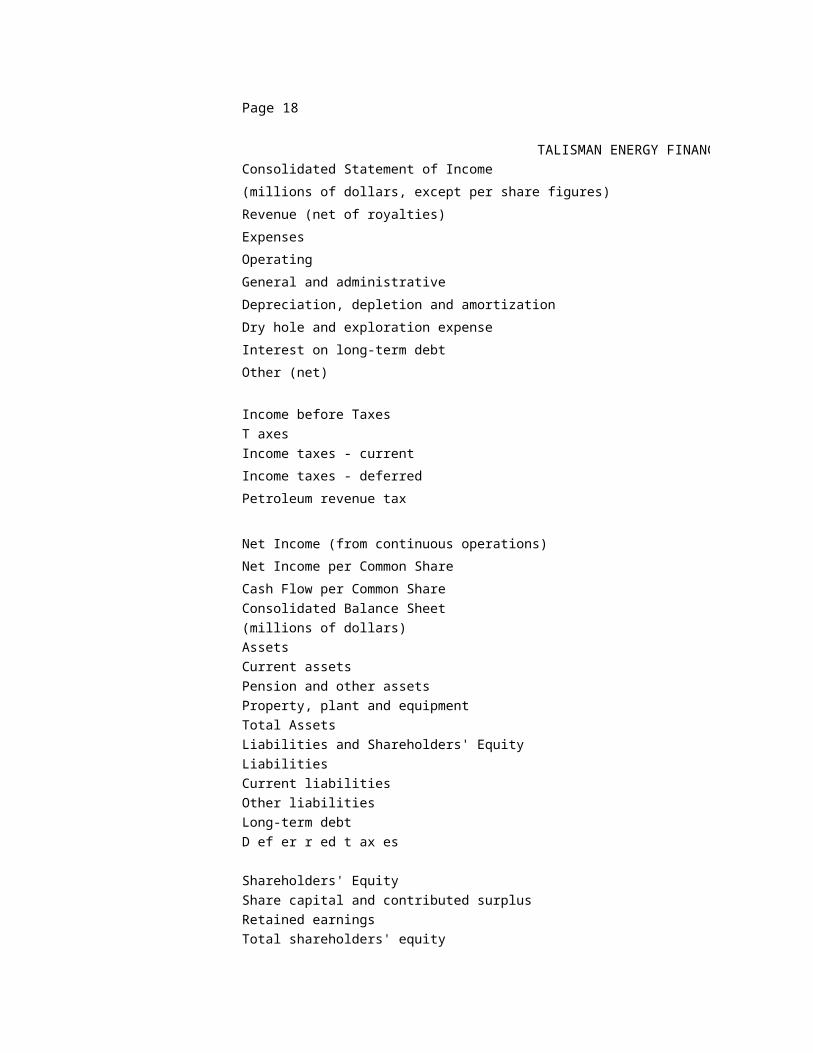
Page 18
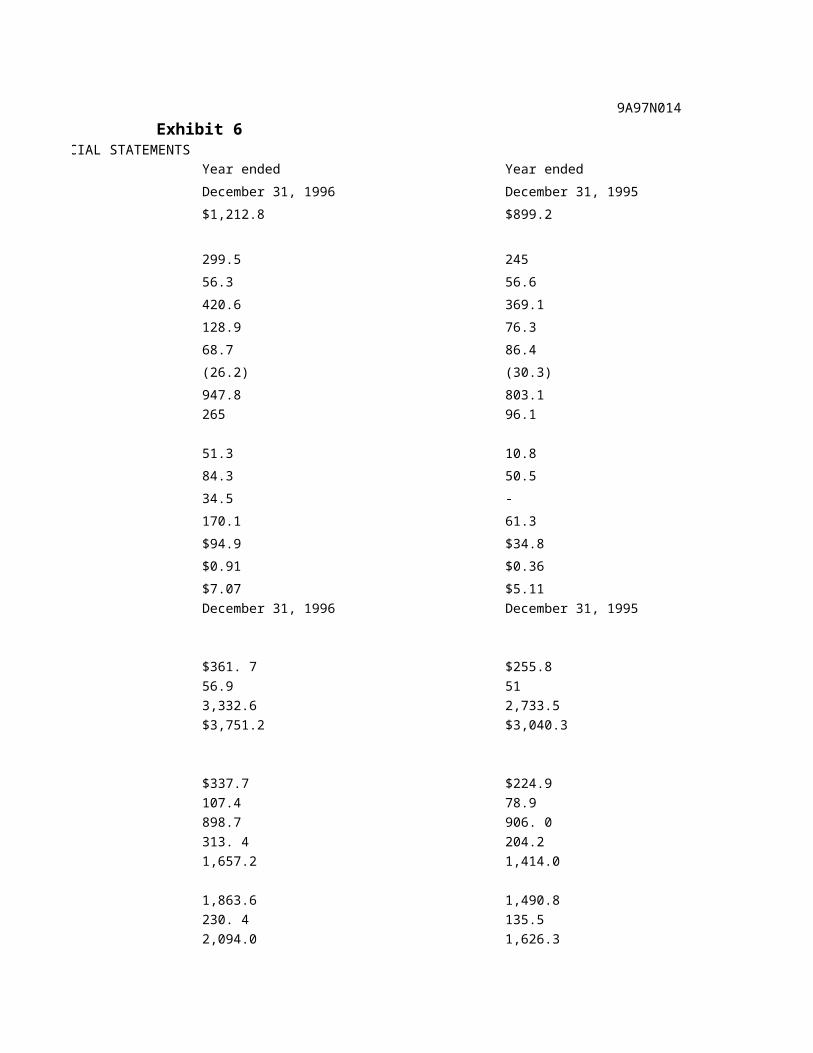
Exhibit 6TALISMAN ENERGY FINANCIAL STATEMENTS
Consolidated Statement of Income
(millions of dollars, except per share figures)
Revenue (net of royalties)
Expenses
Operating
General and administrative
Depreciation, depletion and amortization
Dry hole and exploration expense
Interest on long-term debt
Other (net)
Income before Taxes
T axes
Income taxes - current
Income taxes - deferred
Petroleum revenue tax
Net Income (from continuous operations)
Net Income per Common Share
Cash Flow per Common Share
Consolidated Balance Sheet
(millions of dollars)
Assets
Current assets
Pension and other assets
Property, plant and equipment
Total Assets
Liabilities and Shareholders' Equity
Liabilities
Current liabilities
Other liabilities
Long-term debt
D ef er r ed t ax es
Shareholders' Equity
Share capital and contributed surplus
Retained earnings
Total shareholders' equity
Total Liabilities and Shareholders' EquitySource: Talisman Energy Inc. Annual Report, 1996.
9A97N014
Exhibit 6TALISMAN ENERGY FINANCIAL STATEMENTS
Year ended Year ended
December 31, 1996 December 31, 1995
$1,212.8 $899.2
299.5 245
56.3 56.6
420.6 369.1
128.9 76.3
68.7 86.4
(26.2) (30.3)
947.8 803.1
265 96.1
51.3 10.8
84.3 50.5
34.5 -
170.1 61.3
$94.9 $34.8
$0.91 $0.36
$7.07 $5.11
December 31, 1996 December 31, 1995
$361. 7 $255.8
56.9 51
3,332.6 2,733.5
$3,751.2 $3,040.3
$337.7 $224.9
107.4 78.9
898.7 906. 0
313. 4 204.2
1,657.2 1,414.0
1,863.6 1,490.8
230. 4 135.5
2,094.0 1,626.3
$3,751.2 $3,040.3
Page 19
Exhibit 7STOCK PRICE COMPARISON
Date Wascana Talisman
Energy Energy
1/1/96 $12.88 $27.63
1/1/97 15.8 45.6
2/3/97 16.65 47.4
2/4/97 17 47.2
2/5/97 17 46.25
2/6/97 17.25 44.8
2/7/97 16.75 44.4
2/10/97 16.1 43.2
2/11/97 16.4 44.9
2/12/97 16.95 45.15
2/13/97 19 46.25
2/14/97 19.1 46.3
2/17/97 19.1 46.3
2/18/97 19 46.45
2/19/97 18.9 45.8
2/20/97 18.6 44.15
2/21/97 18.75 45.65
2/24/97 18.85 46
2/25/97 18.55 45.05
2/26/97 18.5 45.4
2/27/97 18.6 44.75
2/28/97 18.45 44.45
3/3/97 18.4 44.3
3/4/97 18.55 44.95
3/5/97 18.9 44.5
3/6/97 18.7 44.15
3/7/97 18.75 44.45
3/10/97 18.95 44.25
3/11/97 19.1 43.9
3/12/97 19.15 44.2
3/13/97 19.4 44
3/14/97 19.4 43.95Notes: (1) — Toronto Stock Exchange Composite Index
Source: Datastream International.

9A97N014
Exhibit 7STOCK PRICE COMPARISON
Canadian TSE 300 TOGP
Occidental Index1 Index2
$22.37 4713.5 4794.1
22.05 5927.03 6577.2
25.35 6140.93 6973.5
25.15 6145.41 6895.3
24.95 6112.41 6805.1
24.2 6071.89 6607.2
23.25 6101.74 6523.8
23.15 6081.27 6331.2
23.4 6126.92 6425.6
23.4 6165.38 6440.6
24.1 6225.78 6568.8
24.1 6214.24 6590.2
24.55 6217.6 6608.4
24.4 6238.22 6599.3
24.15 6248.86 6506.9
23.65 6205.07 6389.1
23.8 6226.95 6443.1
24.1 6242.52 6448.7
23.65 6247.78 6376.7
23.4 6201.43 6369.9
23.4 6187.46 6351.1
23.1 6157.84 6234
22.85 6145.98 6214.1
22.85 6155.05 6282.4
22.75 6203.12 6319.1
22.7 6214.73 6304.3
22.5 6268.39 6397.7
22.7 6332.87 6432.6
22.95 6305.46 6443.5
22.9 6257.21 6414.8
22.8 6165.86 6323.1
23.45 6197.71 6375.2(2) — Toronto Oil and Gas Producers Index
Page 20
Exhibit 8WASCANA FINANCIAL FORECASTS
Consolidated Statements of Operations Forecasts
(millions of dollars except for per share amounts)
1997
Revenue
Operating
less Royalties
Expenses
Operating
General and Administrative
Depletion, Depreciation, and Amortization
Exploration
Interest
Earnings Before Taxes
Capital and Large Corporation Tax
Current Income Taxes
Deferred Income Taxes
Earnings
Earnings per Share - basic
Earnings per Share - fully diluted
Change in Working Capital Balances
Note: Cash flow sensitivity - (millions of Canadian dollars)
Oil price change - US$1.00 per bbl of WTI
$1.00 per bbl change in heavy oil differential
Gas price change - $0.10 per mmcf
Royalties - change of 1%
$0.01 change in US/Cdn exchange rate
Interest rate - change of 1%
Source: Wascana Directors’ Circular, March 10, 1997.

9A97N014
Exhibit 8WASCANA FINANCIAL FORECASTS
Consolidated Statements of Operations Forecasts
(millions of dollars except for per share amounts)
1998
$ 653 $ 866
( 131) ( 156)
522 710
152 184
36 38
161 210
61 57
21 22
431 511
91 199
19 23
- 33
23 24
$ 49 $ 119
$ 0.61 $ 1.46
$ 0.60 $ 1.43
( 7) ( 9)
1997 1998
$ 8.8 $ 16. 5
5.9 6. 5
5.2 5. 4
5.4 5. 1
2.5 3. 1
0.5 1. 1