Embed Size (px)
Citation preview

2017
THE CANADIAN PHYTOPATHOLOGICAL SOCIETY
CANADIAN PLANT DISEASE SURVEY
DISEASE HIGHLIGHTS
SOCIÉTÉ CANADIENNE DE PHYTOPATHOLOGIE
INVENTAIRE DES MALADIES DES PLANTES AU CANADA
APERÇU DES MALADIES
The Society recognizes the continuing need to publish plant disease surveys to document plant
pathology in Canada and to benefit federal, provincial and other agencies in planning research
and development on disease control.
La Société estime qu’il est nécessaire de publier régulièrement les résultats d’études sur l’état des
maladies au Canada afin qu’ils soient disponibles aux phytopathologistes et qu’ils aident les organismes
fédéraux, provinciaux et privés à planifier la recherche et le développement en lutte contre les maladies.
NATIONAL EDITOR/ DIRECTRICE NATIONALE
Dr. Janice Elmhirst
Elmhirst Diagnostics & Research 5727 Riverside Street
Abbotsford, British Columbia V4X1T6
Tel.: 604-820-4075; cell: 604-832-9495
Email: [email protected]

Canadian Plant Disease Survey
CPDS Volume 97: 1 – 235
March, 2017
Inventaire des maladies des plantes au Canada
IMPC Volume 97: 1 - 235 Mars 2017
Contents: DISEASE HIGHLIGHTS - 2016 GROWING SEASON
1 (+ earlier years for historical significance)
Contents / Sections
2017 Section editors / Directeurs de section -
2017 Index- Titles and authors / Titres et auteurs
1
2
Sections: 5 Diagnostic laboratories / Laboratoires diagnostiques
- British Columbia (2)
- Alberta
- Saskatchewan
- Manitoba
- Ontario - New Brunswick - Prince Edward Island
- Québec
100 Cereals / Céréales
161 Oilseeds, Pulses, Forages and Special Crops / Oléagineux, Protéagineux, Plantes fourragères et Cultures spéciales
227 Vegetables / Légumes
233 2017 Author index (alphabetical)/Index d’auteurs (alphabétique) - 2017
235 List of figures/Liste de figures
The Canadian Plant Disease Survey is a periodical of information and record on the occurrence and severity of plant diseases in Canada and the estimated losses from diseases.
Authors who wish to publish articles and notes on other aspects of plant pathology are encouraged to submit this material to the scientific journal of their choice, such as the Canadian Journal of Plant Pathology or Phytoprotection
Deidre Wasyliw, Compiler
Department of Biology 112 Science Place Saskatoon, Saskatchewan S7N 5E2 Tel. (306) 966-4455 Email: [email protected]
L’Inventaire des maladies des plantes au Canada est un périodique d’information sur la fréquence des maladies des plantes au Canada, leur gravité et les pertes qu’elles occasionnent.
Les auteurs qui veulent publier des articles et des notes sur d’autres aspects de la phytopathologie sont invités à soumettre leurs textes à la revue scientifique de leur choix, par exemple à la Revue canadienne de
phytopathologie ou à Phytoprotection.
Deidre Wasyliw, Compilatrice
Department of Biology 112 Science Place Saskatoon, Saskatchewan S7N 5E2 Tél. (306) 966-4455 Courriel: [email protected]

1
2017 CPDS SECTION EDITORS AND ADDRESSES
SECTION EDITORS AND ADDRESSES
DIAGNOSTIC LABORATORIES /LABORATOIRES DIAGNOSTIQUES
Ms. Marilyn Dykstra Pest Management Centre Agriculture and Agri-Food Canada Building 57, 960 Carling Ave. Ottawa, ON K1A 0C6 Tel: (613) 759-7430 Fax: (613) 759-1400 Email: [email protected]
CEREALS / CÉRÉALES Dr. Kelly Turkington Research Scientist Agriculture and Agri-Food Canada Lacombe Resarch and Development Centre 6000 C and E Trail Lacombe, Alberta T4L 1W1 Tel: (403) 782-8138 Fax: (403) 782-6120 Email: [email protected]
OILSEEDS, PULSES, FORAGES AND SPECIAL CROPS / OLÉAGINEUX, PROTÉAGINEUX, PLANTES FOURRAGÈRES ET CULTURES SPÉCIALES
Dr. Debra McLaren Research Scientist Crop Production Pathology Brandon Research Centre 2701 Grand Valley Road P.O. Box 1000A, R.R. #3 Brandon, Manitoba R7A 5Y3 Tel: (204) 578-6561 Fax: (204) 578-6724 Email: [email protected]
VEGETABLES /LÉGUMES Dr. Mary Ruth McDonald Department of Plant Agriculture University of Guelph 50 Stone Road East Guelph, Ontario N1G 2W1 Tel: (519) 824-4120 ext. 52791 Fax: (519) 763-8933 Email: [email protected]
FRUIT, NUTS AND BERRIES, ORNAMENTALS AND TURFGRASS/ FRUITS, FRUITS À ÉCALE ET BAIES, PLANTES ORNEMENTALES ET GAZON
Mr. Mike Celetti Agriculture Development Branch Ontario Ministry of Agriculture, Food and Rural Affairs, Room 3110, Edmund C. Bovey Building, University of Guelph, Guelph, Ontario N1G 2W1 Tel: (519) 824-4120 ext. 58910 Fax: (519) 767-0766 Email: [email protected]
FOREST TREES/ ARBRES FORESTIERS
Dr. Jean Bérubé Service canadien des forêts Centre de foresterie des Laurentides Ressources Naturelles Canada Gouvernement du Canada 1055 rue du P.E.P.S., C.P. 10380 Sainte-Foy (Québec), G1V 4C7 Tél: (418) 648-7174 Facs: (418) 648-5849 Email: [email protected]

2
INDEX – TITLES AND AUTHORS / TITRES ET AUTEURS
DIAGNOSTIC LABORATORIES / LABORATOIRES DIAGNOSTIQUES ......................................................... 5
V.Joshi and M. Jeffries. Diseases/symptoms diagnosed on commercial crop samples submitted to the British Columbia Ministry of Agriculture (BCAGRI) Plant Health Laboratory in 2016 ................................... 5
J. Elmhirst. Diseases diagnosed on ornamental nursery and landscape crops in British Columbia, 2016 ................................................................................................................................................................... 20
K. Zuzak, Y. Yang, D. Rennie, K. Zahr, D. Feindel and J. Feng. Diseases diagnosed on crop samples submitted to the Alberta Plant Health Lab in 2016 ............................................................................................ 22
F.L. Dokken-Bouchard, C. Brenzil, K. Gray, A. Mah, T. Sliva, D.T. Stephens, G. Sweetman, A. Wilyman and B. Ziesman. Diseases diagnosed on crop samples submitted to the Saskatchewan Ministry of Agriculture Crop Protection Laboroatory in 2016. 2015 Manitoba Crop Diagnostic Centre Laboratory submissions..................................................................................................................................... 27
M. Pradhan, V. Bisht, H. Derksen, P. Bajracharya. 2016 Manitoba Agriculture Crop Diagnostic Centre Laboratory submissions ......................................................................................................................... 33
M. Melzer and X. Shan. Diseases diagnosed on plant samples submitted to the Pest Diagnostic Clinic, University of Guelph, in 2016 ................................................................................................................. 41
M. Chandran, D. Van Dyk and M.R. McDonald. Diseases diagnosed on plant samples submitted to the Muck Crops Research Station in 2016 ........................................................................................................ 55
A.M. Breton, A. Dionne, J. Vivancos, J. Caron and D. Hamel. Maladies et problèmes abiotiques diagnostiqués sur les échantillons de plantes reçus en 2016 au Laboratoire de diagnostic en phytoprotection du MAPAQ ............................................................................................................................... 57
A.M. Breton, A. Dionne, J. Vivancos, J. Caron and D. Hamel. Diseases/Abiotic problems diagnosed on plant samples submitted to the MAPAQ – Laboratoire de diagnostic en phytoprotection in 2016 .............. 75
M.T. Tesfaeindrias. Diseases diagnosed on plant samples submitted to the NBDAAF Plant Disease Diagnostic Laboratory in 2016 ........................................................................................................................... 92
M.M. Clark and A. Driscoll. Diseases diagnosed on commercial crop samples submitted to the Prince Edward Island Plant Disease Diagnostic Service (PDDS) in 2016 ........................................................ 96
CEREALS / CÉRÉALES ................................................................................................................................. 100
M. Banik, M. Beyene and X. Wang. Fusarium head blight of barley in Manitoba - 2016 ............................... 100
P. Cholango-Martinez and H.R.Kutcher. Leaf spot diseases in barley in Saskatchewan in 2016 ................. 102
N.E. Rauhala and T.K. Turkington. 2016 Barley disease survey in Central Alberta ...................................... 104
A.G. Xue, Y. Chen and Y. Al-Rewashdy. Diseases of barley in Central and Eastern Ontario ...................... 106
P. Cholango-Martinez, A.G. Liew, E. Meyers, P. Hucl and H.R. Kutcher. Leaf mottle and Fusarium spp. in canary seed in Saskatchewn in 2016. ................................................................................. 108
M. Banik, M. Beyene and X. Wang. Fusarium head blight of oat in Manitoba – 2016 ................................... 111
J.G. Menzies, A.G. Xue, S. Deceuninck, Z. Popovic and J. Friesen. Crown rust of oat in Manitoba, Saskatchewan and Ontario in 2015 ............................................................................................... 113
M. Dyck. A.G. Liew, E. Boots, P. Cholango-Martinez and H.R. Kutcher. Fusarium infection of oat panicles in Saskatchwan in 2016. ................................................................................................................... 116
A.G. Xue, Y. Chen and Y. Al-Rewashdy. Diseases of oat in Central and Eastern Ontario in 2016 .............. 117
M. Beyene, M. Banik and X. Wang. Barley and oat leaf spot diseases in 2016 in Manitoba ........................ 119
A. Woitas, T.S. Grewal, H.R. Kutcher and A.D. Beattie. Leaf spot diseases of oat in Saskatchewan in 2016 .................................................................................................................................... 121

3
S. Rioux. Maladies observes chez les cereals au Québec en 2016. ............................................................... 123
M.A. Henriquez, P. Bajracharya, P. de Rocquigny, H. Derksen, D. Miranda and O. Gruenke.Fusarium head blight of spring wheat in Manitoba in 2016 .............................................................................. 125
M.A. Henriquez, P. Bajracharya, P. de Rocquigny, H. Derksen, D. Miranda and O. Gruenke.Fusarium head blight of winter wheat in Manitoba in 2016 ............................................................................... 127
M.A. Henriquez, P. Bajracharya, P. de Rocquigny, H. Derksen, Z. Yao, D. Miranda and
O. Gruenke. Leaf spot diseases of spring wheat in Manitoba in 2016. ........................................................... 129
M.A. Henriquez, P. Bajracharya, P. de Rocquigny, H. Derksen,Z. Yao, D. Miranda and
O. Gruenke. Leaf spot diseases of winter wheat in Manitoba in 2016. ........................................................... 131
B. McCallum, E. Reimer and W. McNabb. Leaf rust and stripe rust of wheat in Manitoba andEastern Saskatchwan in 2016 .......................................................................................................................... 133
T. Fetch and T. Zegeye. Stem rusts of cereals in Western Canada in 2016 ................................................... 134
M.R. Fernandez, B.A. Out, G. Ford, L. Abdellatif, C. Kenny, F. Wailchli, A. Brown, B. Ziesman,D.T. Stephens and F.L. Dokken-Bouchard. Leaf spotting diseases of common and durum wheatin Saskatchewan in 2016 .................................................................................................................................. 135
G.S. Brar, G. Singh, P. Cholango-Martinez, J. Lobo, K. Nabetani, R.Knox and H.R. Kutcher. Stripe rust of wheat in Saskatchewan in 2016 and 2016 .................................................................................. 142
M.W. Harding, M. Kundu and G.C. Daniels. Wheat streak mosaic virus in Alberta in 2015 and 2016 ............ 144
J.G. Menzies, G.S. Brar, H.R. Kutcher, Z. Popovic, S. Deceuninck and J. Friesen. Cereal smut surveys 2016. .................................................................................................................................................... 146
A.G. Xue, Y. Chen and Y. Al-Rewashdy. Diseases of spring wheat whet in Central and Eastern Ontario in 2016. ................................................................................................................................................. 148
L. Tamburic-lincic and S.B. Rosa. 2016 Survey for stripe rust of winter wheat in Ontario .............................. 150
P. Bajracharya, M. Cott, L. Adam, A. Soliman, E. Bargen, R. Picard, N. Clouson, H. Derksen and
F. Daayf. Distribution of Goss’s wilt disease in corn crops in Manitoba in 2016 ............................................. 152
K.K. Jindal, L.M. Reid, A.U. Tenuta, T. Woldemarium, X. Zhu and G. Kotulak. Status of corn diseases in Ontario, 2016 crop season ............................................................................................................. 155
OILSEEDS, PULSES, FORAGES AND SPECIAL CROPS / OLÉAGINEUX, PROTÉAGINEUX, PLANTES FOURRAGÈRES ET CULTURES SPÉCIALES ............................................................................ 161
C. Armstrong-Cho, A. Brown and S. Banniza. Blossom blight in Saskatchwan caraway andcoriander in 2016 .............................................................................................................................................. 161
S.E. Strelkov, V.P. Manolii, M.W.Harding, S.F. Hwang, E. Manolii, K. Zuzak, D.C. Rennie, J. Feng, M. Raham, G.C. Daniels, D.A. Burke, T.B. Hill, K. Zhar and D. Feindel. Occurrence and spread ofclubroot on canola in Alberta in 2016. ............................................................................................................... 164
M.W. Harding, T.B. Hill, G.C. Daniels, D. Rennie, K. Zuzak, J. Feng, and J. McDonald. A survey for blackleg and sclerotinia stem rot on canola in Alberta in 2016.................................................................... 168
B. Ziesman, D. Bruce, S. Chant, D. Cubbon , I. Epp, S. FriesenJ. Frederick, K. Gray, S. Hertz,L. Hicks, M. Hladun, J. Ippolito, C. Jacob, C. Jurke, K. Kindrachuk, J. Kowalski , M.H. Borhan,N.J. Larkan, J. Loverin, M. Lustig, J. Monvoisin, B. Moon, V. Nameth, A. Noble, N. Philp, S. Roberts,C. Scott, S. Senko, D. Sletten, T. Sliva, D.T. Stephens, K. Stonehouse, B. Wagman, W. Ward, andJ. Zemanek. Survey of canola diseases in Saskatchewan in 2016 ................................................................. 174
D.L. McLaren, A. Kubinex, J. Graham, E. Bargen, A. Brackenreed, D. Brar, T. Buss, D. Chomokovski,A. Farooq, T. Henderson, L. Kaskiw, I. Kristjanson, D. Lange, M. McCracken, J. Cornelsen, R. Picard,M. Pradhan and M. Valentino. Survey of canola diseases in Manitoba in 2016. ............................................. 180

4
M.W. Harding, G.C. Daniels, D.A. Burke, C.A. Pugh and J. M. Nielson. White mould on dry bean in Alberta in 2016. ............................................................................................................................................. 185
Y. M. Kim, D.L. McLaren, R.L. Conner, W.C. Penner and T.J. Kerley. Diseases of field bean inManitoba in 2016. .............................................................................................................................................. 188
Y.M. Kim, D.L. McLaren, R.L. Conner, M. Moran, W.C. Penner and T.J. Kerley. Root diseases offield bean in western Ontario in 2016. .............................................................................................................. 191
L.F. Wu, K.F. Chang, H. Fu, I. Akter, N.Li, S.F. Hwang, G.D. Turnbull, S.E. Strelkov and D. Feindel.The occurrence of and microorganisms associated with root rot of field pea in Alberta in 2016. .................... 193
S. Chatterton, M.W. Harding, R. Bowness, C. Vucurevich, Q. Storozynsky, T. Dubitz, J. Nielsen,B. Olson, S. Phelps, B.D. Gossen, B. Ziesman, D.L. McLaren. Survey of root rot in Alberta,Saskatchewan and Manitoba field pea and lentil in 2016. ................................................................................ 196
D.L. McLaren, T.L. Henderson, Y.M. Kim, K.F. Chang, T.J. Kerley and M.J. Thompson. Field PeaDiseases in Manitoba in 2016 ........................................................................................................................... 200
K.Y. Rashid, B. Ziesman, C. Jacob, H.R. Kutcher, T. Islam and M.P. Pradham. Diseases of flax in Manitoba and Saskatchwean in 2016. .............................................................................................................. 203
D.T. Stephens, S. Chant, C. Jacob, M. Hladun, J. Ippolito, K. Kindrachuk, V. Nameth and B. Ziesman.2016 Survey of lentil diseases in Saskatchewan .............................................................................................. 206
R. Nyandoro, N. Li, K.F. Chang, S.F. Hwang, I. Akter, H.U. Ahmed, H. Fu, S.E. Strelkov,G.D. Turnbull and M.W. Harding. The occurrence of soybean root rot in Southern Alberta in 2016 .............. 210
H. Derksen, D. Lange, T. Buss, P. Bajracharya, K. Podolsky, I. Kristjanson, T. Cummer, M. Lewick,D. Brar, E. Mendoza, A. Farooq, R. Picard, J. Gardiner and S.Kawthekar. Survey of soybean diseasein Manitoba in 2016 ........................................................................................................................................... 214
Y.M. Kim , D.L. McLaren, R.L. Conner, K.F. Chang, S.F. Hwang, T.L. Henderson, W.C. Pennerand T.J. Kerley. Soybean root rot and phytophthora rot in Manitoba in 2015 ................................................. 218
Y.M. Kim , D.L. McLaren, R.L. Conner, K.F. Chang, S.F. Hwang, T.L. Henderson, W.C. Penner,T.J. Kerley, D. Lange, L. Grenkow and S. Kawthekar. Soybean root rot and phytophthora rot inManitoba in 2016. ............................................................................................................................................. 221
K.Y. Rashid, T. Turner and M. Pradhan. Diseases of sunflower in Manitoba in 2016..................................... 224
VEGETABLES / LÉGUMES ............................................................................................................................. 227
E.C. Betz and Z.K. Punja. 2016 Survey of fungal diseases of wasabi in British Columbia greenhouses ........ 227
A. Hajihassani and M. Tenuta. The occurrence of stem and bulb nematode on garlic in SouthernManitoba, Canada in 2015 ................................................................................................................................ 229
2017 AUTHOR INDEX (ALPHABETICAL) / INDEX D’AUTEURS (ALPHABÉTIQUE) – 2017 ...................... 233
LIST OF FIGURES / LISTE DE FIGURES ....................................................................................................... 235

5
Diagnostic Laboratories /Laboratoires Diagnostiques
CROP / CULTURE: Commercial Crops – Plant Health Laboratory Report LOCATION / RĖGION: British Columbia
NAME AND AGENCY:
V.Joshi, P.Ag. (Plant Diagnostic Pathologist) 1 and M. Jeffries, P.Ag. (Plant Health Coordinator)1Corresponding author; Vippen Joshi, Plant Health Laboratory
Plant and Animal Health Branch, B.C. Ministry of Agriculture
Abbotsford Agriculture Centre, 1767 Angus Campbell Road, Abbotsford BC V3G 2M3
Telephone: (604) 556-3128; Facsimile: (604) 556-3154; Email: [email protected]
Web page: http://www2.gov.bc.ca/gov/content/industry/agriculture-seafood/animals-and-crops/plant-health/plant-health-laboratory
TITLE: DISEASES/SYMPTOMS DIAGNOSED ON COMMERCIAL CROPSAMPLES SUBMITTED TO THE
BRITISH COLUMBIA MINISTRY OF AGRICULTURE (BCAGRI) PLANT HEALTH LABORATORY IN 2016
ABSTRACT: The B.C. Ministry of Agriculture Plant Health Laboratory provides diagnoses of diseases caused by fungi, bacteria, viruses, plant parasitic nematodes and insect pests of agricultural crops grown in British Columbia. Between January 1 and November 30, 2016, the laboratory received 915 samples of Christmas trees, field crops, greenhouse vegetable and floriculture crops, forest seedling, herbaceous and woody ornamentals, small fruit, tree fruit, nuts and specialty crops for diagnosis. No significantly noticeable or unusually high level of any disease was detected in the samples.
METHODS: The B.C. Ministry of Agriculture Plant Health Laboratory provides diagnoses for diseases caused
by fungi, bacteria, viruses, plant parasitic nematodes, and insect pests of agricultural crops grown in British
Columbia. The following data reflect samples submitted to the laboratory by ministry staff, growers, agri-
businesses, municipalities and master gardeners. Diagnoses were accomplished by visual and microscopic
examination,culturing onto artificial media, biochemical identification of bacteria using BIOLOG®, serological
testing of viruses, fungi and bacteria with micro-well and membrane based enzyme linked immuno sorbent
assay (ELISA). Molecular techniques (polymerase chain reactions (PCR – conventional and/or real time) were
used for some species-specific diagnoses. Electron microscopic examination was performed on samples with
unknown virus-like symptoms. Some specimens were referred to other laboratories for identification or
confirmation of the diagnosis.
RESULTS AND COMMENTS: Overall, 2016 was an average year for B.C. in terms of rainfall and sunshine. The laboratory received a total of 915 samples between January 1 and November 30, 2016. Forest nursery seedling and field vegetable samples especially garlic submissions (seed growers) were significantly higher than previous years. Summaries of diseases and their causal agents diagnosed on crop samples submitted to the laboratory are presented in the following tables (1 to13) organized under crop category. Under each table, the total number of samples submitted includes abiotic disorders such as nutritional stress, pH imbalance, water stress, drought stress, physiological response to growing conditions, genetic abnormalities, environmental and chemical stresses including herbicide damage, fruit abortion due to lack of pollination, insects and insect-related injury and damage where no conclusive causal factor was identified.

6
Table 1. Diseases/disorders detected in Christmas tree samples submitted to the BCAGRI Plant Health Laboratory between January 1 and November 30, 2016.
CROP DISEASE / DISORDER CAUSAL / ASSOCIATED ORGANISM NUMBER
OF SAMPLES
Abies spp. Needle blight
Twig canker
Rhizosphaera kalkhoffii
Phomopsis sp.
2
1
Total number of samples = 3
Table 2. Diseases/disorders detected in field crop samples submitted to the BCAGRI Plant Health Laboratory between January 1 and November 30, 2016.
CROP DISEASE / DISORDER CAUSAL / ASSOCIATED ORGANISM NUMBER
OF SAMPLES
Forage crop Nematode damage Pratylenchus sp. and Meloidogyne sp. 1
Soybean Seed rot Alternaria sp. 1
Total number of samples = 4

7
Table 3. Diseases/disorders detected in greenhouse floriculture samples submitted to the BCAGRI Plant Health Laboratory between January 1 and November 30, 2016.
CROP DISEASE / DISORDER CAUSAL / ASSOCIATED ORGANISM NUMBER
OF SAMPLES
Carex sp. Anthracnose Colletotrichum sp. 1
Celosia Fusarium stem rot
Root rot
Stem rot
Fusarium sp.
Pythium sp.
Phoma sp.
1
1
1
Chamaerops humilis
Anthracnose Colletotrichum gloeosporioides 1
Chrysanthemum Fusarium wilt Fusarium oxysporum f.sp. chrysanthemi 1
Eustoma grandiflorum
Fusarium crown/stem rot
Pythium root rot
Fusarium avenaceum
Phythium sp.
1
1
Hosta Crown/stem rot Botrytis cinerea 1
Hydrangea Leaf spot
Leaf spot and stem rot
Cladosporium sp.
Ascochyta hyndrangea
1
1
Lavandula sp. Botrytis blight Botrytis cinerea 2
Lobelia Leaf spot Mycovellosiella sp. 1
Narcissus Nematode damage Ditylenchus sp. 1
Petunia Powdery mildew Podosphaera xanthii 1
Sedum Leaf spot
Powdery mildew
Cladosporium sp.
Phyllosticta sp.
Erysiphe sp.
3
1
1
Senecio cineraria Phytophthora root rot
Thielaviopsis root rot
Phytophthora sp.
Thielaviopsis basicola
1
1
Total number of samples submitted to the lab = 37

8
Table 4. Diseases/disorders detected in forest nursery samples submitted to the BCAGRI Plant Health Laboratory during between January 1 and November 30, 2016.
CROP DISEASE / DISORDER CAUSAL / ASSOCIATED ORGANISM NUMBER
OF SAMPLES
Abies spp. Fusarium root rot Fusarium sp. 2
Larix spp. Botrytis blight
Cylindrocarpon root rot
Fusarium root rot
Pythium root rot
Botrytis cinerea
Cylindrocarpon sp.
Fusarium sp.
Pythium sp.
2
1
1
1
Picea spp. Fusarium root rot
Rhizoctonia blight
Fusarium sp.
Rhizoctonia solani
2
1
Picea glauca Cylindrocarpon root rot
Fusarium root rot
Phoma blight
Rhizoctonia root rot
Root colonization
Thielaviopsis root rot
Cylindrocarpon sp.
Fusarium sp.
Fusarium proliferatum
Phoma sp.
Rhizoctonia sp.
Basidiomycete
Thielaviopsis basicola
2
4
1
1
1
3
1
Pinus spp. Cylindrocarpon root rot Fusarium root rot
Pythium root rot
Thielaviopsis root rot
Cylindrocarpon sp.
Fusarium sp.
Pythium sp.
Thielaviopsis basicola
6
2
1
2
Pinus contorta Botrytis blight
Cylindrocarpon root rot
Foliar blight
Needle blight
Phoma blight
Pythium root rot
Sirococcus blight
Botrytis cinerea
Cylindrocarpon sp.
Diplodia pinea
Cytospora sp.
Sirococcus sp. and Diplodia sp.
Phoma sp.
Pythium sp.
Sirococcus strobilinus
1
1
4
1
1
2
2
2
Pinus monticola Botrytis blight
Cylindrocarpon root rot
Foliar blight
Fusarium root rot
Needle blight
Phoma blight
Phomopsis blight
Pythium root rot
Root rot
Root infection
Thielaviopsis root rot
Botrytis cinerea
Cylindrocarpon sp.
Alternaria sp.
Fusarium sp.
Fusarium proliferatum
Lophodermium pinastri
Phoma sp.
Phomopsis sp.
Pythium sp.
Cylindrocarpon sp. and Fusarium sp.
Basidiomycete
Thielaviopsis basicola
2
23
1
13
7
2
5
2
2
3
1
1

9
Table 4 (cont.)
CROP DISEASE / DISORDER CAUSAL / ASSOCIATED ORGANISM NUMBER
OF SAMPLES
Pinus resinosa Cylindrocarpon root rot
Foliar blight
Fusarium root rot
Phoma blight
Cylindrocarpon sp.
Diplodia pinea
Fusarium sp.
Phoma sp.
3
1
3
1
Pseudotsuga menziesii
Cylindrocarpon root rot
Fusarium root rot
Phoma blight
Pythium root rot
Cylindrocarpon sp.
Fusarium proliferatum
Fusarium sp.
Phoma eupyrena
Phoma sp.
Pythium sp.
5
8
3
1
2
1
Pseudotsuga menziesii var. glauca
Cylindrocarpon root rot
Fusarium root rot
Thielaviopsis root rot
Cylindrocarpon sp.
Fusarium proliferatum
Thielaviopsis basicola
1
5
1
Pseudotsuga menziesii var. menziesii
Foliar blight
Cylindrocarpon root rot
Fusarium root rot
Needle blight
Root rot
Phoma sp.
Phoma sp. and Glomerella sp.
Cylindrocarpon sp.
Fusarium proliferatum
Fusarium sp.
Phomopsis sp.
Cylindrocarpon sp. and Fusarium sp.
Pythium sp., Cylindrocarpon sp. and Fusarium sp.
5
1
5
3
8
1
3
1
Tsuga mertensiana Botrytis blight
Sirococcus blight
Botrytis cinerea
Sirococcus strobilinus
2
1
Total number of samples submitted to the lab = 111
Table 5. Diseases/disorders detected in greenhouse vegetable samples submitted to the BCAGRI Plant Health Laboratory between January 1 and November 30, 2016.
CROP DISEASE / DISORDER CAUSAL / ASSOCIATED ORGANISM
NUMBER OF
SAMPLES
Cucumber Fusarium stem/root rot
Pythium root rot
Fusarium oxysporum f.sp. radicis-cucumerinum
Pythium irregulare
1
1
Pepper Fusarium wilt
Pythium root rot
Fusarium oxysporum
Pythium sp.
1
1
Total number of samples submitted to the lab = 5

10
Table 6. Diseases/disorders detected in herbaceous perennial samples submitted to the BCAGRI Plant Health Laboratory between January 1 and November 30, 2016.
CROP DISEASE / DISORDER CAUSAL / ASSOCIATED ORGANISM
NUMBER OF
SAMPLES
Buxus spp. Boxwood blight
Volutella blight
Cylindrocladium pseudonaviculatum
Volutella buxi
2
1
Dahlia Stunted plant Cucumber mosaic virus
Tobacco mosaic virus
1
1
Hydrangea Leaf spot
Stem canker
Phyllosticta sp.
Phoma / Ascochyta sp.
1
1
Paeonia spp. Bacterial leaf spot
Leaf blotch
Leaf spot
Root rot
Pseudomonas syringae pv. Syringae
Cladosporium paeoniae
Hainesia lythri
Phyllosticta sp.
Cylindrocarpon sp.
1
2
1
1
1
Ranunculus Bacterial blight
Ramularia leaf spot
Pseudomonas syringae pv. Syringae
Ramularia didyma
1
1
Sedum Leaf spot
Powdery mildew
Phyllosticta sp.
Erysiphe sedi
1
1
Yucca dismetiana Anthracnose
Leaf spot
Stem rot
Colletotrichum circinans
Cercospora sp.
Fusarium solani
1
1
1
Total number of samples submitted to the lab = 22
Table 7. Diseases/disorders detected in nut crop samples submitted to the BCAGRI Plant Health Laboratory between January 1 and November 30, 2016.
CROP DISEASE / DISORDER CAUSAL / ASSOCIATED ORGANISM
NUMBER OF
SAMPLES
Hazelnut Nectria Canker Nectria galligena 1
Walnut Armillaria root rot Armillaria nabsnona 1
Total number of samples submitted to the lab = 5

11
Table 8. Diseases/disorders detected in small fruit (berry) crop samples submitted to the BCAGRI Plant Health Laboratory between January 1 and November 30, 2016.
CROP DISEASE / DISORDER CAUSAL / ASSOCIATED ORGANISM
NUMBER OF
SAMPLES
Blackberry Anthracnose
Botrytis fruit rot
Cane blight
Nematode damage
Root rot
Spur blight
Uneven fruit ripening
Elsinoe veneta
Botrytis cinerea
Leptosphaeria coniothyrium
Pratylenchus sp.
Phytophthora rubi
Didymella applanata
Arabis mosaic virus (and mites)
Tomato spotted wilt virus (and mites)
2
1
1
1
1
1
2
1
Blueberry Armillaria root rot
Bacterial blight
Blueberry Scorch Virus
Blueberry Shock Virus
Botrytis blight
Coniothyrium canker
Fruit rot
Leaf spot
Nematode damage
Phomopsis canker
Phytophthora root rot
Armillaria sp.
Pseudomonas syringae pv. syringae
Blueberry scorch virus
Blueberry shock virus
Botrytis cinerea
Coniothyrium sp.
Botrytis cinerea
Alternaria sp.
Gloeosporium sp., Alternaria sp., and Diaporthe sp.
Xiphinema sp.
Phomopsis sp.
Phytophthora sp.
3
5
8
4
4
1
1
2
1
1
10
22
Blueberry (Brazelberry)
Bacterial blight
Rust
Pseudomonas syringae
Thekopsora minima
1
1
Cranberry Bitter rot
Blotch rot
Coniothyrium canker
Fruit rot
Leaf and fruit scarring
Leaf scarring
Leaf spot
Runner Rot
Uprightdieback
Glomerella cingulate
Physalospora vaccinii
Coniothyrium sp.
Coleophoma empetri
Blueberry shock virus
Blueberry scorch virus
Allantophomopsis cytisporea
Allantophomopsis sp.
Coleophoma sp.
Discosia sp. and Phyllosticta sp.
Discosia sp., Phyllosticta sp. and Physalspora sp.
Glomerella cingulata
Godronia sp., Discosia sp. and Botrytosphaeria sp.
Phyllosticta sp.
Physalospora sp.
Cytospora sp.
Diaporthe / Phomopsis sp.
Godronia sp.
1
1
1
2
1
1
1
3
1
1
1
1
1
2
1
1
3
1
12
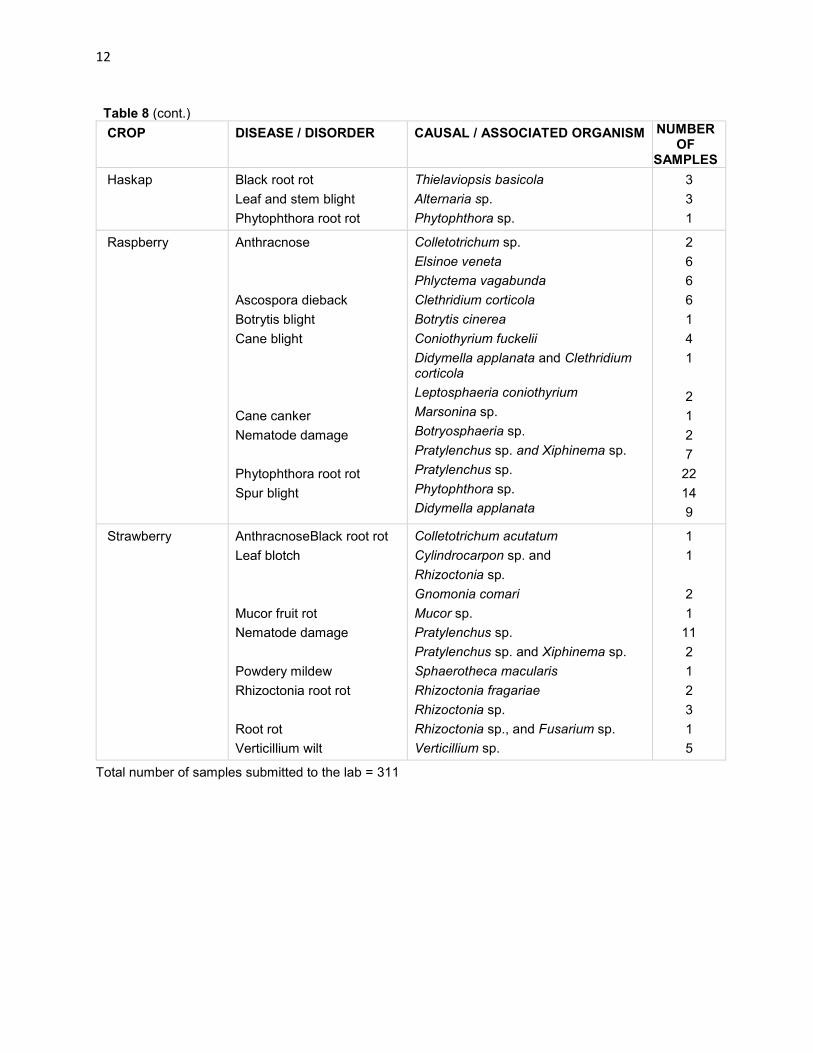
Table 8 (cont.)
CROP DISEASE / DISORDER CAUSAL / ASSOCIATED ORGANISM NUMBER OF
SAMPLES
Haskap Black root rot
Leaf and stem blight
Phytophthora root rot
Thielaviopsis basicola
Alternaria sp.
Phytophthora sp.
3
3
1
Raspberry Anthracnose
Ascospora dieback
Botrytis blight
Cane blight
Cane canker
Nematode damage
Phytophthora root rot
Spur blight
Colletotrichum sp.
Elsinoe veneta
Phlyctema vagabunda
Clethridium corticola
Botrytis cinerea
Coniothyrium fuckelii
Didymella applanata and Clethridium corticola
Leptosphaeria coniothyrium
Marsonina sp.
Botryosphaeria sp.
Pratylenchus sp. and Xiphinema sp.
Pratylenchus sp.
Phytophthora sp.
Didymella applanata
2
6
6
6
1
4
1
2
1
2
7
22
14
9
Strawberry AnthracnoseBlack root rot
Leaf blotch
Mucor fruit rot
Nematode damage
Powdery mildew
Rhizoctonia root rot
Root rot
Verticillium wilt
Colletotrichum acutatum
Cylindrocarpon sp. and
Rhizoctonia sp.
Gnomonia comari
Mucor sp.
Pratylenchus sp.
Pratylenchus sp. and Xiphinema sp.
Sphaerotheca macularis
Rhizoctonia fragariae
Rhizoctonia sp.
Rhizoctonia sp., and Fusarium sp.
Verticillium sp.
1
1
2
1
11
2
1
2
3
1
5
Total number of samples submitted to the lab = 311

13
Table 9. Diseases/disorders detected in specialty crop samples submitted to the BCAGRI Plant Health Laboratory between January 1 and November 30, 2016.
CROP DISEASE / DISORDER CAUSAL / ASSOCIATED ORGANISM
NUMBER OF
SAMPLES
Basil Downy mildew Peronospora belbahrii 1
Ginseng Alternaria blight
Cylindrocarpon root rot
Fusarium root rot
Phytophthora foliar blight
Alternaria panax
Cylindrocarpon destructans
Fusarium sp.
Phytophthora sp.
1
4
4
1
Hop lternaria cone disorder
Apple mosaic virus
Crown and root rot
Downy mildew
Fusarium canker
Leaf spot
Nematode damage
Powdery mildew
Rhizoctonia root rot
Root damage
Sooty mould
Sooty mould / cone disorder
Stem canker
Alternaria alternate
Apple mosaic virus
Rhizoctonia solani and
Cylindrocarpon sp.
Pseudoperonospora humuli
Fusarium sambucinum
Alternaria sp.
Alternaria sp. and Cladoposrium sp.
Botrytis cinerea
Phoma / Ascochyta sp.
Pseudomonas syringae pv. syringae
Pratylenchus sp.
Podosphaera macularis
Rhizoctonia solani
Mesocriconema sp.
Pratylenchus sp.
Cladosporium sp.
Cladosporium sp. and Alternaria sp.
Rhizoctonia solani
2
5
1
2
1
1
1
2
2
1
1
2
1
1
2
2
1
1
Wasabi Leaf blight Botrytis cinerea 1
Total number of samples submitted to the lab = 24

14
Table 10. Diseases/disorders detected in tree fruit and grape samples submitted to the BCAGRI Plant Health Laboratory between January 1 and November 30, 2016.
CROP DISEASE / DISORDER CAUSAL / ASSOCIATED ORGANISM
NUMBER OF
SAMPLES
Apple Bacterial canker
Cytospora canker
Phoma leaf spot
Stem canker
Pseudomonas syringae pv. syringae
Cytospora sp.
Phoma pomorum
Diplodia seriata
1
1
1
1
Crabapple Nematode damage Pratylenchus sp. 1
Fig Chlorotic flecking / mosaic Fig mosaic virus 3
Grape Botrytis blight
Fruit rot
Leaf spot
Botrytis cinerea
Peniciliium sp. and Botrytis sp.
Phyllosticta sp.
1
1
1
Pear Bacterial canker
Cytospora canker
Fire blight
Nematode damage
Sprinkler rot
Pseudomonas syringae pv. syringae Cytospora sp.
Erwinia amylovora
Pratylenchus sp.
Phytophthora cactorum
1
1
1
1
1
Pear (Asian) Anthracnose
Bacterial canker
Cytospora canker
Nematode damage
Phomopsis canker
Stem canker
Cryptosporiopsis sp.
Pseudomonas syringae
Cytospora sp.
Pratylenchus sp.
Phomopsis sp.
Coniothyrium sp.
1
1
1
1
2
1
Total number of samples submitted to the lab = 33
Table 11. Diseases/disorders detected in turf grass, sports field and lawn samples submitted to the BCAGRI Plant Health Laboratory between January 1 and November 30, 2016.
CROP DISEASE / DISORDER ORGANISM CAUSAL / ASSOCIATED
NUMBER OF
SAMPLES
Sports field Ascochyta blight
Leptosphaerulina blight
Localized dry spot
Ascochyta sp.
Leptosphaerulina sp.
Basidiomycete
1
1
1
Turf
(sod or green)
Localized dry spot
Nematode damage
Yellow patch
Basidiomycete
Rhizoctonia cerealis
Meloidogyne sp.
Helicotylenchus sp.
Meloidogyne sp. and
Helicotylenchus sp.
Meloidogyne sp. and Tylenchorhynchus sp.
1
1
1
2
1
3
Total number of samples submitted to the lab = 8

15
Table 12. Diseases/disorders detected in field vegetable samples submitted to the BCAGRI Plant Health Laboratory between January 1 and November 30, 2016.
CROP DISEASE/DISORDER CAUSAL / ASSOCIATED ORGANISM
NUMBER OF
SAMPLES
Bean Alternaria leaf and pod spot Bacterial brown spot
Gray mould
Alternaria sp.
Pseudomonas syringae pv.syringae
Botrytis cinerea
1
1
1
Beet Downy mildewFusarium root rot
Rhizoctonia root rot
Storage rot
Peronospora farinosa f. sp. betae
Fusarium sp.
Rhizoctonia solani
Alternaria sp.
Botrytis cinerea
Fusarium solani
Fusarium sp.
Penicillium sp.
1
1
1
1
1
2
2
1
Brussel Sprout Alternaria spot Alternaria sp. 1
Cabbage Damping off
White mould
Pythium sp.
Sclerotinia sclerotiorum
1
2
Carrot Pythium root rot Pythium sp. 1
Corn Fusarium root rot
Rhizoctonia crown rot
Fusarium proliferatum
Rhizoctonia solani
1
1
Cucumber Vascular wilt Fusarium oxysporum 1
Garlic Blue mould
Botrytis neck rot
Bulb and stem rot
Bulb rot
Embellisia skin blotch
Fusarium basal rot
Fusarium bulb rot
Leaf streak and/or chlorosis
Leaf streaking
Mushy rot
Penicillium sp.
Botrytis allii
Ditylenchus sp.
Botrytis porri
Fusarium proliferatum
Fusarium sp.
Fusarium sp., Penicillium sp. and Mucor sp.
Peniciliium sp., Rhizopus sp. and Fusarium sp..
Penicillium sp. and Rhizopus sp.
Embellisia allii
Fusarium culmorum
Fusarium proliferatum
Fusarium sp.
Potyvirus
Leek yellow stripe virus
Rhizopus sp.
11
2
1
6
18
3
1
1
1
65
1
8
1
51
3
1

16
Table 12 (cont.)
CROP DISEASE / DISORDER CAUSAL / ASSOCIATED ORGANISM NUMBER OF
SAMPLES
Garlic (cont.) Nematode damage
Root rot
Rust
Waxy breakdown
White rot
Ditylenchus dipsaci and
Pratylenchus sp.
Ditylenchus dipsaci and Aphelenchoides sp.
Pratylenchus sp.
Rhizoctonia sp.
Puccinia allii
Physiological
Sclerotium cepivorum
1
1
3
1
3
1
3
Leek Damping off Pythium sp. 1
Lettuce Pythium wilt Pythium sp. 1
Okra Pod rot Botrytis cinerea 1
Pepper Root rot Oomycete 1
Wire stem Rhizoctonia solani 1
Potato Black dot Colletotrichum coccodes 5
Black leg Pectobacterium atrosepticum 1
Pectobacterium carotovorum ssp. carotovorum
1
Black scurf Rhizoctonia solani 6
Common scab Streptomyces scabies 2
Fusarium dry rot Fusarium solani 1
Powdery scab Spongospora subterranea 2
Pythium leak Pythium ultimum 1
Silver scurf Helminthosporium solani 5
Rhubarb Anthracnose
Crown and root rot
Downy mildew
Leaf/stalk spot
Nematode damage
Ramularia leaf blight
Root damage
Colletotrichum sp.
Cylindrocarpon sp.
Peronospora sp.
Ascochyta rhei
Pratylenchus sp. and Xiphinema sp.
Ramularia rhei
Pratylenchus sp.
1
2
1
4
1
3
2
Squash Nematode damage Pratylenchus sp. 1
Squash -spaghetti Bacterial spot
Fusarium fruit rot
Scab
Pseudomonas syringae pv. syringae
Fusarium sp.
Cladosporium cucumerinum
1
1
1
Squash -butternut Fusarium rot
Scab
Fusarium spp.
Cladosporium cucumerinum
1
1
Tomato Leaf deformation/mosaic Tobacco mosaic virus
Cucumber mosaic virus
1
1
Zucchini Angular leaf spot Pseudomonas syringae pv. lachrymans 1
Total number of samples submitted to the lab = 167

17
Table 13. Diseases/disorders detected in woody ornamentalsamples submitted to the BCAGRI Plant Health Laboratory between January 1 and November 30, 2016.
CROP DISEASE / DISORDER CAUSAL / ASSOCIATED ORGANISM NO. OF SAMPLES
Abies balsamea Needle blight Rhizosphaera kalkhoffii 1
Abies concolor Needle blight Rhizosphaera kalkhoffii 1
Acer sp. Leaf spot
Twig canker
Alternaria alternate
Diplodina acerina
1
1
Acer circinatum Phomopsis canker Phomopsis sp. 1
Acer palmatum Anthracnose
Armillaria root rot
Aureobasidium apocryptom and Discula sp.
Armillaria nabsnona
1
1
Amelanchier Fire blight Erwinia amylovora 1
Arbutus menziesii Phytophthora crown rot Phytophthora cactorum 1
Betula papyrifera Twig canker
Twig die-back
Cytospora sp.
Cytosporina (Eutypa sp.)
Gelatinosporium betulinum
Melanconium sp.
Phragmotrichum sp.
Pleomassaria sp.
Prosthemium neobetulinum
Sirococcus strobilinus
2
4
2
5
2
1
3
3
Chamaecyparis Phytophthora root rot Phytophthora sp. 1
Choisya ternata Armillaria root rot Armillaria gallica 1
Clematis Root rot
Stem canker
Phytophthora sp.
Ascochyta clematidina
1
1
Cornus sp. Powdery mildew Microsphaera sp. 1
Corylus spp. Fungus on dead stem
Phomopsis canker
Diapleela sp.
Diaporthe sp.
1
1
Cotoneaster Crown and root rot
Fire blight
Phytophthora sp.
Erwinia amylovora
1
1
Crataegus sp. Fire blight Erwinia amylovora 1
Cypress Foliar blight Sclerophoma sp. 1
Halesia sp. Twig die-back Diaporthe sp. 1
Ilex sp. Dieback
Stem die back
Diaporthe sp.
Leptosphaeria sp.
Botryosphaeria sp.
1
1
1
Juniperus sp. Anthracnose
Phytophthora root rot
Stem rot
Colletotrichum sp.
Phytophthora sp.
Fusarium sp.
1
1
1

18
Table 13 (cont.)
CROP DISEASE / DISORDER CAUSAL / ASSOCIATED ORGANISM NO. OF SAMPLES
Laurus nobilis Leaf spot Cladosporium sp. and Alternaria sp. 1
Lonicera sp. Honeysuckle leaf blight
Root rot
Seedling blight
Insolibasidium deformans
Pythium sp.
Rhizoctonia solani
Botrytis cinerea
1
1
1
1
Magnolia Powdery mildew Microsphaera penicillata 1
Malus sp. Bacterial blight
Leaf spot
Twig blight/dieback
Pseudomonas syringae pv. syringae
Alternaria sp.
Phomopsis sp.
1
1
2
Oenothera Foliar blight Botrytis cinerea 1
Philadelphus sp. Bacterial blight Pseudomonas syringae 1
Photinia Leaf spot Pestalotia sp. 1
Picea sp. Phomopsis canker Phomopsis sp. 1
Picea omorika Phomopsis canker Phomopsis sp. 1
Picea pungens Cylindrocarpon root rot Cylindrocarpon sp. 1
Platanus acerifolia
Anthracnose Apiognomonia sp. 1
Prunus sp. Anthracnose Cytospora canker
Phomopsis canker
Powdery mildew
Root rot
Colletotrichum gloeosporioides Cytospora sp.
Phomopsis sp.
Podosphaera tridactyla
Thielaviopsis basicola
1
1
1
1
1
Prunus serrulata Crown gall Agrobacterium tumefaciens 1
Prunus virginiana Branch canker Coniothyrium sp. 1
Pseudotsuga menziesii
Laminated root rot
Needle blight
Phellinus weirii
Rhizosphaera kalkhoffii
2
2
Quercus sp. Anthracnose Discula umbrinella 1
Rhododendron Botryosphaeria dieback Leaf and stem blight
Phomopsis dieback
Botryosphaeria dothidea
Pestalotia sp.
Diaporthe / Phomopsis sp.
1
1
2
Ribes sanguineum
Phytophthora root rot PhytophthoraI sp. 1
Ribes uva-crispa Anthracnose Drepanopeziza ribis 1
Rosa sp. Black spot
Powdery mildew
Diplocarpon rosae
Podosphaera pannosa
1
1

19
Table 13 (cont.)
CROP DISEASE / DISORDER CAUSAL / ASSOCIATED ORGANISM NO. OF SAMPLES
Sorbus sp. Leucostoma canker Valsa leucostoma 1
Syringa sp. Bacterial blight
Leaf mottling
Pseudomonas syringae pv. syringae
Lilac leaf chlorosis virus
1
1
Thuja spp. Foliar blight
Phomopsis blight
Phytophthora root rot
Kabatina thujae
Pestalotiopsis sp.
Diaporthe sp.
Phytophthora sp.
1
2
1
2
Thuja occidentalis Phomopsis blight
Stem die back
Phomopsis juniperovora
Leptosphaeria coniothyrium
1
1
Tsuga heterophyla
Annosus root rot
Stringy butt rot
White trunk rot
White laminated root rot
Heterobasidium occidentale / annosum Perenniporia subacida
Phellinus hartigii
Ceriporiopsis rivulosa
4
1
1
1
Total number of samples submitted to the lab = 129

20
CROPS / CULTURE: Commercial Ornamental Nursery and Landscape Crops LOCATION / RĖGION: British Columbia
NAME AND AGENCY: J. ElmhirstElmhirst Diagnostics & Research, 5727 Riverside Street, Abbotsford BC V4X1T6Telephone: 604-820-4075; cell: 604-832-9495; Email: [email protected]
TITLE: DISEASES DIAGNOSED ON ORNAMENTAL NURSERY AND LANDSCAPE CROPS IN BRITISH COLUMBIA, 2016
ABSTRACT: Diseases of commercial nursery and landscape ornamental crops and causal agents identified by Elmhirst Diagnostics & Research in south coastal British Columbia in 2016 are listed.
METHODS: Elmhirst Diagnostics & Research (EDR) provides diagnosis of diseases of commercial horticultural crops in British Columbia caused by fungi, bacteria, viruses, plant parasitic nematodes, arthropod and mite pests and abiotic factors. Laboratory diagnostic services are provided in conjunction with on- site diagnostic consultations. Diagnosis is performed primarily by association of known symptoms with the presence of a pathogen known to cause these symptoms, identified by microscopic examination. If the diagnosis is uncertain or further identification or confirmation is needed, fungal and bacterial pathogens are isolated in pure culture for further examination of morphological characteristics, or plant tissue or cultured specimens are sent to other laboratories for identification by ELISA, PCR or DNA sequencing.
RESULTS AND COMMENTS: A summary of diseases and causal agents diagnosed on ornamental crops is presented in Table 1. Problems caused by abiotic factors, i.e., nutrient or pH imbalance, water stress, physiological response to growing conditions, genetic abnormalities and environmental and chemical stresses including herbicide damage, are not included. Powdery mildew of Monarda didyma (bee balm) was 100% homologous to Erysiphe biocellatus (Golovinomyces biocellatus) by DNA sequencing and BLAST comparison in GenBank. E. biocellatus attacks other plants in the mint family, plus Salvia and Oreganum. DNA extracted from the Monarda mildew amplified strongly with PCR primers for E. cichoracearum, but E. biocellatus is now considered a separate species.
Table 1. Diseases diagnosed in 2016 on ornamental nursery and landscape crops in British Columbia by Elmhirst Diagnostics & Research.
CROP SYMPTOM/DISEASE CAUSAL AGENT
NUMBER OF
SAMPLES
Acer x freemanii Bacterial canker Pseudomonas syringae 1
Arctostaphylos uva-ursi Bacterial leaf spot Pseudomonas syringae 1
Azalea x ‘Autumn Princess’, ‘Autumn Chiffon’ Buxus sempervirens ‘Suffruticosa’
Root rot / dieback
Volutella blight
Phytophthora sp.
Pseudonectria buxi (Volutella buxi)
1
1
Buxus sempervirens ‘Suffruticosa’
Fusarium blight Cyanonectria buxi (Fusarium buxicola = Fusarium lateritium var. buxi)
1
Buxus microphylla koreana x sempervirens
‘Green Gem’, ‘Green Mountain’,’Green Velvet’, ‘Variegata’, ‘Winter Gem’
Fusarium blight Cyanonectria buxi (Fusarium buxicola = Fusarium lateritium var. buxi
5

21
Table 1 (cont.)
Buxus microphylla koreana x sempervirens
‘Green Gem’, ‘Green Mountain’,’Green Velvet’, ‘Variegata’, ‘Winter Gem’
Volutella blight Pseudonectria buxi
(Volutella buxi)
5
Cornus alba ‘Elegantissima’
Anthracnose Discula destructiva 1
Cornus stolonifera
‘Arctic Fire’
Stem dieback Melanconium sp. 1
Dianthus caryophyllus Fusarium wilt Fusarium oxysporum 1
Hydrangea arborescens ‘Invincibelle Spirit’
Crown and root rot Phytophthora sp. 1
Hydrangea paniculata ‘Bobo’
Stem canker Ascochyta hydrangeae 2
Juniperus horizontalis
‘Bar Harbour’
Root rot / dieback Phytophthora sp. 1
Juniperus squamata
‘Blue Star’
Root rot / dieback Phytophthora sp. 1
Monarda didyma
‘Fireball’, ‘Snow White’
Powdery mildew Golovinomyces biocellatus (Erysiphe biocellatus)*
2
Picea pungens
‘Iseli Fastigiate’
Sirococcus blight Sirococcus conigenus 1
Pinus mugo Root rot / dieback Phytophthora sp. 1
Rhododendron x ‘Wine and Roses’
Root rot / dieback Phytophthora sp. 1
Rosa x ‘Champlain’ Powdery mildew Podosphaera pannosa 1
Rosa x ‘Morden Blush’ Black spot Diplocarpon rosae 1
Rosa x ‘Yellow Submarine’ Cercospora leaf spot Cercospora rosicola 1
Sarcoccoca hookeriana var. humilis
‘Fragrant Mountain’, ‘Fragrant Valley’
Root and crown rot / dieback
Rhizoctonia solani / Phytophthora sp.
2
Sarcoccoca hookeriana var. humilis
Volutella blight and stem canker
Pseudonectria buxi
(Volutella buxi)
1
Sedum x ‘Thunderhead’ Powdery mildew Erysiphe sedi 1
Syringa x ‘Tinkerbelle’ Root and crown rot / dieback
Phytophthora sp. 1
Syringa x hyacinthflora Bacterial leaf spot Pseudomonas syringae 1
Thuja occidentalis
‘Emerald Green’
Root rot / dieback Pythium sp. / Phytophthora sp. 1
Thuja occidentalis
‘Tom Thumb’
Root rot / dieback Pythium sp. / Phytophthora sp. 1
Foliar nematodes Aphelenchoides sp. 1
Total 40
*Confirmed by DNA sequencing and BLAST comparison to GenBank sequences.
22
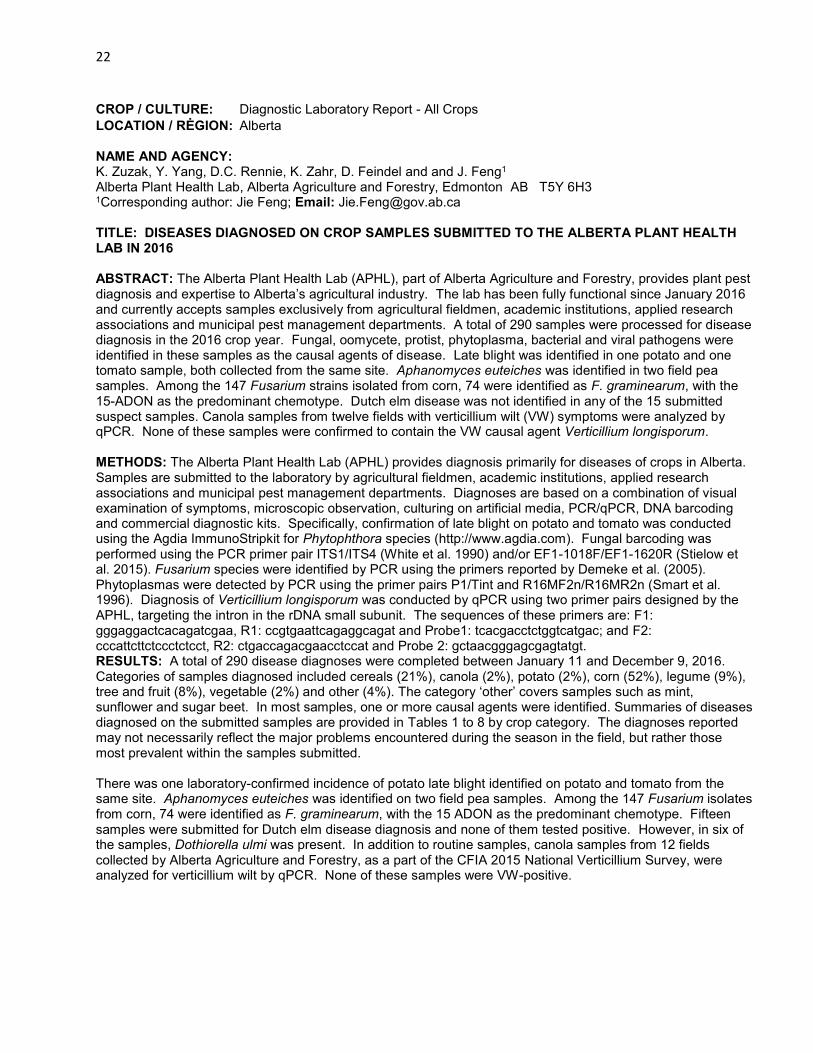
CROP / CULTURE: Diagnostic Laboratory Report - All Crops
LOCATION / RĖGION: Alberta
NAME AND AGENCY: K. Zuzak, Y. Yang, D.C. Rennie, K. Zahr, D. Feindel and and J. Feng1
Alberta Plant Health Lab, Alberta Agriculture and Forestry, Edmonton AB T5Y 6H31Corresponding author: Jie Feng; Email: [email protected]
TITLE: DISEASES DIAGNOSED ON CROP SAMPLES SUBMITTED TO THE ALBERTA PLANT HEALTH LAB IN 2016
ABSTRACT: The Alberta Plant Health Lab (APHL), part of Alberta Agriculture and Forestry, provides plant pest diagnosis and expertise to Alberta’s agricultural industry. The lab has been fully functional since January 2016 and currently accepts samples exclusively from agricultural fieldmen, academic institutions, applied research associations and municipal pest management departments. A total of 290 samples were processed for disease diagnosis in the 2016 crop year. Fungal, oomycete, protist, phytoplasma, bacterial and viral pathogens were identified in these samples as the causal agents of disease. Late blight was identified in one potato and one tomato sample, both collected from the same site. Aphanomyces euteiches was identified in two field pea samples. Among the 147 Fusarium strains isolated from corn, 74 were identified as F. graminearum, with the 15-ADON as the predominant chemotype. Dutch elm disease was not identified in any of the 15 submittedsuspect samples. Canola samples from twelve fields with verticillium wilt (VW) symptoms were analyzed byqPCR. None of these samples were confirmed to contain the VW causal agent Verticillium longisporum.
METHODS: The Alberta Plant Health Lab (APHL) provides diagnosis primarily for diseases of crops in Alberta. Samples are submitted to the laboratory by agricultural fieldmen, academic institutions, applied research associations and municipal pest management departments. Diagnoses are based on a combination of visual examination of symptoms, microscopic observation, culturing on artificial media, PCR/qPCR, DNA barcoding and commercial diagnostic kits. Specifically, confirmation of late blight on potato and tomato was conducted using the Agdia ImmunoStripkit for Phytophthora species (http://www.agdia.com). Fungal barcoding was performed using the PCR primer pair ITS1/ITS4 (White et al. 1990) and/or EF1-1018F/EF1-1620R (Stielow et al. 2015). Fusarium species were identified by PCR using the primers reported by Demeke et al. (2005). Phytoplasmas were detected by PCR using the primer pairs P1/Tint and R16MF2n/R16MR2n (Smart et al. 1996). Diagnosis of Verticillium longisporum was conducted by qPCR using two primer pairs designed by the APHL, targeting the intron in the rDNA small subunit. The sequences of these primers are: F1: gggaggactcacagatcgaa, R1: ccgtgaattcagaggcagat and Probe1: tcacgacctctggtcatgac; and F2: cccattcttctccctctcct, R2: ctgaccagacgaacctccat and Probe 2: gctaacgggagcgagtatgt. RESULTS: A total of 290 disease diagnoses were completed between January 11 and December 9, 2016. Categories of samples diagnosed included cereals (21%), canola (2%), potato (2%), corn (52%), legume (9%), tree and fruit (8%), vegetable (2%) and other (4%). The category ‘other’ covers samples such as mint, sunflower and sugar beet. In most samples, one or more causal agents were identified. Summaries of diseases diagnosed on the submitted samples are provided in Tables 1 to 8 by crop category. The diagnoses reported may not necessarily reflect the major problems encountered during the season in the field, but rather those most prevalent within the samples submitted.
There was one laboratory-confirmed incidence of potato late blight identified on potato and tomato from the same site. Aphanomyces euteiches was identified on two field pea samples. Among the 147 Fusarium isolates from corn, 74 were identified as F. graminearum, with the 15 ADON as the predominant chemotype. Fifteen samples were submitted for Dutch elm disease diagnosis and none of them tested positive. However, in six of the samples, Dothiorella ulmi was present. In addition to routine samples, canola samples from 12 fields collected by Alberta Agriculture and Forestry, as a part of the CFIA 2015 National Verticillium Survey, were analyzed for verticillium wilt by qPCR. None of these samples were VW-positive.

23
REFERENCES: Demeke, T., Clear, R.M., Patrick, S.K. and Gaba, D. 2005. Species-specific PCR-based assays for the detection of Fusarium species and a comparison with the whole seed agar plate method and trichothecene analysis. Inter.J. Food Microbiol. 103:271-284.
Smart, C.D., Schneider, B., Blomquist, C.L., Guerra, L.J., Harrison, N.A., Ahrens, U., Lorenz, K.H., Seemüller, E. and Kirkpatrick, B.C. 1996. Phytoplasma-specific PCR primers based on sequences of the 16S-23S rRNAspacer region. Appl. Environ. Microbiol. 62:2988-2993.
Stielow, J.B., Lévesque, C.A., Seifert, K.A., Meyer, W., Irinyi, L., Smits, D., Renfurm, R., Verkley, G.J., Groenewald, M., Chaduli, D.and Lomascolo, A. 2015. One fungus, which genes? Development and assessment of universal primers for potential secondary fungal DNA barcodes. Persoonia 35:242-263.
White, T.J., Bruns, T., Lee, S. and Taylor, J. 1990. Amplification and direct sequencing of fungal ribosomal RNA genes for phylogenetics. In: Innes MA, Gelfand DH, Sninsky JJ, White TJ. (eds) PCR Protocols: A Guide to Methods and Applications. San Diego, Academic Press, pp 315-322.
Table 1: Summary of diseases diagnosed on cereal crops submitted to the Alberta Plant Health Lab in 2016.
Crop Symptom Causal agent(s)
Number of
Samples
Wheat Leaf lesions
Leaf lesions and / or root rot
Leaf and stem pustules
Black root rot
Yellow leaf streaking and wilting
Yellow leaf streaking and wilting
Leaf and stem pustules
Leaf blotch (dark lesions)
Tan-colored lesions on leaves
Leaf chlorosis
Alternaria sp.
Fusarium sp.
Sclerophthora macrospora
Gaeumannomyces graminis
Phytoplasma*
Negative for phytoplasma*
Blumeria graminis f.sp. tritici
Parastagonospora nodorum
Pyrenophora tritici-repentis
Virus
6
5
1
2
7
4
1
1
1
2
Winter wheat Yellow leaf streaking and wilting Phytoplasma* 2
Barley Dark brown spores on leaves
Yellow leaf striping
Necrotic lesions on leaves
Loose smut
Necrotic and chlorotic leaf lesions
Chlorotic striping on leaves
Chlorotic striping on leaves
Alternaria sp.
Bacterial pathogen
Fusarium sp.
Ustilago nuda
Rhynchosporium commune
Phytoplasma*
Negative for phytoplasma*
5
5
5
3
4
1
1
Durum Leaf chlorosis
Leaf yellowing
Virus
Negative for phytoplasma*
1
2
Oats Leaf yellowing and mold Fusarium sp. 1
Triticale Necrotic and chlorotic leaf lesions
Necrotic and chlorotic leaf lesions
Alternaria sp.
Fusarium sp.
1
1
*These samples were submitted specifically for phytoplasma testing.

24
Table 2: Summary of diseases diagnosed on canola samples submitted to the Alberta Plant Health Lab in
2016.
Crop Symptom Causal agent(s) Number
of Samples
Canola
Black root
Stem rot
Wilting plant
Leptosphaeria maculans
Sclerotinia sclerotiorum
Undetermined
4
1
1
Table 3: Summary of diseases diagnosed on potato samples submitted to the Alberta Plant Health Lab in 2016.
Crop Symptom Causal agent(s) Number
of Samples
Potato Leaf spots
Black dot on tuber
Dark lesions and scabs on tuber
Wilting and necrotic plants
Chlorosis on leaves
Alternaria solani
Colletotrichum coccodes
Pseudomonas sp.
Phytophthora sp.
Phytoplasma
1
1
1
1
Table 4: Summary of diseases diagnosed on corn samples and corn stalk-derived fungal cultures submitted to the Alberta Plant Health Lab in 2016.
Crop Symptom Causal agent(s) Number
of Samples
Corn Culture plates
Culture plates
Culture plates
Culture plates
Culture plates
Culture plates
Culture plates
Culture plates
Root rot
Wilting plant
Fusarium graminearum
Fusarium culmorum
Fusarium graminearum and F. culmorum
Fusarium avenaceum
Fusarium tricinctum
Fusarium equiseti
Fusarium pseudograminearum
Unidentified
Fusarium sp.
Clavibacter michiganensis subsp. nebraskensis
74
46
1
14
3
2
2
5
2
1

25
Table 5: Summary of diseases diagnosed on legumes submitted to the Alberta Plant Health Lab in 2016.
Crop Symptom Causal agent(s) Number
of Samples
Pea Leaf spot / blight
Mycelia on leaves
Leaf spot
Root rot
Root rot
Root rot
Stem rot
Leaf and pod lesions
Stemphyllium globuliferan
Stemphyllium vesicarium
Stemphyllium solani
Pythium sp., Rhizoctonia sp., Fusarium spp.
Fusarium sp.
Aphanomyces euteiches
Sclerotinia sp.
4
1
1
5
5
2
1
2
Chickpea Mycelia on leaves Bjerkandera adusta 3
Lentil Post-emergence plant death Fusarium spp. and Sclerotinia spp. 1
Dry bean Leaf lesions and chlorosis Fusarium spp. and Sclerotinia spp. 1
Table 6: Summary of diseases diagnosed on trees and fruit crops submitted to the Alberta Plant Health Lab in 2016.
Crop Symptom Causal agent(s) Number
of Samples
Elm Wilting twig
Wilting twig
Dothiorella ulmi
Unidentified
6
9
Pine Stem curling / crooking
Needle discoloration
Phoma and Cylindrocarpon spp.
Alternaria alternata
1
1
Apple tree Leaf discoloration Alternaria spp. 2
Maple Leaf chlorosis Phytoplasma* 1
Raspberry Cane and leaf discoloration
Leaf chlorosis
Bacteria spp.
Negative for phytoplasma*
1
1
*These samples were submitted specifically for phytoplasma testing.
26
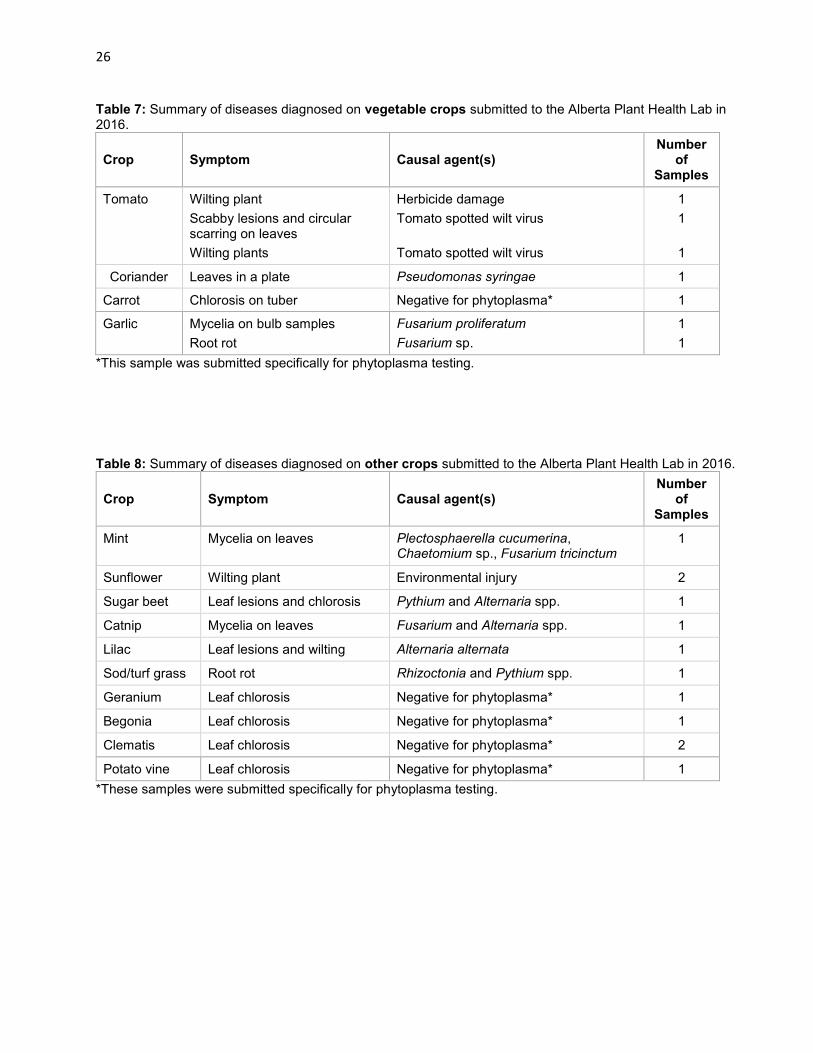
Table 7: Summary of diseases diagnosed on vegetable crops submitted to the Alberta Plant Health Lab in 2016.
Crop Symptom Causal agent(s) Number
of Samples
Tomato Wilting plant
Scabby lesions and circular scarring on leaves
Wilting plants
Herbicide damage
Tomato spotted wilt virus
Tomato spotted wilt virus
1
1
1
Coriander Leaves in a plate Pseudomonas syringae 1
Carrot Chlorosis on tuber Negative for phytoplasma* 1
Garlic Mycelia on bulb samples
Root rot
Fusarium proliferatum
Fusarium sp.
1
1
*This sample was submitted specifically for phytoplasma testing.
Table 8: Summary of diseases diagnosed on other crops submitted to the Alberta Plant Health Lab in 2016.
Crop Symptom Causal agent(s) Number
of Samples
Mint Mycelia on leaves Plectosphaerella cucumerina, Chaetomium sp., Fusarium tricinctum
1
Sunflower Wilting plant Environmental injury 2
Sugar beet Leaf lesions and chlorosis Pythium and Alternaria spp. 1
Catnip Mycelia on leaves Fusarium and Alternaria spp. 1
Lilac Leaf lesions and wilting Alternaria alternata 1
Sod/turf grass Root rot Rhizoctonia and Pythium spp. 1
Geranium Leaf chlorosis Negative for phytoplasma* 1
Begonia Leaf chlorosis Negative for phytoplasma* 1
Clematis Leaf chlorosis Negative for phytoplasma* 2
Potato vine Leaf chlorosis Negative for phytoplasma* 1
*These samples were submitted specifically for phytoplasma testing.

27
CROP / CULTURE: Diagnostic Laboratory Report LOCATION / RĖGION: Saskatchewan NAMES AND AGENCIES: F.L. Dokken-Bouchard, C. Brenzil, K. Gray, A. Mah, T. Sliva, D.T. Stephens, G. Sweetman, A. Wilyman, and B. Ziesman Saskatchewan Ministry of Agriculture, Crop Protection Laboratory, 346 McDonald St., Regina SK S4N 6P6 Telephone: (306) 798-0100; Facsimile: (306) 787-8803; E-mail: [email protected] TITLE: DISEASES DIAGNOSED ON CROP SAMPLES SUBMITTED TO THE SASKATCHEWAN MINISTRY OF AGRICULTURE CROP PROTECTION LABORATORY IN 2016 ABSTRACT: In 2016, 448 samples were diagnosed for plant disease at the Crop Protection Laboratory in Saskatchewan, including 249 crop samples and 199 elm tree samples for Dutch elm disease testing. Most diagnoses were of fungal plant diseases, most notably root rots, but a large number of samples (almost 1/3 of the field crop samples) exhibited symptoms consistent with herbicide damage. METHOD: The Saskatchewan Ministry of Agriculture’s Crop Protection Laboratory (CPL) provides fee-for-service diagnostic services to the agricultural industry on all crop health issues. Services include disease diagnosis and insect and weed identification, as well as testing of weed seeds for herbicide resistance. The CPL also provides a (free) Dutch elm disease (DED) service under which American elm (Ulmus americana) and Siberian elm (U. pumila) samples are tested for DED and dothiorella wilt. Samples for DED testing are submitted by the Saskatchewan Ministry of Environment, cities/towns including City of Regina and City of Saskatoon, or homeowners. Agricultural crop samples are usually submitted by growers and agronomists, Saskatchewan Ministry of Agriculture and Saskatchewan Crop Insurance Corporation staff, or market / home gardeners. Diagnosis of fungal plant diseases is performed primarily through visual assessment of plant symptoms, microscopic examination and the isolation of fungal organisms on artificial media. Diagnoses of injuries suspected to be due to herbicide damage and/or nutrient deficiencies are based on visual observation. Viral and bacterial diagnoses are also based on visible symptoms. Enzyme-linked immunosorbent assay (ELISA) testing is used to identify wheat streak mosaic virus (WSMV). Diagnoses are aided by the receipt of representative samples and adequately detailed information in submission forms. RESULTS AND COMMENTS: In 2016, 249 samples of field crops (including cereals, forages, fruit, oilseeds, pulses, vegetables, and special crops), ornamentals and trees were submitted to the Saskatchewan Crop Protection Laboratory for disease diagnosis. An additional 199 elm tree samples were received for DED testing in 2016. A dry spring followed by excess moisture throughout the growing season, delayed harvest of crops and led to plant stress and high disease pressure in Saskatchewan in 2016. As a result of these conditions, along with a high acreage of lentil, pulses were by far the most common type of field crop submitted. The root rot complex was the most common disease diagnosed visually and by culturing on pulse crops. Summaries of diagnoses on samples submitted to the CPL in 2016 are presented in Tables 1 to 10.

28
Table 1. Summary of diseases diagnosed on cereal crop samples submitted to the Saskatchewan Crop Protection Laboratory in 2016.
Crop Disease/Injury Causal Agent(s) Number of
Samples
Barley Common root rot
Environmental stress
Fusarium head blight
Leaf spot
Loose smut
Root rot / seedling blight (complex)
Spot blotch
Consistent with herbicide damage
Cochliobolus sativus
Various stresses
Fusarium spp.
Suspect Phoma glomerata
Ustilago nuda
Fusarium spp.*
Cochliobolus sativus
Suspect various herbicide groups
1
2
1
1
1
2
1
3
Durum wheat
Common root rot
Environmental stress
Fusarium head blight
Root, crown, and foot rot (complex)
Stagonospora blotch
Stripe rust
Consistent with herbicide damage
Wheat Streak Mosaic Virus
Cochliobolus sativus
Various stresses
Fusarium spp.
Fusarium spp.*
Stagonospora nodorum
Puccinia striiformis
Suspect various herbicide groups
Wheat Streak Mosaic Virus
3
3
1
2
1
1
2
6
Oats Environmental stress Sunburn 1
Wheat Environmental stress
Fusarium head blight
Leaf rust
Leaf spot
Pseudo-black chaff
Root, crown, and foot rot (complex)
Seedling blight (complex)
Consistent with herbicide damage
Wheat Streak Mosaic Virus
Various stresses
Fusarium spp.*
Puccinia triticina
Cochliobolus sativus, Stagonospora nodorum, and Pyrenophora tritici-repentis*
Melanism
Fusarium spp.*
Fusarium spp*
Suspect various herbicide groups
Wheat Streak Mosaic Virus
4
3
1
2
1
1
2
4
3
Winter wheat
Environmental stress
Powdery mildew
Stagonospora blotch
Frost damage
Blumeria graminis
Stagonospora nodorum
1
2
1
*Testing to confirm the presence of other pathogens was not conducted.

29
Table 2. Summary of diseases diagnosed on forage crop samples submitted to the Saskatchewan Crop
Protection Laboratory in 2016.
Crop Disease/Injury Causal Agent(s) Number
of Samples
Alfalfa Unknown Phoma spp. 2
Sweet clover
Consistent with herbicide damage Undetermined 1
Timothy Leaf spot Undetermined 1
Purple eyespot Cladosporium phlei 2
Table 3. Summary of diseases diagnosed on fruit crop samples submitted to the Saskatchewan Crop Protection Laboratory in 2016.
Crop Disease/Injury Causal Agent(s) Number of
Samples
Apple Fire blight Erwinia amylovora 1
Table 4. Summary of diseases diagnosed on oilseed crop samples submitted to the Saskatchewan Crop Protection Laboratory in 2016.
Crop Disease/Injury Causal Agent(s) Number of
Samples
Canola Alternaria black spot
Aster Yellows
Blackleg
Environmental stress
Hybridization nodules
Sclerotinia white mould
Consistent with herbicide damage
Suspect nutrient deficiency
Wire stem
Alternaria spp.
AY Phytoplasma
Leptosphaeria maculans
Various stresses
Unknown
Sclerotinia spp.
Suspect various groups
Undetermined
Rhizoctonia spp.
2
1
2
1
3
13
1
1
Flax Aster Yellows
Environmental stress
Consistent with herbicide damage
AY Phytoplasma
Various stresses
Suspect various herbicide groups
1
2
6

30
Table 5. Summary of diseases diagnosed on ornamental crop samples submitted to the Saskatchewan Crop Protection Laboratory in 2016.
Crop Disease/Injury Causal Agent(s) Number of
Samples
Flowering crabapple
Fire blight Erwinia amylovora 1
Petunia Stem rot Sclerotinia spp. 1
Table 6. Summary of diseases diagnosed on pulse crop samples submitted to the Saskatchewan Crop Protection Laboratory in 2016.
Crop Disease/Injury Causal Agent(s) Number of
Samples
Chickpea Ascochyta blight
Root rot (complex)
Consistent with herbicide damage
Ascochyta rabiei
Fusarium spp.*
Suspect herbicide Group 2 injury
1
3
10
Fababean Chocolate spot
Stemphylium blight
Consistent with herbicide damage
Botrytis spp.
Stemphylium spp.
Suspect herbicide Group 2 injury
2
1
1
Field Pea Foot rot
Root rot (complex)
Consistent with herbicide damage
Ascochyta spp. complex
Fusarium spp.*
Fusarium spp. and oomycete(s)*
Oomycete(s)*
Suspect herbicide Group 2 injury
1
11
12
10
8
Lentil Anthracnose
Botrytis grey mould / stem and pod rot
Environmental stress
Root rot (complex)
Stemphylium blight
Consistent with herbicide damage
Colletotrichum lentis
Botrytis spp.
Various stresses
Fusarium spp.*
Fusarium spp. and oomycete(s)*
Oomycete(s)*
Stemphylium spp.
Suspect various herbicide groups
2
2
13
11
5
10
2
13
Soybean Environmental stress
Stem rot
Various stresses
Phytophthora spp.
1
1
*Testing to confirm the presence of other pathogens was not conducted.

31
Table 7. Summary of diseases diagnosed on special crop samples submitted to the Saskatchewan Crop Protection Laboratory in 2016.
Crop Disease/Injury Causal Agent(s) Number of
Samples
Canaryseed Root, crown, and foot rot (complex)
Consistent with herbicide damage
Fusarium spp.*
Suspect various herbicide groups
1
1
Coriander Blossom blight (complex) Botrytis spp., Fusarium spp. and Alternaria spp.*
1
Corn Consistent with herbicide damage
Suspected nutrient deficiency
Unidentified contact herbicide
Consistent with zinc deficiency
1
1
Suspected nutrient deficiency Consistent with zinc deficiency 1
Quinoa Suspected Phoma stalk rot
Unknown disease / injury
Unconfirmed Phoma spp.
Fusarium spp.
1
Unknown disease/injury Fusarium spp. 1
*Testing to confirm the presence of other pathogens was not conducted. Table 8. Summary of diseases diagnosed on tree samples submitted to the Saskatchewan Crop Protection Laboratory in 2016.
Crop Disease/Injury Causal Agent(s) Number of
Samples
Evergreen Environmental stress Winter damage 1
Consistent with herbicide damage Undetermined 1
Maple Environmental stress Undetermined 1
Plains cottonwood
Leaf rust Melampsora spp. 1
Table 9. Summary of diseases diagnosed on elm samples submitted to the Saskatchewan Crop Protection Laboratory in 2016.
Crop Disease/Injury Causal Agent(s) Number of
Samples
Elm Suspect anthracnose
Dothiorella wilt
Dutch elm disease (DED)
Samples testing negative for disease
Gloeosporium spp.
Dothiorella ulmi
Confirmed Ophiostoma ulmi
No pathogens detected
1
17
55
127

32
Table 10. Summary of diseases diagnosed on vegetable samples submitted to the Saskatchewan Crop
Protection Laboratory in 2016.
Crop Disease/Injury Causal Agent(s) Number of
Samples
Cucumber Septoria leaf spot Septoria cucurbitacearum 1
Garlic Environmental stress Various stresses 1
Horseradish Consistent with herbicide damage Suspect herbicide Group 14 injury 1
Potato Late blight Phytophthora infestans 1
Tomato Environmental stress
Late blight
Hail damage
Phytophthora infestans
1
1

33
CROP / CULTURE: Diagnostic Laboratory Report LOCATION / RĖGION: Manitoba NAME AND AGENCY:
M. Pradhan1, V. Bisht2, H. Derksen2, P. Bajracharya2 1Manitoba Agriculture, Crop Diagnostic Centre, 545 University Crescent, Winnipeg MB R3T 5S6 Telephone: (204) 945-7707; Facsimile: (204) 945-4327; E-mail: [email protected] 2Manitoba Agriculture, Crops Industry Branch, Box 1149, Carman MB R0G 0J0 TITLE: 2016 MANITOBA AGRICULTURE CROP DIAGNOSTIC CENTRE LABORATORY SUBMISSIONS ABSTRACT: This report summarizes the diseases and disorders diagnosed on plant samples analyzed by the Manitoba Agriculture Crop Diagnostic Centre in 2016. Samples received by the laboratory covered most crops grown in Manitoba and also included ornamentals, turf grasses and trees. METHODS: The Manitoba Agriculture, Crop Diagnostic Centre provides diagnoses and control recommendations for disease problems of agricultural crops and ornamentals. Samples are submitted by Manitoba Agriculture Crop Industry Branch specialists, extension and other departmental personnel, farmers, agri-business representatives and the general public. Diagnostic methods used included visual examination for symptoms, microscopy, moist chamber incubation, culturing onto artificial media (general and pathogen specific), Agdia ImmunoStrips® and ELISA testing. RESULTS: Summaries of diseases diagnosed on plants in different crop categories are presented in Tables 1 to11 and cover the time period from January 1 to November 30, 2016. Table 1. Summary of diseases diagnosed on herbaceous ornamental plant samples submitted to the Manitoba Agriculture Crop Diagnostic Centre in 2016. CROP
SYMPTOM/ DISEASE
CAUSAL AGENT
NUMBER OF
SAMPLES
Carnation Leaf spot Alternaria dianthi 1
Rose Black spot Marssonina rosae 1
Rose Crown gall Agrobacterium tumefaciens 1
Table 2. Summary of diseases diagnosed on greenhouse crop samples submitted to the Manitoba Agriculture Crop Diagnostic Centre in 2016. CROP
SYMPTOM/ DISEASE
CAUSAL AGENT
NUMBER OF
SAMPLES
Basil Early blight Alternaria solani 2
Root rot Rhizoctonia sp. 1
Tomato Fusarium wilt Fusarium sp. 1
Environmental injury 2

34
Table 3. Summary of diseases diagnosed on cereal crop samples submitted to the Manitoba Agriculture Crop Diagnostic Centre in 2016. CROP
SYMPTOM/ DISEASE
CAUSAL AGENT
NUMBER OF
SAMPLES
Wheat Bacterial leaf blight Bacterial leaf streak Black head moulds Black point Common root rot Fusarium head blight Glume blotch Leaf spot Powdery mildew Root rot Stripe rust Tan spot Environmental injury Physiological disorders Physiological leaf spot Herbicide injury Nutrient deficiency
Pseudomonas syringae pv. syringae Xanthomonas sp. Epicoccum nigrum, Alternaria sp. Alternaria sp., Cladosporium sp., Epicoccum nigrum Cochliobolus sativus Fusarium sp. Septoria sp. Septoria sp. Blumeria graminis Fusarium sp., Pythium sp., Rhizoctonia solani Puccinia striiformis Pyrenophora tritici-repentis Undetermined Chloride deficiency
5 1 1 3
1 3 1 6 3 9
2 15 14 2 3 4
10 Barley Bacterial leaf blight
Common root rot Fusarium head blight Leaf rust Leaf spot Loose smut Net blotch Root rot Herbicide injury Environmental injury Nutrient deficiency
Pseudomonas syringae pv. Syringae Cochliobolus sativus Fusarium graminearum, F. avenaceum Puccinia sp. Septoria sp. Ustilago nuda Drechslera teres Fusarium sp. Undetermined
2 1 6 1 1 2 2 1 1 1 1
Oat Bacterial blight
Fusarium head blight Root rot
Pseudomonas syringae Fusarium graminearum, F. avenaceum Fusarium sp.
5 1 1
Rye Bacterial leaf streak
Root rot complex Xanthomonas sp. Fusarium sp., Cochliobolus sp.
1 1

35
Table 4. Summary of diseases diagnosed on vegetable crop samples submitted to the Manitoba Agriculture Crop Diagnostic Centre in 2016.
CROP
SYMPTOM/ DISEASE
CAUSAL AGENT
NUMBER OF SAMPLES
Basil Leaf spot Botrytis sp. 1
Beet Cercospora leaf spot Cercospora sp. 1
Cabbage Root rot Black rot General stress
Fusarium oxysporum Pythium sp. Xanthomonas campestris pv. campestris Environmental stress
2 2 2 2
Cauliflower Bacterial leaf spot Black rot
Pseudomonas syringae Xanthomonas campestris pv. Campestris
1 2
Chard Cercospora leaf spot Cercospora sp. 1
Cucumber Alternaria leaf spot Powdery mildew
Alternaria cucumerina Erysiphe cichoracearum
1 1
Garlic Fusarium basal rot Blue mould
Fusarium sp. Penicillium sp.
2 2
Lettuce Downy mildew Bremia lactucae 1
Onion Neck rot Fusarium basal rot Herbicide injury
Botrytis allii Fusarium sp.
1 4 1
Parsnip Environmental injury 1
Pepper Early blight Herbicide injury General stress
Alternaria solani Environmental stress
2 1 1
Pumpkin Root rot Fusarium oxysporum, Fusarium spp. 2
Rhubarb Environmental injury 1
Squash Bacterial fruit blotch Pseudomonas sp. 1
Tomato Black mould (fruit) Cercospora leaf mould Early blight General stress Late blight Herbicide injury
Alternaria alternate Pseudocercospora fuligena Alternaria solani Environmental stress Phytophthora infestans
5 1 1 4 6 3
Zucchini Gummy stem blight
General stress
Herbicide injury
Phoma cucurbitacearum
Environmental stress
1
1
1

36
Table 5. Summary of diseases diagnosed on potato crop samples submitted to the Manitoba Agriculture Crop Diagnostic Centre in 2016.
SYMPTOM/ DISEASE
CAUSAL AGENT
NUMBER OF
SAMPLES
Bacterial soft rot Pectobacterium carotovorum subsp. carotovorum 2
Black dot( tuber) Colletotrichum coccodes 8
Blackleg Pectobacterium carotovorum subsp. atrosepticum 2
Black scurf (tuber) Rhizoctonia solani 2
Brown spot Alternaria alternata 1
Early blight (foliar) Alternaria solani 3
Fusarium dry rot Fusarium sambucinum 2
Late blight Phytophthora infestans 14
Leak Pythium sp. 3
Pink eye Unknown 1
Pink rot Phytophthora erythroseptica 10
Potato Mop Top Furovirus 3
Root rot Rhizoctonia solani, Fusarium spp. 1
Scab, common Streptomyces spp. 2
Scab, powdery Spongospora subterranea 2
Silver scurf Helminthosporium solani 9
Slime mold Stemonitis sp. 1
Tobacco Rattle Virus Tobravirus 1
Herbicide injury 2
Table 6. Summary of diseases diagnosed on shelterbelt trees and woody ornamental plants submitted to the Manitoba Agriculture Crop Diagnostic Centre in 2016. CROP
SYMPTOM/ DISEASE
CAUSAL AGENT
NUMBER OF
SAMPLES
Ash (Fraxinus sp.) AnthracnoseCanker
Fire blight
Environmental injury
Herbicide injury
Gloeosporium aridum
Cytospora sp.
Erwinia amylovora
21
2
3
3
Crabapple
(Malus spp.)
Canker
Frogeye leaf spot
Fire blight
Cytospora sp. Botryosphaeria obtusa
Erwinia amylovora
2
1
2
Basswood
(Tilia americana)
Anthracnose
Canker
Canker
Herbicide injury
Apiognomonia tiliae
Nectria sp.
Phoma sp.
1
1
1
3
Caragana
(Caragana sp.)
Canker
Leaf Spot
Cytospora sp.
Septoria sp.
1
1

37
Table 6 (cont.)
Cotoneaster
(Cotoneaster sp.)
Environmental injury
Nutritional deficiency
1
1
Crabapple
(Malus spp.)
Canker
Fire blight
Frogeye leaf spot
Environmental injury
Nutrient deficiency
Cytospora sp.
Erwinia amylovora
Botryosphaeria obtusa
3
2
1
2
1
Elm, American
(Ulmus americana)
Anthracnose
Botryosphaeria canker
Coniothyrium canker
Cytospora canker
Dutch elm disease
Verticillium wilt
Environmental injury
Gnomonia ulmea
Botryosphaeria sp.
Coniothyrium sp.
Cytospora sp.
Ophiostoma ulmi
Verticillium albo-atrum
8
3
2
3
42
6
1
Juniper
(Juniperus sp.)
Canker
Twig blight
Cytospora sp.
Phomopsis sp.
1
2
Lilac
(Syringa vulgaris)
Herbicide injury 2
Maple, Manitoba (
Acer negundo)
Leaf spot
Environmental injury
Herbicide injury
Phoma sp. 1
1
1
Maple, silver
(Acer saccharinum)
Anthracnose
Environmental injury
Gloeosporium sp. 1
1
Oak
(Quercus macrocarpae)
Anthracnose
Leaf blister
Canker
Environmental injury
Discula sp.
Taphrina caerulescens
Phoma sp.
61
2
1
Pine, Scots
(Pinus sylvestris)
Needle cast
Winter injury
Lophodermium sp.
Environmental stress
2
2
Poplar
(Populus spp.)
Canker
Bronze leaf disease
Herbicide injury
Cytospora sp.
Apioplagiostoma populi
1
2
1
Spruce
(Picea spp.)
Canker
Canker
Needle blight
Needle cast
Stigmina needle blight
Twig canker
Environmental injury
Nutrient deficiency
Undetermined
Cytospora sp.
Lirula sp.
Rhizosphaera kalkhoffii
Stigmina lautii
Phoma sp.
2
2
2
7
7
1
15
55
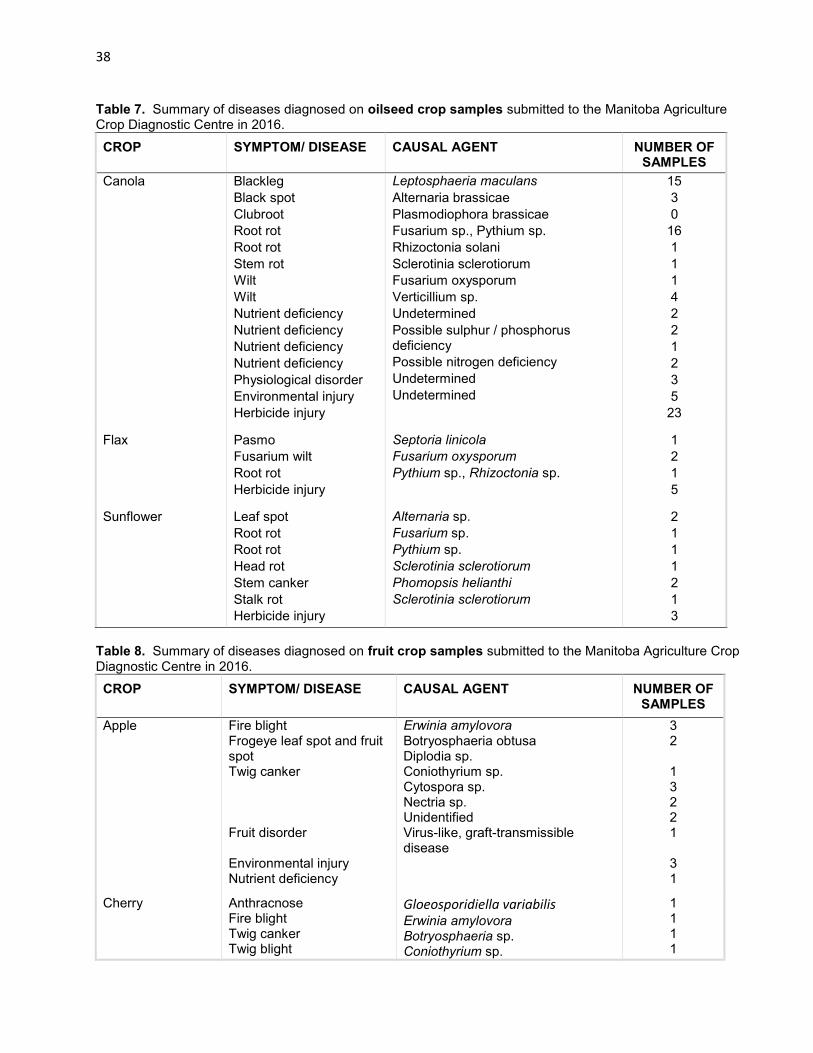
38
Table 7. Summary of diseases diagnosed on oilseed crop samples submitted to the Manitoba Agriculture Crop Diagnostic Centre in 2016. CROP
SYMPTOM/ DISEASE
CAUSAL AGENT
NUMBER OF
SAMPLES
Canola Blackleg Black spot
Clubroot
Root rot
Root rot
Stem rot
Wilt
Wilt
Nutrient deficiency
Nutrient deficiency
Nutrient deficiency
Nutrient deficiency
Physiological disorder
Environmental injury
Herbicide injury
Leptosphaeria maculans
Alternaria brassicae
Plasmodiophora brassicae
Fusarium sp., Pythium sp.
Rhizoctonia solani
Sclerotinia sclerotiorum
Fusarium oxysporum
Verticillium sp.
Undetermined
Possible sulphur / phosphorus deficiency
Possible nitrogen deficiency
Undetermined
Undetermined
15
3
0
16
1
1
1
4
2
2
1
2
3
5
23
Flax Pasmo
Fusarium wilt
Root rot
Herbicide injury
Septoria linicola
Fusarium oxysporum
Pythium sp., Rhizoctonia sp.
1 2
1
5
Sunflower Leaf spot Root rot
Root rot
Head rot
Stem canker
Stalk rot
Herbicide injury
Alternaria sp. Fusarium sp.
Pythium sp.
Sclerotinia sclerotiorum
Phomopsis helianthi
Sclerotinia sclerotiorum
2
1
1
1
2
1
3
Table 8. Summary of diseases diagnosed on fruit crop samples submitted to the Manitoba Agriculture Crop Diagnostic Centre in 2016. CROP
SYMPTOM/ DISEASE
CAUSAL AGENT
NUMBER OF
SAMPLES
Apple Fire blight Frogeye leaf spot and fruit spot Twig canker Fruit disorder Environmental injury Nutrient deficiency
Erwinia amylovora Botryosphaeria obtusa Diplodia sp. Coniothyrium sp. Cytospora sp. Nectria sp. Unidentified Virus-like, graft-transmissible disease
3 2 1 3 2 2 1 3 1
Cherry Anthracnose Fire blight Twig canker Twig blight
Gloeosporidiella variabilis Erwinia amylovora Botryosphaeria sp. Coniothyrium sp.
1 1 1 1

39
Table 8 (cont.)
Grape Leaf spot Phoma sp. Phyllosticta sp.
1 1
Raspberry Anthracnose
Bacterial blight Fire blight Spur blight
Elsinoë veneta Pseudomonas syringae Erwinia amylovora Didymella applanata
1 2 1 1
Saskatoon berry Rust
Twig canker Environmental injury Herbicide injury
Gymnosporangium clavipes Cytospora sp.
1 4 2 1
Strawberry Anthracnose
Flower blight Fruit rot Root rot Slime Mould Environmental injury
Colletotrichum acutatum Botrytis cinerea Botrytis cinerea Rhizoctonia sp., Fusarium sp., Cylindrocarpon sp., Phytophthora sp. Slime mould
4 3 1 4 1 3
Table 9. Summary of diseases diagnosed on forage legume crop samples submitted to the Manitoba Agriculture Crop Diagnostic Centre in 2016.
CROP
SYMPTOM/ DISEASE
CAUSAL AGENT
NUMBER OF SAMPLES
Alfalfa Leptosphaerulina leaf spot Spring black stem / leaf spot Stemphylium leaf spot Summer black stem / leaf spot Root rot Herbicide injury Environmental injury Nutrient deficiency
Leptosphaerulina sp. Phoma medicaginis Stemphylium sp. Cercospora medicaginis Pythium sp.
1 3 2 1 1 2 1 1
Hairy Vetch (Vicia villosa)
Powdery mildew Erysiphe sp. 1
Table 10. Summary of diseases diagnosed on forage grass and turfgrass samples submitted to the Manitoba Agriculture Crop Diagnostic Centre in 2016.
CROP
SYMPTOM/ DISEASE
CAUSAL AGENT
NUMBER OF SAMPLES
Timothy Environmental injury 1 Turfgrass Root rot
Herbicide injury Pythium sp. 1
1

40
Table 11. Summary of diseases diagnosed on special crop samples submitted to the Manitoba Agriculture Crop Diagnostic Centre in 2016.
CROP
SYMPTOM/ DISEASE
CAUSAL AGENT
NUMBER OF SAMPLES
Canary seed Fusarium head blight Root rot
Fusarium sp. Fusarium sp.
1 1
Corn Stewart’s bacterial blight Goss’s wilt Holcus spot Root rot Nutrient deficiency
Xanthomonas sp. Clavibacter michiganensis subsp. nebraskensis Pseudomonas syringae Fusarium sp.
4 5
1 1 1
Dry bean Common blight
Halo blight Nutrient deficiency Herbicide injury
Xanthomonas axonopodis pv. Phaseoli Pseudomonas syringae pv. phaseolicola
2 1
1 5
Faba bean Alternaria leaf spot Alternaria alternata 1
Field pea Alternaria leaf spot Anthracnose Root rot Root rot Root rot Environmental stress Nutrient deficiency Herbicide injury
Alternaria sp. Colletotrichum pisi Aphanomyces sp. Fusarium sp. Fusarium sp., Rhizoctonia sp.
2 4 4 15 3 2 1 10
Hemp Flower blight Root and stem rot
Fusarium graminearum, F. sporotrichioides Fusarium oxysporum
1
2
Quinoa Leaf and stem spot Stem canker
Ascochyta sp. Phoma sp.
1 1
Soybean Alternaria leaf spot Anthracnose Bacterial blight Brown spot Downy mildew Leaf spot Pod and seed rot Root rot Root rot Stem blight Stem blight Stem rot Environmental stress Nutrient deficiency Herbicide injury Physiological stress
Alternaria sp. Colletotrichum sp. Pseudomonas sp. Septoria glycines Peronospora manshurica Phyllosticta sojicola Phomopsis sp. Fusarium spp., Pythium spp., Rhizoctonia solani Phytophthora sojae Phomopsis longicolla Phomopsis sp. Sclerotinia sclerotiorum
2 2 1 12 1 2 2 3 4 5 1 7 9 14 2 31

41
CROP / CULTURE: Commercial Crops - Diagnostic Laboratory Report LOCATION / RĖGION: Ontario NAMES AND AGENCY: M. Melzer and X. Shan Pest Diagnostic Clinic, Laboratory Services Division, University of Guelph, 95 Stone Road W, Guelph, ON N1H 8J7 Telephone: (519) 823-1268; Facsimile: (519) 767-6240; Email: [email protected] Web page: www.guelphlabservices.com TITLE: DISEASES DIAGNOSED ON PLANT SAMPLES SUBMITTED TO THE PEST DIAGNOSTIC CLINIC, UNIVERSITY OF GUELPH IN 2016 ABSTRACT: Diseases and their causal agents diagnosed on plant samples received by the Pest Diagnostic Clinic, University of Guelph in 2016 are summarized in this report. Samples included greenhouse vegetables, annual and perennial ornamental plants, field crops, berry crops, tree fruits, turfgrass and trees. METHODS: The Pest Diagnostic Clinic of the University of Guelph provides plant pest diagnostic services to growers, agri-businesses, provincial and federal governments and homeowners across Canada. Services include disease diagnosis, plant parasitic nematode identification and enumeration, pathogen detection from soil and water, and insect and plant identification. The following data are for samples received by the laboratory for disease diagnosis in 2016. Diagnoses were accomplished using microscopic examination, culturing on artificial media, biochemical identification of bacteria using BIOLOG®, enzyme linked immunosorbent assay (ELISA), polymerase chain reaction (PCR) based techniques including DNA multiscan, PCR and RT-PCR and DNA sequencing. RESULTS AND COMMENTS: In 2016, from January 1 to December 31, the Pest Diagnostic Clinic received samples representing plants in over 100 genera for disease diagnosis. Results are presented in Tables 1 to 6 below. For various reasons, the frequency of samples submitted to the laboratory does not reflect the prevalence of diseases of various crops in the field. Problems caused by plant parasitic nematodes, insects and abiotic factors are not listed. Most diseases identified in 2016 are commonly diagnosed.
Table 1. Summary of plant diseases diagnosed on vegetable samples (including greenhouse vegetables) submitted to the University of Guelph Pest Diagnostic Clinic in 2016.
CROP NAME DISEASE CAUSAL AGENT NO. OF
SAMPLES
Beet (Beta vulgaris)
Rot Fusarium oxysporum 1
Cabbage (Brassica oleracea var. capitata)
Black rot Root rot Root rot Root rot Root rot Root rot
Xanthomonas campestris Fusarium oxysporum Fusarium solani Pythium aphanidermatum Pythium ultimum Rhizoctonia solani
2 2 1 1 1 1
Carrot (Daucus carota)
Cavity spot Root rot Rot Rot
Pythium ultimum Rhizoctonia solani Fusarium oxysporum Fusarium solani
1 1 2 1
Cauliflower (Brassica oleracea var. botrytis)
Downy mildew Hyaloperonospora sp. 1

42
Table 1 (cont.)
Celery (Apium graveolens)
Crown and root rot Crown and root rot Crown and root rot Crown and root rot
Fusarium oxysporum Fusarium solani Pythium irregulare Pythium ultimum
1 1 1 1
Cucumber (Cucumis sativus)
Bacterial wilt Blight Canker Crazy root Crown rot Crown rot Crown and root rot Crown and root rot Crown and root rot Crown and root rot Crown and root rot Crown and root rot Crown and root rot Cucumber Green Mottle Mosaic Virus Gummy stem blight Powdery mildew Root rot Root rot Root rot Root rot Root rot Root rot Root rot Root rot Tobacco Ringspot Virus Tobacco Streak Virus White mould
Erwinia tracheiphila Phytophthora capsici Phomopsis sp. Agrobacterium sp. Fusarium oxysporum Fusarium solani Fusarium oxysporum Fusarium solani Phytophthora capsici Pythium aphanidermatum Pythium dissotocum Pythium irregulare Pythium ultimum Cucumber Green Mottle Mosaic Virus (CGMMV) Didymella bryoniae Oidium sp. Fusarium oxysporum Fusarium solani Phytophthora capsici Pythium sp. Pythium aphanidermatum Pythium dissotocum Pythium irregulare Pythium sylvaticum Tobacco Ringspot Virus (TRSV) Tobacco Steak Virus (TSV) Sclerotinia sclerotiorum
1 1 2 3 1 1 3 1 1 1 1 1
19 3 4 5 1 1 1 6 1 1 2 1 2 1
Eggplant (Solanum melongena)
Root rot Verticillium wilt
Pythium ultimum Verticillium dahliae
1 1
Garlic (Allium sativum)
Garlic Common Latent Virus Gray mould Neck rot Plate rot Plate rot Potyvirus Root rot Rot Rot
Garlic Common Latent Virus (GCLV) Botrytis cinerea Botrytis sp. Fusarium oxysporum Fusarium solani Potyvirus Pythium ultimum Fusarium oxysporum Rhizopus sp.
1 1 2 1 1 6 2 8 1
Lettuce (Lactuca sativa)
Drop Root rot Root rot
Sclerotinia sclerotiorum Pythium dissotocum Pythium irregulare
1 1 1
Melon (Cucumis sp.)
Crown rot Crown rot Crown rot Crown rot
Fusarium oxysporum Fusarium solani Pythium aphanidermatum Pythium irregulare
1 1 1 1

43
Table 1 (cont.)
Onion (Allium cepa) Basal rot Basal rot Leaf blight Root rot Root rot Root rot Root rot
Fusarium oxysporum Fusarium solani Stemphylium sp. Fusarium oxysporum Fusarium solani Pythium sp. Pythium ultimum
3 3 2 2 2 1 2
Pepper (Capsicum sp.) Anthracnose Anthracnose Bacterial leaf spot Bacterial leaf spot Blight Crown and root rot Crown and root rot Crown and root rot Crown and root rot Crown and root rot Crown and root rot Crown and root rot Crown and root rot Fruit rot
Fruit rot Fruit rot Fruit rot Impatiens Necrotic Spot Virus Powdery mildew Root rot Root rot Root rot Root rot Root rot Root rot Tomato Spotted Wilt Virus
Colletotrichum sp. Colletotrichum capsici Pseudomonas syringae Xanthomonas campestris Phytophthora capsici Fusarium sp. Fusarium oxysporum Fusarium solani Phytophthora capsici Pythium dissotocum Pythium irregulare Pythium sylvaticum Pythium ultimum Colletotrichum capsici Geotrichum sp. Pectobacterium carotovorum Phytophthora capsici Rhizopus sp. Impatiens Necrotic Spot Virus (INSV) Oidiopsis sicula Fusarium oxysporum Fusarium solani Phytophthora capsici Pythium dissotocum Pythium ultimum Rhizoctonia solani Tomato Spotted Wilt Virus (TSWV)
1 1 1 2 1 1 4 5 1 1 1 2 1 1
1 2 3 3 1 1 5 2 1 1 1 2 1
Potato (Solanum tuberosum)
Crown and root rot Dry rot Root rot Root rot Root rot Soft rot Verticillium wilt
Rhizoctonia solani Fusarium sp. Fusarium oxysporum Fusarium solani Pythium ultimum Pectobacterium carotovorum Verticillium dahliae
1 2 1 1 1 1 3
Pumpkin (Cucurbita pepo)
Anthracnose Blight Fruit rot Powdery mildew Potyvirus Squash Mosaic Virus
Colletotrichum sp. Phytophthora capsici Phytophthora capsici Oidium sp. Potyvirus Squash Mosaic Virus (SqMV)
1 1 3 1 1 1
Radish (Raphanus sativus)
Bacterial leaf spot Xanthomonas campestris 1

44
Table 1 (cont.)
Rutabaga (Brassica napus)
Downy mildew Hyaloperonospora sp. 1
Shallot (Allium cepa)
Basal rot Fusarium sp. 1
Squash (Cucurbita argyrosperma)
Powdery mildew Root rot Root rot Root rot Root rot
Oidium sp. Fusarium sp. Pythium irregulare Pythium ultimum Thielaviopsis basicola
2 1 1 1 1
Swiss chard (Beta vulgaris subsp. vulgaris)
Root rot Pythium dissotocum 1
Tomato (Lycopersicon esculentum)
Anthracnose Anthracnose Black mould Crazy root Crown rot Crown and root rot Crown and root rot Crown and root rot Crown and root rot Crown and root rot Crown and root rot Crown and root rot Crown and root rot Crown and root rot Fruit rot Fruit rot Leaf mould Pepino Mosaic Virus Pith necrosis Pospiviroid Root rot Root rot Root rot Root rot Root rot Root rot Sour rot Stem rot Tomato bacterial canker Tomato Spotted Wilt Virus Verticillium wilt
Colletotrichum dematium Colletotrichum coccodes Alternaria alternata Agrobacterium sp. Fusarium oxysporum Fusarium oxysporum Fusarium solani Phytophthora capsici Pythium sp. Pythium aphanidermatum Pythium dissotocum Pythium irregulare Pythium ultimum Rhizoctonia solani Cladosporium sp. Rhizopus sp. Fulvia fulva Pepino Mosaic Virus (PepMV) Pseudomonas marginalis Pospiviroid Fusarium oxysporum Fusarium solani Phytophthora cryptogea Pythium sp. Pythium aphanidermatum Pythium dissotocum Geotrichum sp. Pectobacterium chrysanthemi Clavibacter michiganensis subsp. michiganensis Tomato Spotted Wilt Virus (TSWV) Verticillium dahliae
2 4 1
16 1
11 4 2 1 1 6 1 3 1 7 2 1
10 1 1 7 1 1 3 1 4 5 1 6 4 1

45
Table 2. Summary of plant diseases diagnosed on fruit samples submitted to the University of Guelph Pest Diagnostic Clinic in 2016.
CROP NAME DISEASE CAUSAL AGENT NO. OF SAMPLES
Apple (Malus sp.)
Anthracnose Bitter rot Black rot Canker Canker Canker Canker Canker Canker Fire blight Leaf spot Root rot Root rot Rot
Colletotrichum sp. Colletotrichum sp. Botryosphaeria obtusa Botryosphaeria sp. Cytospora sp. Diplodia seriata Fusarium sp. Nectria cinnabarina Phomopsis sp. Erwinia amylovora Phomopsis sp. Phytophthora cactorum Pythium ultimum Trametes versicolor
1 1 12 6 5 1 1 1 20 14 1 2 3 2
Cranberry (Vaccinium sp.)
Leaf spot Pyrenobotrys compacta 3
Grape (Vitis sp.)
Black rot Grapevine Leafroll-associated Virus Grapevine Red Blotch-associated Virus
Guignardia bidwellii Grapevine Leafroll-associated Virus (GLRaV) Grapevine Red Blotch-associated Virus (GRBaV)
1 10 11
Raspberry (Rubus sp.)
Crown and root rot Crown and root rot Leaf spot Potyvirus
Phytophthora cactorum Pythium sp. Sphaerulina rubi Potyvirus
1 1 1 1
Strawberry (Fragaria sp.)
Anthracnose Anthracnose Crown rot Crown and root rot Crown and root rot Crown and root rot Crown and root rot Crown and root rot Gray mold Phytoplasma Strawberry Mild Yellow Edge Virus Strawberry Mottle Virus Strawberry Pallidosis Virus Strawberry Vein Banding Virus Root rot Root rot Root rot Verticillium wilt
Colletotrichum sp. Colletotrichum acutatum Fusarium sp. Fusarium oxysporum Fusarium solani Gnomonia sp. Phytophthora cactorum Pythium irregulare Botrytis cinerea Phytoplasma Strawberry Mild Yellow Edge Virus (SMYEV) Strawberry Mottle Virus (SMoV) Strawberry Pallidosis Virus (SPaV) Strawberry Vein Banding Virus (SVBV) Cylindrocarpon sp. Pythium ultimum Rhizoctonia solani Verticillium dahliae
3 1 3 3 1 1 2 3 2 4 3 23 3 3 4 2 1
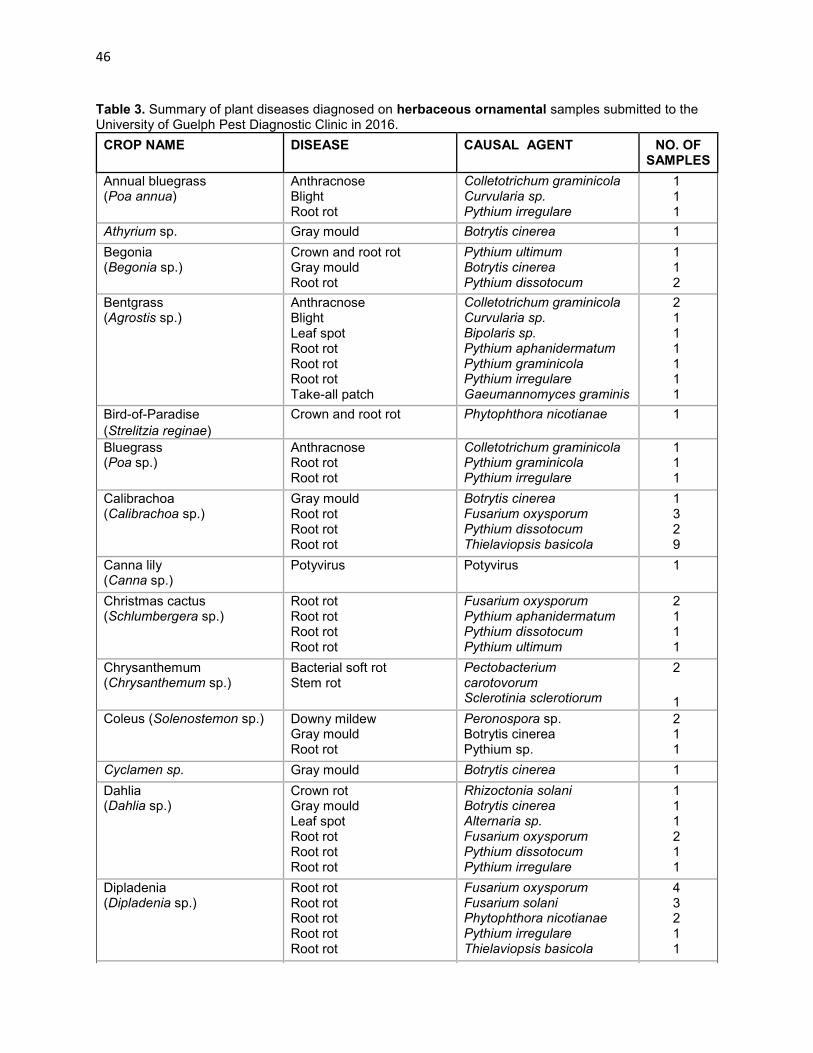
46
Table 3. Summary of plant diseases diagnosed on herbaceous ornamental samples submitted to the University of Guelph Pest Diagnostic Clinic in 2016.
CROP NAME DISEASE CAUSAL AGENT NO. OF SAMPLES
Annual bluegrass (Poa annua)
Anthracnose Blight Root rot
Colletotrichum graminicola Curvularia sp. Pythium irregulare
1 1 1
Athyrium sp. Gray mould Botrytis cinerea 1
Begonia (Begonia sp.)
Crown and root rot Gray mould Root rot
Pythium ultimum Botrytis cinerea Pythium dissotocum
1 1 2
Bentgrass (Agrostis sp.)
Anthracnose Blight Leaf spot Root rot Root rot Root rot Take-all patch
Colletotrichum graminicola Curvularia sp. Bipolaris sp. Pythium aphanidermatum Pythium graminicola Pythium irregulare Gaeumannomyces graminis
2 1 1 1 1 1 1
Bird-of-Paradise
(Strelitzia reginae)
Crown and root rot Phytophthora nicotianae 1
Bluegrass (Poa sp.)
Anthracnose Root rot Root rot
Colletotrichum graminicola Pythium graminicola Pythium irregulare
1 1 1
Calibrachoa (Calibrachoa sp.)
Gray mould Root rot Root rot Root rot
Botrytis cinerea Fusarium oxysporum Pythium dissotocum Thielaviopsis basicola
1 3 2 9
Canna lily (Canna sp.)
Potyvirus Potyvirus 1
Christmas cactus (Schlumbergera sp.)
Root rot Root rot Root rot Root rot
Fusarium oxysporum Pythium aphanidermatum Pythium dissotocum Pythium ultimum
2 1 1 1
Chrysanthemum (Chrysanthemum sp.)
Bacterial soft rot Stem rot
Pectobacterium carotovorum Sclerotinia sclerotiorum
2
1
Coleus (Solenostemon sp.) Downy mildew Gray mould Root rot
Peronospora sp. Botrytis cinerea Pythium sp.
2 1 1
Cyclamen sp. Gray mould Botrytis cinerea 1
Dahlia (Dahlia sp.)
Crown rot Gray mould Leaf spot Root rot Root rot Root rot
Rhizoctonia solani Botrytis cinerea Alternaria sp. Fusarium oxysporum Pythium dissotocum Pythium irregulare
1 1 1 2 1 1
Dipladenia (Dipladenia sp.)
Root rot Root rot Root rot Root rot Root rot
Fusarium oxysporum Fusarium solani Phytophthora nicotianae Pythium irregulare Thielaviopsis basicola
4 3 2 1 1

47
Table 3 (cont)
Echinacea (Echinacea sp.)
Root rot Tobacco Mosaic Virus
Pythium dissotocum Tobacco Mosaic Virus (TMV)
1 1
English ivy (Hedera helix)
Root rot Root rot Root rot Root rot Root rot
Fusarium oxysporum Fusarium solani Phytophthorasp. Pythium dissotocum Pythium irregulare
2 2 8 10 6
Geranium (Pelargonium sp.)
Bacterial blight Gray mould Root rot
Xanthomonas campestris Botrytis cinerea Pythium sp.
2 2 1
Gladiolus
(Gladiolus sp.)
Potyvirus Potyvirus 1
Grass (Gramineae)
Anthracnose Anthracnose Blight Blight Crown and root rot Crown and root rot Crown and root rot Crown and root rot Dollar spot Fusarium patch Leaf spot Leaf spot Necrotic ring spot Red thread Root rot Take-all patch
Colletotrichum graminicola Microdochium bolleyi Curvularia sp. Fusarium culmorum Pythium sp. Pythium aphanidermatum Pythium graminicola Pythium irregulare Sclerotinia homoeocarpa Microdochium nivale Bipolaris sp. Spermospora sp. Leptosphaeria korrae Laetisaria fuciformis Fusarium culmorum Gaeumannomyces graminis
8 5 2 4 6 7 12 8 6 13 6 1 6 3 1 1
Heuchera sp. Root rot Thielaviopsis basicola 1
Heucherella sp. Root rot Thielaviopsis basicola 1
Hibiscus sp. Leaf spot Alternaria sp. 1
Hosta (Hosta sp.)
Leaf spot Alternaria sp. 1
Kalanchoe (Kalanchoe sp.)
Root rot Stem canker
Phytophthora nicotianae Corynespora cassiicola
1 1
Lavender (Lavandula sp.)
Crown and root rot Crown and root rot Gray mould Root rot Root rot Root rot Root rot Root rot
Phytophthora nicotianae Pythium irregulare Botrytis sp. Fusarium oxysporum Fusarium solani Phytophthora sp. Pythium sp. Thielaviopsis basicola
1 1 4 1 1 1 1 4
Leucanthemum sp. Stem rot Fusarium solani 1
Lily (Lilium sp.)
Bulb and root rot Gray mould
Pythium sp. Botrytis sp.
1 1
Lisianthus (Eustoma grandiflorum)
Root rot Stem rot
Pythium sp. Fusarium oxysporum
1 1
Lobelia (Lobelia sp.)
Crown gall Agrobacterium sp. 8

48
Table 3 (cont.)
Monarda sp. Gray mould Root rot
Botrytis cinerea Thielaviopsis basicola
4 2
Morning glory (Ipomoea sp.) Crown and root rot Crown and root rot
Fusarium oxysporum Pythium sp.
2 1
Moth orchid (Phalaenopsis sp.)
Bacterial leaf spot Acidovorax avenae 1
Orchid (Orchidaceae)
Cymbidium Ringspot Virus Odontoglossum Ringspot Virus Potyvirus Tobacco Mosaic Virus
Cymbidium Ringspot Virus (CymRSV) Odontoglossum Ringspot Virus (ORSV) Potyvirus Tobacco Mosaic Virus (TMV)
1 1 1 1
Pansy (Viola sp.)
Gray mould Root rot
Botrytis cinerea Phythium sp.
1 1
Persian violet
(Exacum sp.)
Gray mould Botrytis cinerea 4
Peony
(Paeonia sp.)
Gray mould Botrytis cinerea 1
Petunia
(Petunia sp.)
Gray mould Botrytis cinerea 1
Poinsettia (Euphorbia pulcherrima)
Crown and root rot Crown and root rot Crown and root rot Crown and root rot Crown and root rot Root rot Root rot
Fusarium sp. Fusarium oxysporum Fusarium solani Pythium irregulare Rhizoctonia solani Fusarium oxysporum Pythium aphanidermatum
1 11 1 1 2 1 3
Potentilla
(Potentilla sp.)
Root rot Phytophthora drechsleri 1
Sage
(Salvia sp.)
Potyvirus Potyvirus 1
Sedum (Sedum sp.)
Anthracnose Crown and root rot Crown and root rot Crown and root rot Gray moldmould Powdery mildew Root rot Root rot Root rot Root rot Root rot Stem rot
Colletotrichum sp. Fusarium oxysporum Fusarium solani Pythium dissotocum Botrytis cinerea Oidium sp. Fusarium oxysporum Fusarium solani Pythium irregulare Pythium ultimum Rhizoctonia solani Fusarium sp.
1 1 1 2 1 2 4 3 4 3 3 1
Senna corymbosa Potyvirus Potyvirus 1
Snapdragon (Antirrhinum sp.)
Root rot Root rot
Fusarium oxysporum Thielaviopsis basicola
1 2
Spurge (Euphorbia sp.)
Root rot Root rot
Fusarium solani Thielaviopsis basicola
1 1

49
Table 3 (cont.)
Sweet potato vine
(Ipomoea butatas)
Crown and root rot Fusarium oxysporum 1
Sweet woodruff (Galium odoratum)
Downy mildew Root rot
Peronospora sp. Pythium ultimum
1 1
Vinca sp. Arabis Mosaic Virus Cucumber Mosaic Virus
Arabis Mosaic Virus (ArMV) Cucumber Mosaic Virus (CMV)
1 2

50
Table 4. Summary of plant diseases diagnosed on woody ornamental samples submitted to the University of Guelph Pest Diagnostic Clinic in 2016.
CROP NAME DISEASE CAUSAL AGENT NO. OF SAMPLES
Balsam poplar
(Populus balsamifera)
Canker Cytospora sp. 1
Black cherry (Prunus serotina)
Root rot Root rot Root rot
Fusarium oxysporum Fusarium solani Pythium ultimum
1 1 1
Boxwood (Buxus sp.)
Blight Canker Dieback Leaf blight Root rot Root rot Root rot Root rot Root rot Root rot Root rot
Fusarium sp. Volutella buxi Phoma sp. Volutella buxi Fusarium oxysporum Phytophthora sp. Phytophthora nicotianae Pythium sp. Pythium dissotocum Pythium irregulare Thielaviopsis basicola
4 19 4 47 6 1 3 1 2 1 6
Colorado blue spruce (Picea pungens)
Needlecast Needlecast Needlecast Tip blight
Rhizosphaera kalkhoffii Setomelanomma holmii Stigmina sp. Sphaeropsis sapinea
6 2 3 1
Cornus sericea Leaf spot Septoria cornicola 1
Cotoneaster (Cotoneaster sp.)
Canker Phomopsis sp. 1
Crabapple (Malus sp.)
Canker Fire blight Scab
Botryosphaeria sp. Erwinia amylovora Venturia inaequalis
2 1 2
Dogwood (Cornu ssp.)
Leaf spot Septoria sp. 1
Deutzia gracilis Root rot Root rot
Fusarium solani Pyhium dissotocum
1 1
Douglas fir (Pseudotsuga menziesii)
Root rot Thielaviopsis basicola 1
Eastern white cedar (Thuja occidentalis)
Needle blight Tip blight
Phyllosticta thujae Pestalotiopsis sp.
1 1
Eastern white pine (Pinus strobus)
Root rot Root rot Root rot
Fusarium oxysporum Fusarium solani Pythium sp.
1 1
Elm (Ulmus sp.)
Canker Dutch elm disease
Botryosphaeria sp. Ophiostoma sp.
1 1
Euonymus (Euonymus sp.)
Bacterial leaf spot Powdery mildew
Pseudomonas syringae Oidium sp.
1 1
Forsythia (Forsythia sp.)
Root rot Root rot Root rot
Fusarium oxysporum Fusarium solani Phytophthora nicotianae
1 1 1
Fraser fir (Abies fraseri) Root rot Root rot
Fusarium oxysporum Pythium irregular
1 1

51
Table 4 (cont.)
Hazelnut (Corylus sp.)
Bacterial blight Bacterial blight Powdery mildew
Xanthomonas arboricola Xanthomonas campestris Phyllactinia guttata
1 1 1
Heather (Calluna vulgaris)
Gray mould Botrytis cinerea 1
Honey locust (Gleditsia triacanthos)
Canker Thyronectria austro-americana
1
Honeysuckle (Lonicera sp.)
Root rot Fusarium sp. 1
Hornbeam (Carpinus sp.)
Anthracnose Monostichella robergei 1
Hydrangea (Hydrangea sp.)
Bacterial leaf blight Crown and root rot Gray mould Hydrangea Ringspot Virus Leaf spot Root rot Root rot
Pseudomonas cichorii Pythium aphanidermatum Botrytis cinerea Hydrangea Ringspot Virus (HdRSV) Phoma sp. Fusarium oxysporum Pythium irregulare
1 2 3 1 2 1 1
Ironwood (Ostrya virginiana)
Anthracnose Monostichella robergei 1
Japanese kerria (Kerria japonica)
Twig and leaf blight Blumeriella kerriae 1
Juniper (Juniperus sp.)
Tip blight Diplodia sp. 1
Larch (Larix sp.)
Gray mould Root rot
Botrytis sp. Thielaviopsis basicola
1 1
Lilac (Syringa vulgaris)
Root rot Root rot Root rot Root rot
Phytophthora sp. Phytophthora cryptogea Pythium dissotocum Pythium irregulare
2 1 3 1
London plane tree (Platanus x acerifolia)
Powdery mildew Oidium sp. 1
Mountain ash (Sorbus sp.)
Canker Nectria cinnabarina 1
Northern catalpa (Catalpa speciosa)
Canker and dieback Botryosphaeria obtusa 1
Norway spruce (Picea abies)
Needlecast Rhizosphaera kalkhoffii 4
Pagoda dogwood (Cornus alternifolia)
Root rot Root rot Root rot Root rot
Fusarium oxysporum Fusarium solani Phytophthora sp. Pythium ultimum
1 1 1 1
Pea shrub (Caragana sp.)
Bacterial canker Pseudomonas syringae 1
Pinus sp. Tip blight Diplodia sp. 5
Poplar (Populus sp.)
Crown gall Agrobacterium sp. 1
Prunus sp. Dieback Phomopsis sp. 1
Purple-leaf sand cherry (Prunus x cistena)
Crown and root rot Rhizoctonia solani 1

52
Table 4 (cont.)
Red osier dogwood (Cornus sericea)
Bacterial leaf spot Root rot
Pseudomonas syringae Phytophthora sp.
2 1
Red pine (Pinus resinosa)
Root rot Root rot
Fusarium oxysporum Fusarium solani
1 1
Rose (Rosa sp.)
Powdery mildew Rose rosette disease
Oidium sp. Rose Rosette Virus (RRV)
2 1
Scarlet oak (Quercus coccinea)
Canker Botryosphaeria sp. 1
Serviceberry (Amelanchier sp.)
Canker Biscogniauxia sp. 1
Silver maple (Acer saccharinum)
Leaf spot Phyllosticta sp. 1
Spirea (Spirea sp.)
Root rot Root rot
Fusarium sp. Phytophthora nicotianae
1 1
Spruce (Picea sp.)
Blight Needlecast Needlecast Needlecast Root rot Root rot Root rot Root rot Root rot Root rot
Phoma sp. Lophodermium sp. Rhizosphaera kalkhoffii Setomelanomma holmii Fusarium oxysporum Fusarium solani Phytophthora sp. Phytophthora cryptogea Pythium dissotocum Thielaviopsis basicola
1 1 1 2 2 1 1 1 2
Sugar maple (Acer saccharum)
Canker Wilt
Cytospora chryosperma Verticillium sp.
1 1
Tartarian dogwood (Cornus alba)
Bacterial leaf spot Leaf spot
Pseudomonas syringae Septoria sp.
2 1
Tartarian maple (Acer tataricum)
Anthracnose Aureobasidium apocryptum 1
Viburnum lentago Root rot Root rot Root rot Root rot
Phytophthora cactorum Pythium sp. Pythium ultimum Thielaviopsis basicola
2 1 1 2
White oak (Quercus alba)
Anthracnose Apiognomonia quercina 1
White pine (Pinus strobus)
White pine blister rust Cronartium ribicola 1
Willow (Salix sp.)
Canker Canker
Cytospora sp. Glomerella miyabeana
1 1
Winterberry (Gaultheria sp.)
Anthracnose Dieback Dieback
Colletotrichum sp. Pestalotiopsis sp. Phoma sp.
1 1 1
Witch hazel (Hamamelis virginiana)
Root rot Root rot Root rot Root rot
Phytophthora cactorum Phytophthora drechsleri Pythium aphanidermatum Thielaviopsis basicola
1 1 1 1

53
Table 5. Summary of plant diseases diagnosed onfield cropsamples submitted to the University of Guelph Pest Diagnostic Clinic in 2016.
CROP NAME DISEASE CAUSAL AGENT NO. OF SAMPLES
Adzuki bean (Vigna angularis)
Anthracnose Brown spot Charcoal rot Stem rot
Colletotrichum sp. Pseudomonas syringae pv. Syringae Macrophomina phaseolina Fusarium sp.
1 3 1 2
Barley (Hordeum vulgare)
Crown and root rot Crown and root rot Crown and root rot Root rot
Bipolaris sp. Fusarium culmorum Rhizoctonia solani Pythium sp.
1 1 1 1
Bean (Phaseolus vulgaris)
Anthracnose Colletotrichum sp. 1
Corn (Zea mays)
Anthracnose Northern corn leaf blight Northern corn leaf spot Root rot Rust
Colletotrichum graminicola Exserohilum turcicum Bipolaris zeicola Pythium aphanidermatum Puccinia sorghi
4 2 3 1 1
Oats (Avena sativa)
Crown rust Crown and root rot
Puccinia coronate Pythium sylvaticum
17 1
Quinoa (Chenopodium quinoa)
Downy mildew Peronospora sp. 1
Soybean (Glycine max)
Anthracnose Brown spot Crown and root rot Crown and root rot Crown and root rot Crown and root rot Crown and root rot Charcoal rot Root rot Root rot Root rot Root rot Root rot Root rot Seed decay
Colletotrichum sp. Septoria glycines Fusarium oxysporum Fusarium solani Pythium irregulare Pythium ultimum Rhizoctonia solani Macrophomina phaseolina Fusarium oxysporum Fusarium solani Phytophthora sp. Pythium sp. Pythium irregulare Thielaviopsis basicola Phomopsis longicolla
1 2 1 1 1 1 1 1 2 4 3 1 1 1 1
Sugar beet (Beta vulgaris)
Root rot Root rot Root rot
Fusarium oxysporum Fusarium solani Rhizoctonia solani
2 1 1
Wheat (Triticum sp.)
Blotch Root rot Root rot Root rot Root rot Root rot Root rot Root rot Rust Snow mould Tan spot
Septoria sp. Fusarium culmorum Fusarium oxysporum Fusarium solani Pythium irregulare Pythium sylvaticum Pythium tracheiphilum Pythium ultimum Puccinia sp. Microdochium nivale Drechslera tritici-repentis
1 1 1 1 1 1 3 1 1 2 1

54
Table 6. Summary of plant diseases diagnosed on herb and special crop samples submitted to the University of Guelph Pest Diagnostic Clinic in 2016.
CROP NAME DISEASE CAUSAL AGENT NO. OF SAMPLES
Basil (Ocimum basilicum)
Gray mould Botrytis sp. 1
Centrapalus sp. Crown and root rot Crown and root rot Stem blight
Fusarium oxysporum Pythium ultimum Phomopsis sp.
1 1 1
Ginseng (Panax sp.)
Leaf blight Root rot Root rot Root rot Root rot Root rot Root rot
Phytophthora cactorum Fusarium oxysporum Fusarium solani Phytophthora sp. Pythium sp. Pythium dissotocum Pythium irregulare Pythium ultimum
1 6 3 1 1 1 4 2
Goldseal (Hydrastis canadensis)
Root rot Root rot
Fusarium oxysporum Pythium intermedium
1 1
Hop (Humulus lupulus)
Apple Mosaic Virus Crown rot Crown rot Hop Mosaic Virus Hop Stunt Viroid
Apple Mosaic Virus (ApMV) Fusarium oxysporum Fusarium solani Hop Mosaic Virus (HpMV) Hop Stunt Viroid (HSVd)
13 1 1 3 2
55
CROP / CULTURE: Muck Crops Research Station report LOCATION / RĖGION: Bradford/Holland Marsh, Ontario NAMES AND AGENCY: M. Chandran, D. Van Dyk, and M.R. McDonald
Muck Crops Research Station, University of Guelph, 1125 Woodchoppers Lane, King ON L7B 0E9 Telephone: (905) 775-3783; Facsimile: (905) 775-4546; Email: [email protected]; Website: www.uoguelph.ca/muckcrop/ TITLE: DISEASES DIAGNOSED ON PLANT SAMPLES SUBMITTED TO THE MUCK CROPS RESEARCH STATION IN 2016 ABSTRACT: As part of the Integrated Pest Management (IPM) program provided by the Muck Crops Research Station (MCRS), diagnostics service is provided to vegetable growers around the Holland Marsh/Bradford, Ontario. In 2016,121 samples were submitted to the MCRS for identification and possible control recommendations. Samples included plants with disease and physiological disorders. This report covers diseases and physiological disorders diagnosed on plant samples submitted to the MCRS. INTRODUCTION AND METHODS: As part of the Integrated Pest Management program, the Muck Crops Research Station provides diagnosis and control recommendations for diseases of vegetable crops to growers in the Bradford/Holland Marsh and surrounding area of Ontario. The program objectives are to scout grower’s fields, provide growers with disease and insect forecasting information and to identify and diagnose diseases, insect pests and weeds. Samples are submitted to the MCRS by IPM scouts, growers, agribusiness representatives and crop insurance agents. Disease diagnoses are based on a combination of visual examination of symptoms, microscopic observations and culturing onto growth media. RESULTS AND COMMENTS: From 5 February to 3 November, 2016, the MCRS received 121 samples for diagnosis. Of these, 71% were diseases (86 samples) and 29% physiological disorders (35 samples). These samples were associated with the following crops: onion (47.9%), carrot (31.4%), celery (5.8%), tomato (4.1%) and other crops (10.8%). Weather conditions in the 2016 growing season were hot and dry which is not conducive for the development of many fungal pathogens. There was below average rainfall May to September and dry conditions. A summary of diseases diagnosed and causal agents on crop samples submitted to the MCRS in 2016 is presented in Table 1.
ACKNOWLEDGEMENTS: This project was funded in part through Growing Forward 2 (GF2), a federal-provincial-territorial initiative. The Agricultural Adaptation Council assists in the delivery of GF2 in Ontario. Funding was also provided in part by the Bradford Cooperative Storage Ltd., agrochemical companies and growers participating in the Muck Crops Research Station IPM program.

56
Table 1: Summary of diseases diagnosed on plants submitted to the Muck Crops Research Station in 2016.
CROP
DISEASE
CAUSAL AGENT
NUMBER OF
SAMPLES
Beet Excessive hairy roots Pythium spp. 1
Cabbage Bottom rot Rhyzoctonia solani 1
Carrot Aster yellows Black rot Carrot cyst nematode Cavity spot Root knot nematode Lesion nematode Leaf blight Growth crack (split) Pythium root dieback Chemical injury
Phytoplasma Alternaria radicina Heterodera carotae Pythium spp. Meloidogyne hapla Pratylenchus penetrans Alternaria dauci and Cercospora carotae Fluctuating moisture level Pythium spp. Herbicide damage
11 1 1 2 1 1 11 4 1 5
Celery Celery leaf curl Pink rot Blackheart
Colletotrichum spp. Sclerotinia sclerotiorum Calcium deficiency
3 2 2
Cucumber (high tunnel) Physiological disorder High salt content in soil 1
Garlic Stem and bulb nematode Ditylenchus dipsaci 1
Lettuce Bacterial rot Erwinia carotovora 1
Sunflower sprouts Leaf blight Alternaria sp. 1
Onion Stemphylium leaf blight Pink root Purple blotch Botrytis leaf blight White rot Bacterial rot/soft rot Tip burn Smut Chemical injury Environmental injury
Stemphylium vesicarium Phoma terrestris Alternaria porri Botrytis squamosa Sclerotium cepivorum Erwinia carotovora Heat stress Urocystis cepulae Herbicide damage Pelting rain injury/wind
14 7 9 1 2 3 7 4 6 5
Parsnip Canker in storage Itersonilia perplexans 1
Potato Early blight Dry rot
Alternaria solani Fusarium sp.
2 1
Swiss chard (green) Physiological disorder Possible herbicide injury 1
Spinach Physiological disorder Micronutrient deficiency 1
Tomato Physiological disorder High soil moisture 1
Tomato (high tunnel) Physiological disorder Weak plant Wilt Early blight
High salt content in soil Nutrient deficiency Fusarium oxysporum Alternarium solani
1 1 1 1
Turnip Club root Plasmodiophora brassicae 1
DISEASED SAMPLES ABIOTIC AND OTHER DISORDERS
86 35
TOTAL SUBMISSIONS 121

57
CULTURES / CROP: Échantillons reçus en 2016 au Laboratoire de diagnostic en phytoprotection RÉGION / LOCATION: Québec NOMS ET ÉTABLISSEMENT: A.M. Breton, A. Dionne, J. Vivancos, J. Caron et D. Hamel Laboratoire de diagnostic en phytoprotection, ministère de l'Agriculture, des Pêcheries et de l'Alimentation du Québec (MAPAQ), Complexe scientifique, 2700, rue Einstein - D.1.200h, Québec (Québec) G1P 3W8 Téléphone: 418 643-5027; Télécopieur: 418 646-6806; Courriel: [email protected]; [email protected] Sites Internet: http://www.mapaq.gouv.qc.ca/fr/Productions/Protectiondescultures/diagnostic/Pages/diagnostic.aspx http://www.agrireseau.qc.ca/lab/ TITRE: MALADIES ET PROBLÈMES ABIOTIQUES DIAGNOSTIQUÉS SUR LES ÉCHANTILLONS DE PLANTES REÇUS EN 2016 AU LABORATOIRE DE DIAGNOSTIC EN PHYTOPROTECTION DU MAPAQ RÉSUMÉ: Du 1er janvier au 20 octobre 2016, parmi 1663 échantillons traités par la section phytopathologie du laboratoire; une proportion importante d’échantillons (40 %) étant soumis pour la détection d’un ou de plusieurs agents phytopathogènes spécifiques. Tandis que 60 % des échantillons étaient soumis pour le diagnostic de problématiques phytosanitaires inconnues du client. Les échantillons reçus comprennent les plantes maraîchères (serres et champs), les petits fruits, les grandes cultures, les plantes fourragères, les arbres et arbustes fruitiers, les graminées à gazon, les plantes herbacées, les arbres et les arbustes ornementaux (serres et pépinières) ainsi que les plantes aromatiques et médicinales. MÉTHODES: Le Laboratoire de diagnostic en phytoprotection du ministère de l’Agriculture, des Pêcheries et de l’Alimentation du Québec (MAPAQ) offre un service de diagnostic des maladies parasitaires pour les producteurs, conseillers, particuliers et instances gouvernementales. Les données rapportées présentent les maladies identifiées sur les échantillons de plantes reçues jusqu’à présent en 2016. Tous les échantillons de diagnostic font l’objet d’un examen visuel préalable suivi généralement d’un examen à la loupe binoculaire. Selon les symptômes, un ou plusieurs tests diagnostiques sont réalisés dans le but de détecter ou d’identifier l’agent ou les agents phytopathogène(s). Voici les principaux tests utilisés afin d’appuyer le diagnostic : les nématodes vermiformes sont extraits du sol et des tissus végétaux par entonnoir de Baermann tandis que les nématodes à kystes sont extraits du sol à l’aide d’un appareil de Fenwick. Les genres et espèces (lorsque possible) sont identifiés par microscopie et par des techniques de biologie moléculaire Polymerase Chain Reaction (PCR). Les champignons sont isolés sur des milieux de culture gélosés, identifiés selon leurs caractéristiques morphologiques ou par des techniques de biologie moléculaire (PCR et séquençage d’ADN). Les bactéries sont isolées sur des milieux de culture gélosés puis identifiées par des tests biochimiques BiologR ou à l’aide des tests sérologiques Enzyme-Linked immunosorbent Essay (ELISA) et de techniques de biologie moléculaire (PCR et séquençage d’ADN). Les phytoplasmes sont détectés par des techniques de biologie moléculaire (PCR et séquençage d’ADN). Les virus sont, quant à eux, détectés par des tests sérologiques ELISA ou par PCR. RÉSULTATS ET DISCUSSIONS: Les tableaux 1 à 12 présentent le sommaire des maladies identifiées sur les échantillons de plantes reçus. Au tableau 1, les maladies des plantes maraîchères de plein champ regroupent aussi les transplants provenant des serres et des pépinières. Les maladies des légumes entreposés, listées au tableau 2, incluent les légumes de courte et de longue durée d’entreposage. Au tableau 11, les plantes ornementales d’extérieur (pépinière, aménagement paysager) et d’intérieur (serriculture) sont essentiellement des espèces herbacées annuelles ou vivaces.

58
Le nombre de maladies rapportées ne correspond pas au nombre d’échantillons réellement reçus et traités puisque plus d’une maladie peut être identifiée sur un échantillon. De plus, les diagnostics dont les causes sont indéterminées ou incertaines ou que les résultats de détection sont négatifs n’ont pas été inclus dans ce rapport. Il est à noter que les problèmes abiotiques diagnostiqués sur les échantillons sont de nature hypothétique. Il peut s’agir de stress culturaux regroupent entre autres les désordres minéraux, les pH et les conductivités électriques de sols et de solutions nutritives inadéquats, les structures de sols inadaptées, les phytotoxicités causées par l’usage de produits phytosanitaires, une irrigation inappropriée, les blessures mécaniques, etc. Les stress climatiques pour leur part concernent les insolations, le gel, le froid et l’excès de chaleur, les polluants atmosphériques, l’intumescence (œdème), l’asphyxie racinaire, les orages violents, les vents forts et la grêle blessant les feuilles. Ces diagnostics sont établis en fonction d’observation de symptômes caractéristiques, de résultats tests et/ou de discussions avec le client. REMERCIEMENTS: Les auteurs remercient François Bélanger, Marion Berrouard, Chantal Malenfant, Michel Lemieux, Carolle Fortin et Linda Généreux pour leur support technique.
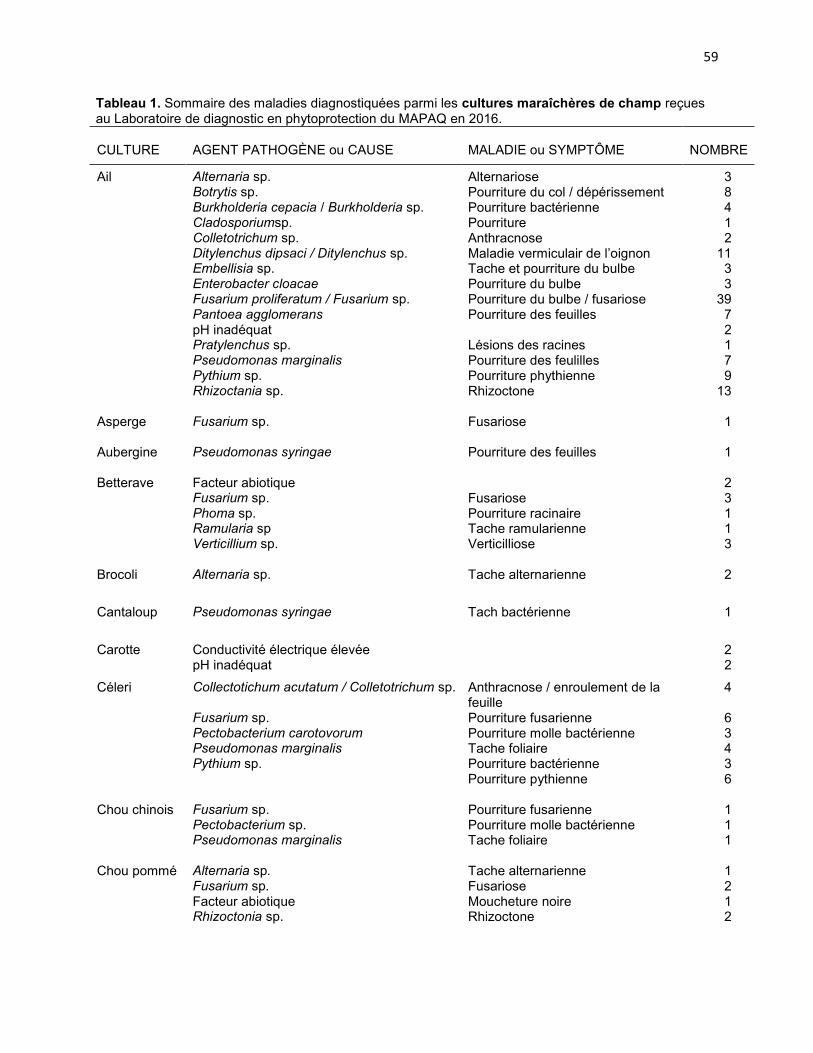
59
Tableau 1. Sommaire des maladies diagnostiquées parmi les cultures maraîchères de champ reçues au Laboratoire de diagnostic en phytoprotection du MAPAQ en 2016.
CULTURE
AGENT PATHOGÈNE ou CAUSE
MALADIE ou SYMPTÔME
NOMBRE
Ail Alternaria sp. Botrytis sp. Burkholderia cepacia / Burkholderia sp. Cladosporiumsp. Colletotrichum sp. Ditylenchus dipsaci / Ditylenchus sp. Embellisia sp. Enterobacter cloacae Fusarium proliferatum / Fusarium sp. Pantoea agglomerans pH inadéquat Pratylenchus sp. Pseudomonas marginalis Pythium sp. Rhizoctania sp.
Alternariose Pourriture du col / dépérissement Pourriture bactérienne Pourriture Anthracnose Maladie vermiculair de l’oignon Tache et pourriture du bulbe Pourriture du bulbe Pourriture du bulbe / fusariose Pourriture des feuilles Lésions des racines Pourriture des feulilles Pourriture phythienne Rhizoctone
3 8 4 1 2 11 3 3 39 7 2 1 7 9 13
Asperge Fusarium sp. Fusariose 1
Aubergine Pseudomonas syringae Pourriture des feuilles 1
Betterave Facteur abiotique Fusarium sp. Phoma sp. Ramularia sp Verticillium sp.
Fusariose Pourriture racinaire Tache ramularienne Verticilliose
2 3 1 1 3
Brocoli Alternaria sp. Tache alternarienne 2
Cantaloup Pseudomonas syringae Tach bactérienne 1
Carotte Conductivité électrique élevée pH inadéquat
2 2
Céleri Collectotichum acutatum / Colletotrichum sp. Fusarium sp. Pectobacterium carotovorum Pseudomonas marginalis Pythium sp.
Anthracnose / enroulement de la feuille Pourriture fusarienne Pourriture molle bactérienne Tache foliaire Pourriture bactérienne Pourriture pythienne
4 6 3 4 3 6
Chou chinois Fusarium sp. Pectobacterium sp. Pseudomonas marginalis
Pourriture fusarienne Pourriture molle bactérienne Tache foliaire
1 1 1
Chou pommé Alternaria sp. Fusarium sp. Facteur abiotique Rhizoctonia sp.
Tache alternarienne Fusariose Moucheture noire Rhizoctone
1 2 1 2

60
Tableau 1 cont’d
CULTURE
AGENT PATHOGÈNE ou CAUSE
MALADIE ou SYMPTÔME
NOMBRE
Ciboulette Fusarium oxysporum Pythium sp.
Fusariose Pourriture pythienne
1 1
Citrouille / Courge à moelle
Colletotrichum sp. Fusarium sp. Phytophthora capsici PythiumI sp.
Anthracnose Fusariose Pourriture des fruits Pourriture pythienne
1 2 1 1
Concombre Alternaria cucumerina / Alternaria sp. Erwinia tracheiphila Facteur abiotique Fusarium sp. Geotrichum sp. Oedème Pectobacterium carotovorum / Pectobacterium sp. Phoma sp. Plectosporium sp. Pseudomonas sp. / Pseudomonas syringae Pseudoperonospora sp. Pythium sp. Sclerotinia sp.
Tache alternarienne Flérussenebt bactérien Pourriture fusarienne Pourriture aquese Pourriture molle bactérienne Pourriture noire Brȗlure plectosporienne Tache foliaire et pourriture bactérienne Mildiou Pourriture phythienne Sclérotiniose
2 1 1 6 1 1 2 1 3 2 2 5 1
Courge Alternaria sp. Cladosporium sp. Colletotrichum sp. Facteur abiotique Fusarium equiseti / Fusarium sp. Geotrichum candicum / Geotrichum sp. Pectobacterium carotovorum Phytophthora capsici / Phytophthora sp. Potyvirus Pseudomonas syringae Septoria sp.
Tach alternarienne Gale Anthracnose Fusariose Pourriture aqueuse Pourriture molle bactérienne Pourriture des fruits Anomalie de coloration sur fruit Tache foliaire Tache septorienne
5 1 1 2 9 3 2 5 1 1 2
Courgette Alternaria sp. Cladosporium sp. Fusarium sp. Facteur abiotique Oidium sp. Pectobacterium carotovorum / Pectobacterium sp. Phoma sp. Phytophthora capsici / Phytophthora sp. Pseudomonas syringae Pythium sp.
Tach alternarienne Gale Pourriture fusarienne Macule physiologique Blanc Pourriture molle bactérienne Pourriture noir Pourriture des fruits Tache foliaire et sur frit Pourriture de fruit
2 14 2 1 1 2 1 4 2 1

61
Tableau 1 cont’d
CULTURE
AGENT PATHOGÈNE ou CAUSE
MALADIE ou SYMPTÔME
NOMBRE
Ėpinard
Fusarium sp. Pythium sp.
Pourriture fusarienne Pourriture pythienne
2 2
Gourgane / féverole
Alternaria sp. Bortrytis sp. Cladosporium sp. Colletotrichum sp. Cylindrocarpon sp. Fusarium sp. Helicotylenchus sp. Meloidogyne sp. Pratylenchus sp. Pythium sp. Rhizoctonia sp.
Tache alternarienne Pourriture grise Pourriture Anthracnose Pourriture racinaire Fusariose Nématode spiralé Nodosité racinaire Lésions des racines Pourriture pythienne Rhizoctone
1 1 4 1 3 6 4 3 4 3 6
Haricot / haricot adzuki
Fusarium sp. Pseudomonas syringae Facteur abiotique
Fusariose Tache foliaire
2 4 1
Laitue romaine Bremia lactucae Fusarium sp. Pseudomonas cichorii Pseudomonas syringae Pythium sp.
Mildiou Fusariose Tache foliaire Tache foliaire Pourriture pythienne
1 1 1 1 1
Melon / melon d’eau / Pastèque
Alternaria cucumerina Erwinia tracheiphila Fusarium sp. Rhizoctonia sp.
Alternariose Flétrissement bactérien Fusariose Rhizoctone
1 2 4 2
Oignon / oignon espagnol
Burkholderia gladioli Enterobacter cloacae Fusarium sp. Pantoea agglomerans Penicillium sp. Pythium sp.
Pourriture bactérienne Oourriture du bulbe Pourriture fusarienne Pourriture des feuilles Pourriture du bulbe Pourriture pythienne
2 3 11 1 3 1
Piment (piment fort)
Fusarium sp. Phytophthora sp.
Fusariose Pourriture des fruits
2 2
Poireau Fusarium sp. Fusariose 3
Pois vert / Petit pois
Fusarium sp. Fusariose 2
Poivron (piment doux)
Fusarium solani / Fusarium sp. Phytophthora capsici / Phytophthora sp. Polluant gazeux – ozone Rhizoctonia sp. Xanthomonas campestris
Fusariose Pourriture des fruits Rhizoctone Tache bactérienne
4 5 2 3 1

62
Tableau 1 cont’d
CULTURE
AGENT PATHOGÈNE ou CAUSE
MALADIE ou SYMPTÔME
NOMBRE
Pomme de terre
Cladosporium sp. Colletotrichum sp. Facteur abiotique Facteur abiotique Fusarium graminearum / Fusarium sp. Geotrichum sp. Helminthosporiumsp. PMTV (Potato Mo—Top Virus) Pectobacterium atrosepticum / Pectobac- terium carotovorum / Pectobacterium sp. Phytophthora sp. Pythium sp. Spongospora subterranea Streptomysces sp. Verticillim sp.
Pourriture Dartrose Cœur noir Fusariose Pourriture caoutchouc Gale argentée Anneaux bruns dans le tuberclue Pourriture molle bactérienne / jambe noire Pourriture rose Pourriture aqueuse Gale poudreuse Gale commune Verticilliose
1 5 1 2 17 10 1 1 14 3 6 1 1 8
Rhubarbe ArMV (Arabis Mosaic Virus) Colletotrichum sp. Cylindrocarphon sp. Helicotylenchus sp. Paratylenchus sp. Pratylenchus sp. Rhizoctonia sp. ToRSV (Tomato Ringspot Virus) Xiphinema sp.
Anomalie de coloration foliaire Anthracnose Pourriture racinaire Nématode spiralé Nématode épingle Lésions des racines Rhizoctone Anomalie de coloration foliaire Nématode dague
1 6 4 4 4 4 3 2 4
Roquette Fusarium sp. Pourriture fusarienne 1
Scarole / chicorée scarole
Facteur abiotique 2
Tomate Alternaria alternata Clavibacter michiganensis subsp. Michiganensis Fusarium sp. Pythium sp.
Taches foliaires Chancre bactérien de la tomate Fusariose Pourriture pythienne
1 2 6 4
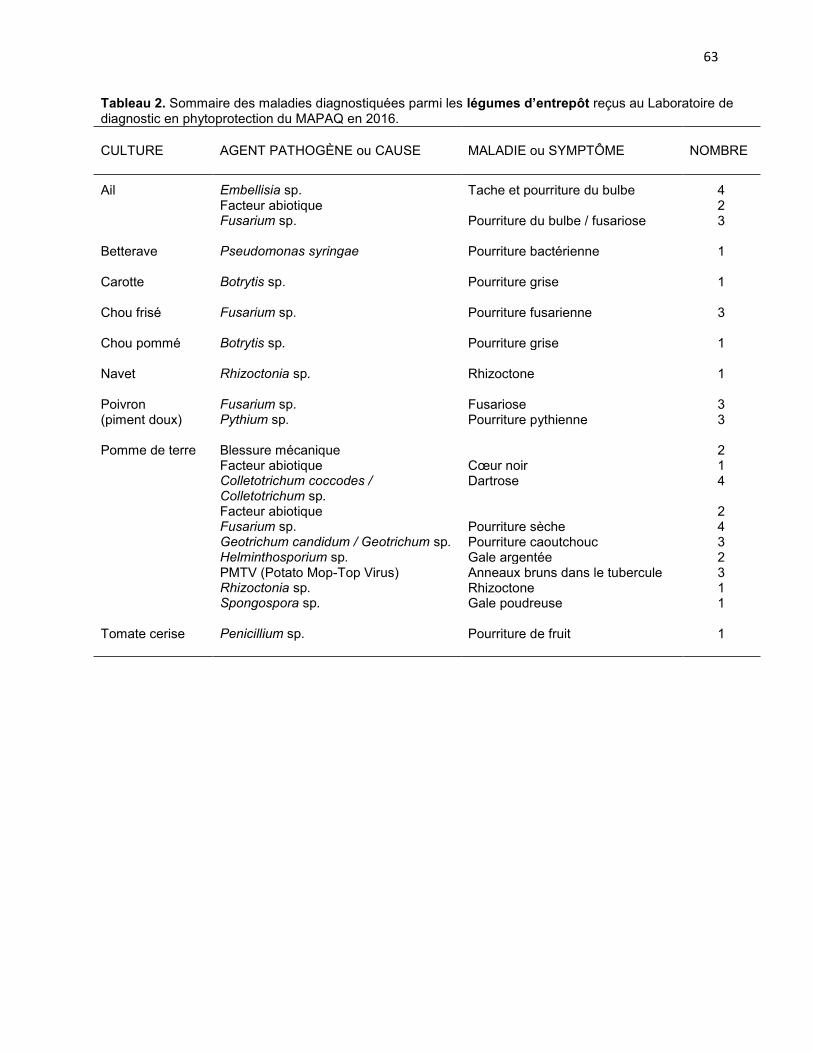
63
Tableau 2. Sommaire des maladies diagnostiquées parmi les légumes d’entrepôt reçus au Laboratoire de diagnostic en phytoprotection du MAPAQ en 2016.
CULTURE AGENT PATHOGÈNE ou CAUSE MALADIE ou SYMPTÔME NOMBRE
Ail Embellisia sp. Tache et pourriture du bulbe 4 Facteur abiotique 2 Fusarium sp. Pourriture du bulbe / fusariose 3 Betterave Pseudomonas syringae Pourriture bactérienne 1 Carotte Botrytis sp. Pourriture grise 1 Chou frisé Fusarium sp. Pourriture fusarienne 3 Chou pommé Botrytis sp. Pourriture grise 1 Navet Rhizoctonia sp. Rhizoctone 1 Poivron Fusarium sp. Fusariose 3 (piment doux) Pythium sp. Pourriture pythienne 3 Pomme de terre Blessure mécanique 2 Facteur abiotique Cœur noir 1 Colletotrichum coccodes /
Colletotrichum sp. Dartrose 4
Facteur abiotique 2 Fusarium sp. Pourriture sèche 4 Geotrichum candidum / Geotrichum sp. Pourriture caoutchouc 3 Helminthosporium sp. Gale argentée 2 PMTV (Potato Mop-Top Virus) Anneaux bruns dans le tubercule 3 Rhizoctonia sp. Rhizoctone 1 Spongospora sp. Gale poudreuse 1 Tomate cerise Penicillium sp. Pourriture de fruit 1

64
Tableau 3. Sommaire des maladies diagnostiquées parmi les plantes maraîchères de serre reçues au Laboratoire de diagnostic en phytoprotection du MAPAQ en 2016.
CULTURE AGENT PATHOGÈNE ou CAUSE MALADIE ou SYMPTÔME NOMBRE
Ail Botrytis sp. Pourriture du col / Dépérissement
1
Enterobacter cloacae Pourriture du bulbe 4 Fusarium sp. Pourriture du bulbe / fusariose 8 Bok Choy / Facteur abiotique 1 pak choi Pseudomonas marginalis Tache foliaire 1 Verticillium sp. Verticilliose 1 Chou pommé Alternaria brassicicola Tache alternarienne 3 Ciboulette Fusarium graminearum Fusariose 1 Concombre Cladosporium cucumerinum / Cladosporium sp. Gale 5 Conductivité électrique élevée 3 Erwinia tracheiphila Flétrissement bactérien 2 Fusarium oxysporum / Fusarium sp. Fusariose 11 Pectobacterium carotovorum Pourriture molle bactérienne 2 Pythium sp. Pourriture pythienne 5 Ulocladium sp. Tache foliaire 2 Laitue Fusarium sp. Fusariose 6 Phytophthora cryptogea Pourriture phytophthoréenne 4 Pythium dissotocum Pourriture pythienne 8 Piment Xanthomonas campestris Tache bactérienne 1 (piment fort) Poivron Fusarium sp. Fusariose 1 (piment doux) pH inadéquat 2 Pomme de terre Colletotrichum sp. Dartrose 2 Tomate Clavibacter michiganensis subsp.
michiganensis Chancre bactérien de la tomate 8
Colletotrichum sp. Anthracnose 1 Facteur abiotique 3 Fusarium oxysporum / Fusarium sp. /
Fusarium sporotrichioides Fusariose 11 Facteur abiotique Moucheture dorée 1 Oedème 3 PepMV (Pepino Mosaic Virus) Multisymptomatique 15 Pseudomonas sp. Anomalie de coloration tige 1 Pythium sp. / Pythium ultimum Pourriture pythienne 5 TSWV (Tomato Spotted Wilt Virus) Anomalie de coloration et
brûlure foliaire
2

65
Tableau 4. Sommaire des maladies diagnostiquées parmi les petits fruit reçues au Laboratoire de diagnostic en phytoprotection du MAPAQ en 2016.
CULTURE AGENT PATHOGÈNE ou CAUSE MALADIE ou SYMPTÔME NOMBRE
Amélanchier Nectria cinnabarina Chancre de tige 3
Argousier Alternaria sp. Aureobasidium sp. Cylindrocarpon sp. Cylindrocladium sp. Facteur abiotique Fusarium sp. Meloidogyne sp. Phomopsis sp. Pratylenchus sp. Pythium sp. Verticillium dahliae Xiphinema sp.
Alternariose Pourriture des fruits Pourriture racinaire Chancre de tige
Fusariose Nodosité Brȗlure phomopsienne Lésions des racines Pourriture phythienne Verticilliose Néematode dague
2 1 3 2 1
14 5 5 8 6 2 5
Bleuetier en corymbe
Agrobacteium sp. Alternaria sp. Aureobasidium sp. BlShV (Blueberry Shock Virus) Botrytis sp. Exobasidium sp. Facteur abiotique Fusarium sp. Fusicoccum sp. Pestalotiopsis sp. Phomopsis sp. Phytoplasme Pratylenchus sp. Pseudomonas syringae / Pseudomonas sp. Pyrenchoaeta sp. Seimatosporium sp. Septoria sp.
Tumeur du collet Alternariose Pourriture des fruits Brȗlure phomopsienne Lésions des racines Pourriture pythienne
Fusarios Chancre de tige Chancre de tige Brȗlurephomopsienne Malformation foliaire et de tige Lésions des racines Brȗlure bactérienne Pourriture racinaire Dépérissement Tache septorienne
2 1 1 9 1 5 4 2 7 1 1 3 1 4 2 7 1
Bleuetier nain Aureobasidium sp. Colletotrichum sp. Facteur abiotique Ramularia sp. Septoria sp.
Pourriture des friuts Anthracnose
Tache ramularienne Tache septorienne
2 1 1 2 4
Camérisier Alternaria sp. Aureobasidium sp. Cylindrocarpon sp. Facteur abiotique Fusarium sp. Meloidogyne sp. Microsphaera sp. pH inadéquat
Alternariose Pourriture des fruits Pourriture racinaire
Fusariose Nodosité racinaire Blanc
4 1 3 1
10 1 4 1

66
Tableau 4 cont’d
CULTURE AGENT PATHOGÈNE ou CAUSE MALADIE ou SYMPTÔME NOMBRE
Camérisier (suite)
Pratylenchus sp. Pythium sp. Rhizoctonia sp.
Lésions des racines Pourriture pythienne Rhizoctone
1 2 8
Canneberge Allantophomopsis cytisporea Coleophoma sp. Colletotrichum acutatum / Colletotrichum sp. Exobasidium sp. Facteur abiotique Phyllosticta elongata / Phyllosticta sp.
Physalospora sp. Protoventuria sp.
Pouriture noire de fruits Pouriture des fruits Tache foliaire Tache foliaire
Tache foliaire / pourriture des fruits Pourriture tachetée Tache folliaire
1 1 3 2 2 8
1 5
Fraisier américain
Botrytis sp. Pythium sp. Rhizoctonia sp.
Pourriture grise Pourriture phthienne Rhizoctone
1 2 2
Fraisier cultivé Botrytis sp. Colletotrichum sp. Conductivité électrique élevée Cylindrocarpon sp. Facteur abiotique Fusarium sp. / Fusarium oxysporum Gel Hainesia sp. Helicotylenchus sp. Longidorus sp. Meloidogyne sp. pH inadéquat Phomopsis sp. Phytophthora cactorum / Phytophthora sp. Phytoplasme Phytotoxicité – Atrazine Podospaera sp. Pourriture noire des racines Pratylenchus sp. Pythium sp. Rhizoctonia sp. SMov (Strawberry Mottle Virus) SMYEV (Strawberry Mild Yellow Edge Virus) SVBV (Strawberry Vein Banding Virus) SPaV (Strawberry Pallidosis Virus) Verticillium dahliae / Verticillium sp. Xanthomonas fragariae Zythia sp. / Gnomonia sp.
Pourriture grise Anthracnose
Pourriture racinaire
Pourriture fusarienne
Pourriture bestre Nématode spiralé Nématode aiguille Nodosité racinaire
Brȗlures des feuilles Pourriture collet et racines Malformation / phyllodie
Blanc Pourriture racinaire Lésions des racine Pourriture pythienne Rhizoctone Dépérissement Dépérissement Dépérissement Dépérissement Verticilliose Tache angulaire Brȗlure pétiole / tache foliaire
7 3 5
20 1
60 7 1 2 3 3 3 2
29 2 1 1
40 6
56 51 16 10
6 1 2 3 2
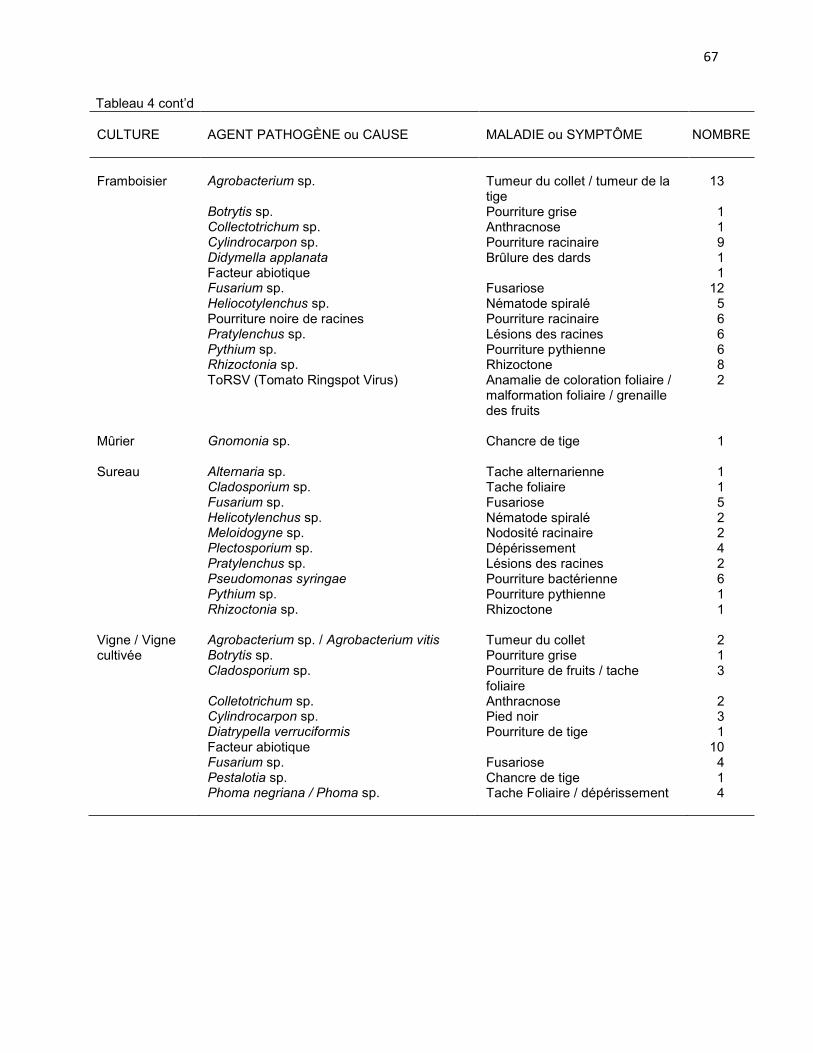
67
Tableau 4 cont’d
CULTURE
AGENT PATHOGÈNE ou CAUSE
MALADIE ou SYMPTÔME
NOMBRE
Framboisier
Agrobacterium sp. Botrytis sp. Collectotrichum sp. Cylindrocarpon sp. Didymella applanata Facteur abiotique Fusarium sp. Heliocotylenchus sp. Pourriture noire de racines Pratylenchus sp. Pythium sp. Rhizoctonia sp. ToRSV (Tomato Ringspot Virus)
Tumeur du collet / tumeur de la tige Pourriture grise Anthracnose Pourriture racinaire Brȗlure des dards Fusariose Nématode spiralé Pourriture racinaire Lésions des racines Pourriture pythienne Rhizoctone Anamalie de coloration foliaire / malformation foliaire / grenaille des fruits
13 1 1 9 1 1 12 5 6 6 6 8 2
Mȗrier Gnomonia sp. Chancre de tige 1
Sureau Alternaria sp. Cladosporium sp. Fusarium sp. Helicotylenchus sp. Meloidogyne sp. Plectosporium sp. Pratylenchus sp. Pseudomonas syringae Pythium sp. Rhizoctonia sp.
Tache alternarienne Tache foliaire Fusariose Nématode spiralé Nodosité racinaire Dépérissement Lésions des racines Pourriture bactérienne Pourriture pythienne Rhizoctone
1 1 5 2 2 4 2 6 1 1
Vigne / Vigne cultivée
Agrobacterium sp. / Agrobacterium vitis Botrytis sp. Cladosporium sp. Colletotrichum sp. Cylindrocarpon sp. Diatrypella verruciformis Facteur abiotique Fusarium sp. Pestalotia sp. Phoma negriana / Phoma sp.
Tumeur du collet Pourriture grise Pourriture de fruits / tache foliaire Anthracnose Pied noir Pourriture de tige Fusariose Chancre de tige Tache Foliaire / dépérissement
2 1 3 2 3 1 10 4 1 4

68
Tableau 5. Sommaire des maladies diagnostiquées parmi les céréales et cultures associées reçues au Laboratoire de diagnostic en phytoprotection du MAPAQ en 2016.
CULTURE AGENT PATHOGÈNE / CAUSE MALADIE / SYMPTÔME NOMBRE
Avoine Ustilago sp. Charbon 1 Blé Bipolaris sp. Tache helminthosporienne 2 Fumagine Fumagine 1 Fusarium sp. Piétin fusarien / pourriture
fusarienne / fusariose 4
Microdochium sp. Pourriture racinaire 1 Puccinia sp. Rouille 2 Pythium sp. Piétin brun 5 Quinoa Cladosporium sp. Pourriture 1 Corynespora sp. Tache foliaire 1 Fusarium sp. Fusariose 2 Pythium sp. Pourriture pythienne 4 Chia Fusarium sp. Fusariose 3 Pythium sp. Pourriture pythienne 3 Orge Alternaria sp. Alternariose 1 Bipolaris sp. Tache helminthosporienne 2 Cladosporium sp. Moisissure noire 1 Sarrasin Fusarium sp. Fusariose 2 Pythium sp. Pourriture pythienne 2 Rhizoctonia sp. Rhizoctone 2

69
Tableau 6. Sommaire des maladies diagnostiquées parmi les grandes cultures (protéagineuses, oléagineuses, textiles et autres cultures associées) reçues au Laboratoire de diagnostic en phytoprotection du MAPAQ en 2016.
CULTURE AGENT PATHOGÈNE ou CAUSE MALADIE ou SYMPTÔME NOMBRE
Houblon Alternaria sp. Alternariose 2 Cladosporium sp. Pourriture 1 Facteur abiotique 1 Fusarium sp. Fusariose 2 Pseudoperonospora sp. Mildiou 2 Maïs grain Carence en phosphore 2 Fusarium sp. Fusariose 6 Kabatiella sp. Kabatiellose 1 Pythium sp. Piétin brun 4 Rhizoctonia sp. Rhizoctone 2 Soya Alternaria sp. Tache alternarienne 2 Cercospora sp. Cercosporose 6 Colletotrichum sp. Anthracnose 6 Corynespora sp. Tache concentrique /
pourriture racinaire 1
Cylindrocarpon sp. Pourriture racinaire 3 Facteur abiotique 1 Fusarium oxysporum / Fusarium sp. Pourriture fusarienne 37 Helicotylenchus sp. Nématode spiralé 1 pH inadéquat 6 Phomopsis sp. Chancre de tiges 3 Phytophthora sp. Pourriture phytophthoréenne 15 Pratylenchus sp. Lésions des racines 3 Pseudomonas syringae Tache foliaire 1 Pythium sp. Pourriture pythienne 26 Rhizoctonia sp. Rhizoctone 6 Septoria sp. Septoriose 4 Tabac d’Australie
INSV (Impatiens Necrotic Spot Virus) Anomalie de coloration foliaire 2

70
Tableau 7. Sommaire des maladies diagnostiquées parmi les plantes fourragères reçues au Laboratoire de diagnostic en phytoprotection du MAPAQ en 2016.
CULTURE AGENT PATHOGÈNE / CAUSE MALADIE / SYMPTÔME NOMBRE
Fléole des prés Colletotrichum sp. Anthracnose 1 Luzerne Alternaria sp. Tache alternarienne 2 Cladosporium sp. Tache foliaire 1 Pseudopeziza sp. Tache commune 1 Ray-grass Puccinia sp. Rouille 2 Sorgho Alternaria sp. Tache alternarienne 1 Curvularia sp. Tache foliaire 1 Fusarium sp. Fusariose 3 Pythium sp. Piétin brun 3 Trèfle Facteur abiotique 2
Tableau 8. Sommaire des maladies diagnostiquées parmi les arbres et arbustes fruitiers reçus au Laboratoire de diagnostic en phytoprotection du MAPAQ en 2016.
CULTURE AGENT PATHOGÈNE ou CAUSE MALADIE ou SYMPTÔME NOMBRE
Cerisier nain Alternaria sp. Alternariose 7 Aureobasidium sp. Rousselure 6 Cladosporium sp. Pourriture 4 Facteur abiotique 4 Fusarium sp. Pourriture fusarienne 2 Pseudomonas syringae Brûlure bactérienne 11 Thielaviopsis sp. Pourriture racinaire 2 Citronnier Fusarium sp. Fusariose 3 Groseillier Puccinia sp. Rouille 2 Sphaerotheca sp. Blanc 1 Poirier Phytoplasme Anomalie de coloration foliaire 2 Pommier Erwinia amylovora Brûlure bactérienne 4 Facteur abiotique 6 Fusarium sp. Dépérissement 7 Phytophthora cactorum Pourriture phytophthoréenne 1 Pratylenchus sp. Lésions des racines 1 Pythium sp. Pourriture pythienne 3 Sphaeropsis sp. Pourriture noire 2 Nectria cinnabarina Chancre nectrien 3 Prunier domestique
Facteur abiotique 5
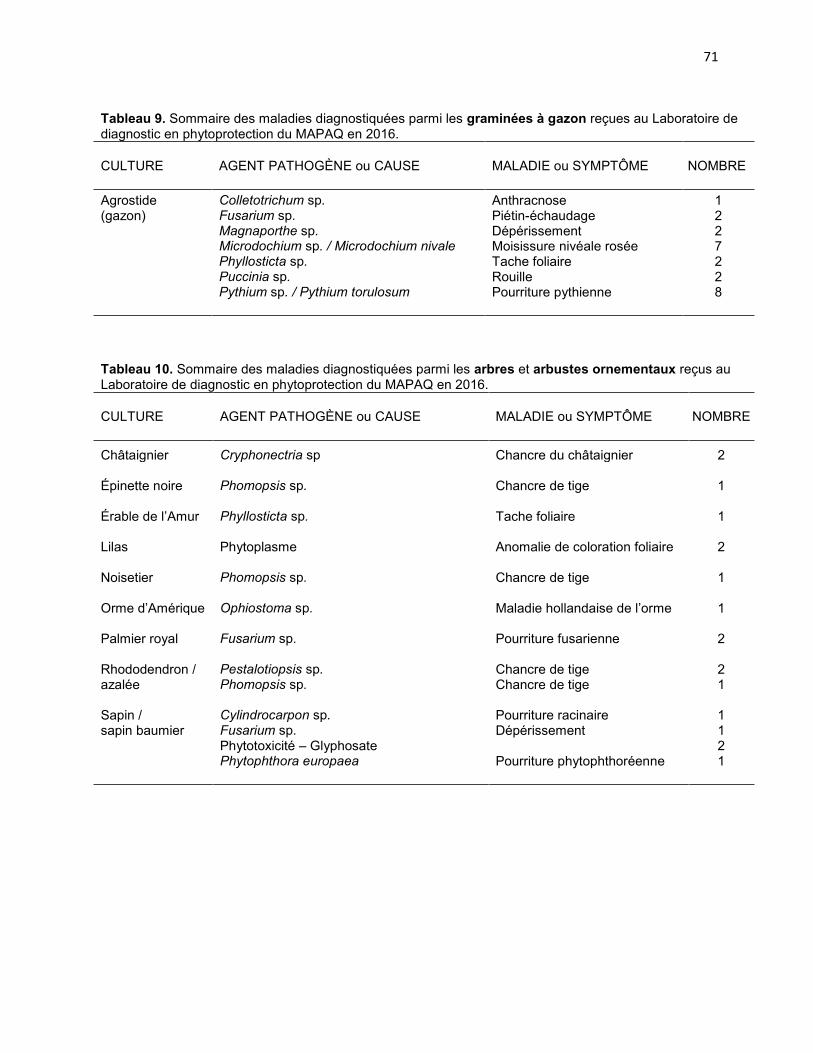
71
Tableau 9. Sommaire des maladies diagnostiquées parmi les graminées à gazon reçues au Laboratoire de diagnostic en phytoprotection du MAPAQ en 2016.
CULTURE AGENT PATHOGÈNE ou CAUSE MALADIE ou SYMPTÔME NOMBRE
Agrostide Colletotrichum sp. Anthracnose 1 (gazon) Fusarium sp. Piétin-échaudage 2 Magnaporthe sp. Dépérissement 2 Microdochium sp. / Microdochium nivale Moisissure nivéale rosée 7 Phyllosticta sp. Tache foliaire 2 Puccinia sp. Rouille 2 Pythium sp. / Pythium torulosum Pourriture pythienne 8
Tableau 10. Sommaire des maladies diagnostiquées parmi les arbres et arbustes ornementaux reçus au Laboratoire de diagnostic en phytoprotection du MAPAQ en 2016.
CULTURE AGENT PATHOGÈNE ou CAUSE MALADIE ou SYMPTÔME NOMBRE
Châtaignier Cryphonectria sp Chancre du châtaignier 2 Épinette noire Phomopsis sp. Chancre de tige 1 Érable de l’Amur Phyllosticta sp. Tache foliaire 1 Lilas Phytoplasme Anomalie de coloration foliaire 2 Noisetier Phomopsis sp. Chancre de tige 1 Orme d’Amérique Ophiostoma sp. Maladie hollandaise de l’orme 1 Palmier royal Fusarium sp. Pourriture fusarienne 2 Rhododendron / Pestalotiopsis sp. Chancre de tige 2 azalée Phomopsis sp. Chancre de tige 1 Sapin / Cylindrocarpon sp. Pourriture racinaire 1 sapin baumier Fusarium sp. Dépérissement 1 Phytotoxicité – Glyphosate 2 Phytophthora europaea Pourriture phytophthoréenne 1

72
Tableau 11. Sommaire des maladies diagnostiquées parmi les plantes ornementales herbacées reçues au Laboratoire de diagnostic en phytoprotection du MAPAQ en 2016.
CULTURE AGENT PATHOGÈNE ou CAUSE MALADIE ou SYMPTÔME NOMBRE
Alpiste Rhizoctonia sp. Rhizoctone 1 Anémone AltMV (Alternanthera Mosaic Virus) Anomalie de coloration foliaire 1 Arabette des Pythium irregulare Pourriture pythienne 1 dames Arnica Fusarium sp. Pourriture fusarienne 2 Pythium sp. Pourriture pythienne 2 Rhizoctonia sp. Rhizoctone 2 Asclépiade Alternaria sp. Alternariose 2 Colletotrichum sp. Anthracnose 2 Facteur abiotique 2 Bacopa AltMV (Alternanthera Mosaic Virus) Anomalie de coloration foliaire 2 Bégonia Botrytis sp. Pourriture grise 1 Calibrachoa Acidovorax sp. Tache bactérienne 1 Facteur abiotique 2 Chrysanthème Agrobacterium tumefaciens Tumeur du collet 1 Échinacée Fusarium sp. Pourriture fusarienne 1 Pseudomonas marginalis Brûlure bactérienne 1 Pythium sp. Pourriture pythienne 1 Rhizoctonia sp. Rhizoctone 2 Géranium / Pseudomonas cichorii Pourriture bactérienne 1 pélargonium Hémérocalle / Aureobasidium sp. Tache foliaire 1 lis d’un jour Heuchère Colletotrichum sp. Anthracnose 1 Impatiente / Botrytis sp. Pourriture grise 3 Impatiente de Facteur abiotique 2 Nouvelle-Guinée Fusarium sp. Pourriture fusarienne 2 Pythium sp. Pourriture pythienne 3 Lavande Fusarium sp. Dépérissement 1 Pythium sp. Pourriture pythienne 1 Lobélie TSWV (Tomato Spotted Wilt Virus) Anomalie de coloration foliaire 1
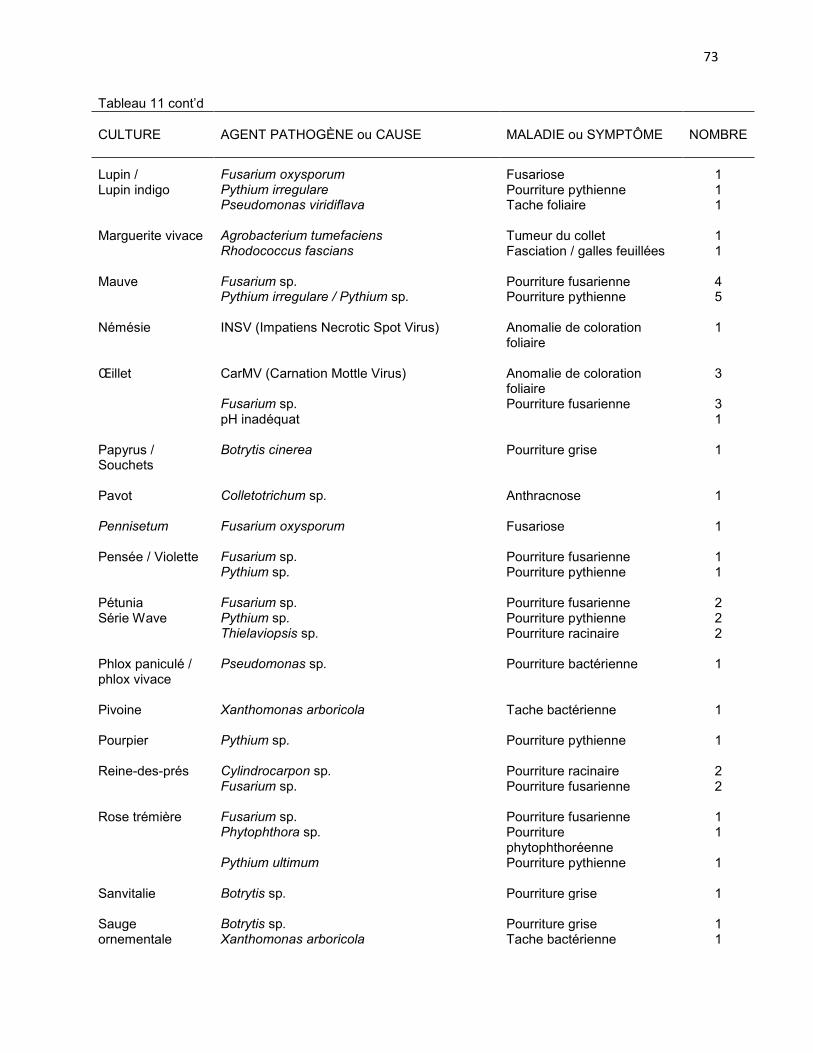
73
Tableau 11 cont’d
CULTURE
AGENT PATHOGÈNE ou CAUSE
MALADIE ou SYMPTÔME
NOMBRE
Lupin / Fusarium oxysporum Fusariose 1 Lupin indigo Pythium irregulare Pourriture pythienne 1 Pseudomonas viridiflava Tache foliaire 1 Marguerite vivace Agrobacterium tumefaciens Tumeur du collet 1 Rhodococcus fascians Fasciation / galles feuillées 1 Mauve Fusarium sp. Pourriture fusarienne 4 Pythium irregulare / Pythium sp. Pourriture pythienne 5 Némésie INSV (Impatiens Necrotic Spot Virus) Anomalie de coloration
foliaire 1
Œillet CarMV (Carnation Mottle Virus) Anomalie de coloration
foliaire 3
Fusarium sp. Pourriture fusarienne 3 pH inadéquat 1 Papyrus / Botrytis cinerea Pourriture grise 1 Souchets Pavot Colletotrichum sp. Anthracnose 1 Pennisetum Fusarium oxysporum Fusariose 1 Pensée / Violette Fusarium sp. Pourriture fusarienne 1 Pythium sp. Pourriture pythienne 1 Pétunia Fusarium sp. Pourriture fusarienne 2 Série Wave Pythium sp. Pourriture pythienne 2 Thielaviopsis sp. Pourriture racinaire 2 Phlox paniculé / Pseudomonas sp. Pourriture bactérienne 1 phlox vivace Pivoine Xanthomonas arboricola Tache bactérienne 1 Pourpier Pythium sp. Pourriture pythienne 1 Reine-des-prés Cylindrocarpon sp. Pourriture racinaire 2 Fusarium sp. Pourriture fusarienne 2 Rose trémière Fusarium sp. Pourriture fusarienne 1 Phytophthora sp. Pourriture
phytophthoréenne 1
Pythium ultimum Pourriture pythienne 1 Sanvitalie Botrytis sp. Pourriture grise 1 Sauge Botrytis sp. Pourriture grise 1 ornementale Xanthomonas arboricola Tache bactérienne 1
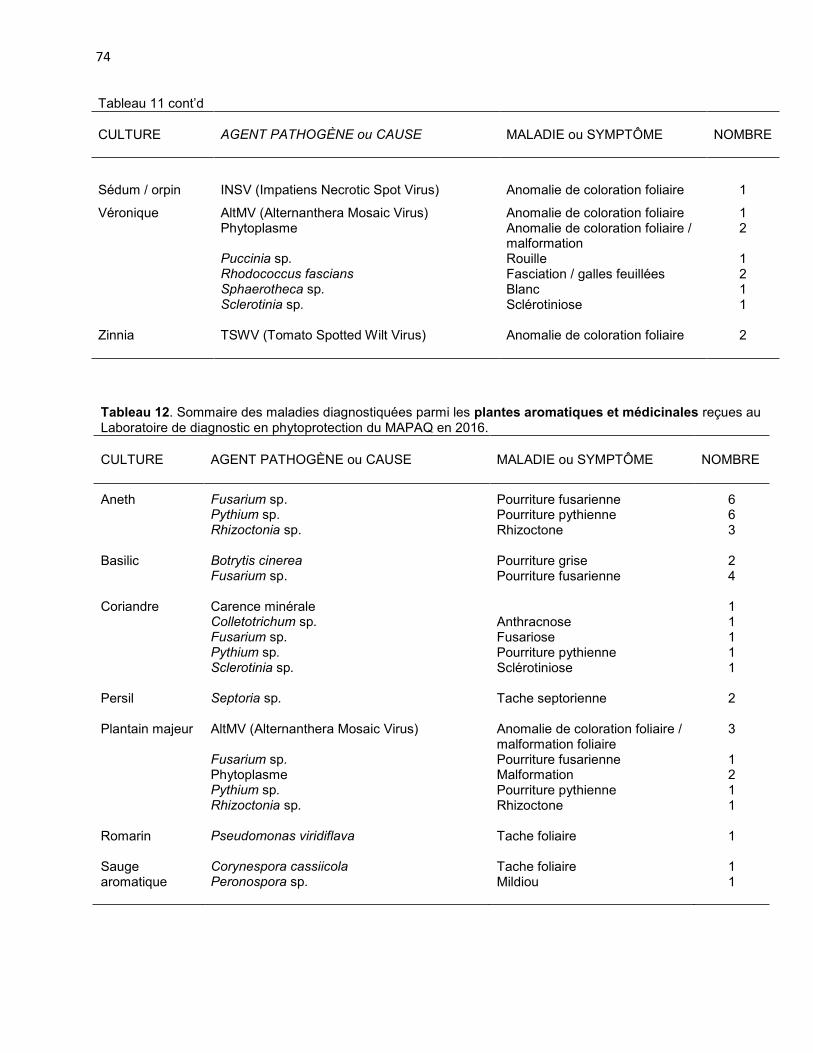
74
Tableau 11 cont’d
CULTURE
AGENT PATHOGÈNE ou CAUSE
MALADIE ou SYMPTÔME
NOMBRE
Sédum / orpin INSV (Impatiens Necrotic Spot Virus) Anomalie de coloration foliaire 1
Véronique AltMV (Alternanthera Mosaic Virus) Anomalie de coloration foliaire 1 Phytoplasme Anomalie de coloration foliaire /
malformation 2
Puccinia sp. Rouille 1 Rhodococcus fascians Fasciation / galles feuillées 2 Sphaerotheca sp. Blanc 1 Sclerotinia sp. Sclérotiniose 1 Zinnia TSWV (Tomato Spotted Wilt Virus) Anomalie de coloration foliaire 2
Tableau 12. Sommaire des maladies diagnostiquées parmi les plantes aromatiques et médicinales reçues au Laboratoire de diagnostic en phytoprotection du MAPAQ en 2016.
CULTURE AGENT PATHOGÈNE ou CAUSE MALADIE ou SYMPTÔME NOMBRE
Aneth Fusarium sp. Pourriture fusarienne 6 Pythium sp. Pourriture pythienne 6 Rhizoctonia sp. Rhizoctone 3 Basilic Botrytis cinerea Pourriture grise 2 Fusarium sp. Pourriture fusarienne 4 Coriandre Carence minérale 1 Colletotrichum sp. Anthracnose 1 Fusarium sp. Fusariose 1 Pythium sp. Pourriture pythienne 1 Sclerotinia sp. Sclérotiniose 1 Persil Septoria sp. Tache septorienne 2 Plantain majeur AltMV (Alternanthera Mosaic Virus) Anomalie de coloration foliaire /
malformation foliaire 3
Fusarium sp. Pourriture fusarienne 1 Phytoplasme Malformation 2 Pythium sp. Pourriture pythienne 1 Rhizoctonia sp. Rhizoctone 1 Romarin Pseudomonas viridiflava Tache foliaire 1 Sauge Corynespora cassiicola Tache foliaire 1 aromatique Peronospora sp. Mildiou 1

75
CROP/ CULTURE: Diagnostic Laboratory Report LOCATION / RĖGION: Quebec NAMES AND AGENCY: A.M. Breton, A. Dionne, J. Vivancos, J. Caron and D. Hamel Laboratoire de diagnostic en phytoprotection, ministère de l'Agriculture, des Pêcheries et de l'Alimentation du Québec (MAPAQ), Complexe scientifique, 2700, Einstein - D.1.200h, Quebec (Quebec) G1P 3W8 Telephone : 418 643-5027; Fax : 418 646-6806; Email: [email protected], [email protected]; Website: http://www.mapaq.gouv.qc.ca/fr/Productions/Protectiondescultures/diagnostic/Pages/diagnostic.aspx http://www.agrireseau.qc.ca/lab/ TITLE: DISEASES / ABIOTIC PROBLEMS DIAGNOSED ON PLANT SAMPLES SUBMITTED TO THE MAPAQ - LABORATOIRE DE DIAGNOSTIC EN PHYTOPROTECTION IN 2016 ABSTRACT: From January 1st to October 20th, 1,663 plant samples were processed by the Laboratoire de diagnostic en phytoprotection team for the diagnosis of plant pathogenic agents. The samples consisted of field and greenhouse vegetables, ornamentals (herbaceous, shrubs and trees), field crops, forage crops, berry crops, fruit trees and turfgrass as well as aromatic and medicinal plants. Diagnoses were accomplished by visual and miocroscopic examination and where required, molecular and other diagnostic tests. This report presents the diseases diagnosed on the plant samples. METHODS: The Laboratoire de diagnostic en phytoprotection du ministère de l'Agriculture, des Pêcheries et de l'Alimentation du Québec (MAPAQ) provides plant disease diagnostic services for growers, their advisers, government and homeowners. All diagnoses are accomplished by visual identification, generally followed by microscopic examination. Depending on the symptoms observed, one or more diagnostic tests are then made in order to determine the presence of plant pathogens. Diagnosis are based mainly on these tests: nematodes are extracted from the soil and plant tissue by Baermann funnel and cyst nematodes are extracted from the soil with the Fenwick can; genus and species are identified according to their morphological characteristics or by polymerase chain reaction (PCR). Fungi are isolated on artificial media and identified by microscopy or by molecular techniques (PCR and DNA sequencing). Bacteria are isolated on artificial media and identified by biochemical identification (BIOLOG®), detected by enzyme-linked immunosorbent essay (ELISA) or by PCR and DNA sequencing. Phytoplasmas are detected by PCR and DNA sequencing. Finally, presence of virus is revealed by ELISA or PCR. RESULTS AND COMMENTS: The following tables (1 to 12) present a summary of the diseases identified on plant samples received between January 1 and October 20, 2016. Table 1 (field vegetables) includes transplants from greenhouses and nurseries as well as field-grown vegetables. Table 2 (warehouse vegetables) including short and long term storage. Table 11 (herbaceous and floriculture ornamental plants) are essentially herbaceous plants (perennial or annual). The number of diseases diagnosed does not correspond to the number of samples processed because some plant samples presented more than one disorder or disease. Negative or non-conclusive diagnoses are not included in the report. Abiotic problems such as mineral deficiencies or excesses, inadequate pH, water stress, drought stress, physiological response to growing conditions, genetic abnormalities, environmental and chemical stresses including herbicide injuries and damage where no conclusive causal factor was identified are also included in this report. These diagnoses are based on the presence of characteristic symptoms, tests results and / or case history. THANKS: Authors wish to thank François Bélanger, Marion Berrouard, Chantal Malenfant, Michel Lemieux, Carolle Fortin and Linda Généreux for their technical assistance.

76
Table 1. Summary of diseases diagnosed on field vegetables received at the Laboratoire de diagnostic en phytoprotection - MAPAQ in 2016.
CROP PATHOGENIC AGENT or CAUSE DISEASE or SYMPTOM NUMBER
Garlic Alternaria sp. Alternaria leaf spot / purple blotch 3
Botrytis sp. Botrytis rot / gray mold 8
Burkholderia cepacia / Burkholderia sp. Bacterial rot 4
Cladosporium sp. Bulb rot 1
Colletotrichum sp. Anthracnose 2
Ditylenchus dipsaci / Ditylenchus sp. Stem and bulb nematode 11
Embellisia sp. Embellisia skin blotch 3
Enterobacter cloacae Bulb rot 3
Fusarium proliferatum / Fusarium sp. Plate rot / fusarium rot 39
Pantoea agglomerans Leaf necrosis 7
Inadequate pH 2
Pratylenchus sp. Lesion nematode damage 1
Pseudomonas marginalis Bacterial leaf rot 7
Pythium sp. Pythium root rot 9
Rhizoctonia sp. Rhizoctonia root rot 13
Asparagus Fusarium sp. Fusarium crown and root rot 1
Eggplant Pseudomonas syringae Bacterial rot 1
Beet Abiotic factor 2
Fusarium sp. Fusarium root rot 3
Phoma sp. Phoma root rot 1
Ramularia sp. Ramularia leaf spot 1
Verticillium sp. Verticillium wilt 3
Broccoli Alternaria sp. Alternaria leaf spot 2
Cantaloup Pseudomonas syringae Bacterial leaf spot 1
Carrot High electrical conductivity 2
Inadequate pH 2
Celery Colletotrichum acutatum / Colletotrichum sp. Anthracnose / leaf curl 4
Fusarium sp. Fusarium rot 6
Pectobacterium carotovorum Bacterial soft rot 3
Pseudomonas cichorii Bacterial leaf spot 4
Pseudomonas marginalis Bacterial soft rot 3
Pythium sp. Pythium root rot 6
Chinese cabbage Fusarium sp. Fusarium rot 1
Pectobacterium sp. Bacterial soft rot 1
Pseudomonas marginalis Bacterial leaf spot 1
Cabbage Alternaria sp. Alternaria leaf spot 1
Fusarium sp. Fusarium yellows / wilt 2
Abiotic disorder Rhizoctonia sp.
Black speck Damping off / head rot / wire stem / bottom rot
1 2

77
Table 1 (cont).
CROP PATHOGENIC AGENT or CAUSE DISEASE or CAUSE NUMBER
Chive Fusarium oxysporum Fusarium root rot 1
Pythium sp. Pythium root rot 1
Pumpkin / Colletotrichum sp. Anthracnose 1
marrow squash Fusarium sp. Fusarium root rot / fruit rot 2
Phytophthora capsici Phytophthora blight 1
Pythium sp. Pythium root rot 1
Cucumber Alternaria cucumerina / Alternaria sp. Alternaria leaf blight / leaf spot 2
Erwinia tracheiphila Bacterial wilt 1
Abiotic factor 1
Fusarium sp. Fusarium rot 6
Geotrichum sp. Sour rot 1
Oedema 1
Pectobacterium carotovorum / Pectobacterium sp.
Bacterial soft rot 2
Phoma sp. Phoma root rot 1
Plectosporium sp. Plectosporium blight 3
Pseudomonas sp. / Pseudomonas syringae Bacterial leaf spot / bacterial rot 2
Pseudoperonospora sp. Downy mildew 2
Pythium sp. Pythium root rot 5
Sclerotinia sp. White mold 1
Squash Alternaria sp. Alternaria leaf spot 5
Cladosporium sp. Scab 1
Colletotrichum sp. Anthracnose 1
Abiotic factor 2
Fusarium equiseti / Fusarium sp. Fusarium crown and root rot 9
Geotrichum candicum / Geotrichum sp. Sour rot 3
Pectobacterium carotovorum Bacterial soft rot 2
Phytophthora capsici / Phytophthora sp. Phytophthora blight 5
Potyvirus Fruit discoloration 1
Pseudomonas syringae Bacterial leaf spot 1
Septoria sp. Septoria leaf spot 2
Zucchini Alternaria sp. Alternaria leaf spot 2
Cladosporium sp. Scab 14
Fusarium sp. Fusarium rot 2
Abiotic factor Silvering 1
Oidium sp. Powdery mildew 1
Pectobacterium carotovorum / Pectobacterium sp.
Bacterial soft rot 2
Phoma sp. Phoma root rot 1
Phytophthora capsici / Phytophthora sp. Phytophthora blight 4
Pseudomonas syringae Bacterial leaf / fruit spot 2
Pythium sp. Pythium fruit rot 1
Spinach
Fusarium sp. Pythium sp.
Fusarium rot Pythium root rot
2 2
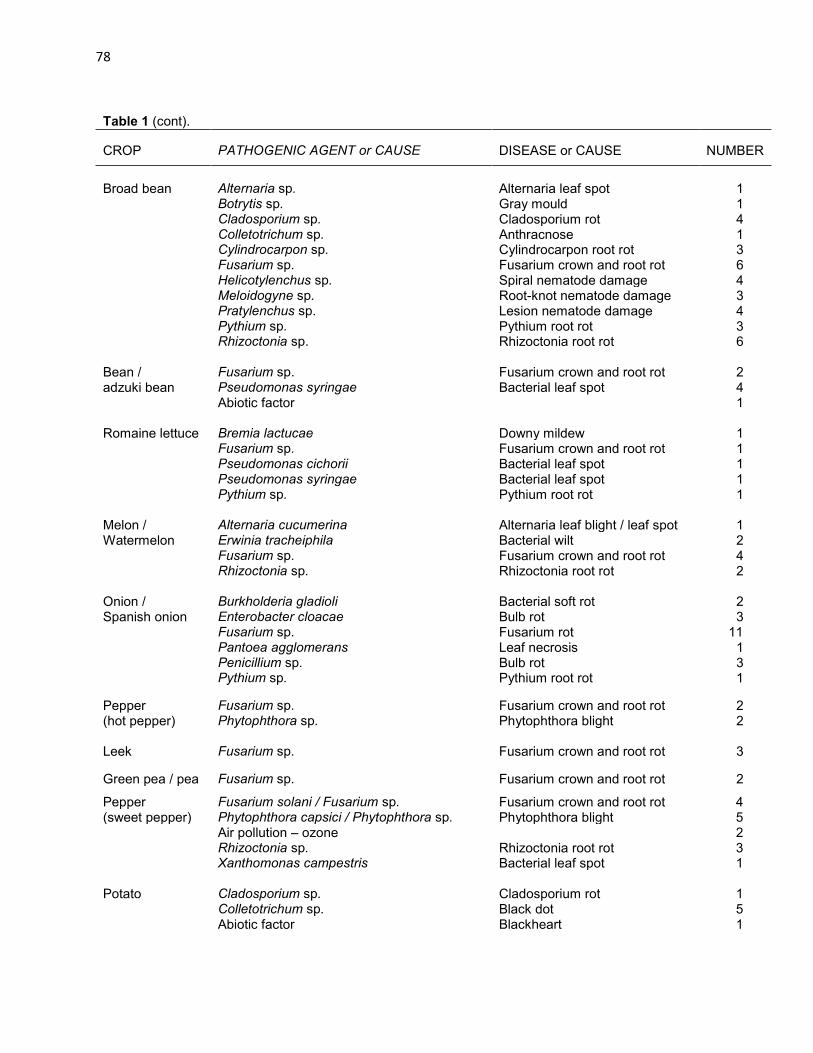
78
Table 1 (cont).
CROP PATHOGENIC AGENT or CAUSE DISEASE or CAUSE NUMBER
Broad bean
Alternaria sp.
Alternaria leaf spot
1
Botrytis sp. Gray mould 1 Cladosporium sp. Cladosporium rot 4 Colletotrichum sp. Anthracnose 1 Cylindrocarpon sp. Cylindrocarpon root rot 3 Fusarium sp. Fusarium crown and root rot 6 Helicotylenchus sp. Spiral nematode damage 4 Meloidogyne sp. Root-knot nematode damage 3 Pratylenchus sp. Lesion nematode damage 4 Pythium sp. Pythium root rot 3 Rhizoctonia sp. Rhizoctonia root rot 6 Bean / Fusarium sp. Fusarium crown and root rot 2 adzuki bean Pseudomonas syringae Bacterial leaf spot 4 Abiotic factor 1 Romaine lettuce Bremia lactucae Downy mildew 1 Fusarium sp. Fusarium crown and root rot 1 Pseudomonas cichorii Bacterial leaf spot 1 Pseudomonas syringae Bacterial leaf spot 1 Pythium sp. Pythium root rot 1 Melon / Alternaria cucumerina Alternaria leaf blight / leaf spot 1 Watermelon Erwinia tracheiphila Bacterial wilt 2 Fusarium sp. Fusarium crown and root rot 4 Rhizoctonia sp. Rhizoctonia root rot 2 Onion / Burkholderia gladioli Bacterial soft rot 2 Spanish onion Enterobacter cloacae Bulb rot 3 Fusarium sp. Fusarium rot 11 Pantoea agglomerans Leaf necrosis 1 Penicillium sp. Bulb rot 3 Pythium sp. Pythium root rot 1
Pepper Fusarium sp. Fusarium crown and root rot 2 (hot pepper) Phytophthora sp. Phytophthora blight 2 Leek Fusarium sp. Fusarium crown and root rot 3
Green pea / pea Fusarium sp. Fusarium crown and root rot 2
Pepper Fusarium solani / Fusarium sp. Fusarium crown and root rot 4 (sweet pepper) Phytophthora capsici / Phytophthora sp. Phytophthora blight 5 Air pollution – ozone 2 Rhizoctonia sp. Rhizoctonia root rot 3 Xanthomonas campestris Bacterial leaf spot 1 Potato Cladosporium sp. Cladosporium rot 1 Colletotrichum sp. Black dot 5 Abiotic factor Blackheart 1

79
Table 1 (cont).
CROP PATHOGENIC AGENT or CAUSE DISEASE or CAUSE NUMBER
Potato
Abiotic factor
2
(continued) Fusarium graminearum / Fusarium sp. Dry rot / tuber rot 17 Geotrichum sp. Rubbery rot 10 Helminthosporium sp. Silver scurf 1 PMTV (Potato Mop-Top Virus) Tuber internal necrosis 1 Pectobacterium atrosepticum / Pectobacterium
carotovorum / Pectobacterium sp. Black leg / bacterial soft rot 14
Phytophthora sp. Pink rot 3 Pythium sp. Pythium leak 6 Spongospora subterranea Powdery scab 1 Streptomyces sp. Potato scab 1 Verticillium sp. Verticillium wilt 8 Rhubarb ArMV (Arabis Mosaic Virus) Foliar discoloration 1 Colletotrichum sp. Anthracnose 6 Cylindrocarpon sp. Cylindrocarpon root rot 4 Helicotylenchus sp. Spiral nematode damage 4 Paratylenchus sp. Pin nematode damage 4 Pratylenchus sp. Lesion nematode damage 4 Rhizoctonia sp. Rhizoctonia crown and root rot 3 ToRSV (Tomato Ringspot Virus) Foliar discoloration 2 Xiphinema sp. Dagger nematode damage 4 Rocket Fusarium sp. Fusarium rot 1 Escarole / Abiotic factor 2 chicory escarole Tomato Alternaria alternata Alternaria leaf spot 1 Clavibacter michiganensis subsp.
michiganensis Tomato bacterial canker 2
Fusarium sp. Fusarium crown and root rot 6 Pythium sp. Pythium root rot 4

80
Table 2. Summary of diseases diagnosed on stored vegetables received at the Laboratoire de diagnostic en phytoprotection - MAPAQ in 2016.
CROP PATHOGENIC AGENT or CAUSE DISEASE or SYMPTOM NUMBER
Garlic Embellisia sp. Embellisia skin blotch 4 Abiotic factor 2 Fusarium sp. Basal plate rot / fusarium rot 3 Beet Pseudomonas syringae Bacterial rot 1 Carrot Botrytis sp. Gray mold 1 Kale Fusarium sp. Fusarium rot 3 Cabbage Botrytis sp. Gray mold 1 Turnip Rhizoctonia sp. Rhizoctonia root rot / storage
rot 1
Pepper Fusarium sp. Fusarium crown and root rot 3 (sweet pepper) Pythium sp. Pythium root rot 3 Potato Mechanical injury 2 Abiotic factor Blackheart 1 Colletotrichum coccodes / Colletotrichum
sp. Black dot 4
Abiotic factor 2 Fusarium sp. Dry rot / tuber rot 4 Geotrichum candidum / Geotrichum sp. Rubbery rot 3 Helminthosporium sp. Silver scurf 2 PMTV (Potato Mop-Top Virus) Tuber internal necrosis 3 Rhizoctonia sp. Black scurf / root rot 1 Spongospora sp. Powdery scab 1 Cherry tomato Penicillium sp. Blue mould / fruit rot 1

81
Table 3. Summary of diseases diagnosed on greenhouse crops received at the Laboratoire de diagnostic en phytoprotection - MAPAQ in 2016.
CROP PATHOGENIC AGENT or CAUSE DISEASE or SYMPTOM NUMBER
Garlic Botrytis sp. Botrytis rot / gray mould 1
Enterobacter cloacae Bulb rot 4 Fusarium sp. Basal plate rot / fusarium rot 8 Bok Choy / Abiotic factor 1 Pak Choy Pseudomonas marginalis Bacterial leaf spot 1 Verticillium sp. Verticillium wilt 1 Cabbage Alternaria brassicicola Black spot 3 Chive Fusarium graminearum Basal plate rot / fusarium rot 1 Cucumber Cladosporium cucumerinum / Cladosporium sp. Scab 5 High electrical conductivity 3 Erwinia tracheiphila Bacterial wilt 2 Fusarium oxysporum / Fusarium sp. Fusarium crown and root rot 11 Pectobacterium carotovorum Bacterial soft rot 2 Pythium sp. Pythium root rot 5 Ulocladium sp. Ulocadium leaf spot 2 Lettuce Fusarium sp. Fusarium crown and root rot 6 Phytophthora cryptogea Phytophthora root rot 4 Pythium dissotocum Pythium root rot 8 Pepper Xanthomonas campestris Bacterial leaf spot 1 (hot pepper) Pepper Fusarium sp. Fusarium crown and root rot 1 (sweet pepper) Inadequate pH 2 Potato Colletotrichum sp. Black dot 2 Tomato Clavibacter michiganensis subsp.
michiganensis Tomato bacterial canker 8
Colletotrichum sp. Anthracnose 1 Abiotic factor 3 Fusarium oxysporum / Fusarium sp. / Fusarium
sporotrichioides Fusarium crown and root rot / Wilt 11
Abiotic factor Gold fleck 1 Oedema 3 PepMV (Pepino Mosaic Virus) Multi-symptomatic 15 Pseudomonas sp. Tomato pith necrosis 1 Pythium sp. / Pythium ultimum
TSWV (Tomato Spotted Wilt Virus) Pythium root rot Foliar discoloration / foliar blight
5 2

82
Table 4. Summary of diseases diagnosed on small fruits received at the Laboratoire de diagnostic en phytoprotection - MAPAQ in 2016.
CROP PATHOGENIC AGENT or CAUSE DISEASE or CAUSE NUMBER
Amelanchier Nectria cinnabarina Stem canker 3
Sea buckthorn Alternaria sp. Alternaria leaf spot 2 Aureobasidium sp. Fruit rot 1 Cylindrocarpon sp. Cylindrocarpon root rot 3 Cylindrocladium sp. Stem canker 2 Abiotic factor 1 Fusarium sp. Fusarium crown and root rot 14 Meloidogyne sp. Root-knot nematode damage 5 Phomopsis sp. Stem canker 5 Pratylenchus sp. Lesion nematode damage 8 Pythium sp. Pythium root rot 6 Verticillium dahliae Verticillium wilt 2 Xiphinema sp. Dagger nematode damage 5
Highbush Agrobacterium sp. Crown gall 2 blueberry Alternaria sp. Alternaria leaf spot 1
Aureobasidium sp. Fruit rot 1 BlShV (Blueberry Shock Virus) Blueberry shock disease 9 Botrytis sp. Gray mould 1 Exobasidium sp. Exobasidium leaf / fruit spot 5 Abiotic factor 4 Fusarium sp. Fusarium crown and root rot 2 Fusicoccum sp. Stem canker 7 Pestalotiopsis sp. Stem canker 1 Phomopsis sp. Stem canker 1 Phytoplasma Blueberry stunt 3 Pratylenchus sp. Lesion nematode damage 1 Pseudomonas syringae / Pseudomonas sp. Bacterial blight 4 Pyrenochaeta sp. Pyrenochaeta root rot 2 Seimatosporium sp. Decline 7 Septoria sp. Septoria leaf spot 1 Lowbush Aureobasidium sp. Fruit rot 2 blueberry Colletotrichum sp. Anthracnose 1 Abiotic factor 1 Ramularia sp. Ramularia leaf spot 2 Septoria sp. Septoria leaf spot 4
Honeysuckle Alternaria sp. Alternaria leaf spot 4 Aureobasidium sp. Fruit rot 1 Cylindrocarpon sp. Cylindrocarpon root rot 3 Abiotic factor 1 Fusarium sp. Fusarium crown and root rot 10 Meloidogyne sp. Root-knot nematode damage 1 Microsphaera sp.
Inadequate pH Powdery mildew
4 1

83
Table 4 (cont.)
CROP PATHOGENIC AGENT or CAUSE DISEASE or CAUSE NUMBER
Honeysuckle Pratylenchus sp. Lesion nematode damage 1 (continued) Pythium sp. Pythium root rot 2 Rhizoctonia sp. Rhizoctonia root rot 8 Cranberry Allantophomopsis cytisporea Black rot 1
Coleophoma sp. Ripe rot 1
Colletotrichum acutatum / Colletotrichum sp. Bitter rot 3
Exobasidium sp. Exobasidium leaf spot 2 Abiotic factor 2 Phyllosticta elongata / Phyllosticta sp. Berry speckle / phyllosticta leaf
spot 8
Physalospora sp. Blotch rot 1 Protoventuria sp. Berry speckle / protoventuria leaf
spot 5
American Botrytis sp. Gray mould 1 strawberry Pythium sp. Pythium root rot 2 Rhizoctonia sp. Rhizoctonia root rot 2 Strawberry Botrytis sp. Gray mould 7 Colletotrichum sp. Anthracnose 3 High electrical conductivity 5 Cylindrocarpon sp. Cylindrocarpon root rot 20 Abiotic factor 1 Fusarium sp. / Fusarium oxysporum Fursarium rot 60 Frost 7 Hainesia sp. Tan brown rot 1 Helicotylenchus sp. Spiral nematode damage 2 Longidorus sp. Needle nematode damage 3 Meloidogyne sp. Root-knot nematode damage 3 Inadequate pH 3 Phomopsis sp. Phomopsis leaf blight 2 Phytophthora cactorum / Phytophthora sp. Phytophthora root rot 29 Phytoplasma Phyllody 2 Atrazine injury 1 Podosphaera sp. Powdery mildew 1 Black root rot Black root rot 40 Pratylenchus sp. Lesion nematode damage 6 Pythium sp. Pythium root rot 56 Rhizoctonia sp. Rhizoctonia root rot 51 SMoV (Strawberry Mottle Virus) Strawberry virus decline 16 SMYEV (Strawberry Mild Yellow Edge
Virus) Strawberry virus decline 10
SVBV (Strawberry Vein Banding Virus) Strawberry virus decline 6 SPaV (Strawberry Pallidosis Virus) Strawberry virus decline 1 Verticillium dahliae / Verticillium sp. Verticillium wilt 2 Xanthomonas fragariae Bacterial angular leaf spot 3 Zythia sp. / Gnomonia sp. Gnomonia leaf blotch / petiole
blight / root rot / fruit rot 2

84
Table 4 (cont.)
CROP PATHOGENIC AGENT or CAUSE DISEASE or CAUSE NUMBER
Raspberry Agrobacterium sp. Crown gall / cane gall 13 Botrytis sp. Gray mould 1 Colletotrichum sp. Anthracnose 1 Cylindrocarpon sp. Cylindrocarpon root rot 9 Didymella applanata Spur blight 1 Abiotic factor 1 Fusarium sp. Fusarium crown and root rot 12 Helicotylenchus sp. Spiral nematode damage 5 Black root rot Black root rot 6 Pratylenchus sp. Lesion nematode damage 6 Pythium sp. Pythium root rot 6 Rhizoctonia sp. Rhizoctonia root rot 8 ToRSV (Tomato Ringspot Virus) Foliar discoloration / crumbly berry 2 Blackberry Gnomonia sp. Stem canker 1 Elderberry Alternaria sp. Alternaria leaf spot 1 Cladosporium sp. Cladosporium leaf spot 1 Fusarium sp. Fusarium crown and root rot 5 Helicotylenchus sp. Spiral nematode damage 2 Meloidogyne sp. Root-knot nematode damage 2 Plectosporium sp. Decline 4 Pratylenchus sp. Lesion nematode damage 2 Pseudomonas syringae Bacterial rot 6 Pythium sp. Pythium root rot 1 Rhizoctonia sp. Rhizoctonia root rot 1 Grape Agrobacterium sp. / Agrobacterium vitis Crown gall 2 Botrytis sp. Gray mould 1 Cladosporium sp. Fruit rot / leaf spot 3 Colletotrichum sp. Anthracnose 2 Cylindrocarpon sp. Black foot 3 Diatrypella verruciformis Wood decay 1 Abiotic factor 10 Fusarium sp. Fusarium crown and root rot 4 Pestalotia sp. Stem canker 1 Phoma negriana / Phoma sp. Phoma leaf spot / root rot 4

85
Table 5. Summary of diseases diagnosed on cereals and associated crops received at the Laboratoire de diagnostic en phytoprotection - MAPAQ in 2016.
CROP PATHOGENIC AGENT or CAUSE DISEASE or SYMPTOM NUMBER
Oat Ustilago sp. Loose smut 1 Wheat Bipolaris sp. Spot blotch 2 Sooty mould Sooty mould 1 Fusarium sp. Fusarium root rot 4 Microdochium sp. Microdochium root rot 1 Puccinia sp. Rust 2 Pythium sp. Pythium root rot 5 Quinoa Cladosporium sp. Cladosporium rot 1 Corynespora sp. Corynespora leaf spot 1 Fusarium sp. Fusarium crown and root rot 2 Pythium sp. Pythium root rot 4 Chia Fusarium sp. Fusarium crown and root rot 3 Pythium sp. Pythium root rot 3 Barley Alternaria sp. Alternaria leaf spot 1 Bipolaris sp. Spot blotch 2 Cladosporium sp. Sooty mold 1 Buckwheat Fusarium sp. Fusarium root rot 2 Pythium sp. Pythium root rot 2 Rhizoctonia sp. Rhizoctonia root rot 2

86
Table 6. Summary of diseases diagnosed on oilseeds, pulses, textiles and associated crops received at the Laboratoire de diagnostic en phytoprotection - MAPAQ in 2016.
CROP PATHOGENIC AGENT or CAUSE DISEASE or SYMPTOM NUMBER
Hop Alternaria sp. Alternaria leaf spot 2 Cladosporium sp. Cladosporium rot 1 Abiotic factor 1 Fusarium sp. Cone tip blight / fusarium root rot 2 Pseudoperonospora sp. Downy mildew 2 Corn Phosphorus deficiency 2 Fusarium sp. Fusarium root rot 6 Kabatiella sp. Eyespot 1 Pythium sp. Pythium root rot 4 Rhizoctonia sp. Rhizoctonia root rot 2 Soybean Alternaria sp. Alternaria leaf spot 2 Cercospora sp. Cercospora leaf spot 6 Colletotrichum sp. Anthracnose 6 Corynespora sp. Target spot / root rot 1 Cylindrocarpon sp. Cylindrocarpon root rot 3 Abiotic factor 1 Fusarium oxysporum / Fusarium sp. Fusarium rot 37 Helicotylenchus sp. Spiral nematode damage 1 Inadequate pH 6 Phomopsis sp. Stem canker 3 Phytophthora sp. Phytophthora root rot 15 Pratylenchus sp. Lesion nematode damage 3 Pseudomonas syringae Bacterial leaf spot 1 Pythium sp. Pythium root rot 26 Rhizoctonia sp. Rhizoctonia root rot 6 Septoria sp. Septoria brown spot 4 Tobacco INSV (Impatiens Necrotic Spot Virus) Foliar discoloration 2 (Australian)

87
Table 7. Summary of diseases diagnosed on forages received at the Laboratoire de diagnostic en phytoprotection - MAPAQ in 2016.
CROP PATHOGENIC AGENT or CAUSE DISEASE or SYMPTOM NUMBER
Timothy grass Colletotrichum sp. Anthracnose 1 Alfalfa Alternaria sp. Alternaria leaf spot 2 Cladosporium sp. Cladosporium leaf spot 1 Pseudopeziza sp. Common leaf spot 1 Perennial rye grass
Puccinia sp. Rust 2
Sorghum Alternaria sp. Alternaria leaf spot 1 Curvularia sp. Curvularia leaf spot 1 Fusarium sp. Fusarium root rot 3 Pythium sp. Pythium root rot 3 Clover Abiotic factor 2
Table 8. Summary of diseases diagnosed on fruit trees received at the Laboratoire de diagnostic en phytoprotection - MAPAQ in 2016.
CROP PATHOGENIC AGENT or CAUSE DISEASE or SYMPTOM NUMBER
Dwarf sour Alternaria sp. Alternaria leaf spot 7 cherry Aureobasidium sp. Fruit rot 6 Cladosporium sp. Cladosporium rot 4 Abiotic factor 4 Fusarium sp. Fusarium rot 2 Pseudomonas syringae Bacterial blight 11 Thielaviopsis sp. Black root rot 2 Lemon Fusarium sp. Fusarium crown and root rot 3 Gooseberry Puccinia sp. Rust 2 Sphaerotheca sp. Powdery mildew 1 Pear Phytoplasma Pear decline 2 Apple Erwinia amylovora Fire blight 4 Abiotic factor 6 Fusarium sp. Fusarium rot 7 Phytophthora cactorum Phytophthora root rot 1 Pratylenchus sp. Lesion nematode damage 1 Pythium sp. Pythium root rot 3 Sphaeropsis sp. Sphaeropsis rot 2 Nectria cinnabarina Nectria canker 3 Plum Abiotic factor 5

88
Table 9. Summary of diseases diagnosed on turfgrass received at the Laboratoire de diagnostic en phytoprotection - MAPAQ in 2016.
CROP PATHOGENIC AGENT or CAUSE DISEASE or SYMPTOM NUMBER
Bentgrass Colletotrichum sp. Anthracnose 1 Fusarium sp. Fusarium patch 2 Magnaporthe sp. Summer patch 2 Microdochium sp. / Microdochium nivale Pink snow mold 7 Phyllosticta sp. Phyllosticta leaf spot 2 Puccinia sp. Rust 2 Pythium sp. / Pythium torulosum Pythium root rot 8
Table 10. Summary of diseases diagnosed on woody ornamentals received at the Laboratoire de diagnostic en phytoprotection - MAPAQ in 2016.
CROP PATHOGENIC AGENT or CAUSE DISEASE or SYMPTOM NUMBER
Chestnut Cryphonectria sp Chestnut blight 2 Black spruce Phomopsis sp. Stem canker 1 Amur maple Phyllosticta sp. Phyllosticta leaf spot 1 Lilac Phytoplasma Witches’ broom 2 Hazel Phomopsis sp. Stem canker 1 Elm Ophiostoma sp. Dutch elm disease 1 Royal palm Fusarium sp. Fusarium rot 2 Rhododendron / azalea Pestalotiopsis sp. Stem canker 2 Phomopsis sp. Stem canker 1 Fir / balsam fir Cylindrocarpon sp. Cylindrocarpon root rot 1 Fusarium sp. Fusarium rot 1 Glyphosate injury 2 Phytophthora europaea Phytophthora root rot 1

89
Table 11. Summary of diseases diagnosed on herbaceous and floriculture ornamental plants received at the Laboratoire de diagnostic en phytoprotection - MAPAQ in 2016.
CROP PATHOGENIC AGENT or CAUSE DISEASE or SYMPTOM NUMBER
Canary seed Rhizoctonia sp. Rhizoctonia root rot 1 Anemone AltMV (Alternanthera Mosaic Virus) Foliar discoloration 1 Arabidopsis Pythium irregulare Pythium root rot 1 thaliana Arnica Fusarium sp. Fusarium rot 2 Pythium sp. Pythium root rot 2 Rhizoctonia sp. Rhizoctonia root rot 2 Asclepias Alternaria sp. Alternaria leaf spot 2 Colletotrichum sp. Anthracnose 2 Abiotic factor 2 Bacopa AltMV (Alternanthera Mosaic Virus) Foliar discoloration 2 Begonia Botrytis sp. Gray mould 1 Calibrachoa Acidovorax sp. Bacterial leaf spot 1 Abiotic factor 2 Chrysanthemum Agrobacterium tumefaciens Crown gall 1 Echinacea Fusarium sp. Fusarium rot 1 Pseudomonas marginalis Bacterial blight 1 Pythium sp. Pythium root rot 1 Rhizoctonia sp. Rhizoctonia root rot 2 Geranium / Pelargonium Pseudomonas cichorii Bacterial rot 1 Daylily Aureobasidium sp. Aureobasidium leaf spot 1 Heuchera Colletotrichum sp. Anthracnose 1 Impatiens / Botrytis sp. Gray mould 3 New Guinea Abiotic factor 2 impatiens Fusarium sp. Fusarium rot 2 Pythium sp. Pythium root rot 3 Lavender Fusarium sp. Fusarium rot 1 Pythium sp. Pythium root rot 1
Lobelia TSWV (Tomato Spotted Wilt Virus) Foliar discoloration 1

90
Table 11 (cont.)
CROP PATHOGENIC AGENT or CAUSE DISEASE or CAUSE NUMBER
Baptisia / Fusarium oxysporum Fusarium crown and root rot 1 Baptisia australis Pythium irregulare Pythium root rot 1 Pseudomonas viridiflava Bacterial leaf spot 1 Perennial daisy Agrobacterium tumefaciens Crown gall 1 Rhodococcus fascians Shoot proliferation / leafy gall 1 Malva sylvestris Fusarium sp. Fusarium rot 4 Pythium irregulare / Pythium sp. Pythium root rot 5 Nemesia INSV (Impatiens Necrotic Spot Virus) Foliar discoloration 1 Carnation CarMV (Carnation Mottle Virus) Foliar discoloration 3 Fusarium sp. Fusarium rot 3 Inadequate pH 1 Cyperus Botrytis cinerea Gray mould 1 alternifolius Poppy Colletotrichum sp. Anthracnose 1 Pennisetum Fusarium oxysporum Fusarium root rot 1 Pansy / violet Fusarium sp. Fusarium rot 1 Pythium sp. Pythium root rot 1 Petunia (wave) Fusarium sp. Fusarium rot 2 Pythium sp. Pythium root rot 2 Thielaviopsis sp. Black root rot 2 Perennial phlox Pseudomonas sp. Bacterial rot 1 Peony Xanthomonas arboricola Bacterial leaf spot 1 Purslane Pythium sp. Pythium root rot 1 Meadowsweet Cylindrocarpon sp. Cylindrocarpon root rot 2 Fusarium sp. Fusarium rot 2 Hollyhock Fusarium sp. Fusarium rot 1 Phytophthora sp. Phytophthora root rot 1 Pythium ultimum Pythium root rot 1 Sanvitalia Botrytis sp. Gray mould 1 Ornamental sage Botrytis sp.
Xanthomonas arboricola Gray mould Bacterial leaf spot
1 1
Sedem / orpin INSV (Impatiens Necrotic Spot Virus Foliar discoloration 1

91
Table 11 (cont.)
CROP PATHOGENIC AGENT or CAUSE DISEASE or CAUSE NUMBER
Veronica AltMV (Alternanthera Mosaic Virus) Foliar discoloration 1 Phytoplasma Foliar discoloration / distortion 2 Puccinia sp. Rust 1 Rhodococcus fascians Shoot proliferation / leafy gall 2 Sphaerotheca sp. Powdery mildew 1 Sclerotinia sp. White mould 1 Zinnia TSWV (Tomato Spotted Wilt Virus) Foliar discoloration 2
Table 12. Summary of diseases diagnosed on herbs and medicinal plants received at the « Laboratoire de diagnostic en phytoprotection - MAPAQ » in 2016.
CROP PATHOGENIC AGENT or CAUSE DISEASE or SYMPTOM NUMBER
Dill Fusarium sp. Fusarium rot 6 Pythium sp. Pythium root rot 6 Rhizoctonia sp. Rhizoctonia root rot 3 Basil Botrytis cinerea Gray mold 2 Fusarium sp. Fusarium rot 4 Coriander Mineral deficiency 1 Colletotrichum sp. Anthracnose 1 Fusarium sp. Fusarium root rot 1 Pythium sp. Pythium root rot 1 Sclerotinia sp. White mould 1 Parsley Septoria sp. Septoria leaf spot 2 Broad-leaved plantain AltMV (Alternanthera Mosaic Virus) Foliar discoloration / distortion 3 Fusarium sp. Fusarium rot 1 Phytoplasma Foliar distortion 2 Pythium sp. Pythium root rot 1 Rhizoctonia sp. Rhizoctonia root rot 1 Rosemary Pseudomonas viridiflava Bacterial leaf spot 1 Aromatic sage Corynespora cassiicola Corynespora leaf spot 1 Peronospora sp. Downy mildew 1

92
CROP / CULTURE: Diagnostic Laboratory Report LOCATION / RĖGION: New Brunswick NAMES AND AGENCY: M.T. Tesfaendrias New Brunswick Department of Agriculture, Aquaculture and Fisheries (NBDAAF) 850 Lincoln Road, Fredericton NB E3B 4Z7 Telephone: (506) 453-3478; Facsimile: (506) 453-7978; E-mail: [email protected] TITLE: DISEASES DIAGNOSED ON PLANT SAMPLES SUBMITTED TO THE NBDAAF PLANT DISEASE DIAGNOSTIC LABORATORY IN 2016 ABSTRACT: The New Brunswick Department of Agriculture, Aquaculture and Fisheries (NBDAAF) Plant Disease Diagnostic Laboratory provides diagnostic services and disease management recommendations to growersand the agricultural industry in New Brunswick. In 2016, a total of 151 plant tissue samples were submitted to the diagnostic laboratory for problem identification and possible control recommendations. Samples included infectious diseases and abiotic disorders. INTRODUCTION AND METHODS: The NBDAAF Plant Disease Diagnostic Laboratory located in Fredericton, NB, provides diagnostic services and control recommendations for diseases of various crops to growers and the agricultural industry in New Brunswick as part of an integrated pest management (IPM) service. Samples are submitted to the diagnostic laboratory by IPM scouts, growers, agribusiness representatives, crop insurance agents and NBDAAF crop specialists and extension officers. Disease diagnoses are based on a combination of visual examination of symptoms, microscopic observations and culturing onto growth media. RESULTS AND COMMENTS: From 2 February to 30 November, 2016, the Plant Disease Diagnostic Laboratory received 150 diseased plant samples for diagnosis. Of these, 83% were infectious diseases (125 in total) and 17% physiological disorders (25 in total). Samples submitted to the diagnostic laboratory which were associated with insect damage are not included in this report. Also, samples diagnosed during scouting (surveys) and field visits are not included in this report. Summaries of diseases diagnosed and causal agents on plant tissue samples submitted to the NBDAAF Plant Disease Diagnostic Laboratory in 2016 are presented in Tables 1 to 5 by crop category.
Table 1: Summary of diseases diagnosed on fruit tree crops submitted to the NBDAAF Plant Disease Diagnostic Laboratory in 2016.
CROP DISEASE CAUSAL AGENT NUMBER
OF SAMPLES
Apple Apple scab Venturia inaequalis 3
Black rot Botryosphaeria obtusa 2 4
Canker (black rot) Botryosphaeria obtusa 2 Crown and collar rot Phytophthora cactorum 2 Frogeye leaf spot Botryosphaeria obtusa 2 Perennial canker Neofabraea perennans 1 Chemical injury Pesticide damage 2
Plum Brown rot Monilinia fructicola 1
DISEASED SAMPLES 15
ABIOTIC DISORDERS 2
TOTAL SUBMISSIONS 17

93
Table 2: Summary of diseases diagnosed on berry crops submitted to the NBDAAF Plant Disease
Diagnostic Laboratory in 2016.
CROP DISEASE CAUSAL AGENT NUMBER
OF SAMPLES
Blackcurrant Mycosphaerella leaf spot Mycosphaerella ribis 1
Blueberry (lowbush) Septoria leaf spot Septoria spp. 1
Valdensinia leaf spot Valdensinia heterodoxa 1
Botrytis blight Botrytis cinerea 1 Exobasidium leaf and fruit spot Exobasidium vaccinii 1
Leaf rust Thekopsora minima 1 Monilinia blight Monilinia vaccinii-corymbosi 1 Red leaf Exobasidium vaccinii 1 Chemical injury Herbicide injury 2 Environmental injury Frost injury 2
Blueberry (highbush)
Phomosis canker Phomopsis vaccinii 1
Botrytis blight Botrytis cinerea 1 Environmental injury Frost injury 1
Grape Downy mildew Plasmopara viticola 1
Haskap Powdery mildew Erysiphales 1
Raspberry Spur blight Didymella applanata 1 Gray mould Botrytis cinerea 1 Late leaf rust Pucciniastrum americanum 1
Strawberry Black root rot Fusarium spp.,Pythium sp., Rhizoctonia spp.
5
Anthracnose fruit rot Colletotrichum spp. 3 Crown rot Phytophthora cactorum 2 Gray mould Botrytis cinerea 2
Powdery mildew Sphaerotheca macularis f.sp.
fragariae 4
Verticillium wilt Verticillium dahliae 1 Leaf scorch Diplocarpon earlianum 2 Leaf spot Mycosphaerella fragariae 2 Environmental injury Frost injury 1
DISEASED SAMPLES 36
ABIOTIC DISORDERS 6
TOTAL SUBMISSIONS 42
Table 3: Summary of diseases diagnosed on vegetable (field and greenhouse) crops submitted to the
NBDAAF Plant Disease Diagnostic Laboratory in 2016.
CROP DISEASE CAUSAL AGENT NUMBER
OF SAMPLES
Bean Anthracnose
Environmental injury
Environmental injury
Colletotrichum sp.
Chilling injury
Herbicide damage
1
1
1
Beet Cercospora leaf spot Cercospora betae
Alternariabrassicae and A. brassicicola
1
2
Brussels sprout Alternaria leaf spot Alternaria brassicae and A. brassicicola 2

94
Table 3 (cont.)
Cabbage Black leaf spot Pepper spot Cottony soft rot
Alternaria brassicae and A. brassicicola Physiological disorder Sclerotinia sclerotiorum
1 1 1
Cantaloupe Fruit cracking Moisture fluctuation 1
Carrot Leaf blight Gray mould Cavity spot Crater rot Pythium root dieback Environmental injury
Alternaria dauci and Cercospora carotae
Botrytis cinerea Pythium spp. Rhizoctonia carotae Pythium spp. Herbicide damage
2 1 2 1 2 1
Celeriac Soft rot Erwinia carotovora 1
Celery Black heart Nutrient deficiency
Ca deficiency N deficiency
1 1
Cucumber Damping-off Alternaria leaf blight Scab White mould
Pythium spp. Alternaria spp. Cladosporium cucumerinum Sclerotinia sclerotiorum
1 3 2 1
Garlic Basal rot Purple blotch Bulb and stem nematode
Fusarium oxysporum f. sp. cepae Alternaria porri Ditylenchus dipsac
1 1 2
Leek Basal rot Bulb and stem nematode
Fusarium sp. Ditylenchus dipsaci
1 1
Lettuce Lettuce drop Sclerotinia sclerotiorum 1
Melon Alternaria leaf blight Environmental injury Environmental injury
Alternaria spp. Hail damage Drought stress
2 1 1
Onion Neck rot Purple blotch Smudge
Botrytis spp. Alternaria porri Colletotrichum sp.
1 2 1
Pepper Blossom end rot Sunscald
Environmental injury Environmental injury
2 1
Squash Alternaria leaf blight Black rot
Alternaria spp. Didymella bryoniae
1 1
Spinach Cladosporium leaf spot Cladosporium spp. 1
Tomato Leaf mould Powdery mildew Early blight Bacterial spot Septoria leaf spot Gray mould White mould Anthracnose Blossom end rot Environmental injury Edema
Passalora fulva Oidium neolycopersici Alternaria solani Xanthomonas campestris pv.vesicatoria Septoria lycopersici Botrytis cinerea Sclerotinia sclerotiorum Colletotrichum sp. Environmental injury Drought stress Environmental injury
6 3 6 1 1 1 3 1 1 1 1
Turnip Rhizoctonia rot Rhizoctonia sp. 1
DISEASED SAMPLES 62
ABIOTIC DISORDERS 14
TOTAL SUBMISSIONS 76

95
Table 4: Summary of diseases diagnosed on field crops (cereals, legume and sugar beet) submitted to
the NBDAAFPlant Disease Diagnostic Laboratory in 2016.
CROP DISEASE CAUSAL AGENT NUMBER
OF SAMPLES
Barley Tip burn Environmental injury 1
Corn Ear rot Fusariumsp. 1
Soybean Pod and stem blight Diaporthe phaseolorum var. sojae 1
Wheat Tip burn Environmental injury 1
Sugar beet Alternaria leaf spot Alternaria spp. 1
DISEASED SAMPLES 3
ABIOTIC DISORDERS 2
TOTAL SUBMISSIONS 5
Table 5: Summary of diseases diagnosed on trees and ornamental plants submitted to the NBDAAFPlant
Disease Diagnostic Laboratory in 2016.
CROP DISEASE CAUSAL AGENT NUMBER
OF SAMPLES
Austrian pine Diplodia tip blight Sphaeropsis sapinea 1
Asian pine Diplodia tip blight Sphaeropsis sapinea 1
Red maple Phyllosticta leaf spot Phyllosticta minima 1
Spruce Rhizospahera needle cast Rhizospahera kalkloffi 2
Rose Powdery mildew Podosphaera pannosa 1
Geranium Bacterial leaf spot Pseudomonas syringae 2
Edema Environmental injury 1
Zinnia Botrytis blight Botrytis cinerea 1
DISEASED SAMPLES 9
ABIOTIC DISORDERS 1
TOTAL SUBMISSIONS 10

96
CROP / CULTURE: Diagnostic Laboratory Report - All Crops LOCATION / RĖGION: Prince Edward Island NAME AND AGENCY: M.M.Clark1 and A.Driscoll2 1P.E. Department of Agriculture and Fisheries, Plant Disease Diagnostic Laboratory, P.O. Box 2000, 23 Innovation Way, Charlottetown, PE C1E 0B7 Telephone: (902)368-5261; Facsimile: (902)368-6299; Email: [email protected] 2P.E. Department of Environment, Labour and Justice, PE Analytical Laboratories, P.O. Box 2000 Charlottetown, PE C1A 7N3 TITLE: DISEASES DIAGNOSED ON COMMERCIAL CROP SAMPLES SUBMITTED TO THE PRINCE EDWARD ISLAND PLANT DISEASE DIAGNOSTIC SERVICE (PDDS) IN 2016 ABSTRACT: The Prince Edward Island Department of Agriculture’s Plant Disease Diagnostic Service (PDDS) provides diagnosis and control recommendations primarily for disease problems of commercial crops produced on PE. A total of 153 samples were processed for the 2016 crop year. The 2016 growing season was unusually dry followed with some heavy rain periods at the end of the growing season. There were four confirmed incidences of potato late blight. Three cases of pink rot (Phytophthora erythroseptica) in potatoes were confirmed in Prince County and were tested for metalaxyl-resistance. They were found to be sensitive to metalazyl. Fusarium isolates from faba bean were found to be sensitive to difenoconazole, fludioxonil and thiabendazole. METHODS: The Prince Edward Island Department of Agriculture’s Plant Disease Diagnostic Service (PDDS) provides diagnosis and control recommendations primarily for disease problems of commercial crops produced on PE. Samples are submitted to the laboratory by agriculture extension staff, producers, growers, agri-business representatives, crop insurance agents and the general public. Diagnoses are based on a combination of investigative work, visual examination of symptoms, microscopic observation and culturing onto artificial media. In most samples one or more causal agents were identified. RESULTS: A total of 153 samples were processed for the 2016 crop year. A total of 310 disease diagnoses were completed during the period June 1st to October 31st 2016. Categories of samples received were: potatoes (64.50%), cereal and soybean crops (11.73%), vegetable and fruit crops (20.85%), and other (2.93 %). The category ‘other’ covers samples such as cherry, elm and faba bean. A summary of diseases diagnosed on crop samples is provided in Table 1 by crop category. The diagnoses reported may not necessarily reflect the major disease problems encountered during the season in the field, but rather those most prevalent within the samples submitted. There were four confirmed incidences of potato late blight. The plant source for Phytophthora infestans inoculum for potatoes has changed from potato tubers to home garden tomato plants in recent years. The US23 late blight genotype that was discovered in 2012 is now the predominant strain in PE. Late blight incidence in potatoes has been reduced since this genotype is more aggressive in tomato plants than potato plants. However, the US23 genotype is aggressive in potato tubers. Isolates of fusarium from faba bean were found to be sensitive to fungicides difenoconazole, fludioxonil and thiabendazole. One faba bean field was exhibiting a girdling root rot and isolates of Pythium, Rhizoctonia and a new Fusarium isolate, Fusarium cerealis, were involved in the disease phenomenon. At the beginning of the growing season, rainfall was limited and some early potato varieties exhibited symptoms of wilt. Fungal organisms involved in this wilt syndrome included Verticillium albo-atrum, Rhizoctonia solani, Verticillium dahliae, Colletotrichum coccodes and Fusarium spp. Two potato samples with blackleg tested positive for Pectobacterium carotovorum subsp. carotovorum which is the common, less aggressive bacterium involved in bacterial blackleg disease.

97
Table 1: Summary of diseases diagnosed on commercial crop samples submitted to the Plant Disease Diagnostic Laboratory, Prince Edward Island Department of Agriculture in 2016.
CROP DISEASE CAUSAL AGENT / PLANT PATHOGEN
FREQUENCY OF IDENTIFICATION
VEGETABLES:
Cabbage Abiotic disease Edema 2
Carrot Bacterial soft rot Clostridium sp. 1
Pseudomonas sp. 1
Fusarium root rot Fusarium oxysporum 3
Cauliflower Abiotic disease Nutritional imbalance 1
Leaf spot Alternaria sp. 1
Fusarium wilt Fusarium oxysporum 1
Wirestem Rhizoctonia sp. 2
Cucumber Bacterial wilt Pectobacterium sp. 2
Leaf spot Ulocladium sp. 2
Onion Abiotic disease Tip burn 1
Potato Abiotic disease Elephant hide 1
Growth cracks 1
Bacterial soft rot Clostridium sp. 7 Pectobacterium sp. 3
Pseudomonas sp. 2
Black dot Colletotrichum coccodes 18
Black scurf Rhizoctonia solani 5
Blackleg Pectobacterium sp. 2
Botrytis gray mould Botrytis cinerea 9
Brown spot Alternaria alternata 4
Common scab Streptomyces scabies 7
Early blight Alternaria solani 1
Fusarium dry rot Fusarium coeruleum 3
Fusarium oxysporum 2
Fusarium sambucinum 4
Fusarium solani 1
Fusarium sp. 3
Tuber rot Pythium sp. 2
Tuber rot Rhizoctonia solani 7
Fusarium wilt Fusarium avenaceum 1
Fusarium oxysporum 2
Fusarium solani 2
Fusarium sp. 11
Late Blight Phytophthora infestans 4 Leak Pythium sp. 9

98
Table 1 (cont.)
Potato (cont.) Physiological disorders Bruising 1
Burn 2
Elephant hide 1
Off-type 1
Thickened stems 1
Translucent end 1
Wind damage 2
Pink rot Phytophthora erythroseptica 3
Pinkeye Pseudomonas sp. 3
Unknown cause 4
Pocket rot Phoma exigua 1
Rhizoctonia canker Rhizoctonia solani 30
Seed piece decay Clostridium sp. 2
Fusarium sp. 1
Geotrichum sp. 2
Pythium sp. 1
Silver scurf Helminthosporium solani 3
Verticillium wilt Verticillium albo-atrum 2
Verticillium dahliae 5
Verticillium sp. 25
White mould Sclerotinia sclerotiorum 2
Rutabaga Blackleg Phoma lingam 1 Root rot Rhizoctoniasolani 1
Spinach Fusarium wilt Fusarium oxysporum 2
CEREAL / FIELD CROPS:
Barley Common root rot Bipolaris sp. 3
Fusarium graminearum 1
Fusarium avenaceum 1
Stemphylium sp. 1
Fusarium head blight Gibberella zeae 1
Net blotch Pyrenophora sp. 1
Scald Rhynchosporium secalis 1
Smut Ustilago sp. 1 Sooty mould Alternaria sp. 1
Aspergillus sp. 1
Cladosporium sp. 1
Stemphylium sp. 1
Bipolaris sp. 1
Soybean Anthracnose Colletotrichum sp. 2

99
Table 1 (cont.)
Soybean (cont.) Wilt Verticillium sp. 1
Abiotic disorder Nutritional imbalance 1 Brown spot Septoria sp. 3 Downy mildew Peronospora sp. 1
Pod and stem blight Colletotrichum sp. 1
Diaporthe sp. 3
Fusarium sp. 2
Phomopsis sp. 2
Rhizoctonia sp. 1
Rhizoctonia root rot Rhizoctonia solani 4
SMALL FRUITS:
Blueberry Fusicoccum canker Fusicoccum sp. 2 Leaf spot Phomopsis sp. 2
Phomopsis canker Phomopsis sp. 1
Powdery mildew Microsphaera sp. 1
Red Leaf Exobasidium sp. 2
Septoria leaf spot Septoria sp. 1
Witches’ broom Pucciniastrum goeppertianum 2
Grape Abiotic disease Herbicide damage 1
Strawberry Anthracnose Colletotrichum sp. 1
Gloeosporium sp. 1
Black root rot Certobasidium sp. 2
Pythium sp. 2
Rhizoctonia sp. 2
Leaf spot Botrytis cinerea 1
Leaf blight Phomopsis sp. 4
Abiotic disease Winter injury 4
Powdery mildew Sphaerotheca macularis 6
Root / crown rot Rhizoctonia sp. 2
Verticillium wilt Verticillium dahlia 1
Verticillium sp. 1
OTHER CROPS:
Cherry Leaf spot Blumeriella jaapii 1
Elm Dutch elm disease Ophiostoma ulmi 1
Faba bean Leaf spot Alternaria sp. 1
Stemphylium sp. 1
Rhizoctonia root rot Rhizoctonia sp. 2
Root rot Pythium sp. 1
Fusarium cerealis 1 Rhizoctonia sp. 1
Total 310

100
CEREALS / CÉRÉALES
CROP / CULTURE: Barley LOCATION / RÉGION: Manitoba NAMES AND AGENCY / NOMS ET ÉTABLISSEMENT: M. Banik, M. Beyene and X. Wang Agriculture and Agri-Food Canada, Morden Research and Development Centre, 101 Route 100, Morden MB R6M 1Y5 Telephone: (204) 822-7530; Facsimile: (204) 822-7507; E-mail: [email protected] TITLE / TITRE: FUSARIUM HEAD BLIGHT OF BARLEY IN MANITOBA – 2016 ABSTRACT: Forty nine barley fields in Manitoba were surveyed for fusarium head blight (FHB) in 2016 to assess disease severity and the causal Fusarium species. FHB severity in 2016 was much higher than 2015 with a mean FHB index of 2.1%. F. graminearum was the predominant Fusarium species identified, followed by F. poae, F. avenaceum, F. sporotrichioides, and F. equiseti. INTRODUCTION AND METHODS: A total of 49 barley (38 two-row, 11 six-row) fields in Manitoba were examined for the prevalence of fusarium head blight from July 18-August 5 when crops were at the early- to soft- dough (ZGS 79-82) stages of growth. Fields were selected at regular intervals approximately 20-25 km along the survey routes, depending on crop availability and accessibility. The area sampled was bounded by Highways numbers 67, 16 to the north, 12 to the east, 3 to the south, 8 to the north and 83 to the west. FHB incidence (the percentage of spikes showing typical FHB symptoms) was assessed in each field by sampling 95-110 spikes at three locations and averaging the scores. The mean spike proportion infected (SPI) was estimated for each field. Forty to sixty affected spikes were collected at each survey site and stored in paper envelopes. Consequently, 1 gm of infected kernel removed from 15 randomly selected panicles from each field was frozen in liquid nitrogen and ground to a powder using Spex Sample Prep 2010 Geno/Grinder. DNA was extracted from the ground grain sample from each field using the QIAGEN DNeasy Mini Kit (QIAGEN). Polymerase chain reaction (PCR) analysis was performed on extracted DNA samples using species- specific oligonucleotide primer to various Fusarium species frequently obtained in cereal samples grown in western Canada (Demeke et al. 2005). RESULTS AND COMMENTS: In 2016, growing conditions throughout Manitoba were conducive for the development of fusarium head blight, largely due to excessive rain, hail, wind resulting in lodging and stalk breakage. Quality of the crop was downgraded due to high disease pressure. Higher disease pressure was also noted in many crop types in 2016. Barley was grown on 352,348 acres in Manitoba in 2016, representing almost similar acreages compared to 2015 (MASC, 2016). The 2-row cultivar ‘CDC Austenson’ was the most widely planted barley in 2016, occupying 21.8% and the acreage increased from 16.6% in 2015. The acreage of CDC Conlon decreased from 24.4% in 2015 to 19.5% in 2016 (MASC, 2016; Yield Manitoba, 2016). ‘Celebration’ was the third most widely planted cultivar, occupying 9.3 of the area. These three cultivars made up half of the barley acreage in Manitoba in 2016 (MASC, 2016). Putative symptoms of FHB were detected in all fields surveyed. The mean incidence of FHB in 2-row barley was 13.71% (range 4.59 – 31%) and SPI was 11.76 % (range 3.0 – 30.0%). In six-row barley, the incidence was 13.41% (range 5.66 – 39%) and SPI 16.19% (range 3 - 30%). The resulting mean Fusarium Head Blight Index (FHB-I) [%incidence X %SPI / 100] for two-row barley was 1.82% (range 0.228-7.9%), and that for six-row barley 2.72 % (range 0.1689-11.7%). The FHB-I in 6-row vs. 2-row barley was higher than reported for 2009 to 2015 (Tekauz et al. 2010, Tekauz et al. 2011, Banik et al.

101
2014, 2016, Beyene et al. 2015). This FHB-I would likely had effect on crop yields and grain quality in 2016. Fusarium infection was detected in all 49 fields. The individual Fusarium species amplified from infected kernels DNA are listed in Table 1. F. graminearum predominated and was present in 95.9 % of the fields. Similar results were also obtained in 2009 and 2010 (Tekauz et al. 2010, 2011). In contrast, F. poae was detected in 82% of the fields and was the most common Fusarium species recovered from the infected kernels in Manitoba since 2011 (Tekauz et al. 2013, Banik et al. 2014, 2016; Beyene et al. 2015). F. avenaceum and F. sporotrichoides were detected in 37% and 29% of fields respectively. F. equiseti was also detected, but only occurred at low levels (Table 1). Excess moisture during growing season was likely more favourable for F. graminearum infection than F. poae. REFERENCES: Banik, M., Beyene, M. and Wang, X. 2016. Fusarium head blight of barley in Manitoba - 2015. Can. Plant Dis. Surv. 96:93-94. (www.phytopath.ca/publication/cpds) Banik, M., Beyene, M and Tekauz, A. 2014. Fusarium head blight and leaf spot diseases of barley in Manitoba in 2013. Can. Plant Dis. Surv. 94:107-108. (www.phytopath.ca/publication/cpds) Beyene, M., Banik, M and Wang, X. 2015. Fusarium Head Blight of barley in Manitoba – 2014. Can. Plant Dis. Surv. 95:74-75. (www.phytopath.ca/publication/cpds) Manitoba Agricultural Services Corporation (MASC). 2016. Variety Market Share Information Report. Tekauz, A., Gilbert, J., Stulzer, M., Beyene, M. and Slusarenko, K. 2010. Monitoring fusarium head blight of barley in Manitoba in 2009. Can. Plant Dis. Surv. 90:60-61. (www.phytopath.ca/publication/cpds) Tekauz, A., Stulzer, M., Beyene, M., Kleiber, F., Ghazvini, H. and Hajipour, Z. 2011. Monitoring fusarium head blight of barley in Manitoba in 2010. Can. Plant Dis. Surv. 91:62-63. (www.phytopath.ca/publication/cpds) Tekauz, A., Stulzer, M., Beyene, M., Dupriez, M., Harris, A. and Le Ba, N. 2012. Fusarium head blight of barley – Manitoba 2011. Can. Plant Dis. Surv. 92:67-68. (www.phytopath.ca/publication/cpds) Tekauz, A., Stulzer, M., Beyene, M., Gompf, J. and Moncomble, C. 2013. Fusarium head blight of barley in Manitoba – 2012. Can. Plant Dis. Surv. 93:91-92. (www.phytopath.ca/publication/cpds) Yield Manitoba 2016. Manitoba Crop Services Corporation, supplement to the Manitoba Co-operator. 2016 Table 1: Fusarium spp. identified by PCR from FHB-affected barley kernels from 49 fields in Manitoba in 2016.
Fusarium spp. Percent of fields
F. avenaceum 37.0
F. equiseti 8.12
F. graminearum 95.92
F. poae 82
F. sporotrichioides 29

102
CROP / CULTURE: Barley LOCATION / RÉGION: Saskatchewan NAMES AND AGENCIES / NOMS ET ÉTABLISSEMENT: P. Cholango-Martinez and H.R. Kutcher Crop Development Centre, University of Saskatchewan, 51 Campus Drive, Saskatoon SK S7N 5A8 Telephone: (306) 966-8661 Facsimile: (306) 966-5015 E-mail: [email protected] TITLE / TITRE: LEAF SPOT DISEASES IN BARLEY IN SASKATCHEWAN IN 2016 ABSTRACT: The most prevalent diseases observed in barley during 2016 were spot blotch (Cochliobolus sativus), net blotch (Pyrenophora teres) and septoria leaf blotch (Septoria passerinii). Among 37 crops surveyed, 78% were categorized as having trace to slight leaf spot disease severity, 19% were moderately severe and 3% of the crops were in the severe category. INTRODUCTION AND METHODS: A survey was conducted by Saskatchewan Crop Insurance Corporation from July to mid-August, 2016. Thirty seven commercial fields were selected randomly from 15 crop districts (1A, 2A, 3BN, 3BS, 4B, 5A, 5B, 6A, 6B, 7A, 8A, 8A, 8B, 9A, 9B). More than 25 leaves were collected and put in paper envelops. At the Cereal and Flax Pathology lab of the University of Saskatchewan, ten leaves were visual assessed for severity of various leaf diseases. The average severity was categorized as: trace (0-10%), light (6-10%), moderate (11-40%) and severe (41-100%). Ten leaves were chosen and cut into multiple pieces; ten leaf pieces were randomly chosen and surface-sterilized using ethanol (70%) for 1 min and then rinsed three times in sterile water. The leaf pieces were plated on filter paper and after 7 days the presence of net blotch (Pyrenophora teres Drechsler), spot blotch (Cochliobolus sativus Ito & Kuribayashi Drechs. ex Dast.) and septoria leaf blotch (Septoria passerinii Sacc.) on the leaves was identified and recorded. RESULT AND CONCLUSIONS: Weather conditions in 2016 were warm and dry at the beginning of the season, which allowed growers to start seeding early. For the balance of the season frequent precipitation events occurred well into the fall. These conditions affected development of the leaf diseases in barley. The prevalence of leaf diseases at trace to slight levels was higher in 2016 than in 2015 (Tran et al., 2016). Among the 37 barley crops surveyed, leaf diseases were detected in 78% at trace to slight levels, 19% were moderate and 3% were severe (Table 1). The most common pathogen on barley (prevalence and incidence) was Cochliobolus sativus, present in 84% of surveyed crops, followed by P. teres (68%) and S. passerinii (46%) (Table 2). Cochliobolus sativus was the most prevalent pathogen in 2014 (Lui et. al. 2015) and 2015 (Tran et al. 2016), although incidence was higher in 2014. The incidence of the second most common pathogen, P. teres, was higher than in the two previous years. Prevalence and incidence of Septoria passerinii was the least of the three pathogens. ACKNOWLEDGEMENTS: We thank the Saskatchewan Crop Insurance Corporation for sample collection during the growing season 2016. REFERENCES: Liu, J., Tran, V.A. and Kutcher, H.R. 2015. Leaf spot diseases of barley in Saskatchewan in 2014. Can. Plant Dis. Surv. 95:72-73. Tran, V.A., Vera, J.T., Grewal, T.S. and Kutcher, H.R. 2016. Leaf spot diseases of barley in Saskatchewan in 2015. Can. Plant Dis. Surv. 96:91-92.

103
Table 1. Leaf spot disease severity in Saskatchewan 2016.
Table 2. Leaf spot disease severity in Saskatchewan 2016.
*Incidence: percentage of leaf pieces that were infected with each pathogen.
Severity (%) # Fields
Percentage of crops in each category
Trace <1% 4 11
Very slight 1-5% 12 32
Slight 6-15% 13 35
Moderate 16-40% 7 19
Severe 41-100% 1 3
Prevalence (% of crops)
Incidence* (%)
Cochliobolus sativus 84 55 Pyrenophora teres 68 34
Septoria passerinii 46 11
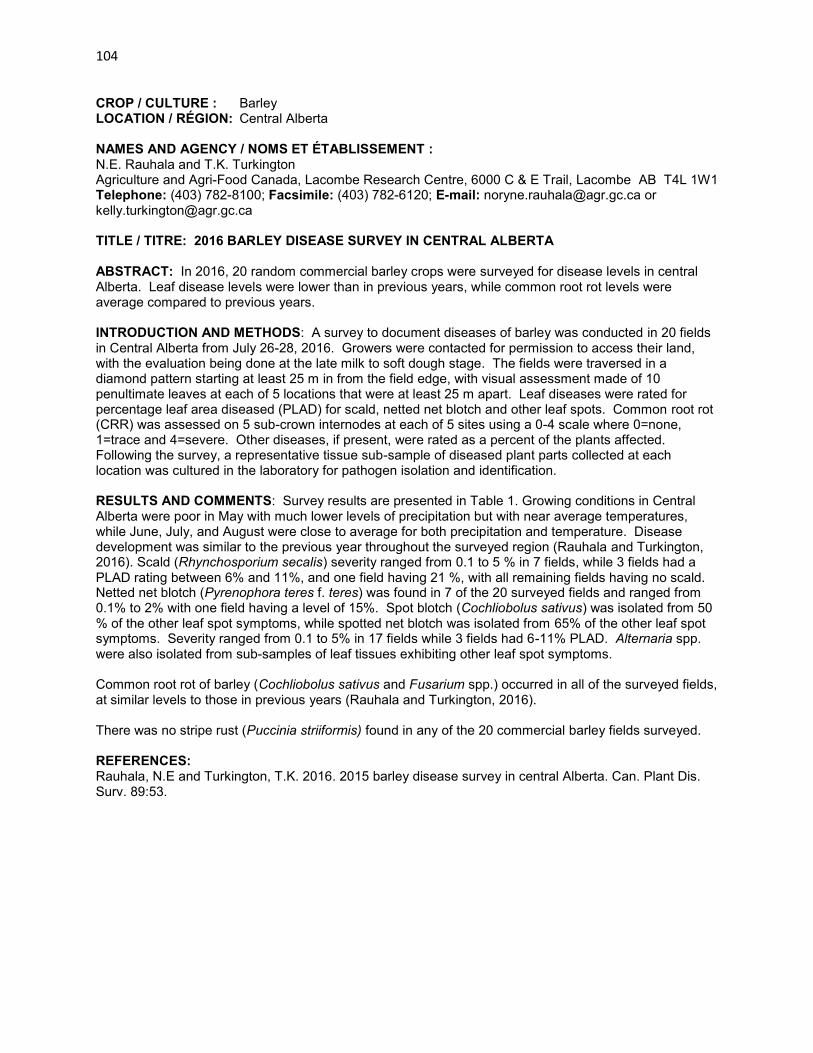
104
CROP / CULTURE : Barley LOCATION / RÉGION: Central Alberta NAMES AND AGENCY / NOMS ET ÉTABLISSEMENT : N.E. Rauhala and T.K. Turkington Agriculture and Agri-Food Canada, Lacombe Research Centre, 6000 C & E Trail, Lacombe AB T4L 1W1 Telephone: (403) 782-8100; Facsimile: (403) 782-6120; E-mail: [email protected] or [email protected] TITLE / TITRE: 2016 BARLEY DISEASE SURVEY IN CENTRAL ALBERTA ABSTRACT: In 2016, 20 random commercial barley crops were surveyed for disease levels in central Alberta. Leaf disease levels were lower than in previous years, while common root rot levels were average compared to previous years. INTRODUCTION AND METHODS: A survey to document diseases of barley was conducted in 20 fields in Central Alberta from July 26-28, 2016. Growers were contacted for permission to access their land, with the evaluation being done at the late milk to soft dough stage. The fields were traversed in a diamond pattern starting at least 25 m in from the field edge, with visual assessment made of 10 penultimate leaves at each of 5 locations that were at least 25 m apart. Leaf diseases were rated for percentage leaf area diseased (PLAD) for scald, netted net blotch and other leaf spots. Common root rot (CRR) was assessed on 5 sub-crown internodes at each of 5 sites using a 0-4 scale where 0=none, 1=trace and 4=severe. Other diseases, if present, were rated as a percent of the plants affected. Following the survey, a representative tissue sub-sample of diseased plant parts collected at each location was cultured in the laboratory for pathogen isolation and identification. RESULTS AND COMMENTS: Survey results are presented in Table 1. Growing conditions in Central Alberta were poor in May with much lower levels of precipitation but with near average temperatures, while June, July, and August were close to average for both precipitation and temperature. Disease development was similar to the previous year throughout the surveyed region (Rauhala and Turkington, 2016). Scald (Rhynchosporium secalis) severity ranged from 0.1 to 5 % in 7 fields, while 3 fields had a PLAD rating between 6% and 11%, and one field having 21 %, with all remaining fields having no scald. Netted net blotch (Pyrenophora teres f. teres) was found in 7 of the 20 surveyed fields and ranged from 0.1% to 2% with one field having a level of 15%. Spot blotch (Cochliobolus sativus) was isolated from 50 % of the other leaf spot symptoms, while spotted net blotch was isolated from 65% of the other leaf spot symptoms. Severity ranged from 0.1 to 5% in 17 fields while 3 fields had 6-11% PLAD. Alternaria spp. were also isolated from sub-samples of leaf tissues exhibiting other leaf spot symptoms. Common root rot of barley (Cochliobolus sativus and Fusarium spp.) occurred in all of the surveyed fields, at similar levels to those in previous years (Rauhala and Turkington, 2016). There was no stripe rust (Puccinia striiformis) found in any of the 20 commercial barley fields surveyed. REFERENCES: Rauhala, N.E and Turkington, T.K. 2016. 2015 barley disease survey in central Alberta. Can. Plant Dis. Surv. 89:53.

105
Table 1. Disease incidence and severity in 20 commercial barley fields in Central Alberta, 2016.
Disease (severity rating scale)
% of fields
affected
Overall average severity
Range in average severity per field
Scald (PLAD*) 55 2.3 0 –20
Netted net blotch (PLAD) 40 <1 0 – 15
Other leaf spots (PLAD) 100 2.4 1 – 11
Total leaf area diseased (PLAD) 100 5.5 1 – 32
Common root rot (0-4) 100 1.8 1 - 3
*Percentage leaf area diseased

106
CROP / CULTURE: Barley LOCATION / RÉGION: Central and Eastern Ontario NAMES AND AGENCY / NOMS ET ÉTABLISSEMENT: A.G. Xue, Y. Chen and Y. Al-Rewashdy Agriculture and Agri-Food Canada, Ottawa Research and Development Centre, K.W. Neatby Building, 960 Carling Avenue, Ottawa ON K1A 0C6 Telephone: (613) 759-1513; Facsimile: (613) 759-1926; E-mail: [email protected] TITLE / TITRE: DISEASES OF BARLEY IN CENTRAL AND EASTERN ONTARIO IN 2016 ABSTRACT: Thirty barley crops in central and eastern Ontario were surveyed for diseases in 2016. Of the 14 diseases observed, none had severe level of infection. Spot blotch, take-all and barley yellow dwarf were the most prevalent and moderate levels of these were found in 6, 5 and 3 fields, respectively. Slight infection by Fusarium head blight (FHB) was found in all field and Fusarium poae, F. sporotrichioides, and F. graminearum were the predominant species causing the FHB. INTRODUCTION AND METHODS: A survey for barley diseases was made in central and eastern Ontario, in areas where spring barley is grown, in the third week of July 2016. Thirty crops were sampled when plants were at the soft-dough stage of growth. Foliar disease severity was determined on 10 flag and penultimate leaves sampled at each of three random sites per field, using a rating scale of 0 (no disease) to 9 (severely diseased). Diagnosis was based on visual symptoms. Average severity scores of <1, <3, <6, and ≥6 were considered as trace, slight, moderate, and severe disease levels, respectively. Severity of covered smut, ergot, leaf stripe, loose smut, and take-all was based on the percent of plants infected. FHB was rated for incidence (% infected spikes) and severity (% infected spikelets in the affected spikes) based on approximately 200 spikes at each of three random sites per field. A FHB index [(% incidence x % severity)/100] was determined for each field. The percentage of infected plants or FHB index values of <1, <10, <20, and ≥20% were considered as slight, moderate, severe, and very severe disease levels, respectively. Determination of the causal species of FHB was based on 50 infected spikes collected from each field. The spikes were air-dried at room temperature and threshed. Fifty discolored kernels per sample were chosen at random, surface sterilized in 1% NaOCI for 60 sec. and plated in 9-cm diameter petri dishes on modified potato dextrose agar (10 g dextrose per liter amended with 50 ppm of streptomycin sulphate). The plates were incubated for 10-14 days at 22-25ºC and a 14-hour photoperiod using fluorescent and long wavelength light. Fusarium species isolated from kernels were identified by microscopic examination using standard taxonomic keys. RESULTS AND COMMENTS: The survey included 4 two-row and 26 six-row barley fields. A total of 14 diseases or disease complexes were observed (Table 1). Spot blotch (Cochliobolus sativus), net blotch (normally associated with the pathogen Pyrenophora teres) and barley yellow dwarf (BYDV) were the most common, and were found in 30, 28, and 26 fields at average severities of 2.6, 1.4, and 2.0 respectively. Severe infection from these diseases was not found, but moderate disease levels from spot blotch, net blotch, and barley yellow dwarf were observed in 6, 1, and 3 fields, respectively. Yield reductions due to these diseases were estimated to have averaged <3% in affected fields. Other foliar diseases observed included leaf rust (Puccinia hordei), powdery mildew (Blumaria graminis), scald (Rhynchosporium secalis), septoria complex [including speckled leaf blotch (Septoria tritici) and leaf blotch (Stagonospora nodorum)], and stem rust (Puccinia graminis f. sp. tritici or f. sp. secalis); they were observed in 19, 10, 5, 23, and 7 fields at mean severities of 1.3, 1.4, 1.0, 1.4, and 1.4, respectively. Although one field had a moderate level of leaf rust and another field had a moderate level of septoria complex (Table 1), none of these diseases would have resulted in substantive damage to the crop. Ergot (Claviceps purpurea), loose smut (Ustilago nuda) and the root disease take-all (Gaeumannomyces graminis) were observed in all fields at mean incidences of 1.0, 0.4, and 1.8%, respectively (Table 1). Severe infection from these diseases was not observed, but moderate disease levels due to ergot and take-all were found in 3 and 5 fields, respectively. Yield reductions by ergot and take-all were estimated to be <3% in affected fields.
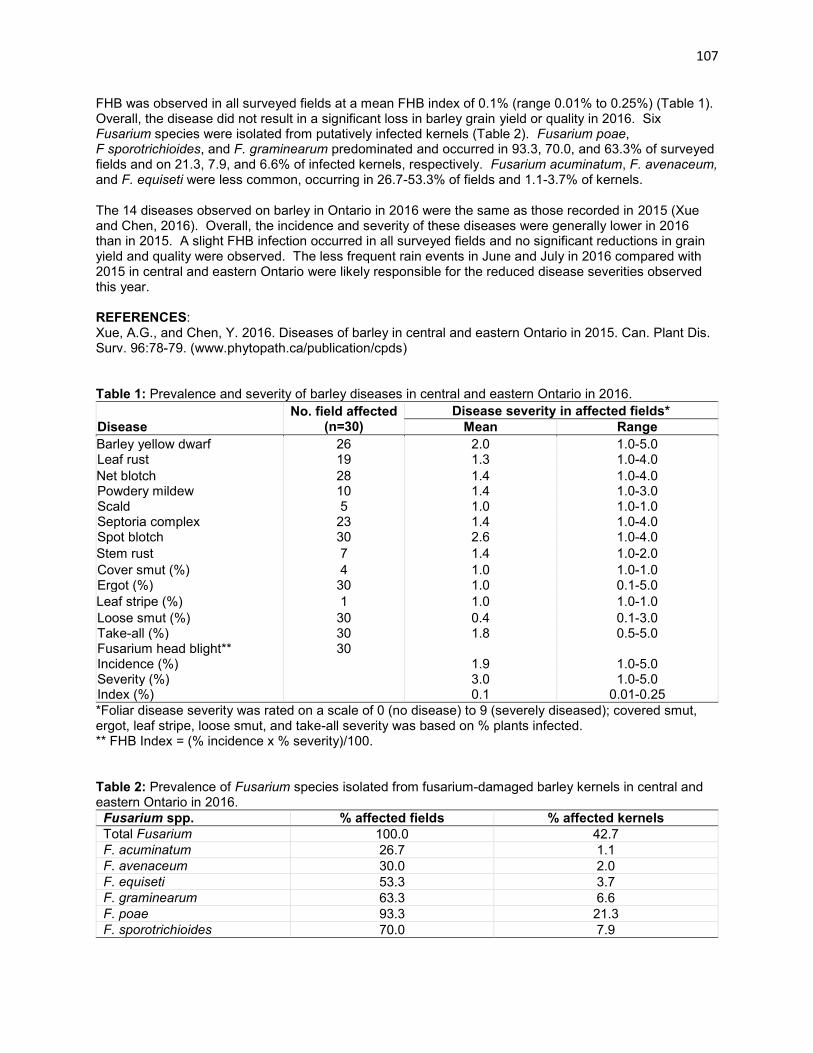
107
FHB was observed in all surveyed fields at a mean FHB index of 0.1% (range 0.01% to 0.25%) (Table 1). Overall, the disease did not result in a significant loss in barley grain yield or quality in 2016. Six Fusarium species were isolated from putatively infected kernels (Table 2). Fusarium poae, F sporotrichioides, and F. graminearum predominated and occurred in 93.3, 70.0, and 63.3% of surveyed fields and on 21.3, 7.9, and 6.6% of infected kernels, respectively. Fusarium acuminatum, F. avenaceum, and F. equiseti were less common, occurring in 26.7-53.3% of fields and 1.1-3.7% of kernels. The 14 diseases observed on barley in Ontario in 2016 were the same as those recorded in 2015 (Xue and Chen, 2016). Overall, the incidence and severity of these diseases were generally lower in 2016 than in 2015. A slight FHB infection occurred in all surveyed fields and no significant reductions in grain yield and quality were observed. The less frequent rain events in June and July in 2016 compared with 2015 in central and eastern Ontario were likely responsible for the reduced disease severities observed this year. REFERENCES: Xue, A.G., and Chen, Y. 2016. Diseases of barley in central and eastern Ontario in 2015. Can. Plant Dis. Surv. 96:78-79. (www.phytopath.ca/publication/cpds) Table 1: Prevalence and severity of barley diseases in central and eastern Ontario in 2016.
Disease
No. field affected (n=30)
Disease severity in affected fields*
Mean Range
Barley yellow dwarf 26 2.0 1.0-5.0 Leaf rust 19 1.3 1.0-4.0
Net blotch 28 1.4 1.0-4.0 Powdery mildew 10 1.4 1.0-3.0 Scald 5 1.0 1.0-1.0 Septoria complex 23 1.4 1.0-4.0 Spot blotch 30 2.6 1.0-4.0
Stem rust 7 1.4 1.0-2.0
Cover smut (%) 4 1.0 1.0-1.0 Ergot (%) 30 1.0 0.1-5.0
Leaf stripe (%) 1 1.0 1.0-1.0
Loose smut (%) 30 0.4 0.1-3.0 Take-all (%) 30 1.8 0.5-5.0 Fusarium head blight** 30 Incidence (%) 1.9 1.0-5.0 Severity (%) 3.0 1.0-5.0 Index (%) 0.1 0.01-0.25
*Foliar disease severity was rated on a scale of 0 (no disease) to 9 (severely diseased); covered smut, ergot, leaf stripe, loose smut, and take-all severity was based on % plants infected. ** FHB Index = (% incidence x % severity)/100. Table 2: Prevalence of Fusarium species isolated from fusarium-damaged barley kernels in central and eastern Ontario in 2016.
Fusarium spp. % affected fields % affected kernels
Total Fusarium 100.0 42.7
F. acuminatum 26.7 1.1
F. avenaceum 30.0 2.0
F. equiseti 53.3 3.7
F. graminearum 63.3 6.6
F. poae 93.3 21.3
F. sporotrichioides 70.0 7.9

108
CROP / CULTURE: Canary seed LOCATION / RÉGION: Saskatchewan NAMES AND AGENCIES / NOMS ET ÉTABLISSEMENT: P. Cholango-Martinez, A.G. Liew, E. Meyers, P. Hucl and H.R. Kutcher Crop Development Centre, University of Saskatchewan, 51 Campus Drive, Saskatoon SK S7N 5A8 Telephone: (306) 966-8661 Facsimile: (306) 966-5015 E-mail: [email protected] TITLE / TITRE: LEAF MOTTLE AND FUSARIUM SPP. IN CANARY SEED IN SASKATCHEWAN IN 2016 ABSTRACT: Leaf mottle (Septoria triseti Speg.) was detected in 20 out of the 24 canary seed crops surveyed, with disease severities of trace to moderate. Fusarium graminearum Schwabe was the most prevalent fusarium species on canary seed crops (48%), followed by F. avenaceum (12%), F. poae (8%) and F. equiseti (4%). The incidence of fusarium species was lower than in the two previous years. INTRODUCTION AND METHODS: A survey of canary seed crops was conducted between August 3rd and 19th 2016. Twenty-four randomly selected crops varied between BBCH growth stages 65 - 89 (full flower - maturity) (Lancashire et al. 1991). Ten leaves were assessed for leaf mottle severity and categorized as follows: trace (<1% of leave tissue affected), very slight (1-5%), slight (6-15%), moderate (16-40%) and severe (41-100%). Ten leaves from each of the 24 crops, with or without symptoms (necrosis with black pycnidia) were collected and cut into pieces, surface sterilized with a 5% bleach (NaOCl) solution for 1 min and then rinsed 3 times in sterile water. The leaf pieces were plated on filter paper; after 24 h the presence of cirrhi on the leaf surface confirmed the presence of Septoria triseti. Incidence of seed infected by Fusarium spp. was determined in 24 crops (100 seeds per crop). Seeds were surface sterilized in 5% bleach (NaOCl) solution for 1 min and rinsed three times in sterile water and dried. Seeds were then plated on PDA and placed under a 12 hour light/dark regime at room temperature for 5 days (Warham at al. 1995). Fusarium spp. were identified morphologically from examination of spores and mycelial growth (Gerlach and Nirenberg 1982). Prevalence of Septoria triseti and Fusarium spp. was determined by counting the proportion of crops affected, and incidence by counting the number of leaves (from the 10 leaves plated) and number of seeds affected by each Fusarium sp. of the 100 plated for each canary seed crop. RESULTS AND CONCLUSIONS: Prevalence of leaf mottle was 83%; 17% (eight crops) were free of leaf mottle. Among the 24 fields, 13% were categorized as trace, 13% as very slight, 21% as slight, and 38% as moderate; none of the crops were assessed as severe (Table 1). Among the 240 leaf pieces plated, 105 were affected by Septoria triseti, with an incidence of 44%. The most highly infected crops were observed in the Kindersley area, where precipitation was 40% higher than the long term average. The prevalence of fusarium species on seeds of canary seed was 64% (Table 2). The prevalence and incidence of F. graminearum in 2016 was lower than in 2015 (Cholango-Martinez et. al. 2015). Among the 24 crops, 32% were surveyed during flowering, 24% at milk, 28% soft and 16% hard dough stage. This indicated that 56% of the fields were surveyed during the growth stage where the presence of fusarium seed infection was not able to be detected, resulting in the lower incidence of fusarium seed infection reported in 2016. In addition, four species were identified: F. graminearum, F. avenaceum, F. equiseti and F. poae. The most common species observed was F. graminearum (48%). ACKNOWLEDGEMENTS: We thank Mallory Dyck and CFPATH group for survey coordination.
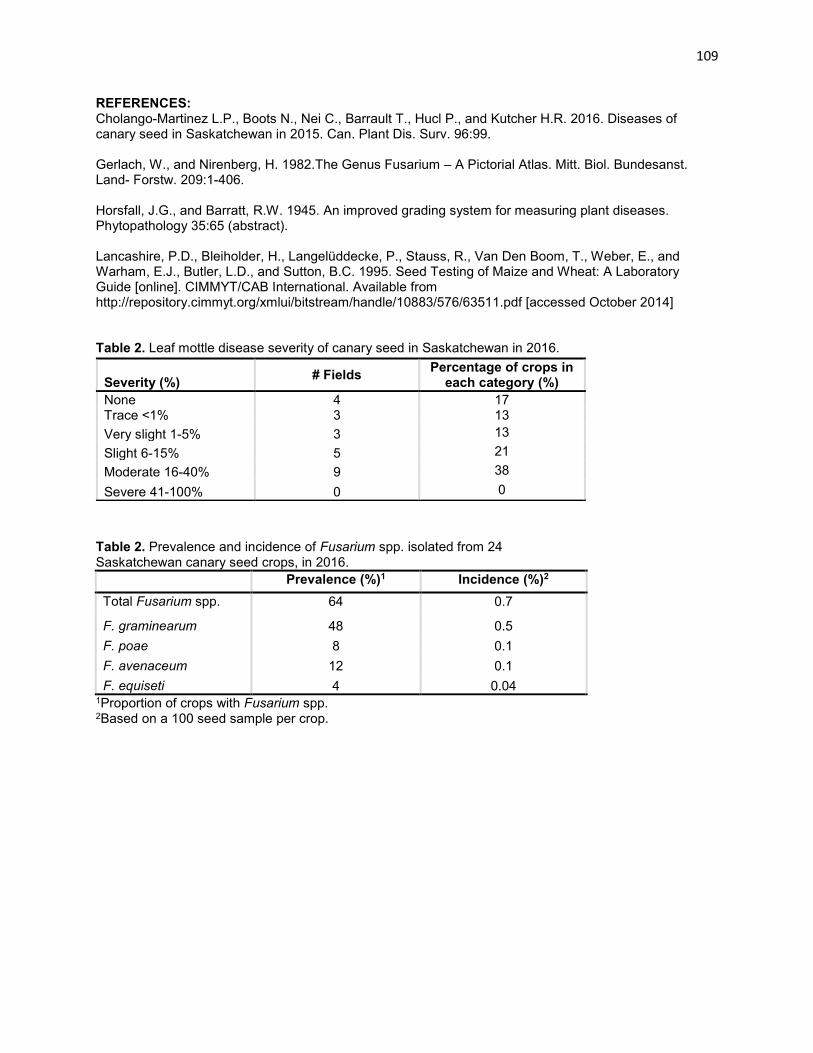
109
REFERENCES: Cholango-Martinez L.P., Boots N., Nei C., Barrault T., Hucl P., and Kutcher H.R. 2016. Diseases of canary seed in Saskatchewan in 2015. Can. Plant Dis. Surv. 96:99. Gerlach, W., and Nirenberg, H. 1982.The Genus Fusarium – A Pictorial Atlas. Mitt. Biol. Bundesanst. Land- Forstw. 209:1-406. Horsfall, J.G., and Barratt, R.W. 1945. An improved grading system for measuring plant diseases. Phytopathology 35:65 (abstract). Lancashire, P.D., Bleiholder, H., Langelüddecke, P., Stauss, R., Van Den Boom, T., Weber, E., and Warham, E.J., Butler, L.D., and Sutton, B.C. 1995. Seed Testing of Maize and Wheat: A Laboratory Guide [online]. CIMMYT/CAB International. Available from http://repository.cimmyt.org/xmlui/bitstream/handle/10883/576/63511.pdf [accessed October 2014] Table 2. Leaf mottle disease severity of canary seed in Saskatchewan in 2016.
Table 2. Prevalence and incidence of Fusarium spp. isolated from 24 Saskatchewan canary seed crops, in 2016.
Prevalence (%)1 Incidence (%)2
Total Fusarium spp. 64 0.7
F. graminearum 48 0.5
F. poae 8 0.1
F. avenaceum 12 0.1
F. equiseti 4 0.04 1Proportion of crops with Fusarium spp. 2Based on a 100 seed sample per crop.
Severity (%) # Fields
Percentage of crops in each category (%)
None 4 17 Trace <1% 3 13
Very slight 1-5% 3 13
Slight 6-15% 5 21
Moderate 16-40% 9 38
Severe 41-100% 0 0

110
Table 3. Incidence (%) of Fusarium spp. on 100-seed samples of canary seed from 24 Saskatchewan crops in 2016.
Field # Crop
District F. graminearum
(%) F. poae
(%) F. avenaceum
(%) F. equiseti
(%)
1 2B 1 0 0 0
2 2B 0 0 0 0
3 2B 0 1 0 0
4 2B 1 0 0 0
5 2B 1 0 0 0
6 2B 1 0 0 0
7 2B 1 0 0 0
8 2B 1 0 0 0
9 3B 0 0 1 0
10 3B 0 0 0 0
11 3B 0 0 0 0
12 3B 0 0 0 0
13 3B 1 0 0 0
14 4B 1 0 0 1
15 4B 0 1 0 0
16 4B 1 0 1 0
17 7A 0 0 0 0
18 7A 0 0 0 0
19 7A 0 0 0 0
20 7A 0 0 0 0
21 7A 0 0 1 0
22 7A 0 0 0 0
23 7A 1 0 0 0
24 7A 1 0 0 0
25 7A 1 0 0 0

111
CROP / CUTURE: Oat LOCATION / RÉGION: Manitoba NAMES AND AGENCY / NOMS ET ÉTABLISSEMENT: M. Banik, M. Beyene and X. Wang Agriculture and Agri-Food Canada, Morden Research and Development Centre, 101 Route 100, Morden MB R6M 1Y5 Telephone: (204) 822-7530; Facsimile: (204) 822-7507; E-mail: [email protected] TITLE / TITRE: FUSARIUM HEAD BLIGHT OF OAT IN MANITOBA – 2016 ABSTRACT: Forty three oat fields in Manitoba were surveyed for fusarium head blight (FHB) to assess severity and the causal Fusarium species. Visual symptoms were observed in most of the fields and Fusarium spp. were identified from the infected kernels of all 43 fields. F. graminearum was the predominant species detected, followed by F. poae, F. sporotrichioides, F. avenaceum and F. equiseti. INTRODUCTION AND METHODS: A total of 43 oat fields in Manitoba were monitored for the prevalence of fusarium head blight from July 18-August 5 when crops were at the early- to soft- dough (ZGS 79-83) stages of growth. Fields were selected at regular intervals approximately 20-25 km along the survey routes, depending on crop frequency. The area sampled was bounded by HWY 67 and 16 to the north, 12 to the east, 3 to the south, 8 to the north and 83 to the west. FHB incidence (the percentage of spikes showing typical FHB symptoms) was assessed by sampling 95-110 panicles at three locations and averaging the scores. Subsequently, 1 g of infected kernels was removed from 15 randomly selected panicles from each field and was frozen in liquid nitrogen and ground to a powder using Spex Sample Prep 2010 Geno/Grinder. DNA was extracted from the ground grain sample from each field using the QIAGEN DNeasy Mini Kit (QIAGEN). Molecular techniques such as conventional polymerase chain reaction (PCR) or quantitative real-time PCR were performed using Fusarium species-specific oligonucleotide primers commonly detected in cereal crops (Demeke et al. 2005; Nicolaisen et al. 2009). Real time PCR was executed with the Real-Time PCR system CFX96 PCR system (BioRad) using 2XSsoFast EvaGreen supermixes (BioRad) and 37 cycles threshold (Ct) cut-off detection limit was used to detect and quantify the Fusarium species present. RESULTS AND COMMENTS: In 2016, crop growing conditions in Manitoba were wetter than normal due to extreme weather such as rain, hail, and wind, which resulted in lodging and stalk breakage. A total of 336,427 acres of oat were seeded in Manitoba, a reduction of 25% compared to 2015. ‘Summit’, ‘Souris’, and ‘CS Cadman’ were top three cultivars grown and made up to 72.4% of the total oat production area in Manitoba (MASC, 2016), while ‘Summit’ was the top most cultivated (32%) variety. In contrast, ‘Souris’ was the top most cultivated (37%) variety in 2015 (Yield Manitoba, 2016). Most of oat crops surveyed showed definitive FHB symptoms, such as orange-pink discolouration of spikelets. In some fields a few spikelets of a panicle or the entire panicle exhibited discoloration or bleaching. The later situation is unusual and made disease diagnosis equivocal. Fusarium infection was detected in all 43 fields by PCR (Table 1). F. graminearum was the most predominant species detected in the surveyed fields (41 fields), followed by F. poae (12 fields), F. sporotrichioides (10 fields), F. avenaceum (9 fields) and F. equiseti (4 fields) (Table 1). In contrast, F. poae was the most common species in previous survey years (Tekauz et al. 2011; 2016ab). Similar to oat fields, F. graminearum was also found in higher level in barley fields in 2016. Extreme weather conditions in 2016 appear to have favoured oat kernel infestation by F. graminearum compared with other Fusarium species. Symptoms of fusarium head blight in 2016 were at the highest levels observed since surveys in oat in Manitoba were initiated in 2002 and resulted in an estimated 5-10% loss in yield or quality in the commercial oat crop based on visual symptoms.

112
Real-time PCR was performed with F. poae and F. sporotrichioides primers to detect and quantify these species. F. poae and F. sporotrichioides were detected from a total of 36 and 31 of the fields where conventional PCR detected only in 12 and 10 of the fields, respectively. The amounts of DNA for both species in a few samples were at a higher level, and ranged from 0.001-200pg/ ng and 0.009—160pg/ng respectively (Table 2). A comparison of the two DNA-based methods for identification indicates that real-time PCR was more sensitive for detecting the presence and quantity of Fusarium spp. than conventional PCR. REFERENCES: Beyene, M., Banik, M and Wang, X. 2016a. Fusarium head blight of oat – Manitoba 2014 Can. Plant Dis. Surv. 96:111-112. (phytopath.ca/publication/cpds). Beyene, M., Banik, M. and Wang, X. 2016b. Fusarium head blight of oat – Manitoba 2015 Can. Plant Dis. Surv. 96:113-114. (phytopath.ca/publication/cpds). Demeke, T., Clear, R.M., Patrick, S.K. and Gaba, D. 2005. Species-specific PCR-based assays for the detection of Fusarium species and a comparison with the whole seed agar plate method and trichothecene analysis. Int. J. Food Microbiol. 103(3):271-84 (doi:10.1016/j.ijfoodmicro.2004.12.026). Manitoba Agricultural Services Corporation (MASC). 2016. Variety Market Share Information Report. Nicolaisen, M., Suproniene, S., Nielsen, L.K., Lazzaro, I., Spliid, N.H. and Justesen, A.F. 2009. Real-time PCR for quantification of eleven individual Fusarium species in cereals. J. Microbiol. Methods. 76: 234-240. (doi: 10.1016/j.mimet.2008.10.016). Tekauz, A., Stulzer, M., Beyene, M., Dupriez, M. and Harrs, A. 2012. Fusarium head blight of oat –Manitoba 2011. Can. Plant Dis. Surv. 92:90-91. (phytopath.ca/publication/cpds). Yield Manitoba 2016. Manitoba Crop Services Corporation, supplement to the Manitoba Co-operator. 2016. Table 1. Fusarium spp. detected by PCR of FHB-affected kernels from 43 oat fields in Manitoba in 2016.
Fusarium spp. Percentage of positive fields
F. avenaceum 21.3
F. graminearum 95.35
F. poae 27.9
F. sporotrichioides 23.25
F.equiseti 9.3
Table 2. Amount of F. poae and F. sporotrichioides DNA detected by real-time PCR from FHB-affected kernels in Manitoba in 2016.
Fusarium spp. % of fields Range Mean
F. poae 84 1-200.5 20.52
F.sporotrichiodes 72 0.9-160.3 16.66

113
CROP / CULTURE: Oat LOCATION / RÉGION: Manitoba, Saskatchewan and Ontario NAMES AND AGENCY / NOMS ET ÉTABLISSEMENT: J.G. Menzies1, A.G. Xue2, S. Deceuninck1, Z. Popovic1 and J. Friesen1
1Morden Research and Development Centre, Agriculture and Agri-Food Canada, 101 Route 100, Morden MB R6M 1Y5 Telephone: 204-822-7522; Facsimile: 204-822-7507; E-mail: [email protected] 2Agriculture and Agri-Food Canada, Ottawa Research and Development Centre, K.W. Neatby Building, 960 Carling Avenue, Ottawa ON K1A 0C6 TITLE / TITRE: CROWN RUST OF OAT IN MANITOBA, SASKATCHEWAN AND ONTARIO IN 2015 ABSTRACT: In 2015, 100 fields with wild oats and 66 fields of common oats were surveyed for the incidence and severity of Puccinia coronata f. sp. avenae in Manitoba and eastern Saskatchewan. Crown rust infected plants were found in 82 (82%) and 45 (69%) of all wild and common oat fields at mean incidences of 26% and 23%, and mean severities of 2 MS and 3 MS, respectively. No virulence was detected to resistance gene Pc94 in common oat collections from Manitoba and Saskatchewan. Only 4 collections were viable from Ontario and no virulence was detected to the resistance genes Pc45, Pc50, Pc51, Pc54, Pc58, Pc59, Pc64, Pc91, Pc94, PC96, PC97, Pc98, PC101, and Pc103-1 in those collections. INTRODUCTION AND METHODS: Surveys for incidence and severity of oat crown rust (caused by Puccinia coronata Cda f. sp. avenae Eriks.) were conducted in Manitoba and Saskatchewan from August 2 to August 10, 2015. The areas surveyed were in crop districts 1, 2, 3, 7, 8, 9, 11 and 12 in Manitoba and crop districts 1, 2, 5, and 6 in Saskatchewan. Incidence was considered to be the percentage of leaves infected with rust in a given field, and the severity was the mean percentage leaf area with pustules. Crown rust collections were obtained from wild oat (Avena fatua L.) and common oat (A. sativa L.) in commercial farm fields, and susceptible and resistant oat lines and cultivars grown in uniform rust nurseries. The nurseries were located at Emerson and Thornhill, MB, and Indian Head, SK. Samples from fields in Ontario were collected in July. For virulence studies, single-pustule isolates (spi) were established from the rust collections. Races were identified using 16 standard oat crown rust differentials (Table 1) as described by Chong et al. (2000). In addition, single Pc-gene lines with Pc91, Pc94, Pc96, temp_pc97, temp_Pc98, Pc101, Pc103-1, and Pc104 were used as supplemental differentials. RESULTS AND COMMENTS: One hundred fields with wild oats and 66 fields of common oat lines were surveyed in Manitoba and Saskatchewan. Wild oat plants infected with P. coronata f. sp. avenae were found in 82 (82%) of the fields, and infected common oat plants were found in 45 (69%) of the fields.
Crown rust incidence on wild oats ranged from 0 to 100%, with a mean incidence of 26%. The severity of crown rust on wild oats ranged from 0 to 20S with a mean severity of 2MS. The incidence and severity of crown rust infection on wild oats was higher in southcentral Manitoba.
Crown rust incidence on commercial oats ranged from 0 to 100%, with a mean incidence of 23%. The severity of crown rust on common oats ranged from 0 to 5S and 10MS with a mean severity of 3MS. The incidence and severity of crown rust infection on common oats was generally higher in Manitoba crop districts 8 and 9 and Saskatchewan crop district 1.
One hundred sixteen spi were made from wild oats and 111 races were identified from these spi. The number of spi of each race was usually one, but occasionally two. Virulence to each Pc gene was observed in the wild oat spi, although it was not common (5% or less) for genes Pc50 and Pc94 (Table 1). Fifty three spi were made from common oat collections with 52 races identified from these spi. None of the common oat derived spi had virulence to the resistance gene Pc94 and virulence to Pc97 was not common (2%) (Table 1).

114
Twenty five spi were made from collections from the Uniform Rust Nursery and 24 races identified. Virulence to Pc64 and Pc94 was not observed using the Uniform Rust Nursery spi (Table 1) and virulence to Pc96, Pc98 and Pc101 was not common (4%). Only 4 spi were made from the eastern Canada collections, and 4 races identified. All four races were virulent to Pc38, Pc39, Pc48, Pc52, Pc56 and Pc68 (Table 1). With only 4 spi, virulence to a number of Pc genes was not observed in 2015. Greater than 50% of all spi from the 2015 collections possessed virulence to resistance genes Pc38, Pc39, Pc45, Pc46, Pc51, Pc56, Pc68 and Pc91. The high levels of virulence to Pc38, and Pc39 likely reflect the deployment of Pc38 and Pc39 in combination in the eastern prairies, as well as North Dakota and Minnesota since the 1980s. The high levels of virulence to Pc91 likely reflect its recent deployment in commercial oat lines. REFERENCES: Chong, J., J. Gruenke, R. Dueck, W. Mayert, and S. Woods. 2008. Virulence of oat crown rust [Puccinia coronata f. sp. avenae] in Canada during 2002-2006. Can. J. Plant Pathol. 30:115-123. Chong, J., K.J. Leonard, and J.J. Salmeron. 2000. A North American system of nomenclature for Puccinia coronata f. sp. avenae. Plant Dis. 84:580-585.

115
Table 1. Frequencies (%) of virulence of Puccinia coronata f. sp. avenae isolates from the eastern Canadian Prairie region and eastern Canada on 16 standard and eight supplemental crown rust differential oat lines in 2015.
Oat lines and Pc gene present
Wild Oat Commercial Oat Field
Uniform Rust Nursery
Eastern Canada
No. of
isolates
Percent No. of
isolates
Percent No. of
isolates
Percent No. of
isolates
Percent
Standard
Pc38 115 99 53 100 25 100 4 100
Pc39 112 97 53 100 25 100 4 100
Pc40 41 35 9 17 7 28 1 25
Pc45 71 61 30 57 11 44 0 0
Pc46 69 59 33 62 15 60 1 25
Pc48 42 36 33 62 20 80 4 100
Pc50 6 5 3 6 2 8 0 0
Pc51 91 78 41 77 15 60 0 0
Pc52 39 34 29 55 17 68 4 100
Pc54 19 16 5 9 4 16 0 0
Pc56 111 96 53 100 23 92 4 100
Pc58a 20 17 10 19 2 8 0 0
Pc59a 26 22 11 21 5 20 0 0
Pc62 25 22 14 26 6 24 1 25
Pc64 21 18 5 9 0 0 0 0
Pc68 66 57 32 60 14 56 4 100
Supplemental
Pc91 67 58 40 75 15 60 0 0
Pc94 3 3 0 0 0 0 0 0
Pc96 9 8 6 11 1 4 0 0
Temp_Pc97 11 9 1 2 2 8 0 0
Temp_Pc98 10 9 3 6 1 4 0 0
Pc101 11 9 3 6 1 4 0 0
Pc103-1 22 19 13 25 2 8 0 0
Pc104 20 17 7 13 8 32 1 25
Total 116 53 25 4 aThe Pc58-differential was shown to carry three linked genes, and the Pc59-differential three unlinked genes (Chong et al. 2008).
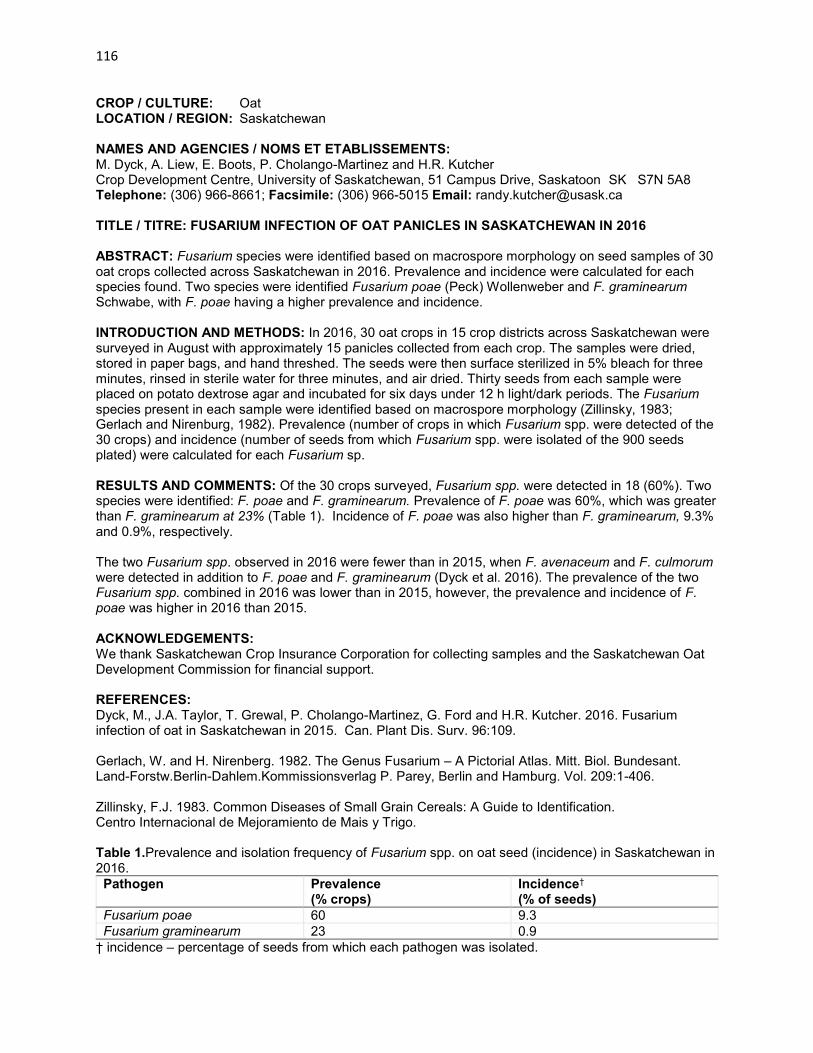
116
CROP / CULTURE: Oat LOCATION / REGION: Saskatchewan NAMES AND AGENCIES / NOMS ET ETABLISSEMENTS: M. Dyck, A. Liew, E. Boots, P. Cholango-Martinez and H.R. Kutcher Crop Development Centre, University of Saskatchewan, 51 Campus Drive, Saskatoon SK S7N 5A8 Telephone: (306) 966-8661; Facsimile: (306) 966-5015 Email: [email protected] TITLE / TITRE: FUSARIUM INFECTION OF OAT PANICLES IN SASKATCHEWAN IN 2016 ABSTRACT: Fusarium species were identified based on macrospore morphology on seed samples of 30 oat crops collected across Saskatchewan in 2016. Prevalence and incidence were calculated for each species found. Two species were identified Fusarium poae (Peck) Wollenweber and F. graminearum Schwabe, with F. poae having a higher prevalence and incidence. INTRODUCTION AND METHODS: In 2016, 30 oat crops in 15 crop districts across Saskatchewan were surveyed in August with approximately 15 panicles collected from each crop. The samples were dried, stored in paper bags, and hand threshed. The seeds were then surface sterilized in 5% bleach for three minutes, rinsed in sterile water for three minutes, and air dried. Thirty seeds from each sample were placed on potato dextrose agar and incubated for six days under 12 h light/dark periods. The Fusarium species present in each sample were identified based on macrospore morphology (Zillinsky, 1983; Gerlach and Nirenburg, 1982). Prevalence (number of crops in which Fusarium spp. were detected of the 30 crops) and incidence (number of seeds from which Fusarium spp. were isolated of the 900 seeds plated) were calculated for each Fusarium sp. RESULTS AND COMMENTS: Of the 30 crops surveyed, Fusarium spp. were detected in 18 (60%). Two species were identified: F. poae and F. graminearum. Prevalence of F. poae was 60%, which was greater than F. graminearum at 23% (Table 1). Incidence of F. poae was also higher than F. graminearum, 9.3% and 0.9%, respectively. The two Fusarium spp. observed in 2016 were fewer than in 2015, when F. avenaceum and F. culmorum were detected in addition to F. poae and F. graminearum (Dyck et al. 2016). The prevalence of the two Fusarium spp. combined in 2016 was lower than in 2015, however, the prevalence and incidence of F. poae was higher in 2016 than 2015. ACKNOWLEDGEMENTS: We thank Saskatchewan Crop Insurance Corporation for collecting samples and the Saskatchewan Oat Development Commission for financial support. REFERENCES: Dyck, M., J.A. Taylor, T. Grewal, P. Cholango-Martinez, G. Ford and H.R. Kutcher. 2016. Fusarium infection of oat in Saskatchewan in 2015. Can. Plant Dis. Surv. 96:109. Gerlach, W. and H. Nirenberg. 1982. The Genus Fusarium – A Pictorial Atlas. Mitt. Biol. Bundesant. Land-Forstw.Berlin-Dahlem.Kommissionsverlag P. Parey, Berlin and Hamburg. Vol. 209:1-406. Zillinsky, F.J. 1983. Common Diseases of Small Grain Cereals: A Guide to Identification. Centro Internacional de Mejoramiento de Mais y Trigo. Table 1.Prevalence and isolation frequency of Fusarium spp. on oat seed (incidence) in Saskatchewan in 2016.
Pathogen Prevalence (% crops)
Incidence† (% of seeds)
Fusarium poae 60 9.3
Fusarium graminearum 23 0.9
† incidence – percentage of seeds from which each pathogen was isolated.

117
CROP / CULTURE: Oat LOCATION / RÉGION: Central and eastern Ontario NAMES AND AGENCY / NOMS ET ÉTABLISSEMENT: A.G. Xue, Y. Chen and Y. Al-Rewashdy Agriculture and Agri-Food Canada, Ottawa Research and Development Centre, K.W. Neatby Building, 960 Carling Avenue, Ottawa ON K1A 0C6 Telephone: (613) 759-1513; Facsimile: (613) 759-1926; E-mail: [email protected] TITLE / TITRE: DISEASES OF OAT IN CENTRAL AND EASTERN ONTARIO IN 2016 ABSTRACT: Twenty-three oat crops in central and eastern Ontario were surveyed for diseases in 2016. Of the 11 diseases observed, stagonospora leaf blotch, barley yellow dwarf, and take-all were most prevalent. Fusarium head blight (FHB) was found in all fields, but only at slight levels. Fusarium poae was the predominant species causing FHB. INTRODUCTION AND METHODS: A survey to document diseases in central and eastern Ontario oat crops was conducted in the third week of July 2016 when plants were at the soft dough stage of development. Twenty-three fields were chosen at random in regions where most oat crops were grown. Foliar disease severity was determined on 10 flag and penultimate leaves sampled at each of three random sites per field, using a rating scale of 0 (no disease) to 9 (severely diseased). Disease diagnosis was based on visual symptoms. Average severity scores of <1, <3, <6, and ≥6 were considered trace, slight, moderate, and severe disease levels, respectively. Severity of ergot, loose smut, and take-all was based on the percent of plants infected. FHB was rated for incidence (% infected panicles) and severity (% infected spikelets in the affected panicles) based on approximately 200 panicles at each of three random sites per field. A FHB index [(% incidence x % severity)/100] was determined for each field. The percentage of infected plants or FHB index values of <1, <10, <20, and ≥20% were considered as slight, moderate, severe, and very severe disease levels, respectively. Determination of the causal species of FHB was based on 50 infected panicles (heads) collected from each field. The panicles were air-dried at room temperature and subsequently threshed. Fifty discolored kernels per sample were chosen at random, surface sterilized in 1% NaOCI for 60 seconds and plated in 9-cm diameter petri dishes on modified potato dextrose agar (10 g dextrose per liter amended with 50 ppm of streptomycin sulphate). The plates were incubated for 10-14 days at 22-25ºC and a 14-hour photoperiod using fluorescent and long wavelength ultraviolet tubes. The Fusarium species isolated were identified by microscopic examination using standard taxonomic keys. RESULTS AND COMMENTS: Eleven diseases were identified and all, except for stem rust (Puccinia graminis f. sp. tritici), were commonly observed (Table 1). Stagonospora leaf blotch (normally associated with the pathogen Stagonospora avenae f. sp. avenaria), and barley yellow dwarf (BYDV) were the most important diseases and were found in 22 and 23 fields at average severities of 2.4 and 2.0, respectively. Severe infection from the two diseases was not found, but moderate disease levels of stagonospora leaf blotch and BYDV were observed in 4 and 3 fields, respectively. Other foliar diseases observed were crown rust (Puccinia coronata f. sp. avenae), halo blight (Pseudomonas syringae pv. coronafaciens), pyrenophora leaf blotch (Pyrenophora avenae), spot blotch (Cochliobolus sativus), and stem rust. Severe levels of these diseases were not found except for crown crust that was observed in one field. These diseases collectively likely resulted in yield reductions of <3% in affected crops. Ergot (Claviceps purpurea), loose smut (Ustilago nuda) and take-all root rot (Gaeumannomyces graminis var. avenae) were observed in all fields at incidence levels of 0.2, 0.4, and 2.1%, respectively (Table 1). Severe infection from these diseases was not observed, but moderate disease levels of loose smut and take-all were found in 3 and 7 fields, respectively. Yield reductions by loose smut and take-all were estimated <5% in affected fields. Fusarium head blight occurred in all fields at a mean FHB index of 0.3% (range 0.01-2.0%) (Table 1). The disease was recorded at slight levels in affected crops. Seven Fusarium species were isolated from discoloured kernels (Table 2). Fusarium poae predominated and occurred in 87% of fields and on 14.1%

118
of kernels. Fusarium avenaceum, F. equiseti, F. graminearum and F. sporotrichioides were less common and found in 30, 22, 17, and 17% of fields and on 1.0, 1.5, 0.7, and 2.1% of kernels. Fusarium acuminatum and F. oxysporum were least common, occurring in 4-9% of fields and on 0.1-0.6% of kernels. The 11 diseases observed on oat in Ontario in 2016 were the same as those recorded in 2015 except for stem rust that was not found in 2015 (Xue and Chen, 2016). Overall, the incidence and severity of these diseases were generally lower in 2016 than in 2015. A slight FHB infection occurred in all surveyed fields and no significant reductions in grain yield and quality were observed. The less frequent rain events in June and July in 2016 compared with 2015 in central and eastern Ontario were likely responsible for the reduced disease severities observed this year. REFERENCE: Xue, A.G., and Chen, Y. 2016. Diseases of oat in central and eastern Ontario in 2015. Can. Plant Dis. Surv. 96:115-116. (www.phytopath.ca/publication.cpds) Table 1: Prevalence and severity of oat diseases in central and eastern Ontario in 2016.
DISEASE
No. field affected (n=23)
Disease severity in affected fields*
Mean Range
Barley yellow dwarf 23 2.0 1.0-4.0
Crown rust 11 2.9 1.0-6.0
Halo blight 14 1.0 1.0-1.0
Pyrenophora leaf blotch 18 1.4 1.0-3.0
Spot blotch 15 1.0 1.0-1.0
Stagonospora leaf blotch 22 2.4 1.0-4.0
Stem rust 4 1.5 1.0-2.0
Ergot (%) 23 0.2 0.1-1.0
Loose smut (%) 23 0.4 0.1-1.5
Take-all (%) 23 2.1 0.5-7.0
Fusarium head blight** 23
Incidence (%) 5.2 1-20.0
Severity (%) 4.5 1-10.0
Index (%) 0.3 0.01-2.0
*Foliar disease severity was rated on a scale of 0 (no disease) to 9 (severely diseased); ergot, loose smut, and take-all severity was based on % plants infected. **FHB Index = (% incidence x % severity)/100. Table 2. Prevalence of Fusarium species isolated from discolored kernels of oat in central and eastern Ontario in 2016.
Fusarium spp. % affected fields % affected kernels
Total Fusarium 100.0 20.0 F. acuminatum 8.7 0.6 F. avenaceum 30.4 1.0 F. equiseti 21.7 1.5 F. graminearum 17.4 0.7 F. oxysporum 4.3 0.1 F. poae 87.0 14.1 F. sporotrichioides 17.4 2.1

119
CROP / CULTURE: Barley and Oat LOCATION / RÉGION: Manitoba NAMES AND AGENCY / NOMS ET ÉTABLISSEMENT: M. Beyene, M. Banik and X. Wang Morden Research and Development Centre, Agriculture and Agri-Food Canada, 101 Route 100, Morden, MB R6M 1Y5 Telephone: (204) 822-7530; Facsimile: (204) 822-7507; E-mail: [email protected] TITLE / TITRE: BARLEY AND OAT LEAF SPOT DISEASES IN 2016 IN MANITOBA ABSTRACT: In 2016, 92 commercial barley and oat fields were assessed for leaf spot diseases in Manitoba. Cochliobolus sativus (spot blotch) and Pyrenophora teres (net blotch) were the principal pathogens isolated from barley fields whereas Pyrenophora avenae and Stagonospora avenae were the predominant pathogens isolated from oat fields. Disease severity was higher than reported in earlier years due to extreme weather in 2016. INTRODUCTION AND METHODS: In 2016, barley and oat leaf spot diseases in Manitoba were assessed by surveying 92 farm fields (49 barley, 43 oat fields) from July18-August 5, when most crops were at the early to soft-dough stages of growth (ZGS 79-82). Fields were sampled at regular intervals approximately 20-25 km along the survey routes, depending on crop availability. The area sampled was bounded by HWY 67 and 16 to the north, 12 to the east, 3 to the south, 8 to the north and 83 to the west. Disease incidence and severity were recorded by averaging their occurrence on 10-20 plants along a diamond-shaped transect of about 50 m per side, beginning near the field edge. Disease ratings were taken on both the upper (flag and penultimate leaves) and lower leaf canopies, using a six-category scale: 0 (no visible symptoms); trace (<1% leaf area affected); very slight (1-5%); slight (6-15%); moderate (16-40%); and severe (41-100%). Infected leaves with typical symptoms were collected at each site, dried, and stored in paper envelopes. Subsequently, 10 surface-sterilized pieces of putatively infected leaf tissue were incubated on filter paper in moist chambers for 3-5 days to promote sporulation to identify the causal agent(s) and disease(s). RESULTS AND COMMENTS: Barley– Leaf spot symptoms were observed in both upper and lower leaf canopies in 98% and 100% of the barley fields respectively. In the upper canopies, trace to slight and moderate to severe leaf spot symptoms were observed in 62% and 36% of the fields, respectively. Disease levels in the lower leaf canopies were found to be trace in 6% of fields, very slight or slight in 16%, moderate in 24%, and severe in 53% of the fields. These severity levels were much higher than those reported in previous years from 2012 to 2015 (Tekauz et al. 2013, Wang et al. 2015, Banik et al. 2014, 2016). The heightened leaf spot severity observed in 2016 was likely due to unusually higher precipitation. The observed disease levels, especially in the upper canopies, would suggest that leaf spot also caused considerable yield losses in Manitoba in 2016. Cochliobolus sativus (causal agent of spot blotch) and Pyrenophora teres (net blotch) were the principal pathogens isolated from infected leaf tissues and caused most of the leaf spot damage observed. Cochliobolus sativus was isolated from 36 fields and Pyrenophora teres from 17 fields (Table1). Septoria passerinnii (speckled leaf blotch), a minor pathogen of leaf spot complex was also detected from 3 fields, and was not identified in previous two years (Wang et al. 2015; Banik et al. 2016). Oat – In the upper leaf canopies, 5% of fields showed no visible leaf spot symptoms, trace levels were observed in 32% of the fields, very slight or slight in 30% of the fields, and moderate levels in 23% of the fields, while in 9% of fields, leaves had senesced. In the lower canopies, 100% of the fields showed visible symptoms, trace to very slight levels in 32% of the fields, and moderate to severe levels were observed in the remaining 68% of the fields.

120
Pyrenophora avenae, causal agent of pyrenophora leaf blotch, was the most prevalent pathogen and caused most of the damage observed in oat fields (Table 2). This occurred at much higher level than reported in 2015 (Banik et al. 2016), but at similar to levels found in 2011 and 2012 (Tekauz et al. 2012, 2013). Stagonospora avenae f. sp. avenaria (stagonospora leaf blotch) was found to be the second most prevalent pathogen and was the most predominant pathogen reported in 2010 (Tekauz et al. 2011). Stagonospora avenae f. sp. avenaria was not detected at all in previous year (Banik et al. 2016) and this was due to the occurrence of very low level of leaf spot diseases. Cochliobolus sativus (spot blotch) was also detected in four fields, and was a minor component of the oat leaf spot complex remaining at low levels in Manitoba (Table 2). REFERENCES: Banik, M., Beyene, M. and Tekauz, A. 2014. Fusarium head blight and leaf spot diseases of barley in Manitoba in 2013. Can. Plant Dis. Surv. 94:107-108. (www.phytopath.ca/publication/cpds).
Banik, M., Beyene, M. and Wang X. 2016. Barley and oat leaf spot diseases in 2015 in Manitoba.Can. Plant Dis. Surv. 96:95-96. (www.phytopath.ca/publication/cpds).
Tekauz, A., Kutcher, H.R., McCartney, C., Lewchuk, Z., Beyene, M., Stulzer, M., and Kirkham, C.L. 2010. Leaf spot diseases in Manitoba and Saskatchewan oats crops in 2009. Can. Plant Dis. Surv. 90:84-85. (www.phytopath.ca/publication/cpds).
Tekauz, A., Kutcher, H.R., Gilbert, J., Beyene, M., Stulzer, M., Kleiber, F., Ghazvini, H. and Hajipour, Z. 2011. Leaf spot diseases in Manitoba and Saskatchewan oat in 2010. Can. Plant Dis. Surv. 91:86-87. (www.phytopath.ca/publication/cpds).
Tekauz, A., Kutcher, H.R., Gilbert, J., Beyene, M., Stulzer, M., Kleiber, F., Ghazvini, H., and Hajipour, Z. 2012. Leaf spot diseases of Manitoba and Saskatchewan oat in 2011. Can. Plant Dis. Surv. 92:92-93. (www.phytopath.ca/publication/cpds).
Tekauz, A., Stulzer, M., Beyene, M., Dupriez, M., Harris, A. and Le-Ba, N. 2013. Leaf spot diseases in Manitoba barley crops in 2012. Can. Plant Dis. Surv. 93:93-94. (www.phytopath.ca/publication/cpds).
Wang, X., Beyene, M. and Banik, M. 2015. Barley leaf spot diseases in 2014 in Manitoba. Can. Plant Dis. Surv. 95:76-77. (www.phytopath.ca/publication/cpds). Table 1. Incidence and isolation frequency of leaf spot pathogens of barley in Manitoba in 2016.
Pathogen Incidence (% of fields) Frequency (% of isolations)
Cochliobolus sativus 73.5 95.9
Pyrenophora teres 34.7 25.4
Septoria passerinii 6.1 3.7
Table 2. Incidence and isolation frequency of leaf spot pathogens of oat in Manitoba in 2016.
Pathogen Incidence (% of fields) Frequency (% of isolation)
Pyrenophora avenae 51.1 77.6
Stagonospora avenae 23.3 16.3
Cochliobolus sativus 9.3 6.1

121
CROP / CULTURE: Oat LOCATION / RÉGION: Saskatchewan NAMES AND AGENCIES / NOMS ET ÉTABLISSEMENT: A. Woitas, T.S. Grewal, H.R. Kutcher and A.D. Beattie Crop Development Centre, University of Saskatchewan, 51 Campus Drive, Saskatoon SK S7N 5A8 Telephone: (306) 966-8476; Facsimile: (306) 966-5015 Email: [email protected] TITLE / TITRE: LEAF SPOT DISEASES OF OAT IN SASKATCHEWAN IN 2016 ABSTRACT: Leaf spot disease severity was assessed and the causal pathogens identified in 43 oat crops in 2016. Disease severity was trace to slight in the majority of surveyed crops with a few showing moderate levels. Pyrenophora avenae (pyrenophora leaf blotch) and Cochliobolus sativus (spot blotch) were the two oat pathogens isolated from diseased leaves. Stagonospora avenae f. sp. avenaria (stagonospora leaf blotch) was not observed in 2016. INTRODUCTION AND METHODS: In 2016, leaf spotting diseases of oat were surveyed across Saskatchewan in early August, when the crops were at the milk to soft dough growth stages. Forty-three crops were surveyed in 2016 and disease severity was assessed in each crop based on two to four plants collected at each of five points located approximately 15 m apart and 30 m from the field edge. Oat plants in each crop were rated based on disease severity on the upper (flag and penultimate leaves) and lower canopies as follows: 0 (no visible symptoms); trace (<1% leaf area affected); very slight (1-5%); slight (6-15%); moderate (16-40%); and severe (41-100%). Approximately 25 leaves were collected from each crop, dried and stored in paper envelopes. Pathogens were identified in the laboratory by cutting and surface sterilizing 10 pieces of infected leaf tissue from 10 different leaves. The leaf cuttings were placed on water agar plates containing a 1:1000 dilution of 85% lactic acid for four days to promote sporulation of pathogens. The identities of the causal agents of the leaf spots were determined by spore size and shape. Identified pathogens were transferred to V8 Juice Agar (V8A) plates and single spore technique was used to obtain pure cultures of P. avenae and C. sativus which were then stored in cryopreservation fluid at -65°C. RESULTS AND COMMENTS: Leaf spots were observed in the canopies of all 43 crops sampled in 2016 however, disease severity was assessed for only 25 of the 43 crops. Leaf spot severity in the upper canopy varied from trace to slight in 22 crops and moderate in three crops, while severity in the lower canopy was rated as moderate in 14 crops, severe in two and slight in the remaining nine. Only two leaf-spot pathogens were identified from the plated oat leaf tissues (Table 1), P. avenae and C. sativus, with P. avenae being more common. S. avenae was not observed in any of the samples, as was the case in 2015. The prevalence and incidence (Table 1) of P. avenae and C. sativus was lower when compared to that of 2015 when P. avenae and C. sativus were present in 65% and 37% of crops sampled, respectively (Grewal et al. 2016). The results from 2015 and 2016 surveys differed from the surveys conducted prior to 2015 (Tekauz et al. 2012, Taylor et al. 2014, Taylor et al. 2015) in which S. avenae was observed in all years and with greater prevalence than C. sativus in most years (2011-2013). The results from 2015 and 2016 suggest that higher average temperatures (as observed in both years), as opposed to precipitation amount (which different across these two years) may favour the growth of C. sativus over S. avenae, while results from 2011-2016 indicate that P. avenae is consistently the most prevalent oat leaf spot pathogen regardless of growing conditions. REFERENCES: Grewal, T.S., Woitas, A., Kutcher, H R., and Beattie, A D. 2016. Leaf spot diseases of oat in Saskatchewan in 2015. Can. Plant Dis. Surv. 96:110. (http://www.phytopath.ca/cpds.shtml) Taylor, J., Cholango, P, Dyck, M., Grewal, T.S. and Kutcher, H.R. 2015. Leaf spot diseases of oat in Saskatchewan in 2014. Can. Plant Dis. Surv. 95:101-102. (http://www.phytopath.ca/cpds.shtml)

122
Taylor, J., Liu, J., Vera, J.T., Dament, T., Woytowich, J. and Kutcher, H.R. 2014. Leaf spot diseases of oat in Saskatchewan in 2012 and 2013. Can. Plant Dis. Surv. 94:131-132. (http://www.phytopath.ca/cpds.shtml) Tekauz, A., Kutcher, H.R., Gilbert, J., Beyene, M., Stulzer, F., Ghazvini, H. and Hajipour, Z. 2012. Leaf spot diseases of Manitoba and Saskatchewan oat in 2011. Can. Plant Dis. Surv. 92:92-93. (http://www.phytopath.ca/cpds.shtml) Table 1. Oat leaf blotch disease prevalence and incidence in 43 Saskatchewan oat crops surveyed in 2016.
Pathogen Prevalence (% crops) Incidence (% isolations)*
Pyrenophora avenae 33 8 Cochliobolus sativus 9 1
*Number of leaf sections from which pathogens were isolated per total number of leaf sections sampled. Indicative of the relative amount of foliar damage observed.

123
CULTURES / CROPS: Avoine, Orge, Blé RÉGION / LOCATION: Québec NOMS ET ÉTABLISSEMENT / NAME AND AGENCIES: S. Rioux Centre de recherche sur les grains inc. (CÉROM), 2700, rue Einstein, Québec, (Québec) G1P 3W8 Téléphone: (418) 528-7896; Télécopieur: (418) 644-6855; Courriel: [email protected] TITRE / TITLE: MALADIES OBSERVÉES CHEZ LES CÉRÉALES AU QUÉBEC EN 2016 RÉSUMÉ: En 2016, la rouille jaune du blé a été observée seulement dans les régions où la neige était encore présente au sol au moment des gels d’avril et où la maladie était présente à l’été 2015. Encore cette année, la rouille jaune a affecté plus fortement le blé d’hiver, alors que la rouille brune ainsi que l’oïdium, présents dans les régions centrales, étaient plus intenses sur le blé de printemps. Moins répandue qu’à l’habitude, la rouille couronnée de l’avoine a été notée à deux stations seulement. Chez l’orge, la rouille des feuilles, habituellement absente, a été décelée à deux stations des régions centrales et l’oïdium à une seule de ces stations. Comme à l’habitude, les taches foliaires étaient présentes sur tout le territoire. Finalement, la fusariose de l’épi n’a pas été un problème en 2016. ABSTRACT: In 2016, yellow stripe rust on wheat was observed only in regions where snow was still present on the ground when frosts occurred in April and where the disease occurred in the summer 2015. Again this year, stripe rust was more severe on winter wheat, while brown leaf rust and powdery mildew, present in the central regions, were more severe on spring wheat. Less widespread than usual, crown rust on oats was assessed at only two locations. In barley, brown leaf rust, usually absent, was detected at two locations in the central regions and powdery mildew at one of these locations. As usual, leaf spots were widespread on the territory. Finally, fusarium head blight was not a problem in 2016. MÉTHODES: Sept à neuf essais d’enregistrement et de performance de céréales de printemps et quatre essais de blé d’hiver répartis dans différentes régions du Québec (RGCQ 2016), ont été visités une fois durant l’été 2016 pour y dépister les maladies du feuillage. Le stade de développement de la céréale au moment de la visite se situait entre laiteux moyen et pâteux moyen. Les maladies ont été identifiées sur la base des symptômes visuels et l’intensité des symptômes a été notée selon une échelle de notation de 0 à 9; la catégorie 0 correspondant à aucun symptôme et 9 à des symptômes sur plus de 50 % de la surface de la feuille étendard. Le nom des agents pathogènes normalement associés à ces maladies est mentionné dans le texte à titre indicatif. Les valeurs de 0 à 4 réfèrent à une faible intensité, les valeurs de 4 à 7 à une intensité moyenne et les valeurs de 7 à 9 à une intensité élevée. La Financière agricole du Québec (FADQ) a fourni le nombre d’avis de dommages aux cultures de blé et d’orge qui avaient comme cause principale la fusariose (Michel Malo, FADQ, communication personnelle). RÉSULTATS et COMMENTAIRES: En 2016 (FADQ, 2016), les semis des céréales de printemps ont été réalisés dans de bonnes conditions puisque les températures pendant cette période, fin avril et mai, ont été clémentes et les précipitations normales pour l’ensemble des régions du Québec. En juin les précipitations ont été abondantes dans les régions centrales, de l’est et du nord de la province, alors qu’elles ont été inférieures à la normale dans les régions du sud et de l’ouest. En 2016, comme à chaque année, la tache ovoïde (Stagonospora avenae) de l’avoine s’est manifestée dans toutes les régions visitées. L’intensité des symptômes était moyenne pour l’ensemble des lignées/cultivars évalués. La rouille couronnée (Puccinica coronata) a été moins répandue en 2016 qu’au cours des deux dernières années. Elle a été observée seulement à Saint-Étienne-de-Lauzon (région de Québec) et La Pocatière (Bas-Saint-Laurent) et l’intensité des symptômes variait de faible à moyenne. La rouille jaune du blé (Puccinia striiformis), en 2016, a touché le blé d’hiver dans les régions où la neige était encore suffisamment abondante pour empêcher le gel du feuillage du blé, soit à Saint-Augustin-de-Desmaures (région de Québec) et à La Pocatière. Elle était cependant absente à Normandin qui présentait un bon couvert de neige mais qui a eu très peu de rouille jaune à l’été 2015. Elle n’a pas été observée aux stations plus au sud de Princeville (Centre-du-Québec) et Saint-Mathieu-de-Beloeil

124
(Montérégie-Est), qui sont situées dans des régions qui étaient exemptes de neige au sol au moment des gels d’avril. L’intensité des symptômes variait de faible à élevée dépendamment des cultivars/lignées. La rouille jaune s’est aussi manifestée chez le blé de printemps, mais faiblement et seulement dans la région de Québec (Saint-Augustin et Saint-Étienne-de-Lauzon). Elle a également été observée à Normandin sur quelques lignées de printemps. La rouille brune (Puccinia triticina) présente sur le blé de printemps, mais faiblement tout comme la rouille jaune, était restreinte à la région de Québec. Quant aux taches foliaires (Drechslera tritici-repentis, Stagonospora nodorum et Cochliobolus sativus), elles ont été notées dans tous les essais de blé d’hiver et de printemps et présentaient des symptômes d’intensité moyenne, sauf pour le blé d’hiver à Saint-Mathieu-de-Beloeil où l’intensité était plutôt faible. L’oïdium (Blumeria graminis f. sp. tritici, syn. Erysiphe graminis), qui a été observé à Princeville et dans la région de Québec a plus affecté le blé de printemps (intensité variant de faible à élevée) que le blé d’hiver (faible intensité pour tous les cultivars/lignées). La fusariose de l’épi n’a pas été un problème en 2016 alors que seulement 0,7 % des producteurs de blé assurés (10 sur 1456) ont signalé des dommages à leur culture attribuables à cette maladie. Ce ratio est le plus bas des ratios enregistrés par la FADQ depuis le début des prises de données qui date de 2004. Les taches foliaires de l’orge (Drechslera teres, Rhynchosporium secalis et Cochliobolus sativus), surtout la rayure réticulée (D. teres), étaient présentes dans tous les essais visités et l’intensité des symptômes a varié de moyenne à élevée. La rouille des feuilles (Puccinia hordei) chez l’orge est peu fréquente au Québec. Elle s’est toutefois manifestée en 2016 à Princeville et Saint-Augustin. Les symptômes étaient cependant peu intenses pour la majorité des cultivars/lignées. Pour ce qui est de l’oïdium (Blumeria graminis f.sp. hordei, syn. Erysiphe graminis) il s’est manifesté seulement à Saint-Augustin et faiblement. Finalement la fusariose de l’épi de l’orge, tout comme pour le blé, n’a pas été un problème en 2016; seulement 0,7 % des producteurs d’orge assurés (4 sur 565) à la FADQ ont rapporté des dommages dus à la maladie. RÉFÉRENCES: CÉROM. 2016. Résultats des essais de cultivars de céréales à paille 2016. Dans : Guide RGCQ 2016. Grandes cultures, décembre, pages 45-51. La Financière agricole du Québec (FADQ). 2016. L’état des cultures au Québec. Rapport nº 5 – Bilan au 5 juillet 2016, 12 juillet. [http://www.fadq.qc.ca/fileadmin/fr/bulletins/etat-culture-2016-no-5.pdf]

125
CROP / CULTURE: Spring Wheat LOCATION / RÉGION: Manitoba NAMES AND AGENCIES / NOMS ET ÉTABLISSEMENTS: M.A. Henriquez1, P. Bajracharya2, P. de Rocquigny2, H. Derksen2, D. Miranda1 and O. Gruenke1
1Agriculture and Agri-Food Canada, Morden Research and Development Centre, 101 Route 100, Morden MB R6M 1Y5 Telephone: 204-822-7551; Facsimile: 204-822-7507; E-mail: [email protected] 2Manitoba Agriculture, 65-3rd Avenue NE, Carman MB R0G 0J0 TITLE / TITRE: FUSARIUM HEAD BLIGHT OF SPRING WHEAT IN MANITOBA IN 2016 ABSTRACT: In 2016, fusarium head blight incidence and severity were assessed in 70 spring wheat fields in Manitoba. The disease occurred in 87% of the wheat fields surveyed at a provincial mean FHB severity (FHB Index) of 2.0 %. The most prevalent Fusarium species was F. graminearum, followed by F. poae and F. avenaceum. INTRODUCTION AND METHODS: Spring wheat in Manitoba was surveyed for fusarium head blight (FHB) at 70 field locations. The survey for FHB was conducted from early July to early August when most of the crops were at growth stage ZGS 73 – 85. In contrast to other disease surveys conducted in Manitoba, the fields were not surveyed at random. Instead, information on their location was obtained from the producers. The proportion of infected spikes per field (incidence) and the proportion of infected spikelets in each spike (severity) were recorded in 10 spikes from ten random sites in each field surveyed. The FHB index (overall severity) was determined for each field surveyed: [Average % incidence X Average % severity] / 100. From each field, at least 50 spikes were processed for pathogen isolation and identification in the laboratory. Ten kernels from each field surveyed were surface-sterilized in a laminar flow bench placed on Spezieller Nährstoffarmer Agar (SNA) media. Identification of Fusarium species involved microscopic examination and morphological characterization using the criteria of Leslie and Summerell (2006). RESULTS AND COMMENTS: According to Manitoba Agricultural Services Corporation’s Variety Market Share Report (MASC 2016), there were approximately 2.2 million acres of spring wheat seeded in Manitoba in 2016. The top five cultivars, based on seed acreage, were ‘AAC Brandon’ (37.9%), ‘Cardale’ (17.1%), ‘Carberry’ (10.2%) and ‘Glenn’ (7.1%). ‘AAC Brandon’ and ‘Cardale’ were the predominant spring wheat cultivars grown in the fields sampled in this survey. FHB occurred in 87% of the surveyed spring wheat fields in Manitoba (Table 1). The provincial mean FHB severity (FHB Index) was 2.0 %. The range in severity varied from a minimum of zero to a maximum of 15.1%. Prevalence and severity of FHB in spring wheat were lowest in the Northwest and Interlake region and most prevalent in the Central (90%) and Eastern regions (92%). The highest mean severity was in the Southwest region. The sample with the highest FHB severity (15.11%) was from a spring wheat field in the Central region. Overall, the 2016 provincial mean FHB index was higher than in previous years, i.e., 1.7% in 2010, 1.1% in 2012, 1.0 % in 2014 and 0.3% in 2015 (Gilbert et al. 2011, 2012, 2013; Derksen and de Rocquigny 2015, Henriquez et al. 2016). However, the 2016 provincial mean FHB index was almost similar to 2011 (2.1%) (Gilbert et al. 2012). Isolation results from 700 kernels plated on SNA media showed that Fusarium graminearum was the most frequently isolated pathogen species, accounting for 93.6% of isolations (Table 2). It was detected in 83.3% of surveyed fields. Three other species were found at lower levels, including F. poae detected in 3.3% of fields and 1.1% of total Fusarium isolations, and F. avenaceum detected in 3.3% of fields and 1.1% of total Fusarium isolations. Unidentified Fusarium spp. are listed as Fusarium spp.
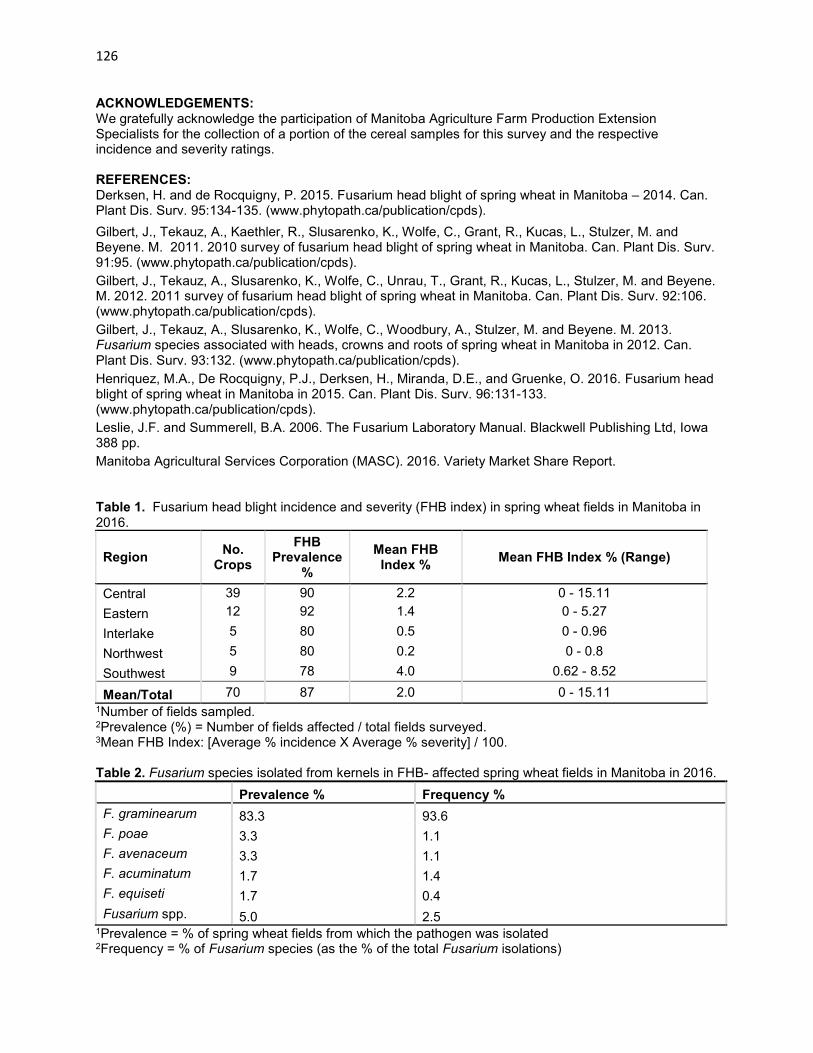
126
ACKNOWLEDGEMENTS: We gratefully acknowledge the participation of Manitoba Agriculture Farm Production Extension Specialists for the collection of a portion of the cereal samples for this survey and the respective incidence and severity ratings. REFERENCES: Derksen, H. and de Rocquigny, P. 2015. Fusarium head blight of spring wheat in Manitoba – 2014. Can. Plant Dis. Surv. 95:134-135. (www.phytopath.ca/publication/cpds).
Gilbert, J., Tekauz, A., Kaethler, R., Slusarenko, K., Wolfe, C., Grant, R., Kucas, L., Stulzer, M. and Beyene. M. 2011. 2010 survey of fusarium head blight of spring wheat in Manitoba. Can. Plant Dis. Surv. 91:95. (www.phytopath.ca/publication/cpds).
Gilbert, J., Tekauz, A., Slusarenko, K., Wolfe, C., Unrau, T., Grant, R., Kucas, L., Stulzer, M. and Beyene. M. 2012. 2011 survey of fusarium head blight of spring wheat in Manitoba. Can. Plant Dis. Surv. 92:106. (www.phytopath.ca/publication/cpds).
Gilbert, J., Tekauz, A., Slusarenko, K., Wolfe, C., Woodbury, A., Stulzer, M. and Beyene. M. 2013. Fusarium species associated with heads, crowns and roots of spring wheat in Manitoba in 2012. Can. Plant Dis. Surv. 93:132. (www.phytopath.ca/publication/cpds).
Henriquez, M.A., De Rocquigny, P.J., Derksen, H., Miranda, D.E., and Gruenke, O. 2016. Fusarium head blight of spring wheat in Manitoba in 2015. Can. Plant Dis. Surv. 96:131-133. (www.phytopath.ca/publication/cpds).
Leslie, J.F. and Summerell, B.A. 2006. The Fusarium Laboratory Manual. Blackwell Publishing Ltd, Iowa .
388 pp.
Manitoba Agricultural Services Corporation (MASC). 2016. Variety Market Share Report. Table 1. Fusarium head blight incidence and severity (FHB index) in spring wheat fields in Manitoba in 2016.
Region No.
Crops
FHB Prevalence
%
Mean FHB Index %
Mean FHB Index % (Range)
Central 39 90 2.2 0 - 15.11
Eastern 12 92 1.4 0 - 5.27
Interlake 5 80 0.5 0 - 0.96
Northwest 5 80 0.2 0 - 0.8
Southwest 9 78 4.0 0.62 - 8.52
Mean/Total 70 87 2.0 0 - 15.11 1Number of fields sampled. 2Prevalence (%) = Number of fields affected / total fields surveyed. 3Mean FHB Index: [Average % incidence X Average % severity] / 100.
Table 2. Fusarium species isolated from kernels in FHB- affected spring wheat fields in Manitoba in 2016.
Prevalence % Frequency %
F. graminearum 83.3 93.6
F. poae 3.3 1.1
F. avenaceum 3.3 1.1
F. acuminatum 1.7 1.4
F. equiseti 1.7 0.4
Fusarium spp. 5.0 2.5 1Prevalence = % of spring wheat fields from which the pathogen was isolated 2Frequency = % of Fusarium species (as the % of the total Fusarium isolations)
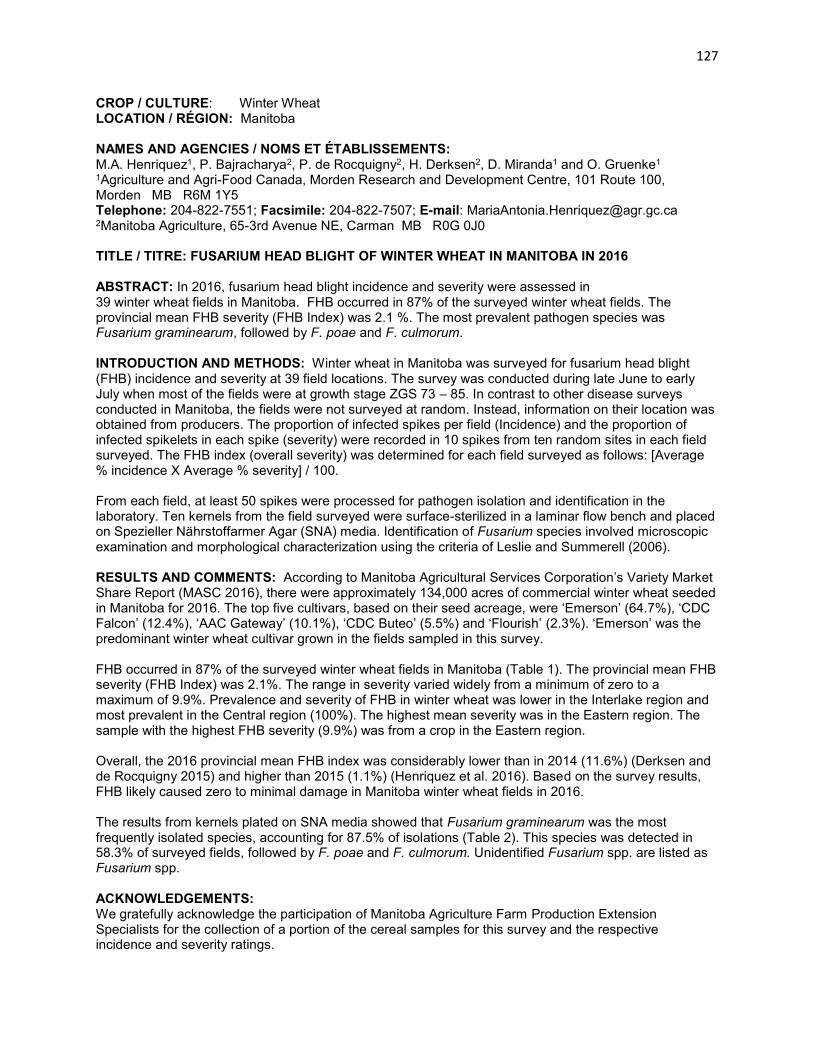
127
CROP / CULTURE: Winter Wheat LOCATION / RÉGION: Manitoba NAMES AND AGENCIES / NOMS ET ÉTABLISSEMENTS: M.A. Henriquez1, P. Bajracharya2, P. de Rocquigny2, H. Derksen2, D. Miranda1 and O. Gruenke1
1Agriculture and Agri-Food Canada, Morden Research and Development Centre, 101 Route 100, Morden MB R6M 1Y5 Telephone: 204-822-7551; Facsimile: 204-822-7507; E-mail: [email protected] 2Manitoba Agriculture, 65-3rd Avenue NE, Carman MB R0G 0J0 TITLE / TITRE: FUSARIUM HEAD BLIGHT OF WINTER WHEAT IN MANITOBA IN 2016 ABSTRACT: In 2016, fusarium head blight incidence and severity were assessed in 39 winter wheat fields in Manitoba. FHB occurred in 87% of the surveyed winter wheat fields. The provincial mean FHB severity (FHB Index) was 2.1 %. The most prevalent pathogen species was Fusarium graminearum, followed by F. poae and F. culmorum. INTRODUCTION AND METHODS: Winter wheat in Manitoba was surveyed for fusarium head blight (FHB) incidence and severity at 39 field locations. The survey was conducted during late June to early July when most of the fields were at growth stage ZGS 73 – 85. In contrast to other disease surveys conducted in Manitoba, the fields were not surveyed at random. Instead, information on their location was obtained from producers. The proportion of infected spikes per field (Incidence) and the proportion of infected spikelets in each spike (severity) were recorded in 10 spikes from ten random sites in each field surveyed. The FHB index (overall severity) was determined for each field surveyed as follows: [Average % incidence X Average % severity] / 100. From each field, at least 50 spikes were processed for pathogen isolation and identification in the laboratory. Ten kernels from the field surveyed were surface-sterilized in a laminar flow bench and placed on Spezieller Nährstoffarmer Agar (SNA) media. Identification of Fusarium species involved microscopic examination and morphological characterization using the criteria of Leslie and Summerell (2006). RESULTS AND COMMENTS: According to Manitoba Agricultural Services Corporation’s Variety Market Share Report (MASC 2016), there were approximately 134,000 acres of commercial winter wheat seeded in Manitoba for 2016. The top five cultivars, based on their seed acreage, were ‘Emerson’ (64.7%), ‘CDC Falcon’ (12.4%), ‘AAC Gateway’ (10.1%), ‘CDC Buteo’ (5.5%) and ‘Flourish’ (2.3%). ‘Emerson’ was the predominant winter wheat cultivar grown in the fields sampled in this survey. FHB occurred in 87% of the surveyed winter wheat fields in Manitoba (Table 1). The provincial mean FHB severity (FHB Index) was 2.1%. The range in severity varied widely from a minimum of zero to a maximum of 9.9%. Prevalence and severity of FHB in winter wheat was lower in the Interlake region and most prevalent in the Central region (100%). The highest mean severity was in the Eastern region. The sample with the highest FHB severity (9.9%) was from a crop in the Eastern region. Overall, the 2016 provincial mean FHB index was considerably lower than in 2014 (11.6%) (Derksen and de Rocquigny 2015) and higher than 2015 (1.1%) (Henriquez et al. 2016). Based on the survey results, FHB likely caused zero to minimal damage in Manitoba winter wheat fields in 2016. The results from kernels plated on SNA media showed that Fusarium graminearum was the most frequently isolated species, accounting for 87.5% of isolations (Table 2). This species was detected in 58.3% of surveyed fields, followed by F. poae and F. culmorum. Unidentified Fusarium spp. are listed as Fusarium spp. ACKNOWLEDGEMENTS: We gratefully acknowledge the participation of Manitoba Agriculture Farm Production Extension Specialists for the collection of a portion of the cereal samples for this survey and the respective incidence and severity ratings.

128
REFERENCES: Derksen, H. and de Rocquigny, P. 2015. Fusarium head blight of winter wheat in Manitoba – 2014. Can. Plant Dis. Surv. 95:140-141. (www.phytopath.ca/publication/cpds).
Henriquez, M.A., De Rocquigny, P.J., Derksen, H., Miranda, D.E., and Gruenke, O. 2016. Fusarium head blight of winter wheat in Manitoba in 2015. Can. Plant Dis. Surv. 96:138-139. (www.phytopath.ca/publication/cpds).
Leslie, J.F. and Summerell, B.A. 2006. The Fusarium Laboratory Manual. Blackwell Publishing Ltd, Iowa. 388 pp.
Manitoba Agricultural Services Corporation (MASC). 2016. Variety Market Share Report. Table 1. Fusarium head blight (FHB) index in winter wheat fields in Manitoba in 2016.
Region No. Crops FHB
Prevalence %
Mean FHB Index %
Mean FHB Index % (Range)
Central 26 85 1.8 0 - 9.0
Eastern 7 100 3.8 0.2 - 9.9
Interlake 6 83 1.1 0 - 4.4
Mean/Total 39 87 2.1 0 - 9.9 1Number of fields sampled. 2Prevalence (%) = Number of fields affected / total fields surveyed. 3Mean FHB Index: [Average % incidence X Average % severity] / 100.
Table 2. Fusarium species isolated from kernels in FHB- affected winter wheat fields in Manitoba in 2016.
Prevalence % Frequency %
F. graminearum 58.3 87.5
F. poae 8.3 4.4
F. avenaceum 2.8 5.0
F. culmorum 8.3 2.5
Fusarium spp. 2.8 0.6 1Prevalence = % of winter wheat fields from which the pathogen was isolated 2Frequency = % of Fusarium species (as the % of total Fusarium isolations)

129
CROP / CULTURE: Spring Wheat LOCATION / RÉGION: Manitoba NAMES AND AGENCIES / NOMS ET ÉTABLISSEMENTS: M.A. Henriquez1, P. Bajracharya2, P. de Rocquigny2, H. Derksen2, Z. Yao1, D. Miranda1 and O. Gruenke1
1Agriculture and Agri-Food Canada, Morden Research and Development Centre, 101 Route 100, Morden MB R6M 1Y5 Telephone: 204-822-7551; Facsimile: 204-822-7507; E-mail: [email protected] 2Manitoba Agriculture, 65-3rd Avenue NE, Carman MB R0G 0J0 TITLE / TITRE: LEAF SPOT DISEASES OF SPRING WHEAT IN MANITOBA IN 2016 ABSTRACT: In 2016, leaf spot diseases were assessed in 65 spring wheat fields in Manitoba. Prevalence and isolation frequency of leaf spot pathogens showed that Pyrenophora tritici-repentis was the most prevalent and widespread pathogen, followed by Stagonospora nodorum. INTRODUCTION AND METHODS: A survey for leaf spot (LS) diseases of spring wheat was conducted between the milk and dough growth stages in 2016 (ZGS 73 – 85). A total of 65 spring wheat fields were sampled. In contrast to other disease surveys conducted in Manitoba, the fields were not surveyed at random. Instead, information on their location was obtained from producers. In each field, 50 flag leaves were collected at random and percentage of leaf area affected by LS (severity) was recorded using a scale from 1 (slightly affected) to 50 (leaves dead) (Fernandez, 1998). From each field, 1 cm2 surface-disinfested leaf pieces from 10 leaves were plated on V8 agar media amended with 0.02% streptomycin sulfate to promote pathogen sporulation for disease identification. Identification of LS pathogens involved microscopic examination and morphological characterization. RESULTS AND COMMENTS: According to Manitoba Agricultural Services Corporation’s Variety Market Share Report (MASC 2016), there were approximately 2.2 million acres of spring wheat seeded in Manitoba in 2016. The top five cultivars, based on seed acreage, were ‘AAC Brandon’ (37.9%), ‘Cardale’ (17.1%), ‘Carberry’ (10.2%) and ‘Glenn’ (7.1%). ‘AAC Brandon’ and ‘Cardale’ were the predominant spring wheat cultivars grown in the fields sampled in this survey. Leaf spot diseases were observed in all of the fields surveyed (Table 1). The provincial mean LS severity was 5.6%. This severity was lower than in 2015 (15.7%) (Henriquez et al. 2016). The range in severity varied widely from a minimum of one to a maximum of 35%. LS severity was lowest in the Central region (3.3%) and highest in the Southwest region (17.8%). The sample with the highest LS severity was from the Southwest region (35.0%). As reported for previous years (Gilbert et al. 2012, 2013) Pyrenophora tritici-repentis (tan spot) was the most prevalent and widespread LS pathogen in Manitoba (Table 2). The results of 650 samples of leaf tissue analyzed showed that Pyrenophora tritici-repentis, causal agent of tan spot, was the most frequently isolated species, accounting for 97.9% of isolations. This species was detected in 53.8% of surveyed fields, and was followed by Stagonospora nodorum (2.1%) (stagonospora blotch) which was detected in 3.1% of surveyed fields. ACKNOWLEDGEMENTS: We gratefully acknowledge the participation of Manitoba Agriculture Farm Production Extension Specialists for the collection of a portion of the cereal samples for this survey. REFERENCES: Fernandez, M.R. 1998. Percentage leaf spot infection. Laborartory protocols. SemiArid Prairie Agricultural Research Centre. AAFC, Swift Current, SK.
Gilbert, J., Tekauz, A., Slusarenko, K., Wolfe, C., Kucas, L., Stulzer, M. and Beyene, M. 2012. 2011 survey for leaf spot diseases of spring wheat in Manitoba. Can. Plant Dis. Surv. 92:108. (www.phytopath.ca/publication/cpds)
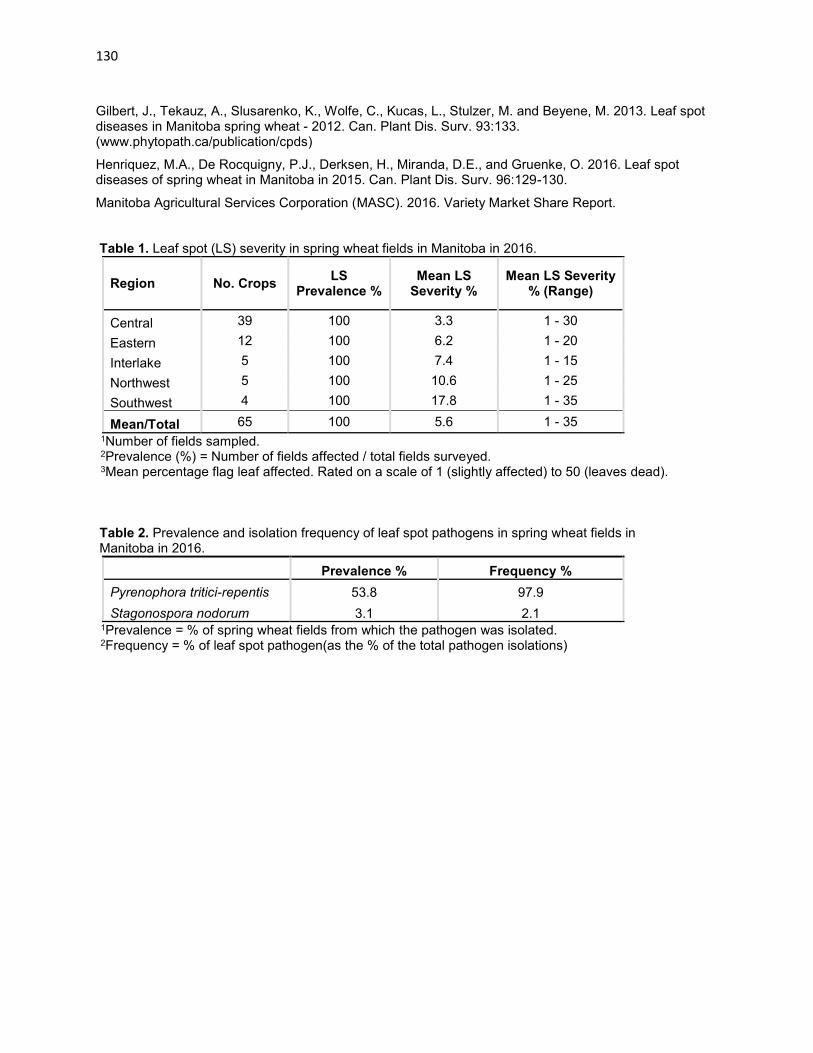
130
Gilbert, J., Tekauz, A., Slusarenko, K., Wolfe, C., Kucas, L., Stulzer, M. and Beyene, M. 2013. Leaf spot diseases in Manitoba spring wheat - 2012. Can. Plant Dis. Surv. 93:133. (www.phytopath.ca/publication/cpds)
Henriquez, M.A., De Rocquigny, P.J., Derksen, H., Miranda, D.E., and Gruenke, O. 2016. Leaf spot diseases of spring wheat in Manitoba in 2015. Can. Plant Dis. Surv. 96:129-130.
Manitoba Agricultural Services Corporation (MASC). 2016. Variety Market Share Report. Table 1. Leaf spot (LS) severity in spring wheat fields in Manitoba in 2016.
Region No. Crops LS
Prevalence % Mean LS
Severity % Mean LS Severity
% (Range)
Central 39 100 3.3 1 - 30
Eastern 12 100 6.2 1 - 20
Interlake 5 100 7.4 1 - 15
Northwest 5 100 10.6 1 - 25
Southwest 4 100 17.8 1 - 35
Mean/Total 65 100 5.6 1 - 35 1Number of fields sampled. 2Prevalence (%) = Number of fields affected / total fields surveyed. 3Mean percentage flag leaf affected. Rated on a scale of 1 (slightly affected) to 50 (leaves dead).
Table 2. Prevalence and isolation frequency of leaf spot pathogens in spring wheat fields in Manitoba in 2016.
Prevalence % Frequency %
Pyrenophora tritici-repentis 53.8 97.9
Stagonospora nodorum 3.1 2.1 1Prevalence = % of spring wheat fields from which the pathogen was isolated. 2Frequency = % of leaf spot pathogen(as the % of the total pathogen isolations)

131
CROP / CULTURE: Winter Wheat LOCATION / RÉGION: Manitoba NAMES AND AGENCIES / NOMS ET ÉTABLISSEMENTS: M.A. Henriquez1, P. Bajracharya2, P. de Rocquigny2, H. Derksen2, Z. Yao1, D. Miranda1 and O. Gruenke1
1Agriculture and Agri-Food Canada, Morden Research and Development Centre, 101 Route 100, Morden MB R6M 1Y5 Telephone: 204-822-7551; Facsimile: 204-822-7507; E-mail: [email protected] 2Manitoba Agriculture, 65-3rd Avenue NE, Carman MB R0G 0J0 TITLE / TITRE: LEAF SPOT DISEASES OF WINTER WHEAT IN MANITOBA IN 2016 ABSTRACT: In 2016, leaf spot diseases were assessed in 37 winter wheat fields in Manitoba. Prevalence and isolation frequency of leaf spot pathogens showed that Pyrenophora tritici-repentis was the most prevalent and widespread pathogen, followed by Cochiobolus sativus and Stagonospora nodorum. INTRODUCTION AND METHODS: A survey for leaf spot (LS) diseases of winter wheat was conducted between the milk and dough growth stages in 2016 (ZGS 73 – 85). A total of 37 winter wheat fields were sampled. In contrast to other disease surveys conducted in Manitoba, the fields were not surveyed at random. Instead, information on their location was obtained from producers. In each field, 50 flag leaves were collected at random and percentage of leaf area affected by LS (severity) was recorded using a scale from 1 (slightly affected) to 50 (leaves dead) (Fernandez, 1998). From each field, 1 cm2 surface-disinfested leaf pieces from 10 leaves were plated on V8 agar media amended with 0.02% streptomycin sulfate to promote pathogen sporulation for disease identification. Identification of LS pathogens involved microscopic examination and morphological characterization. RESULTS AND COMMENTS: According to Manitoba Agricultural Services Corporation’s Variety Market Share Report (MASC 2016), there were approximately 134,000 acres of commercial winter wheat seeded in Manitoba for 2016. The top five cultivars, based on their seed acreage, were ‘Emerson’ (64.7%), ‘CDC Falcon’ (12.4%), ‘AAC Gateway’ (10.1%), ‘CDC Buteo’ (5.5%) and ‘Flourish’ (2.3%). ‘Emerson’ was the predominant winter wheat cultivar grown in the fields sampled in this survey. Leaf spot diseases were observed in 100% of fields surveyed (Table 1). The provincial mean LS severity was 5.9%. This severity was lower than in 2015 (9.5%) (Henriquez et al. 2016). The range in severity varied widely from a minimum of 1.0% to a maximum of 30%. LS severity was lowest in the Eastern region (4.6%) and highest in the Interlake region (9.5%). The sample with the highest LS severity was from the Central region (30%). As reported for previous years (Tekauz et al. 2011, 2013) Pyrenophora tritici-repentis (tan spot) was the most prevalent and widespread LS pathogen in Manitoba (Table 2). The results of 370 samples of leaf tissue analyzed showed that Pyrenophora tritici-repentis was the most frequently isolated species, accounting for 91.3% of isolations. This species was detected in 64.9% of surveyed fields. This was followed by Cochiobolus sativus (7.5%) (spot blotch) and Stagonospora nodorum (1.3%) (stagonospora blotch) detected in 8.1% and 2.7% of surveyed fields, respectively. ACKNOWLEDGEMENTS: We gratefully acknowledge the participation of Manitoba Agriculture Farm Production Extension Specialists for the collection of a portion of the cereal samples for this survey.

132
REFERENCES: Fernandez, M.R. 1998. Percentage leaf spot infection. Laborartory protocols. SemiArid Prairie Agricultural Research Centre. AAFC, Swift Current, SK. Henriquez, M.A., De Rocquigny, P.J., Derksen, H., Miranda, D.E., and Gruenke, O. 2016. Leaf spot diseases of winter wheat in Manitoba in 2015. Can. Plant Dis. Surv. 96:136-137. (www.phytopath.ca/publication/cpds) Tekauz, A.,Stulzer, M., Beyene, M. , Ghazvini, H. and Kleiber, F. 2011. Winter wheat leaf spot diseases in Manitoba in 2010. Can. Plant Dis. Surv. 91:101-102. (www.phytopath.ca/publication/cpds) Tekauz, A., Stulzer, M., Beyene, M. and Gompf, J. 2013. Leaf spot diseases of Manitoba winter wheat crops in 2012. Can. Plant Dis. Surv. 93:137-138. (www.phytopath.ca/publication/cpds) Manitoba Agricultural Services Corporation (MASC). 2016. Variety Market Share Report. Table 1. Leaf spot (LS) severity in winter wheat fields in Manitoba in 2016.
Region No. Crops LS
Prevalence % Mean LS
Severity % Mean LS Severity
% (Range)
Central 26 100 5.4 1 - 30
Eastern 7 100 4.6 1 - 15
Interlake 6 100 9.5 1 - 20
Mean/Total 39 100 5.9 1 - 30 1Number of fields sampled. 2Prevalence (%) = Number of fields affected / total fields surveyed. 3Mean percentage flag leaf affected. Rated on a scale of 1 (slightly affected) to 50 (leaves dead).
Table 2. Prevalence and isolation frequency of leaf spot pathogens in winter wheat fields in Manitoba in 2016.
Prevalence % Frequency %
Pyrenophora tritici-repentis 64.9 91.3
Cochiobolus sativus 8.1 7.5
Stagonospora nodorum 2.7 1.3 1Prevalence = % of winter wheat fields from which the pathogen was isolated. 2Frequency = % of leaf spot pathogen(as the % of the total pathogen isolations).

133
CROP / CULTURE: Spring and Winter Wheat LOCATION / RÉGION: Manitoba and eastern Saskatchewan NAMES AND AGENCY / NOMS ET ÉTABLISSEMENT: B. McCallum, E. Reimer and W. McNabb Cereal Research Centre, Agriculture and Agri-Food Canada, 101 Route 100, Morden MB R6M 1Y5 Telephone: (204) 294-1837; Facsimile: (204) 822-7507; E-mail: [email protected] TITLE / TITRE: LEAF RUST AND STRIPE RUST OF WHEAT IN MANITOBA AND EASTERN SASKATCHEWAN IN 2016 ABSTRACT: Field surveys for leaf and stripe rust were conducted during July and August 2016 in Manitoba and eastern Saskatchewan on winter and spring wheat. Wheat leaf rust was first reported in June in Manitoba and developed throughout the growing season. Favorable spring weather facilitated early seeding of wheat in and the rust epidemic built up slowly. Stripe rust was widely found in Manitoba and Saskatchewan with varying levels of infection depending on location. INTRODUCTION AND METHODS: Trap nurseries and commercial fields of wheat in Manitoba and eastern Saskatchewan were surveyed for the incidence and severity of leaf rust (Puccinia triticina Erikss.) and stripe rust (Puccinia striiformis f. sp. tritici Erikss.) during July and August 2016. Winter wheat trials were examined for rust at 8 trap nurseries in Manitoba in July. In August, spring wheat trials at 11 trap nurseries were surveyed in Manitoba and south eastern Saskatchewan. RESULTS AND COMMENTS: Early seeding resulted in an early maturing wheat crop in southern Manitoba. The leaf rust epidemic built up slowly, but steadily to higher levels later in the season on lines that were not sprayed with foliar fungicides. Leaf rust was found at most locations surveyed across southern Manitoba. In Saskatchewan during the latter part of August, leaf rust was also found widely spread at relatively low levels. In Manitoba Crop Variety Evaluation Trials (MCVET), low levels of leaf rust were found on winter wheat entries with 35% leaf infection occasionally recorded on lines. In MCVET trials and Saskatchewan Variety Performance Group (SVPG) trials where spring wheat lines were tested, susceptible lines such as AAC Indus had 50-60% flag leaf infection. At Uniform Rust Nursery (URN) trials, leaf rust levels reached as high as 90% on highly susceptible lines such as Morocco. Stripe rust was found widely distributed in Manitoba, with some winter wheat lines having up to 70% leaf infection at the Portage location, but spring wheat lines generally showing only trace levels of stripe rust. It was widely reported in Saskatchewan, and during our survey of eastern Saskatchewan we found it in diverse locations at low levels of infection (less than 5% flag leaf coverage). At the URN in Indian Head, SK, 45% stripe rust infection was noted on susceptible lines.
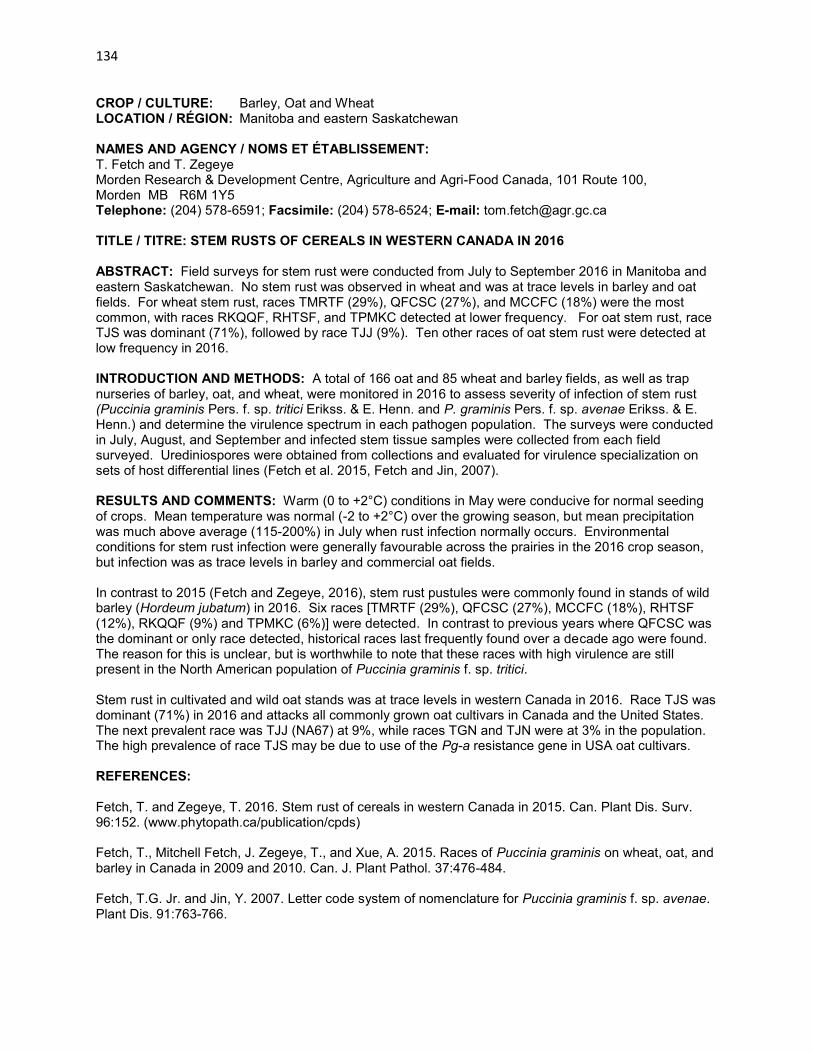
134
CROP / CULTURE: Barley, Oat and Wheat LOCATION / RÉGION: Manitoba and eastern Saskatchewan NAMES AND AGENCY / NOMS ET ÉTABLISSEMENT: T. Fetch and T. Zegeye Morden Research & Development Centre, Agriculture and Agri-Food Canada, 101 Route 100, Morden MB R6M 1Y5 Telephone: (204) 578-6591; Facsimile: (204) 578-6524; E-mail: [email protected] TITLE / TITRE: STEM RUSTS OF CEREALS IN WESTERN CANADA IN 2016 ABSTRACT: Field surveys for stem rust were conducted from July to September 2016 in Manitoba and eastern Saskatchewan. No stem rust was observed in wheat and was at trace levels in barley and oat fields. For wheat stem rust, races TMRTF (29%), QFCSC (27%), and MCCFC (18%) were the most common, with races RKQQF, RHTSF, and TPMKC detected at lower frequency. For oat stem rust, race TJS was dominant (71%), followed by race TJJ (9%). Ten other races of oat stem rust were detected at low frequency in 2016. INTRODUCTION AND METHODS: A total of 166 oat and 85 wheat and barley fields, as well as trap nurseries of barley, oat, and wheat, were monitored in 2016 to assess severity of infection of stem rust (Puccinia graminis Pers. f. sp. tritici Erikss. & E. Henn. and P. graminis Pers. f. sp. avenae Erikss. & E. Henn.) and determine the virulence spectrum in each pathogen population. The surveys were conducted in July, August, and September and infected stem tissue samples were collected from each field surveyed. Urediniospores were obtained from collections and evaluated for virulence specialization on sets of host differential lines (Fetch et al. 2015, Fetch and Jin, 2007). RESULTS AND COMMENTS: Warm (0 to +2°C) conditions in May were conducive for normal seeding of crops. Mean temperature was normal (-2 to +2°C) over the growing season, but mean precipitation was much above average (115-200%) in July when rust infection normally occurs. Environmental conditions for stem rust infection were generally favourable across the prairies in the 2016 crop season, but infection was as trace levels in barley and commercial oat fields. In contrast to 2015 (Fetch and Zegeye, 2016), stem rust pustules were commonly found in stands of wild barley (Hordeum jubatum) in 2016. Six races [TMRTF (29%), QFCSC (27%), MCCFC (18%), RHTSF (12%), RKQQF (9%) and TPMKC (6%)] were detected. In contrast to previous years where QFCSC was the dominant or only race detected, historical races last frequently found over a decade ago were found. The reason for this is unclear, but is worthwhile to note that these races with high virulence are still present in the North American population of Puccinia graminis f. sp. tritici. Stem rust in cultivated and wild oat stands was at trace levels in western Canada in 2016. Race TJS was dominant (71%) in 2016 and attacks all commonly grown oat cultivars in Canada and the United States. The next prevalent race was TJJ (NA67) at 9%, while races TGN and TJN were at 3% in the population. The high prevalence of race TJS may be due to use of the Pg-a resistance gene in USA oat cultivars. REFERENCES: Fetch, T. and Zegeye, T. 2016. Stem rust of cereals in western Canada in 2015. Can. Plant Dis. Surv. 96:152. (www.phytopath.ca/publication/cpds) Fetch, T., Mitchell Fetch, J. Zegeye, T., and Xue, A. 2015. Races of Puccinia graminis on wheat, oat, and barley in Canada in 2009 and 2010. Can. J. Plant Pathol. 37:476-484. Fetch, T.G. Jr. and Jin, Y. 2007. Letter code system of nomenclature for Puccinia graminis f. sp. avenae. Plant Dis. 91:763-766.

135
CROP / CULTURE: Common and durum wheat LOCATION / RÉGION: Saskatchewan NAMES AND AGENCIES / NOMS ET ÉTABLISSEMENTS: M.R. Fernandez1, B.A. Out1, G. Ford1, L. Abdellatif1, C. Kenny2, F. Waelchli3, A. Brown3, B. Ziesman4, D. Stephens4 and F.L. Dokken-Bouchard5
1Agriculture and Agri-Food Canada, Swift Current Research and Development Centre, P.O. Box 1030, Swift Current SK S9H 3X2 Telephone: (306) 770-4459; E-mail: [email protected] 2Agriculture and Agri-Food Canada, Saskatoon Research and Development Centre, 107 Science Place, Saskatoon SK S7N 0X2 3Saskatchewan Crop Insurance Corporation, Box 3000, 484 Prince William Drive, Melville SK S0A 2P0 4Saskatchewan Ministry of Agriculture, Crops and Irrigation Branch, 3085 Albert Street, Regina SK S4S 0B1 5Saskatchewan Ministry of Agriculture, Crop Protection Laboratory, 346 McDonald Street, Regina SK S4N 6P6 TITLE / TITRE: LEAF SPOTTING DISEASES OF COMMON AND DURUM WHEAT IN SASKATCHEWAN IN 2016 ABSTRACT: The leaf spot (LS) disease complex was evaluated in 148 common and durum wheat crops across Saskatchewan. Disease severity was compared relative to wheat species, soil zone, crop district, cultivar, tillage method, and previous crop. Mean LS severity was lower than in 2014 and 2012, but similar to 2013 and 2015. Overall, there was no difference in LS levels between common and durum wheat. LS severity was lowest in the Dark Brown, and highest in the Brown soil zone. Pyrenophora tritici-repentis was the most prevalent pathogen in durum while Septoria tritici was the most prevalent pathogen in common wheat. INTRODUCTION AND METHODS: A survey for leaf spot (LS) diseases of common and durum wheat in Saskatchewan was conducted between the milk and dough growth stages in 2016. A total of 148 common and durum crops were sampled in 21 crop districts (CD) in the various soil zones (Fig. 1, Table 1). There were 41 fields surveyed in the Brown soil zone, 55 in the Dark Brown soil zone, and 52 in the Black/Gray soil zone. Among the crops sampled, 85 were identified as common and 63 as durum wheat. Information on the agronomic practices employed was obtained from the producers for most fields sampled. Twenty-nine common, and 10 durum, wheat cultivars were identified among the samples, the most popular (grown in 5 fields or more) being the durum wheat cultivars ‘Transcend’ (13), ‘Strongfield’ (12), ‘Brigade’ (9), ‘CDC Verona’ (5) and the common wheat cultivars ‘Cardale’ (9), ‘AAC Brandon’ (6), ‘Goodeve VB’ (5), and ‘CDC Utmost VB’ (5). Information on whether the sampled fields had been sprayed with fungicide(s) was obtained from most of the producers. There were more crops sprayed with fungicides (75) than unsprayed (57) but no information was obtained on timing of fungicide applications. Information on the crop grown in 2015 and 2014 (or if summer-fallowed), and tillage method was also obtained from producers for most of the fields surveyed. For common wheat, the most frequent previous crop was an oilseed (59 fields); fewer common wheat crops were preceded by a pulse (10) or a cereal (5) crop, while the most frequently grown crop two years previously was a cereal (57) or an oilseed (8). For durum wheat, the most frequent previous crop was a pulse (29) or an oilseed (17), while the most frequently grown crop two years previously was a cereal (31) followed by an oilseed (11) or pulse (7). Summer fallow was the least common practice, with only 6 common, and 10 durum, wheat fields having been left fallow the previous year or two years previously. Tillage system was classified as conventional, minimum-, or zero-till. Most of the common wheat crops for which agronomic information was provided were under zero-till (61), followed by fields under minimum-till (14), with only 8 fields being managed conventionally; by contrast, all durum wheat fields surveyed were under zero-till (49) or minimum-till (9). In each field, 50 flag leaves were collected at random and air-dried at room temperature. Percentage of leaf area affected by LS (severity) was recorded for each leaf, and a mean percentage leaf area with LS was calculated for each crop and CD. For crops with the greatest LS severities and which had not been

136
sprayed with a fungicide (total of 57 crops), 1 cm2 surface-disinfested leaf pieces were plated on water agar for identification and quantification of the causal LS pathogens. RESULTS AND COMMENTS: LS were observed in all crops surveyed in 2016 (Table 1). In individual crops, percentage flag leaf area affected ranged from trace to 18%. The overall mean LS severity on flag leaves of 7.2%, was similar to 2013 (7.6%) and 2015 (7.6%) but lower than 2012 (10.0%) and 2014 (9.8%) (Fernandez et al. 2013, 2014, 2015, 2016a). Overall, for all crops sampled in 2016, there was no difference in LS severity between common and durum wheat. This agrees with observations made in 2012, 2013, and 2015. There was a large variation in disease severity among and within regions that could be attributed, at least partly, to the weather conditions throughout the summer. Influence of soil zone and crop district on LS severity For all common wheat fields sampled, mean LS severity was greater in the Brown and Black/Gray soil zones than in the Dark Brown soil zone, while for durum wheat disease severity was highest in the Brown soil zone (Table 1). For common wheat, the highest LS severity occurring in the Brown soils zone does not agree with results from previous years where the Black/Gray soil zone had the highest disease severity (Fernandez et al. 2013, 2014, 2015, 2016a). This can be explained, at least partly, by the higher than normal rainfall levels in the Brown soil zone in the 2016 growing season (Fig. 2). For durum wheat, the higher disease level in the Brown vs. the Dark Brown soil zone agrees with observations made in 2014 and 2015. When grouped by CDs, common wheat crops in 1A/1B (south-east), 5A/5B (east), 8A/8B (north-east) and 3A/3B (south-central) had the greatest mean LS severity, while those in 2A/2B (south-east), 7A/7B (west-central), and 6A/6B (central) had the lowest disease levels (Table 1). For durum wheat, CDs 4A/4B (south-west) had the greatest mean disease severity followed by 3A/3B (south-central). The mean LS severities in the remaining CDs were less than 5%. Influence of cultivar on LS severity Overall, for the most frequently-grown common wheat cultivars, ‘Carberry’ (mean LS of 9.0%), ‘Goodeve VB’ (8.0%), and ‘AAC Brandon’ (7.9%) had the highest disease severities, with ‘CDC Utmost VB’ (4.1%) and ‘Cardale’ (5.2%) having the lowest LS levels. Among the durum wheat cultivars grown in five or more fields, the greatest disease severities were observed in ‘Transcend’ (7.8%) and ‘Strongfield’ (6.3%), followed by ‘CDC Verona’ (4.4%) and ‘Brigade’ (3.3%). In 2015, ‘Transcend’ and ‘Strongfield’ also had among the greatest, and ‘CDC Utmost VB’ among the lowest, mean LS severities (Fernandez et al. 2016a). Causal pathogens Unlike previous years, Septoria tritici (a component of the septoria leaf complex) was the most prevalent LS pathogen in common wheat while, like previous years, Pyrenophora tritici-repentis (tan spot) was the most prevalent pathogen in durum wheat (Fernandez et al., 2013, 2014, 2015, 2016a) (Table 1). The remainder of infections was caused primarily by P. tritici-repentis in common wheat and the septoria leaf complex in durum wheat. The least commonly isolated pathogen was Cochliobolus sativus (spot blotch). Percentage isolation of each of the pathogens among the soil zones was similar for common wheat, while for durum wheat S. tritici was isolated at the highest and C. sativus at the lowest levels in the Brown soil zone. Influence of environment on LS severity and pathogens Overall, in 2016, total precipitation during the growing season across most of the province exceeded the long-term average (Fig. 2). The highest amounts of precipitation fell in the south-west and south-east areas of the province (Fig. 2) which coincides with crop districts 1A/1B (south-east) having the highest LS severity in common wheat, and CDs 4A/4B (south-west) having the highest LS severity in durum wheat (Table 1). Mean monthly temperatures across most of the province were generally normal to above (0 to 2°C) normal in May and June (maps not shown, Agriculture and Agri-Food Canada, 2016). Mean
temperatures in July were up to 2oC lower than normal in the south and west-central areas (Fig. 3). The lower temperatures might explain the increased prevalence of S. tritici relative to P. tritici-repentis, and the lower levels of C. sativus, relative to previous years (Fernandez et al. 2016b).

137
Influence of tillage method Zero-till was the most common tillage method in common wheat fields (63 fields) followed by minimum-till (13 fields) and conventional tillage (8 fields). There was no difference in LS severity among the three methods, and they also followed the same pattern of distribution of the pathogens (Table 2). Influence of previous crop Oilseeds were the most common previous crops (59 fields) followed by pulses (10 fields) and cereals (5 fields). Common wheat grown on cereal stubble had the highest LS severity followed by wheat on oilseed or pulse stubble (Table 3). The distribution of the LS pathogens varied among the different stubbles. P. tritici-repentis was isolated at the highest levels when the previous crop was a pulse, while S. tritici was isolated at the highest levels when the previous crop was a cereal or oilseed. ACKNOWLEDGEMENTS: We gratefully acknowledge the participation of Saskatchewan Crop Insurance Corporation staff for the collection of leaf samples and agronomic information for this survey; and K. Olsen and R. Candlishat, Agriculture and Agri-Food Canada, for technical assistance. REFERENCES: Agriculture and Agri-Food Canada.2016. National Agroclimate Information Service (NAIS), in partnership with Environment Canada. (http://www.agr.gc.ca/eng/programs-and-services/list-of-programs-and-services/drought-watch/?id=1461263317515). Fernandez, M.R., Out, B.A., Kenny, C., Hodge, K., Waelchli, F., Brown, A., Dokken-Bouchard, F.L., Stephens, D., and Peluola, C.O. 2016a. Leaf spot diseases of common and durum wheat in Saskatchewan in 2015. Can. Plant Dis. Surv. 96:120-128. (www.phytopath.ca/publication/cpds) Fernandez, M.R., Stevenson, F.C., Hodge, K.T., Dokken-Bouchard, F.L., Pearse, P.G., Waelchli, F., Brown, A.E., and Peluola, C. 2016b. Assessing effects of climactic change, region, and agronomic practices on leaf spotting of bread and durum wheat in the western Canadian Prairies, from 2001 to 2012. Agron. J. 108:1180-1195. (https://dl.sciencesocieties.org/publications/aj/articles/108/3/1180) Fernandez, M.R., Hodge, K., Ellouze, W., Waelchli, F., Brown, A., Dokken-Bouchard, F.L. and Peluola, C.O. 2015. Leaf spotting diseases of common and durum wheat in Saskatchewan in 2014. Can. Plant Dis. Surv. 95:123-130. (www.phytopath.ca/publication/cpds) Fernandez, M.R., Lim, S., Dokken-Bouchard, F.L., Miller, S.G. and Peluola, C.O. 2014. Leaf spotting diseases of common and durum wheat in Saskatchewan in 2013. Can. Plant Dis. Surv. 94:141-143. (www.phytopath.ca/publication/cpds) Fernandez, M.R., Lim, S., Dokken-Bouchard, F.L., Miller, S.G., and Peluola, C.O. 2013. Leaf spotting diseases of common and durum wheat in Saskatchewan in 2012. Can. Plant Dis. Surv. 93:125-129. (www.phytopath.ca/publication/cpds)

138
Fig.1. Soil zone map with common and durum wheat fields surveyed across Saskatchewan in 2016.

139
Table 1. Incidence and severity of leaf spotting diseases and percentage isolation of the most common leaf spotting pathogens in common and durum wheat crops surveyed in Saskatchewan in 2016.
Soil Zone/ Crop District
No. of Crops1
Mean Severity2
Pyrenophora tritici-repentis3
Stagonospora nodorum3
Septoria tritici3
Stagonospora avenae f. sp.
triticea3 Cochliobolus
sativus3
----------------------------------------------%--------------------------------------------------
Soil Zone Common wheat: 1 (Brown) 4 8.8 22.7/2 25.6/2 30.0/2 21.7/2 -/0 2 (Dark
Brown) 29 6.3 17.3/7 23.2/7 35.8/7 23.7/7 -/0
3 (Black/ Gray)
52 7.7 25.2/16 20.4/15 34.3/16 19.4/16 3.7/8
Mean/total: 85 7.3 22.8/25 21.7/24 34.4/25 20.8/25 3.7/8 Durum wheat: 1 (Brown) 37 9.4 52.7/12* 11.3/12 16.5/13 11.6/13 23.7/7 2 (Dark
Brown) 26 4.0 48.5/6 10.3/5 7.7/6 10.8/6 48.9/3
Mean/total: 63 7.1 51.3/18 11.0/17 13.7/19 11.4/19 31.2/10 Crop District
Common wheat: 1A/1B 17 11.4 24.8/5 22.8/5 25.4/5 24.8/5 3.6/3 2A/2B 6 4.4 36.9/2 26.3/2 19.0/2 17.9/2 -/0 3A/3B4 2 9.0 30.9/1 8.6/1 40.0/1 20.5/1 -/0 5A/5B 15 6.7 5.9/4 22.9/4 49.7/4 21.4/4 0.5/1 6A/6B 15 5.2 6.6/4 19.3/4 47.3/4 24.6/4 9.0/1 7A/7B 5 4.6 14.5/1 42.5/1 20.0/1 23.0/1 -/0 8A/8B 9 9.6 3.3/4 23.2/4 50.4/4 21.9/4 2.4/2 9A/9B 16 5.7 66.0/4 13.5/3 11.3/4 11.4/4 4.5/1 Durum wheat: 1A/1B 2 4.5 75.7/1 12.1/1 10.7/1 1.4/1 -/0 2A/2B 13 4.8 51.7/3 1.2/2 5.0/3 7.9/3 51.4/2 3A/3B 21 9.6 54.2/6** 9.7/6 13.4/7 10.2/7 29.1/3 4A/4B 10 13.0 36.9/4 10.1/4 19.4/4 14.8/4 25.1/3 6A/6B 6 3.9 41.7/1 5.6/1 3.3/1 5.6/1 43.9/1 7A/7B 11 2.1 41.0/3 19.4/3 20.2/3 18.3/3 3.3/1
1Number of crops sampled. All crops had leaf spot lesions on the flag leaves. 2Mean percentage flag leaf affected. 3Mean percentage fungal isolation/number of crops where the pathogen occurred. For each crop district, the number of crops where P. tritici-repentis was isolated is equivalent to the total number of crops plated for fungal identification and quantification. See below for exceptions. *There were 13 crops plated for fungal identification but P. tritici-repentis was only isolated from 12. **There were 7 crops plated for fungal identification but P. tritici-repentis was only isolated from 6. 4’3A’ includes CDs 3AS and 3AN; ‘3B’ includes CDs 3BS and 3BN.

140
© Agriculture &Agri-Food Canada Fig. 2. Three month (May 11- Aug 8) percent of average precipitation. Normal precipitation based on 1981-2010 (Agriculture and Agri-Food Canada, 2016).
© Agriculture & Agri-Food Canada
Fig. 3. Monthly mean temperature (oC) difference from normal for July 2016. Normal temperature based on 1981-2010 (Agriculture and Agri-Food Canada, 2016).
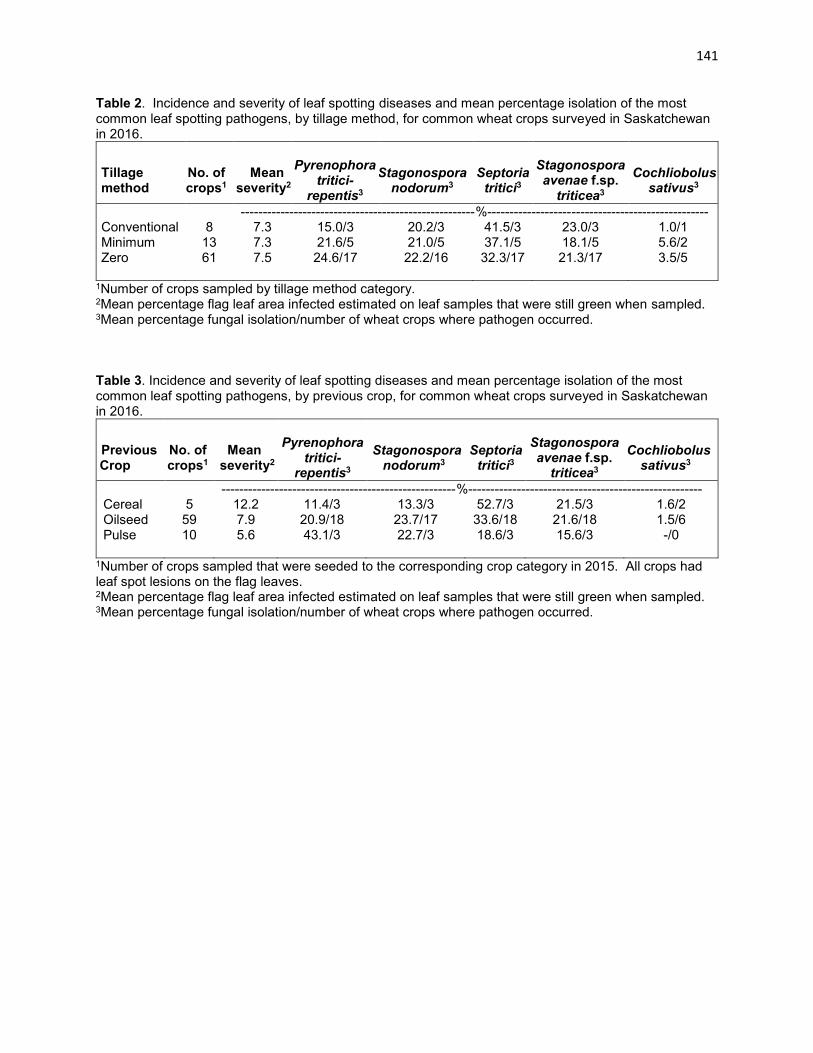
141
Table 2. Incidence and severity of leaf spotting diseases and mean percentage isolation of the most common leaf spotting pathogens, by tillage method, for common wheat crops surveyed in Saskatchewan in 2016.
Tillage method
No. of crops1
Mean severity2
Pyrenophora tritici-
repentis3
Stagonospora nodorum3
Septoria tritici3
Stagonospora avenae f.sp.
triticea3
Cochliobolus sativus3
-----------------------------------------------------%-------------------------------------------------- Conventional 8 7.3 15.0/3 20.2/3 41.5/3 23.0/3 1.0/1 Minimum 13 7.3 21.6/5 21.0/5 37.1/5 18.1/5 5.6/2 Zero 61 7.5 24.6/17 22.2/16 32.3/17 21.3/17 3.5/5
1Number of crops sampled by tillage method category. 2Mean percentage flag leaf area infected estimated on leaf samples that were still green when sampled. 3Mean percentage fungal isolation/number of wheat crops where pathogen occurred. Table 3. Incidence and severity of leaf spotting diseases and mean percentage isolation of the most common leaf spotting pathogens, by previous crop, for common wheat crops surveyed in Saskatchewan in 2016.
Previous Crop
No. of crops1
Mean severity2
Pyrenophora tritici-
repentis3
Stagonospora nodorum3
Septoria tritici3
Stagonospora avenae f.sp.
triticea3
Cochliobolus sativus3
-----------------------------------------------------%----------------------------------------------------- Cereal 5 12.2 11.4/3 13.3/3 52.7/3 21.5/3 1.6/2 Oilseed 59 7.9 20.9/18 23.7/17 33.6/18 21.6/18 1.5/6 Pulse 10 5.6 43.1/3 22.7/3 18.6/3 15.6/3 -/0
1Number of crops sampled that were seeded to the corresponding crop category in 2015. All crops had leaf spot lesions on the flag leaves. 2Mean percentage flag leaf area infected estimated on leaf samples that were still green when sampled. 3Mean percentage fungal isolation/number of wheat crops where pathogen occurred.

142
CROP / CULTURE: Spring Wheat, Winter Wheat, Durum Wheat LOCATION / RÉGION: Saskatchewan NAMES AND AGENCIES / NOMS ET ÉTABLISSEMENTS: G.S. Brar1, G. Singh1, P. Cholango-Martinez1, J. Lobo1, K. Nabetani1, R. Knox2 and H.R. Kutcher1
Telephone: (306) 966-4951; Facsimile: (306) 966-5015; E-mail: [email protected] 1Department of Plant Sciences/Crop Development Centre, 51 Campus Drive, University of Saskatchewan, Saskatoon SK S7N 5A8 2Agriculture and Agri-Food Canada, Swift Current Research and Development Centre, Box 1030, Swift Current SK S9H 3X2 TITLE / TITRE: STRIPE RUST OF WHEAT IN SASKATCHEWAN IN 2015 AND 2016 ABSTRACT: A stripe rust survey of wheat was conducted in 2015 and 2016 with stripe rust detected in 21% and 35% of crops, respectively. In 2015, stripe rust disease pressure was very low due to dry conditions. In 2016, favourable weather resulted in widespread occurrence of stripe rust, although major yield losses did not occur. Severe stripe rust on susceptible winter wheat cultivars was observed at Swift Current and Outlook in experimental plots in 2016. INTRODUCTION AND METHODS: Stripe rust, caused by Puccinia striiformis f. sp. tritici Erikss., has become one of the most important diseases of wheat in western Canada since 2000 and regional epidemics of the disease in 2005, 2006, 2011 were reported (Brar et al. 2016). Stripe rust severity in western Canada is largely dependent on the inoculum level and disease pressure in the United States; in Saskatchewan, inoculum comes from the Pacific Northwest, as well as the Puccinia Pathway through the Great Plains in the USA (Brar and Kutcher 2016). Recent epidemics of the disease makes it imperative that we study pathogen virulence, for which disease surveys are of key importance. Disease surveys also help in framing future needs for wheat breeding programs. Twenty-eight and 20 commercial crops of spring wheat, durum wheat, and winter wheat were surveyed in 2015 and 2016, respectively. The survey in 2015 was conducted in July and for 2016 in July and August. In 2016, in addition to commercial crops, stripe rust was also assessed in experimental plots and hills at Outlook and Swift Current. The crops surveyed were separated from each other by at least 20 km. Each crop was traversed in a “V” pattern (Puchalski et al. 2012) within which individual plants from five sites separated by about 40 m were evaluated for incidence and severity of stripe rust. Incidence was estimated as the proportion of infected plants exhibiting at least trace levels of stripe rust in a 5 m segment of row in the crop. The modified Cobb scale (Peterson et al. 1948) was used to assess stripe rust severity on the flag leaves of 50 plants per field (10 leaves per site). A six-category scale was used to assess stripe rust severity in each field: clean (no visible symptoms); trace (<3% leaf area affected); light (3-15%); moderate (>15-20%); and severe (>20%). RESULTS AND COMMENTS: In 2015, stripe rust was observed in six of the 28 crops (21%) surveyed (Table 1). The four fields with trace levels of stripe rust were all spring wheat in west-central Saskatchewan (Table 1). Stripe rust severity was light in two winter wheat crops by late July. Due to very dry conditions in 2015, disease pressure was very low in the province. Stripe rust was mainly observed in western Saskatchewan, but not in eastern Saskatchewan. In 2016, stripe rust was observed in seven of the 20 commercial crops (35%) surveyed (Table 2). Crop Districts 2B, 3B-N, and 7A were surveyed in August when crops were near maturity. None of the crops in these crop districts had stripe rust symptoms. Two crops had moderate and one field had severe levels of stripe rust (Table 2). Stripe rust was widespread in the province in 2016, but did not cause severe damage to many crops. Stripe rust severity was higher in south-western Saskatchewan compared with other parts of the province. Severe stripe rust infection was observed on susceptible winter wheat varieties including ‘AC Radiant’ in experimental plots at Agriculture and Agri-Food Canada, Swift Current and was severe by June 10, which was earlier than in previous years. The early occurrence of stripe rust in western Canada may indicate overwintering of P. striiformis f. sp. tritici (Brar and Kutcher 2016), however, severe infection could also be attributed to inoculum build-up under favourable conditions

143
created by precipitation in early May and June. Stripe rust usually appears in the northern USA and southern Alberta earlier than the rest of Alberta or Saskatchewan (Brar et al. 2015). Similar to Swift Current, severe stripe rust infection was observed on susceptible winter wheat varieties at Outlook in mid-July. Regular precipitation and favourable conditions in 2016 resulted in stripe rust inoculum build-up, although it did not to our knowledge, cause epidemics in commercial wheat crops. ACKNOWLEDGEMENTS: The assistance of Mallory Dyck, Everett Boots, Angel Liew, and summer students of the Cereal and Flax Pathology of the Crop Development Centre is appreciated. REFERENCES: Brar, G.S., and Kutcher, H.R. 2016. Race characterization of Puccinia striiformis f. sp. tritici, the cause of wheat stripe rust, in southern Alberta and Saskatchewan, Canada and virulence comparison with races from the United States. Plant Dis. 100(8):1744-1753. http://dx.doi.org/10.1094/PDIS-12-15-1410-RE Brar, G.S., McCallum, B.D., Gaudet, D.A., Puchalski, B.J., Fernandez, M.R., and Kutcher, H.R. 2016. Stripe rust disease dynamics in southern Alberta, Saskatchewan, and Manitoba, 2009-2014. Can. J. Plant Pathol. 30(1):112-127. Pp. 114-115 [Abstr.]. Brar, G.S., MacLean, D., and Kutcher, H.R. 2015. Stripe rust survey of winter and spring wheat in Saskatchewan in 2014. Can. Plant Dis. Surv. 95:110-111. Peterson, R.F., Campbell, A.B., and Hannah, A.E. 1948. A diagrammatic scale estimating rust intensity of leaves and stem of cereals. Can J. Res. Sect. C, 26:496-500. Table 1. Prevalence and severity categories for stripe rust on commercial wheat crops in 2015 in Saskatchewan by crop district.
*Proportion of crops or trap plots affected. Table 2. Prevalence and severity categories for stripe rust on commercial wheat crops in 2016 in Saskatchewan by crop district.
*Proportion of crops or trap plots affected.
Crop District
Prevalence*
Severity
Clean Trace Light Moderate Severe
2B 1/4 3 0 1 0 0 3A-N 0/4 4 0 0 0 0 3B-N 0/10 10 0 0 0 0 6A 3/4 1 2 1 0 0 6B 1/4 3 1 0 0 0 7A 1/2 1 1 0 0 0 Total 6/28 22 4 2 0 0
Crop District
Prevalence*
Severity
Clean Trace Light Moderate Severe
2B 0/3 3 0 0 0 0 3B-N 0/4 4 0 0 0 0 6B 4/5 1 1 1 2 0 7A 0/2 2 0 0 0 0 7B 2/4 2 0 1 0 1 8B 1/2 1 0 1 0 0 Total 7/20 13 1 3 2 1

144
CROP / CULTURE: Wheat LOCATION / RÉGION: Alberta NAMES AND AGENCY / NOMS ET ÉTABLISSEMENT: M.W. Harding, M. Kundu and G.C. Daniels
Alberta Agriculture Forestry, Crop Diversification Centre South, Brooks AB T1R 1E6 Telephone: (403) 362-1338; Facsimile: (403) 362-1326; E-mail: [email protected] TITLE / TITRE: WHEAT STREAK MOSAIC VIRUS IN ALBERTA IN 2015 AND 2016 ABSTRACT: In 2015 a few fields were confirmed to have Wheat streak mosaic virus (WSMV) in Alberta. In 2016, an awareness campaign was initiated inviting cereal producers, agronomists, agricultural fieldmen and crop scouts to submit any wheat samples with possible WSMV symptoms. Twenty samples were tested for WSMV and 14 were positive for a prevalence of 70%. INTRODUCTION AND METHODS: WSMV is a Group IV (+ssRNA) in the Potyviridae. It is vectored semi-persistently by the wheat curl mite (Aceria tosichella Keifer). The virus can infect many hosts in the Poaceae family, but wheat (Triticum spp.) is the most susceptible crop. Over 6.5 million acres of wheat are grown in Alberta, however, WSMV is a relatively rare problem, with reports of only a few outbreaks between 2000 and 2015. A recent increase in wheat viruses in the Great Plains region of North America has been reported (Burrows et al. 2009). Warm, open fall weather, mild winters and green bridges caused by early-seeded winter wheat, volunteer cereals and grassy weeds may have helped bring about the increase in wheat viruses in the USA Great Plains region, and may also have contributed to the Alberta situation in 2015 and 2016. Wheat samples were evaluated for the presence of WSMV using a commercially available Enzyme Linked Immunosorbent Assay (ELISA) purchased from Agdia, Inc. (Elkhart, IN). Samples were processed and evaluated according to the manufacturer’s recommendations and using a BIO-TEK® Synergy HT multi-detection microplate reader (BIO-TEK® Instruments, Winooski, VT) with appropriate controls and standards. RESULTS AND COMMENTS: Four and 20 samples were tested in 2015 and 2016, respectively. All four samples in 2015 were positive and were all collected from within a 150 km2 area just east or southeast of Lethbridge, AB (Fig. 1). Seventy percent (14 of 20) of wheat fields in 2016 were positive for WSMV and their locations can be seen in Fig. 2. The 20 samples tested in 2016 came from an area of approximately 13,500 km2 that included most of southern Alberta (Fig. 1). Early seeding of winter wheat, and warm, open fall conditions in 2016 may provide an opportunity for additional cases of WSMV in Alberta in 2017. REFERENCES: Burrows, M., Franc, G., Rush, C., Blunt, T., Ito, D., Kinzer, K., Olson, J., O’Mara, J., Price, J., Tande, C. and Ziems, A., 2009. Occurrence of viruses in wheat in the Great Plains region, 2008. Plant Health Progress doi, 10. ACKNOWLEDGEMENTS We gratefully acknowledge the submissions of suspicious samples from producers, agronomists and agricultural fieldmen.

145
Figure 1. The locations of confirmed WSMV samples in Alberta in 2016.
Figure 2. Approximate distribution of WSMV in Alberta in 2015 and 2016.

146
CROPS / CULTURES: Durum Wheat, Spring Wheat, Winter Wheat, Barley, Oat LOCATION / RÉGION: Manitoba, Saskatchewan NAMES AND AGENCIES / NOMS ET ÉTABLISSEMENTS: J.G. Menzies1, G.S. Brar2, H.R. Kutcher2, Z. Popovic1, S. Deceuninck1 and J. Friesen1 1Morden Research and Development Centre, Agriculture and Agri-Food Canada, 101 Route 100, Morden MB R6M 1Y5 Telephone: 204-822-7522; Facsimile: 204-822-7507; E-mail: [email protected] 2Department of Plant Science/Crop Development Centre, University of Saskatchewan, Saskatoon SK S7N 5A8 TITLE / TITRE: CEREAL SMUT SURVEYS, 2016 ABSTRACT: In Manitoba in 2016, 39 spring wheat fields, 10 barley fields, and five oat fields were surveyed for the smut diseases caused by Ustilago spp. One wheat field was infested with U. tritici-infected plants, at 1% severity, one 2-row barley field was infested with U. nuda-infected plants at a 25% severity, and no oat fields had infected plants. In Saskatchewan, seven fields of spring wheat, two fields of durum wheat and two fields of winter wheat were surveyed. Three spring wheat fields were infested with U. tritici-infected plants at trace severity levels. No carboxin-resistant strains of Ustilago were identified. INTRODUCTION AND METHODS: Two surveys, one in Manitoba and one in Saskatchewan, were conducted during July to early August in 2016 to assess the incidence and severity of the smut diseases caused by Ustilago hordei, U. nigra, U. nuda, U. tritici, U. avenae and U. kolleri. The area surveyed in Manitoba included crop districts 1, 2, 3, 7, 8, 9 and 11 and in Saskatchewan, crop districts 6B, 7B, and 8B. Fields were selected at random at approximately 15 - 30 km intervals, depending on the frequency of the crops in the area. In Manitoba, an estimate of the percentage of infected plants (i.e., plants with sori) was made while walking an ovoid path of approximately 100 m in each field. Levels of smut greater than trace (<0.01%) were estimated by counting plants in a one m2 area at a minimum of two sites on the path. In Saskatchewan, the percentage of infected plants was estimated by assessing a 5 m row at 5 random locations in a field and counting the number of total heads, and of infected heads. Fields with <0.01 % were considered as trace infection levels in Manitoba, and <0.05% infections were considered as trace in Saskatchewan. An isolate of smut was collected from each field with smutted plants. This was compared with a carboxin-sensitive isolate, ‘72-66’, of U. nuda from Canada, and a carboxin-resistant isolate, ‘Viva’, of U. nuda (Newcombe and Thomas 1991) from France, using the teliospore germination assay of Leroux (1986) and Leroux and Berthier (1988) to determine if resistance to the fungicide carboxin may be present. Teliospores of each isolate were streaked onto half-strength potato dextrose agar amended with 0 or 1.0 μg ml-1 of carboxin. The cultures were incubated at 20oC in a controlled environment chamber and examined for teliospore germination after 24 h. RESULTS AND COMMENTS: Manitoba: Of the 39 fields of spring what assessed, 33 were of awned wheat and six of awnless wheat. One (3%) field of awned wheat in Manitoba crop district 9 was infested with smut (U. tritici) at a 1% severity. No field of awnless wheat was infested with smutted plants. Eight fields of 2-row barley and two fields of 6-row barley were assessed, with loose smut (U. nuda) being observed only in one 2-row barley field in Manitoba crop district 2 at a 25% severity level. No smut infection was observed in the five oat fields surveyed. Saskatchewan: A total of 11 wheat fields were assessed in Saskatchewan: two fields of winter wheat, two fields of durum wheat and seven fields of spring wheat. No smutted plants were found in the fields of winter wheat or durum wheat. Three (43%) fields of spring wheat were infested with smutted plants at a trace severity levels. Two of these fields were found in Saskatchewan crop district 6B, and one field was in Saskatchewan crop district 7B.

147
None of the Ustilago spp. strains collected in Manitoba or Saskatchewan in 20164 was able to germinate and grow on agar medium amended with carboxin. REFERENCES : Leroux P. 1986. Caractéristiques des souches d’Ustilago nuda, agent du charbon nu de l’orge, résistantes à la carboxine. Agronomie 6:225-226. Leroux P. and Berthier, G. 1988. Resistance to carboxin and fenfuram in Ustilago nuda (Jens) Rostr., the causal agent of barley loose smut. Crop Protection 7:16-19. Newcombe G. and Thomas, P.L. 1991. Incidence of carboxin resistance in Ustilago nuda. Phytopathology 81:247-250.

148
CROP / CULTURE: Spring wheat LOCATION / RÉGION: Central and eastern Ontario NAMES AND AGENCY / NOMS ET ÉTABLISSEMENT: A.G. Xue, Y. Chen and Y. Al-Rewashdy Agriculture and Agri-Food Canada, Ottawa Research and Development Centre, K.W. Neatby Building, 960 Carling Avenue, Ottawa, ON K1A 0C6 Telephone: (613) 759-1513; Facsimile: (613) 759-1926; E-mail: [email protected] TITLE / TITRE: DISEASES OF SPRING WHEAT IN CENTRAL AND EASTERN ONTARIO IN 2016 ABSTRACT: Twenty-six spring wheat crops in central and eastern Ontario were surveyed for diseases in 2016. Of the 11 diseases observed, septoria/stagonospora leaf blotch, septoria glume blotch, and take-all were most prevalent. Fusarium head blight (FHB) was found in 22 fields, but only at slight levels. Fusarium graminearum and F. sporotrichioides were the predominant species causing FHB. INTRODUCTION AND METHODS: A survey for spring wheat diseases was conducted in central and eastern Ontario in the third week of July when plants were at the soft dough stage of development. Twenty-six fields were chosen at random in regions where most of the spring wheat was grown. Foliar disease severity was determined on 10 flag and penultimate leaves sampled at each of three random sites per field, using a rating scale of 0 (no disease) to 9 (severely diseased). Disease diagnosis was based on visual symptoms. Average severity scores of <1, <3, <6, and ≥6 were considered trace, slight, moderate, and severe levels, respectively. Severity of ergot, loose smut, and take-all was based on the percent plants infected. FHB was rated for incidence (% infected spikes) and severity (% infected spikelets in the affected spikes) based on approximately 200 spikes at each of three random sites per field. A FHB index [(% incidence x % severity)/100] was determined for each field. The percentage of infected plants or FHB index values of <1, <10, <20, and ≥20% were considered as slight, moderate, severe, and very severe disease levels, respectively. Determination of the causal species of FHB was based on 30 infected spikes collected from each field. The spikes were air-dried at room temperature and subsequently threshed. Thirty discolored kernels per sample were chosen at random, surface sterilized in 1% NaOCI for 60 seconds and plated in 9-cm diameter petri dishes on modified potato dextrose agar (10 g dextrose per liter amended with 50 ppm of streptomycin sulphate). The plates were incubated for 10-14 days at 22-25ºC and a 14-hour photoperiod provided by fluorescent and long wavelength ultraviolet tubes. Fusarium species isolated from kernels were identified by microscopic examination using standard taxonomic keys. RESULTS AND COMMENTS: Eleven diseases or disease complexes were observed in the crops surveyed (Table 1). Septoria/stagonospora leaf blotch (normally associated with the pathogens Septoria tritici and Stagonospora spp.), stagonospora glume blotch (Stagonospora nodorum), and tan spot (Pyrenophora tritici-repentis) were the most common diseases identified, and were each found in 23 surveyed fields at average severities of 1.9, 1.9, and 1.3, respectively. Severe infection levels by stagonospora glume blotch and tan spot were not observed, but septoria/stagonospora leaf blotch was found in 1 field. Yield reductions due to these four diseases were estimated to have averaged <2% in affected fields. Other foliar diseases observed included bacterial leaf blight (Pseudomonas syringae pv. syringae), leaf rust (Puccinia triticina), powdery mildew (Blumeria graminis f.sp. tritici), and spot blotch (Cochliobolus sativus). These diseases were found in 15, 10, 4, and 14 fields at average severities of 1.1, 1.0, 2.3, and 1.1, respectively. No severe levels of infection were observed and these diseases likely caused little or no yield reduction. Ergot (Claviceps purpurea), loose smut (Ustilago tritici) and take-all root rot (Gaeumannomyces graminis var. tritici) were observed in all fields at incidence levels of 0.4, 0.2, and 1.8%, respectively (Table 1). Severe infection from these diseases was not observed, but moderate disease levels by ergot and take-all were found in 1 and 6 fields, respectively. Yield reductions by ergot and take-all were estimated <3% in affected fields.

149
FHB was observed in 22 fields at a mean FHB index of 0.02% (range 0.01-0.09%) (Table 1). Overall, FHB did not result in a significant loss of grain yield and quality in 2016. Six Fusarium species were isolated from putative fusarium-damaged kernels (Table 2). Fusarium sporotrichioides and F. graminearum predominated and occurred in 54 and 35% of fields and on 6.0 and 3.1% of kernels, respectively. Fusarium equiseti and F. poae were less common and found in 31and 42% of fields and on 1.2 and 1.8% of kernels, respectively. Fusarium acuminatum and F. avenaceum were least common, occurring in 4-19% of fields and 0.2-0.6% of kernels. The 11 diseases observed on spring wheat in Ontario in 2016 were the same as those recorded for 2015 except for stem rust that was not found in 2016 (Xue and Chen 2016). Overall, the incidence and severity of these diseases were generally lower in 2016 than in 2015. A slight FHB infection occurred in 22 surveyed fields and no significant reductions in grain yield and quality were observed. The less frequent rain events in June and July in 2016 compared with 2015 in central and eastern Ontario were likely responsible for the reduced disease severities observed this year. REFERENCE: Xue, A.G. and Chen, Y. 2016. Diseases of spring wheat in central and eastern Ontario in 2015. Can. Plant Dis. Surv. 96:134-135. (www.phytopath.ca/publication/cpds) Table 1. Prevalence and severity of spring wheat diseases in central and eastern Ontario in 2016.
Disease
No. field affected (n=26)
Disease severity in affected fields*
Mean Range
Bacterial blight 15 1.1 1.0-2.0
Leaf rust 10 1.0 1.0-1.0
Powdery mildew 4 2.3 1.0-4.0
Septoria glume blotch 23 1.9 1.0-5.0
Septoria/Stagonospora leaf blotch 23 1.9 1.0-7.0
Spot blotch 14 1.1 1.0-2.0
Tan spot 23 1.3 1.0-2.0
Ergot (%) 26 0.4 0.1-2.0
Loose smut (%) 26 0.2 0.1-1.0
Take-all (%) 26 1.8 0.5-5.0
Fusarium head blight** 22
Incidence (%) 1.4 1.0-3.0
Severity (%) 1.5 1.0-5.0
Index (%) 0.02 0.01-0.09
*Foliar disease severity was rated on a scale of 0 (no disease) to 9 (severely diseased); ergot, loose smut, and take-all severity was based on % plants infected. **FHB Index = (% incidence x % severity)/100. Table 2. Prevalence of Fusarium species isolated from fusarium-damaged wheat kernels in central and eastern Ontario in 2016.
Fusarium spp. % affected fields % affected kernels
Total Fusarium 92.3 12.9 F. acuminatum 19.2 0.6 F. avenaceum 3.8 0.2 F. equiseti 30.8 1.2 F. graminearum 34.6 3.1 F. poae 42.3 1.8 F. sporotrichioides 53.8 6.0

150
CROP / CULTURE: Winter wheat LOCATION / RÉGION: Ontario NAME AND AGENCY / NOM ET ÉTABLISSEMENT: L. Tamburic-Ilincic and S.B. Rosa University of Guelph, Ridgetown Campus, Ridgetown ON N0P 2C0 Telephone: (519) 674-1500 x 63557; Facsimile: (519) 674-1600; E-mail: [email protected] TITLE / TITRE: 2016 SURVEY FOR STRIPE RUST OF WINTER WHEAT IN ONTARIO ABSTRACT: Stripe rust was the most important disease of winter wheat in Ontario in 2016 with severities reaching 8 (0 to 9 scale). Yield, TW and TKW were significantly affected by the disease. INTRODUCTION AND METHODS: Stripe rust (Puccinia striiformis f. sp. tritici Erikss.) severity and the effect of the disease on yield, test weight (TW) and thousand kernel weight (TKW) was assessed on 12 current Ontario winter wheat cultivars. Plots were planted in mid-October in 2015 at Ridgetown (four replicates) and at Centralia (two replicates), Ontario, in a randomized complete block design following standard agronomic practices for Ontario. The plots were planted in six rows, at a row spacing of 17.8 cm, and 4 m in length. Stripe rust was evaluated in June 2016 using a 0 to 9 scale, where 0 = no disease and 9 = more than 90% of leaf tissue affected by symptoms. No artificial inoculation was used. Yield was assessed for Ridgetown and Centralia trials. Thousand kernel weight (TKW) and test weight (TW) were calculated for Ridgetown plots. Pearson’s correlation coefficients between stripe rust and yield, TKW and TW were calculated using the PROC CORR statement (SAS Institute Inc. 2013). RESULTS AND COMMENTS: Stripe rust was the most important disease of winter wheat in Ontario in 2016. Some cultivars had good resistance to the disease (Table 1). ‘Gallus’ and ‘Priesley’ had the lowest stripe rust levels of 1 (Centralia) and 2 (Ridgetown) using a 0 to 9 scale. The highest disease score was recorded in the soft white winter wheat ‘Venture’ with 8.0 and 7.5 severity at Centralia and Ridgetown, respectively. ‘Venture’ showed the lowest yield (1.4 t/ha at Centralia and 3.9 t/ha in Ridgetown), TW (70.6 kg/hl) and TKW (21.1 g) in the trial. Yield varied from 1.4 to 5.7 t/ha at Centralia, and from 3.9 to 8.5 t/ha at Ridgetown. Yield, TW and TKW were significantly affected by the stripe rust disease at Ridgetown with negative correlation of -0.79 (P= 0.0022); -0.65 (P= 0.0217) and -0.83 (P= 0.0008), respectively. At Centralia, the correlation between yield and stripe rust was -0.88 (P=0.0001). Results indicate that stripe rust might be an important disease in winter wheat in Ontario in the future. To avoid yield losses, it is important to conduct stripe rust studies to better understand and manage the disease. REFERENCES: SAS Institute Inc. 2013. SAS/ACCESS® 9.4 Interface to ADABAS: Reference. Cary, NC: SAS Institute Inc.

151
Table 1. Stripe rust, yield, test weight (TW) and thousand kernel weight (TKW) in winter wheat in Ontario in 2016.
Stripe rust (0 to 9 scale) Yield (t/ha) TW (kg/hl) TKW (g)
Genotype Centralia Ridgetown Centralia Ridgetown Ridgetown Ridgetown
Gallus 1.0 2.0 5.7 7.8 81.8 41.8
Priesley 1.0 2.0 4.7 8.1 76.6 37.1
Branson 1.5 2.0 5.3 8.0 78.1 31.5
Marker 1.5 4.5 5.2 7.5 77.3 31.3
UGRC DH5-28 3.5 4.5 4.4 7.9 76.8 31.8
UGRC Ring 4,0 4.0 5.7 8.5 76.7 35.2
UGRC C2-5 6.0 4.5 3.6 7.5 75.3 35.3
AC Morley 6.5 4.9 3.4 6.2 80.3 34.9
UGRC GL-164 6.5 6.0 3.6 6.8 78.2 22.7
Emmit 7.5 5.0 3.0 6.3 77.7 31.9
OAC Flight 8,0 7.0 1.9 5.6 75.4 26.8
Venture 8.0 7.5 1.4 3.9 70.6 21.1

152
CROP / CULTURE: Corn LOCATION / RÉGION: Manitoba NAME AND AGENCY / NOM ET ÉTABLISSEMENT: P. Bajracharya1, M. Cott2, L. Adam3, A. Soliman3, E.Bargen4, R. Picard5, N. Clouson6, H. Derksen7 and F. Daayf3 1Manitoba Agriculture, Box 1149, Carman MB R0G 0J0 Telephone: (204)750-0754; Facsimile: (204)745-5690; E-mail: [email protected] 2Manitoba Corn Growers Association, Box 188, Carman MB R0G 0J0 3Department of Plant Science, University of Manitoba, 66 Dafoe Rd, Winnipeg MB R3T 2N2 4Manitoba Agriculture, Unit C-284 Reimer Ave., Steinbach MB R5G 0R5 5Manitoba Agriculture, Box 189, Somerset MB R0G 2L0 6Manitoba Agriculture, Box 370, Swan River MB R0L 1Z0 7Manitoba Agriculture, Box 1149, Carman MB R0G 0J0 TITLE / TITRE: DISTRIBUTION OF GOSS’S WILT DISEASE IN CORN CROPS IN MANITOBA IN 2016 ABSTRACT: Corn production has increased in recent years and is no longer limited to traditional corn growing areas in Manitoba. Grain and silage corn can be found in all crop reporting districts in Manitoba. According to Manitoba Agricultural Services Corporation (MASC), approximately 422,000 acres in Manitoba were seeded to grain and silage corn in 2016. This is a significant increase in corn acres in Manitoba compared to 281,000 seeded acres of grain and silage corn in 2015 (MASC). As corn acres are increasing, the spread of Goss’s wilt disease is also on the rise across the province, especially in the areas where shorter crop rotation is practiced. Therefore, a survey to determine Goss’s wilt disease distribution was conducted across all crop reporting districts in Manitoba. The survey results indicated that 42 percent of the surveyed fields were affected by Goss’s wilt disease. The highest percentage of positive identifications for Goss’s wilt disease was made in Interlake, Eastern and Central regions of Manitoba, respectively. METHODS: Thirty-seven rural municipalities (RM) in five crop reporting districts in Manitoba were surveyed in 2016. A total of 142 corn fields were surveyed throughout August and September 2016. The number of fields surveyed in each RM was determined on the basis of corn acres in each RM. Visual inspections of the fields were done to assess the presence of Goss’s wilt in the surveyed fields. RESULTS: Goss’s wilt disease was detected in 42 percent of the surveyed fields and in 24 out of 37 surveyed RMs (Tables 1 and 2). A total of 59 putatively positive identifications for Goss’s Wilt were made by visual inspections during the 2016 survey (Table 2). These detections were later confirmed by PCR and pathogenicity test. Most of the corn fields surveyed are in Central (97), Eastern (24) and Interlake (8) regions of Manitoba, respectively (Table 2). Among these regions, the Interlake region had the highest percentage of positive identifications (77%). Also, all five surveyed RMs in Interlake region were found to be positive for Goss’s wilt disease. The preliminary results of the survey indicate that the incidence of Goss’s wilt may be dependent on the type of corn hybrid planted and the field history. In addition to 59 positively identified fields during the 2016 Goss’s wilt disease survey, one field in the RM of Portage la Prairie, two in the RM of Oakland and one in the RM of North Cypress-Langford were also found to be positive for Goss’s wilt disease.

153
Table 1. Number of positively identified RMs in different crop reporting districts (CRD).
CRD No. of RM's surveyed No. of positive RMs
Northwest 1 0
Southwest 4 2
Central 19 12
Interlake 5 5
Eastern 8 5
Total 37 24
Table 2. Number of Goss’s wilt positive fields in different crop reporting districts (CRD).
CRD No. of fields surveyed No. of positive fields % of positive identifications
Northwest 4 0 0
Southwest 8 2 25
Central 97 34 35
Interlake 9 7 77
Eastern 24 16 66
Total 142 59 42

154
CROP / CULTURE: Corn LOCATION/ REGION: Ontario NAMES AND AGENCIES / NOMS ET ÉTABLISSEMENTS: K.K. Jindal1, L.M. Reid1, A.U.Tenuta2, T. Woldemariam1, X. Zhu1 and G. Kotulak2
1Agriculture and Agri-Food Canada, Ottawa Research and Development Centre, Ottawa ON K1A 0C6
Telephone: (613) 759-1752; Facsimile: (613) 952-9295; E-mail: [email protected]
2Ontario Ministry of Agriculture, Food and Rural Affairs, P.O. Box 400, Ridgetown ON N0P 2C0 TITLE / TITRE: STATUS OF CORN DISEASES IN ONTARIO, 2016 CROP SEASON ABSTRACT: Northern corn leaf blight (NCLB), common rust and eyespot were the most common leaf diseases found in Ontario corn fields in 2016, but overall the severity and incidence of these diseases was lower compared to earlier years. NCLB and common rust were found in ≥92% of fields visited in Southern and Western Ontario with only 16% and 9% of the affected fields having incidence levels of ≥25%, and only three fields of 122 visited having severities of ≥5 (>20% leaf area affected). NCLB incidence was less in fields sampled in Eastern Ontario (4%) compared to Southern Ontario (18%). Common rust incidence was also greater in Southern Ontario (10%) compared to Eastern (3%) and Western Ontario (7%). Eyespot was found in 75% of the fields sampled at a mean severity of 2.1 and an incidence of 4.4% of the fields visited. Grey leaf spot (GLS) was localized primarily in Southern Ontario where it was observed in 72% of the fields sampled. Ear and stalk rot diseases were insignificant at the time of survey. Neither Stewart’s bacterial wilt nor Goss’s bacterial wilt and blight were detected in Ontario in 2016. INTRODUCTION AND METHODS: Favourable spring conditions in most of Ontario resulted in many corn fields being planted in first quarter of May. The warm and dry weather during the 2016 growing season in conjunction with early planting led to rapid crop development which resulted in a decrease in the incidence and severity of many foliar diseases compared to 2014 and 2015 (Jindal et al. 2015, 2016). A total of 165 corn fields were surveyed across Ontario from September 06-16, 2016 to document the occurrence of various corn diseases, including: anthracnose leaf blight and die back (ALB) (Colletotrichum graminicola (Ces.) G.W. Wils), eyespot (Aureobasidium zeae (Narita & Hiratsuka) Dingley), grey leaf spot (GLS) (Cercospora zeae-maydis Tehon & E.Y. Daniels), northern corn leaf blight (NCLB) (Exserohilum turcicum (Pass.) K.J. Leonard and E.G. Suggs), northern corn leaf spot (Bipolaris zeicola (G.L. Stout) Shoemaker), southern corn leaf blight (Bipolaris maydis (Y. Nisik. & C. Miyake) Shoemaker), common rust (Puccinia sorghi Schwein), southern rust (P. polyspora Underw.), common smut (Ustilago maydis (DC.) Corda), head smut (Sphacelotheca reiliana (Kuhn) G.P. Clinton), Physoderma brown spot (Physoderma maydis (Miyabe) Miyabe), ear rot (Fusarium spp.), stalk rot (Fusarium spp. and Colletotrichum graminicola), and Stewart’s bacterial wilt (Pantoea stewartii Mergaert et al.). The 2016 corn disease survey provides vital information on endemic pathogen populations and allows for scouting of new invasive pathogens such as Goss’s bacterial wilt and blight (Clavibacter michiganensis subsp. nebraskensis (Vidaver & Mandel) Davis et al.) which has been detected in other areas of Canada (Manitoba and Alberta) and bordering US Great Lakes states, including Michigan (Harding et al. 2016). In addition to disease occurrence, the incidence (number of affected plants) and severity of the major leaf diseases (eyespot, GLS, NCLB and common rust) were also recorded in all 165 surveyed fields (Fig. 1). Severity of common rust, eyespot, GLS and NCLB was rated on the 1-7 scale of Reid and Zhu (2005). Leaves displaying NCLB symptoms were collected for E. turcicum race identification and distribution patterns. Additional symptomatic plants parts were collected for subsequent laboratory analysis, especially for unidentifiable or suspect Goss’s bacterial wilt and Stewart’s bacterial wilt samples. GPS coordinates of the fields visited were also recorded and used to plot the map.

155
RESULTS AND DISCUSSION:
Northern corn leaf blight continues to be the most common foliar corn disease in the province. In 2016 the disease was detected in 136 (82.4%) of fields sampled (Table 1). Seventeen of the 136 fields with NCLB had incidences ≥30% and 15 had severity ratings ≥4. The most severely affected fields were found in six counties of 19 surveyed across the province (Chatham-Kent (12/37), Leeds and Grenville (1/7), Oxford (1/12), Elgin (1/9), Ottawa (1/2), Middlesex (2/13)), illustrating that this year NCLB was not widespread in Ontario, although it is still the most widely spread and economically important foliar disease of corn. The disease was found in almost all the fields sampled in Southern and Western Ontario (96%), and nearly half the fields in Eastern Ontario (51%). Mean disease incidence in affected fields was also considerably lower in Eastern Ontario (4%) and Central Ontario (1.5%) compared to Southern (18%) and Western Ontario (4%); only four fields in Eastern Ontario had disease incidences of ≥18%. Mean disease severity in affected fields was near identical in Central (1.8), Eastern (1.8), Southern (2.7) and Western Ontario (1.9) (Table 2). Furthermore, all seed corn fields surveyed in Chatham-Kent and Essex counties had a higher mean disease severity (3.4; range 1.5-5.0) and a higher mean disease incidence (44.0%; range 3-90%) than those recorded for commercial corn fields. The high incidence of NCLB in Ontario is concerning since yield losses are associated with the disease, which erodes producer profits. Thus, there is a need to look for additional disease management strategies other than use of foliar fungicides, which increases production costs and can be an environmental risk. In future, sustainable and economic corn production will require the development of new NCLB Ht gene/inbreds and their incorporation into high yielding commercial corn hybrids. Variability in commercial corn hybrid reactions to NCLB was evident from inspection of the 17 Ontario Corn Committee (OCC) 2016 performance trials, of which 3 locations (Elora, Ottawa, and Ridgetown) had very high disease severity ratings (≥4) and 7 locations (Belmont, Blyth, Exeter, Lindsey, Orangeville, Tilbury and Wingham) had low disease severity ratings (≥2) (Table 3). The 165 sites surveyed will be used to map the geographical distribution of physiological races of E. turcicum as it is not uncommon to find both resistant and susceptible NCLB lesion types on the same leaf. Likewise one can observe that the reactions of some hybrids to NCLB differ depending on where they are grown in Ontario, suggesting the presence of different races of E. turcicum, as has been reported in previous years (Zhu et al. 2013, Jindal et al. 2016). To verify this, and to subsequently map the distribution of such races in corn growing regions of Ontario, 125 leaf samples with NCLB symptoms were collected during the survey. Eyespot was less prevalent in 2016 compared to earlier years particularly to 2015. The disease was found in 123 (75%) of the sites sampled (Table 1) at a mean severity of 2.1 and an incidence of 4.4% of the fields visited (Table 2). Only six of 123 affected fields had severity levels of 4 and an incidence of 5-35% of plants affected. As with NCLB, eyespot was less common in Eastern Ontario (67% of fields affected) compared to Southern and Western Ontario (78%). However, 4 individual fields in Eastern Ontario had high eyespot severity ratings of 4.0, compared to the mean eyespot severity of 2.1 in affected fields in Ontario. The less widespread distribution of eyespot in Ontario in 2016 was demonstrated by the elevated severity ratings of ≥4 only in 6 corn fields. Many of the hybrids included in the OCC trials planted at Belmont, Ilderton and Winchester, as well as many entries in seed company demonstration plots, exhibited variable levels of resistance to eyespot. These hybrids need to be identified for cultivation in the province. Common rust was also one of the more common foliar diseases detected in Ontario corn in 2016. Common rust was found in 139 (84%) fields (Table 1) at a mean disease severity of 2.3 and an incidence of 7.5% (Table 2). In contrast to NCLB and eyespot, common rust severity and incidence was similar across the province. High levels of common rust (≥4) were recorded in 12 fields in 5 counties [Wellington (1), Chatham-Kent (8), Dufferin (1), Durham (1), Waterloo (1) and Wellington (1)]. At all OCC sites, some of the commercial and developmental hybrids exhibited moderate to high resistance to common rust, assuming that infection was uniform throughout the field. In seed corn, three of 17 fields visited had female inbreds that were moderately susceptible (severity rating of 4.0) to common rust.

156
Southern rust, which has been common in southern and mid-central U.S. regions, was not found in any of the fields sampled. Grey leaf spot was found in 58 (35%) of the fields sampled (Table 1). Compared to 2014 and 2015, GLS was more widely spread in Ontario in 2016. The disease was most prevalent (95% of fields) in five counties, Chatham-Kent, Elgin, Essex, Middlesex and Oxford in Southern Ontario like 2015 (Jindal et al 2016). In Eastern Ontario, where 51 fields were sampled, GLS was detected only in one field. GLS severity and incidence was more (≤3.5 and ≤25.0, respectively) in 9 of 15 seed corn fields sampled compared to commercial hybrids grown in the area. At the OCC trial in Dresden and Belmont, some hybrids were highly susceptible to GLS, as was the case for various hybrids in demonstration plots in Chatham-Kent and Essex. Usually, GLS has been of major concern in the extreme southwest counties of Essex and Chatham-Kent where factors such as increased corn residues, intensive corn and seed corn production, and warm and humid conditions have favoured its development. This is in stark contrast to the U.S. Midwest corn-belt where GLS occurs throughout the region and is the most economically important foliar corn disease (Wise 2012). Anthracnose leaf blight and dieback was detected in 56 fields (34%), more than in earlier years. Twenty-three of these fields were in Eastern Ontario and 20 in Western Ontario. Overall the severity and incidence were low with the exception of four fields in Southern Ontario (≤3.0 and ≤10.0), respectively. ALB was also observed in 4 of the 15 seed corn fields and 9 of the 17 OCC trial sites. Other leaf spots: Northern leaf spot was found in 65 fields (40%) in Southern and Western Ontario. Its incidence was high in Chatham-Kent and Elgin counties. Physoderma Brown spot was found in many fields visited throughout the province, however, its severity and incidence were low in the majority of fields. Phaeosphaeria leaf spot caused by Phaeosphaeria maydis (Henn.) Rane, Payak, & Renfro was found in one field in Southern Ontario. Holcos leaf spot was not observed in any of the fields visited. Fungal ear and stalk diseases: Common smut and head smut were found in 46 (28%) of sampled fields (Table 1). This was more than last year but the incidence of either was not high. Only two fields had an incidence of more than 3%. Head smut was found in 6 fields in 2016. Ear rot was found in 10 fields at a low incidence level. Ears with exposed kernels were found to have more Fusarium spp. infection. Stalk rot was not found in any field. The low incidence and occurrence of ear and stalk diseases at the time of the survey suggests these diseases were less important in 2016 compared to earlier years, however, this survey may have been conducted too early to detect high levels of ear and stalk rots. Ear rots (Diplodia, Fusarium and Penicillium) were seldom observed at harvest as was Gibberella ear rot and its accompanying vomitoxin (DON) in the majority of the province. In another survey conducted in the last week of September, 2016 by OMAFRA to assess the presence of corn ear mould and grain vomitoxin, mould symptoms were much more prevalent (26% of samples above 2 ppm DON) compared to recent years (Rosser and Tenuta, 2016). Stewart’s bacterial wilt, which historically has been the most economically important disease in Ontario seed corn production, once again was not detected in any of the seed or commercial corn fields sampled in 2016. The decline in Stewart’s bacterial wilt in Ontario, as well as the U.S., has been attributed to the effective control of its vector, the corn flee beetle through the use of neonicotinoid seed treatment (Chaky et al. 2013). Likewise, Goss’s bacterial wilt and blight was not found in Ontario in 2016. ACKNOWLEDGEMENTS: This survey was supported in part by the AAFC Growing Forward Partnership with the Canadian Field Crop Research Alliance (CFCRA) and the Grain Farmers of Ontario who obtained funding, in part, through ‘Growing Forward 2’ (GF2), a federal-provincial-territorial initiative. The Agricultural Adaptation Council assists in the delivery of GF2 in Ontario. We would also like to thank our grower co-operators, various seed companies (Horizon Seeds, Hyland Seeds, Maizex Seeds, Mycogen Seeds, Pioneer Hi-Bred, and Pride Seeds) and the Ontario Corn Committee (OCC) for access to their fields.

157
REFERENCES: Chaky, J.L., Dolezal, W.E., Ruhl, G.E. and Jesse, L. 2013. A trend study of the confirmed incidence of Stewart’s wilt of corn, Pantoea stewartii subsp. stewartii, in the USA (2001-2012). Phytopathology 103 (Suppl. 3):S3.3. Harding, M.W., Howard, R.J., Reid, L.M., Jindal, K., Tambong, J.T., Tenuta, A. and Derksen, H. 2016. Overview of Goss’s Bacterial Wilt and Leaf Blight in Canada: Epidemiology, Distribution and Management. Can. J. Pl. Pathol. (Submitted). Jindal. K, Reid, L.M., Tenuta, A.U., Woldemariam, T. Zhu, X., Van Herk, C. and Kotulak, G. 2015. Status of corn diseases on Ontario, 2014 crop season. Can. Plant Dis. Surv. 95:91-96. Jindal. K, Reid, L.M., Tenuta, A.U., Woldemariam, T. Zhu, X., Van Herk, C. and Kotulak, G. 2016. Status of corn diseases on Ontario, 2015 crop season. Can. Plant Dis. Surv. 96:101-108. Reid, L.M. and Zhu, X. 2005. Screening corn for resistance to common diseases in Canada. Agriculture and Agri-Food Publication No. A42-103/2005E-PDF. Rosser, B. and Tenuta, A. 2016. Grain Corn Ear Mould and Vomitoxin (DON) Survey. (http://fieldcropnews.com/2016/10/2016-grain-corn-ear-mould-and-vomitoxin-don-survey/) Wise, K. 2012. Corn disease loss estimates from the United States and Ontario, Canada. (http://fyi.uwex.edu/fieldcroppathology/files/2014/01/BP-96-12-W.pdf) Zhu, X., Reid, L. M., Woldemariam, T., Tenuta, A., Van Herk, C. and Kotulak, G. 2013. Survey of corn diseases and pests in Ontario and Québec in 2012. Can. Plant Dis. Surv. 93:102-107. (www.phytopath.ca/publication/cpds)
Figure 1. 2016 Ontario corn diseases survey sampling sites.

158
Table 1. Disease occurrence in Ontario corn crops in 2016 grouped by county and region.
County No.
crops
Disease / number of crops affected (n=165)
ALB Eye-spot
GLS NCLB Rust Smut Ear rot
Stalk rot
Chatham-Kent 37 3 27 35 37 35 6 3 0
Dufferin 4 4 4 0 4 4 3 3 0
Durham 2 1 2 0 2 1 1 0 0
Elgin 9 6 8 7 9 9 1 1 0
Essex 3 0 2 2 3 3 0 1 0
Grey 5 1 0 0 2 1 1 0 0
Huron 9 4 5 0 8 8 1 0 0
Lanark 1 1 1 0 1 1 1 0 0
Leeds & Grenville 9 6 8 0 7 8 5 0 0
Middlesex 13 1 12 7 13 13 0 0 0
Norfolk 3 0 3 1 3 3 0 0 0
Ottawa 5 2 3 0 2 3 3 1 0
Oxford 12 2 10 4 12 12 2 0 0
Perth 8 6 8 1 8 7 3 0 0
Prescott & Russell 1 0 1 0 1 0 1 0 0
Renfrew 18 2 6 0 0 11 5 0 0
Stormont, Dundas & Glengarry 17 12 15 1 15 11 12 1 0
Waterloo 3 2 3 0 3 3 0 0 0
Wellington 6 3 5 0 6 6 1 0 0
Central Ontario 2 1 2 0 2 1 1 0 0
Eastern Ontario 51 23 34 1 26 34 27 2 0
Southern Ontario 77 12 62 56 77 75 9 5 0
Western Ontario 35 20 25 1 31 29 9 3 0
Ontario 165 56 123 58 136 139 46 10 0
ALB = Anthracnose leaf blight and die back, GLS = Grey leaf spot, NCLB = Northern corn leaf blight, Rust = Common rust, Smut = Common smut, Ear rot = includes Gibberella ear rot and Fusarium ear rot, Stalk rot = includes Fusarium stalk rot and Pythium stalk rot

159
Table 2. Severity and incidence of major diseases in Ontario corn crop in 2016, grouped by county and region
County Eyespot GLS NCLB Common Rust
Severity1 Incidence (%)2 Severity1 Incidence (%)2 Severity1 Incidence (%)2 Severity1 Incidence (%)2
Mean Range Mean Range Mean Range Mean Range Mean Range Mean Range Mean Range Mean Range
Chatham-Kent 1.9 1.0-3.5 3.4 0-20 2.9 1-5.5 22.4 0-100 3.0 1.5-5.0 26.0 2-90 2.9 1-5.5 15.6 0-100 Dufferin 1.9 1.5-2.0 1.3 1-2 - - - - 2.0 1.5-2.5 1.0 1.0 2.8 1.5-4 14.8 1-50 Durham 2.5 2.0-3.0 3.0 1-5 - - - - 1.8 1.5-2.0 1.5 1-2 2.5 1.0-4.0 40.0 0-80 Elgin 2.3 1.0-4.0 4.4 0-15 2.2 1.0-4.0 6.9 0-35 2.5 1.5-4.5 9.0 1-50 2.3 2.0-3.5 4.6 1-20 Essex 1.7 1.0-2.0 1.7 0-3 2.0 1.0-3.0 2.3 0-5 2.0 2.0 4.0 2-5 2.3 2.0-3.0 3.0 2-5 Grey - - - - - - - - 1.4 1.0-2.0 1.0 0-2 1.4 1.0-3.0 2.0 0-10 Huron 1.6 1.0-3.5 3.1 0-20 - - - - 2.0 1.0-3.0 4.0 0-15 2.1 1.0-3.0 4.6 0-15 Lanark 2.0 2.0 3.0 3 - - - - 2.0 2.0 2.0 2.0 2.5 2.5 4.0 4 Leeds & Grenville 2.4 1.0-4.0 6.0 0-30 - - - - 2.1 1.0-4.5 6.0 0-50 2.5 1.0-3.0 4.8 0-9 Middlesex 2.8 1.0-4.0 11.4 0-30 1.6 1.0-2.5 1.9 0-5 2.8 2.0-5.5 19.0 1-100 2.5 2.0-3.0 7.8 2-34 Norfolk 2.0 2.0 2.0 2 1.5 1.0-2.5 1.7 0-5 2.0 2.0 2.0 1-3 2.0 2.0 2.0 2 Ottawa 2.0 1.0-3.0 3.0 0-8 - - - - 1.9 1.0-4.0 9.0 0-45 1.7 1.0-3.0 3.6 0-15 Oxford 2.1 1.5-3.0 4.6 0-20 1.3 1.0-2.0 1.1 0-5 2.3 1.5-3.5 9.0 3-70 2.2 1.5-3.0 3.6 1-11 Perth 2.1 1.5-3.5 3.3 1-10 1.1 1.0-1.5 0.1 0-1 1.9 1.5-3.5 5.0 1-10 2.1 1.0-3.0 3.4 0-12 Prescott & Russell 2.5 2.5 2.0 2 - - - - 2.5 2.5 2.0 2 - - - - Renfrew 1.5 1.0-3.0 1.1 0-5 - - - - - - - - 1.9 1.0-3.5 2.6 0-10 Stormont, Dundas & Glengarry 2.8 1.0-4.0 9.7 0-35 1.1 1.0-2.5 0.2 0-3 2.4 1.0-3.5 6.0 0-25 1.9 1.0-3.5 2.3 0-8 Waterloo 2.3 2.0-3.0 3.0 2-5 - - - - 2.2 1.5-3.0 8.0 2-20 2.7 2.0-4.0 8.0 1-20 Wellington 2.1 1.0-3.0 1.8 0-4 - - - - 2.2 1.5-4.0 6.0 1-28 2.3 15-4.5 12.0 1-60
Central Ontario 2.5 2.0-3.0 3.0 1-5 - - - - 1.8 1.5-2.0 1.5 1-2 2.5 1.0-4.0 40.0 0-80 Eastern Ontario 2.2 1.0-4.0 5.1 0-35 1.0 1.0-2.5 0.1 1-3 1.8 1.0-4.5 4.0 0-50 2.0 1.0-3.5 2.9 0-15 Southern Ontario 2.2 1.0-4.0 4.9 0-30 2.3 1.0-5.5 12.2 1-100 2.7 1.5-5.5 18.0 1-100 2.6 1.0-5.5 10.1 0-100 Western Ontario 1.8 1.0-3.5 2.3 0-20 1.0 1.0-1.5 0.0 0-1 1.9 1.0-4.0 4.2 0-28 2.2 1.0-4.5 6.7 0-60
All Ontario 2.1 1.0-4.0 4.4 0-100 1.6 1.0-5.5 5.7 0-100 2.3 1.0-5.5 10.7 0-100 2.3 1.0-5.5 7.5 0-100 1Disease severity in affected crop was rated as percentage of leaf area with symptoms; eyespot, GLS (Grey leaf spot) and common rust were rated on a 1-7 scale (1=no symptoms, 2=<1%, 3=1-5%, 4=6-20%, 5=21-50%, 6=>50 % leaf area with symptoms and 7= most of the leaves dead); NCLB (Northern corn leaf blight) on 1-7 scale based on percentage of leaf area with symptoms (1=no symptoms; 2=<1% (1% leaves with symptoms); 3=1-5% (2-10%
leaves with symptoms); 4=6-20% (11 to 25% leaves with symptoms); 5=21-50% (50% lower leaves and >25% of the centre and upper leaves with symptoms), 6=51-75% (lower leaves dead, >50 centre leaves and >25% upper leaves with symptoms); 7=most leaves almost dead. 2Incidence is number of affected plants/total number of plants observed x 100; A 'hyphen' indicates disease not found in the fields sampled.

160
Table 3. Severity and incidence of major diseases observed at OCC1 corn trial sites in Ontario, 2016.
OCC1 trial site
ES GLS NCLB Common Rust
Severity2 Incidence
(%)3 Severity2 Incidence
(%)3 Severity2 Incidence
(%)3 Severity2 Incidence
(%)3
Alma 2.5 2 1.0 0 2.5 3 3.5 7
Belmont 4.0 15 4.0 35 2.0 4 3.5 10
Blyth 1.5 1 1.0 0 2.0 3 3.0 15
Dresden 2.0 2 4.5 50 2.5 5 3.5 10
Dundalk 1.0 0 1.0 0 1.0 0 1.0 0
Elora 2.0 2 1.0 0 4.0 28 4.5 60
Exeter 2.0 3 1.0 0 2.0 4 2.0 3
Ilderton 4.0 30 2.0 3 2.5 5 2.5 4
Linsay 2.0 1 1.0 0 2.0 2 1.0 0
Orangeville 2.0 1 1.0 0 1.5 1 2.5 3
Ottawa 3.0 8 1.0 0 4.0 45 3.0 15
Ridgetown 3.0 8 2.0 3 4.0 20 3.0 6
Tilbury 2.0 5 2.0 2 1.5 15 2.0 5
Waterloo 2.0 2 1.0 0 3.0 20 4.0 20
Winchester 4.0 24 2.5 3 3.0 5 3.5 8
Wingham 1.5 1 1.0 0 2.0 1 2.0 2
Woodstock 2.5 10 1.0 0 2.5 4 2.5 11 1OCC - Ontario Corn Committee 2Disease severity in affected crop was rated as percentage of leaf area with symptoms; eyespot, GLS (Grey leaf spot) and common rust were rated on a 1-7 scale (1=no symptoms, 2=<1%, 3=1-5%, 4=6-20%, 5=21-50%, 6=>50 % leaf area with symptoms and 7= most of the leaves dead); NCLB (Northern corn leaf blight) on 1-7 scale based on percentage of leaf area with symptoms (1=no symptoms; 2=<1% (1% leaves with symptoms); 3=1-5% (2-10% leaves with symptoms); 4=6-20% (11 to 25% leaves with symptoms); 5=21-50% (50% lower leaves and >25% of the centre and upper leaves with symptoms), 6=51-75% (lower leaves dead, >50 centre leaves and >25% upper leaves with symptoms); 7=most leaves almost dead. 3Incidence is number of affected plants/total number of plants observed x 100.

161
OILSEEDS, PULSES, FORAGES AND SPECIAL CROPS / OLÉAGINEUX, PROTÉAGINEUX, PLANTES FOURRAGÈRES ET CULTURES SPÉCIALES CROP / CULTURE: Caraway and Coriander LOCATION /RÉGION: Saskatchewan NAMES AND AGENCIES / NOMS ET ÉTABLISSEMENTS: C. Armstrong-Cho1, A. Brown2 and S. Banniza1
1Crop Development Centre, University of Saskatchewan, 51 Campus Drive, Saskatoon SK S7N 5A8 2Saskatchewan Crop Insurance Corporation, 484 Prince William Drive, Melville, SK S0A 2P0 Telephone: (306) 966-1956; Facsimile: (306) 966-5015; E-mail: [email protected] TITLE / TITRE: BLOSSOM BLIGHT IN SASKATCHEWAN CARAWAY AND CORIANDER IN 2016 ABSTRACT: Field observations of blossom blight were coupled with conventional flower plating analysis. Blossom blight occurred at three of seven caraway locations sampled, and at seven of 13 coriander locations. Incidence of the pathogen in flowers ranged from 0-78% in brown caraway umbels and 0-16% in green (asymptomatic) caraway umbels. In coriander, incidence of the pathogen ranged from 3-70% in brown and 0-33% in green umbels. INTRODUCTION AND METHODS: Blossom blight is an important production issue in caraway and coriander. Limited availability of information and disease management tools make production challenging. Several pathogens have been reported to play a role in blossom blights in these crops (Dennis 2002; Duczek and Slinkard, 2003), but information on their relative importance is lacking. A survey was undertaken to observe the occurrence of blossom blight disease in Saskatchewan. Sampling of flowers prior to epidemic development and sampling of green as well as brown umbels, were strategies employed to reduce the confounding effects of secondary pathogens and saprophytes. Sampling was carried out from early to late flower in both crops. Umbels from 12 caraway fields from seven Saskatchewan locations were collected during the 2016 growing season. In coriander, 28 fields and 1 urban garden were sampled from 13 Saskatchewan locations. Five umbels were collected from three sites in each field, and each umbel was scored as green or brown. Four floret clusters from each umbel were surface sterilized and plated on potato dextrose agar (PDA). Organisms arising from ovary tissues were recorded after two days and colonies arising from tissues were recorded after seven days. The incidence of the various organisms observed in plate testing was summarized and correlated with field observations. In this way, one (major) pathogen candidate for each crop was identified. The incidence of this pathogen in plate tests was then used as an indicator of disease incidence. In both caraway and coriander, their respective candidate pathogens resemble blossom blight pathogens previously reported in the province (Duczek and Slinkard, 2003; Thomson and Waterer, 2008). RESULTS AND COMMENTS: Blossom blight was observed at three of the seven caraway locations sampled. The pathogen candidate could be observed in green as well as brown tissues from these sites, as well as at a low level (2%) in a field at Odessa where disease symptoms were not noted in the field (Table 1). Blossom blight was observed in seven of 13 coriander growing locations in Saskatchewan, three of which (Lemberg, Duff, and Neudorf), were clustered east of the Qu’Appelle region. Of note was severe disease observed at Eston, Saskatchewan despite two fungicide applications. In the Saskatoon area, severe disease was observed in a home garden, but research plots both at AAFC and the University of Saskatchewan’s Kernen Crop Research Farm remained healthy. The pathogen candidate was detected in flowers from all diseased fields, with 3-20% incidence in brown umbels and 4-33% incidence in green umbels. Although the flowers collected at Grayson appeared

162
healthy, 33% were infected with the pathogen candidate and symptoms in the field were noted by the grower shortly after sampling. Where disease was not noted in the field, recovery of the pathogen candidate was low (0-8%). Although disease symptoms were noted at Watrous, recovery of the pathogen candidate was low (0-4%), but Botrytis recovery was high compared to other sites, with 40% observed in green umbels and 72% in brown umbels. Generally, however, the incidence of Botrytis on coriander umbels did not correlate well with field disease observations. Excluding Watrous samples, mean Botrytis incidence was 15% from sites with disease and 18% from sites without disease. Despite frequent rainfall in much of the province in 2016, blossom blight of caraway and coriander was observed at less than half of the locations sampled. Many questions remain about disease transmission of blossom blight, the variation in pathogen prevalence among years and locations, the impact of agronomic practises on disease development and the efficacy of fungicides. Accurate identification of primary pathogens is also needed. ACKNOWLEDGEMENTS: We gratefully acknowledge the participation of the Saskatchewan Crop Insurance Corporation and the Crop Development Centre staff for the collection of umbel samples and agronomic information. Sincere thanks also go to Laura Cox for her technical assistance. REFERENCES: Dennis, J.I. 2002. New disease of coriander in Australia associated with a Microdochium species. New Disease Reports 6: 7.
Duczek, L. and Slinkard, A.E. 2003. Final Report for Saskatchewan Agricultural Development Fund Project 19990339, Blight Disease of Coriander and Caraway.
Thomson, J. and Waterer, D. 2008. Final Report for Agricultural Development Fund Project 20040517, Management of Foliar and Seed-Borne Diseases of Spice Crops. Table 1. Incidence of a blossom blight (%) pathogen candidate isolated from green and brown caraway umbels.
Sask. Location
(number of fields)
in the field
brown umbels
green umbels
Assiniboia (2) no 0 0
Carrot River (2) no 0 0
Choiceland (1) yes 78 16
Hudson Bay (1) no n/a 0
Lemberg (3) yes 36 7
Duff (2) yes 13 7
Odessa (1) no 2 0

163
Table 2. Incidence of a blossom blight pathogen candidate (%) isolated from green and brown coriander umbels.
Sask. Location (number of fields)
Disease noted in the field
Incidence of coriander pathogen candidate (%)
brown umbels green umbels
Assiniboia (1) no 8 0
Eston (2) yes 70 4
Francis (2) no n/a 0
Grayson (3) yes n/a 33
Lemberg (3) yes 51 5
Duff (1) yes 64 27
Leross (6) yes 3 20
Neudorf (1) yes 8 8
Odessa (1) no n/a 0
Saskatoon AAFC (1) no n/a 2
Saskatoon Kernen (1) no n/a 0
Saskatoon garden (1) yes 45 n/a
Tyvan (1) no n/a 2
Watrous (3) yes 4 0
Wolseley (2) no n/a 0

164
CROP / CULTURE Canola LOCATION / RÉGION: Alberta NAMES AND AGENCIES / NOMS ET ÉTABLISSEMENTS S.E. Strelkov1, V.P. Manolii1, M.W. Harding2, S.F. Hwang3, E. Manolii1, K. Zuzak3, D.C. Rennie3, J. Feng3, M. Rahaman1, G.C. Daniels2, D.A. Burke2, T.B. Hill2, K. Zhar3 and D. Feindel3 Telephone: (780) 492-1969; Facsimile: (780) 492-4265; E-mail: [email protected] 1Department of Agricultural, Food and Nutritional Science, University of Alberta, 410 Agriculture/Forestry Centre, Edmonton AB T6G 2P5 2Alberta Agriculture and Forestry, Crop Diversification Centre South, 301 Horticultural Station Road East, Brooks AB T1R 1E6
3Alberta Agriculture and Forestry, Crop Diversification Centre North, 17507 Fort Road NW, Edmonton AB T5Y 6H3 TITLE: OCCURRENCE AND SPREAD OF CLUBROOT ON CANOLA IN ALBERTA IN 2016 ABSTRACT: A survey of 570 commercial canola (Brassica napus L.) crops representing 40 counties and municipalities in Alberta revealed 68 new fields infested with clubroot (Plasmodiophora brassicae Woronin). Another 221 new cases of the disease were found during surveillance by municipal and county personnel, for a total of 289 new clubroot-infested fields in 2016. Clubroot infestations have been confirmed in a grand total of 2443 fields in Alberta since surveys for this disease commenced in 2003. METHODS: A survey for clubroot (Plasmodiophora brassicae Woronin) was carried out in 570 commercial canola (Brassica napus L.) crops distributed across 40 counties and municipalities in Alberta. Fields included in the survey had either not been inspected previously for clubroot, or had been surveyed earlier and found to be free of the disease. Most fields were visited in September shortly after swathing. A 20 to 30 m2 area was selected near the field entrance and at least 50 canola roots were sampled randomly within that area. If no symptoms of clubroot were found, then no more sampling was carried out. If clubroot was found, then the crop was surveyed more extensively by inspecting the roots of all plants within a 1 m2 area at each of 10 locations along the arms of a ‘W’ sampling pattern. This approach was used because most clubroot infestations are initiated at field entrances (1). Clubroot symptom severity on each sampled canola plant was assessed on a scale of 0 to 3 according to Kuginuki et al. (2), where: 0 = no galling, 1 = a few small galls, 2 = moderate galling and 3 = severe galling. The individual ratings were used to calculate an index of disease (ID) for each crop, based on the method of Horiuchi and Hori (3) as modified by Strelkov et al. (4). Whenever possible, surveillance activities were coordinated with the agricultural fieldman in each municipality. Survey information from independent clubroot inspections conducted by county and municipal staff was collected and combined with the data from the Alberta-wide survey, in order to produce the most complete assessment possible of clubroot infestation in the province. RESULTS AND COMMENTS: Symptoms of clubroot were found in 68 of 570 canola crops inspected. Disease severity ranged from mild to severe, with an average ID <10% in 45 crops, 10-60% in 20 crops, and >60% in three crops. The three cases of severe clubroot were found in susceptible hybrids. In addition to the new records of clubroot identified in the province-wide survey, another 221 new cases of the disease were found during surveillance by county and municipal personnel in the counties of Athabasca, Camrose, Lacombe, Lamont, Leduc, Minburn, Parkland, Smoky Lake, Stettler, Strathcona, Sturgeon, Westlock, Wetaskiwin and Woodlands (Table 1). Since Athabasca, Lacombe, Lamont, Minburn, Parkland, Stettler and Wetaskiwin were not visited as part of the province-wide survey coordinated by the University of Alberta and Alberta Agriculture and Forestry, the only data on clubroot occurrence in those counties came from the municipal personnel. Further monitoring of canola crops in the Peace River Region of Alberta by Ministry of Agriculture and Forestry staff revealed no instances of clubroot there (data not shown), and the region still appears to be free of the disease. In total, 289 new clubroot infestations were recorded in Alberta in 2016, for a grand total of 2443 fields with confirmed infestations since surveys began in 2003 (Fig. 1). While most of the 289 new records of clubroot were found on susceptible canola hybrids or hybrids of unknown resistance, symptoms of the disease also were identified in 42 fields that had been planted to clubroot-resistant hybrids. Galled canola root tissue was collected from each of these fields in order to

165
recover the corresponding pathogen populations and evaluate their virulence under controlled environmental conditions. Novel virulence phenotypes of P. brassicae, capable of overcoming the resistance in most clubroot resistant hybrids, have been recently identified in Alberta (5). As such, it is important to monitor for further shifts in pathogen virulence that could decrease the effectiveness of genetic resistance as a clubroot management tool. ACKNOWLEDGEMENTS: We would like to thank J. Babcock, A. Barnes, M. Bates, Q. Beaumont, J. Benson, J. Boden, A. Boese, N. Boulet, L. Boyd, D. Burlock, T. Cherniawsky, C. Chrenek, J. Cosens, A. Delaney, M. Deol, C. Dowhan, K. Gabert, T. Eleniak, A. Eyolfson, D. Fortin, J. Fulton, J. Gauthier, K. Hudson, A. Hutchings, M. Janz, M. Jenkins, T. Jensen, C. Jurke, T. Keller, T. Kerr, A. Kolenosky, T. Korchinski, K. Kornelsen, E. Kozak, G. Kummer, K. Lamoureux, W. Leister, J. Leskiw, S. Majek, M. Martinson, T. McGinn, C. McLean, J. Meeks, K. Meunier, M. Millang, D. Myshak, D. Orchard, T. Ponath, G. Renfert, T. Roeleveld, J. Schwindt, A. Shapka, A. Skogstad, J. Tigert, D. Ullery, A. Van Beers, R. Veenstra, J. Williams, R. Young, and E. Zukiwski for their assistance with the survey. The financial support provided by Agriculture and Agri-Food Canada, the Canola Council of Canada, the Canola Agronomic Research Program (CARP), and the Alberta Crop Industry Development Fund also is gratefully acknowledged. REFERENCES:
Cao, T., Manolii, V.P., Hwang, S.F., Howard, R.J., and Strelkov, S.E. 2009. Virulence and spread of
Plasmodiophora brassicae [clubroot] in Alberta, Canada. Can. J. Plant Pathol. 31:321-329.
Kuginuki, Y., Hiroaki, Y., and Hirai, M. 1999. Variation in virulence of Plasmodiophora brassicae in Japan
tested with clubroot-resistant cultivars of Chinese cabbage (Brassica rapa L. spp. pekinensis). Eur. J.
Plant Pathol. 105:327-332.
Horiuchi, S., and Hori, M. 1980. A simple greenhouse technique for obtaining high levels of clubroot
incidence. Bull. Chugoku Natl. Agric. Exp. Stn. E (Environ. Div.). 17:33-55.
Strelkov, S.E., Tewari, J.P., and Smith-Degenhardt, E. 2006. Characterization of Plasmodiophora
brassicae populations from Alberta, Canada. Can. J. Plant Pathol. 28:467-474.
Strelkov, S.E., Hwang, S.F., Manolii, V.P., Cao, T., and Feindel, D. 2016. Emergence of new virulence
phenotypes of Plasmodiophora brassicae on canola (Brassica napus) in Alberta, Canada. Eur. J. Plant
Pathol. 145:517-529.

166
Table 1. Distribution of Plasmodiophora brassicae-infested canola fields identified in Alberta in 2016.
County or municipality
Number of fields assessed in
provincial survey
Number of new cases of P.
brassicae- infested fields
Additional new cases identified by county/
municipal staff
Total new cases
Acadia 2 0 0 0
Athabasca 0 -- 3 3
Beaver 24 2 0 2
Bonnyville 24 0 0 0
Brazeau 7 0 0 0
Camrose 20 5 34 39
Cardston 10 0 0 0
Clearwater 21 2 0 2
Edmonton (City) 3 1 0 1
Flagstaff 24 0 0 0
Foothills 10 0 0 0
Forty Mile 10 0 0 0
Lac Ste. Anne 21 2 0 2
Lacombe 0 -- 5 5
Lamont 0 -- 3 3
Leduc 12 6 94 100
Lesser Slave River 23 0 0 0
Minburn 0 -- 1 1
Mountain View 16 1 0 1
Newell 20 0 -- 0
Paintearth 22 0 0 0
Parkland 0 -- 38 38
Pincher Creek 10 0 0 0
Ponoka 21 4 0 4
Smoky Lake 26 10 1 11
Special Area 2 10 0 0 0
Starland 20 0 0 0
Stettler 6 0 5 5
St. Paul 22 2 0 2
Strathcona 3 0 10 10
Sturgeon 35 13 12 25
Taber 10 0 0 0
Two Hills 18 4 0 4
Vulcan 14 0 0 0
Warner 10 0 0 0
Westlock 48 11 1 12
Wetaskiwin 0 -- 12 12
Wheatland 20 0 0 0
Willow Creek 10 0 0 0
Woodlands 18 5 2 7
TOTAL 570 68 221 289

167
Figure 1. The occurrence of clubroot on canola in Alberta. Since surveys for clubroot were initiated in 2003, the disease has been confirmed in a total of 2443 fields representing 31 counties and municipal districts in the province, as well as in rural areas of the cities of Edmonton and Medicine Hat, and the Town of Stettler.

168
CROP / CULTURE: Canola LOCATION / RÉGION: Alberta NAMES AND AGENCY / NOMS ET ÉTABLISSEMENT: M.W. Harding, T.B. Hill, G.C. Daniels, DC. Rennie, K. Zuzak, J. Feng and J. McDonald
Alberta Agriculture Forestry, Crop Diversification Centre South, Brooks AB T1R 1E6 Telephone: (403) 362-1338; Facsimile: (403) 362-1326; E-mail: [email protected] TITLE / TITRE: A SURVEY FOR BLACKLEG AND SCLEROTINIA STEM ROT ON CANOLA IN ALBERTA IN 2016 ABSTRACT: Blackleg on canola (Brassica napus L.), caused by Leptosphaeria maculans (Sowerby) P. Karst., is a disease commonly found across Alberta and can be responsible for serious yield losses if not managed. However, where cultivar resistance is utilized, the disease severity is often very low (Kutcher et al., 2013; Harding et al., 2016). Stem rot caused by Sclerotinia sclerotiorum (Lib.) de Bary is also a very common disease on canola in Alberta, but strong genetic resistance is not available as a management option (Garg et al., 2010; Uloth et al., 2013). A survey for blackleg and stem rot on canola was undertaken to characterize the prevalence, incidence and severity of the diseases in Alberta in 2016. INTRODUCTION AND METHODS: Leptosphaeria maculans, the causal agent of blackleg, is a declared pest in Alberta’s Agricultural Pests Act and Regulation. The recent surveys for blackleg on canola in Alberta in 2012 and 2015 indicated that, while the pathogen is commonly found across the province, cases of high severity are extremely rare. Since it is important to understand the distribution, prevalence and severity of this pathogen, a survey for blackleg in Alberta was undertaken in 2016. A survey target of 1% of canola fields in each county was established based on the most recent Agricultural Census for Alberta. The total survey target for Alberta was 378 canola fields. Surveyors were encouraged to visit canola fields the week prior to swathing. Post-swathing ratings were discouraged unless they were taken within a few days of cutting. Surveyors walked a W-shaped pattern, stopping at five locations in the field. Sampling locations were at least 20 m apart and at least 20 m from field margins. The lower stems (bottom 6 in) of twenty plants were collected at each sampling location (100 stems per field). All stems were sent directly to Alberta Agriculture and Forestry stations, either the Crop Diversification Centre North (Edmonton, AB) or South (Brooks, AB). Each canola stem sample was evaluated for the presence of blackleg symptoms such as stem cankers, lesions with pycnidia and internal stem blackening. Blackleg prevalence was calculated as a percentage of fields with symptoms. Blackleg incidence was calculated as a percentage of stem samples showing blackleg symptoms. Blackleg severity was estimated using 0-5 scale for rating vascular discoloration (WCC/RCC, 2009; Table 1). Stem rot infections on lower main stems, caused by Sclerotinia sclerotiorum, were also recorded from 311 of the fields sampled. Stems were considered to have stem rot infection caused by S. sclerotiorum when stems were soft and would shred when twisted, or when sclerotia were observed inside the stem. Prevalence was calculated as the percentage of fields with stem rot and incidence as the percentage of samples showing stem rot symptoms. RESULTS AND COMMENTS: In total, 480 canola fields were surveyed for blackleg and 311 fields for stem rot in 2016. A total of 432 were found to have blackleg symptoms for a prevalence of 90%. Symptoms were seen on 10,178 out of 48,519 canola stems for an overall blackleg incidence of 21.2%. The overall average severity was 0.42. Survey results are presented in Table 2 and Figure 1. Stem rot was observed in 252 of the 311 fields evaluated for a prevalence of 81.0%. The incidence of stem rot ranged from 0 to 100% with an overall incidence of 30.7% (Table 3). REFERENCES: Kutcher, H.R., Brandt, S.A., Smith, E.G., Ulrich, D., Malhi, S.S. and Johnston, A.M. 2013. Blackleg disease of canola mitigated by resistant cultivars and four-year crop rotations in western Canada. Can. J. Plant Pathol. 35: 209-221. Harding, M.W., Hill, T.B., Daniels, G.C., Burke, D.A., Pugh, C.A. and Hill C.J. 2016. A survey for blackleg on canola in Alberta in 2015. Can. Plant Dis. Surv. 95:160-162.
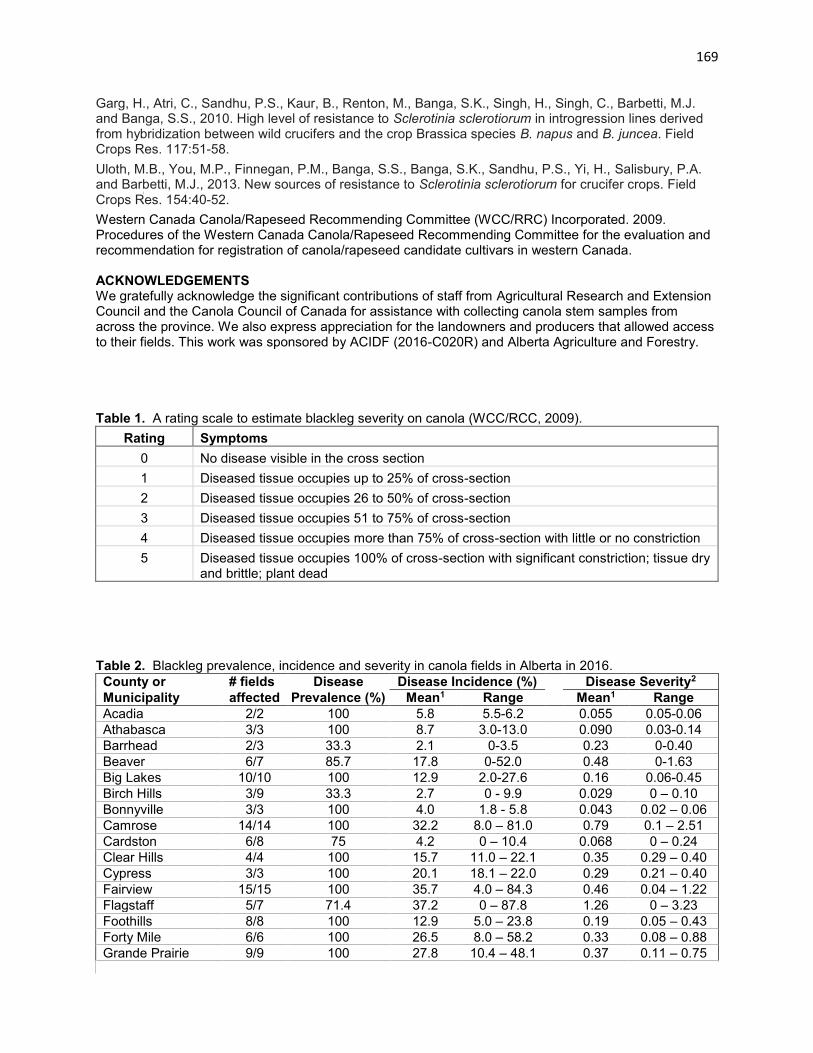
169
Garg, H., Atri, C., Sandhu, P.S., Kaur, B., Renton, M., Banga, S.K., Singh, H., Singh, C., Barbetti, M.J. and Banga, S.S., 2010. High level of resistance to Sclerotinia sclerotiorum in introgression lines derived from hybridization between wild crucifers and the crop Brassica species B. napus and B. juncea. Field Crops Res. 117:51-58.
Uloth, M.B., You, M.P., Finnegan, P.M., Banga, S.S., Banga, S.K., Sandhu, P.S., Yi, H., Salisbury, P.A. and Barbetti, M.J., 2013. New sources of resistance to Sclerotinia sclerotiorum for crucifer crops. Field Crops Res. 154:40-52.
Western Canada Canola/Rapeseed Recommending Committee (WCC/RRC) Incorporated. 2009. Procedures of the Western Canada Canola/Rapeseed Recommending Committee for the evaluation and recommendation for registration of canola/rapeseed candidate cultivars in western Canada. ACKNOWLEDGEMENTS We gratefully acknowledge the significant contributions of staff from Agricultural Research and Extension Council and the Canola Council of Canada for assistance with collecting canola stem samples from across the province. We also express appreciation for the landowners and producers that allowed access to their fields. This work was sponsored by ACIDF (2016-C020R) and Alberta Agriculture and Forestry. Table 1. A rating scale to estimate blackleg severity on canola (WCC/RCC, 2009).
Rating Symptoms
0 No disease visible in the cross section
1 Diseased tissue occupies up to 25% of cross-section
2 Diseased tissue occupies 26 to 50% of cross-section
3 Diseased tissue occupies 51 to 75% of cross-section
4 Diseased tissue occupies more than 75% of cross-section with little or no constriction
5 Diseased tissue occupies 100% of cross-section with significant constriction; tissue dry and brittle; plant dead
Table 2. Blackleg prevalence, incidence and severity in canola fields in Alberta in 2016.
County or # fields Disease Disease Incidence (%) Disease Severity2
Municipality affected Prevalence (%) Mean1 Range Mean1 Range
Acadia 2/2 100 5.8 5.5-6.2 0.055 0.05-0.06
Athabasca 3/3 100 8.7 3.0-13.0 0.090 0.03-0.14
Barrhead 2/3 33.3 2.1 0-3.5 0.23 0-0.40
Beaver 6/7 85.7 17.8 0-52.0 0.48 0-1.63
Big Lakes 10/10 100 12.9 2.0-27.6 0.16 0.06-0.45
Birch Hills 3/9 33.3 2.7 0 - 9.9 0.029 0 – 0.10
Bonnyville 3/3 100 4.0 1.8 - 5.8 0.043 0.02 – 0.06
Camrose 14/14 100 32.2 8.0 – 81.0 0.79 0.1 – 2.51
Cardston 6/8 75 4.2 0 – 10.4 0.068 0 – 0.24
Clear Hills 4/4 100 15.7 11.0 – 22.1 0.35 0.29 – 0.40
Cypress 3/3 100 20.1 18.1 – 22.0 0.29 0.21 – 0.40
Fairview 15/15 100 35.7 4.0 – 84.3 0.46 0.04 – 1.22
Flagstaff 5/7 71.4 37.2 0 – 87.8 1.26 0 – 3.23
Foothills 8/8 100 12.9 5.0 – 23.8 0.19 0.05 – 0.43
Forty Mile 6/6 100 26.5 8.0 – 58.2 0.33 0.08 – 0.88
Grande Prairie 9/9 100 27.8 10.4 – 48.1 0.37 0.11 – 0.75

170
Table 2 (cont’d.) Greenview 4/4 100 13.9 1.1 – 20.8 0.17 0.01 – 0.27
Kneehill 7/7 100 17.8 4.0 – 34.3 0.37 0.08 – 0.76
Lac La Biche 1/1 100 1.0 n/a 0.02 n/a
Lac Ste Anne 3/3 100 12.9 7.9 – 20.0 0.2 0.08 – 0.12
Lacombe 6/7 85.7 25.7 0 – 51.8 0.53 0 – 1.17
Lamont 5/5 100 23.3 11.4 – 55.0 0.35 0.12 – 1.07
Leduc 8/8 100 16.8 2.1 – 25.8 0.22 0.02 – 0.35
Lethbridge 5/9 55.6 3.3 0 – 14.4 0.04 0 – 0.21
Mackenzie 20/20 100 37.9 6.7 – 89.0 1.2 0.07 – 3.81
Minburn 13/13 100 33.6 5.1 – 100 0.83 0.05 – 3.13
Mountain View 4/6 66.7 3.3 0 – 7.8 0.053 0 – 0.21
Newell 10/10 100 29.8 7.0 – 78.1 0.62 0.12 – 2.19
Northern Lights 9/9 100 39.7 5.2 – 82.2 0.61 0.05 – 1.51
Paintearth 5/6 83.3 6.3 0 – 12.6 0.065 0 – 0.13
Parkland 2/2 100 12.6 11.5 – 13.7 0.13 0.12 – 0.13
Peace 2/2 100 25.5 10.1 – 40.9 0.47 0.16 – 0.77
Pincher Creek 5/5 100 4.9 1.0 – 10.7 0.07 0.01 – 0.17
Ponoka 5/5 100 16.1 3.1 – 33.0 0.19 0.03 – 0.45
Provost 2/2 100 47.4 21.2 – 73.7 0.43 0.34 – 0.51
Red Deer 16/16 100 12.2 2.0 – 49.0 0.24 0.02 – 1.38
Rocky View 12/12 100 12.3 1.0 – 43.0 0.24 0.01 – 1.23
SA 2 2/2 100 2.5 2.0 – 3.0 0.065 0.04 – 0.09
Saddle Hills 4/7 57.1 0.9 0 – 2.3 0.01 0 – 0.03
Smoky Lake 17/20 85 30.0 0 – 68.9 0.42 0 – 1.31
Smoky River 15/15 100 32.5 6.9 – 70.0 0.48 0.07 – 1.23
Spirit River 0/10 0 0 n/a 0 n/a
St. Paul 2/2 100 5.1 4.2 – 6.0 0.05 0.04 – 0.06
Starland 7/7 100 5.1 2.1 – 11.1 0.05 0.02 – 0.11
Stettler 12/12 100 25.7 3.8 – 58.0 0.56 0.04 – 1.52
Sturgeon 18/18 100 38.9 6.0 – 90.1 1.18 0.07 – 3.67
Taber 14/14 100 35.4 1.0 – 88.0 0.56 0.01 – 3.14
Thorhild 0/2 0 0 n/a 0 n/a
Two Hills 11/11 100 40.8 11.0 – 60.0 1.04 0.16 – 1.98
Vermillion River 12/15 80 20.3 0 – 72.5 0.43 0 – 1.5
Vulcan 17/17 100 16.9 1.0 – 59.8 0.30 0.01 – 1.32
Wainwright 6/10 60 9.3 0 – 22.0 0.12 0 – 0.31
Warner 6/6 100 10.7 3.0 – 14.9 0.21 0.03 – 0.45
Westlock 10/12 83.3 22.1 0 – 49.0 0.53 0 – 1.38
Wetaskiwin 6/6 100 10.0 5.1 – 14.8 0.12 0.05 – 0.15
Wheatland 19/19 100 19.2 4.0 – 76.8 0.27 0.02 – 0.92
Willow Creek 10/11 90.9 15.3 0 – 55.0 0.25 0 – 1.14
Woodlands 1/1 100 4.9 n/a 0.05 n/a
Total or Avg. 432/480 90.0 21.2 0 – 100 0.42 0 – 3.81 1Means represent an average of all the crops surveyed. 2Disease severity was assessed using a 0-5 scale.

171
Table 3. Prevalence and incidence of lower main stem infections by S. sclerotiorum in canola fields in Alberta in 2016.
County or Municipality
Number of Fields affected
Disease Prevalence (%)
Disease Incidence (%)
Mean1 Range
Acadia 2/2 100 40.4 40.2 – 40.6
Athabasca 3/3 100 80.9 75.7 – 84.8
Barrhead 3/3 100 39.4 24.3 – 48.1
Beaver 4/4 100 27.2 7.7 – 43.4
Big Lakes 7/10 70 3.9 0 – 21.1
Birch Hills 4/9 44.4 14.2 0 – 50.4
Bonnyville 3/3 100 87.1 80.0 – 92.7
Camrose 4/4 100 59.9 41.4 – 93.5
Cardston 0/5 0 0 n/a
Clear Hills 4/4 100 12.2 9.3 – 15.4
Cypress 0/3 0 0 n/a
Fairview 7/10 70 15.5 0 – 46.6
Flagstaff 7/7 100 83.6 39.8 – 100
Foothills 5/5 100 64.8 48.0 – 81.2
Forty Mile 0/6 0 0 n/a
Grande Prairie 9/9 100 30.4 3.8 – 47.7
Greenview 4/4 100 53.9 4.4 – 94.4
Kneehill 6/6 100 13.9 4.0 – 26.9
Lac La Biche 1/1 100 83.3 n/a
Lac Ste Anne 2/2 100 44.9 8.9 – 80.9
Lacombe 7/7 100 19.1 4.8 – 77.1
Lamont 4/4 100 72.2 69.2 – 77.1
Leduc 8/8 100 23.5 4.0 – 82.6
Lethbridge 0/6 0 0 n/a
Mackenzie 6/9 66.7 8.6 0 – 28.0
Minburn 6/6 100 42.8 9.8 – 72.4
Mountain View 6/6 100 53.6 41.9 – 60.4
Newell 0/4 0 0 n/a
Northern Lights 9/9 100 11.0 5.0 – 17.7
Paintearth 6/6 100 34.5 12.6 – 66.3
Parkland 2/2 100 27.8 13.5 – 42.1
Peace 2/2 100 25.2 24.2 – 26.1
Pincher Creek 2/2 100 0.88 0.83 – 0.93
Ponoka 5/5 100 39.2 0.94 – 94.1
Provost 2/2 100 57.0 19.2 – 94.7
Red Deer 8/8 100 50.8 22.0 – 79.4
Rocky View 7/7 100 24.5 9.7 – 45.8
SA 2 2/2 100 8.9 3.0 – 14.9
Saddle Hills 0/7 0 0 n/a
Smoky Lake 2/2 100 88.5 87.0 – 89.9
Smoky River 13/15 86.7 33.9 0 – 83.3
Spirit River n.d. n.d. n.d. n.d.
St. Paul 2/2 100 97.9 95.8 – 100
Starland 7/7 100 49.4 30.3 – 60.4
Stettler 6/6 100 46.5 13.3 – 68.5
Sturgeon 8/8 100 43.6 17.0 – 86.9
Taber 5/10 50 1.8 0 – 3.9
Thorhild 2/2 100 53.4 52.0 – 54.8
Two Hills 4/4 100 58.7 49.5 – 63.6

172
Table 3 (cont’d.) Vermillion River 15/15 100 36.1 2.4 – 100
Vulcan n.d. n.d. n.d. n.d.
Wainwright 10/10 100 50.1 13.0 – 85.4
Warner 3/5 60 1.2 0 – 3.9
Westlock 4/4 100 77.8 58.8 – 87.9
Wetaskiwin 5/5 100 49.7 20.8 – 96.1
Wheatland 4/8 50 2.7 0 – 7.0
Willow Creek 4/5 80 10.9 0 – 20.6
Woodlands 0/1 0 0 n/a
Total or Avg. 252/311 81.0% 30.7% 0 - 100 1Means represent an average of all the crops surveyed. n.d. = not determined.

173
Figure 1.The location and severity of blackleg in 480 canola fields in Alberta in 2016.
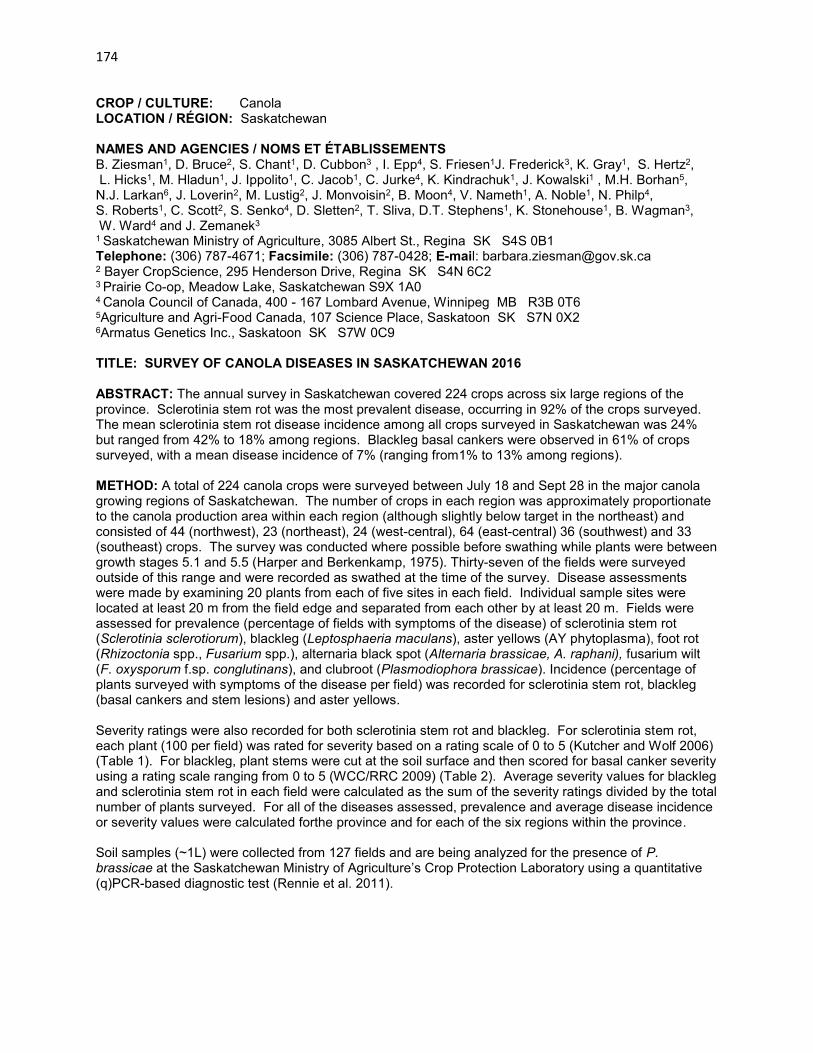
174
CROP / CULTURE: Canola LOCATION / RÉGION: Saskatchewan NAMES AND AGENCIES / NOMS ET ÉTABLISSEMENTS B. Ziesman1, D. Bruce2, S. Chant1, D. Cubbon3 , I. Epp4, S. Friesen1J. Frederick3, K. Gray1, S. Hertz2, L. Hicks1, M. Hladun1, J. Ippolito1, C. Jacob1, C. Jurke4, K. Kindrachuk1, J. Kowalski1 , M.H. Borhan5, N.J. Larkan6, J. Loverin2, M. Lustig2, J. Monvoisin2, B. Moon4, V. Nameth1, A. Noble1, N. Philp4, S. Roberts1, C. Scott2, S. Senko4, D. Sletten2, T. Sliva, D.T. Stephens1, K. Stonehouse1, B. Wagman3, W. Ward4 and J. Zemanek3 1 Saskatchewan Ministry of Agriculture, 3085 Albert St., Regina SK S4S 0B1 Telephone: (306) 787-4671; Facsimile: (306) 787-0428; E-mail: [email protected] 2 Bayer CropScience, 295 Henderson Drive, Regina SK S4N 6C2 3 Prairie Co-op, Meadow Lake, Saskatchewan S9X 1A0 4 Canola Council of Canada, 400 - 167 Lombard Avenue, Winnipeg MB R3B 0T6 5Agriculture and Agri-Food Canada, 107 Science Place, Saskatoon SK S7N 0X2 6Armatus Genetics Inc., Saskatoon SK S7W 0C9 TITLE: SURVEY OF CANOLA DISEASES IN SASKATCHEWAN 2016 ABSTRACT: The annual survey in Saskatchewan covered 224 crops across six large regions of the province. Sclerotinia stem rot was the most prevalent disease, occurring in 92% of the crops surveyed. The mean sclerotinia stem rot disease incidence among all crops surveyed in Saskatchewan was 24% but ranged from 42% to 18% among regions. Blackleg basal cankers were observed in 61% of crops surveyed, with a mean disease incidence of 7% (ranging from1% to 13% among regions). METHOD: A total of 224 canola crops were surveyed between July 18 and Sept 28 in the major canola growing regions of Saskatchewan. The number of crops in each region was approximately proportionate to the canola production area within each region (although slightly below target in the northeast) and consisted of 44 (northwest), 23 (northeast), 24 (west-central), 64 (east-central) 36 (southwest) and 33 (southeast) crops. The survey was conducted where possible before swathing while plants were between growth stages 5.1 and 5.5 (Harper and Berkenkamp, 1975). Thirty-seven of the fields were surveyed outside of this range and were recorded as swathed at the time of the survey. Disease assessments were made by examining 20 plants from each of five sites in each field. Individual sample sites were located at least 20 m from the field edge and separated from each other by at least 20 m. Fields were assessed for prevalence (percentage of fields with symptoms of the disease) of sclerotinia stem rot (Sclerotinia sclerotiorum), blackleg (Leptosphaeria maculans), aster yellows (AY phytoplasma), foot rot (Rhizoctonia spp., Fusarium spp.), alternaria black spot (Alternaria brassicae, A. raphani), fusarium wilt (F. oxysporum f.sp. conglutinans), and clubroot (Plasmodiophora brassicae). Incidence (percentage of plants surveyed with symptoms of the disease per field) was recorded for sclerotinia stem rot, blackleg (basal cankers and stem lesions) and aster yellows. Severity ratings were also recorded for both sclerotinia stem rot and blackleg. For sclerotinia stem rot, each plant (100 per field) was rated for severity based on a rating scale of 0 to 5 (Kutcher and Wolf 2006) (Table 1). For blackleg, plant stems were cut at the soil surface and then scored for basal canker severity using a rating scale ranging from 0 to 5 (WCC/RRC 2009) (Table 2). Average severity values for blackleg and sclerotinia stem rot in each field were calculated as the sum of the severity ratings divided by the total number of plants surveyed. For all of the diseases assessed, prevalence and average disease incidence or severity values were calculated forthe province and for each of the six regions within the province. Soil samples (~1L) were collected from 127 fields and are being analyzed for the presence of P. brassicae at the Saskatchewan Ministry of Agriculture’s Crop Protection Laboratory using a quantitative (q)PCR-based diagnostic test (Rennie et al. 2011).

175
RESULTS AND COMMENTS: Approximately 4.4 million ha (10.9 million acres) of canola were seeded in Saskatchewan in 2016 (Statistics Canada 2016). Wet conditions were conducive for disease development throughout most of Saskatchewan in 2016. Late season rains and snow in early October created harvest delays in some parts of the province. Eighty percent of the canola crops were combined by October 24, 2016 compared to 97% by October 19, 2015 (Government of Saskatchewan 2015, 2016). Sclerotinia stem rot was observed in 92% of the canola crops surveyed. The average incidence in the province was 24% (26% in infested crops) (Table 3). The incidence was highest in the West-central region (43%) and lowest in the East-central region (18%). The average severity of sclerotinia stem rot in canola crops in Saskatchewan was 0.7. The severity of sclerotinia stem rot was highest in the West-central region (1.4) and lowest in the Southeast and Southwest regions (<0.6) (Table 3). Symptoms of blackleg basal infection (rated after cutting of lower stems) were present in 61 % of the Saskatchewan canola crops included in the survey (Table 4). The average incidence in the province was 7 % (12 % in infested crops). The average incidence was highest in the Northwest region (90%) and lowest in the Southwest region (44%). The average severity of blackleg basal cankers in the province was 0.1. The average severity was highest in the West-central region (0.2) and lowest in the Southwest region (0.01). Blackleg stem lesions were present in 25% of canola crops with an average incidence of 2% (data not shown). The highest average blackleg stem lesion incidence occurred in the Southeast and West-central regions (33%). The lowest incidence was in the Southwest region (11%). Stem samples that were symptomatic of internal blackleg infection and collected from 45 crops across the province were assessed via culturing for fungal isolation and identification. Only 17 of the samples (38%) produced Leptosphaeria maculans, the causal agent of blackleg disease. Alternaria- and Fusarium-like species were each cultured from 42% of the samples, with 31% of samples producing mixtures of fungal species. Aster yellows had a prevalence of 24% with an average incidence of 1% (5% in infected fields). This is higher than in 2015 where the average incidence in Saskatchewan was 8% (3% in infected fields). The highest prevalence of aster yellows in 2016 was in the Northwest region (66%) with an average incidence of 6%. Province-wide, aster yellows was observed in 72% of surveyed canola fields (includes surveyed fields where infected plants were seen outside of the 100 plant sample) (Table 5). Foot rot was recorded in 10% of canola crops in the province. The highest incidence was in the Northeast region (21%). Foot rot was not detected in the Southwest region of Saskatchewan (Table 5). In 2016, alternaria pod spot was recorded as present in 88% of canola crops surveyed in the province. Alternaria pod spot prevalence was highest in the Northwest (100%) and lowest in the Southwest region (77%) (Table 5). A total of 127 soil samples were collected for the Saskatchewan clubroot survey and submitted to the Saskatchewan Crop Protection Laboratory for analysis by qPCR testing. Clubroot or the causal agent (P. brassicae) was not detected or quantifiable in any of the samples. REFERENCES: Dokken-Bouchard, F.L., Baugh, F., Blackmore, B., Campbell, E., Chant, S., Cowell, L.E., Cubbon, D., Friesen, S., Gilrolyd, J., Gray, K., Haddow, C., Hertz, S., Hicks, L., Holba, K., Ippolito, J., Jacob, C., Jurke, C., Kindrachuk, K., Kirkham, C.L., Kowalski, J., Borhan, M.H., Larkan, N.J., Leppa, M., Loverin, J., Lustig, M., Pettit, M., Peru, J., Philp, N., Platford, R.G., Roberts, S., Scott, C., Senko, S., Stephens, D.T., Stonehouse, K., Voth, B., Wagman, B., Ward, W., Wuchner, A., and Ziesman, B. 2016. Survey of canola diseases in Saskatchewan, 2015. Can. Plant Dis. Surv. 96: 169-174. (www.phytopath.ca/cpds.shtml)
Government of Saskatchewan. 2016. Ministry of Agriculture. Crop Report No. 27, October 27, 2016.
Government of Saskatchewan. 2015. Ministry of Agriculture. Crop Report No. 26, October 22, 2015.
Harper, F.R. and Berkenkamp, B. 1975. Revised growth-stage key for Brassica campestris and B. napus. Can. J. Plant Sci. 55:657–658.
Kutcher, H.R. and Wolf, T.M. 2006. Low-drift fungicide application technology for sclerotinia stem rot control in canola. Crop Prot. 25:640–646.

176
Rennie, D.C., Manolii, V.P., Cao, T. Hwang, S.F., Howard, R.J. and Strelkov, S.E. 2011. Direct evidence of surface infestation of seeds and tubers by Plasmodiophora brassicae and quantification of spore loads. Plant Pathology 60: 811-819
Statistics Canada. 2016. Table 001-0010 - Estimated areas, yield, production and average farm price of principal field crops, in metric units, annual CANSIM (database). (Accessed: November 2, 2016)
Western Canada Canola/Rapeseed Recommending Committee (WCC/RRC) Incorporated. 2009. Procedures of the Western Canada Canola/Rapeseed Recommending Committee for the evaluation and recommendation for registration of canola/rapeseed candidate cultivars in western Canada. Table 1. Sclerotinia rating scale (Kutcher and Wolf 2006).
Disease Rating
Lesion Location Symptoms
0 None No symptoms
1 Pod Infection of pods only
2
Upper plant parts
Lesion situated on main stem or branch(es) with potential to affect up to ¼ of seed formation and filling on plant
3 Lesion situated on main stem or on a number of branches with potential to affect up to ½ of seed formation and filling on plant
4 Lesion situated on main stem or on a number of branches with potential to affect up to ¾ of seed formation and filling on plant
5 Lower plant part
Main stem lesion with potential effects on seed formation and filling of entire plant

177
Table 2. Blackleg rating scale (WCC/RRC 2009).
Rating Description
0 No disease visible in the cross section
1 Diseased tissue occupies up to 25% of cross-section
2 Diseased tissue occupies 26 to 50% of cross-section
3 Diseased tissue occupies 51 to 75% of cross-section
4 Diseased tissue occupies more than 75% of cross-section with little or no constriction of affected tissues
5 Diseased tissue occupies 100% of cross-section with significant constriction of affected tissues; tissue dry and brittle; plant dead
Table 3. Mean disease incidence and severity of sclerotinia stem rot of canola in Saskatchewan in 2016.
REGION (NO. OF FIELDS)
Sclerotinia Stem Rot All Fields Surveyed
Sclerotinia Stem Rot Infected Fields Only
Incidence Severity1 Incidence Severity2
Northwest (44)
30 0.75 (2.1)
32 0.77 (2.1)
Northeast (23)
20 0.72 (3.4)
22 0.79 (3.4)
West-central (24)
43 1.40 (3.3)
42 1.40 (3.3)
East-central (64)
18 0.60 (3.2)
20 0.66 (3.5)
Southwest (36)
20 0.55 (2.8)
22 0.58 (3.0)
Southeast (33)
19 0.46 (2.3)
23 0.58 (2.9)
Overall mean (224) 24 0.7 (2.8)
26 0.75 (3.0)
1Severity as divided by the number of plants surveyed per field. 2Severity as divided by the number of infected plants per field.

178
Table 4. Mean disease incidence and severity of blackleg basal cankers in Saskatchewan in 2016.
REGION1 (NO. OF FIELDS)
Blackleg Basal Cankers
All Fields Surveyed
Blackleg Basal Cankers
Infected Fields Only
Prevalence Incidence Severity1 Incidence Severity2
Northwest (44)
90 12 0.18 (1.2) 13 0.20 (1.4)
Northeast (23)
52 7 0.1 (0.64) 14 0.20 (1.2)
West-central (24)
71 13 0.20 (0.91) 19 0.28 (1.3)
East-central (64)
58 6 0.11 (1.0) 10 0.20 (1.7)
Southwest (36)
44 1 0.01 (0.54) 3 0.03 (1.2)
Southeast (33)
45 5 0.06 (0.58) 12 0.14 (1.3)
Overall mean (224) 61 7 0.11 (0.85) 12 0.18 (1.4)
1Severity as divided by the number of plants surveyed per field. 2Severity as divided by the number of infected plants per field. Table 5. Prevalence of alternaria pod spot, aster yellows, and foot rot of canola fields surveyed in Saskatchewan in 2016.
REGION (NO. OF FIELDS)
Alternaria Pod Spot
Aster Yellows1
Aster Yellows Field Total2 Foot Rot
Northwest (44)
100 66 66 5
Northeast (23)
96 26 74 17
West-central (24)
83 9 61 21
East-central (64)
87 17 89 12
Southwest (36)
78 0 41 0
Southeast (33)
82 12 77 12
Overall mean (224) 88 24 74 10
1Prevalence of aster yellows when identified within 100 plant sample. 2Prevalence of aster yellows including fields where aster yellows was indicated outside of the 100 plant sample.
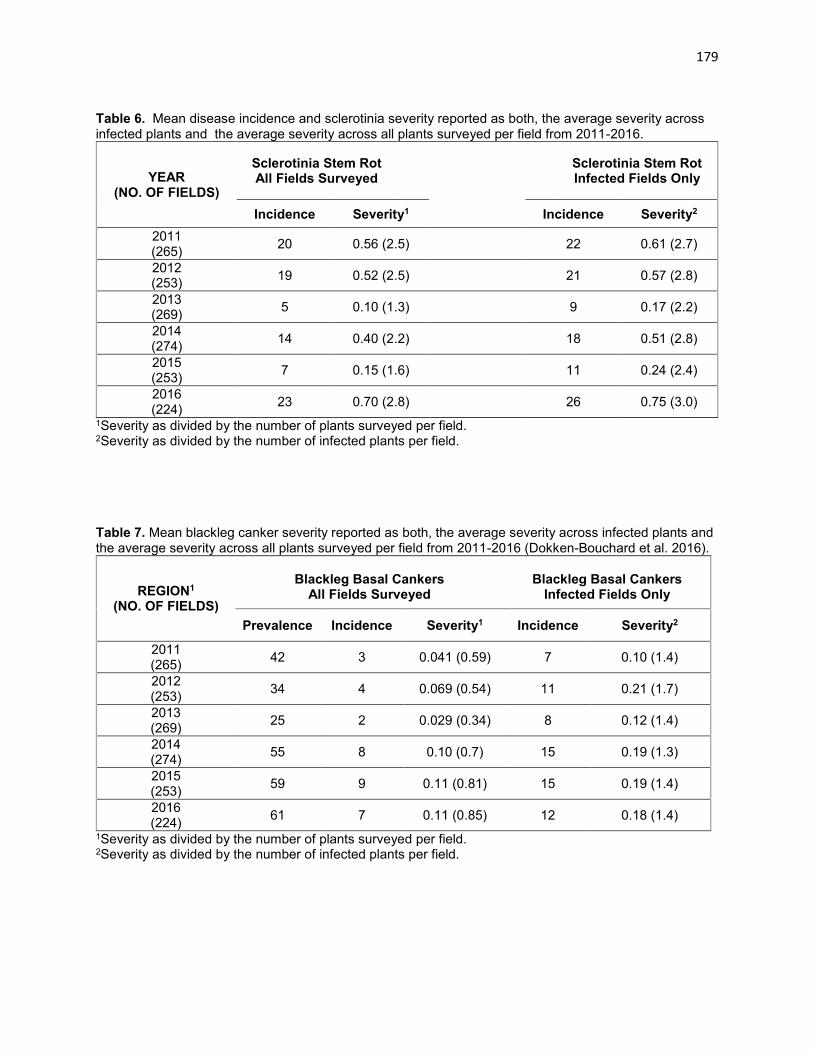
179
Table 6. Mean disease incidence and sclerotinia severity reported as both, the average severity across infected plants and the average severity across all plants surveyed per field from 2011-2016.
YEAR (NO. OF FIELDS)
Sclerotinia Stem Rot All Fields Surveyed
Sclerotinia Stem Rot Infected Fields Only
Incidence Severity1 Incidence Severity2
2011 (265)
20 0.56 (2.5)
22 0.61 (2.7)
2012 (253)
19 0.52 (2.5)
21 0.57 (2.8)
2013 (269)
5 0.10 (1.3)
9 0.17 (2.2)
2014 (274)
14 0.40 (2.2)
18 0.51 (2.8)
2015 (253)
7 0.15 (1.6)
11 0.24 (2.4)
2016 (224)
23 0.70 (2.8)
26 0.75 (3.0)
1Severity as divided by the number of plants surveyed per field. 2Severity as divided by the number of infected plants per field. Table 7. Mean blackleg canker severity reported as both, the average severity across infected plants and the average severity across all plants surveyed per field from 2011-2016 (Dokken-Bouchard et al. 2016).
REGION1 (NO. OF FIELDS)
Blackleg Basal Cankers
All Fields Surveyed
Blackleg Basal Cankers
Infected Fields Only
Prevalence Incidence Severity1 Incidence Severity2
2011 (265)
42 3 0.041 (0.59) 7 0.10 (1.4)
2012 (253)
34 4 0.069 (0.54) 11 0.21 (1.7)
2013 (269)
25 2 0.029 (0.34) 8 0.12 (1.4)
2014 (274)
55 8 0.10 (0.7) 15 0.19 (1.3)
2015 (253)
59 9 0.11 (0.81) 15 0.19 (1.4)
2016 (224)
61 7 0.11 (0.85) 12 0.18 (1.4)
1Severity as divided by the number of plants surveyed per field. 2Severity as divided by the number of infected plants per field.

180
CROP / CULTURE: Canola LOCATION/ RÉGION: Manitoba NAMES AND AGENCIES / NOMS ET ÉTABLISSEMENTS D.L. McLaren1, A. Kubinec2, J. Graham3, E. Bargen4, A. Brackenreed5, D. Brar6, T. Buss7, D. Chomokovski7, A. Farooq8, T.M. Henderson1, L. Kaskiw9, I. Kristjanson10, D. Lange11, M. McCracken12, J. Cornelsen5, R. Picard13, M. Pradhan14 and M.Valentino15 1Agriculture and Agri-Food Canada Research and Development Centre, 2701 Grand Valley Rd., Brandon MB R7A 5Y3 Telephone: (204) 578-6561; Facsimile: (204) 578-6524; E-mail: [email protected] 2Manitoba Agriculture, Carman MB R0G 0J0 381 Ellesmere Ave, Winnipeg MB R2M 0G5 4Manitoba Agriculture, Steinbach MB R5G 0R5 5Canola Council of Canada, 400 – 167 Lombard Avenue, Winnipeg MB R3B 0T6
6Manitoba Agriculture, Teulon MB R0C 3B0
7Manitoba Agriculture, Beausejour MB R0E 0C0 8Manitoba Agriculture, Hamiota MB R0M 0T0 9Manitoba Agriculture, Souris MB R0K 2C0
10Manitoba Agriculture, Morris MB R0G 1K0
11Manitoba Agriculture, Altona, MB R0G 0B0
12Manitoba Agriculture, The Pas MB R9A 1M4
13Manitoba Agriculture, Somerse , MB R0G 2L0 14Manitoba Agriculture Crop Diagnostic Centre, 201-545 University Crescent, Winnipeg MB R3T 5S6 15Manitoba Agriculture, Roblin MB R0L 1P0
TITLE / TITRE: SURVEY OF CANOLA DISEASES IN MANITOBA IN 2016 ABSTRACT: A total of 105 canola crops were surveyed in Manitoba for the prevalence and incidence or severity of sclerotinia stem rot, blackleg, alternaria pod spot, aster yellows, fusarium wilt, foot rot and clubroot. Blackleg and sclerotinia stem rot were the most prevalent diseases throughout the province. There were no canola plants collected from the 105 surveyed canola crops that were confirmed to have clubroot. One plant sample from the 2016 survey of 105 canola crops was confirmed to have verticillium wilt. METHODS: A total of 105 canola crops were surveyed in the southwest (48), northwest (31), eastern/interlake (14) and central (12) regions of Manitoba from July 29 to August 30. All crops were Brassica napus and the majority were surveyed before swathing while plants were between growth stages 5.1 and 5.5 (Harper and Berkenkamp, 1975). In each canola crop, 100 plants were selected in a regular pattern starting at a corner of the field or at a convenient access point. The edges of the fields were avoided. Twenty plants were removed from each of five points of a “W” pattern in the field. Points of the “W” were at least 20 paces apart. All plants were pulled up, removed from the field and examined for the presence of diseases. For soil collection, samples were obtained from each of the five points of the “W”, or if the field entrance was identifiable, they were collected at 5 points near the entrance. Canola crops were assessed for the prevalence (percent crops infested) and incidence (percent plants infected per crop) of sclerotinia stem rot (Sclerotinia sclerotiorum), aster yellows (AY phytoplasma), foot rot (Fusarium spp. and Rhizoctonia spp.), blackleg (Leptosphaeria maculans), fusarium wilt (F. oxysporum f. sp. conglutinans) and clubroot (Plasmodiophora brassicae). For sclerotinia stem rot, each plant was also scored based on the possible impact of infection on yield using a disease severity scale of 0 (no symptoms) to 5 (main stem lesion with potential effects on seed formation and filling of entire plant) (Kutcher and Wolf, 2006). Blackleg lesions that occurred on the upper portions of the stem were assessed separately from basal stem cankers. Stem lesions were recorded as present or absent. Basal stem cankers were scored using a disease severity scale of 0 to 5 based on area of diseased tissue in the stem cross-section where 0 = no diseased tissue visible in the cross section and 5 = diseased tissue occupying 100% of the cross section and plant dead (WCC/RRC, 2009). If present, clubroot symptoms were rated using a scale of 0 to 3 where 0 = no galling and 3 = severe galling (Kuginuki et al. 1999).The

181
prevalence and percent severity (Conn et al. 1990) of alternaria pod spot (Alternaria spp.) were also determined. When diseases were observed in the crop, but not in the sample of 100 plants, they were recorded as “trace” for incidence and counted as 0.1%. Mean disease incidence or severity values were calculated for each region. In addition to the visual assessment of diseases, soil samples were collected from 50 of the surveyed canola fields in Manitoba for DNA analysis (Cao et al., 2007) to test for the presence of the clubroot pathogen. RESULTS: A number of diseases were present in each of the four regions of Manitoba. However, no clubroot symptoms were observed in the 105 Manitoba canola crops surveyed in 2016. Information on the recent monitoring and occurrence of clubroot in Manitoba in 2011, 2012 and 2013 is provided by Derksen et al. (2013) and Kubinec et al. (2014). Sclerotinia stem rot and blackleg were the most prevalent diseases throughout the province in 2016 (Tables 1, 2 and 3). The prevalence of sclerotinia-infested crops ranged from a high of 100% in the central and eastern/interlake regions to 87% in the northwest region with a provincial mean of 93%. Mean disease incidence averaged across all crops was 14.4% and ranged from 20.3% in the central region to 10.9% in the southwest region. For infested crops only, mean disease incidence was 15.5%. Throughout the province, mean severity of sclerotinia stem rot was 3.0 and ranged from 3.6 in the southwest and central regions to 2.2 in the eastern/interlake region. Aster yellows was observed in 17% of canola crops in Manitoba with a mean disease incidence of 1.8% in these crops (Table 2). The prevalence of this disease was substantially less than in 2012, when aster yellows was observed in 95% of canola crops with a mean disease incidence of 9.9%. Contributing factors to the record high level of aster yellows in all regions of Manitoba in 2012 included drought in the midwestern United States, the early arrival of aster leafhoppers from the southern U.S. and the higher than normal percentage of infected individuals in the leafhopper population. In 2013, 2014, 2015 and 2016, aster leafhopper numbers were considerably lower than in 2012 (Canola Council of Canada 2013; Gavloski 2014, 2015, 2016) reducing the risk of this disease. Blackleg basal cankers occurred in 82% of the crops surveyed in 2016 (Table 1), with prevalence ranging from 92% in the central region to 54% in the eastern/interlake region. The mean incidence of basal cankers averaged across all crops was 12.3%, while the incidence in infested crops was 15.1%. In 2015, basal cankers were found in 80% of crops surveyed with a mean disease incidence of 18% in infested crops. The severity of blackleg basal cankers was similar in both years, with mean ratings of 2 or less. A value of 2 indicates that 26-50% of the basal stem cross-section was diseased. The mean prevalence of blackleg stem lesions in 2016 was 71%. In previous years, 64%, 68%, 63%, 71% and 65% of crops had stem lesions in 2011, 2012, 2013, 2014 and 2015, respectively (McLaren et al. 2014; 2015; 2016). The mean incidence of blackleg stem lesions was 13.4% in infested crops and 9.5% in all crops. The mean prevalence of alternaria pod spot in 2016 was 29% and 32% for crops surveyed in the eastern/interlake and northwest regions, respectively (Table 2). The severity of alternaria pod spot was low with means < 2% in these regions. No pod spot was recorded in the central and southwest regions. Fusarium wilt was observed in 10% of canola crops surveyed in Manitoba, with a mean incidence of 5% in diseased fields and an average severity of 4.7 (Table 1). Foot rot occurred in 2% of canola crops surveyed with a provincial mean incidence of <1%. Foot rot was observed in the northwest region only. White rust (Albugo candida) has not been confirmed in any crop of B. napus since 2011 (McLaren et al. 2012). One plant sample from the 2016 survey of 105 canola crops was confirmed to have verticillium wilt. In addition, wilt caused by Verticillium spp. was identified in four different canola fields from plant samples (one per field) submitted to the Manitoba Crop Diagnostic Centre.

182
REFERENCES: Canola Council of Canada. 2013. Aster yellows: No evidence of a problem in 2013. Canola Watch, Issue 13, June 19, 2013.
Cao, T., Tewari, J. and Strelkov, S.E. 2007. Molecular detection of Plasmodiophora brassicae, causal agent of clubroot of crucifers in plant and soil. Plant Dis. 91: 80-87.
Conn, K.L., Tewari, J.P., and Awasthi, R.P. 1990. A disease assessment key for Alternaria blackspot in rapeseed and mustard. Can. Plant Dis. Surv. 70:19–22. (www.phytopath.ca/cpds.shtml)
Derksen, H., Kubinec, A.M. and McLaren, D.L. 2013. Detection of Plasmodiophora brassicae in Manitoba, 2011. Can. Plant Dis. Surv. 93: 159. (www.phytopath.ca/cpds.shtml)
Gavloski, J. 2014. Summary of insects on crops in Manitoba in 2014. Manitoba Agriculture, Food and Rural Development. November 2014. (www.gov.mb.ca/agriculture/crops/insects/pubs/2014-summary.pdf)
Gavloski, J. 2015. Summary of insects on crops in Manitoba in 2015. Manitoba Agriculture, Food and Rural Development. November 2015. (www.gov.mb.ca/agriculture/crops/insects/pubs/2015-summary.pdf)
Gavloski, J. 2016. Summary of insects on crops in Manitoba in 2016. Manitoba Agriculture. November 2016. (www.gov.mb.ca/agriculture/crops/insects/pubs/2016-summary.pdf)
Harper, F.R. and Berkenkamp, B. 1975. Revised growth-stage key for Brassica campestris and B.napus. Can. J. Plant Sci. 55:657–658.
Kubinec, A.M., Derksen, H., Desjardins, M. and McLaren, D.L. 2014. Monitoring and occurrence of clubroot in Manitoba in 2013. Can. Plant Dis. Surv. 94: 184-185. (www.phytopath.ca/cpds.shtml)
Kuginuki. Y., Hiroaki, Y. and Hirai, M. 1999. Variation in virulence of Plasmodiophora brassicae in Japan tested with clubroot-resistant cultivars of Chinese cabbage (Brassica rapa L. ssp. pekinensis). Eur. J. Plant Pathol. 105: 327-332.
Kutcher, H.R. and Wolf, T.M. 2006. Low-drift fungicide application technology for sclerotinia stem rot in canola. Crop Protection 25: 640-646.
McLaren, D.L., Platford, R.G., Kubinec, A., Kutcher, H.R., Bisht, V., Derksen, H., Kristjanson, I., Phillips, K., Henderson, T.L., Hausermann, D.J., Jack, B., Picard, R., Jersak, S., Johnson, H., Stornowski, D., Neurenberg, E., Farooq, A. and McCracken, M. 2012. Survey of canola diseases in Manitoba in 2011. Can. Plant Dis. Surv. 92: 130-132. ((www.phytopath.ca/cpds.shtml)
McLaren, D.L., Platford, R.G., Kubinec, A., Derksen, H., Bargen, E., Brackenreed, A., Brown-Livingston, Buss, T., Chomokovski, D., Farooq, A, Hausermann, D., Heshka, J., Henderson, T., Jersak, S., Kaskiw, E., Kaskiw, L., Kristjanson, I., Lange, D., McCracken, M., Nernberg, E., Picard, R. and Stoyanowski, D. 2014. Survey of canola diseases in Manitoba in 2013. Can. Plant Dis. Surv. 94: 180-183. (www.phytopath.ca/cpds.shtml)
McLaren, D.L., Platford, R.G., Kubinec, A., Derksen, H., Bisht, V., Bargen, E., Brackenreed, A., Buss, T., Chomokovski, D., Farooq, A, Hausermann, D., Henderson, T., Jersak, S., Kaskiw, E., Kaskiw, L., Kristjanson, I., Lange, D., McCracken, M. and Picard, R. 2015. Survey of canola diseases in Manitoba in 2014. Can. Plant Dis. Surv. 95: 164-167. (www.phytopath.ca/cpds.shtml)
McLaren, D.L., Platford, R.G., Kubinec, A., Lindquist, N., Davies, H., Bisht, V., Bajracharya, P., Bargen, E., Brar, D., Brackenreed, A., Buss, T., Chomokovski, D., Farooq, A, Hari, N., Hausermann, D., Henderson, T., Jersak, S., Kaskiw, E., Kaskiw, L., Kristjanson, I., Lange, D., McCracken, M., McLennan, L., Mitchell, L., Picard, R. and Pradhan, M. 2016. Survey of canola diseases in Manitoba in 2015. Can. Plant Dis. Surv. 96: 175-179. (www.phytopath.ca/cpds.shtml)
Western Canada Canola/Rapeseed Recommending Committee. 2009. Procedures for evaluation and recommendation for registration of canola/rapeseed candidate cultivars in western Canada. Appendix B. Disease Testing Protocols. p. 11.
ACKNOWLEDGEMENTS: We thank the Manitoba Canola Producers for their continued support of this survey work and both the Manitoba Canola Growers Association and the Canola Council of Canada for their financial assistance.

183
Table 1. Mean prevalence, incidence and severity of sclerotinia stem rot and blackleg in Manitoba in 2016.
1 Prevalence (P). 2Disease incidence (DI) or severity (Sev.) across all surveyed crops. 3Disease incidence or severity in infested crops.
Crop Region Sclerotinia stem rotSclerotinia stem rot
Blackleg basal cankersBlackleg basal
cankers
Blackleg stem lesions
(No. of crops) P1 Inc.2 Inc3 Sev.2 Sev.3 P1 DI2 DI3 Sev.2 Sev.3 P1 DI2 DI3
Central 100 20.3 20.3 3.6 3.6 92 17.9 19.6 1.5 1.8 58 9.5 16.3
(12)
East./Inter. 100 17.8 17.8 2.2 2.2 54 10.5 19.6 0.7 1.3 38 5.8 15.0
(14)
Northwest 87 16.2 18.6 2.3 2.6 81 18.1
22.5 1.1 1.4 61 3.6 5.8
(31)
Southwest 94 10.9 11.6 3.6 3.8 88 7.6 8.7 1.3 1.5 89 14.4 16.1
(48)
All regions 93 14.4 15.5
3.0 3.3 82 12.3 15.1 1.2 1.5 71 9.5 13.4
(105)

184
Table 2. Mean prevalence and incidence or severity of alternaria pod spot, aster yellows, fusarium wilt and foot rot in Manitoba in 2016.
1 Prevalence (P). 2Disease incidence (DI) and severity (Sev.) across all surveyed crops. 3Disease incidence and severity in infested crops. Table 3. Distribution of incidence (sclerotinia, blackleg, aster yellows, fusarium wilt and foot rot) and severity (alternaria pod spot) classes in 105 crops of Brassica napus in Manitoba in 2016.
Percentage of crops with
Incidence range
Sclerotinia stem rot
Blackleg basal
cankers
Blackleg stem lesions
Aster yellows
Fusarium wilt
Foot rot Alternaria pod spot
0% 7 19 30 83 91 98 86
1-5% 27 32 30 17 6 1 14
6-10% 19 13 14 0 2 1 0
11-20% 26 17 13 0 1 0 0
21-50% 19 15 10 0 0 0 0
>50% 2 4 3 0 0 0 0
Crop Region Alternaria pod spot
Aster yellows Fusarium wilt Foot rot
(No. of crops) P1 Sev.3 P1 Inc.2 Inc.3 P1 Inc.2 Inc.3 Sev.2
Sev.3 P1 Inc.2 Inc.3
Central 0 0 0 0 0 8 0.8 1.0 0.2 2.0 0 0 0
(12)
East./Inter. 29 1.0 21 0.3 1.3 21 8.0 37.3 0.5 5.7 0 0 0
(14)
Northwest 32 1.0 35 0.7 2.0 13 0.4 3.3 0.5 5.3 7 0.3 4.5
(31)
Southwest 0 0 8 0.1 1.5 6 0.5 8.0 0.3 4.5 0 0 0
(48)
All regions 47 1.1 17 0.3 1.8 10 1.4 13.6 0.4 4.7 2 0.1 4.5
(105)

185
CROP / CULTURE: Field Bean (Phaseolus vulgaris L.) LOCATION / RÉGION: Southern Alberta NAMES AND AGENCY / NOMS ET ÉTABLISSEMENT: M.W. Harding, G.C. Daniels, D.A. Burke, C.A. Pugh and J.M. Nielson
Telephone: (403) 362-1338; Facsimile: (403) 362-1326; E-mail: [email protected] Alberta Agriculture and Forestry, Crop Diversification Centre South, Brooks AB T1R 1E6 TITLE / TITRE: WHITE MOULD ON DRY BEAN IN ALBERTA IN 2016 ABSTRACT: Dry bean production in southern Alberta averages approximately 49,230 tonnes on 19,405 hectares (Government of Alberta, 2016). The main disease affecting production is white mould caused by Sclerotinia sclerotiorum (Lib.) de Bary. A survey for white mould in 26 commercial dry bean (Phaseolus vulgaris L.) fields in southern Alberta was conducted in 2016. White mould symptoms were observed in all fields surveyed. Disease prevalence, incidence and severity were the highest reported for at least the past seven years. INTRODUCTION AND METHODS: Dry bean is a high value pulse crop for many irrigated farms in southern Alberta. White mould caused by S. sclerotiorum is a commonly occurring disease and, in some years, is the greatest production constraint for bean producers. Cultivars with upright architecture and small, quantitative, genetic tolerance can avoid disease to some extent, but no strong, genetic resistance to white mould is known (Balasubramanian et al., 2013). As a result, the disease is managed mainly using fungicides and cultural practices. Since 2011, white mould incidences and severities have typically ranged from 18% to 29%, and 0.1 to 0.75, respectively (Harding et al., 2016; M.W. Harding unpublished) with the exception of 2014 when white mould incidence average in mid-August was 4.1% and severity was 0.11 (Chatterton et al., 2015). A survey was conducted in mid-August, 2016 to evaluate white mould prevalence, incidence and severity on dry bean in southern Alberta. Twenty-six irrigated, commercial dry bean fields in southern Alberta were surveyed on August 8-9, 2015 for white mould (S. sclerotiorum). Each field was evaluated for white mould in 2 m of two adjacent rows at three locations.The incidence of disease was calculated as a percent of infected plants with white mould symptoms, and the disease severity was estimated using a rating scale of 1 to 4 where a score of ’1’ was given when no disease was observed, up to a score of ’4’ which was assigned when the disease had killed the host plant (Table 1; Balasubramanian et al., 2013). RESULTS AND COMMENTS: White mould disease was found in all 26 fields for a prevalence of 100%. The disease incidence ranged from 14.3% to 75% with an overall average incidence of 60.8% and severity ranged from 1.0 to 2.2 with overall average severity of 1.2 (Table 2 and Figure 1). White mould prevalence, incidence and severity on dry bean were higher than any year on record since at least 2010. Coincidentally, precipitation in July was much higher relative to long-term normal values, especially in areas where white mould incidence was ≥ 75% (Figure 2). The very wet conditions in July may have contributed to the higher than average levels of white mould in dry bean in Alberta in 2016. REFERENCES: Government of Alberta. 2016. Alberta Special Crops – Area, Yield, Production and Price, 2005-2014. (https://open.alberta.ca/opendata/alberta-special-crops-area-yield-production-and-price-2005-2014)
Balasubramanian, P.M., Conner, R.L., McLaren, D.L., Chatterton S. and Hou, A. 2013. Partial resistance to white mould in dry bean. Can. J. Plant Sci. 94:683-691.
Harding, M.W., Burke, D.A., Pugh, C.A. and Daniels, G.C. White mould in dry bean in 2015. Can. Plant Dis. Surv. 96:156-157.
Chatterton, S., Erickson, S., Burke, D.A., Pugh, C.A., and Harding, M.W. 2015. Dry bean diseases in Alberta in 2014. Can. Plant Dis. Surv. 95:149-150.
ACKNOWLEDGEMENTS This survey was supported by Alberta Agriculture and Forestry. Thanks to Viterra’s Alberta Bean Division for assistance, and to the producers for allowing access to their fields.

186
Table 1. A rating scale to estimate severity of white mould on dry edible bean.1
Rating Symptoms
1 healthy;
2 single stem infected;
3 multiple stems infected;
4 lower part of main stem infected or dead plant.
1Balasubramanian et al., 2013 Table 2. White mould prevalence, incidence and severity in dry bean fields in southern Alberta in 2016.
No. crops Disease Disease Incidence (%) Disease Severity2
affected Prevalence (%) Mean1 Range Mean1 Range
26/26 100 60.8 14.3 – 75.0 1.2 1.0 – 2.2
1Means represent an average of all the crops surveyed. 2Disease severity was assessed using a 1-4 scale.
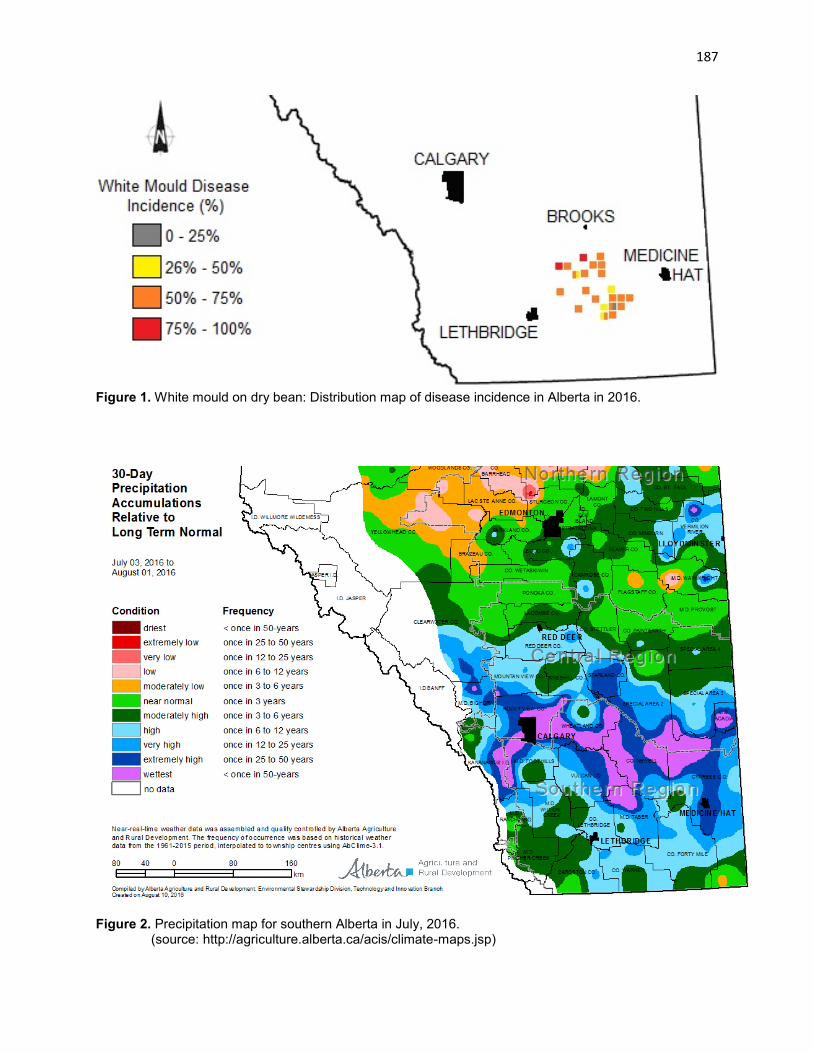
187
Figure 1. White mould on dry bean: Distribution map of disease incidence in Alberta in 2016.
Figure 2. Precipitation map for southern Alberta in July, 2016. (source: http://agriculture.alberta.ca/acis/climate-maps.jsp)

188
CROP / CULTURE: Field bean LOCATION / RÉGION: Manitoba NAMES AND AGENCY / NAMES AND AGENCIES / NOMS ET ÉTABLISSEMENTS: Y.M. Kim1, D.L. McLaren, R.L. Conner2, W.C. Penner2 and T.J. Kerley1
1Agriculture and Agri-Food Canada Research and Development Centre, 2701 Grand Valley Rd., Brandon MB R7A 5Y3 Telephone (204) 578-6691; Facsimile (204) 578-6524; E-mail: [email protected] 2Agriculture and Agri-Food Canada Research and Development Centre, Unit 101, Route 100, Morden MB R6M 1Y5 TITLE: DISEASES OF FIELD BEAN IN MANITOBA IN 2016 ABSTRACT: A total of 40 bean crops were surveyed for root and foliar diseases, respectively. Fusarium root rot was the most prevalent root disease and common bacterial blight the most widespread foliar disease throughout the province. Diseases of less importance included rhizoctonia root rot, white mould and halo blight. In 2016, anthracnose and rust were not observed in any of the 40 surveyed bean crops. METHODS: Crops of field bean in Manitoba were surveyed for root and foliar diseases at 40 different locations. The survey for root diseases was conducted in mid- to late July when most plants were at the early to mid-flowering stage. During the root disease survey the severity of halo blight (Pseudomonas syringae pv. phaseolicola) was also assessed. When the plants were starting to mature, the foliar survey was carried out on August 18, 19, 22 and 25 on the same fields assessed for root rot. The crops surveyed were selected at random from regions in southern Manitoba where most of the field bean crops are grown. For the root diseases, at least 10 plants were sampled at each of three random sites in each crop surveyed. Root diseases were rated on a scale of 0 (no disease) to 9 (death of plant). Fifteen symptomatic roots were collected from each of the 40 crops for fungal isolation and identification. Identification of Fusarium species involved visual assessment, microscopic examination and morphological characterization using the criteria of Leslie and Summerell (2006). Fifteen roots from each of the 40 crops surveyed were frozen for future PCR analysis of root rot pathogens. Foliar diseases were identified by symptoms. Levels of common bacterial blight (CBB) (Xanthomonas axonopodis pv. phaseoli) were estimated based on the percent incidence of leaf infection and a severity scale of 0 (no disease) to 5 (50-100% of the leaf area covered by lesions). Anthracnose (Colletotrichum lindemuthianum), rust (Uromyces appendiculatus), white mould (Sclerotinia sclerotiorum) and halo blight (Pseudomonas syringae pv. phaseolicola) severity were assessed as percentages of infected plant tissue. RESULTS AND COMMENTS: The 2016 growing season was challenging for many producers throughout Manitoba. The major challenge was precipitation with localized hail storms that caused damage earlier in the season in a number of areas (Manitoba Agriculture, 2016; Manitoba Pulse and Soybean Growers, 2016a). In mid-season, high rainfall amounts drowned out some fields resulting in significant yield losses (Manitoba Agriculture, 2016). Later in the season, excess moisture created less than ideal conditions for harvest (Manitoba Pulse and Soybean Growers, 2016b). Two root diseases were identified (Table 1). Fusarium root rot was observed in all 40 field bean crops surveyed, with severity ratings ranging from 3.5 to 7.0, and a mean of 5.5. It has remained the most prevalent root disease of dry bean for several years (Conner et al. 2011; Henriquez et al. 2013; McLaren et al. 2016). A number of Fusarium spp. including F. redolens, F. oxysporum, F. acuminatum and F. solani were isolated from symptomatic root tissue. Rhizoctonia root rot (Rhizoctonia solani) was detected in 1 of the 40 crops sampled with a severity rating of 5.6. Pythium root rot was not detected in any of the crops surveyed. Thirty-seven crops (93%) had average root rot severity ratings above 4 (i.e., symptoms were present on 50% of the root system and plants were stunted) and this would have had a detrimental effect on yield. In the last five years, this represents the highest percentage of bean crops surveyed with root rot severity ratings that would impact yield. Halo blight was assessed in 20 of the 40 crops surveyed and was observed in two crops with a disease severity of 1% infected plant tissue in each crop.

189
Two diseases were observed during the survey of foliar diseases (Table 2). Common bacterial blight was the most prevalent and symptoms were observed in all 40 crops. The incidence of CBB ranged from 1.7 to 40% with a mean of 17.7%, while severity ranged from 0.3 to 4.0, with a mean of 2.2. Anthracnose was not detected in 2014, 2015 and 2016, unlike many years prior to this period. Rust was not observed in any of the crops surveyed. White mould symptoms were detected in 16 crops with a percent of tissue infection that ranged from 0.3% to 40%, and an average of 7.3%. This represents an increase from 2015 in the disease severity (McLaren et al. 2016). Seasonal precipitation in many of the bean growing regions of Manitoba in 2016 was above normal, which would have contributed to the increased risk of white mould in these crops. For example, in the Morden area, 371 mm and 238 mm of precipitation were received during May to August in 2016 and 2015, respectively, compared with the 30-year average of 305 mm for this four month period (Agriculture and Agri-Food Canada, 2016; Government of Canada, 2016). REFERENCES: Agriculture and Agri-Food Canada. 2016. Real-Time Weather Network. (www.ablethr2/Weather.html).
Conner, R.L., McLaren, D.L., Penner, W.C., and Kerley, T.J. 2011. Diseases of field bean in Manitoba in 2010. Can. Plant Dis. Surv. 91:107-108. (www.phytopath.ca/cpds.shtml)
Government of Canada. 2016. Weather, climate and hazard; past weather and climate historical data. (www.climate.weather.gc.ca/climate_data/)
Henriquez, M.A., McLaren, D.L., Conner, R.L., Penner, W.C. and Kerley, T.J. 2013. Diseases of field bean in Manitoba in 2012. Can. Plant Dis. Surv. 93: 143-144. (www.phytopath.ca/cpds.shtml)
Leslie J.F. and Summerell B.A. 2006. The Fusarium Laboratory Manual. Blackwell Publishing Ltd, Iowa. 388 p.
Manitoba Agriculture. 2016. Final 2016 Crop Report. Issue 24, October 17. (www.gov.mb,.ca/agriculture/crops/seasonal-reports/crop-report-archive/2016-10-17-crop-report.html)
Manitoba Pulse and Soybean Growers. 2016a. The Bean Report: Crop Conditions. No. 3. June 16, 2016. (www.manitobapulse.ca/wp-content/uploads/2016/06/2016.06.16-Bean-Report.pdf)
Manitoba Pulse and Soybean Growers. 2016b. The Bean Report: Harvest Update. No. 8. September 15, 2016. (www.manitobapulse.ca/wp-content/uploads/2016/09/2016.09.15-Bean-Report.pdf)
McLaren, D.L., Kim, Y.M., Conner, R.L., Penner, W.C. and Kerley, T.J. 2016. Diseases of field bean in Manitoba in 2015. Can. Plant Dis. Surv. 96: 153-155.

190
Table 1. Prevalence and severity of root diseases in 40 crops and halo blight in 20 crops of field bean in Manitoba in 2016.
No. Crops Disease Severity
Disease Affected Mean1 Range
Fusarium root rot2 40 5.5 3.5-7.0
Rhizoctonia root rot2 1 5.6 5.6
Halo blight (%) 2 1% 1%
1Means are based on an average of the crops in which the diseases were observed. 2Root diseases were rated on a scale of 0 (no disease) to 9 (death of plant). Table 2. Prevalence and severity of foliar diseases in 40 crops of field bean in Manitoba in 2016.
No. Crops Disease Severity1 Incidence of Leaf Infection
Disease Affected Mean2 Range Mean2 Range
Common bacterial blight3 40 2.2 0.3-4.0 17.7% 1.7-40.0%
Anthracnose (%) 0 0 0
Rust (%) 0 0 0
White mould (%) 16 7.3 0.3-40%
1White mould severity was rated as the percentage of infected plant tissue; common bacterial blight severity was rated on a scale of 0 (no disease) to 5 (50-100% of leaf area diseased) and on the incidence of leaves with symptoms. 2Means are based on an average of the crops in which the diseases were observed.
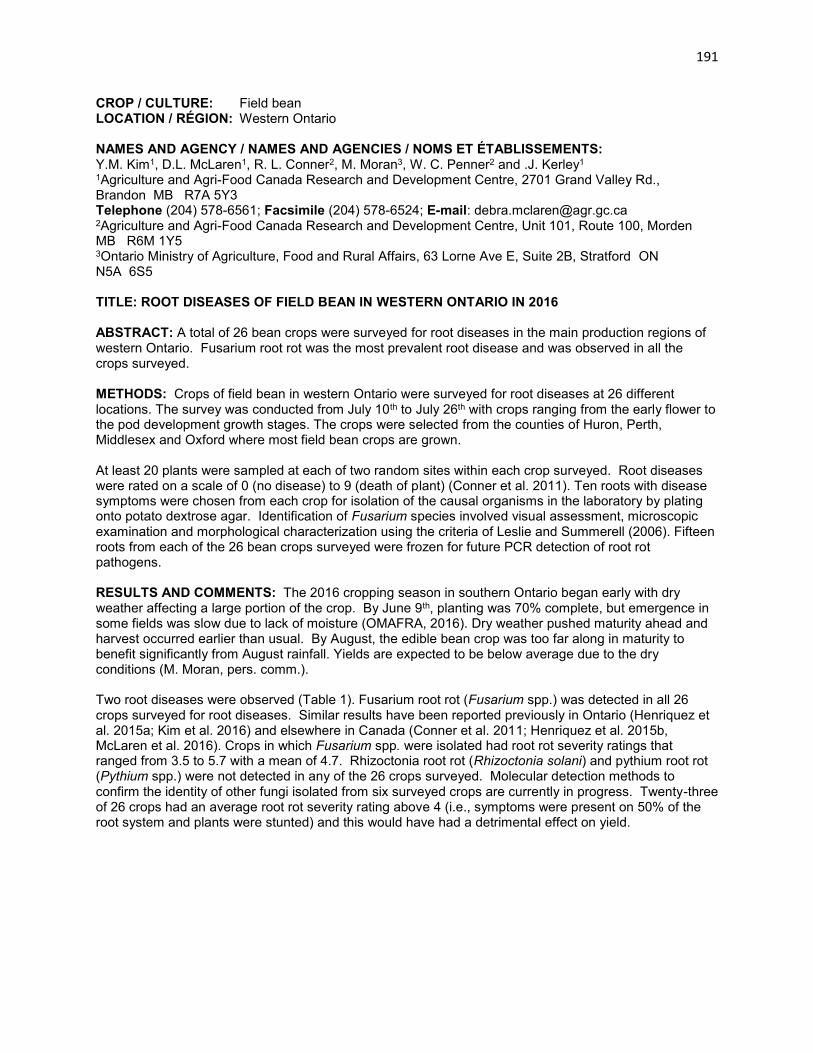
191
CROP / CULTURE: Field bean LOCATION / RÉGION: Western Ontario NAMES AND AGENCY / NAMES AND AGENCIES / NOMS ET ÉTABLISSEMENTS: Y.M. Kim1, D.L. McLaren1, R. L. Conner2, M. Moran3, W. C. Penner2 and .J. Kerley1 1Agriculture and Agri-Food Canada Research and Development Centre, 2701 Grand Valley Rd., Brandon MB R7A 5Y3 Telephone (204) 578-6561; Facsimile (204) 578-6524; E-mail: [email protected] 2Agriculture and Agri-Food Canada Research and Development Centre, Unit 101, Route 100, Morden MB R6M 1Y5 3Ontario Ministry of Agriculture, Food and Rural Affairs, 63 Lorne Ave E, Suite 2B, Stratford ON N5A 6S5 TITLE: ROOT DISEASES OF FIELD BEAN IN WESTERN ONTARIO IN 2016 ABSTRACT: A total of 26 bean crops were surveyed for root diseases in the main production regions of western Ontario. Fusarium root rot was the most prevalent root disease and was observed in all the crops surveyed. METHODS: Crops of field bean in western Ontario were surveyed for root diseases at 26 different locations. The survey was conducted from July 10th to July 26th with crops ranging from the early flower to the pod development growth stages. The crops were selected from the counties of Huron, Perth, Middlesex and Oxford where most field bean crops are grown. At least 20 plants were sampled at each of two random sites within each crop surveyed. Root diseases were rated on a scale of 0 (no disease) to 9 (death of plant) (Conner et al. 2011). Ten roots with disease symptoms were chosen from each crop for isolation of the causal organisms in the laboratory by plating onto potato dextrose agar. Identification of Fusarium species involved visual assessment, microscopic examination and morphological characterization using the criteria of Leslie and Summerell (2006). Fifteen roots from each of the 26 bean crops surveyed were frozen for future PCR detection of root rot pathogens. RESULTS AND COMMENTS: The 2016 cropping season in southern Ontario began early with dry weather affecting a large portion of the crop. By June 9th, planting was 70% complete, but emergence in some fields was slow due to lack of moisture (OMAFRA, 2016). Dry weather pushed maturity ahead and harvest occurred earlier than usual. By August, the edible bean crop was too far along in maturity to benefit significantly from August rainfall. Yields are expected to be below average due to the dry conditions (M. Moran, pers. comm.). Two root diseases were observed (Table 1). Fusarium root rot (Fusarium spp.) was detected in all 26 crops surveyed for root diseases. Similar results have been reported previously in Ontario (Henriquez et al. 2015a; Kim et al. 2016) and elsewhere in Canada (Conner et al. 2011; Henriquez et al. 2015b, McLaren et al. 2016). Crops in which Fusarium spp. were isolated had root rot severity ratings that ranged from 3.5 to 5.7 with a mean of 4.7. Rhizoctonia root rot (Rhizoctonia solani) and pythium root rot (Pythium spp.) were not detected in any of the 26 crops surveyed. Molecular detection methods to confirm the identity of other fungi isolated from six surveyed crops are currently in progress. Twenty-three of 26 crops had an average root rot severity rating above 4 (i.e., symptoms were present on 50% of the root system and plants were stunted) and this would have had a detrimental effect on yield.

192
REFERENCES: Conner, R.L., McLaren, D.L., Penner, W.C., and Kerley, T.J. 2011. Diseases of field bean in Manitoba in 2010. Can. Plant Dis. Surv. 91:107-108. (www.phytopath.ca/cpds.shtml)
Henriquez, M.A., McLaren, D.L., Conner, R.L., Hall, B.E., Penner, W.C. and Kerley, T.J. 2015a. Diseases of field bean in western Ontario in 2014. Can. Plant Dis. Surv. 95: 153-154. (www.phytopath.ca/cpds.shtml)
Henriquez, M.A., McLaren, D.L., Conner, R.L., Penner, W.C. and Kerley, T.J. 2015b. Diseases of field bean in Manitoba in 2014. Can. Plant Dis. Surv. 95: 151-152. (www.phytopath.ca/cpds.shtml)
Kim, Y.M., McLaren, D.L., Conner, R.L., Hall, B.E., Hutcheson, D., Penner, W.C. and Kerley, T.J. 2016. Root diseases of field bean in western Ontario in 2015. Can. Plant Dis. Surv. 96: 158-159.
Leslie J.F., Summerell B.A. (2006): The Fusarium Laboratory Manual. Blackwell Publishing Ltd, Iowa. 388 pp.
McLaren, D.L., Kim, Y.M., Conner, R.L., Penner, W.C. and Kerley, T.J. 2016. Diseases of field bean in Manitoba in 2015. Can. Plant Dis. Surv. 96: 153-155.
Ontario Ministry of Agriculture, Food and Rural Affairs (OMAFRA). 2016. OMAFRA Field Crop Report. June 8, 2016. (www.fieldcropnews.com/2016/06/omaafra-field-crop-report-june8-2016/) Table 1. Prevalence and severity of root diseases in 26 crops of field bean in Ontario in 2016.
No. Crops Disease Severity
Disease1 Affected Mean2 Range
Fusarium root rot 26 4.7 3.5-5.7
Rhizoctonia root rot
Pythium root rot
Other
0
0
6
0
0
4.6
0
0
3.8-5.2
1Root diseases were rated on a scale of 0 (no disease) to 9 (death of plant). 2Means are based on an average of the crops in which the diseases were observed.

193
CROP / CULTURE: Field pea (Pisum sativum L.) LOCATION / RÉGION: Alberta NAMES AND AGENCIES / NAMES AND AGENCIES / NOMS ET ÉTABLISSEMENTS: L.F. Wu1, K.F. Chang2, H. Fu1, I. Akter2, N. Li3, S.F. Hwang2, G.D. Turnbull2, S.E. Strelkov1 and D. Feindel2 1Department of Agricultural, Food and Nutritional Science, University of Alberta, Edmonton AB T6G 2P5 E-mail: [email protected] 2Alberta Agriculture and Forestry, Crop Diversification Centre North, 17507 Fort Road NW, Edmonton AB T5Y 6H3 Telephone: (780) 644-8352; Facsimile: (780) 422-6096; E-mail: [email protected] 3Shandong Centre of Crop Germplasm Resources, Jinan 250100, Shandong, China TITLE: THE OCCURRENCE OF AND MICROORGANISMS ASSOCIATED WITH ROOT ROT OF FIELD PEA IN ALBERTA IN 2016 ABSTRACT: The occurrence and severity of root rot disease on field pea was investigated in five counties across Alberta in July, 2016. A total of 71 fields were surveyed. Root rot symptoms were found at all locations, with an average incidence of 57.6%, ranging from 2% to 100%. Symptom severity ranged from 0.01 to 3.4 on a scale of 0-4, with an average of 1.3. The pathogens associated with the root rot complex were isolated from infected root tissues. Species of Fusarium were recovered most frequently, followed by Pythium spp., Aphanomyces euteiches and Rhizoctonia spp. The frequent co-occurrence of Fusarium spp. and Pythium spp. suggests that interactions between these pathogens contribute to the incidence and severity of root rot on field pea. METHODS: The occurrence and severity of root rot on field pea (Pisum sativum L.) were investigated in a total of 71 commercial fields distributed across five counties in Alberta from July 8 to July 24, 2016. Five random sites with a ‘W’ shape sampling pattern were surveyed in each crop. At each of the five sampling sites, 20 pea plants were randomly selected and dug from the ground. Soil was carefully cleaned off from the root samples to preserve the intact root system. The percentage of symptomatic plants sampled within a field was recorded, while root rot severity was rated on scale of 0-4 (Chang et al. 2013). Ten pieces from each infected root sample were used to isolate the pathogens associated with the root rot complex, as described by Chang et al. (2005). The root pieces were transferred onto Petri dishes filled with potato dextrose agar (PDA) or selective MBV medium (Pfender et al. 1984) for Aphanomyces euteiches isolation. RESULTS AND COMMENTS: The distribution ofroot rot was uneven across the 71 pea fields surveyed (Table 1). The mean incidence of the disease was similar in the fields sampled at Edmonton, Drumheller and Sturgeon Counties, with an average of 68.7% ranging from 7% to 100% (Fig.1). At Vermillion and Westlock, root rot incidence was lower, with a mean of 41% ranging from 2-100%. Across all fields surveyed in Alberta, the mean disease incidence was 57.6%, while the average severity was 1.3 with a range of 0.01 to 3.4. A total of 364 symptomatic root samples were cultured on PDA and MBV for pathogen isolation. Species of Fusarium were isolated most commonly from these roots, followed by Pythium spp., A. euteiches and Rhizoctonia spp. (Table 2). A mixture of Fusarium spp. and Pythium spp. was recovered from 66.6% of the roots, which suggested that an interaction between these two species frequently results in root rot. Rhizoctonia spp. were identified only from Sturgeon County at an incidence of 5%. ACKNOWLEDGEMENTS: We are grateful for the financial support provided by the Growing Forward 2 Program of Agriculture and Agri-Food Canada, the Government of Alberta (Pest Management and Surveillance Implementation Program), the Saskatchewan Pulse Growers and the Manitoba Pulse and Soybean Growers associations. We thank Mr. Roger Barron from Sturgeon Valley Fertilizers Inc., St. Albert, AB, and Mr. Ryan Adams, from Crop Production Services, Fort Saskatchewan, AB, for providing field locations and grower contact information. We also appreciate the support provided by staff from the Crop Diversification Centre North, Edmonton, Alberta.

194
REFERENCES:
Chang, K.F., Bowness, R., Hwang, S.F., Turnbull, G.D., Howard, R.J., Lopetinsky, K., Olson, M., and Bing, D.J. 2005. Pea diseases in central Alberta in 2004. Can. Plant Dis. Surv. 85: 89-90. (http://www. cps-scp.ca/cpds.htm)
Chang, K.F., Hwang, S.F., Ahmed, H.U., Gossen, B.D., Turnbull, G.D., and Strelkov, S.E. 2013. Management strategies to reduce losses caused by Fusarium seedling blight of field pea. Can. J. Plant Sci. 93: 619-625.
Pfender, W.F., Delwiche, P.A., Grau, C.R., and Hagedorn, D.J. 1984. A medium to enhance recovery of Aphanomyces from infected plant tissue. Plant Dis. 68: 845-847. Table 1. Incidence and severity of pea root rot in Alberta in 2016.
County No. of fields
surveyed
Root rot incidence (%)
Root rot severity
(0-4)
Mean Range Mean Range
Edmonton 5 63 7-100 1.4 0.9-2.5
Drumheller 2 69 38-100 1.8 0.1-3.0
Sturgeon 19 74 13-100 1.6 0.2-3.0
Vermillion 26 43 9-92 0.8 0.1-2.4
Westlock 19 39 2-100 0.9 0.01-3.4
Total/Average 71 57.6 2-100 1.3 0.01-3.4
Table 2. Incidence (%) of the pathogens recovered from pea roots collected in Alberta in 2016 and showing symptoms of root rot
County No. Roots tested
No. Field tested
Fusarium spp. (F)
Pythium spp. (P)
F + P Aphanomyces* euteiches
Rhizoctonia spp.
Edmonton 39 3 97 92 90 5 0
Drumheller 18 2 100 44 44 6 0
Sturgeon 144 17 76 44 74 0 5
Vermillion 40 4 95 68 65 0 0
Westlock 123 15 85 62 60 5 0
Total / Avg. 364 41 90.6 62 66.6 3.2 1
* Data were obtained on the selective medium MBV.

195
Figure 1. Field pea plants affected by severe root rot in a low-lying area of a field in Sturgeon County.

196
CROP / CULTURE: Field pea (Pisum sativum L.), Lentil (Lens culinaris Medik.) LOCATION / RÉGION: Alberta, Saskatchewan, Manitoba
NAMES AND AGENCIES / NOMS ET ÉTABLISSEMENTS: S. Chatterton1, M.W. Harding2, R. Bowness3, C. Vucurevich1, Q. Storozynsky1, T. Dubitz3, J.M. Nielsen2,B. Olson4, S. Phelps5, B.D. Gossen6, B. Ziesman7, D. McLaren8
1Agriculture and Agri-Food Canada, Lethbridge Research and Development Centre, P. O. Box 3000,Lethbridge AB T1J 4B12Alberta Agriculture and Forestry, Crop Diversification Centre South, 301 Horticultural Station Road East,Brooks AB T1R 1E63Alberta Agriculture and Forestry, 6000 C&E Trail, Lacombe, AB T4L 1W14 Hazlet SK S0N 1E05Saskatchewan Pulse Growers, 207-116 Research Dr., Saskatoon SK S7N 3R36AAFC, Saskatoon Research and Development Centre, 107 Science Plan, Saskatoon SK S7N 0X27Saskatchewan Ministry of Agriculture, 3085 Albert St., Regina SK S4S 0B18AAFC, Brandon Research and Development Centre, 2701 Grand Valley Road, Brandon MB R7A 5Y3
TITLE / TITRE: SURVEY OF ROOT ROT IN ALBERTA, SASKATCHEWAN AND MANITOBA FIELD PEA AND LENTIL IN 2016
ABSTRACT: A total of 185 field pea (Pisum sativum) and 93 lentil (Lens culinaris) crops were surveyed in Alberta, Saskatchewan and Manitoba (field pea only) for root rot. Root rot was present in all regions in 92% of pea crops and 95% of lentil crops. Roots with symptoms of aphanomyces root rot were observed in all regions surveyed, and the presence of Aphanomyces euteiches was confirmed by isolation on culture media and/or PCR tests.
INTRODUCTION AND METHODS: Field pea and lentil crops reached record production in Alberta and Saskatchewan, with 2.4 million ha of lentil and 1.6 million ha of pea seeded across both provinces in 2016 (1). Root rots caused by Fusarium spp. have become a severe problem for many Alberta pea producers (2). The destructive root rot pathogen Aphanomyces euteiches was reported to be present in Saskatchewan and Alberta pea fields in 2012 and 2013, respectively (3, 4). To assess the prevalence, incidence and severity of root rot in Alberta, Saskatchewan and Manitoba, pea and lentil crops were surveyed at flowering in June-July 2016 for above- and below-ground symptoms of root rot. Representative samples were collected from each field to allow the causal agents to be isolated and identified.
Crops were evaluated at 10 sites per field along a U-shaped pattern, with a minimum of 20 m between sites. Fields surveyed were categorized according to soil zone (black, brown, dark brown) for analysis of root rot incidence and severity. To assess root rot, roots from 5-10 plants were dug up at each of the 10 sampling sites per field, bagged and stored at ~4oC until processing. Samples from Manitoba, Saskatchewan and central Alberta were shipped to the Lethbridge Research and Development Centre for root rot rating and processing. Roots were washed under running tap water for 10 min, and individual roots were assigned a visual rating for disease severity (1=healthy, 7=dead) (5). Roots collected early in the season (early June) in southern Alberta from fields with symptoms of aphanomyces root rot were kept for isolation of A. euteiches. For pathogen isolations, lateral roots were examined for presence of oospores under a microscope, and roots with oospores were plated (without surface sterilization) onto cornmeal agar amended with metalaxyl, benomyl and vancomycin (MBV) (6). All other roots with a severity rating of 4 – 6 were processed for DNA extraction. Roots from each site per field were bulked, cut into 0.5 cm pieces, freeze-dried and 30 mg removed for DNA extractions using the BioSprint Plant DNA kit (Qiagen). Extracted DNA was then used in a series of four multiplex end-point PCR reactions, using previously published species-specific primers, designed to test for presence/absence of A. euteiches (7), nine Fusarium spp., Rhizoctonia solani, Pythium ultimum and P. irregulare.
RESULTS AND DISCUSSION: Field pea: Root rot symptoms were found in 87% of pea crops surveyed in Alberta and 100% of fields in Saskatchewan and Manitoba. In Manitoba, mean root incidence was 95% and severity was 3.9 (Table 1). In Saskatchewan, mean root rot incidence was 88% and severity was 3.3. In the black soil zone, 96% of

197
360 sample sites had root rot, with a mean severity of 3.5. Root rot severity was highest in the brown soil zone at 4.3, with a mean incidence of 92%. Fields in the dark brown zone had the lowest incidence and severity (82% and 3.2).
In Alberta, mean root rot incidence was 68% and severity was 2.7. As in Saskatchewan, mean root rot incidence and severity were highest in the brown soil zone (74%, 2.9). Incidence and severity were slightly lower (63%, 2.8) in the dark brown soil and in the black soil zone (66%, 2.5) (Table 1).
Lentil: Root rot symptoms were found in 86% of lentil crops surveyed in Alberta and 100% of fields in Saskatchewan. In Alberta, lentil is grown almost exclusively in the brown soil zone, where root rot incidence was 76% with a mean severity of 2.8. In Saskatchewan, root rot incidence and severity was highest in the black soil zone (96%, 3.5), but only 10 fields were surveyed because fewer lentils are grown in this region. Mean incidence and severity was lower in the dark brown soil zone (94%, 3.1), and lowest in the brown soil zone (89%, 2.7).
Identification of causal agents: A. euteiches was isolated from roots from 12 fields in southern Alberta that were surveyed from June 10-24. Roots sampled after these dates yielded primarily Fusarium spp., and therefore attempts to isolate A. euteiches did not continue from fields surveyed in July.
At the time this report was submitted, PCR assays and analysis for presence/absence of A. euteiches for most samples retained from diseased fields were complete. However, the results for Fusarium spp., R. solani and Pythium spp. have not yet been scored and analyzed. A. euteiches frequency was higher inpea than lentil crops, with Alberta showing the highest frequency of infected fields at 61%, followed byManitoba at 58% and then Saskatchewan at 44% (Table 2). In initial assessments, 32% of lentil fields inSaskatchewan were positive for A. euteiches and 29% were positive in Alberta. However, some PCRtests are being repeated because the results were either not consistent between duplicates or theamplification strength was weak. Two fields each of dry bean and alfalfa gave weakly positive results forA. euteiches, and these fields will be re-tested to confirm presence / absence. Preliminary assessment ofPCR results for Fusarium spp. indicates that these were the predominant fungi present in roots, asbanding patterns indicating presence of at least one Fusarium sp. were observed from almost allsamples. Rhizoctonia solani and Pythium spp. were also detected, but at much lower frequencies.
ACKNOWLEDGEMENTS: Funding for this project is provided by the Alberta Crop Industry Development Fund, the Alberta Pulse Growers Commission, the Saskatchewan Pulse Growers Commission and Agriculture and Agri-Food Canada. We thank all producers that co-operated with surveillance efforts and field sampling. We thank C. Mueller, B. Groenenboom and A. Lorenz for technical assistance.
REFERENCES: Statistics Canada, 2016. CANSIM Table 001-0010. http://www5.statcan.gc.ca/cansim/pick-choisir?lang=eng&p2=33&id=0010010
Chatterton, S., Harding, M.W., Bowness, R., Vucurevich, C., Storozynsky, Q., Dubitz, T., Nielsen, J., Olson, M. 2016. Survey of root rot in Alberta field pea in 2015. Can. Plant Dis. Surv. 96:188-190.
Chatterton, S., Bowness, R., Harding, M.W. 2014. First report of root rot of field pea caused by Aphanomyces euteiches in Alberta, Canada. Plant Dis. 99: 288.
Armstrong-Cho, C., Carriere, B., Peluola, C., Dokken-Bouchard, F., Banniza, S. 2015. Reports of Aphanomyces from Saskatchewan root and soil samples. Can. Plant Dis. Surv. 95:176-177.
Bilgi, V. N., Bradley, C. A., Khot, S. D., Grafton, K. F. and Rasmussen, J. B. 2008. Response of dry bean genotypes to Fusarium root rot caused by Fusarium solani f. sp. phaseoli, under field and controlled conditions. Plant Dis. 92:1197-1200.
Windels, C. E. 2000. Aphanomyces root rot on sugar beet. Plant Health Progress online (10.1094/PHP-2000-0720-01-DG).
Gangneux, C., Cannesan, M.-A., Bressan, M., Castel, L., Moussart, A., Vicré-Gibouin, M., Driouich, A., Trinsoutrot-Gattin, I., Laval, K. 2014. A sensitive assay for rapid detection and quantification of Aphanomyces euteiches in soil. Phytopathology 104:1138-1147.

198
Table 1. Root rot prevalence, incidence and severity in field pea (Alberta, Saskatchewan and Manitoba) and lentil (Alberta and Saskatchewan) crops in 2016.
Soil zone No. fields surveyed
Root rot prevalence (%)
Root rot incidence (%)
Severity (1-7)
Severity Range
Pea, Alberta
Black 21 95 66 2.5 1.0 – 7.0
Dark brown 22 82 63 2.8 1.0 – 6.8
Brown 41 83 74 2.9 1.0 – 7.0
Total / Mean / Range 84 87 68 2.7 1.0 – 7.0
Pea, Saskatchewan
Black 36 100 92 3.5 1.0 – 6.6
Dark brown 17 100 82 3.2 1.0 – 7.0
Brown 15 100 92 4.3 1.0 – 7.0
Grey 3 100 85 2.4 1.0 – 4.2
Total / Mean / Range 71 100 90 3.5 1.0 – 7.0
Pea, Manitoba 30 100 95 3.9 2.0 – 7.0
Lentil, AB and SK
Alberta (brown) 29 86 76 2.8 1.0 – 6.0
Saskatchewan
Black 10 100 96 3.5 1.0 – 6.4
Dark brown 24 100 94 3.1 1.0 – 7.0
Brown 30 100 89 2.7 1.0 – 6.0
Total / Mean / Range 64 100 92 3.0 1.0 – 7.0

199
Table 2. Number of fields and root samples in Alberta, Saskatchewan, and Manitoba that tested positive for Aphanomyces euteiches using a PCR assay.
Location/Crop No. fields tested
No. fields positive
% fields positiveb
No. samples tested
No. samples positivec
% samples positive
Alberta
Pea 62 38 (8)a 61 262 178 67
Lentil 21 6 (2) 29 100 32 32
Dry bean 7 (2) 0 9 0 0
Alfalfa 4 (2) 0 7 0 0
Saskatchewan
Pea 66 29 (11) 44 282 159 56
Lentil 62 20 (20) 32 242 131 54
Manitoba
Pea 26 15 (8) 58 117 95 81 aNumber in brackets indicates additional number of fields testing positive but PCR result was not consistent between duplicate reactions, or band intensity was weak and difficult to score. bOnly includes fields that had a strong positive reaction or the PCR result was consistent between duplicate reactions. cOnly includes samples that had a strong positive reaction or the PCR result was consistent between duplicate reactions.

200
CROP / CULTURE: Field pea LOCATION / RÉGION: Manitoba
NAMES AND AGENCIES / NOMS ET ÉTABLISSEMENTS D.L. McLaren1, T.L. Henderson1, Y.M. Kim1, K.F. Chang2, T.J. Kerley1 and M.J. Thompson1
1Agriculture and Agri-Food Canada (AAFC) Research and Development Centre, 2701 Grand ValleyRoad, Brandon MB R7A 5Y3Telephone: (204) 578-6561; Facsimile: (204) 578-6524; E-mail: [email protected] Agriculture and Rural Development, Crop Diversification Centre-North, 17507 Fort Road N.W.,Edmonton AB T5Y 6H3
TITLE: FIELD PEA DISEASES IN MANITOBA IN 2016
ABSTRACT: A total of 40 and 38-40 pea crops were surveyed in Manitoba for root and foliar diseases, respectively. Fusarium root rot was the most prevalent root disease and mycosphaerella blight the most widespread foliar disease throughout the province. Diseases less frequently observed included sclerotinia stem rot and downy mildew. Rust, bacterial blight, septoria leaf blotch and anthracnose were not observed in any of the crops surveyed in 2016.
METHODS: Field pea crops were surveyed for root and foliar diseases at 40 and 38-40 different locations, respectively in Manitoba. The crops surveyed were randomly chosen from regions in south-central and southwest Manitoba, where field pea is commonly grown. The area seeded to field pea in Manitoba has increased in recent years with approximately 20,000, 22,000 and 26,000 ha in 2013, 2014 and 2015, respectively (Manitoba Pulse and Soybean Growers 2015). However, the area sown to field pea in 2016 more than doubled with 66,000 ha in Manitoba based on an increased demand for peas (Manitoba Pulse and Soybean Growers 2016).
The survey of root diseases was conducted during late June to mid-July when most plants were at the early to late flowering stages. At least ten plants were sampled at each of three random sites in each crop surveyed. Root diseases were rated on a scale of 0 (no disease) to 9 (death of plant) (Xue 2000). To confirm the visual disease identification, 15 symptomatic roots were collected from each of the 40 crops for fungal isolation and identification. Identification of Fusarium species involved visual assessment, microscopic examination and morphological characterization using the criteria of Leslie and Summerell (2006). Fifteen roots from each of the 40 pea crops were frozen for future PCR analysis of the root rot pathogens.
Foliar diseases were assessed during the late July when most plants were at the intermediate to round pod stage. Severe hail damage prevented foliar disease assessment in two fields with the exception of downy mildew when samples were collected prior to the damaging storm. A minimum of 30 plants (10 plants at each of 3 sites) was assessed in each field. Foliar diseases were identified by symptoms. The severity of mycosphaerella blight, sclerotinia stem rot and anthracnose was estimated using a scale of 0 (no disease) to 9 (whole plant severely diseased). Powdery mildew, downy mildew, rust, septoria leaf blotch and bacterial blight were rated as the percentage of foliar area infected.
RESULTS AND COMMENTS: Favorable weather and field conditions allowed seeding operations to get underway in many areas of Manitoba by May 2, 2016 (Manitoba Agriculture 2016a). In mid-May, cool weather and excess moisture impacted crop development in some regions (Manitoba Agriculture 2016b). Thunderstorm activity in July resulted in heavy rainfall, strong winds and hail in areas of Manitoba resulting in crop damage (Manitoba Agriculture 2016c). Several producers reported difficulty harvesting the crop due to lodging. Continuing wet conditions in some areas of Manitoba delayed the 2016 harvest, with reports of average to below average pea yields.
Two diseases were identified based on laboratory assessment of the roots collected from the 40 pea crops (Table 1). Fusarium root rot was the most prevalent as in previous years (McLaren et al. 2015, 2016). The 40 crops from which Fusarium spp. were isolated had root rot severity ratings ranging from 0.9 to 5.9 with a mean of 2.8. The most predominant Fusarium spp. isolated in 2016 were F. acuminatum

201
and F. avenaceum. Rhizoctonia root rot (Rhizoctonia solani) was not detected in any of the crops sampled. Six pea crops had average root rot severity ratings above 4 (i.e., symptoms were present on 50% of the root system) and this would have had a detrimental effect on crop yield. Fusarium oxysporum, an efficient root colonizer known to cause wilt of pea, was detected in 30 of the 40 crops sampled for fungal isolation and identification. Three foliar diseases were observed (Table 2). Mycosphaerella blight (Mycosphaerella pinodes) was the most prevalent, as in previous years (McLaren et al. 2015, 2016), and was present in all crops surveyed. Disease severity ranged from 3.4 to 8.4 with a mean of 6.0. Sclerotinia disease (Sclerotinia sclerotiorum) was detected in twenty-one (55%) of the crops surveyed. In 2015, sclerotinia stem rot was detected in one crop only with a severity of <1.0. Environmental conditions during the latter half of the 2016 field season were more conducive to the development of sclerotinia stem rot compared with the previous year and contributed to increased disease risk. Downy mildew (Peronospora viciae) was detected in nine (23%) of the crops surveyed with a mean disease severity of <0.1. Powdery mildew (Erysiphe pisi) was not observed in any of the surveyed crops. Because all newly registered pea cultivars are required to have resistance to powdery mildew, the absence of this disease could be mainly attributed to the use of new cultivars by growers or early seeded crops escaping infection. However, powdery mildew was observed in August on a few susceptible lines at AAFC-Morden and AAFC-Brandon, which suggests that there may have been crops in which powdery mildew developed after the survey. Anthracnose (Colletotrichum pisi), rust (Uromyces viciae-fabae), septoria leaf blotch (Septoria pisi) and bacterial blight (Pseudomonas syringae pv. pisi) were not observed in any of the surveyed crops. REFERENCES: Leslie J.F. and Summerell B.A. 2006. The Fusarium Laboratory Manual. Blackwell Publishing Ltd, Iowa.388 pp. Manitoba Agriculture. Crop report. Issue 1, May 2, 2016a. (www.gov.mb,.ca/agriculture/crops/seasonal-reports/crop-report-archive/2016-05-02-crop-report.html) Manitoba Agriculture. Crop report. Issue 3, May 16, 2016b. (www.gov.mb,.ca/agriculture/crops/seasonal-reports/crop-report-archive/2016-05-16-crop-report.html) Manitoba Agriculture. Crop report. Issue 11, July 11, 2016c. (www.gov.mb,.ca/agriculture/crops/seasonal-reports/crop-report-archive/2016-07-11-crop-report.html) Manitoba Pulse and Soybean Growers. 2015. Pulses and Soybeans in Manitoba (www.manitobapulse.ca/pulses-in-manitoba). Manitoba Pulse and Soybean Growers 2016. The Bean Report. No. 8. September 15, 2016. (www.manitobapulse.ca/the-bean-report/) McLaren, D.L., Hausermann, D.J., Henriquez, M.A., Chang, K.F. and Kerley, T.J. 2015. Field pea diseases in Manitoba in 2014. Can. Plant Dis. Surv. 95: 173-175. (www.phytopath.ca/cpds.shtml) McLaren, D.L., Henderson, T.L., Kim, Y.M., Chang, K.F. and Kerley, T.J. 2016. Field pea diseases in Manitoba in 2015. Can. Plant Dis. Surv. 96: 191-193. (www.phytopath.ca/cpds.shtml) Xue, A.G. 2000. Effect of seed-borne Mycosphaerella pinodes and seed treatments on emergence, foot rot severity and yield of field pea. Can. J. Plant Pathol. 22:248-253.

202
Table 1. Prevalence and severity of root diseases in 40 crops of field pea in Manitoba in 2016.
Disease
Crops Affected (%)
Disease Severity (0-9)1
Mean Range
Fusarium root rot 100 2.8 0.9 - 5.9
Rhizoctonia root rot 0 0 0
Fusarium oxysporum 75 2.9 0.9-5.2
1All diseases were rated on a scale of 0 (no disease) to 9 (death of plant). Mean values are based only on crops in which the disease was observed
Table 2. Prevalence and severity of foliar diseases in 38 and 401 crops of field pea in Manitoba in 2016.
Disease
Crops Affected (%)
Disease Severity (0-9 or % leaf area infected)2
Mean Range
Mycosphaerella blight 100 6.0 3.4 - 8.4
Sclerotinia stem rot 55 0.5 <0.1 - 2.9
Powdery mildew 0 0% 0%
Downy mildew 23 <0.1% <0.1 - 0.2%
Anthracnose 0 0 0
Rust 0 0% 0%
Bacterial blight 0 0% 0%
Septoria leaf blotch 0 0% 0%
1Downy mildew was assessed prior to two of the 40 crops being severely damaged by hail.
2Powdery mildew, downy mildew, rust, septoria leaf blotch and bacterial blight severity were rated as the percentage of leaf area infected; other diseases were rated on a scale of 0 (no disease) to 9 (whole plant severely diseased). Mean values are based only on crops in which the disease was observed.

203
CROP / CULTURE: Flax LOCATION / RÉGION: Manitoba / Saskatchewan NAMES AND AGENCIES / NOMS ET ÉTABLISSEMENTS K. Y. Rashid1, B. Ziesman3, C. Jacob3, H.R. Kutcher2, T. Islam2, M.P. Pradhan4 1Agriculture & Agri-Food Canada, Research & Development Centre, 101 Route 100, Morden MB R6M 1Y5 Telephone: (204) 822-7520; Facsimile: (204) 822-7507; E-mail: [email protected] 2Crop Development Centre, University of Saskatchewan, 51 Campus Drive, College of Agriculture and Bioresources, Saskatoon SK S7N 5A8 3Crops Branch, Saskatchewan Ministry of Agriculture, 3085 Albert Street, Regina SK S4S 0B1 4Manitoba Agriculture, Crop Diagnostic Centre, 201-545 University Crescent, Winnipeg MB R3T 5S6
TITLE: DISEASES OF FLAX IN MANITOBA AND SASKATCHEWAN IN 2016 ABSTRACT: A survey of 23 flax crops in Manitoba and 58 crops in Saskatchewan revealed that pasmo was the most prevalent disease in 98% of crops surveyed in 2016, followed by alternaria blight in 31%, fusarium root rot in 27%, aster yellows in 14%, and sclerotinia stem rot in 7% of the crops surveyed. Rust was absent in all surveyed flax crops for the last 30 years. Powdery mildew was not assessed due to early maturity of the crops. METHODS: A total of 81 flax crops were surveyed in 2016: 23 in southern Manitoba and 58 in central, southern and eastern Saskatchewan. Four crops were surveyed in the third week of August, 14 in the fourth week of August and 63 in the first week of September. Crops surveyed were selected at random along pre-planned routes in the major areas of flax production. Each crop was sampled by two people walking ~100 m in opposite directions to each other following an "M" pattern. Diseases were identified by visible symptoms and the incidence and severity of fusarium wilt (Fusarium oxysporum lini), pasmo (Septoria linicola), powdery mildew (Oidium lini), rust (Melampsora lini), alternaria blight (Alternaria spp.), sclerotinia stem infection (Sclerotinia sclerotiorum), and aster yellows (AY phytoplasma) were recorded. Stand establishment, vigour, and maturity were rated on a scale of 1 to 5 (I = very good/early, and 5 = very poor/very late). In addition, nine samples of flax plants were submitted for analysis to the Crop Diagnostic Centre of Manitoba Agriculture by agricultural representatives and growers. RESULTS AND COMMENTS: Seventy-seven percent of the flax crops surveyed in 2016 (96% in Manitoba and 69% in Saskatchewan) had excellent stands and the rest were good to fair. Sixty-seven percent of the crops surveyed were early maturing (78% in Manitoba and 62% in Saskatchewan). Seventy-eight percent of the crops had excellent vigour and the rest were poor (83% in Manitoba and 76% in Saskatchewan). Ninety-six percent of the crops were brown seed-colour flax, and only 4% were yellow seed-colour. Weed infestation was very low in 72% of the crops surveyed in 2016 and the reminder 28% had medium to high weed infestation. The 2016 growing season was characterized by normal soil moisture conditions in Manitoba but above normal wet soils in Saskatchewan early in the season. Frequent rains occurred in Manitoba and Saskatchewan throughout the summer. Total flax area was ~400,000 ha, approximately 85% in Saskatchewan according to Statistics Canada. This disease survey showed minor differences between Saskatchewan and Manitoba; fusarium wilt/root rot, alternaria blight, and aster yellows were higher in Manitoba than in Saskatchewan. Of all crops surveyed, lodging was higher in Saskatchewan at 45% than in Manitoba at 22%. Pasmo, the most prevalent disease in 2016, was observed in 97% of the crops surveyed in both provinces especially those surveyed in September (Table 1). The prevalence and severity on stems were generally higher than in 2015 but similar to previous years (1, 2, 3, 4), due probably to the frequent precipitation throughout the growing season. Pasmo severity was mostly at trace to 5% levels in most of the crops surveyed in August but the disease developed further towards the end of the season and reached a severity of 20-40% stem area affected in 43% of flax crops in both provinces (Table 1). Root infections and fusarium wilt were observed in 27% of the crops surveyed (44% in Manitoba and 21% in Saskatchewan). Incidence was very low (trace to 5%) even in the most affected crops (Table 1). The prevalence of this disease in 2016 was generally similar to previous years (1, 2, 3, 4).

204
Powdery mildew was not assessed in 2016 due to the late onset of the disease, the early maturity of the flax crops and the senescing of leaves prior to the survey. Powdery mildew was observed on the top few leaves of the late maturing crops but no precise data could be collected in 2016. Rust was not observed in any of the crops surveyed in 2016, nor in the flax rust trap nurseries planted at Morden and Portage la Prairie in Manitoba, and at Indian Head and Saskatoon in Saskatchewan. Aster yellows was present at trace levels in 31% of the crops surveyed (35% in Manitoba and 5% in Saskatchewan). This was more frequent than in previous years especially in Manitoba (1, 2, 3), but disease severity was very low (trace to 5% in most surveyed crops). This disease is transmitted by the aster leafhopper (Macrosteles quadrilineatus) that usually migrates from the south during the growing season. Alternaria blight was observed at trace to 5% levels in 31% of the crops (61% in Manitoba and 19% in Saskatchewan). Sclerotinia stem infections were observed in lodged flax crops at trace to 1% levels in 7% of the crops (13% in Manitoba and 5% in Saskatchewan), lower than in 2015 (1). Of the nine samples submitted to the MAFRD Crop Diagnostic Centre in 2016, one was affected by pasmo, one by Pythium and Rhizoctonia spp., two by fusarium wilt, and five by herbicide injury. ACKNOWLEDGEMENTS: Technical assistance of Tricia Cabernel and Maurice Penner. REFERENCES: Rashid, K.Y., Kutcher, H.R., Islam, T., Stephens, D., Dokken-Bouchard, F., Pradhan, M.P., and Duguid, S. 2016. Diseases of flax in Manitoba and Saskatchewan in 2015. Can. Plant Dis. Surv. 96:180-181 (cps-scp.ca/cpds.shtml).
Rashid, K.Y., Kutcher, H.R., Cholango Martinez, L.P., Dokken-Bouchard, F., Desjardins, M.L., and Duguid, S. 2015. Diseases of flax in Manitoba and Saskatchewan in 2014. Can. Plant Dis. Surv. 95:169-169 (cps-scp.ca/cpds.shtml).
Rashid, K.Y., Kutcher, H.R., Desjardins, M.L., and Duguid, S. 2014. Diseases of flax in Manitoba and Saskatchewan in 2013. Can. Plant Dis. Surv. 94:187-1881 (cps-scp.ca/cpds.shtml).
Rashid, K.Y., Desjardins, M.L., and Duguid, S. 2013. Diseases of flax in Manitoba and Saskatchewan in 2012. Can. Plant Dis. Surv. 93:161-162. (cps-scp.ca/cpds.shtml).

205
Table 1. Incidence and severity of fusarium wilt and pasmo in 81 crops of flax in Manitoba and Saskatchewan in 2016.
Fusarium Wilt Pasmo
Disease Class Crops Disease Class Crops
Incid.1 Sever.2 # % Incid.1 Sever.2 # %
0% 0% 59 73 0% 2% 2 2
1-5% 1-5% 22 27 1-10% 1-5% 23 29
5-20% 5-10% 0 0 10-30% 5-10% 21 26
2-40% 10-20% 0 0 30-60% 10-20% 17 21
>40% 10-40% 0 0 >60% 20-50% 18 22
1Disease incidence = percentage of infected plants in each crop 2Disease severity = percentage of roots affected by fusarium wilt, and of stems affected by pasmo.

206
CROP / CULTURE Lentil LOCATION / RÉGION: Saskatchewan NAMES AND AGENCIES / NOMS ET ÉTABLISSEMENTS D.T. Stephens, S. Chant, C. Jacob, M. Hladun, J. Ippolito, K. Kindrachuk, V. Nameth and B. Ziesman Saskatchewan Ministry of Agriculture, 3085 Albert St., Regina SK S4S 0B1 Telephone: (306) 787-4671; Facsimile: (306) 787-0428; E-mail: [email protected] TITLE: 2016 SURVEY OF LENTIL DISEASES IN SASKATCHEWAN ABSTRACT: A total of 50 lentil crops were surveyed in Saskatchewan in 2016. Sclerotinia and stemphylium blight were the most prevalent diseases observed in the survey, whereas anthracnose and root rot varied from field to field. Overall ascochyta blight levels remain low. METHODS: Saskatchewan lentil crops were surveyed for disease in 2016 (50 fields). Fields were surveyed between July 19 and Aug 14th and fields ranged in staging from mid-flower to approximately 30% moisture content (desiccation stage). Regions surveyed were west-central (16), southwest (20), southeast (6) and east-central (8). Disease assessments were made qualitatively in each crop by observing several representative plants to evaluate general health and presence or absence of symptoms. In each field plants were examined to determine the presence or absence of the following diseases: root rot complex (Fusarium spp. / Pythium spp. / Rhizoctonia solani / Aphanomyces euteiches), anthracnose (Colletotrichum lentis), ascochyta blight (Ascochyta lentis), sclerotinia stem and pod rot (Sclerotinia sclerotiorum), botrytis stem and pod rot / grey mould (Botrytis cinerea), and stemphylium blight (Stemphylium spp.). Percentages of the crops surveyed showing symptoms (prevalence) of each of these diseases were calculated for each region surveyed (Tables 1-4) and for the province (Table 5); totals from the previous four years are also presented (Dokken-Bouchard et al. 2016). RESULTS AND COMMENTS: Approximately 2.1 million hectares (5.2 million acres) of lentil were seeded in Saskatchewan in 2016, in what has been a steady increase in lentil hectares over the last 5 years (Statistics Canada 2016). Crop seeding started relatively early in 2016. Wet conditions throughout the growing season resulted in generally high levels of diseases in lentil crops, particularly in traditional lentil growing areas (brown soil zone – southwest and west-central SK). As of early November, 1.9 million hectares of lentils were harvested (Statistics Canada 2016) in Saskatchewan, with 98% of the crop combined by November 21, 2016 (Saskatchewan Ministry of Agriculture 2016). Lentil grades from submitted harvest samples (Canadian Grain Commission 2016) were 26% 1CAN, 38% 2CAN, 26% Extra 3CAN and 10% 3CAN. At least two lentil diseases (root rot complex, anthracnose, ascochyta, sclerotinia, botrytis or stemphylium) were observed in each field of the 50 fields surveyed in 2016. Ascochyta blight symptoms (Ascochyta lentis) were observed in 6% of fields surveyed in 2016. Ascochyta blight has generally decreased in prevalence over the last four years and was not observed in any fields included in the 2015 lentil survey. However it is important to note that the number of fields sampled in 2016 (50) is more than double those sampled in 2015 (18 fields) with the 2016 survey covering a larger area of the province. The low levels of ascochyta blight are thought to be due to improved resistance in lentil varieties. As a result, it is important to watch for and prevent breakdown of resistance under tight rotations and/or conditions conducive to disease development. Anthracnose (Colletotrichum lentis) was observed in 74% (37 fields) of the fields surveyed in 2016. The highest prevalence was found in the east-central region (100%), followed by the west-central (88%), southeast (83%) and southwest (50%) regions. Root rot was observed in 70% (35) of the fields included in the 2016 survey. The highest prevalence was found in the west-central region (94%), followed by the southwest (65%), east-central (63%) and southeast (33%) regions. Root rot was often observed in low lying areas prone to waterlogging. Root rot has been a notable issue in pea and lentil crops in recent years, with a number of potential pathogenic causes (Fusarium spp. / Pythium spp. / Rhizoctonia solani / Aphanomyces euteiches) in addition to
207
environmental stresses due to excess moisture. No sampling or further testing was performed to confirm causal pathogens. Botrytis stem and pod rot / grey mould (Botrytis cinerea) was found in 66% of the fields surveyed. The prevalence of botrytis stem and pod rot was considerably higher than recorded from 2012 to 2015, with the highest prevalence in this time period being 29% in 2012. The highest prevalence in 2016 was found in the east-central region (88%), followed by the west-central (69%), southwest (60%) and southeast (50%) regions. Sclerotinia stem and pod rot (Sclerotinia sclerotiorum) was noted in 86% of fields and was the second most prevalent disease in the 2016 lentil disease survey. The highest prevalence was found in the west-central region (94%), followed by the east-central (88%), southwest (85%) and southeast (67%) regions. The prevalence in 2016 was considerable higher than from 2012 to 2015 where the highest prevalence was 56% in 2014. Stemphylium blight (Stemphylium spp.) was found in 88% of lentil fields surveyed. Although the overall prevalence was high, surveyors commented that individual fields had trace levels or had a patchy distribution of the disease in most cases. This disease was observed in 100% of the fields surveyed in the southwest, southeast and east-central region, and in 63% of fields in west-central region. From 2012 to 2015, stemphylium blight has been reported to have a prevalence of 50% (2015) or less. It is not known what economic impact stemphylium blight might have on lentil and there are no commercial fungicides available to manage this disease. Tables 1-5 include one corrected prevalence value for 2015 and should be considered an amendment to those reported by Dokken-Bouchard et al. (2016). REFERENCES: Canadian Grain Commission.Preliminary quality data of western Canadian lentils, as of Oct 27, 2016. 2016. (https://www.grainscanada.gc.ca/lentils-lentille/harvest-recolte/2016/hql16-qrl16-en.htm )
Dokken-Bouchard, F.L., K. Bassendowski, S. Chant, S. Friesen, J. Ippolito, S. Miller and D.T. Stephens. 2016. A survey of lentil diseases in Saskatchewan, 2012-2015. Can. Plant Dis. Surv. 96: 182-185. (http://phytopath.ca/publication/cpds/). Saskatchewan Ministry of Agriculture. 2016. Saskatchewan Crop Report for the period November 15-21, 2016. (www.saskatchewan.ca/crop-report) Statistics Canada. 2016. Table 001-0010 - Estimated areas, yield, production and average farm price of principal field crops, in metric units, annual, CANSIM database: http://www5.statcan.gc.ca/cansim/a26?lang=eng&id=10010 (accessed: November 2, 2016)
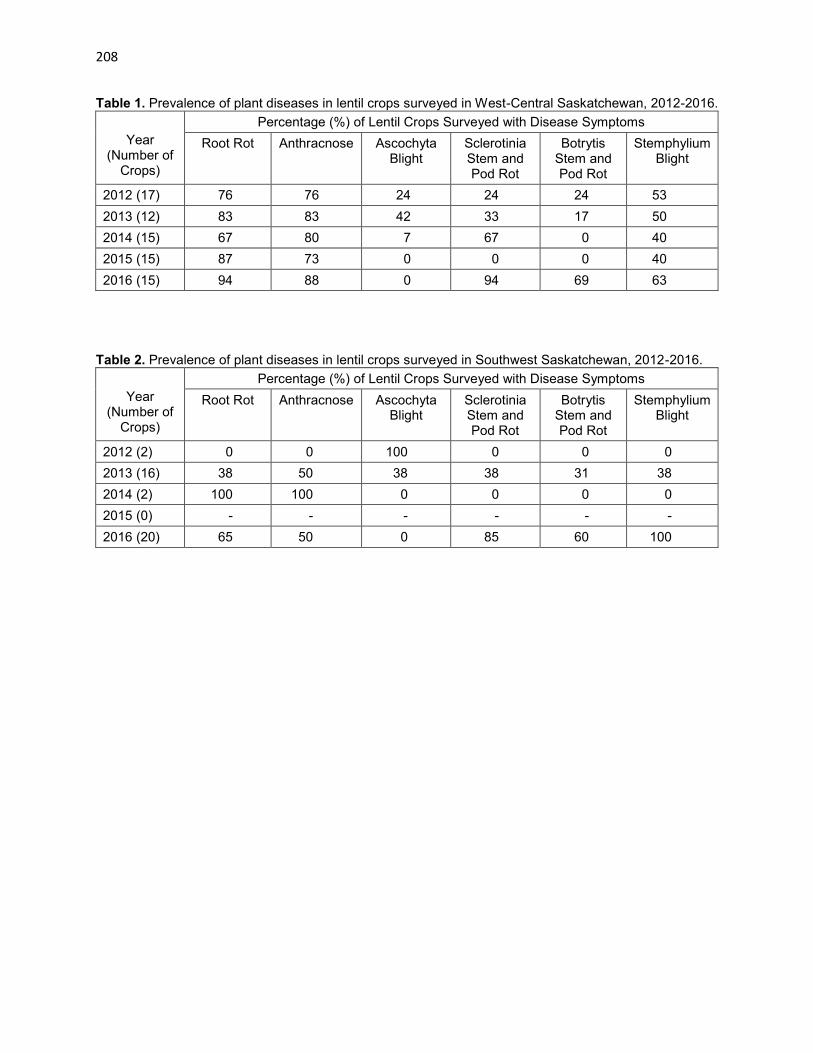
208
Table 1. Prevalence of plant diseases in lentil crops surveyed in West-Central Saskatchewan, 2012-2016.
Year (Number of
Crops)
Percentage (%) of Lentil Crops Surveyed with Disease Symptoms
Root Rot Anthracnose Ascochyta Blight
Sclerotinia Stem and Pod Rot
Botrytis Stem and Pod Rot
Stemphylium Blight
2012 (17) 76 76 24 24 24 53
2013 (12) 83 83 42 33 17 50
2014 (15) 67 80 7 67 0 40
2015 (15) 87 73 0 0 0 40
2016 (15) 94 88 0 94 69 63
Table 2. Prevalence of plant diseases in lentil crops surveyed in Southwest Saskatchewan, 2012-2016.
Year (Number of
Crops)
Percentage (%) of Lentil Crops Surveyed with Disease Symptoms
Root Rot Anthracnose Ascochyta Blight
Sclerotinia Stem and Pod Rot
Botrytis Stem and Pod Rot
Stemphylium Blight
2012 (2) 0 0 100 0 0 0
2013 (16) 38 50 38 38 31 38
2014 (2) 100 100 0 0 0 0
2015 (0) - - - - - -
2016 (20) 65 50 0 85 60 100
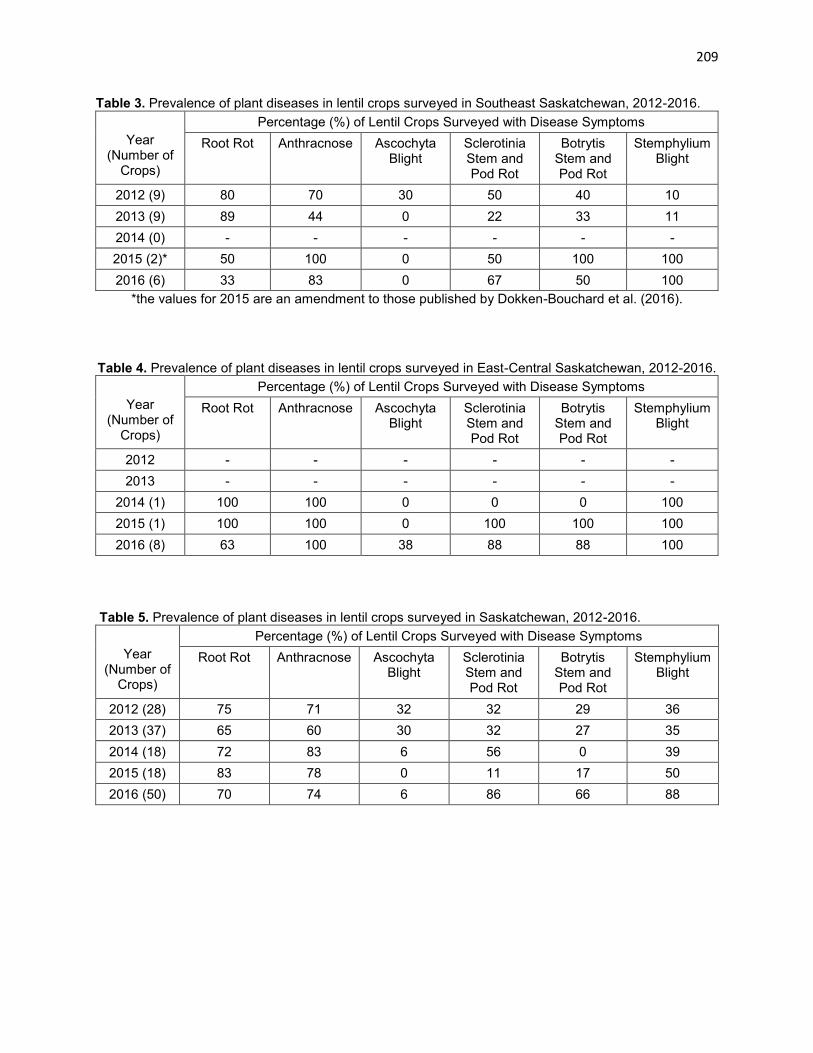
209
Table 3. Prevalence of plant diseases in lentil crops surveyed in Southeast Saskatchewan, 2012-2016.
Year (Number of
Crops)
Percentage (%) of Lentil Crops Surveyed with Disease Symptoms
Root Rot Anthracnose Ascochyta Blight
Sclerotinia Stem and Pod Rot
Botrytis Stem and Pod Rot
Stemphylium Blight
2012 (9) 80 70 30 50 40 10
2013 (9) 89 44 0 22 33 11
2014 (0) - - - - - -
2015 (2)* 50 100 0 50 100 100
2016 (6) 33 83 0 67 50 100
*the values for 2015 are an amendment to those published by Dokken-Bouchard et al. (2016).
Table 4. Prevalence of plant diseases in lentil crops surveyed in East-Central Saskatchewan, 2012-2016.
Year (Number of
Crops)
Percentage (%) of Lentil Crops Surveyed with Disease Symptoms
Root Rot Anthracnose Ascochyta Blight
Sclerotinia Stem and Pod Rot
Botrytis Stem and Pod Rot
Stemphylium Blight
2012 - - - - - -
2013 - - - - - -
2014 (1) 100 100 0 0 0 100
2015 (1) 100 100 0 100 100 100
2016 (8) 63 100 38 88 88 100
Table 5. Prevalence of plant diseases in lentil crops surveyed in Saskatchewan, 2012-2016.
Year (Number of
Crops)
Percentage (%) of Lentil Crops Surveyed with Disease Symptoms
Root Rot Anthracnose Ascochyta Blight
Sclerotinia Stem and Pod Rot
Botrytis Stem and Pod Rot
Stemphylium Blight
2012 (28) 75 71 32 32 29 36
2013 (37) 65 60 30 32 27 35
2014 (18) 72 83 6 56 0 39
2015 (18) 83 78 0 11 17 50
2016 (50) 70 74 6 86 66 88

210
CROP / CULTURE: Soybean (Glycine max (L.) Merr.) LOCATION / RÉGION: Southern Alberta NAMES AND AGENCIES / NOMS ET ÉTABLISSEMENTS R. Nyandoro1, N. Li2, K.F. Chang1, S.F. Hwang1, I. Akter1, H.U. Ahmed1, H. Fu1, S.E. Strelkov3, G.D. Turnbull1 and M.W. Harding4 1Crop Diversification Centre North, Alberta Agriculture and Forestry (AAF), Edmonton AB T5Y 6H3 Telephone: (780) 644-8352; Facsimile: (780) 422-6096; E-mail: [email protected] 2Shandong Centre of Crop Germplasm Resources, Jinan 250100, Shandong, China 3Department of Agricultural, Food and Nutritional Science, University of Alberta, Edmonton AB T6G 2P5 4Crop Diversification Centre South, AAF, Brooks AB T1R 1E6 TITLE / TITRE: THE OCCURRENCE OF SOYBEAN ROOT ROT IN SOUTHERN ALBERTA IN 2016 ABSTRACT: A survey was conducted during the period of August 17- 23, 2016, across 6 locations (Brooks, Duchess, Lethbridge, Medicine Hat, Seven Persons and Turin) in southern Alberta. The survey covered 29 soybean fields with 100 root samples collected per field. Root rot occurred at all locations with an average incidence of 90%, ranging from 25% to 100%and with an average severity of 2.0, ranging from 0.2 to 3.6. Nodulation also was assessed on a scale of 0-4 and averaged 1.9 with a range of 0-3.9 on a scale of 0-4. Species of Fusarium were most commonly isolated from infected root tissue (recovered from 85.5% of samples), followed by Pythium spp. (7.4%), Sclerotinia sclerotiorum (1.7%), Rhizoctonia solani (0.8%) and Phytophthora spp. (0.2%). INTRODUCTION: Soybean (Glycine max (L.) Merr.) has great potential for inclusion in the cropping systems of southern areas of western Canada (4). In southern Alberta, the area seeded to soybeans has increased from 283 ha in 2008 to about 6,000 ha in 2015 (Patrick Fabian, pers. comm.), and this is expected to continue to increase as early maturing and cold-tolerant cultivars become available. Root rot is, however, a common constraint in soybean production, and its occurrence has been documented in all soybean crops surveyed in southern Alberta in the past few years (2, 3, 6, 7, Fig. 1). Root rot has deleterious effects on plant stand, directly impacting productivity, and also allows invasive weed species to outgrow the crop causing significant reductions in yield and quality (2). A survey was conducted in August 2016 across southern Alberta to assess root rot and its impact on soybean crops. METHODS: The survey was conducted during August17- 23, 2016 when soybean crops were at the pod set to early pod filling stages. Root samples were collected from 29 soybean fields in six locations of southern Alberta: Brooks, Duchess, Seven Persons, Lethbridge, Medicine Hat, and Turin (Fig. 2). The samples were collected from five points in each field at the ends and elbows of W-shaped transects. Twenty plants were dug from the soil at each of the sampling points on the W-transect for a total of 100 root samples per soybean field. Soil samples were also collected outside the sampling points (primarily in low lying areas of the field) where the soybeans were observed to be severely stunted, yellowing, or dead. Soil samples were stored for future pathogen baiting experiments. Root samples were shaken gently to rid them of excess soil, sealed in plastic bags, and placed on ice in coolers in order to prevent rapid decomposition. At the end of each day, the root samples were placed in a 4°C cooler until the time of disease scoring. In the laboratory, the roots were washed gently under running water and then visually rated for root rot incidence and severity and nodulation on the 0-4 scales described by Chang et al. (2012). Microorganisms were isolated from infected root tissues using the method described by Chang et al. (2004) (1). Equal amounts of root rot tissues from soybean plants were tested for the presence of Phytophthora sojae using the selective medium PBNIC (5). RESULTS AND DISCUSSION: Root rot was observed in all 29 crops sampled, at a high incidence in most fields, but disease severity varied across the locations. Mean disease severity was highest (3.3) at Medicine Hat and lowest (1.4) at Brooks (Table 1). Root nodulation varied from 0.9 (Turin) to 2.8 (Seven Persons). Overall, root rot disease incidence and severity in the surveyed locations were higher in 2016 than in 2014 and 2015 (6, 7). Rainfall was greater in the 2016 cropping season relative to the previous years, which may have created conducive soil conditions for root rot disease development in the soybean crops.

211
The majority of the microorganisms isolated from roots exhibiting symptoms of root rot consisted of Fusarium (recovered from 85.5% of samples), followed by Pythium spp. (7.4%), Sclerotinia sclerotiorum (1.7%), Rhizoctonia solani (0.8%) and Phytophthora spp. (0.2%) (Table 2). Root rot caused extensive yellowing, stunting and mortality of the soybean plants in some low-lying areas. In cases of severe disease, the plants were easily pulled from the soil. Sclerotinia stem rot disease was observed in 12 of the 29 fields sampled, with the incidence of disease ranging from 0 to 19%. The disease was observed at 4 sites (Duchess, 19% incidence; Turin, 17.5%; Seven Persons, 14%, and Medicine Hat, 13%). No sclerotinia stem rot was observed at the Brooks or Lethbridge sites (Table 1). Nevertheless, the pathogen S. sclerotinia was isolated from infected roots at Brooks and Duchess (Table 2). This indicated that most of the pathogen inoculum could have originated from air-borne spores. The higher incidence of root rot and white mould in some fields in 2016 vs. 2015 was due in part to the higher accumulated precipitation (358.1 mm) during the 2016 growing season as compared with 2015 (113.5 mm). Bacterial blight also was observed in experimental plots at CDC South, but not in the fields sampled. ACKNOWLEDGEMENTS: This survey was financially supported by the Growing Forward 2 Program, the Government of Alberta, and the Manitoba Pulse and Soybean Growers. We gratefully acknowledge Mr. Patrick Fabian (Fabian Seed Farms Inc., Tilley, AB) for providing contact information for growers and information on field locations. We also acknowledge the support provided by staff from the Crop Diversification Centre North in Edmonton and the Crop Diversification Centre South in Brooks. REFERENCES: Chang, K.F., Bowness, R., Hwang, S.F., Turnbull, G.D., Howard, R.J., Lopetinsky, K., Olson, M. and Bing, D.J. 2005.Pea diseases in central Alberta in 2004. Can. Plant Dis. Surv. 85: 89–90. (www.phytopath.ca/cpds.shtml) Chang, K.F., Hwang, S.F., Yang, Y., Fu, H., Strelkov, S.E., Turnbull, G.D., Harding, M.W., and Bandara, M. 2016. The occurrence of soybean root rot in southern Alberta, Canada in 2015. Can. Plant Dis. Surv. 96: 196–199. Chang, K.F., Nyandoro, R., Howard, R.J., Hwang, S.F., Turnbull, G.D., Laflamme, P., Strelkov, S.E., and McLaren, D.L. 2013. Occurrence of soybean root rot in southern Alberta, Canada in 2011 and 2012. Can. Plant Dis. Surv. 93: 170–173. (www.phytopath.ca/cpds.shtml) Dorff, E. 2007. The soybean, agriculture’s jack-of-all-trades, is gaining ground across Canada (statcan.gc.ca) Dorrance, A.E., Berry, S.A., Anderson, T.R., and Mehang, C. 2008. Isolation, storage, pathotype characterization, and evaluation of resistance for Phytophthora sojae in soybean. Online. Plant Health Progress doi:10.1094/PHP-2008-0118-01-DG. Nyandoro, R., Chang, K.F., Hwang, S.F., Ahmed, H.U., Strelkov, S.E., Turnbull, G.D., and Harding, M.W. 2015. The occurrence of soybean root rot in southern Alberta, in 2014. Can. Plant Dis. Surv. 95: 182–184. (www.phytopath.ca/cpds.shtml) Nyandoro, R., Chang, K.F., Hwang, S.F., Strelkov, S.E., Turnbull, G.D., Howard, R.J., McLaren, D.L., and Conner, R.L. 2014. The occurrence of soybean root rot in southern Alberta, Canada in 2013. Can. Plant Dis. Surv. 94: 198–200. (www.phytopath.ca/cpds.shtml)

212
Table 1. Root rot incidence, severity and nodulation, and Sclerotinia disease in 29 soybean crops in southern Alberta in 2016.
Location No. of fields
surveyed
Root rot incidence (%)
Root rot severity (0-4)
Root nodulation
(0-4)
Sclerotinia incidence (%)
Range Mean Range Mean Range Mean Range
Mean
Brooks 10 25-100 80 0.2-2.7 1.4 0.0-3.9 1.3 0.0 0.0
Duchess 4 60-100 94 0.8-3.6 2.0 0.2-3.9 2.4 18-20 19
Lethbridge 1 95-100 99 1.1-2.8 2.1 0.5-2.6 1.9 0.0 0.0
Seven Persons
10 75-100 98 1.7-3.3 2.8 2.7-3.4 2.8 12-16 14
Medicine Hat
2 94-100 97 2.2-2.3 3.3 2.8-2.6 2.7 11-15 13
Turin 2 45-100 81 0.7-2.8 2.0 0.0-2.8 0.9 16-19 17.5
Total*/ Average
29* 25-100 90 0.2-3.6 2.0 0.0-3.9 1.9 0-20 8.7
Table 2. Incidence of microorganisms isolated from diseased root tissues of soybean plants collected in southern Alberta soybean fields in 2016.
Location No. of roots tested
Colony numbers of isolated microorganisms
Fusarium spp.
Phytoph-thora spp.x
Sclerotinia sclerotiorum
Pythium spp.
Rhizoctonia solani
Miscella- neousy
Brooks 500 303 0 10 31 4 11
Duchess 40 133 0 8 7 4 3
Lethbridge 10 30 1 0 11 0 2
Medicine Hat 20 69 1 0 6 0 3 Seven Persons 500 335 0 0 16 0 20
Turin 20 33 0 0 7 0 7
Total 1,090 903 2 18 78 8 46
Isolation (%) - 85.5 0.2 1.7 7.4 0.8 4.4 xPhytophthora spp. were isolated on PBNIC medium. All other fungi were isolated using PDA medium. yMiscellaneous fungi isolated included Alternaria spp., Pithomyces spp., Rhizopus spp. and Stemphylium spp.

213
Figure 1. Soybean plants affected by severe root rot and exhibiting premature yellowing in a field near Turin, AB, 2016.
Figure 2. Map showing the approximate locations of the surveyed soybean crops in southern Alberta in 2016.

214
CROP / CULTURE: Soybean LOCATION / RÉGION: Manitoba NAMES AND AGENCY: H. Derksen1, D. Lange2, T. Buss3, P.Bajracharya4, K. Podolsky5, I. Kristjanson6, T. Cummer4, M. Lewick7, D. Brar8, E. Mendoza9, A. Farooq10, R. Picard11, J. Gardiner12 and S.Kawthekar13
1Manitoba Agriculture, Box 1149, Carman MB R0G 0J0 Telephone: (204) 750-4248; Facsimile: (204) 745-5690; E-mail: [email protected] 2Manitoba Agriculture, Box 969, Altona MB R0G 0B0 3Manitoba Agriculture, Box 50, Beausejour MB R0E 0C0 4Manitoba Agriculture, Box 1149, Carman MB R0G 0J0 5Manitoba Pulse and Soybean Growers, Box 1760, Carman MB R0G 0J0 6Manitoba Agriculture, Box 100, Morris MB R0G 1K0 7Manitoba Agriculture, 536 Stephen St., Morden MB R6M 1T7 8Manitoba Agriculture, Box 2000, Arborg MB R0C 0A0 9Manitoba Agriculture, Unit C-284 Reimer Ave., Steinbach MB R5G 0R5 10Manitoba Agriculture, Box 50, Hamiota MB R0M 0T0 11Manitoba Agriculture, Box 189, Somerset MB R0G 2L0 12Manitoba Agriculture, Box 180, Pilot Mound MB R0G 1P0
13Manitoba Agriculture, 1129 Queens Ave., Brandon MB R7A 1L9 TITLE: SURVEY OF SOYBEAN DISEASES IN MANITOBA IN 2016 ABSTRACT: A total of 55 soybean crops at the V2 toV3 (two trifoliates/three nodes to three trifoliates/ two nodes) stage were surveyed in Manitoba for the prevalence and incidence of foliar and root diseases. A total of 82 soybean crops at the R5 to R6 (beginning seed to full seed) stage were surveyed for the prevalence and incidence of phytophthora root rot and prevalence, incidence and severity of bacterial blight, septoria brown spot, downy mildew, white mould, pod/stem blight, and anthracnose. At the later survey timing, bacterial blight and septoria brown spot were the most prevalent diseases throughout the province. Symptoms of soybean cyst nematode were not observed in the 2016 disease survey. METHODS: A provincial soybean survey coordinated by Manitoba Agriculture and Manitoba Pulse and Soybean Growers was conducted for the first time in 2016. All results are based on visual assessment of diseases within the surveyed crops. A total of 55 fields were surveyed at the “early” stage (V2-V3 stage). Plants in these fields were given a presence/absence rating for general foliar disease and a presence/absence rating for general root disease. A total of 82 fields were surveyed at the “late” stage (R5-R6 stage). Plants at this timing weregiven incidence and severity ratings for bacterial blight, septoria brown spot, downy mildew, white mould, pod/stem blight, and anthracnose and an incidence rating for phytophthora root rot. Severity for foliar disease was rated on a 0-5 scale (0-no symptoms; 1-trace symptoms; 2-symptoms in lower canopy; 3-symptoms in mid-upper canopy; 4-severe symptoms in mid-upper canopy; 5-severe symptoms in mid-upper canopy with defoliation) (Bisht et al. 2014). The survey focused on areas with longer histories of soybean production with fewer fields being surveyed in areas newer to soybean production (Table 1). RESULTS (EARLY SURVEY): Foliar disease was present in 91% of the fields surveyed (Table 2). The prevalence was highest in the eastern/interlake region (94%) and lowest in the southwest (75%). The provincial average incidence of foliar disease was 30%. The incidence was highest in the central region (37%) and lowest in the southwest (19%). Root disease was present in 58% of the fields surveyed (Table 2). The prevalence was highest in the central region (70%) and lowest in the southwest (38%). The provincial average incidence of root disease was 8%. The incidence was highest in the eastern/interlake region (9%) and lowest in the southwest (2%).

215
RESULTS (LATE SURVEY): Bacterial blight was present in 87% of the fields surveyed (Table 3). The prevalence was highest in the southwest region (100%) and lowest in the central region (84%).The provincial average incidence of bacterial blight was 49%. The incidence was highest in the eastern/ interlake region (63%) and lowest in the southwest (24%). The average severity of bacterial blight was 1.7. The severity was highest in the central region (1.8) and the lowest in the southwest (1.4). Septoria brown spot was present in 98% of the fields surveyed (Table 3). The prevalence was highest in the southwest and eastern/interlake regions (100%) and lowest in the central region (95%). The provincial average incidence of septoria brown spot was 57%. The incidence was highest in the eastern/interlake region (74%) and lowest in the southwest (18%). The average severity of septoria brown spot was 1.6. The severity was highest in the eastern/interlake region (1.6) and the lowest in the central and southwest regions (1.5). Downy mildew was present in 39% of the fields surveyed (Table 4). The prevalence was highest in the central region (58%) and lowest in the southwest (11%). The provincial average incidence of downy mildew was 35%. The incidence was highest in the central region (39%) and lowest in the southwest (2%). The average severity of downy mildew was 1.5. The severity was highest in the central region (1.6) and the lowest in the southwest (1.0). White mould was present in 33% of the fields surveyed (Table 4). The prevalence was highest in the central region (37%) and lowest in the southwest (11%). The provincial average incidence of white mould was 9%. The incidence was highest in the central region (9%) and lowest in the southwest (5%). The average severity of white mould was 2.8. The severity was highest in the southwest region (3.6) and the lowest in the eastern/interlake region (2.6). Pod/stem blight was present in 9% of the fields surveyed (Table 5). The prevalence was highest in the eastern/interlake region (17%) and lowest in the southwest (0%). The provincial average incidence of pod/stem blight was 11%. The incidence was highest in the eastern/interlake region (15%) and lowest in the southwest (0%). The average severity of pod/stemblight was 1.5. The severity was highest in the eastern/interlake region (1.7) and did not occur in the southwest region. Visual symptoms of anthracnose were present in 10% of the fields surveyed (Table 5). Symptomatic plant samples were not assessed in the laboratory for fungal isolation and identification to confirm the visual disease identification. The prevalence was highest in the central region (11%) and lowest in the eastern/interlake region (3%). The provincial average incidence of anthracnose was 2%. The incidence was highest in the eastern/interlake region (5%) and lowest in the central region (1%). The average severity of anthracnose was 1.7. The severity was highest in the central region (1.8) and the lowest in the southwest (1.0). Plant samples symptomatic of phytophthora root rot (PRR) were found in 59% of the fields surveyed (Table 6). The prevalence was highest in the eastern/interlake region (73%) and lowest in the southwest (22%). The provincial average incidence of plants symptomatic of PRR was 7%. The incidence was highest in the central and southwest regions (8%) and lowest in the eastern/interlake region (7%). Severity ratings were not taken for PRR. Symptomatic plant samples were not assessed in the laboratory for fungal isolation and identification to confirm the visual disease identification. A separate survey conducted by McLaren et al. in 2016 and reported in this issue of CPDS indicated that 38% of fields surveyed were confirmed through laboratory assessment and molecular detection techniques to be positive for the presence of Phytophthora sojae. Visual detection of this disease can be difficult and therefore, in this report, plants symptomatic of PRR in 59% of the 82 crops surveyed may be on the high side without confirmation of the presence of the pathogen. REFERENCES: Bisht, V., K. Podolsky, G. Bartley, & A. Iverson. 2014. 2014 Soybean Disease Survey & Extension. Manitoba Agronomists Conference 2014 – Agronomists & Biosecurity: Managing the Risks. ACKNOWLEDGEMENTS: This survey work was coordinated with research being conducted by Agriculture and Agri-Food Canada and Brandon University.

216
Table 1. Number of fields surveyed by crop reporting district in Manitoba.
Region Early Survey Late Survey
Central 30 43
Eastern/Interlake 17 30
Southwest 8 9
Provincial Total 55 82
Table 2. Manitoba 2016 soybean disease survey results at early-season survey timing (V2-V3 stage).
Region
(No. of Crops)
Foliar Disease Root Disease
Prevalence Inc1 (Inc2) Prevalence Inc1 (Inc2)
Central (30) 93 37 (35) 70 8 (6)
Eastern/Interlake (17) 94 22 (21) 47 9 (4)
Southwest (8) 75 19 (14) 38 2 (1)
Provincial Total (55) 91 30 (27) 58 8 (4)
1Average percent incidence of disease in soybean crops infected with the given disease. 2Average percent incidence of disease in all soybean crops with and without the given disease. Table 3. Manitoba 2016 soybean disease survey results for bacterial blight and septoria brown spot at late-season survey timing (R5-R6).
Region (No. of Crops) Bacterial Blight Septoria Brown Spot
Prevalence Inc1 (Inc2) Severity3 Prevalence Inc1 (Inc2)
Severity3
Central (43) 84 44 (37) 1.8 95 53 (51) 1.5
Eastern/Interlake (30) 87 63 (55) 1.6 100 74 (74) 1.6
Southwest (9) 100 24 (24) 1.4 100 18 (18) 1.5
Provincial Total (82) 87 49 (42) 1.7 98 57 (56) 1.6
1Average percent incidence of disease in soybean crops infected with the given disease. 2Average percent incidence of disease in all soybean crops with and without the given disease. 3Average severity of disease in soybean crops infected with the given disease.

217
Table 4. Manitoba 2016 soybean disease survey results for downy mildew and white mould at late-season survey timing (R5-R6).
Region (No. of Crops) Downy Mildew White Mould
Prevalence Inc1 (Inc2) Severity3 Prevalence Inc1 (Inc2)
Severity3
Central (43) 58 39 (22) 1.6 37 9 (3) 3.0
Eastern/Interlake (30) 27 25 (7) 1.2 33 8 (3) 2.6
Southwest (9) 11 2 (0.2) 1.0 11 5 (1) 3.6
Provincial Total (82) 39 35 (14) 1.5 33 9 (3) 2.8 1Average percent incidence of disease in soybean crops infected with the given disease. 2Average percent incidence of disease in all soybean crops with and without the given disease. 3Average severity of disease in soybean crops infected with the given disease. Table 5. Manitoba 2016 soybean disease survey results for pod/stem blight and anthracnose at late-season survey timing (R5-R6).
Region (No. of Crops) Pod/Stem Blight Anthracnose
Prevalence Inc1 (Inc2) Severity3 Prevalence Inc1 (Inc2)
Severity3
Central (43) 7 2 (0.1) 1.3 14 1 (0.1) 1.8
Eastern/Interlake (30) 17 15 (2) 1.7 3 5 (0.2) 1.4
Southwest (9) 0 0 (0) n/a 11 3 (0.3) 1.0
Provincial Total (82) 9 11 (9) 1.5 10 2 (0.2) 1.7
1Average percent incidence of disease in soybean crops infected with the given disease. 2Average percent incidence of disease in all soybean crops with and without the given disease. 3Average severity of disease in soybean crops infected with the given disease. Table 6. Manitoba 2016 soybean disease survey results for phytophthora root rot at late-season survey timing (R5-R6).
Region (No. of Crops) Prevalence Inc1 (Inc2)
Central (43) 56 8 (4)
Eastern/Interlake (30) 73 7 (5)
Southwest (9) 22 8 (2)
Provincial Total (82) 59 7 (4)
1Average percent incidence of disease in soybean crops infected with the given disease. 2Average percent incidence of disease in all soybean crops with and without the given disease.

218
CROP / CULTURE: Soybean LOCATION / RÉGION: CROP: Manitoba NAMES AND AGENCIES / NOMS ET ÉTABLISSEMENTS Y.M. Kim1 , D.L. McLaren1, R.L. Conner2, K.F. Chang3, S.F. Hwang3, T.L. Henderson1, W.C. Penner2 and T.J. Kerley1
1Agriculture and Agri-Food Canada (AAFC) Research Centre, 2701 Grand Valley Road, Brandon MB R7A 5Y3 Telephone: (204) 578-6561; Facsimile: (204) 578-6524; E-mail: [email protected] 2AAFC Research Station, Unit 101, Route 100, Morden MB R6M 1Y5 3Alberta Agriculture and Rural Development, Crop Diversification Centre-North, 17507 Fort Road N.W., Edmonton AB T5Y 6H3 TITLE: SOYBEAN ROOT ROT AND PHYTOPHTHORA ROT IN MANITOBA IN 2015 ABSTRACT: In 2015, 40 soybean crops were surveyed in Manitoba for root diseases and fusarium root rot was the most prevalent root disease. Root rot was severe in low-lying areas of some fields, indicating that seed yield and quality may have been affected. INTRODUCTION: Soybean production continues to increase with 354,000 ha (875,000 acres), 428,000 ha (1,058,000 acres), 525,700 ha (1,299,000 acres) and 526,100 ha (1,300,000 acres) seeded in Manitoba in 2012, 2013, 2014 and 2015, respectively (Manitoba Pulse Growers Association 2014; Statistics Canada 2015). This represents the eighth consecutive annual increase in soybean production in Manitoba. Root rot is a constraint in other areas of Canada where soybean production is established (Chang et al. 2013; OMAFRA 2011) and this disease complex may become more of an issue in Manitoba as soybean production continues to expand. METHODS: Soybean crops were surveyed for root diseases at 40 different locations in Manitoba in 2015. The crops surveyed were randomly chosen from regions in south-central and southwest Manitoba where soybean is commonly grown.
The survey for root diseases was conducted during mid- to late-July when most plants were at the early flowering stage. At least ten plants were sampled by uprooting them at each of three random sites in each crop surveyed. Root diseases were rated on a scale of 0 (no disease) to 9 (death of plant). To confirm the visual disease identification, 15 symptomatic roots were collected from each of the 40 crops for fungal isolation and identification. Identification of Fusarium species involved visual assessment, microscopic examination and morphological characterization using the criteria of Leslie and Summerell (2006). Fifteen roots from each of the 40 soybean crops surveyed were frozen for future PCR analysis of root rot pathogens. All crops that were surveyed for root rot in July were re-assessed in mid- to late August for phytophthora rot. Twenty-three additional crops were also included in the late season survey, which was conducted when most plants were at the R6 stage (APS Press 1999). Soybean plants that were symptomatic for phytophthora root and stem rot were collected for further assessment in the laboratory. Approximately 200 stems were placed on different selective media to identify Phytophthora spp. based on morphological characteristics (Gallegly and Hong 2008). Tissue samples from symptomatic plants were frozen for molecular detection of pathogens at a later date. RESULTS AND COMMENTS: Favourable environmental conditions resulted in an early start to the 2015 growing season, with some early-seeded soybeans being reported (Manitoba Agriculture Food and Rural Development 2015a). Soybeans in many regions of the province responded well to good growing conditions in late June and into July and early August. Some fields that missed thundershowers in early August showed symptoms of moisture stress and premature senescence ((Manitoba Agriculture, Food and Rural Development 2015b). However crop yields were reported to be slightly above long term averages (Manitoba Agriculture, Food and Rural Development 2015c).

219
Root rot was observed in all soybean crops surveyed in July 2015. The microorganisms most frequently isolated from roots of infected plants belonged to Fusarium spp. (Table 1). Thirty-nine crops in which Fusarium spp. were isolated had root rot severity ratings that ranged from 1.3 to 6.7 with a mean of 4.3. Rhizoctonia root rot (Rhizoctonia solani) was not detected in any of the crops surveyed in 2015. The low recovery rate of R. solani in 2013 and lack of recovery in 2014 and 2015, suggest that in Manitoba this fungus may not be as important a root rot pathogen of soybean as are Fusarium spp., in contrast with other regions in western Canada (Chang et al. 2013). Pythium root rot was identified in five soybean crops with root rot ratings ranging from 2.1 to 5.9 and a mean of 3.8. Phytophthora rot was identified in 3% (2/63) of fields surveyed in mid-August (Table 1). Each symptomatic plant that was positive for Phytophthora spp. had a discoloured taproot with lesions that progressed up the stem. Although symptomatic plants were collected from 16 soybean crops, many samples were not able to be processed immediately making isolation of Phytophthora spp. more challenging. Molecular detection methods to confirm the presence of Phytophthora spp. from the surveyed crops are currently in progress. This disease is more common in heavy textured soils that are subject to saturation and flooding such as those in the Red River Valley. In addition, soybeans have been grown longer in this region. Favorable weather (cool and wet) contributes to the occurrence of phytophthora rot as motile zoospores, the primary infective units, are produced under cool conditions when the soil is saturated. In late July, hot, humid weather conditions were common in many areas of soybean production (Manitoba Agriculture, Food and Rural Development 2015d) and this may have contributed to the reduced risk from this disease. REFERENCES: APS Press. 1999. Compendium of Soybean Diseases. Fourth edition. The American Phytopathological Society, St. Paul, MN 55121-2097. USA. 100 pp. Chang, K.F., Nyandoro, R., Howard, R.J., Hwang, S.F., Turnbull, G.D., Laflamme, P., Strelkov, S.E. and McLaren, D.L. 2013. Occurrence of soybean root rot in southern Alberta, Canada in 2011 and 2012. Can. Plant Dis. Surv. 93: 170-173. Gallegly M.E., C. Hong. 2008. Phytophthora: Identifying Species by Morphology and DNA Fingerprints.
APS Press. American Phytopathological Society, St. Paul, MN. USA.
Leslie J.F. and Summerell B.A. (2006). The Fusarium Laboratory Manual. Blackwell Publishing Ltd, Iowa. 388 pp. Manitoba Agriculture, Food and Rural Development (MAFRD). Crop report. Issue 2, May 11, 2015a. (www.gov.mb,.ca/agriculture/crops/seasonal-reports/crop-report-archive/2015-05-11-crop-report.html) Manitoba Agriculture, Food and Rural Development (MAFRD). Crop report. Issue 17, August 24, 2015b. (www.gov.mb,.ca/agriculture/crops/seasonal-reports/crop-report-archive/2015-08-24-crop-report.html) Manitoba Agriculture, Food and Rural Development (MAFRD). Crop report. Issue 24, October 13, 2015c. (www.gov.mb,.ca/agriculture/crops/seasonal-reports/crop-report-archive/2015-10-13-crop-report.html) Manitoba Agriculture, Food and Rural Development (MAFRD). Crop report. Issue 13, July 27, 2015d. (www.gov.mb,.ca/agriculture/crops/seasonal-reports/crop-report-archive/2015-07-27-crop-report.html) Manitoba Pulse Growers Association 2014. The Bean Report: Pulses in Manitoba. (www.manitobapulse.ca/pulses-in-manitoba). Ontario Ministry of Agriculture, Food and Rural Affairs (OMAFRA). 2011. Agronomy Guide for Field Crops: Soybean Diseases. Publication #811. 28 pp. (http://www.omafra.gov.on.ca/english/crops/pub811/14soybean.htm)

220
Statistics Canada. 2015. Principal field crops areas, June 2015. (www.statcan.gc.ca/daily-quotidien/150630/dq150630b-eng.htm) Table 1. Prevalence and severity of root diseases in 40 crops of soybean in July and prevalence of phytophthora rot in 63 crops of soybean in August 2015.
Disease Severity (0-9)1
Disease No. Crops Affected Mean Range
Fusarium root rot 39 4.3 1.3-6.7
Pythium root rot 5 3.8 2.1-5.9
Rhizoctonia root rot 0 0 0
Phytophthora rot 2 n/a n/a
1All diseases, excluding phytophthora rot, were rated on a scale of 0 (no disease) to 9 (death of plant). Mean values are based only on crops in which the disease was observed.

221
CROP / CULTURE: Soybean LOCATION / RÉGION: Manitoba NAMES AND AGENCIES: Y.M. Kim1, D.L. McLaren1, R.L. Conner2, K.F. Chang3, S.F. Hwang3, T.L. Henderson1, W.C. Penner2, T.J. Kerley1, D. Lange4, L. Grenkow5 and S. Kawthekar6
1Agriculture and Agri-Food Canada (AAFC) Research and Development Centre, 2701 Grand Valley Road, Brandon MB R7A 5Y3 Telephone: (204) 578-6561; Facsimile: (204) 578-6524; E-mail: [email protected] 2AAFC Research and Development Centre, Unit 101, Route 100, Morden MB R6M 1Y5 3Alberta Agriculture and Rural Development, Crop Diversification Centre-North, 17507 Fort Road N.W., Edmonton AB T5Y 6H3 4Manitoba Agriculture, Box 969, 67-2nd Street NE, Altona MB R0G 0B0 5Manitoba Pulse and Soybean Growers, Box 1760, Carman MB R0G 0J0 6Manitoba Agriculture, 1129 Queens Avenue, Brandon MB R7A 1L9
TITLE / TITRE: SOYBEAN ROOT ROT AND PHYTOPHTHORA ROT IN MANITOBA IN 2016
ABSTRACT: In 2016, 40 soybean crops were surveyed in Manitoba for root diseases and fusarium root rot was the most prevalent root disease. Root rot was severe in low-lying areas of some fields, indicating that seed yield and quality may have been affected.
INTRODUCTION: Soybean production continues to increase with 428,000 ha (1,058,000 acres), 525,700 ha (1,299,000 acres), 526,100 ha (1,300,000 acres) and 647,500 ha (1,600,000 acres) seeded in Manitoba in 2013, 2014, 2015 and 2016, respectively (Manitoba Pulse and Soybean Growers 2016; Statistics Canada 2016). This represents the ninth consecutive annual increase in soybean production in Manitoba. Root rot is a constraint in other areas of Canada where soybean production is established (Chang et al. 2013; OMAFRA 2011) and this disease complex may become more of an issue in Manitoba as soybean production continues to expand.
METHODS: Soybean crops were surveyed for root diseases at 40 different locations in Manitoba in 2016. The crops surveyed were randomly chosen from regions in south-central and southwest Manitoba, where soybean is commonly grown.
The survey for root diseases was conducted during mid-July when most plants were at the early pod stage. At least ten plants were sampled by uprooting them at each of three random sites in each crop surveyed. Root diseases were rated on a scale of 0 (no disease) to 9 (death of plant). To confirm the visual disease identification, 15 symptomatic roots were collected from each of the 40 crops for fungal isolation and identification. Identification of Fusarium species involved visual assessment, microscopic examination and morphological characterization using the criteria of Leslie and Summerell (2006). Fifteen roots from each of the 40 soybean crops surveyed were frozen for future PCR analysis of root rot pathogens. All crops that were surveyed for root rot in July were re-assessed for phytophthora rot in mid-August when most plants were at the pod yellowing (R7) stage (APS Press 1999). Approximately 37 additional crops were also included in the late season survey. Soybean plants that were symptomatic for phytophthora root and stem rot were collected for further assessment in the laboratory. Approximately 250 stems were placed on different selective media to identify Phytophthora spp. based on its morphological characteristics (Gallegly and Hong 2008). Tissue samples from symptomatic plants were frozen for molecular detection of pathogens at a later date. RESULTS AND COMMENTS: Cool temperatures and scattered showers delayed soybean seeding for many producers in 2016. However, in some areas, warmer, drier conditions prevailed, which led to an early start of spring seeding (Manitoba Pulse and Soybean Growers 2016). Variable weather throughout the season with warm, dry periods and sudden thunderstorms or heavy rainfall events proved challenging for crop production (Manitoba Agriculture 2016a). Higher yields were obtained in areas receiving timely precipitation, with lower yields generally a result of excess moisture or extreme weather events (Manitoba Agriculture 2016b).

222
Root rot was observed in all 40 soybean crops surveyed in July 2016. The microorganisms most frequently isolated from roots of infected plants belonged to Fusarium spp. (Table 1). Forty crops in which Fusarium spp. were isolated had root rot severity ratings that ranged from 3.4 to 7.7 with a mean of 5.6. Rhizoctonia root rot (Rhizoctonia solani) was not confirmed in any of the crops surveyed in 2016. The low recovery rate of R. solani in 2013 and lack of recovery in 2014, 2015 and 2016 suggest that in Manitoba this fungus may not be as important a root rot pathogen of soybean as are Fusarium spp., in contrast with other regions in western Canada (Chang et al. 2013). Pythium root rot was not detected in any soybean crops surveyed in 2016. To date, phytophthora rot has been identified in 38% (15/40) of fields surveyed in mid-August for this disease (Table 1). Each symptomatic plant that was positive for Phytophthora spp. had a discoloured taproot with lesions that progressed up the stem. Plant samples were also obtained from an additional 37 crops, but few were symptomatic of the disease and when selected samples were processed for isolation, no phytophthora rot was detected. Molecular detection methods to confirm the presence/absence of Phytophthora spp. from the surveyed crops are currently in progress. REFERENCES: APS Press. 1999. Compendium of Soybean Diseases. Fourth edition. The American Phytopathological Society, St. Paul, MN 55121-2097. USA. 100 pp. Chang, K.F., Nyandoro, R., Howard, R.J., Hwang, S.F., Turnbull, G.D., Laflamme, P., Strelkov, S.E. and McLaren, D.L. 2013. Occurrence of soybean root rot in southern Alberta, Canada in 2011 and 2012. Can. Plant Dis. Surv. 93: 170-173. Gallegly M.E.and Hong, C. 2008. Phytophthora: Identifying Species by Morphology and DNA
Fingerprints. APS Press. American Phytopathological Society, St. Paul, MN. USA. 168 pp.
Leslie J.F. and Summerell B.A. 2006. The Fusarium Laboratory Manual. Blackwell Publishing Ltd, Iowa. 388 pp. Manitoba Agriculture. 2016a. Crop report. Issue 12, July 18, 2016. (www.gov.mb,.ca/agriculture/crops/seasonal-reports/crop-report-archive/2016-07-18-crop-report.html) Manitoba Agriculture. 2016b. Crop report. Issue 24, October 17, 2016. (www.gov.mb,.ca/agriculture/crops/seasonal-reports/crop-report-archive/2016-10-17-crop-report.html) Manitoba Pulse and Soybean Growers 2016. The Bean Report: No. 1, May 13, 2016. (www.manitobapulse.ca/wp-content/uploads/2016/05/2016.05.13-Bean-Report.pdf). Ontario Ministry of Agriculture, Food and Rural Affairs (OMAFRA). 2011. Agronomy Guide for Field Crops: Soybean Diseases. Publication #811. 28 pp. (http://www.omafra.gov.on.ca/english/crops/pub811/14soybean.htm) Statistics Canada. 2016. Principal field crops areas, June 2016. (www.statcan.gc.ca/daily-quotidien/160629/dq160629a-eng.htm)
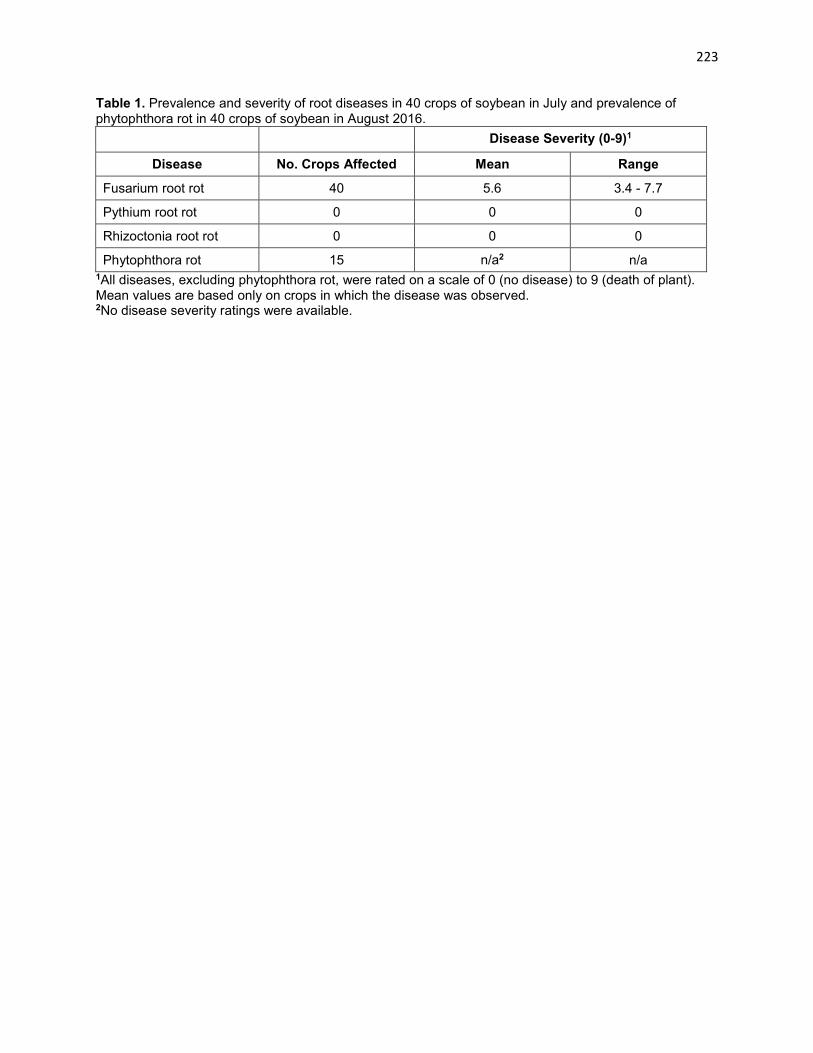
223
Table 1. Prevalence and severity of root diseases in 40 crops of soybean in July and prevalence of phytophthora rot in 40 crops of soybean in August 2016.
Disease Severity (0-9)1
Disease No. Crops Affected Mean Range
Fusarium root rot 40 5.6 3.4 - 7.7
Pythium root rot 0 0 0
Rhizoctonia root rot 0 0 0
Phytophthora rot 15 n/a2 n/a 1All diseases, excluding phytophthora rot, were rated on a scale of 0 (no disease) to 9 (death of plant). Mean values are based only on crops in which the disease was observed. 2No disease severity ratings were available.

224
CROP / CULTURE: Sunflower LOCATION / RÉGION: Manitoba NAMES AND AGENCY / NOMS ET ÉTABLISSEMENTS K. Y. Rashid1, T. Turner2 and M.P. Pradhan3 1Agriculture and Agri-Food Canada Research and Development Centre, 101 Route 100, Morden MB R6M 1Y5 Telephone: (204) 822-7520; Facsimile: (204) 822-7507; E-mail: [email protected] 2National Sunflower Association of Canada, 38-4th Avenue N.E., Box 1296 Carman MB R0G 0J0 3Manitoba Agriculture, Crop Diagnostic Centre, 201-545 University Crescent, Winnipeg MB R3T 5S6 TITLE / TITRE: DISEASES OF SUNFLOWER IN MANITOBA IN 2016 ABSTRACT: A survey of 40 sunflower crops in Manitoba in 2016 revealed that sclerotinia wilt/basal stem rot was the most prevalent disease in 94% of the crops followed by verticillium wilt in 78%, sclerotinia head rot in 63%, rust in 56%, septoria leaf spot in 53%, phoma stem lesions in 41%, and downy mildew in 31%. Disease severity ranged from low to moderate with no severe epidemics. METHODS: A total of 40 sunflower crops were surveyed in 2016 in Manitoba. Fifteen crops were surveyed in the third week of August, 12 in the fourth week of August, and 13 in the first week of September. The crops were surveyed along pre-planned routes in the major areas of sunflower production in southern Manitoba. Each crop was sampled by two persons walking ~100 m in opposite directions to each other following an "M" pattern in the field. Diseases were identified by symptoms and the percent incidences of downy mildew (Plasmopara halstedii), sclerotinia wilt or head and stem infections (Sclerotinia sclerotiorum), rhizopus head rot (Rhizopus spp.), and verticillium wilt (Verticillium dahliae) were estimated. Disease severity for rust (Puccinia helianthi), leaf spots (Septoria helianthi and Alternaria spp.), powdery mildew (Erysiphe cichoracearum) and stem diseases (Phoma spp. and Phomopsis spp.) were estimated as percent leaf or stem area infected. A disease index was calculated for each disease in every crop based on disease incidence or disease severity (Table 1). Stand establishment, vigour, and maturity were rated on a scale of 1 to 5 (I = very good/early, and 5 = very poor/very late). In addition, eight samples of downy mildew-infected plants were submitted by the National Sunflower Association of Canada from crops surveyed early in the season for downy mildew race identification, and 11 samples of sunflower plants were submitted for analysis to the Crop Diagnostic Centre of Manitoba Agriculture by agricultural representatives and growers.
RESULTS AND COMMENTS: Ninety-seven percent of the sunflower crops surveyed in 2016 had excellent to good stands, but only 72% had good vigour, and the rest had fair to poor vigor. Only 81% of the sunflower crops were early maturing, and the remaining 19% were late to very late (Table 1). The crops surveyed were split 60:40% between confectionery and oilseed hybrids, thus showing a decrease in the confection acreage in 2016 in comparison with previous years (1, 2, 3). The 2015 growing season started with above normal soil moisture, and this contributed to the decrease in the area seeded to sunflower in Manitoba (~30,000 ha in 2016 in comparison with 41,000 ha in 2015 (Statistics Canada 2016). Growing conditions were relatively normal throughout the growing season with above normal precipitation throughout the summer. Low disease incidence and severity were observed in 2016 for rust and downy mildew in comparison with previous years (1, 2, 3). Sclerotinia wilt/basal stem rot was present in 94% of the crops surveyed in 2016, mostly at trace to 5% disease incidence (Table 1). Sclerotinia head rot and mid-stem infections, caused by airborne ascospores, were observed at trace to 5% levels in most of the 63% of infested crops. The prevalence and incidence of head rot in 2016 were high in comparison with 2015 due to the above normal soil moisture conditions in 2016 which favoured root infection by mycelia and ascospores production for head infections (1).

225
Rust was present in 56% of the crops surveyed, with severity ranging from trace to 5% leaf area affected in most fields but as high as 30% leaf area affected in a few crops (Table 1). Rust infections started relatively late in 2016 and did not develop rapidly in most of the crops surveyed. Preliminary analysis of the rust isolates collected indicates the prevalence of races 777, 735, 727, 357, and 377 of P. helianthi, which are virulent on most commercial sunflower hybrids. The predominant race of the 2016 rust population was race 777, similar to 2015 (1). Rust incidence and severity in 2016 were lower than in 2015 (1, 2), and were probably due to the late onset of infection and the normal temperatures in July and August. Verticillium wilt was present in 78% of the crops surveyed in 2016 with traces to 5% severity in the oilseed hybrids, and 10-20% severity in the confection sunflower hybrids (Table 1). The incidence and severity of verticillium wilt were lower in 2016 than in 2015 (1). Downy mildew was observed in 31% of the crops in 2016 close to the 29% in 2015, two years of low records of this disease (Table 1). The incidence ranged from trace to 2% at a record low in 2016, especially in the eight crops surveyed early in the season for downy mildew. Preliminary analysis of isolates collected indicates the predominance of race-group 700 (88%) followed by races 776 (38%), 732 (21%), 722 (17%), 702 (8%), and 766 (4%). A total of 43% of the downy mildew isolates collected in 2016 are either insensitive or partially insensitive to metalaxyl seed treatment, a little lower than levels reported in previous years (1, 2, 3). Downy mildew was less prevalent in 2016 and 2015 than in 2014 and was at trace levels in most crops perhaps due to normal soil moisture at the seedling stage and the wide use of downy mildew resistant hybrids (1, 2, 3). Traces to 5% leaf area infected by Septoria helianthi were observed in 53% of the crops as well as some infection by Alternaria spp. in a few crops (Table 1) with higher severity and prevalence than previous years (1, 2, 3). Traces to 5% of stem lesions caused by Phoma spp. were observed in 41% of the crops and traces to 1% of Phomopsis spp. were present in 16% of the crops surveyed in 2016, similar to 2012-2015 but considerably lower than those prior to 2012 (1, 2, 3). Traces to 1% infestation with the sunflower beetle (Zygogramma exclamationis) were observed in a few crops. Infestations at trace to 1% levels with sunflower midge (Contarinia schulzi) were encountered in 25% of the crops. Traces of infestation with grasshoppers were observed in a few crops. Moderate infestations by aphids were encountered in a few crops in 2016. All the seven sunflower diseased samples submitted by the NSAC were diagnosed as having downy mildew. Of the 11 samples received by the Manitoba Agriculture Crop Diagnostic Centre in 2016, one was affected by fusarium root rot, one with Pythium root rot, two by alternaria leaf spot; two by phomopsis stem canker, one by sclerotinia head rot, one by sclerotinia stalk rot, and three with herbicide injury. ACKNOWLEDGMENTS: The technical assistance of Tricia Cabernel and Maurice Penner is gratefully acknowledged. REFERENCES: Rashid, K. Y., Turner, T., and Pradhan, M.P. 2016. Diseases of sunflower in Manitoba in 2015. Can. Plant Dis. Surv. 96:200-202. (www.phytopath.ca/cpds.shtml).
Rashid, K. Y., and Desjardins, M.L. 2015. Diseases of sunflower in Manitoba in 2014. Can. Plant Dis. Surv. 95:185-187. (www.phytopath.ca/cpds.shtml).
Rashid, K. Y., and Desjardins, M.L. 2014. Diseases of sunflower in Manitoba in 2013. Can. Plant Dis. Surv. 94:203-205. (www.phytopath.ca/cpds.shtml).
Rashid, K. Y., and Desjardins, M.L. 2013. Diseases of sunflower in Manitoba in 2012. Can. Plant Dis. Surv. 93:161-162. (www.phytopath.ca/cpds.shtml). Statistics Canada. 2016. Principle field crop areas, June 2016. (/www.statcan.gc.ca/daily-quotidien/160629/dq160629a-eng.htm)

226
Table 1. Prevalence and index of diseases in 40 crops of sunflower in Manitoba in 2016, eight of which were surveyed early for downy mildew only.
Disease Crops Affected Disease Index1
No. of crops % of crops Mean Range
Sclerotinia wilt/basal stalk rot 30 94% 1.3 1 - 3
Sclerotinia head rot/stem rot 20 63% 1.0 T - 1
Verticillium wilt 25 78% 1.4 T - 3
Downy mildew 10 31% 1.0 T - 1
Rust 18 56% 1.5 1 - 3
Leaf spots ( Septoria & Alternaria)
Phoma stem lesions
Phomopsis stem lesions
17
13
5
14%
41%
16%
1.1
1.1
1.0
1 - 2
T - 2
T - 1
Lateness2 6 19% 1.8 1 - 3
Poor Stand 1 3% 1.3 1 - 3
Poor Vigour 9 28% 2.0 1 - 4
1Disease index on a scale of T to 5: T (Trace) = < 1%, 1= 1-5%, 2= 5-20%, 3= 20-40%, 4= 40-60%, and 5= > 60% disease levels. Index is for disease incidence with downy mildew, verticillium wilt and sclerotinia. Disease severity for rust and leaf spots was measured as % leaf and stem area affected.
2Indexes for lateness, stand, and vigour are based on a 1-5 scale (1= early/very good and 5= very late/very poor).

227
Vegetables / Légumes
CROP / CULTURE: Wasabi (Wasabia japonica) LOCATION / RÉGION: British Columbia NAME AND AGENCY / NOM ET ÉTABLISSEMENT: E.C. Betz and Z.K. Punja Simon Fraser University, Department of Biological Sciences, 8888 University Drive, Burnaby BC V5A 1S6 Telephone: (778) 782-4471; E-mail: [email protected] TITLE / TITRE: 2016 SURVEY OF FUNGAL DISEASES OF WASABI IN BRITISH COLUMBIA GREENHOUSES ABSTRACT: Five wasabi greenhouses in the Lower Mainland and Vancouver Island areas of British Columbia were surveyed for disease symptoms during the summer of 2016. Disease symptoms (Table 1) were observed at low to moderate levels, depending on the greenhouse sampled. Thirty-one plant samples were collected from which 8 potential fungal pathogens, as well as two oomycetes and one bacterial pathogen, were identified. Three previously unreported fungi were recovered, including Verticillium isaacii, Fusarium solani, and Fusarium avenaceum. INTRODUCTION AND METHOD: We conducted a survey of fungal pathogens on wasabi (Wasabia japonica) from May to August 2016. Thirty-one plant samples were taken from 5 greenhouses in British Columbia –3 in the Lower Mainland (Abbotsford and Surrey) and 2 on Vancouver Island (Sooke and Nanoose Bay). Microbes were isolated following surface-sterilization and plating of diseased tissues onto potato dextrose agar and identified by microscopic features and sequencing of the ITS1-ITS4 barcode region. Host/pathogen associations have not yet been confirmed by Koch’s postulates. RESULTS AND COMMENTS: Moderate levels of verticillium wilt/blackening and powdery mildew were recorded at most locations except Surrey and Sooke (Table 1). Phoma leaf spot was recorded in moderate levels at all Lower Mainland locations (Table 1). Root rot caused by Pythium and Fusarium species was found at low levels across locations (Table 1). ACKNOWLEDGMENTS: We thank Dr. Laila Benkrima, Your Wasabi Farms Ltd., for assisting in sample collections and Dr. Siva Sabaratnam, B.C. Ministry of Agriculture, for providing pathogen cultures for comparison. Funding for this survey was provided by Growing Forward 2 (URAGF-406), a federal-provincial-territorial initiative. REFERENCES: MacDonald, J.L. and Punja, Z.K. 2016. Occurrence of botrytis leaf blight, anthracnose leaf spot and white blister rust on Wasabia japonica in British Columbia. Can J. Plant Pathol. (submitted). Joshi, V., Jeffries, M., and Jesperson, G. 2014. Diseases diagnosed on commercial crops submitted to the British Columbia Ministry of Agriculture plant health laboratory in 2013. Can. Plant Dis. Surv. 94: 8-18. (www.phytopath.ca/publication/cpds) Joshi, V., Jeffries, M., and Jesperson, G. 2015. Diseases diagnosed on commercial crops submitted to the British Columbia Ministry of Agriculture plant health laboratory in 2014. Can. Plant Dis. Surv. 95: 7-16. (www.phytopath.ca/publication/cpds) Joshi, V. and Jeffries, M. 2016. Diseases diagnosed on commercial crops submitted to the British Columbia Ministry of Agriculture plant health laboratory in 2015. Can. Plant Dis. Surv. 96: 7-18. (www.phytopath.ca/publication/cpds) Punja, Z.K., Chandanie, W.A., Chen, X., and Rodriguez, G. 2016. Phoma leaf spot of wasabi (Wasabia japonica) caused by Leptosphaeria biglobosa. Plant Pathol. (in press). Rodríguez, G.and Punja, Z.K. 2007. Root infection of wasabi (Wasabia japonica) caused by Pythium species. Can J Plant Pathol. 29: 79-83. Rodríguez, G.and Punja, Z.K. 2009. Vascular blackening of wasabi rhizomes caused by Pectobacterium carotovorum subsp. carotovorum. Eur J Plant Pathol. 124: 483-493.

228
Table 1. Summary of diseases of wasabi identified during a survey of BC greenhouses in the summer of 2016.
CROP DISEASE/ SYMPTOM CAUSAL/ ASSOCIATED ORGANISM
NUMBER OF SAMPLES
Wasabi (Wasabia japonica)
Root rot, wilt, and vascular blackening
Verticillium isaacii 6
Leaf spot and vascular blackening Phoma wasabiae Leptosphaeria biglobosa)
5
Powdery mildew Erysiphe cruciferarum 5
Leaf blight Botrytis cinerea 3
White rust Albugo candida 2
Root rot Fusarium avenaceum 2
Root rot Fusarium solani 1
Anthracnose Colletotrichum destructivum
1
Root rot Pythium intermedium 1
Root rot Pythium irregulare 1
Soft rot Pectobacterium carvotorum
2

229
CROP / CULTURE: Garlic LOCATION / RĖGION: Manitoba NAME AND AGENCY / NOM ET ÉTABLISSEMENT: A. Hajihassani and M.Tenuta Department of Soil Science, University of Manitoba, Winnipeg MB Canada R3T 2N2 Telephone: (204) 474-7827; Email: [email protected] TITLE / TITRE: THE OCCURRENCE OF STEM AND BULB NEMATODE ON GARLIC IN SOUTHERN MANITOBA, CANADA IN 2015 ABSTRACT: Stem and bulb nematode Ditylenchus dipsaci is known to have a significant presence in garlic crops, particularly in eastern Canada. In June 2015, we received samples of garlic bulbs with disease symptoms caused by stem and bulb nematode from two locations south of Winnipeg in the Red River Valley. Nematodes were isolated from the samples and identified as D. dipsaci based on morphometric and morphological characters of adult individuals. The detection was confirmed by analysing the hsp90 and ITS regions of rDNA using species specific primers. To our knowledge, this is the first report of D. dipsaci associated with garlic in Manitoba. INTRODUCTION: Ditylenchus dipsaci (Kühn) Filipjev (Tylenchida: Anguinidae) is considered one of the most destructive pests of many cultivated and wild crops. It has numerous hosts and is considered as a quarantine pest in many countries. D. dipsaci can invade and damage garlic and onion crops throughout the world, due to its ability to adapt to different climatic conditions. However, the moderate and humid environmental conditions occurring in early spring in Canada favor the nematode development. D. dipsaci produces several generations per growing season which leads to severe yield loss. In Canada, the first occurrence of D. dipsaci on onion was reported in southwestern Ontario in 1957 (Mountain, 1957). Results of a recent survey of garlic growing fields in Ontario revealed that 73% of the samples collected were infested with D. dipsaci (Hughes et al., 2013). More recently, the Soil Ecology laboratory at the University of Manitoba recovered the nematode in garlic bulbs from Quebec (unpublished). METHODS: One plant sample from a commercial garlic field and one from a home garden were delivered to the Soil Ecology Lab at the University of Manitoba. Disease symptoms visible on the infected plants were recorded. Nematode individuals were isolated from plant bulbs and identified primarily by microscopic examination of morphometric and morphological characters of males and females including body length and width, stylet length, vulva and spicule length and tail length (Tenuta et al., 2014). A PCR-based assay using species-specific primers described by Madani et al. (2015) was used with some modifications for nematode identification. Briefly, DNA was extracted from single adults from each plant sample and the species-specific primers U831 (5′-AAY AAR ACM AAG CCN TYT GGA C-3′) and Dipsaci_hsp90R (5′-GWG TTA WAT AAC TTG GTC RGC-3′) were used in the PCR reaction. The modification made in our study was in the DNA amplification temperature and time consisted of 35 cycles of 4 min at 94˚C, 30 sec at 94 ˚C and 45 s at 56 ˚C. A final step of 15 min at 72 ˚C completed the DNA amplification followed by running on a 1.2% agarose gel, stained with GelRed (Biotium, Hayward CA) dye in TAE buffer. Population density of the nematode in the plants was determined by extracting vermiform life stages using an extraction pan, followed by enumerating the number of nematode in a counting slide under compound microscope at 40x. RESULTS AND DISCUSSION: Disease symptoms observed on the infested plants include malformation and twisting of the leaves, blister-like areas on the leaf surface, and leaf dieback (Fig 1A & B). The bulbs were soft or spongy and no roots were observed on the bulbs (Fig 1C). Plants were generally weakened and stunted. In addition, many conidia of fusarium basal rot (Fusarium spp.) were observed in the
extracted nematode suspension.
All nematode specimens isolated from the two samples were identified as D. dipsaci based on key morphological characters from females and males. Measurements of females (n = 5) included a body length of 1,454 to 1,585μm, maximum body width 31 to 35μm, body width at anus 21 to 22μm, stylet length 7.9 to 10.1μm, vulva length 1,161 to 1,246μm, and tail length 82-95μm. Male (n = 5)

230
measurements were body length of 1,446-1,548μm, maximum body width 31 to 34μm, body width at anus 20 to 22μm, stylet length 8.4 to 10.3μm, spicule length 30 to 32μm, and tail length 88 to 101μm. The measurements were generally similar to those reported by Tenuta et al. (2014) and other authors for D. dipsaci. Our PCR test confirmed the D. dipsaci identification by amplification of a distinct 182-bp fragment (Fig. 2). The primer set used in our study amplified DNA of a population of D. dipsaci obtained from garlic bulbs in Ontario, whereas it did not amplify DNA of D. weischeri, a closely (morphologically) related species, obtained from Cirsium arvense stems from Manitoba (Fig. 2). The number of D. dipsaci recovered from infested garlic plants ranged between 63 and 254 nematodes per gram of dry material. A mass of the nematode individuals was observed on the bottom surface of the infested bulbs (Fig. 3A). In addition, nematode developmental stages, including eggs, were detected inside the leaf scales of bulbs (Fig. 3B) and stem tissues. This nematode pest has not been known to occur in Manitoba previously. We believe that the growers importing infested seed bulbs of garlic from Ontario introduced the nematode into Manitoba. Infested bulbs may easily be overlooked and become the sources of D. dipsaci re-infestation. The presence of D. dipsaci in garlic seed is of importance for spreading of the pest and may allow this nematode to cross quarantine barriers. The use of uncertified saved seed bulbs may intensify the chance of contamination of crops by D. dipsaci. If the nematode is present in soil, garlic cultivation should be either prohibited or subjected to phytosanitary controls. Crop rotation with nonhost crops has been recognized as a useful method for the disease management. We recently discovered that wheat and canola are nonhosts for D. dipsaci and can be used as rotational crops to control the nematode. REFERENCES:
Hajihassani, A., Tenuta, M. and Gulden, R.H. 2016. Host preference and seedborne transmission of Ditylenchus weischeri and D. dipsaci on select pulse and non-pulse crops grown in the Canadian Prairies. Plant Dis. 100: 1087-1092. Hughes, B.R., Celetti, M.J., Paibomesai, M. and Yu, Q. 2013. Stem and bulb nematode in Ontario-grown garlics. Can. Plant Dis. Surv. 93:178-181.(www.phytopath.ca/cpds.shtml) Madani, M., Tenuta, M., Chizhov, V.N. and Subbotin, S.A. 2015. Diagnostics of stem and bulb nematodes Ditylenchus weischeri and D. dipsaci (Nematoda: Anguinidae) using PCR with species specific primers. Can. J. Plant Pathol. 37:212-220. Mountain, W.B. 1957. Outbreak of the bulb and stem nematode in Ontario. Can. Plant Dis. Surv. 37:62-62. (www.phytopath.ca/cpds.shtml) Tenuta, M., Madani, M., Briar, S.H., Molina, O., Gulden R.H. and Subbotin, S.A. 2014. Occurrence of Ditylenchus weischeri and not D. dipsaci in field pea harvest samples and Cirsium arvense in the Canadian Prairies. J. Nematol.46: 376-384.

231
Fig. 1. A & B: Garlic plant with chlorosis symptoms on the foliage and dieback of the leaves caused by stem and bulb nematode (Ditylenchus dipsaci) and fusarium basal rot (Fusarium spp.). As the disease progresses the leaves becomes necrotic, followed by stunting and drying of the whole plant, C: Root loss and basal plate damage on the bulb due to growth of pink masses of the fungal mycelium co-infested with the nematode.
A
B
C

232
Fig. 2. Gel with specific amplicons obtained by PCR with the D. dipsaci species-specific primer. Lanes: M =100-bp DNA ladder; 1 and 7 = control (without DNA); 2 = D. weischeri from C. arvense; 3-5 = D. dipsaci from garlic, Manitoba, and 6 = D. dipsaci from garlic, Ontario.
Fig. 3. A: Mass of Ditylenchus dipsaci individuals on the bottom surface of an infested garlic bulb, B: Stained red adults and eggs (circled) of the nematode inside a leaf scale of the bulb.
A B A
B
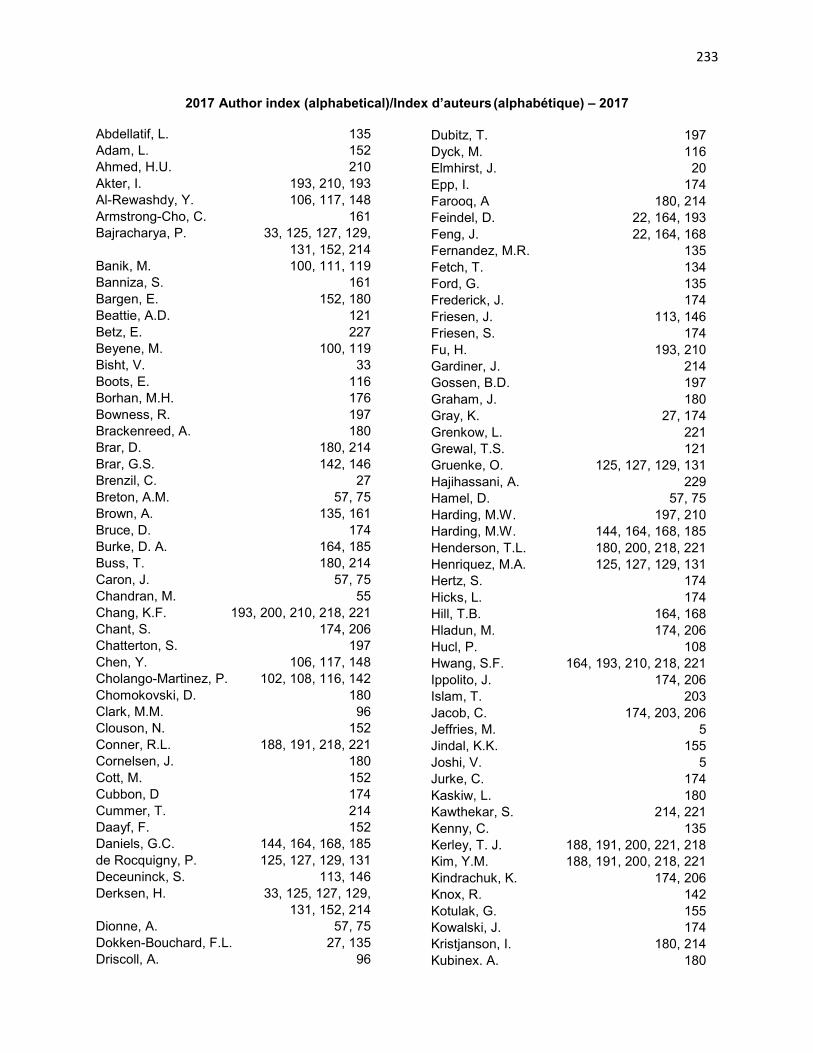
233
2017 Author index (alphabetical)/Index d’auteurs (alphabétique) – 2017
Abdellatif, L. 135
Adam, L. 152
Ahmed, H.U. 210
Akter, I. 193, 210, 193
Al-Rewashdy, Y. 106, 117, 148
Armstrong-Cho, C. 161
Bajracharya, P. 33, 125, 127, 129,
131, 152, 214
Banik, M. 100, 111, 119
Banniza, S. 161
Bargen, E. 152, 180
Beattie, A.D. 121
Betz, E. 227
Beyene, M. 100, 119
Bisht, V. 33
Boots, E. 116
Borhan, M.H. 176
Bowness, R. 197
Brackenreed, A. 180
Brar, D. 180, 214
Brar, G.S. 142, 146
Brenzil, C. 27
Breton, A.M. 57, 75
Brown, A. 135, 161
Bruce, D. 174
Burke, D. A. 164, 185
Buss, T. 180, 214
Caron, J. 57, 75
Chandran, M. 55
Chang, K.F. 193, 200, 210, 218, 221
Chant, S. 174, 206
Chatterton, S. 197
Chen, Y. 106, 117, 148
Cholango-Martinez, P. 102, 108, 116, 142
Chomokovski, D. 180
Clark, M.M. 96
Clouson, N. 152
Conner, R.L. 188, 191, 218, 221
Cornelsen, J. 180
Cott, M. 152
Cubbon, D 174
Cummer, T. 214
Daayf, F. 152
Daniels, G.C. 144, 164, 168, 185
de Rocquigny, P. 125, 127, 129, 131
Deceuninck, S. 113, 146
Derksen, H. 33, 125, 127, 129,
131, 152, 214
Dionne, A. 57, 75
Dokken-Bouchard, F.L. 27, 135
Driscoll, A. 96
Dubitz, T. 197
Dyck, M. 116
Elmhirst, J. 20
Epp, I. 174
Farooq, A 180, 214
Feindel, D. 22, 164, 193
Feng, J. 22, 164, 168
Fernandez, M.R. 135
Fetch, T. 134
Ford, G. 135
Frederick, J. 174
Friesen, J. 113, 146
Friesen, S. 174
Fu, H. 193, 210
Gardiner, J. 214
Gossen, B.D. 197
Graham, J. 180
Gray, K. 27, 174
Grenkow, L. 221
Grewal, T.S. 121
Gruenke, O. 125, 127, 129, 131
Hajihassani, A. 229
Hamel, D. 57, 75
Harding, M.W. 197, 210
Harding, M.W. 144, 164, 168, 185
Henderson, T.L. 180, 200, 218, 221
Henriquez, M.A. 125, 127, 129, 131
Hertz, S. 174
Hicks, L. 174
Hill, T.B. 164, 168
Hladun, M. 174, 206
Hucl, P. 108
Hwang, S.F. 164, 193, 210, 218, 221
Ippolito, J. 174, 206
Islam, T. 203
Jacob, C. 174, 203, 206
Jeffries, M. 5
Jindal, K.K. 155
Joshi, V. 5
Jurke, C. 174
Kaskiw, L. 180
Kawthekar, S. 214, 221
Kenny, C. 135
Kerley, T. J. 188, 191, 200, 221, 218
Kim, Y.M. 188, 191, 200, 218, 221
Kindrachuk, K. 174, 206
Knox, R. 142
Kotulak, G. 155
Kowalski, J. 174
Kristjanson, I. 180, 214
Kubinex. A. 180

234
Kundu, M. 144
Kutcher, H.R. 102, 108, 116,
121, 142, 146, 203
Lange, D. 2180, 14, 221
Larkan, N.J. 174
Lewick, M. 214
Li, N. 193, 210
Liew, A.G. 108, 116
Lobo, J. 142
Loverin, J. 174
Lustig, M. 174
Mah, A. 27
Manoli, V.P. 164
Manolii, E. 164
McCallum, B. 133
McCracken, M. 180
McDonald, J. 168
McDonald, M.R. 55
McLaren, D. L. 180, 181, 191, 197,
200, 218, 221
McNabb, W. 133
Melzer. M. 41
Mendoza, E. 214
Menzies, J.G. 113, 146
Meyers, E. 108
Miranda, D. 125, 127, 129, 131
Monvoisi, J. 174
Moon, B. 174
Moran, M. 191
Nabetani, K. 142
Nameth, V. 174, 206
Nielsen, J. 197
Nielson, J.M. 185
Noble, A. 174
Nyandoro, R. 206
Olson, B. 197
Out, B.A. 135
Penner, W.C. 188, 191, 218
Phelps, B, S. 197
Philp, N 174
Picard, R. 152, 180, 214
Podolsky, K. 214
Popovic, Z. 113, 145
Pradhan, M. 33, 180, 203, 224
Pugh, C.A. 185
Punja, A.K. 227
Raham, M. 164
Rashid, K.Y. 203, 224
Rauhala, N.E. 104
Reid, L.M. 155
Reimer, E. 133
Rennie, D. C. 22, 164, 168
Rioux, S. 123
Roberts, S. 174
Rosa, S.B. 150
Scott, C. 174
Senko, S. 174
Shan, X. 41
Silva, T. 27, 174
Singh, G. 142
Sletten, D. 174
Soliman, A. 152
Stephens, D.T. 27, 135, 174, 206
Stonehouse, K. 174
Storozynsky, Q. 197
Strelkov, S.E. 164, 193, 210
Sweetman, G. 27
Tamburic-Iincic, L. 150
Tenuta, A.U. 155
Tenuta, M. 229
Tesfaeindrias, M.T. 92
Thompson, M. J. 200
Turkington, T.K. 104
Turnbull, G.D. 193, 210
Turner, T. 224
Valentino, M. 180
Van Dyk, D. 55
Vivancos, J. 57, 75
Vucurevich, C. 197
Wagman, B. 174
Wailchli, F. 135
Wang, X. 100, 119
Ward, W. 174
Wilyman, A. 27
Woitas, A. 121
Woldemarium, T. 155
Wu, L.F. 193
Xue, A.G. 106, 113, 117, 148
Yang, Y. 22
Yao, Z. 129, 131
Zahr, K. 22, 164
Zegeye, T. 134
Zemanek, J. 174
Zhu, X. 155
Ziesman, B. 27, 135, 174, 197, 203, 206
Zuzak, K. 22, 164, 16

235
List of Figures: Soil zone map with common and durum wheat fields surveyed across Saskatchewan in 2016. ............... 138
Three month (May 11- Aug 8) percent of average precipitation. Normal precipitation based on 1981-2010 (Agriculture and Agri-Food Canada, 2016). ...................................................................... 140
Monthly mean temperature (oC) difference from normal for July 2016. Normal temperature based on 1981-2010 (Agriculture and Agri-Food Canada, 2016). ................................................................ 140
The locations of confirmed WSMV samples in Alberta in 2016 .................................................................. 145
Approximate distribution of WSMV in Alberta in 2015 and 2016 ................................................................ 145
2016 Ontario corn diseases survey sampling sites ................................................................................... 157
The occurrence of clubroot on canola in Alberta. Since surveys for clubroot were initiated in 2003, the disease has been confirmed in a total of 2443 fields representing 31 counties and municipal districts in the province, as well as in rural areas of the cities of Edmonton and Medicine Hat, and the Town of Stettler ......................................................................................... 167
The location and severity of blackleg in 480 canola fields in Alberta in 2016 ............................................. 173
White mould on dry bean: Distribution map of disease incidence in Alberta in 2016 ................................ 187
Precipitation map for southern Alberta in July, 2016 .................................................................................. 187
Field pea plants affected by severe root rot in a low-lying area of a field in Sturgeon County .................. 195
Soybean plants affected by severe root rot and exhibiting premature yellowing in a field near Turin, AB, 2016 ..................................................................................................................................... 213
Map showing the approximate locations of the surveyed soybean crops in southern Alberta in 2016 ................................................................................................................................................ . 213
Garlic plant with chlorosis symptoms on the foliage and dieback of the leaves caused by stem and bulb nematode (Ditylenchus dipsaci) and fusarium basal rot (Fusarium spp.). As the disease progresses the leaves becomes necrotic, followed by stunting and drying of the whole plant. C: Root loss and basal plate damage on the bulb due to growth of pink masses of the fungal mycelium co-infested with the nematode. ............................................................................................ 231
Gel with specific amplicons obtained by PCR with the D. dipsaci species-specific primer. Lanes: M =100-bp DNA ladder; 1 and 7 = control (without DNA); 2 = D. weischeri from C. arvense; 3-5 = D. dipsaci from garlic, Manitoba, and 6 = D. dipsaci from garlic, Ontario ................................... 232
Mass of Ditylenchus dipsaci individuals on the bottom surface of an infested garlic bulb, Stained red adults and eggs (circled) of the nematode inside a leaf scale of the bulb. .................. 232