Embed Size (px)
Citation preview
Canadian Policy Context
For Climate ChangeAg & Forestry GHG Modeling Forum
Shepardstown WVa, Sept 26-29, 2011
Bob MacGregor

2
To outline Canada’s national circumstances and key issues and challenges for climate change mitigation
To provide an overview of Canada’s sector-by-sector regulatory approach
– Progress to date in reducing emissions
– Further action proposed towards achieving Canada’s target
Review progress made in the agriculture and food sector in terms of environmental management and contribution to GHG reduction
Discuss the potential nature and scope of an AAFC “departmental” strategy, that could contribute to Canada reaching the goal of a 17 percent reduction from 2005 levels by 2020
To highlight an approach to climate change adaptation
Purpose

3
Canada’s unique national circumstances make tackling climate change a formidable challenge
Canada has an extreme climate
Canada has a large landmass, coupled with a very low overall population density
Canada has a growing economy and population
Canada is a net exporter of energy
– Increased oil and gas production in response to strong global demand for energy is a significant contributor to the overall rise in Canada’s emissions
Canada has an energy intensive industrial sector
Canada’s economy is highly integrated with that of the U.S.
4
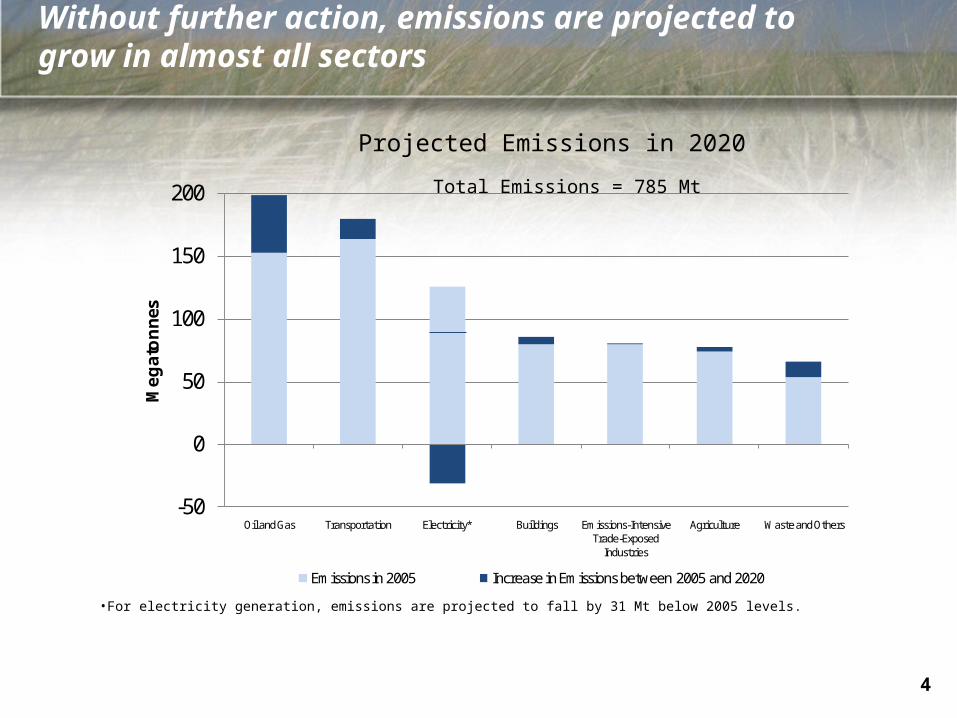
Without further action, emissions are projected to grow in almost all sectors
-50
0
50
100
150
200
Oil and Gas Transportation Electricity* Buildings Emissions-Intensive Trade-Exposed
Industries
Agriculture Waste and Others
Me
ga
ton
nes
Emissions in 2005 Increase in Emissions between 2005 and 2020
•For electricity generation, emissions are projected to fall by 31 Mt below 2005 levels.
Projected Emissions in 2020
Total Emissions = 785 Mt

5
Given Canada’s energy intensive economy, economic growth and emissions are connected
Progress on clean energy and energy efficiency is essential to the long-term competitiveness of the Canadian economy
– Canada is the 2nd highest per capita energy consumer in the OECD
Energy investment decisions taken today will affect the future economic prosperity and carbon footprint of Canadians
– Oil and other fossil fuels will remain an important part of global energy mix even with the transition to a low carbon economy
Oil sands represent an important source of economic prosperity but are also driving Canada’s emissions growth
– From 2005 to 2020, production is projected to increase from 1.7 to 5 million barrels/day (↑200%)
– During the same period, GHG emissions are projected to increase from 30 to 92 Mt (↑207%)
6
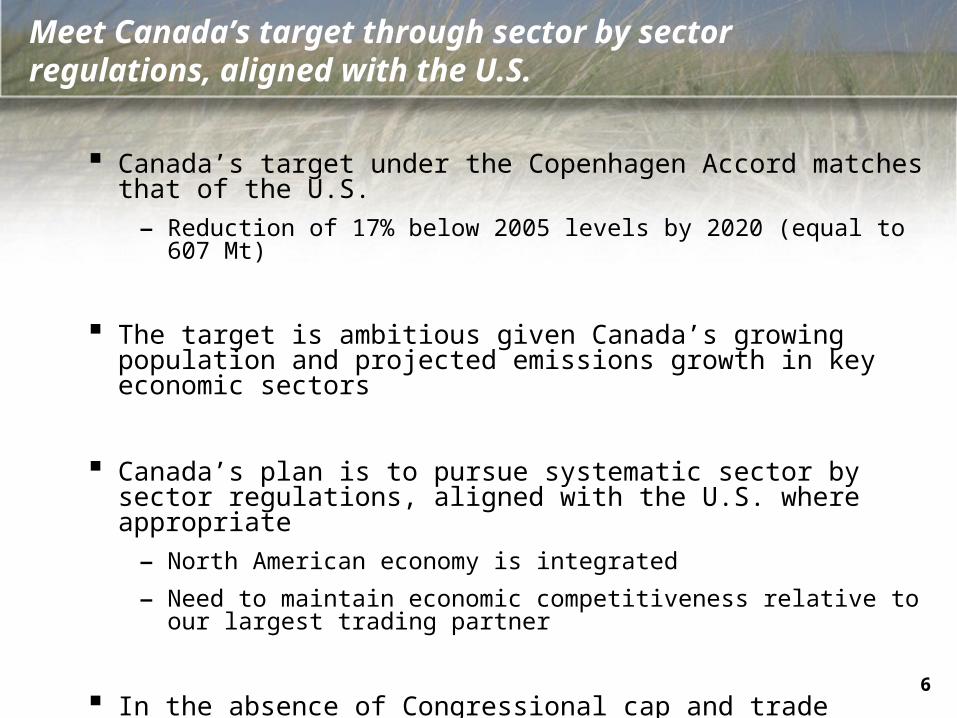
Meet Canada’s target through sector by sector regulations, aligned with the U.S.
Canada’s target under the Copenhagen Accord matches that of the U.S. – Reduction of 17% below 2005 levels by 2020 (equal to 607 Mt)
The target is ambitious given Canada’s growing population and projected emissions growth in key economic sectors
Canada’s plan is to pursue systematic sector by sector regulations, aligned with the U.S. where appropriate
– North American economy is integrated– Need to maintain economic competitiveness relative to our largest trading partner
In the absence of Congressional cap and trade legislation, the U.S. Environmental Protection Agency (EPA) is moving forward with regulations under the Clean Air Act
7
We have the legislative and institutional capacity to enforce and administer our measures effectively
Canadian Environmental Protection Act (CEPA) is the primary regulatory instrument for limiting GHGs
– CEPA’s enforcement regime allows for the designation of both enforcement officers and analysts, and the creation of various tools that can be employed in order to promote compliance and enforce the Act’s provisions
Proposed legislation including administrative details are reviewed and discussed at two committees:
– House of Commons Standing Committee on the Environment and Sustainable Development
– Cabinet Committee on Environment and Energy Security

8
Initial focus in reducing emissions has been in the transportation and electricity sectors
Transportation is currently Canada’s largest source of GHG emissions, with forecasted growth.
– Alignment with the U.S. is critical given the highly integrated nature of the North American automotive industry
– Performance standards have already been implemented to address emissions from new cars and light trucks (2011-2016 model years); further action to address later model years and emissions from heavy duty vehicles is underway
– Requirement for an avg. 5% renewable fuel content in gasoline came into force Dec. 2010; provisions for diesel fuel and heating oil to take effect in July 2011
Electricity is an area where Canada is leading relative to the U.S.– Canada has a much higher proportion of non-emitting generation (approx. 75%)
– U.S. relies on coal for about half of total generation, whereas only ~19% of Canada’s electricity generated from coal-fired units
– Capital stock turnover provides the opportunity for ambitious action
– Proposed performance standards for coal-fired generation to come into force in 2015 and would move Canada off of traditional coal
9
Provinces and territories have been taking action
Provinces and territories have established their own targets
They hold many of the levers for action on climate change and are developing tailored strategies that reflect their individual circumstances
There are a range of initiatives being implemented by provinces:
– Regulatory framework in Alberta
– Carbon tax in British Columbia
– Various measures to support energy efficiency and renewables (e.g. Ontario feed-in tariffs)
Actions from provinces and territories are contributing about half of the expected reductions towards meeting Canada’s emissions target, and there is potential for them to do more (e.g. Western Climate Initiative)
10
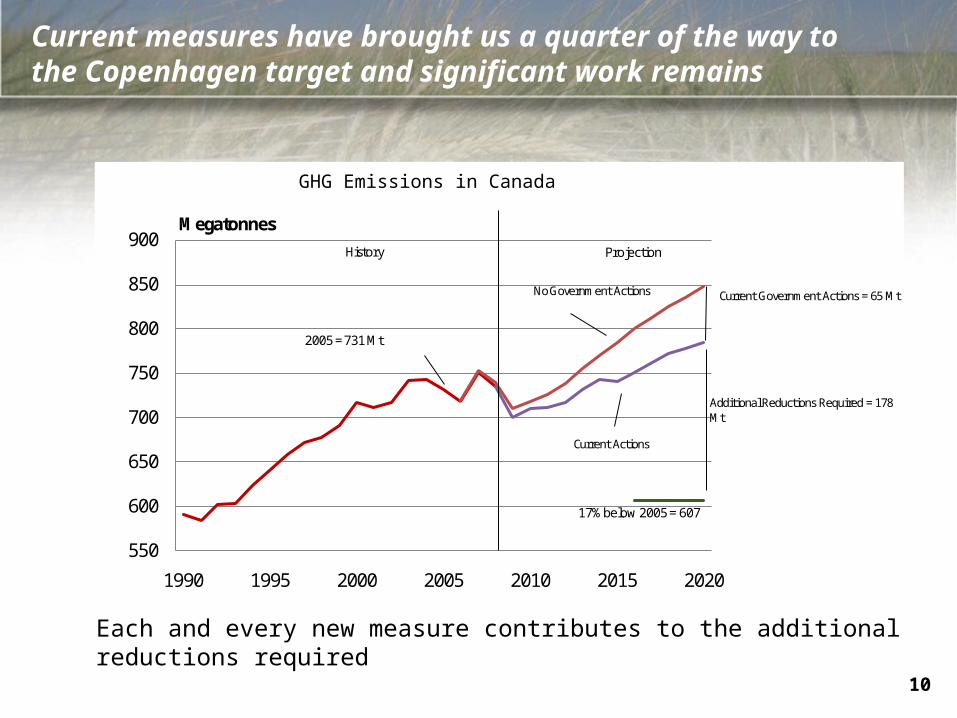
Current measures have brought us a quarter of the way to the Copenhagen target and significant work remains
550
600
650
700
750
800
850
900
1990 1995 2000 2005 2010 2015 2020
Megatonnes
17% below 2005 = 607
History Projection
Additional Reductions Required = 178 Mt
Current Government Actions = 65 MtNo Government Actions
Current Actions
2005 = 731 Mt
GHG Emissions in Canada
Each and every new measure contributes to the additional reductions required
11
Government is in the process of developing additional measures
Further measures are being developed for the transportation sector– Working with U.S. to develop standards for new cars and light trucks of the 2017 and later model years.
– Work with U.S. and international partners underway on emissions from aviation, rail and marine
Performance standards would be designed to achieve equivalent or better outcomes to those implied by the U.S. approach
They would also take into consideration:– Equitable treatment across regions and industrial sectors
– Competitiveness and minimizing stranded capital
– Promoting development and deployment of new technologies
– Minimizing regulatory overlap and duplication
12
In taking action, minimizing adverse socioeconomic impacts is a key concern
Canada is aligning policies with the U.S. where appropriate to maintain economic competitiveness
Current measures have been implemented with a view to achieving an equitable treatment among sectors and minimizing employment impacts
– For example, analysis of federal measures implemented to date indicate that there is no negative impact on employment, and no distributional concerns across sectors or regions in terms of reductions and costs
Adverse socio-economic impacts outside of continental and national borders are also minimized by:
– Ensuring that the processes of establishing and implementing climate policies include consultations with Federal departments with international responsibilities (Canadian International Development Agency, Department of Foreign Affairs and International Trade)
Canada also contributed $400M of fast-start funding to assist developing and vulnerable countries to address climate change and its impacts
13
However, Canada’s climate will continue to change regardless of mitigation activities
Impacts are already evident across Canada– Changes in temperature, precipitation, ice coverage and melt, and sea level rise– More frequent and severe extreme weather events– Significant impacts on human health and the economy
Canada is experiencing faster warming than countries farther south– Increased risks for health, safety, infrastructure, viability of natural resource industries, coastal
communities, water, and natural ecosystems– The North is particularly vulnerable
Adaptation involves adjusting activities, decisions, and thinking to moderate harm and take advantage of new opportunities
– E.g. infrastructure standards for more frequent and extreme weather events, surveillance programs for shifting ranges of infectious disease
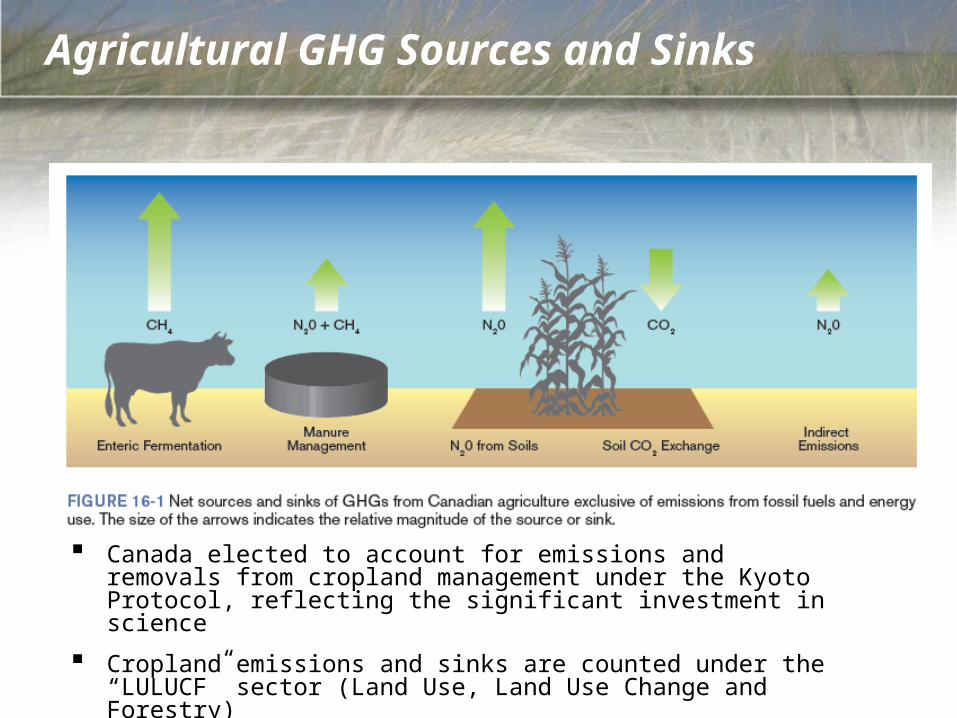
Agricultural GHG Sources and Sinks
Canada elected to account for emissions and removals from cropland management under the Kyoto Protocol, reflecting the significant investment in science
Cropland emissions and sinks are counted under the “LULUCF” sector (Land Use, Land Use Change and Forestry)

15
Agricultural GHG Emissions in Canada
Manure Mgmt8 Mt
Agricultural Soils30 Mt
On Farm Energy
Emissions 12 Mt
Enteric Fermentation from
Livestock 24 Mt
Transportation 164 Mt (22%)
Electricity 126 Mt (17%)
Oil and Gas 153 Mt (21%)
EITE Industries 80 Mt (11%)
Buildings 80 Mt (11%)
Waste and Others 54 Mt
(7%)
Agriculture 74 Mt (10%)
Summary of Agricultural GHG Emissions in 2005
Excludes LULUCF
16
40,000
45,000
50,000
55,000
60,000
65,000
70,000
75,000
80,000
1990 1995 2000 2005 2010 2015 2020
Year
Ag
ricu
ltu
ral G
HG
Em
issi
on
s (k
t C
O2
eq.)
Total Emissions (LUC not included)
Net Emissions (LUC included)
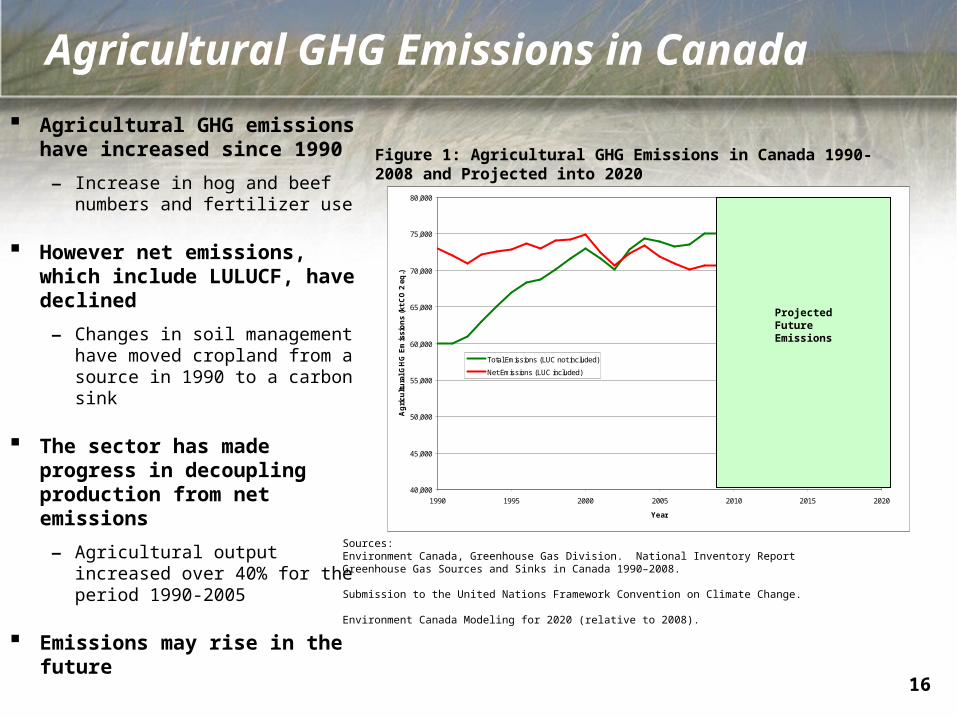
Agricultural GHG Emissions in Canada
Agricultural GHG emissions have increased since 1990
– Increase in hog and beef numbers and fertilizer use
However net emissions, which include LULUCF, have declined
– Changes in soil management have moved cropland from a source in 1990 to a carbon sink
The sector has made progress in decoupling production from net emissions
– Agricultural output increased over 40% for the period 1990-2005
Emissions may rise in the future
Sources: Environment Canada, Greenhouse Gas Division. National Inventory ReportGreenhouse Gas Sources and Sinks in Canada 1990–2008.
Submission to the United Nations Framework Convention on Climate Change.
Environment Canada Modeling for 2020 (relative to 2008).
Projected Future Emissions
Figure 1: Agricultural GHG Emissions in Canada 1990-2008 and Projected into 2020

17
Reduction of GHG Emissions Intensity for Livestock in Canada
Meeting growing world demand for food is still the priority for the sector
– 40% of output is exported
GHG Emissions Intensity is the measure of GHG emissions per total weight of production
– e.g. CO2 equivalent per kg of milk or animal live weight produced
From 1981 to 2006, farmers made significant improvements in their management practices, including improved nutrient management, reduced energy consumption and better genetics, increasing the efficiency of production.
– Resulted in improvements to GHG emission intensities (Figure 2):
Dairy: 20% decrease CO2 eq. /kg milk,
Beef: 36% decrease CO2 eq. /kg live weight
Pork: 37% decrease CO2 eq. /kg live weight
0
2
4
6
8
10
12
14
16
18
Dairy Beef PorkGH
G e
mis
sion
s (k
g C
O2e
) per
kilo
gram
of m
ilk o
r liv
e w
eigh
t pro
duce
d
1981 1986 1991
1996 2001 2006
Figure 2: Greenhouse gas emission intensities for milk, beef and pork production in Canada, 1981–2006
Source:Eilers, W., R. MacKay, L. Graham and A. Lefebvre (eds). 2010. Environmental Sustainability of Canadian Agriculture: Agri-Environmental Indicator Report Series — Report #3. Agriculture and Agri-Food Canada, Ottawa, Ontario.
18
Canada, the US and other countries have worked closely on forming the Global Research Alliance on Agricultural Greenhouse Gases, announced in Copenhagen in 2009
Objective of the Alliance is to help farmers improve efficiencies, reduce costs of production and lower emissions
Working with industry and university partners to cover the continuum from research to tech transfer through the $27M, five-year Agricultural Greenhouse Gas Program
International cooperation

19
As a complement to ongoing research that improves productivity and helps to decouple GHG emissions from agricultural output, future effort could focus on:
1. Nutrient management
– conduct science, create decision tools and encourage adoption of best practices
2. Climate change mitigation and adaptation
– develop goals for agricultural emissions
– improve measurement and monitoring
3. A biomass / bioproducts strategy that moves beyond biofuels and contributes to a low-carbon economy
An agriculture sector strategy could focus on three areas:
20
Nutrient management challenge is a common thread connecting many agri-environmental issues
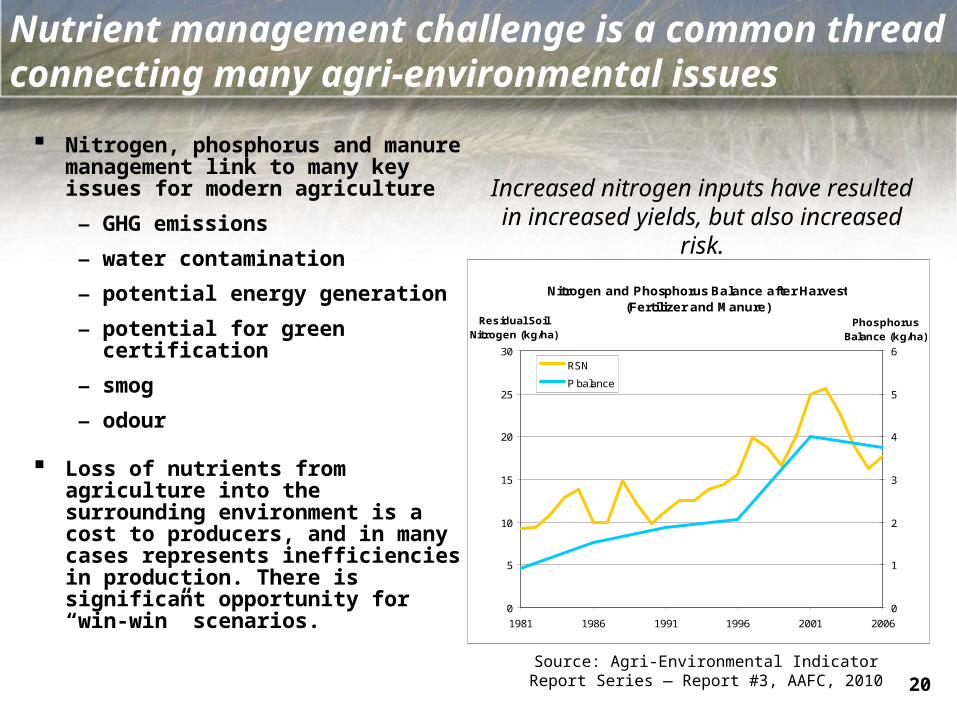
Nitrogen, phosphorus and manure management link to many key issues for modern agriculture
– GHG emissions
– water contamination
– potential energy generation
– potential for green certification
– smog
– odour
Loss of nutrients from agriculture into the surrounding environment is a cost to producers, and in many cases represents inefficiencies in production. There is significant opportunity for “win-win” scenarios.
Nitrogen and Phosphorus Balance after Harvest(Fertilizer and Manure)
0
5
10
15
20
25
30
1981 1986 1991 1996 2001 2006
Residual Soil Nitrogen (kg/ha)
0
1
2
3
4
5
6
Phosphorus Balance (kg/ha)
RSN
P balance
Increased nitrogen inputs have resulted in increased yields, but also increased risk.
Source: Agri-Environmental Indicator Report Series — Report #3, AAFC, 2010
21
Improved nutrient management practices can support Canada’s emission target
GHG emissions can be mitigated by improving farm practices related to nutrient management such as
– new animal feeding strategies
– more efficient use of crop production inputs
– new waste treatment techniques
Cost and/or technological barriers often prevent the widespread adoption of these practices
– Environmental Farm Plans, technical and financial assistance to adopt beneficial management practices (BMPs) help address these barriers

22
Breakthrough discoveries are possible, but further reductions in agriculture emissions are likely to be small in absolute terms
– some potential for additional soil carbon sequestration, but widespread adoption occurred prior to 2005 baseline period
– agriculture is part of a biological system in which some greenhouse gas emissions are natural
– a limited number of practices can provide emission reductions, however, many come with high additional costs to farmers
Given the imperative to achieve global food security, it is important to emphasize improved efficiency through productivity research, lowering the carbon intensity of agricultural production
Agriculture’s greatest potential to reduce emissions would likely occur by replacing coal with biomass, but this will only occur if incentives change
The path forward on agricultural GHG emissions
23
1) Through adoption of innovative farming practices, the agriculture sector has reduced net emissions and improved emissions intensity
2) “Departmental” environmental agenda at AAFC will be delivered through Growing Forward 2 starting in April 2013
3) AAFC environmental strategy could include a focus on
improving nutrient management practices
reducing GHG emissions intensity
supporting the bioproducts industry
Conclusion for Mitigation
Currently the agricultural sector has no Policies or Measures that have GHG emission reductions as an objective
24
Canada’s climate will continue to change regardless of mitigation activities
Impacts are already evident across Canada– Changes in temperature, precipitation, ice coverage and melt, and sea level rise– More frequent and severe extreme weather events– Significant impacts on human health and the economy
Canada is experiencing faster warming than countries farther south– Increased risks for health, safety, infrastructure, viability of natural resource industries, coastal
communities, water, and natural ecosystems– The North is particularly vulnerable
Adaptation involves adjusting activities, decisions, and thinking to moderate harm and take advantage of new opportunities
– E.g. infrastructure standards for more frequent and extreme weather events, surveillance programs for shifting ranges of infectious disease
25
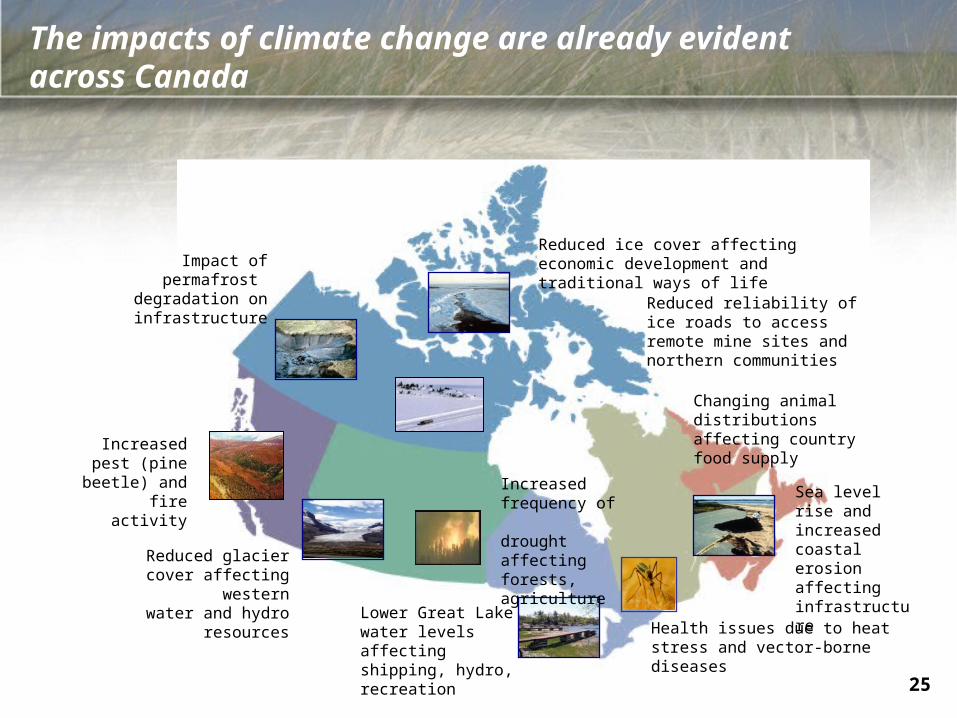
Reduced glacier cover affecting
westernwater and hydro
resources
Impact of permafrost
degradation on infrastructure
Increased frequency of drought affecting forests, agriculture
Reduced ice cover affecting economic development and traditional ways of life
Increased pest (pine beetle)
and fire activity
Lower Great Lake water levels affecting shipping, hydro, recreation
Changing animal distributions affecting country food supply
Sea level rise and increasedcoastal erosion affecting infrastructure
Reduced reliability of ice roads to access remote mine sites and northern communities
Health issues due to heat stress and vector-borne diseases
The impacts of climate change are already evident across Canada
26
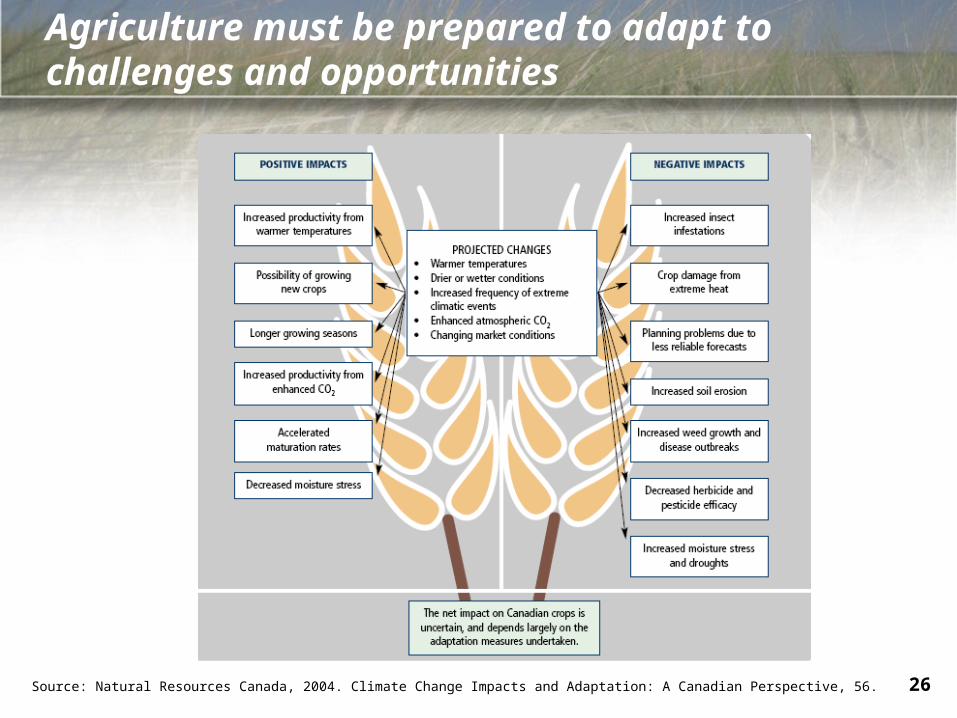
Agriculture must be prepared to adapt to challenges and opportunities
Source: Natural Resources Canada, 2004. Climate Change Impacts and Adaptation: A Canadian Perspective, 56.
27
Canada is making investments to improve our understanding of climate change and developing a comprehensive sector strategy
Continuing to fund research to understand impacts and evaluate adaptation strategies to improve resilience
A comprehensive Foresight activity involving wide spectrum of participants to help frame the long term challenges and opportunities
Canada wide consultations to gage sector understanding of issues related to impact and adaptation and to help frame a sector strategy that could have the following elements
– Contributing to mitigation objectives
– A sector ready to adapt
– Seizing opportunities that emerge with a changing climate
– A global citizen