Embed Size (px)
Citation preview
Canadian Environmental Quality Guidelines for Diisopropanolamine (DIPA):
Water and Soil
Scientific Supporting Document
PN 1367
ISBN-10 1-896997-57-0 PDF ISBN-13 978-1-896997-57-5 PDF
© Canadian Council of Ministers of the Environment 2006
ii
NOTE TO READERS The Canadian Council of Ministers of the Environment (CCME) is the major intergovernmental forum in Canada for discussion and joint action on environmental issues of national, international and global concern. The 14 member governments work as partners in developing nationally consistent environmental standards, practices and legislation. This document provides the scientific supporting information and rationale for the development of Canadian Water Quality Guidelines as well as Canadian Environmental and Human Health Soil Quality Guidelines for Diisopropanolamine (DIPA). For additional technical information regarding this document, please contact: Environment Canada phone: 819-953-1550 National Guidelines and Standards Office [email protected] 351 Saint-Joseph Boulevard http://www.ec.gc.ca/ceqg-rcqe Gatineau, Quebec K1A 0H3 Canadian Water Quality Guidelines are developed by the Water Quality Guidelines Task Group and Canadian Soil Quality Guidelines are developed by the Soil Quality Guidelines Task Group of CCME. Canadian Council of Ministers of the Environment 123 Main St., Suite 360 Winnipeg, Manitoba R3C 1A3 Ph: (204) 948-2090 Email: [email protected]: www.ccme.ca
iii
TABLE OF CONTENTS
NOTE TO READERS.................................................................................................................... II
TABLE OF CONTENTS............................................................................................................... III
LIST OF FIGURES ......................................................................................................................VI
LIST OF TABLES.........................................................................................................................VI
ABSTRACT.................................................................................................................................VII
RÉSUMÉ......................................................................................................................................IX
ACKNOWLEDGEMENTS ............................................................................................................XI
CHAPTER 1. INTRODUCTION ................................................................................................... 1
CHAPTER 2. BACKGROUND INFORMATION........................................................................... 2 Physical and Chemical Properties ........................................................................................ 2 Analytical Methods................................................................................................................ 2 Production and Uses ............................................................................................................ 3
Production .................................................................................................................... 3 Uses ............................................................................................................................. 4
Existing Guidelines and Criteria in Various Media................................................................ 5
CHAPTER 3: LEVELS IN THE CANADIAN ENVIRONMENT ..................................................... 5
CHAPTER 4. ENVIRONMENTAL FATE AND BEHAVIOUR....................................................... 7 Adsorption and Mobility ........................................................................................................ 7 Leaching and Lateral Movement .......................................................................................... 8 Biodegradation...................................................................................................................... 8
Kinetics ......................................................................................................................... 9 Metabolites ................................................................................................................... 9
Volatilization........................................................................................................................ 10 Photolysis ........................................................................................................................... 10
CHAPTER 5. BEHAVIOUR AND EFFECTS IN TERRESTRIAL BIOTA.................................... 12 Soil Microbial Processes..................................................................................................... 12 Terrestrial Plants................................................................................................................. 12 Terrestrial Invertebrates...................................................................................................... 12
CHAPTER 6. BEHAVIOUR AND EFFECTS IN FRESHWATER AQUATIC BIOTA .................. 14 Aquatic Vertebrates ............................................................................................................ 14 Aquatic Invertebrates.......................................................................................................... 14 Aquatic Plants..................................................................................................................... 15 Other Aquatic Biota............................................................................................................. 15
CHAPTER 7. BEHAVIOUR AND EFFECTS IN MARINE AQUATIC BIOTA ............................. 16 Marine Vertebrates ............................................................................................................. 16
iv
Marine Invertebrates........................................................................................................... 16 Marine Plants...................................................................................................................... 16 Other Marine Biota.............................................................................................................. 16
CHAPTER 8. BEHAVIOUR AND EFFECTS IN HUMANS AND MAMMALIAN SPECIES......... 17 Adsorption, Tissue Distribution, Metabolism and Excretion................................................ 17 Acute Toxicity Studies ........................................................................................................ 17
Dermal and Ocular Studies in Test Animals............................................................... 18 Dermal Studies in Humans......................................................................................... 18
Subchronic Toxicity Studies................................................................................................ 18 Chronic Toxicity and Oncogenicity Studies ........................................................................ 19 Genotoxicity Studies ........................................................................................................... 20 Reproductive and Developmental Toxicity Studies ............................................................ 22 Tolerable Daily Intake ......................................................................................................... 22
Tolerable Daily Intake (TDI)........................................................................................ 23
CHAPTER 9. DEVELOPMENT OF CANADIAN SOIL QUALITY GUIDELINES........................ 25 Environmental Soil Quality Guidelines (SQGE)................................................................... 25 Agricultural and Residential/Parkland Land Uses............................................................... 25
Soil and Food Ingestion Guideline.............................................................................. 26 Nutrient and Energy Cycling Check............................................................................ 26
Commercial and Industrial Land Uses................................................................................ 26 Soil Contact Guideline ................................................................................................ 26 Nutrient and Energy Cycling Check............................................................................ 28 Off-Site Migration Check ............................................................................................ 28
Groundwater Check (Aquatic Life)...................................................................................... 29 pH Check ............................................................................................................................ 29 Data Gaps........................................................................................................................... 30 Human Health Soil Quality Guidelines (SQGHH) ................................................................. 31 Agricultural and Residential/Parkland Uses........................................................................ 31
Soil Ingestion Guideline.............................................................................................. 31 Inhalation of Indoor Air Check .................................................................................... 32 Produce, Meat and Milk Check................................................................................... 32
Commercial Land Use ........................................................................................................ 33 Soil Ingestion Guideline.............................................................................................. 33 Inhalation of Indoor Air Check .................................................................................... 34
Industrial Land Use............................................................................................................. 34 Soil Ingestion Guideline.............................................................................................. 34 Inhalation of Indoor Air Check .................................................................................... 35 Off-Site Migration Check ............................................................................................ 35
Groundwater Check (Drinking Water)................................................................................. 35 Data Gaps........................................................................................................................... 36
CHAPTER 10. DEVELOPMENT OF CANADIAN WATER QUALITY GUIDELINES................. 38 Freshwater Aquatic Life ...................................................................................................... 38
Data Quality................................................................................................................ 38 Data Quantity.............................................................................................................. 38 Guideline Derivation ................................................................................................... 39
Irrigation.............................................................................................................................. 39 Livestock Watering ............................................................................................................. 41
v
Human Drinking Water ....................................................................................................... 42 Ingestion of Drinking Water ........................................................................................ 43 Dermal Contact Check ............................................................................................... 44
Data Gaps........................................................................................................................... 45 Freshwater Aquatic Life.............................................................................................. 45 Marine Aquatic Life..................................................................................................... 45 Irrigation...................................................................................................................... 45 Livestock Watering ..................................................................................................... 46 Drinking Water............................................................................................................ 46
CHAPTER 11. DISCUSSION OF SOIL AND WATER QUALITY GUIDELINES........................ 48 Soil Quality Guidelines........................................................................................................ 48
Environmental Health ................................................................................................. 48 Human Health............................................................................................................. 48
Water Quality Guidelines .................................................................................................... 48 Freshwater Aquatic Life.............................................................................................. 48 Irrigation...................................................................................................................... 48 Livestock Watering ..................................................................................................... 49 Drinking Water..............................................................Error! Bookmark not defined.
REFERENCES ........................................................................................................................... 50
APPENDIX A-1. BIODEGRADATION STUDIES FOR DIISOPROPANOLAMINE. ................... 57
APPENDIX A-2. TOXICITY OF DIISOPROPANOLAMINE TO TERRESTRIAL PLANTS......... 58
APPENDIX A-3. TOXICITY OF DIISOPROPANOLAMINE TO TERRESTRIAL INVERTEBRATES. ..................................................................................................................... 61
APPENDIX A-4. TOXICITY OF DIISOPROPANOLAMINE TO AQUATIC SPECIES. ............... 62
APPENDIX A-5. ACUTE TOXICITY OF DIISOPROPANOLAMINE TO MAMMALIAN SPECIES. 63
APPENDIX A-6. CHRONIC AND SUBCHRONIC TOXICITY OF DIISOPROPANOLAMINE TO MAMMALIAN SPECIES.............................................................................................................. 64
APPENDIX B-1. CORRECTION OF TOXICITY DATA TO RELECT ANALYTICALLY MEASURED CONCENTRATIONS............................................................................................. 65
APPENDIX B-2. ANALYTICAL VS. NOMINAL DIPA IN SOIL (BASED ON DRY WEIGHTS FROM TABLE I-2)....................................................................................................................... 67
APPENDIX B-3. NOMINAL AND ANALYTICAL CONCENTRATIONS IN SOLUTIONS ........... 68
APPENDIX B-4. NOMINAL AND ANALYTICAL CONCENTRATIONS IN SOIL........................ 69
APPENDIX B-5. RAW PLANT AND INVERTEBRATE TOXICITY DATA.................................. 70
APPENDIX B-6. TOXICITY DATA CORRECTED TO REFLECT ANALYTICALLY MEASURED CONCENTRATIONS .................................................................................................................. 71
vi
APPENDIX B-7. TOXICITY DATA CORRECTED TO REFLECT ANALYTICALLY MEASURED CONCENTRATIONS (REGRESSION USED TO CORRECT FOR ANALYTICAL MEASUREMENTS: Y = 1.4452E-05X2 + 0.3592X) ................................................................... 72 LIST OF FIGURES
Figure 1. Canadian Environmental Soil Quality Guidelines (SQGE) for DIPA calculated using the distribution of effect concentration (EC25) of plant and invertebrate species. ...............28
LIST OF TABLES
TABLE 1. Physical and chemical properties of diisopropanolamine. ..........................................11
TABLE 2. Tolerable daily intake of DIPA for humans ................................................................24
TABLE 3. Soil quality guidelines and check values for diisopropanolamine.Error! Bookmark not defined.
TABLE 4. Water quality guidelines for diisopropanolamine. ......................................................47
vii
Abstract This scientific supporting document provides the background information and rationale for the derivation of Canadian Soil Quality Guidelines and Canadian Water Quality Guidelines for diisopropanolamine (DIPA). DIPA is a secondary alkanolamine which is a hygroscopic polar solvent that is completely miscible in water. DIPA has a wide variety of applications such as a solvent used in the Sulfinol process by the petroleum industry to remove acid gases from natural gas streams through chemical absorption. The neutralizing capacity of DIPA salts, their high foaming properties and low level of skin irritation allow them to be commonly used as components of cosmetics, personal care products and detergents. In North America, the Dow Chemical Company (Dow) is the dominant DIPA producer. In 1995, the US production was estimated by Dow to be approximately 7,000 tons per year. DIPA is essentially non-volatile with mobility classified as very high to medium. Biodegradation rates of DIPA in aerobic microcosms showed that first order kinetics with lag times fit the data best. No studies have found that DIPA occurs naturally in the environment. Reports on the presence of anthropogenic DIPA in the environment are limited to data collected at sour gas processing facilities in western Canada. A maximum soil DIPA concentration of 1,480 mg·kg-1 was measured in clay-rich till. Concentrations of DIPA in groundwater collected from contaminated aquifers beneath gas processing facilities were 6 mg⋅L-1 in a sand aquifer, 590 mg⋅L-1 in a shallow till aquifer and 0.07 mg⋅L-1 in creek water. The maximum measured DIPA concentration in found in wetland plants was 208 mg·kg-1 while the maximum concentration in wetland water was 13 mg⋅L-1. Toxicity tests show that when acute concentrations of DIPA are applied to the skin they can cause irritation, dermal toxicity and severe eye irritation in rabbits. Acute inflammation and degeneration of the kidney and urinary bladder was found in rabbits that ingested acute concentrations of DIPA. A test of a sunscreen containing 1% DIPA caused only minimal irritation in humans however there was evidence of sensitization reactions. There is a possibility of an endogenous reaction between DIPA and nitrites in the diet to form nitrosamines which are known carcinogens. Accordingly, a 1000-fold safety factor was applied to the Yamamoto et al. (1989) chronic NOAEL of 391 mg·kg-1 bw·day-1 to derive a human TDI of 0.39 mg·kg-1 bw·day-1. DIPA is known to raise the pH of water with a low buffering capacity which may preclude the survival of certain aquatic organisms. Acute toxicity tests on aquatic invertebrates reported LC50 values ranging from 278 mg⋅L-1 (D. magna) to 1,128 mg⋅L-1 (H. azteca, pH 7.5). Chronic LOEC tests which used reproduction endpoints for C. dubia gave values of 31 mg⋅L-1 at the lower pH (7.7 to 8.4) and 250 mg⋅L-1 at the higher pH (8.2 to 9.4). Acute toxicity tests on aquatic vertebrates yielded a range of LC50 values from 42 mg⋅L-1 (stickleback) to 7,698 mg⋅L-1 (rainbow trout). A chronic study used to calculate the 7-day growth endpoint for the fathead minnow gave a value of 1,000 mg⋅L-1 at both test pHs (ERAC 1998). The results of LOEC toxicity tests performed on green alga ranged from 16 mg⋅L-1 to 63 mg⋅L-1. Based upon these tests, interim water quality guidelines for DIPA were calculated to be 1.6 mg·L-1 for the protection of
viii
freshwater aquatic life. The species maximum acceptable toxicant concentrations (SMATCs) for cereals, tame hays, and pasture crops are 6 mg⋅L-1 in loam and 4 mg⋅L-1 in poor soil. For other crops, SMATCs are 25 mg⋅L-1 in loam and 2 mg⋅L-1 in poor soil. Therefore, the interim irrigation water quality guideline protective of all crop species, regardless of soil type, is 2 mg·L-1. A source guidance value for groundwater was set at 4 mg·L-1. The human health soil ingestion guideline for commercial land use is 97,000 mg⋅kg-1 while the agricultural and residential/parkland land use guidelines are 27,000 mg·kg-1. The industrial off-site migration check for human health endpoints for DIPA is 380,000 mg·kg-1. The maximum DIPA soil concentration that is protective of groundwater as a source of drinking water yields 460 mg·kg-1. The groundwater check is the limiting pathway for this medium, therefore, the soil quality guideline for the protection of human health is 460 mg·kg-1. The DIPA environmental soil contact guideline for agricultural and residential/parkland land uses was calculated to be 360 mg·kg-1 while the soil contact guideline for commercial and industrial land was calculated 750 mg⋅kg-1. The value for the DIPA off-site migration check for ecological endpoints is 5,100 mg·kg-1. The maximum DIPA soil concentration that is protective of freshwater aquatic life was found to be 180 mg·kg-1. The maximum DIPA soil concentration that will ensure soil pH remains below 8.0 is 230 mg·kg-1. The groundwater check is the limiting pathway for this media, therefore, the soil quality guideline for the protection of environmental health is 180 mg·kg-1. This groundwater check is also the limiting pathway for the overall recommended soil quality guideline for DIPA, therefore, the overall value is set at 180 mg·kg-1.
ix
RÉSUMÉ Le présent document scientifique justificatif fournit l’information générale et l’explication pour l’élaboration des Recommandations canadiennes pour la qualité des sols et des Recommandations pour la qualité des eaux au Canada à l’égard de la diisopropanolamine (DIPA). La DIPA est une alkanolamine secondaire qui agit comme solvent polaire hygroscopique complètement miscible dans l’eau. La DIPA se prête à une grande variété d’applications, comme les solvants utilisés dans le processus Sulfinol par l’industrie pétrolière pour retirer les gaz acides des flux gazeux naturels par absorption chimique. Grâce à leur capacité de neutralisation, à leurs grandes propriétés moussantes et à leur faible niveau d’irritation de la peau, les sels de la DIPA sont couramment utilisés dans les cosmétiques, les produits de soins personnels et les détergents. En Amérique du Nord, Dow Chemical Company (Dow) est le principal producteur de DIPA. En 1995, la production américaine annuelle était estimée par Dow à environ 7 000 tonnes. La DIPA est essentiellement non volatile, et sa mobilité va de très élevée à moyenne. Les taux de biodégradation de la DIPA dans un micro-écosystème aérobique a montré qu’une cinétique de premier ordre avec des temps morts présentait le mieux les conditions optimales. Aucune étude n’a prouvé que la DIPA est naturellement présente dans l’environnement. Les rapports sur la présence de DIPA anthropique dans l’environnement se limitent aux données recueillies dans des installations de transformation des gaz acides dans l’Ouest canadien. Dans ces installations, une concentration maximale de DIPA dans le sol de 1 480 mg·kg-1 a été mesurée dans un till très argileux. Les concentrations de DIPA recueillies dans des aquifères contaminés situés sous l’une des installations de transformation de gaz étaient de 6 mg⋅L-1 pour une formation sablonneuse, de 590 mg⋅L-1 pour une formation profonde de till et de 0,07 mg⋅L-1 pour l’eau de ruisseau. Les concentrations maximales de DIPA mesurées dans les plantes poussant dans une zone humide étaient de 208 mg·kg-1 et la concentration maximale dans l’eau en milieu humide était de 13 mg⋅L-1. Les essais de toxicité ont montré que lorsque des concentrations aiguës de DIPA sont appliquées sur la peau, cela entraîne des irritations, une toxicité cutanée et de graves irritations des yeux chez les lapins. On a observé une inflammation et une dégénération aiguë des reins et de la vessie chez les lapins qui ont ingéré des concentrations à effet aigu de DIPA. Un essai mené avec un écran solaire contenant 1 % de DIPA a entraîné une irritation minimale chez les humains, avec des preuves de sensibilisation. Il y a une possibilité de réaction endogène entre la DIPA et les nitrites, qui pourraient former des nitrosamines, un cancérogène connu. En conséquence, un facteur de sécurité de 1 000 a été appliqué à la dose sans effet nocif observé, dans un essai de toxicité chronique, par Yamamoto et coll. (1989) de 391 mg·kg-1 de poids corporel jour-1 pour obtenir une dose journalière admissible chez les humains de 0,39 mg·kg-1 de poids corporel jour-1. La DIPA est reconnue pour hausser le pH de l’eau avec un faible pouvoir tampon qui pourrait empêcher la survie de certains organismes aquatiques. Des essais de toxicité aiguë sur des
x
invertébrés aquatiques ont montré des valeurs de CL50 allant de 278 mg⋅L-1 (D. magna) à 1 128 mg⋅L-1 (H. azteca, pH 7,5). Des essais d’exposition chronique pour établir la concentration minimale avec effet observé utilisant les valeurs de reproduction pour C. dubia ont donné des résultats de 31 mg⋅L-1 au plus bas pH (7,7 à 8,4) et de 250 mg⋅L-1 au pH le plus élevé (8,2 à 9,4). Des essais de toxicité aiguë sur des vertébrés aquatiques ont obtenu des valeurs de CL50 de 42 mg⋅L-1 (épinoche) à 7 698 mg⋅L-1 (truite arc-en-ciel). Dans le cadre d’une étude de toxicité chronique utilisée pour calculer le résultat final de croissance en 7 jours pour la tête-de-boule, on a obtenu une valeur de 1 000 mg⋅L-1 pour les deux tests de pH (ERAC, 1998). Les résultats des essais de toxicité de concentration minimale avec effet menés sur des algues vertes vont de 16 mg⋅L-1 à 63 mg⋅L-1. Selon ces essais, les recommandations provisoires pour la qualité des eaux en ce qui a trait à la DIPA ont été calculées à 1,6 mg·L-1 pour la protection de la vie aquatique en eau douce. Pour les céréales, le foin cultivé et les pâturages, les concentrations maximales acceptables de toxiques pour une espèce (CMATE) sont de 6 mg⋅L-1 dans le limon et de 4 mg⋅L-1 dans les sols pauvres. Pour les autres cultures, les CMATE sont de 25 mg⋅L-1 dans le limon et de 2 mg⋅L-1 dans les sols pauvres. Les recommandations provisoires pour la qualité des eaux de toutes les cultures, peu importe le type de sol, sont de 2 mg·L-1. La valeur-guide de 4 mg·L-1 a été établie pour les sources d’eau souterraine. La recommandation pour la qualité des sols à l’égard de l’effet de l’ingestion de sol sur la santé humaine pour les terrains commerciaux est de 97 000 mg⋅kg-1 et de 27 000 mg·kg-1 pour les terrains agricoles et à vocation résidentielle ou de parc. La valeur pour la vérification de la migration hors site des terrains industriels relativement aux valeurs de seuil pour la santé humaine de la DIPA est de 380 000 mg·kg-1. La concentration maximale dans le sol qui protège les eaux souterraines comme source d’eau potable atteint 460 mg·kg-1. La vérification pour les eaux souterraines est la voie limite pour ce milieu; ainsi, la recommandation pour la qualité du sol en vue de protéger la santé humaine est de 460 mg·kg-1. La recommandation environnementale relative à la DIPA en contact avec le sol concernant l’utilisation des terres agricoles ou à vocation résidentielle ou de parc a été calculée à 360 mg·kg-1 tandis que la recommandation concernant le contact avec le sol pour les terres commerciales et industrielles s’élève à 750 mg⋅kg-1. La valeur pour la vérification de la migration hors site de la DIPA en ce qui a trait aux effets sur l’écologie est de 5 100 mg·kg-1. La concentration maximale de la DIPA dans le sol qui protège la vie aquatique en eau douce est de 180 mg·kg-1. La concentration maximale de la DIPA dans le sol qui assure un pH de moins de 8,0 est de 230 mg·kg-1. Le mécanisme de vérification des eaux souterraines est la voie limite pour ce milieu; ainsi, la valeur recommandée pour la qualité du sol en ce qui a trait à la protection de la santé de l’environnement est de 180 mg·kg-1. Cette vérification des eaux souterraines est aussi la voie limite pour la recommandation générale de la qualité du sol à l’égard de la DIPA; par conséquent, la valeur globale est établie à 180 mg·kg-1.
xi
Acknowledgements This report is the scientific supporting document for the Canadian Environmental Quality Guidelines for diisopropanolamine (DIPA). A draft of this report was submitted by Komex International Ltd on behalf of the Canadian Association of Petroleum Producers (CAPP) to the Soil Quality Guidelines Task Group and to the Water Quality Task Group of Canadian Council of Ministers of the Environment for consideration as Canadian Environmental Quality Guidelines. Environment Canada co-ordinated the peer review of the draft document and provided scientific expertise and technical assistance in its revision on behalf of both CCME task groups. CCME and Environment Canada provided additional funding and in-kind contributions toward this project. Miles Tindal and Jim Sevigny are acknowledged for their major scientific contribution to the original draft from Komex International Ltd. Kelly Potter, Susan Roe and Jonathan Hill of Environment Canada are acknowledged for their significant efforts in finalising this document. Members of both the Soil Quality Guidelines Task Group and the Water Quality Task Group are thanked for their contributions, as are the peer reviewers: Doug Bright, Peter Chapman, Gordon Craig, John Headley, L.S. McCarty, Stephanie Meakin, and Daniel Nadon.
1
CHAPTER 1. INTRODUCTION Canadian Soil Quality Guidelines are numerical concentrations or narrative statements that specify levels of toxic substances or other parameters in soil that are recommended to maintain, improve or protect environmental quality and human health. They are developed using formal protocols to ensure nationally consistent, scientifically defensible values. The guidelines are nationally endorsed through the Canadian Council of Ministers of the Environment (CCME). This report reviews the sources and emissions of diisopropanolamine (DIPA), its distribution and behaviour in the environment, and its toxicological effects on soil micro-organisms, plants, animals, and humans. Soil quality guidelines are derived according to “A Protocol for the Derivation of Environmental and Human Health Soil Quality Guidelines” (CCME 1996; CCME 2003) for various land uses: agricultural, residential/parkland, commercial and industrial. In addition, various check mechanisms considering indirect pathways of exposure (e.g., nutrient and energy cycling check and off-site migration of contaminants via wind and water erosion) are used to provide protection for resources and receptors not otherwise considered in the derivation of soil quality guidelines. The following derived values should be considered for general guidance purposes; however, in the application of these values, site-specific conditions should be considered. Because the guidelines may be applied differently in various jurisdictions, the reader should consult appropriate authorities for guidance in the application of these guidelines. The guidelines represent a limit below which no adverse impacts are expected, but site-specific information, should always be considered in the application of these guidelines.
2
CHAPTER 2. BACKGROUND INFORMATION Diisopropanolamine [CAS#110-97-4], C6H15NO2, is known under a variety of synonyms and trade names, including (bis(2-hydroxypropyl)amine, 1,1’-iminodi-2-propanol, bis(2-propanol)amine, 1,1’ iminodipropan-2-ol, DIPA, 1,1’iminobis-2-propanol, dipropyl-2,2-dihydroxyamine, 1,1’-iminodi-2-propanol, 1,1’-iminobis(2-propanol)). Diisopropanolamine (DIPA) belongs to the chemical group of alkanolamines. Alkanolamines are organic derivatives of ammonia and are classified based on the number of substituent groups attached to the nitrogen atom. Substitution of one organic alcohol group, ROH, for one of the hydrogen atoms of ammonia (NH3) forms a primary alkanolamine (ROHNH2). Similarly, substitution of two and three organic groups yield secondary (ROH)2NH and tertiary (ROH)3N alkanolamines, respectively (Solomons and Graham 1988). DIPA is a secondary alkanolamine. The synthesis of DIPA was first reported in the chemical literature in the late 19th century.
Physical and Chemical Properties
Published physical and chemical properties of DIPA are summarized in Table 1. Alkanolamines have a basicity similar to aqueous ammonia, are completely miscible in water, and are polar solvents. They are characterized by a mild ammoniacal odour and are extremely hygroscopic. The subgroup of isopropanolamines results from the reaction of propylene oxide (C3H6O) with ammonia and comprises (monoisopropanolamine (MIPA), diisopropanolamine (DIPA), and triisopropanolamine (TIPA), with the general formula NH3-n(CH2CHOHCH2CH3)n. At room temperature, DIPA is a white solid. Analytical Methods
There are currently no recommended methods for DIPA analysis published by CCME or the United States Environmental Protection Agency (US EPA). Generally, DIPA can be analyzed by gas chromatography, high performance liquid chromatography (HPLC), ion chromatography (IC), or wet test methods. Methods using derivatization, gas chromatograph (GC) separation, and flame ionization detection (FID) were described by Bachelor (1976) and Langvardt and Melcher (1980). GC methods without derivatization using packed or capillary columns were reported in CAPP (1997) using direct injection and a nitrogen-phosphate detector and Dawodu and Meisen (1993) using a flame ionization detector. GC methods for DIPA analysis were summarized by Witzaney and Fedorak (1996) and evaluated by CAPP (1997). Direct injection using a flame ionization or nitrogen-selective detector in combination with a capillary column did not yield satisfactory results. Problems were attributed to contamination of the injection port liner. Similarly, DIPA analysis using a packed stainless steel column and a flame ionization detector was associated with carryover (“ghosting”)
3
and required that the column was conditioned. DIPA analysis using a non-polar, megabore, thick-filmed capillary column that had been base-deactivated and using a nitrogen-selective detector was more successful. However, the matrix of the samples studied contained NH4Cl and chloroform, which interfered with the nitrogen-selective detector. Methods for DIPA analysis employing high performance liquid chromatography were discussed by Einarsson et al. (1986), Nasholm et al. (1987), and Serbin and Birkholz (1995).
Headley et al. (1999a) described a method for analysis of vegetation samples collected from a DIPA-contaminated wetland. Sample preparation included grinding and homogenizing frozen vegetation samples under liquid nitrogen. Ground samples were transferred into centrifuge tubes and allowed to warm to room temperature. Following addition of deionized water and equilibration for 45 minutes, samples were centrifuged for 45 minutes at 2,500 rpm. DIPA supernatants were analyzed using ion chromatography-electrospray ionization-tandem mass spectrometry. Analytical methods used by two commercial laboratories that routinely conduct environmental DIPA analysis of water and soil samples are summarized below: The first laboratory performs DIPA analysis based on the method described by Einarsson et al. (1986) and Serbin and Birkholz (1995). Water samples or aqueous extracts of soil samples are derivatized to 9-fluorenylmethyl formides. Analysis is then performed by HPLC. Detection limits are 1 mg⋅L-1 and 2.5 mg·kg-1 for water and soil, respectively. The second laboratory uses an IC method for DIPA analysis. Water samples are filtered prior to analysis. Soil samples are extracted with deionized water and the extract is also filtered. Water samples or extracts are analyzed by IC using a specialized column for separation and a two-solvent gradient. DIPA detection is achieved with an electrochemical detector using pulsed amperometry. Detection limits are 0.005 mg⋅L-1 and 0.05 to 0.1 mg·kg-1 for water and soil, respectively. Production and Uses
This section on the production and uses of DIPA was summarized from information in Kirk-Othmer (1999), except where otherwise indicated. Production Isopropanolamines have been commercially available for over 40 years. DIPA is synthesized by a reaction of propylene oxide (C3H6O) with ammonia (NH3). The reaction path is shown below:
2156363 NOHCNHOH2C →+
4
In North America, the Dow Chemical Company (Dow) is the dominant DIPA producer. In 1995, the US production was estimated by Dow to be approximately 7,000 tons per year. Commercially, DIPA is available as commercial grade compound (98% pure, containing a maximum of 0.5% water) and as low freezing grade DIPA (containing 10 or 15% deionized water by weight). Uses DIPA has a wide variety of commercial, industrial, and household applications. Based on its physical and chemical properties, DIPA applications include gas treating, cosmetics and personal care products, detergents, metalworking fluids, coatings, corrosion inhibitors, and cement applications. Commercial and industrial uses of DIPA summarized by Dow (1999) and in Kirk-Othmer (1999) are provided below: Gas Treating
DIPA is used as a solvent in the Sulfinol process to remove acid gases from natural gas streams. The utility of DIPA in these gas “sweetening” processes is based on an H2S selectivity (Goar and Arrington 1979). The Sulfinol process was introduced by Shell in 1963 and consists of passing the natural sour gas stream through a mixture of sulfolane, DIPA, or methyldiethanolamine, and water. Acid gases including hydrogen sulphide (H2S), carbon dioxide (CO2), carbonyl sulphide (COS), carbon disulphide (CS2), and mercaptans (thiols) are physically absorbed by sulfolane and chemically absorbed by DIPA thereby “sweetening” the gas stream. In the acid gas removal (AGR) process, the weakly basic alkanolamines react with acid gases to form salts that are thereby removed from the gas stream. Amine salts are subsequently decomposed by thermal regeneration. Cosmetics and Personal Care Products
Alkanolamine salts, including DIPA salts, are used as raw materials in the manufacture of creams (Jellinke 1970; Balsam and Sagarin 1972; Navarre 1975), lotions, shampoos, soaps, and cosmetics based on their high foaming properties and low skin irritation. DIPA and MIPA may comprise up to 10% of emulsifying agents for cosmetic lotions, bath preparations, and neutralizers in cosmetics (Beyer et al. 1987). Chemistry similar to that used in soluble oils and other emulsifiers is applicable to cleansing creams and lotions. Isopropanolamines, including DIPA, neutralize acidic components, and provide a balanced pH and suitable surfactant properties for hair sprays, hair wave lotions, skin lotions, and moisturizers. Detergents and Cleaners
DIPA is used extensively in soaps, cleaning products and detergents as an emulsifying and wetting agent, a foam stabilizer, and a rinse improver (Dow 1999). Alkanolamines (including DIPA) are also used in phosphate-free liquid detergents. In non-enzyme products, they contribute alkalinity, pH control, and enhancement of product stability. In enzyme products, alkanolamines contribute to the stability of the enzyme in water solutions.
5
Metal Working Fluids
Isopropanolamines (DIPA, MIPA, and TIPA) are widely used in the metal working industry for corrosion protection, lubrication, foam suppression, and reduction of friction in metal cutting operations. Coatings
In metal-coating preparations, alkanolamines (including DIPA) are used as metal-complexing agents, neutralizers, promoters, modifiers, corrosion inhibitors and in electrocoating. DIPA further assists in improving curing resins, improving storage stability, and improving both fresh and salt water resistance for some types of coatings. In water-borne coatings, DIPA is used for acid neutralization, improvement of water solubility, and reduction of water sensitivity and discoloration (Dow 1999). Corrosion Inhibitors
Alkanolamines (including DIPA) inhibit corrosion of ferrous metals. Applications include coolant systems, lubricating oils, metal working fluids, petroleum anti-fouling, and drilling needs. Corrosion inhibitors for aluminum that contain alkanolamines have also been discussed in the literature. Cement Applications
Among other alkanolamines (e.g., MIPA and TIPA), DIPA is often used in cement admixtures as an accelerator to reduce set time (Kirk-Othmer 1999; Dow 1999). Miscellaneous Uses
Additional applications for DIPA include herbicides, pesticides, insecticides, paint strippers, wax removers, polishes, paper and paperboard, photographic intermediates, plastics and polymers, and as polyurethane additive. Existing Guidelines and Criteria in Various Media
Federal or provincial environmental quality guidelines have not been developed for DIPA. Chapter 3: Levels in the Canadian Environment The occurrence of DIPA in the environment has been reported in groundwater, surface water, soil, and plants in the vicinity of facilities where it has been used. Reports on the presence of anthropogenic DIPA in the environment are limited to data collected at three sour gas processing facilities in Alberta and British Columbia (CAPP 1997; Wrubleski and Drury 1997). At these facilities, a maximum soil DIPA concentration of 1,480 mg·kg-1 was measured in clay-rich till. Maximum measured DIPA concentrations in groundwater collected from contaminated aquifers beneath the gas processing facilities were 6 mg⋅L-1 in a sand aquifer (Greene et al. 1999) and 590 mg⋅L-1 in a shallow till aquifer. At one of the facilities, DIPA-impacted groundwater discharged via a wetland into a creek. Levels within the wetland and the creek were significantly reduced
6
compared to the discharging groundwater. Maximum DIPA concentrations reported in groundwater and creek water were 590 and 0.07 mg⋅L-1, respectively. DIPA uptake by wetland vegetation was studied as part of a CAPP research program to evaluate natural attenuation processes in contaminated wetlands (CAPP 1998; 1999; 2000). Roots, stems, leaves, flower heads, seed heads, and berries of cattail, dogwood, sedge, marsh reed grass, cow parsnip, and smooth brome growing in a DIPA-impacted wetland were included in the study (CAPP 1999 and 2000; Headley et al. 1999b). Analytical results indicated highly variable DIPA concentrations for different parts of the same species (e.g., roots versus leaves), between different plant species (e.g., cattail leaves versus sedge leaves), and even between different samples of the same part of the same species. The maximum measured DIPA concentration in plants in the wetland was 208 mg·kg-1. The maximum measured DIPA concentration in water within the wetland was 13 mg⋅L-1. No studies were found that had detected DIPA as a naturally-occurring compound in the environment.
7
CHAPTER 4. ENVIRONMENTAL FATE AND BEHAVIOUR The fate and behaviour of a compound released to the subsurface environment is determined by the physical and chemical properties of the compound and the attenuation processes (e.g., biodegradation) to which it is subjected. The relationship between compound properties, and fate and behaviour can be used to predict the potential for the persistence and transport of DIPA. Physical and chemical properties of DIPA (Table 1) in combination with recently published sorption studies and an alkanolamine fate and transport study conducted by Sorensen et al. (1996) are discussed in the sections below to evaluate the environmental fate and behaviour of DIPA. The environmental fate and behaviour of DIPA are affected by its physical and chemical properties and susceptibility to biodegradation, as well as the hydrogeological and geological properties of the aquifer material. Adsorption and Mobility
Luther et al. (1998) investigated DIPA sorption parameters in batch equilibration studies. Sorbent materials included aquifer sediments from three DIPA-contaminated sour gas treatment facilities, reference clays of pure montmorillonite and kaolinite, and six soils of various clay and organic matter contents. DIPA sorption isotherms were found to be curvilinear, and the slope decreased with increasing concentration. X-ray analysis of DIPA-saturated montmorillonite showed that DIPA enters the interlayer space of the mineral. Sorption by aquifer materials was interpreted to be relatively independent of organic carbon content, but a strong function of montmorillonite content. The DIPA distribution coefficient (Kd) for montmorillonite (16 to 42 L·kg-1) was higher than for humus-rich soil (2.0 L·kg-1). Cation exchange capacity (CEC) was found to be a reasonable predictor of DIPA sorption by soils and aquifer materials with low organic carbon content (i.e., <1%). The mean Kd measured for the six soils and three aquifer sediments was 2.2 L·kg-1 (Table 1) with a standard deviation of 1.4 L·kg-1. DIPA retardation coefficients calculated by Luther et al. (1998) for aquifer sediments were 3.2, 5.3, and 12 for weathered sandstone, weathered shale/sandstone, and clay-rich till, respectively. These values indicate that, particularly in the presence of clay-rich sediments, DIPA migration is significantly retarded relative to groundwater flow velocity. The organic carbon-water partition coefficient (Koc) and the n-octanol-water partition coefficient (Kow) represent the equilibrium ratio of DIPA sorbed by organic carbon or octanol to its concentration in water, respectively. The low Koc, Kow, and pKa (negative logarithm of the acid dissociation constant) values, and high water solubility of DIPA (Table 1) are consistent with the findings of the sorption study summarized above; the potential for DIPA to sorb to sediments or soils is relatively low, but increases with the proportion of clay, and particularly with the proportion of montmorillonite clay. Note that Table 1 includes two differing values for Kow (-0.072, and 0.79). This likely reflects the fact that Kow will vary with pH, due to the increasing protonation at lower pH values.
8
Leaching and Lateral Movement
The leaching and lateral movement potential of DIPA is determined by its relatively strong affinity for sorption to montmorillonite, low retardation coefficients in DIPA-contaminated aquifer sediments (except for montmorillonite), and high solubility. CAPP (1997) used the classification system of McCall et al. (1980) to classify DIPA mobility as very high to medium. The mean retardation factor estimated from the data for DIPA at three sour gas facilities was 6.8 (Luther et al. 1998). Thus, DIPA is predicted to partition between water and montmorillonite in the vadose (i.e., unsaturated) zone. Once in the saturated zone, the migration rate of DIPA is a function of the clay content (i.e., montmorillonite) of the aquifer material, the hydraulic conductivity of the aquifer material, the hydraulic gradient, and the susceptibility of DIPA to biological attenuation processes (i.e., biodegradation).
Biodegradation
The biodegradation of DIPA has been investigated in acclimated sewage sludge, refinery wastewater, in laboratory microcosm studies using contaminated aquifer sediments, and as part of a natural attenuation study in natural wetlands. DIPA biodegradation has been examined using nutrient-amended and -unamended microcosms, under aerobic and anaerobic conditions, and at temperatures ranging from 8°C to 28°C. Microcosm studies were conducted using water with sediments and soils from DIPA-contaminated aquifers. DIPA concentrations reported in these microcosm studies reflect chemical analysis of the supernatant liquid in mg⋅L-1. Aquifer materials ranged from sandstone, to till and sand, to wetland sediments. Materials, conditions, lag times and biodegradation rates reported in microcosm studies are summarized in Appendix A-1. Most studies have demonstrated that DIPA biodegrades in aerobic microcosms from a variety of DIPA-contaminated environmental samples. Reported DIPA biodegradation rates and lag times (i.e., time required before degradation starts) are highly variable. Biodegradation rates range from 0 to 70 mg⋅L-1 day-1. Lag times range from <1 to 220 days (Appendix A-1). Witzaney and Fedorak (1996) reviewed previous work conducted on DIPA biodegradation. Their review indicated that some studies provided evidence of DIPA degradation (Bridié et al. 1979; CAPP 1997; Chong 1994), whereas results of Rothkopf and Bartha (1984) suggested that DIPA did not support microbial growth. Gieg et al. (1998) conducted aerobic and anaerobic microcosm studies at 8°C and 28°C using a variety of sediments from contaminated aquifers. Shake flask cultures were incubated at 8ºC and 28ºC under addition of the appropriate nutrients such as nitrogen and phosphate. This study documented the presence of aerobic and anaerobic microbial DIPA degraders in contaminated aquifer sediments from three sour gas treatment facilities. Under aerobic conditions at 28°C, DIPA was completely removed. DIPA removal was significantly slower at 8°C and complete DIPA removal was not achieved. Refeeding of microcosms with additional DIPA led to faster and complete DIPA removal at 8°C and 28°C. Under anaerobic conditions, DIPA biodegradation was confirmed to occur at 28ºC under NO3
-, Mn4+, and Fe3+ reducing conditions.
9
At 8°C, evidence of anaerobic degradation under NO3-, Mn4+, and Fe3+ reducing conditions was
observed in a limited number of microcosms. Kinetics Different studies identified different kinetics that best fit the observed DIPA degradation. Gieg et al. (1998) found that first order kinetics fit the data best, and they calculate a half life for the degradation process (Appendix A-1). In contrast, the studies by Greene et al., (1999) and Chong (1994) found that the observed DIPA degradation was better described by a lag time followed by a rate constant (mg·L-1·day-1) for the subsequent “zero order” degradation. However, the criterion for assessing persistence in surface water is based on half-life; a chemical is considered non- persistent if its half-life is less than 8 weeks (CCME 1999). Accordingly, a “pseudo-half life” was generated for each of the studies by Greene et al., (1999) and Chong (1994) and reported in Appendix A-1. A pseudo half-life is defined here as the half-life that correctly predicts the time taken for DIPA to reach the analytical detection limit. The pseudo half life was generated by i) calculating the number of half lives required under first order kinetics for the initial concentration in each experiment to be reduced to the detection limit (1 mg·L-1); ii) calculating the time required (including lag time) for DIPA to be degraded from the initial concentration to the detection limit, and; iii) dividing the results from ii) by the results from i). Appendix A-1 groups the microcosm experiments into three groups. The most relevant data to determining the environmental persistence of DIPA in surface water are the “surface water studies”, where wetland sediment together with corresponding surface water samples were spiked with DIPA and incubated. These microcosms yielded pseudo half lives in the range of 2 to 38 days (Appendix A-1), and included microcosms with no nitrogen or phosphate supplementation. These pseudo half lives are significantly less than the criterion of 8 weeks noted above, and accordingly, DIPA is considered a non-persistent variable in surface water. The remainder of the microcosms in Appendix A-1 are relevant to groundwater rather than surface water, and are discussed in Section 3. Briefly, these data indicate that microcosms consisting of aquifer material and groundwater with the addition of phosphate can degrade DIPA rapidly (pseudo half lives on the order of a few days) while similar microcosms without supplementary phosphate may not degrade at all. The findings noted above are in accordance with field observations (Komex International Ltd., unpublished data) over a number of years which indicate that DIPA can be persistent in groundwater, however it degrades rapidly once the ground water discharges to a surface water body. Metabolites West (1995) suggested that the DIPA biodegradation pathway occurs via the metabolites N-(2-oxopropyl)-isopropanolamine to MIPA and methylglyoxal. MIPA has been identified as an intermediate metabolite in soil microcosms (CAPP 1997). The aerobic microbial metabolism of MIPA was studied by Jones and Turner (1973). The aerobic pathway occurred via initial activation to 1-aminopropan-2-ol o-phosphate to propionaldehyde, which was subsequently
10
oxidized to propanoic acid. Propanoic acid was hypothesized to be further metabolized. Anaerobic biodegradation of MIPA was investigated by Chou et al. (1978), who documented that MIPA can be biodegraded under methanogenic conditions. Gieg et al. (1999) used radio-labelled 14C-DIPA to investigate the microbial mineralization of DIPA. They demonstrated the release of 14CO2 from 14C-DIPA and the reduction of the respective electron acceptors in aerobic and anaerobic microcosm studies at 8°C and 28°C. In anaerobic cultures, DIPA degradation was observed under NO3
- and Mn4+ reducing conditions at 8°C and 28°C, whereas DIPA-degrading activity was difficult to sustain under Fe3+ reducing conditions. In aerobic cultures, between 30 and 50% of the nitrogen from DIPA was found as ammonium-nitrogen. Volatilization
Volatilization potential is commonly expressed using the vapour pressure and the Henry’s law constant of a compound. The Henry’s law constant is the equilibrium ratio of the concentration in the gas phase to the concentration in the aqueous phase. This value is closely related to the vapour pressure of a compound but is also dependent on its aqueous solubility and molecular weight and, therefore, can be used to make a more accurate prediction of volatility than one based on solely on vapour pressure. Lyman et al. (1982) used Henry’s law constants to classify volatilization potential as follows: • values less than 10-7 atm·m3·mol-1 indicate the substance is less volatile than water and can be
considered essentially non-volatile; • values between 10-7 and 10-5 atm·m3·mol-1 indicate the substance may volatilize slowly but
the compound will still tend to partition into the aqueous phase; • values between 10-5 and 10-3 atm·m3·mol-1 indicate volatilization is significant; and, • values greater than 10-3 atm·m3·mol-1 indicate the majority of the mass of the compound will
tend to partition into the gas phase. The vapour pressure of a compound is the pressure that the vapour phase of a compound exerts at equilibrium with its aqueous phase. Vapour pressures are reported for a given temperature and increase with increasing temperature. Compounds with high vapour pressures are more likely to volatilize than those with lower vapour pressures. Thus, the potential of vapour-phase transport of a compound increases with increasing vapour pressures. The low Henry’s law constant of DIPA (1.72 x 10⁻⁷ atm·m3·mol-1), combined with a low vapour pressure (0.02 mm Hg at 42°C) (Table 1), suggest that DIPA can be considered essentially non-volatile. Thus, vapour-phase transport in the vadose zone is not expected to be significant.
Photolysis
No information on the susceptibility of DIPA to phototransformation reactions was available at the time this report was prepared.

11
TABLE 1. Physical and chemical properties of diisopropanolamine.
Property Units Value Reference
CAS registry number - 110-97-4 Molecular formula - C6H15NO2 Lide (1996) Molecular weight g⋅mol-1 133.19 Lide (1996) Melting point º C 44 Kirk-Othmer (1999) Boiling point º C 249 Kirk-Othmer (1999) Specific gravity 20º C (DIPA) /4º C (Water) 40º C (DIPA) /4º C (Water)
- -
1.004 0.992
Aldrich (1990) Dow (1999)
Flashpoint º C 126 (closed up) Lenga (1985) Density at 25º C g⋅cm-3 0.989 Lide (1996) Vapour density (air=1) g⋅L-1 4.6 Verschueren (1996) Vapour pressure 42º C 50º C 100º C
mm Hg mm Hg
hPA
0.02
0.035 3
Verschueren (1996) Dow (1999) Verschueren (1996)
n-Octanol-water partition coefficient (Kow)
log log
-0.072 0.79
Dow (1995) Verschueren (1996)
Organic carbon partition coefficient (Koc) log 21.77 Dow (1995) Henry’s law constant atm⋅m-3⋅mol-1 1.72 x 10⁻⁷ Dow (1995) Solubility in water 25º C 25º C
g/100g g⋅L-1
1,200 870
Kirk-Othmer (1999) Verschueren (1996)
Water soil partition coefficient (Kd) montmorillonite kaolinite humus-rich soil low carbon content surface soils till sandstone, shale/sandstone mean value for nine soils/sediments
L/kg L/kg L/kg L/kg L/kg L/kg L/kg
16-42
3.5 2.0
0.73-4.0 3.2
0.54-1.1 2.2
Luther et al. (1998) Luther et al. (1998) Luther et al. (1998) Luther et al. (1998) Luther et al. (1998) Luther et al. (1998) Luther et al. (1998)
pKa -log K 8.88 Kim et al. (1987) Viscosity 30º C 54º C
centipoise centipoise
870 86
Sorensen et al. (1996) Kirk-Othmer (1999)
12
CHAPTER 5. BEHAVIOUR AND EFFECTS IN TERRESTRIAL BIOTA Soil Microbial Processes
Specific studies designed to address the effect of DIPA on nitrogen fixation, nitrification, carbon cycling, or nitrogen mineralization have not been conducted. However, a number of biological fate studies have been conducted to determine the biodegradation rate of DIPA by indigenous soil bacteria. Soil microcosms containing DIPA have been investigated by CAPP (1997), Chong (1994), Geig et al. (1998, 1999), and Greene et al. (1999). These studies are summarized in Appendix A-1 and are discussed here because they provide concentrations at which soil dwelling bacteria were presumed to be unaffected, and were capable of degrading DIPA. The study by Greene et al. (1999) provides evidence that DIPA is readily biodegradable at concentrations up to 350 mg⋅L-1 (Appendix A-1). These researchers showed that mixed populations of indigenous bacteria were active in subsurface environments contaminated with up to 350 mg⋅L-1 DIPA. Terrestrial Plants
The toxicity of DIPA to terrestrial plants is summarized in Appendix A-2. Two toxicity studies have been completed. Data for both studies are provided in CAPP (2001). The first study (Komex 1999) conducted on lettuce (Lactuca sativa), consisted of a five day seed emergence test. Komex (1999) reported a LOEC for seed emergence of 13,000 mg⋅kg-1 for lettuce grown in artificial soil (Appendix A-2). The terrestrial plant toxicity testing completed for CAPP (2001) (Appendix A-2) was conducted by Scientific Information Services (SIS) using an Environment Canada (1998a) draft protocol, four plant species (lettuce (Lactuca sativa), carrot (Daucus carota), alfalfa (Medicago sativa), and timothy (Phleum pratense)), and four soils (artificial soil, loam, sand and till) with differing texture, organic carbon content, and cation exchange capacity. The endpoints measured in the seven day tests were emergence, biomass, root length, and shoot length (Appendix A-2). The majority of species/endpoint combinations were most sensitive to DIPA in sand or till, and least sensitive in loam. Terrestrial Invertebrates
The toxicity of DIPA to terrestrial invertebrates is summarized in Appendix A-3. Two acute toxicity studies using an Environment Canada (1998b) draft protocol and measuring 7 and 14 day mortality endpoints have been conducted using earthworms (Eisenia fetida). Data for both studies are provided in CAPP (2001). Acute toxicity testing of earthworms is a widely used and accepted method of assessing toxicity to terrestrial invertebrates (e.g., OECD 1984; Greene et al. 1989).
13
Komex (1999) reported an LC25 value of 7,600 mg⋅kg-1 (Appendix A-3). The earthworm toxicity testing completed for CAPP (2001) (Appendix A-3), was conducted by SIS on four soils (artificial soil, loam, sand and till) with differing texture, organic carbon content, and cation exchange capacity, and using an Environment Canada (1998b) protocol. pH values for the tests ranged from 6.8 to 8.1. LC25 values were lowest for sand (2,070 mg⋅kg-1) and highest for loam (23,100 mg⋅kg-1 Appendix A-3).
14
CHAPTER 6. BEHAVIOUR AND EFFECTS IN FRESHWATER AQUATIC BIOTA Available data on the toxicity of DIPA to freshwater and marine aquatic species are presented in Appendix A-4. Toxicological studies on rainbow trout (Oncorhynchus mykiss) and the sideswimmer (Hyalella azteca) were commissioned by CAPP (2001). ERAC (1998) included a review of previous published and unpublished freshwater aquatic toxicological data, and a report on freshwater toxicological studies, which were commissioned for the ERAC (1998) report. DIPA has a pKa of 8.9 (Table 1), which means that below a pH of 8.9, DIPA is present predominantly in its charged, protonated form. Conversely, above pH 8.9, DIPA is predominantly unprotonated (Chapter 3). This behaviour has the potential to affect the toxicity of DIPA to freshwater aquatic life. In addition, adding DIPA to water with a low buffering capacity will result in an alkaline pH, which may preclude the survival of certain organisms, due to pH alone. Accordingly, the CAPP (2001) and ERAC (1998) studies ran DIPA toxicity tests at two pHs. The toxicity tests completed for CAPP (2001) were conducted at buffered pH values of 7.5 and 8.5. In the ERAC (1998) study, one test was run with the pH not controlled (designated pH >9 in Appendix A-4), while the pH in the other test was buffered to 8.0. Aquatic Vertebrates
Data were available for seven species of aquatic vertebrates (Appendix A-4). An acute lethality study on rainbow trout (Oncorhynchus mykiss) was completed for CAPP (2001). ERAC (1998) completed a 7-day survival and growth test on fathead minnows (Pimephales promelas). The results of acute lethality studies on clawed toad (Xenopus laevis), goldfish (Carassius auratus), ide (Leuciscus idus), mosquito fish (Gambusia sp.), and stickleback (species not specified) were also available (deZwart and Sloof 1987, Bridie et al. 1979b, BASF AG 1987a, Huels 1992, Exxon 1986). Reported LC50 values for the acute tests ranged from 42 mg⋅L-1 (stickleback) to 7,698 mg⋅L-1 (rainbow trout). The LOEC for the 7-day growth endpoint for the fathead minnow was 1,000 mg⋅L-1 at both test pHs (ERAC 1998). Aquatic Invertebrates
Four studies considered the toxicity of DIPA to three species of aquatic invertebrates (Appendix A-4). An acute lethality study on a sideswimmer (Hyalella azteca) was completed at two pH values (CAPP 2001). Two studies reported the acute lethality of DIPA to Daphnia magna (ERAC 1998, BASF AG, 1988), and one study investigated the 7-day (chronic) reproduction and survival endpoints in Ceriodaphnia dubia (ERAC 1998). Reported LC50 values for the acute tests ranged from 278 mg⋅L-1 (D. magna) to 1,128 mg⋅L-1 (H. azteca, pH 7.5). The LOECs for the reproduction endpoints for C. dubia were 31 mg⋅L-1 at the lower pH (7.7 to 8.4) and 250 mg⋅L-1 at the higher pH (8.2 to 9.4).
15
Aquatic Plants
Only one study for an aquatic vascular plant was available. SRC (1994) reported the EC50 for duckweed (Lemna minor) growth to be 1,500 to 2,300 mg⋅L-1. Two studies on the green alga Selenastrum capricornutum and one study on the green alga Scenedesmus suspicatius were available for various endpoints (ERAC 1998, BASF AG 1988, SRC 1994). The LOEC values, where reported, ranged from 16 mg⋅L-1 to 63 mg⋅L-1. Other Aquatic Biota
Other aquatic biota include all aquatic organisms not included in the animal or plant kingdoms. This covers organisms from the kingdoms Monera, Protista, and Fungi. A study by SRC (1994) measured 14C uptake and nitrogen fixation by the cyanobacteria Aphanizomenon flos-aquae and 14C uptake by the diatom Cyclotella meneghiana. The EC50 values reported ranged from 110 mg⋅L-1 to 200 mg⋅L-1.
16
CHAPTER 7. BEHAVIOUR AND EFFECTS IN MARINE AQUATIC BIOTA Marine Vertebrates
Literature data were not available for marine vertebrates. Marine Invertebrates
Literature data were not available for marine invertebrates. Marine Plants
Literature data were not available for marine plants. Other Marine Biota
Other marine biota include all marine organisms not included in the animal or plant kingdoms. This covers organisms from the kingdoms Monera, Protista, and Fungi. Two studies examined the effect of DIPA on the luminescence of the marine bacterium Vibrio fischerii (SRC 1994; ERAC 1998). The reported EC50 values ranged from 50 to 9,202 mg⋅L-1.
17
CHAPTER 8. BEHAVIOUR AND EFFECTS IN HUMANS AND MAMMALIAN SPECIES Adsorption, Tissue Distribution, Metabolism and Excretion
One study on the absorption, tissue distribution, and excretion of DIPA in mammals was available. A 19.5 mg⋅kg-1 bw dose of 14C-DIPA was dissolved in acetone and applied to the skin of four female Fischer 344 rats (Dow 1985a). After solvent evaporation, the DIPA remained in direct contact with the skin for 48 hours. At 48 hours, 25% of the DIPA had penetrated the skin and was absorbed. Approximately 12% of the applied dose was excreted unaltered by metabolism in the urine, 12.5% remained in tissues, and less that 1% was either eliminated in expired air or found in the feces. There was no evidence of DIPA accumulation in fatty tissues. Approximately 50% of the applied material was recovered from the skin, and about 23% was recovered from the skin at and around the site of application. In the same study, a 19 mg·kg-1 bw dose of aqueous 14C-DIPA was administered intravenously to four female Fischer 344 rats. Greater than 70% of the radioactivity was cleared from the blood within the first six hours. Approximately 90% of the dose was recovered unchanged in urine within twelve hours. No metabolites of DIPA were characterized in urinary excretions (Dow 1985a). Metabolism studies of DIPA in animals indicate that it is poorly metabolized in mammals. Dow (1985a) concluded that DIPA, either ingested or absorbed through skin, will be eliminated rapidly and almost entirely in the urine. Acute Toxicity Studies
Animal studies summarizing the acute lethality of DIPA using single dose exposures (LD50) are summarized in Appendix A-5. Test animals have included rat, mouse, guinea pig, and rabbit. Oral Studies in Test Animals A 30% aqueous solution of DIPA was administered orally to two groups of rats (two animals per group). The first group received a total dose of 2,000 mg·kg-1 bw without observable effect. A second group received a dose of 3,980 mg·kg-1 bw, and both died within 24 hours (Dow 1954). The acute toxicity of two sunscreen formulations containing DIPA (1%) was determined in male and female albino rats, or Sprague Dawley rats. When administered by gavage, the LD50 for one of the sunscreen preparations was 5,000 mg·kg-1 bw in one instance, but this dose was tolerated in the second study. At lower doses, there were no toxicological effects up to 14 days after treatment (Biosearch 1981a; Springborn 1982a).
18
Dermal and Ocular Studies in Test Animals There are several studies that have examined the skin irritation and dermal toxicity of DIPA. Undiluted DIPA was applied to intact, or abraded skin on the abdomens of rabbits (Dow 1954). Moderate hyperemia to severe necrosis were observed at the intact sites, and slight hyperemia, oedema, and moderate denaturation were observed where DIPA was applied to abraded skin. A 10% aqueous solution of DIPA applied to rabbit ears had no observable effect. When applied to either normal or abraded skin on the abdomens of rabbits, however, this dose of DIPA produced moderate hyperemia and blistering, oedema, and moderate denaturation (Dow 1954). Undiluted DIPA is a severe eye irritant in rabbits. Application of 50 mg of DIPA directly to the eye caused burns of the eyelid, eyeball and corneal mucosa (Toropkov 1980a). Recovery occurred in 22 days, but ocular burns that produced cataracts or opaque corneas remained. A dilute solution (1% DIPA) was tested in a sunscreen formulation on New Zealand rabbits to evaluate skin irritation. The application of 0.2 mL of undiluted product produced evidence of mild primary irritation (Springborn 1982b). The ocular irritation produced by a sunscreen containing DIPA (1%) was evaluated in two studies in albino rabbits. Eyes were treated briefly with the solution and immediately rinsed, or were treated and then left unattended for up to seven days. The product was deemed not to be an ocular irritant (Biosearch 1981b; Springborn 1982c). Dermal Studies in Humans Responses to pure DIPA, or to a 1% aqueous solution in a patch test demonstrated variable skin irritation responses (BIBRA 1991). A test of a sunscreen containing 1% DIPA on 24 human subjects that required fifteen separate applications to skin over a 21 day period concluded the substance had minimal irritation qualities. However, in two other studies on human skin that required repeated application of a cream containing 1% DIPA, there was evidence of sensitization reactions. A number of dermal exposures were followed by a challenge to determine whether any subject responded with evidence of sensitization. It was concluded that the sunscreen product that contained DIPA was not a strong irritant, but that it may be capable of inducing contact sensitization (ACT 1987). Subchronic Toxicity Studies
DIPA has been tested in rats for responses to subchronic exposures in drinking water. Groups of five male and five female CFD Fischer 344 rats (10 animals per dose) were given doses of 0, 100, 300, 600, 1,200, and 3,000 mg·kg-1 bw·day-1 in their drinking water for a period of two weeks. Observations of activity and physical characteristics were recorded during the exposure period, at the end of which animals were examined for gross pathological changes, or changes in organ weights. Histological studies were performed on liver, kidney, and urinary bladder (Dow 1984). The 3,000 mg·kg-1 bw·day-1 dose of DIPA was not well tolerated by either sex. Two of five male rats died before the completion of the two-week study. Other animals demonstrated marked
19
weight loss, reductions in body fat, organ sizes and weights, and altered clinical biochemical parameters. These changes were partially attributed to emaciated states from marked decreases in food and water consumption. At the highest dose, rats suffered acute inflammation and degeneration of kidney and urinary bladder. There was evidence of generalized liver atrophy, but no clear evidence of hepatotoxicity (Dow 1984). Animals dosed at 1,200 mg·kg-1 bw·day-1 were observed to have lower dietary and water intakes which accounted for a small weight decrease in males, but the rate of weight gain for females was unaffected. Kidney weights (relative to control animals) were slightly increased in this group. The type of kidney alterations observed in the high-dose animals was observed on histological examination of only one animal at this dose. All other rats of either sex showed no treatment related effects in any of the organs examined. No toxicological effects were observed among animals that received 600 mg·kg-1 bw·day-1 or less in this study (Dow 1984). As such, this dose rate could be considered the study NOAEL. Wistar rats that received 1% DIPA mixed with their powdered diet from age 6 weeks to 24 weeks showed no evidence of renal toxicity. There was no evidence of endogenously produced N-nitrosobis(2-hydroxypropyl)amine detected in urine collected from these animals (detection limit 50 nmol per 200 mL) (Yamamoto et al. 1989; Konishi et al. 1991). In another study, rats given 5,000 mg·kg-1 bw·day-1 for seven days produced no evidence of toxic effect (BIBRA 1991). In the guinea pig, a threshold for toxic effects for less than chronic exposures was given at 0.22 mg·kg-1 bw·day-1 (Toropkov 1980b). Chronic Toxicity and Oncogenicity Studies
There was no increase in the incidence of tumors observed in target organs of Wistar rats fed 1% DIPA mixed with commercial powdered diet (w/v) for a period of 94 weeks (Yamamoto et al. 1989; Konishi et al. 1991).
The lung, oesophagus, urinary bladder and kidney, as well as the nasal cavity, are recognized target tissues for nitrosated diisopropanolamine. Among 16 treated rats that survived the full 94-week exposure period, there were no tumors of the nasal cavity, none in the lung, oesophagus, liver, urinary bladder, or kidney. There were also no thyroid adenomas in any of the treated animals, while one rat of 19 control animals had thyroid adenomas (Yamamoto et al. 1989; Konishi et al. 1991). These are sites known to be susceptible to tumor formation in rats exposed to N-nitrosobis(2-hydroxypropanol)-amine. In addition, the spontaneous tumor frequency in adrenal gland, testis, and pituitary gland was lower in DIPA treated animals than the controls. This indicates that chronic (lifetime) exposure to 391 ± 41 mg·kg-1 bw·day-1 of DIPA was not carcinogenic (Yamamoto et al. 1989). When fed a similar diet in conjunction with a source of nitrite in the drinking water (0.3% but not 0.15%), tumors appeared in every expected target organ. This was taken as evidence of endogenous production of N-nitrosobis(2-hydroxypropanol)amine in conditions of simultaneous
20
exposure to DIPA and nitrite. Analysis of urine from animals chronically exposed to both substances for a period of 24 weeks also showed evidence of N-nitrosobis(2-hydroxy-propanol)amine from endogenous enzymatic activity. In conditions where the animals’ diet had no source of excess nitrite, exposure to DIPA produced none of this carcinogenic material based on the detection limit of the assay. Animals treated with DIPA at a dose of 448 ± 36 mg·kg-1 bw·day-1 with a daily nitrite intake of 151 ± 16 mg·kg-1 bw·day-1 developed significant numbers of tumors at all sites examined. These were similar in location and type to tumors induced by exposure to N-nitrosobis(2-hydroxypropanol)amine alone (Yamamoto et al. 1989). Among animals that received similar doses of DIPA, but reduced nitrite (0.15% instead of 0.3% in drinking water), tumor frequency in target tissues was not significantly different from control animals. This suggests a threshold of tumor response in the rat, even though there is evidence for production of the carcinogenic substance most likely responsible for tumor production. This cannot be taken to mean that a combination of high nitrite exposure with DIPA is essential for carcinogenic initiation in tissues. Yamamoto et al. (1989) suggest their results provide evidence that endogenous nitrosations of environmental nitrosatable amines can be potential risk factors for human cancer development. Genotoxicity Studies
When evaluating data for genotoxicity, primary goals are to determine (1) the likelihood of occurrence of a key event and (2) whether that event might lead to heritable changes associated with any adverse effect in vivo, including cancer. The basis upon which a weight-of-evidence evaluation can be constructed include the following: • any statistically significant observations should be reproducible and biologically significant; • a dose-response relationship should exist for effects; • the effects should be permanent and progressive, as opposed to reversing upon cessation of
chemical dosing; • the nature of DNA effects should be characterized; • the database should be consistent or inconsistencies adequately explained; and, • the effects produced in the assay should be relevant to humans. A central objective of the weight-of-evidence approach is to balance experimental test data with experience, and not to accord greater weight to any single result. For purposes of human hazard assessment, greater confidence is placed in those test systems that examine possible genetic effects from chemical exposure of animals, rather than in tests that rely on selected homogeneous cell populations raised and tested in vitro. Chemical exposures of biological systems carried out in vitro are much less realistic, and results of such tests can be attributed to the effects of toxicity. Such toxicity can occur at unusually high exposure concentrations and/or be dependent on metabolic and detoxification capabilities. Finally, a weight-of-evidence evaluation seeks to establish a dose-response relationship. Greater attention should be given wherever there is a clear association between increased exposure and a genetic effect.
21
The consideration of the carcinogenic potential of DIPA can be assessed in a number of ways. Short-term tests for mutation, or for other evidence of genotoxic activity, allow identification of alterations in the genome. A primary purpose of such tests is to provide information on the production of heritable changes (mutations) that could lead to further adverse biological consequences. An initial and prominent question that genotoxicity tests are designed to answer, is whether the chemical (or any derivative) interacts directly with and mutates DNA (Williams 1989). Such interactions are known to bring about changes in gene expression or to affect other key biological processes. However, there is clear evidence that some short-term tests demonstrate effects of toxicity that may or may not support direct interaction with DNA. Finally, some chemical exposures show no effect at low dosages, and can be shown to be dependent on a threshold of exposure to produce an effect. The production of such indirect effects is often limited to conditions of high dose, which may be irrelevant to health risk assessment. The genotoxicity of DIPA has not been extensively investigated. One study in Salmonella was negative (at doses up to 10 mg⋅plate-1) in several standard tester strains including TA100, TA98, TA 1535, and TA1537 with or without microsomal activation using rat or hamster liver S9 (Mortelmans et al. 1986). An unpublished report (Dow 1994) has examined DIPA in the in vitro chromosomal aberration test (OECD Guideline 473). The purpose of the in vitro chromosome aberration test is to identify agents that cause structural (chromosome or chromatid type) chromosome aberrations in cultured mammalian cells. Chromosome mutations and related events are the cause of many human genetic diseases and there is substantial evidence that chromosome mutations and related events causing alterations in oncogenes and tumor suppressor genes of somatic cells are involved in cancer induction in humans and experimental animals. DIPA did not produce chromosomal aberrations in rat lymphocytes with and without metabolic activation at exposures of 313 to 5,000 µg mL-1 (Dow 1994 in BASF 1994). There were no other published reports in the literature.
While DIPA may not be genotoxic, a related nitroso-derivative that can be produced in the environment and endogenously in certain conditions does have genotoxic potential. Commercial DIPA prepared by chemical synthesis from propylene oxide and ammonia has been reported to contain between 20 and 1,300 ppb of N-nitrosobis(2-hydroxypropyl)amine (Issenberg et al. 1984). Older samples (>5 years storage) exhibited the highest concentration of this contaminant. Current commercial synthetic practice (Dow 1985b) produces product with no evidence of N-nitrosobis(2-hydroxypropyl)amine at a detection limit of 20 ppb. Therefore, it is likely any of this product found in the environment would be the result of biological or direct chemical reactions.
N-nitrosobis(2-hydroxypropyl)amine has genotoxic properties. It is rapidly absorbed through the skin of hamsters, and topical application produced neoplasms of the lip, cheek pouch, and vaginal epithelium (Pour et al. 1977; 1980). N-nitrosobis(2-hydroxypropyl)amine has been identified as a potent pancreatic carcinogen in hamsters (Pour et al. 1974). Oral ingestion (drinking water) in rats, induced neoplasms of the colon, respiratory tract, esophagus, and liver (Lijinsky and Taylor 1978; Pour et al. 1979). In mice, it induced neoplasms in the lung, liver, and nasal cavity. In rabbits and guinea pigs, it induced neoplasms in the liver.
22
There is no evidence that DIPA is either genotoxic in short-term assays or carcinogenic in a 94 week bioassay conducted in Wistar rats. DIPA, therefore, does not pose a genetic hazard as a result of exposure. There is, on the other hand, ample evidence that DIPA may undergo nitrosation reactions either in the environment, or after ingestion by endogenous mechanisms, when sources of nitrite are available. Since DIPA undergoes biodegradation in the environment primarily by oxidative metabolism, DIPA from groundwater sources would likely remain unaltered. In the event that elevated levels of nitrite were concurrently available in drinking water contaminated by DIPA, there is a possibility for endogenous generation of N-nitrosobis(2-hydroxypropyl)amine. Results of a long-term bioassay in rats suggest relatively high levels of nitrite were required to initiate the production of sufficient quantities of this carcinogenic substance to produce tumours in tissues. No tumours developed, and no dose-response was observed when 0.15% soluble nitrite was given to rats that consumed DIPA in their diet. At 0.3% nitrite in drinking water, animals that received DIPA in the diet responded with significant increases in the number of tumours in several target tissues. Thus, for rats ingesting DIPA, there is a clear dose-response relationship between the amount of nitrite in drinking water and a carcinogenic response. The risk of developing genotoxic products endogenously is clearly related to the concentrations of key substances in the environment. The relationship between nitrite and DIPA in the environment will control the likelihood of the occurrence of a key event, or mutation in target tissues. Reproductive and Developmental Toxicity Studies
According to a Russian source, a study carried out in rats at a dose of 0.055 mg·kg-1 bw·day-1 revealed no effects on a number of markers of reproductive toxicity (BIBRA 1991). This was based on an English language abstract of a paper in Russian. Since there is only one study, and it is unclear whether GLP criteria were used, we conclude there are insufficient data to assess whether DIPA exposure could produce adverse effects in reproductive endpoints. Tolerable Daily Intake
The Protocol for Developing Environmental and Human Health Soil Quality Guidelines (CCME 2003) defines the Tolerable Daily Intake (TDI) as the intake to which it is believed a receptor can be exposed over a lifetime without deleterious effects. The TDI represents the combination of (1) real values for toxicological endpoints when no evidence of adverse effects can be detected in experimental animals or humans and (2) safety factors that account for anticipated differences between responses in the species tested and humans, sensitive individuals in the human population, and other factors that contribute to the uncertainty of the toxicological data. The TDI is defined by the CCME (2003) protocol as (see also CAPP 2001):
⎟⎟⎠
⎞⎜⎜⎝
⎛=
FactorSafetyNOAELorLOAELTDI
23
Guidance on developing safety factors has been offered by a number of agencies. Health Canada (1994) propose: • A factor of 1 to10 to account for interspecies variation; • A factor of 1 to 10 to account for intraspecies variation; • A factor of 1 to 100 to account for inadequacies in the database; and, • A factor of 1 to 5 if there is information indicating the potential for interaction with other
substances in the environment. Exceptionally, an additional factor of 1 to 10 may be incorporated when deriving a TDI for severe effects. The Joint European Committee on Food Additives (JECFA) has also proposed principles for determining a margin of safety, and has developed a methodology to establish an acceptable value for a factor that would directly link animal toxicological data to human health and safety (FAO/WHO 1958). The margin of safety allows for any interspecies differences in susceptibility, the numerical differences between the test animals and the exposed human population, the greater variety of complicating disease processes in the human population, the difficulty of estimating the human intake, and the possibility of synergistic action. JECFA stated that the 100-fold margin of safety applied to the maximum ineffective dosage (expressed in mg·kg-1 bw·day-1) was believed to be an adequate factor (FAO/WHO 1958). The value of 100 has been regarded as comprising two factors of ten to allow for interspecies and intraspecies variation (WHO 1994). The validity and size of safety/uncertainty factors, and their application across many substances including pesticides has undergone periodic re-evaluation (Renwick and Lazarus 1998). By and large, the allocation of appropriate safety factors is considered on a case-by-case basis, relying on analysis of the total weight-of-evidence including a consideration of data gaps (WHO 1990). WHO Scientific Groups have confirmed a 100-fold safety factor as an adequate and useful guide, particularly when there are few toxicological data gaps (WHO 1967; 1994). The National Research Council report on Pesticides in the Diets of Infants and Children (NRC 1993) indicated that the current 10-fold intraspecies factor is adequately protective of socioeconomic, nutritional, and health status factors that influence the vulnerability of children to environmental toxicants. Tolerable Daily Intake (TDI) A NOAEL of 391 mg·kg-1 bw·day-1, from the study by Yamamoto et al. (1989), was selected as the basis for deriving the TDI. This study was chosen because it was sensitive, and chronic in duration. Six-week-old male Wistar rats were fed, ad libitum, a powdered diet supplemented with DIPA at a concentration of 1% for 94 weeks. At the end of the exposure period, no increase was observed in the incidence of tumour formation in various organs of the rats, compared with controls. A limitation of this study is that only a single dose treatment was tested.
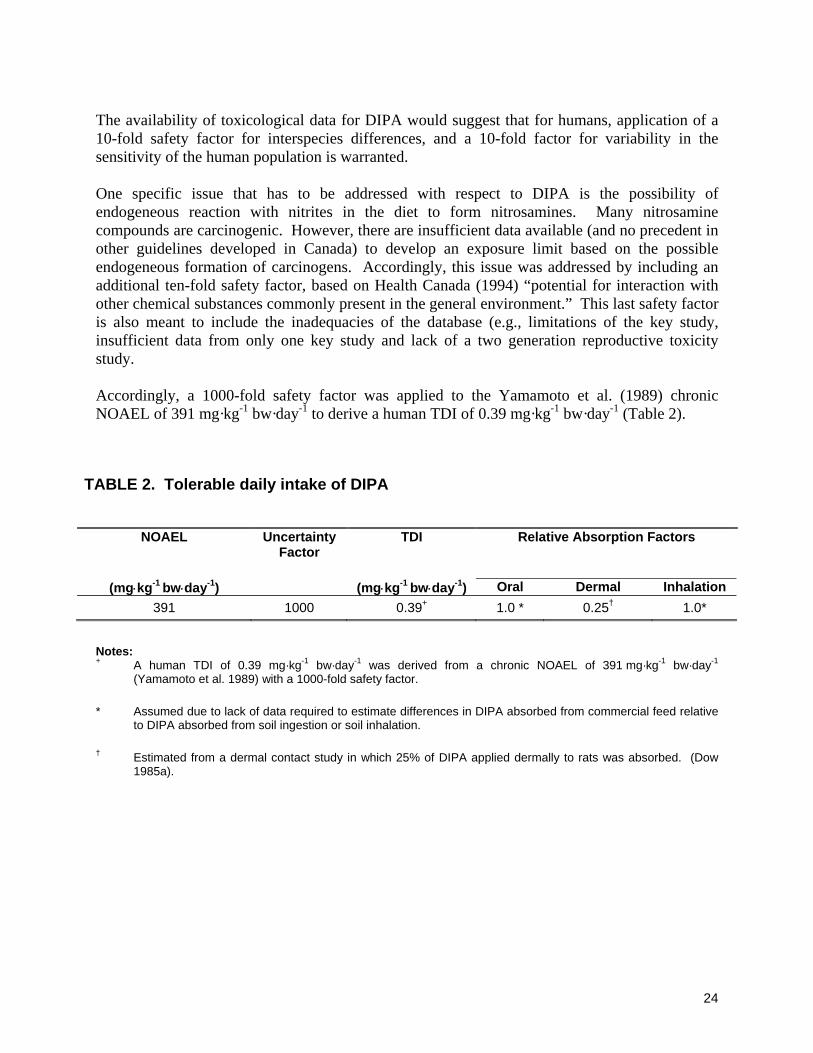
24
The availability of toxicological data for DIPA would suggest that for humans, application of a 10-fold safety factor for interspecies differences, and a 10-fold factor for variability in the sensitivity of the human population is warranted. One specific issue that has to be addressed with respect to DIPA is the possibility of endogeneous reaction with nitrites in the diet to form nitrosamines. Many nitrosamine compounds are carcinogenic. However, there are insufficient data available (and no precedent in other guidelines developed in Canada) to develop an exposure limit based on the possible endogeneous formation of carcinogens. Accordingly, this issue was addressed by including an additional ten-fold safety factor, based on Health Canada (1994) “potential for interaction with other chemical substances commonly present in the general environment.” This last safety factor is also meant to include the inadequacies of the database (e.g., limitations of the key study, insufficient data from only one key study and lack of a two generation reproductive toxicity study. Accordingly, a 1000-fold safety factor was applied to the Yamamoto et al. (1989) chronic NOAEL of 391 mg·kg-1 bw·day-1 to derive a human TDI of 0.39 mg·kg-1 bw·day-1 (Table 2).
TABLE 2. Tolerable daily intake of DIPA
NOAEL Uncertainty
Factor TDI Relative Absorption Factors
(mg⋅kg-1 bw⋅day-1) (mg⋅kg-1 bw⋅day-1) Oral Dermal Inhalation
391 1000 0.39+ 1.0 * 0.25† 1.0*
Notes: + A human TDI of 0.39 mg·kg-1 bw·day-1 was derived from a chronic NOAEL of 391 mg·kg-1 bw·day-1
(Yamamoto et al. 1989) with a 1000-fold safety factor.
* Assumed due to lack of data required to estimate differences in DIPA absorbed from commercial feed relative to DIPA absorbed from soil ingestion or soil inhalation.
† Estimated from a dermal contact study in which 25% of DIPA applied dermally to rats was absorbed. (Dow 1985a).
25
CHAPTER 9. DEVELOPMENT OF CANADIAN SOIL QUALITY GUIDELINES Environmental Soil Quality Guidelines (SQGE)
Canadian soil quality guidelines are designed to protect four different land uses: agricultural, residential/parkland, commercial, and industrial. Derivations of the environmental soil quality guidelines (SQGE) for sensitive land uses (agricultural and residential/parkland) and less-sensitive land uses (commercial and industrial) are presented below. All data used in the following derivations were screened for ecological relevance and are presented in Tables 3, 4, and 5.
Agricultural and Residential/Parkland Land Uses
The SQGE for agricultural land use is equal to the lowest value obtained from two procedures; soil contact guideline and soil and food ingestion guideline while the SQGE for residential/parkland use is based only the soil contact guideline. The derivation procedure for SQGE for these two land uses is the same when the soil and food ingestion Guideline is not calculated for agricultural land use (see discussion below). Therefore, these two land uses are discussed together. Soil Contact Guideline
The derivation of the soil quality guideline for soil contact is based on the CAPP (2001) toxicological data for plants and soil invertebrates. The data reported in CAPP (2001) were expressed in terms of nominal concentrations. Appendix B-1 explains how these data were adjusted to reflect analytically measured concentrations, rather than nominal concentrations. A methodology was provided in CCME (1996) for deriving Canadian soil quality guidelines for this pathway. Significant revisions in this methodology were published in CCME (2000). The methodology used in this document is based on the procedure in CCME (2000), but standardizes the effect at the 25th percentile level rather than the 50th percentile (as described in CCME 2003). The procedure used was as follows: • Plant and terrestrial invertebrate toxicological data were screened for ecological relevance
(i.e., endpoints such as growth, reproduction, and mortality were selected). • Data were standardized at a 25th percentile response level (i.e., EC25/LC25). • Data based on nominal concentrations were corrected to reflect analytically measured
concentrations (Appendix B-1). • If multiple data existed for the same species/endpoint/soil combination, only the data from
the longest duration test were used; if multiple data points existed for the same test and same test duration, they were combined and replaced by their geometric mean.
• The resulting data points (i.e., one data point for each species/endpoint/soil combination) for plants and terrestrial invertebrates together were combined in a “species sensitivity distribution” in which the percentile was plotted against the EC25 values on a log scale (Figure 1).
26
• The 25th percentile of the species sensitivity distribution is the “no potential effects range” (NPER) for agricultural and residential/parkland land uses. The value of 710 mg·kg-1 is read directly from the species sensitivity distribution plot (Figure 1).
The soil quality guideline for soil contact (SQGSC) is equal to the NPER divided by an optional safety factor (CCME 2003). In this case a safety factor is justified for the following reasons: 1) the protocol requires at least two invertebrate species; however, only earthworm data were available, and 2) while the available data exceed the minimum requirement of 10 discrete data points, all of it came from a single source. As such a safety factor of 2 was chosen. Therefore, the soil contact guideline for agricultural and residential/parkland land uses calculated for DIPA based on the above procedure is 360 mg·kg-1 (Appendix A-2). Soil and Food Ingestion Guideline The soil and food ingestion guideline (SQGI) applies only to agricultural land use, and was not derived for DIPA. The protocol for this guideline requires a minimum of three oral toxicological studies, of which at least two must be oral mammalian studies and one must be an oral avian study, and that a grazing herbivore with a high ingestion rate to body weight ratio should be considered in the minimum data set. The minimum data requirements for this guideline were not met, and the guideline was therefore not calculated. In addition, soil-to-plant bioconcentration factors would be required to calculate this guideline, and available plant concentration data were not suitable for calculating a bioconcentration factor. Nutrient and Energy Cycling Check The nutrient and energy cycling check was not calculated for residential/agricultural land use because sufficient data on the effect of DIPA on microbial processes were not available. DIPA biodegradation was observed in soil microcosms at concentrations up to 350 mg·L-1 (Appendix A-1 and references therein). While these data do not satisfy the requirements for the nutrient and energy cycling check, they do support the interpretation that at concentrations equal to or greater than 350 mg·L-1, indigenous soil dwelling bacteria capable of degrading DIPA were active. Commercial and Industrial Land Uses
Soil Contact Guideline The derivation of the soil quality guideline for soil contact is based on the CAPP (2001) toxicological data for plants and soil invertebrates. The data reported in CAPP (2001) were expressed in terms of nominal concentrations. Appendix B-1 explains how these data were adjusted to reflect analytically measured concentrations, rather than nominal concentrations. A methodology was provided in CCME (1996) for deriving Canadian soil quality guidelines for this pathway. Significant revisions in this methodology were published in CCME (2000). The methodology used in this document is based on the procedure in CCME (2000), but standardizes the response at the 25th percentile level rather than the 50th percentile (as described in CCME 2003). The procedure used was as follows:
27
• Plant and terrestrial invertebrate toxicological data were screened for ecological relevance
(i.e., endpoints such as growth, reproduction, and mortality were selected). • Data were standardized at a 25th percentile response level (i.e., EC25/LC25). • Data based on nominal concentrations were corrected to reflect analytically measured
concentrations (Appendix B-1). • If multiple data existed for the same species/endpoint/soil combination, only the data from
the longest duration test were used; if multiple data points existed for the same test and same test duration, they were combined and replaced by their geometric mean.
• The resulting data points (i.e., one data point for each species/endpoint/soil combination) for plants and terrestrial invertebrates together were combined in a “species sensitivity distribution” in which the percentile was plotted against the EC25 values on a log scale (Figure 1).
• The 50th percentile of the species sensitivity distribution is the “no potential effects range” (NPER) for agricultural and residential/parkland land uses. The value of 1,500 mg·kg-1 is read directly from the species sensitivity distribution plot (Figure 1).
The soil quality guideline for soil contact (SQGSC) is equal to the NPER divided by an optional safety factor (CCME 2003). In this case a safety factor is justified for the following reasons: 1) the protocol requires at least two invertebrate species; however, only earthworm data were available, and 2) while the available data exceed the minimum requirement of 10 discrete data points, all of it came from a single source. As such a safety factor of 2 was chosen. Therefore, the soil contact guideline for commercial and industrial land uses calculated for DIPA based on the above procedure is 750 mg⋅kg-1 (Appendix A-2).
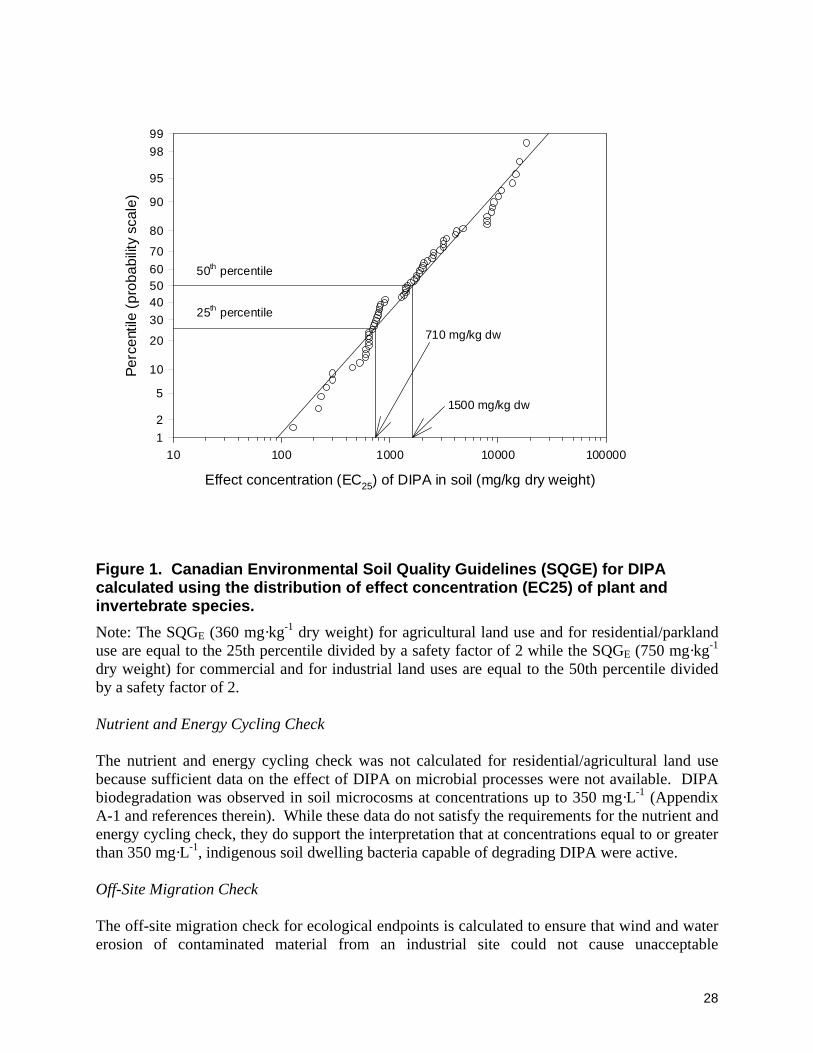
28
10 100 1000 10000 100000
Perc
entil
e (p
roba
bilit
y sc
ale)
12
5
10
20
3040506070
80
90
95
9899
1500 mg/kg dw
710 mg/kg dw
Effect concentration (EC25) of DIPA in soil (mg/kg dry weight)
50th percentile
25th percentile
Figure 1. Canadian Environmental Soil Quality Guidelines (SQGE) for DIPA calculated using the distribution of effect concentration (EC25) of plant and invertebrate species. Note: The SQGE (360 mg·kg-1 dry weight) for agricultural land use and for residential/parkland use are equal to the 25th percentile divided by a safety factor of 2 while the SQGE (750 mg·kg-1 dry weight) for commercial and for industrial land uses are equal to the 50th percentile divided by a safety factor of 2. Nutrient and Energy Cycling Check The nutrient and energy cycling check was not calculated for residential/agricultural land use because sufficient data on the effect of DIPA on microbial processes were not available. DIPA biodegradation was observed in soil microcosms at concentrations up to 350 mg·L-1 (Appendix A-1 and references therein). While these data do not satisfy the requirements for the nutrient and energy cycling check, they do support the interpretation that at concentrations equal to or greater than 350 mg·L-1, indigenous soil dwelling bacteria capable of degrading DIPA were active. Off-Site Migration Check The off-site migration check for ecological endpoints is calculated to ensure that wind and water erosion of contaminated material from an industrial site could not cause unacceptable
29
contaminant concentrations on an adjacent residential property (CCME, 2003). The check is calculated using the equation provided in CCME (1999):
[ ] ( )[ ]{ }d
dmmmi D
BSCDDCDC ⋅−−⋅=
Where: Ci = off-site migration check (mg·kg-1); Dm = mixing depth (2 cm, CCME, 2003); Cm = SQGE for residential/parkland use (360 mg·kg-1, see Table 3); Dd = depth of deposited material before mixing (0.14 cm; CCME,
2003); and, BSC = background concentration of the contaminant in the receiving soil
(0 mg·kg-1, assumed). Substituting these values in the above equation gives 5,100 mg·kg-1. This value is the off-site migration check for ecological endpoints for DIPA (Table 3). Groundwater Check (Aquatic Life)
The groundwater check for aquatic life applies equally to all land uses and was performed using data and formulae included in Appendices C and D of the CCME (1996) protocol. The formula used for the groundwater check was:
( ) ( )mdwa KCDFsoilkgmgCheckrGroundwate θ+⋅=−1 Where: DF = dilution factor (50; CCME 1996); Cwa = concentration in the aquifer, which was set equal to the DIPA
freshwater aquatic life guideline (1.6 mg⋅L-1; see “Derivation of Water Quality Guidelines – Freshwater Aquatic Life” and Table 4);
Kd = DIPA soil to water partition coefficient (2.2 L·kg-1; Table 1); and, θm = field capacity moisture content (0.1 g·g-1; CCME 1996). Substituting values from above, and rounding to two significant figures, yields 180 mg·kg-1, which represents the maximum DIPA soil concentration that is protective of freshwater aquatic life (Table 3).
pH Check
DIPA is a weak base, and so dissolves in water to yield an alkaline solution. At sufficient concentrations of DIPA in soil pore water, it is possible that the increased pH alone might be enough to adversely impact some receptors. Accordingly, a “pH check” was calculated. It should be noted that this check is not a part of the CCME (1996 or 2003) protocol, but that it was
30
felt to be appropriate for this particular compound, and consistent with the overall approach of the CCME (1996, 2003) protocol. The pH check was calculated by determining the concentration of DIPA in soil that would be required to raise the pH of the soil moisture to 8.0. CCME (1991a) gives 8.0 as the upper limit for pH in soil for all land uses. The calculation conservatively assumes that the pore water and the soil have no significant buffering capacity. The equation used was:
( ) ( )mdpKa
pH
KRMMsoilkgmgCheckpH θ+⋅= −
−−− 000,1
1010 )14(2
1
Where: pH = maximum acceptable soil pH (8.0; CCME 1991a); pKa = negative logarithm of the acid dissociation constant for DIPA
(8.88; Table 1); 1,000 = a factor to convert from g to mg; RMM = the relative molecular mass of DIPA (133.19; Table 1); Kd = DIPA soil to water partition coefficient (2.2 L·kg-1; Table 1); and, θm = field capacity moisture content (0.1 g g-1; CCME 1996). Substituting values from above yields 230 mg·kg-1, which represents the maximum DIPA soil concentration that will ensure soil pH remains below 8.0 (Table 3).
Data Gaps
With regards to the soil contact guideline, data on an invertebrate species other than earthworms are needed. Sufficient data were available to calculate the groundwater check for aquatic life, and a pH check. Additional information would be required to calculate the nutrient and energy cycling check. Specifically, a minimum of three studies would be required, addressing nitrogen fixation and nitrification (preferably), or carbon cycling and nitrogen mineralization. In order to meet the minimum data requirements for the soil and food ingestion guideline, one oral study on an ungulate, and one oral study on an avian species would be required, as well as at least one study on the bioconcentration of DIPA from soil into plants.
31
Human Health Soil Quality Guidelines (SQGHH)
The human health guidelines for the four CCME land uses are discussed in the following sections. One parameter that warrants further discussion is the soil allocation factor (SF). The CCME (1996) protocol recommends using an SF of 0.2 to allow for the fact that, in theory, human exposure to contaminants can occur via five media: water, soil, air, food, and consumer products. However, more recent guidance (CCME 2000; CCME 2003) allows a consideration of which of these five media are realistic exposure pathways for the contaminant under investigation. Exposure to DIPA may occur through soil at contaminated sites. Exposure through water is also possible, based on the solubility of DIPA. Alkanolamine salts, including DIPA salts, are used as raw materials in the manufacture of creams, lotions, shampoos, soaps, and cosmetics, and accordingly exposure to DIPA through consumer products is possible. Exposure to DIPA through food is considered unlikely, and exposure to DIPA in air is precluded by its low volatility. Accordingly a soil allocation factor (SF) of 0.33 was used for DIPA. The protocol (CCME, 2003) assumes that absorption efficiency in an environmental exposure is equal to that of the experimental exposure unless other evidence exists. In cases where the experimental exposure occurs through a medium (e.g., drinking water) other than through soil, soil ingestion, dermal contact, and inhalation rates can be multiplied by a corresponding relative absorption factor (AF) to account for differences between absorption from drinking water and these soil-based routes of exposure. For DIPA, the experimental exposure on which the TDI is based is through a contaminated commercial diet (Yamamoto et al. 1989). No data exist, however, on the absorption of DIPA in food relative to ingested soil or to inhalation. As a result, a relative absorption factor of one has been assumed for oral and inhalation exposure routes (Table 2). With respect to dermal contact, Dow (1985a) found that 25% of a dose applied to rats was absorbed in to the body, therefore, a relative absorption factor of 0.25 was used for dermal contact (Table 2) 1. This AF value is likely somewhat conservative because only half the DIPA remained in the tissues while the rest was excreted almost entirely through urine. However, according to the standard interpretation of skin absorption studies, initial absorbed doses, metabolized or not, are considered to be absorbed (USEPA, 1998). Other reasons for keeping the relative absorption factor at this level are uncertainties regarding skin-bound DIPA residues, testing of only a single dose, the use of acetone as a vehicle/solvent and whether the experimental dose (19.5 mg·kg-1 bw) is representative of expected field conditions. Agricultural and Residential/Parkland Uses
Soil Ingestion Guideline For a threshold chemical such as DIPA, the CCME (2003) protocol uses a fully-exposed child aged 0.5 to 5 years to develop soil quality guidelines for agricultural and residential/parkland
1 Although estimated, the relative absorption factor was not used in the derivation of the Canadian Soil Quality Guidelines for human health because the dermal pathway was not included.
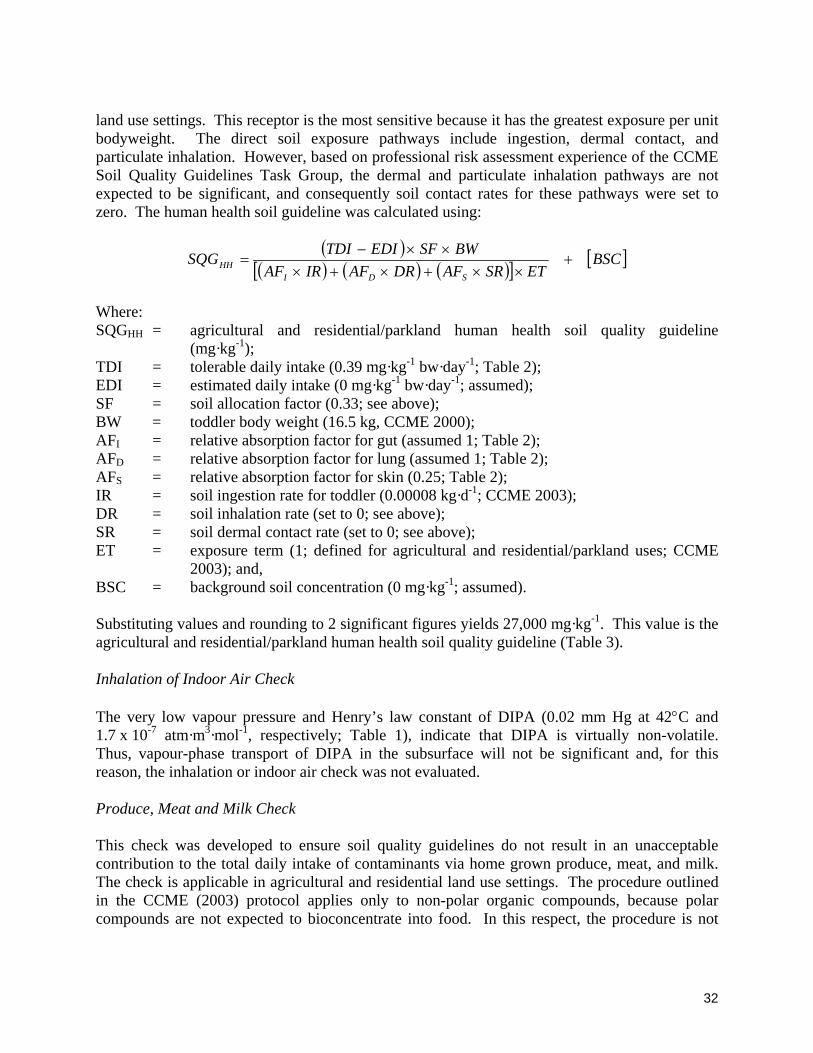
32
land use settings. This receptor is the most sensitive because it has the greatest exposure per unit bodyweight. The direct soil exposure pathways include ingestion, dermal contact, and particulate inhalation. However, based on professional risk assessment experience of the CCME Soil Quality Guidelines Task Group, the dermal and particulate inhalation pathways are not expected to be significant, and consequently soil contact rates for these pathways were set to zero. The human health soil guideline was calculated using:
( )( ) ( ) ( )[ ] [ ]BSC
ETSRAFDRAFIRAFBWSFEDITDISQG
SDIHH +
××+×+×××−
=
Where: SQGHH = agricultural and residential/parkland human health soil quality guideline
(mg·kg-1); TDI = tolerable daily intake (0.39 mg·kg-1 bw·day-1; Table 2); EDI = estimated daily intake (0 mg·kg-1 bw·day-1; assumed); SF = soil allocation factor (0.33; see above); BW = toddler body weight (16.5 kg, CCME 2000); AFI = relative absorption factor for gut (assumed 1; Table 2); AFD = relative absorption factor for lung (assumed 1; Table 2); AFS = relative absorption factor for skin (0.25; Table 2); IR = soil ingestion rate for toddler (0.00008 kg·d-1; CCME 2003); DR = soil inhalation rate (set to 0; see above); SR = soil dermal contact rate (set to 0; see above); ET = exposure term (1; defined for agricultural and residential/parkland uses; CCME
2003); and, BSC = background soil concentration (0 mg·kg-1; assumed). Substituting values and rounding to 2 significant figures yields 27,000 mg·kg-1. This value is the agricultural and residential/parkland human health soil quality guideline (Table 3). Inhalation of Indoor Air Check The very low vapour pressure and Henry’s law constant of DIPA (0.02 mm Hg at 42°C and 1.7 x 10⁻⁷ atm·m3·mol-1, respectively; Table 1), indicate that DIPA is virtually non-volatile. Thus, vapour-phase transport of DIPA in the subsurface will not be significant and, for this reason, the inhalation or indoor air check was not evaluated. Produce, Meat and Milk Check This check was developed to ensure soil quality guidelines do not result in an unacceptable contribution to the total daily intake of contaminants via home grown produce, meat, and milk. The check is applicable in agricultural and residential land use settings. The procedure outlined in the CCME (2003) protocol applies only to non-polar organic compounds, because polar compounds are not expected to bioconcentrate into food. In this respect, the procedure is not
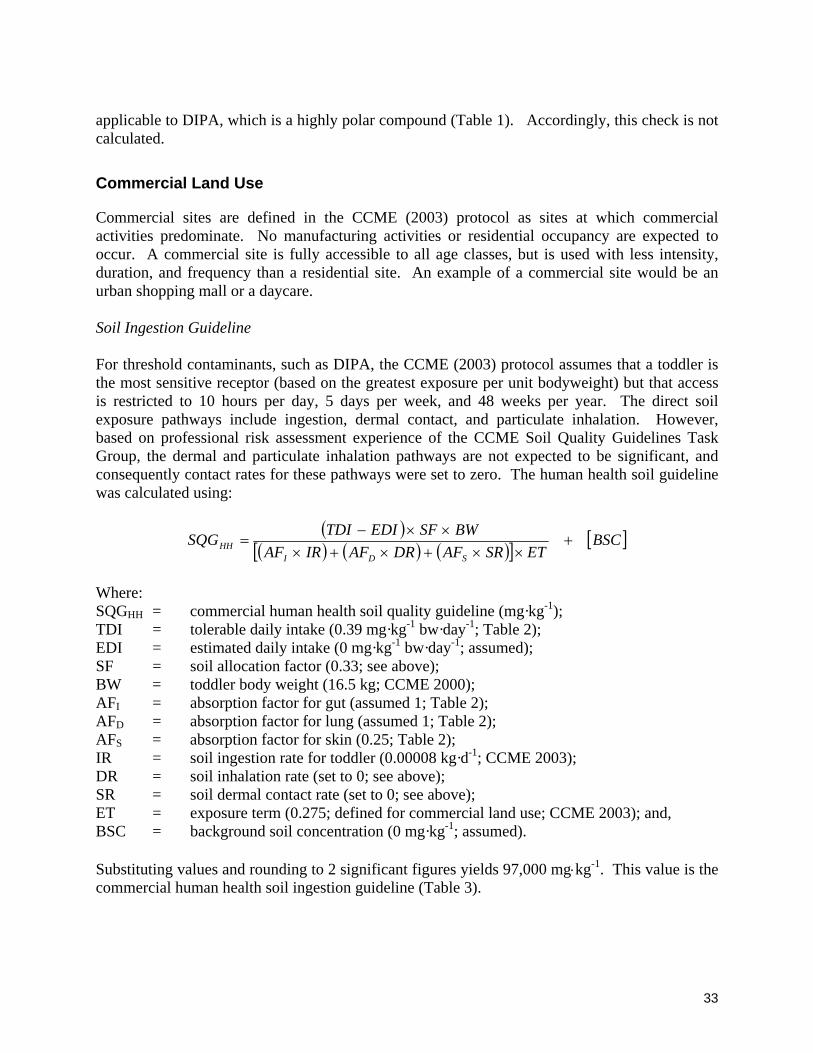
33
applicable to DIPA, which is a highly polar compound (Table 1). Accordingly, this check is not calculated.
Commercial Land Use
Commercial sites are defined in the CCME (2003) protocol as sites at which commercial activities predominate. No manufacturing activities or residential occupancy are expected to occur. A commercial site is fully accessible to all age classes, but is used with less intensity, duration, and frequency than a residential site. An example of a commercial site would be an urban shopping mall or a daycare. Soil Ingestion Guideline For threshold contaminants, such as DIPA, the CCME (2003) protocol assumes that a toddler is the most sensitive receptor (based on the greatest exposure per unit bodyweight) but that access is restricted to 10 hours per day, 5 days per week, and 48 weeks per year. The direct soil exposure pathways include ingestion, dermal contact, and particulate inhalation. However, based on professional risk assessment experience of the CCME Soil Quality Guidelines Task Group, the dermal and particulate inhalation pathways are not expected to be significant, and consequently contact rates for these pathways were set to zero. The human health soil guideline was calculated using:
( )( ) ( ) ( )[ ] [ ]BSC
ETSRAFDRAFIRAFBWSFEDITDISQG
SDIHH +
××+×+×××−
=
Where: SQGHH = commercial human health soil quality guideline (mg·kg-1); TDI = tolerable daily intake (0.39 mg·kg-1 bw·day-1; Table 2); EDI = estimated daily intake (0 mg·kg-1 bw·day-1; assumed); SF = soil allocation factor (0.33; see above); BW = toddler body weight (16.5 kg; CCME 2000); AFI = absorption factor for gut (assumed 1; Table 2); AFD = absorption factor for lung (assumed 1; Table 2); AFS = absorption factor for skin (0.25; Table 2); IR = soil ingestion rate for toddler (0.00008 kg·d-1; CCME 2003); DR = soil inhalation rate (set to 0; see above); SR = soil dermal contact rate (set to 0; see above); ET = exposure term (0.275; defined for commercial land use; CCME 2003); and, BSC = background soil concentration (0 mg·kg-1; assumed). Substituting values and rounding to 2 significant figures yields 97,000 mg⋅kg-1. This value is the commercial human health soil ingestion guideline (Table 3).
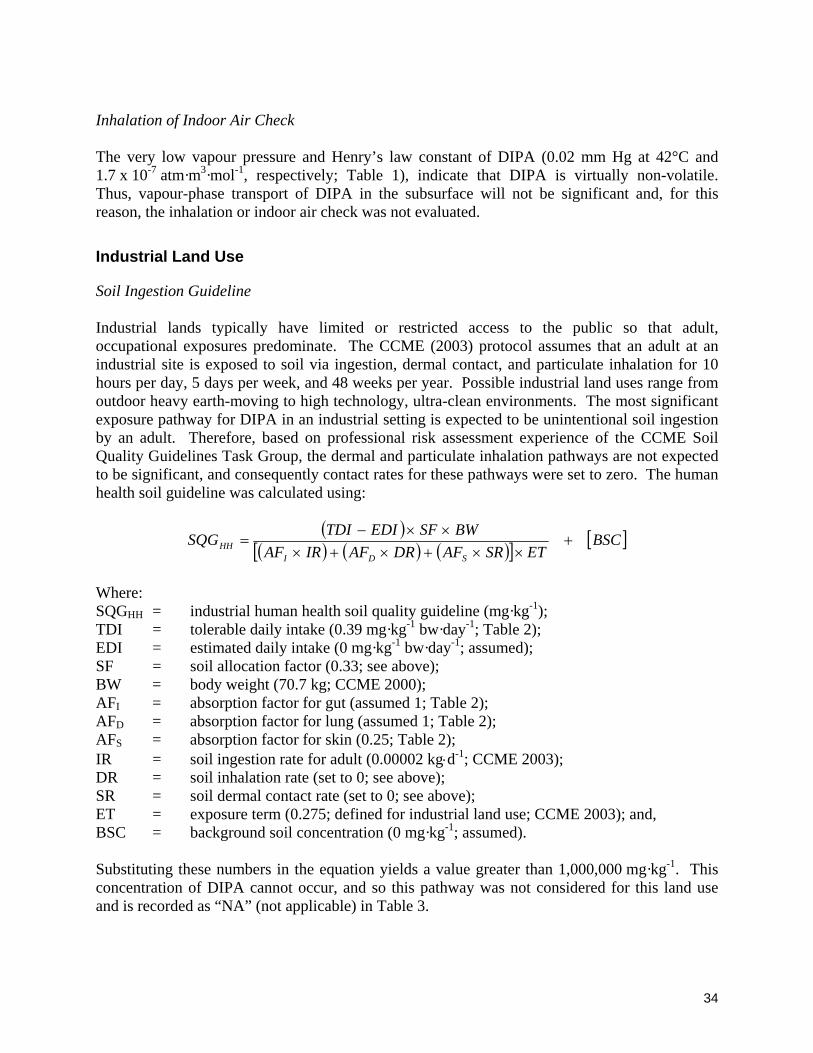
34
Inhalation of Indoor Air Check The very low vapour pressure and Henry’s law constant of DIPA (0.02 mm Hg at 42°C and 1.7 x 10⁻⁷ atm·m3·mol-1, respectively; Table 1), indicate that DIPA is virtually non-volatile. Thus, vapour-phase transport of DIPA in the subsurface will not be significant and, for this reason, the inhalation or indoor air check was not evaluated. Industrial Land Use
Soil Ingestion Guideline Industrial lands typically have limited or restricted access to the public so that adult, occupational exposures predominate. The CCME (2003) protocol assumes that an adult at an industrial site is exposed to soil via ingestion, dermal contact, and particulate inhalation for 10 hours per day, 5 days per week, and 48 weeks per year. Possible industrial land uses range from outdoor heavy earth-moving to high technology, ultra-clean environments. The most significant exposure pathway for DIPA in an industrial setting is expected to be unintentional soil ingestion by an adult. Therefore, based on professional risk assessment experience of the CCME Soil Quality Guidelines Task Group, the dermal and particulate inhalation pathways are not expected to be significant, and consequently contact rates for these pathways were set to zero. The human health soil guideline was calculated using:
( )( ) ( ) ( )[ ] [ ]BSC
ETSRAFDRAFIRAFBWSFEDITDISQG
SDIHH +
××+×+×××−
=
Where: SQGHH = industrial human health soil quality guideline (mg·kg-1); TDI = tolerable daily intake (0.39 mg·kg-1 bw·day-1; Table 2); EDI = estimated daily intake (0 mg·kg-1 bw·day-1; assumed); SF = soil allocation factor (0.33; see above); BW = body weight (70.7 kg; CCME 2000); AFI = absorption factor for gut (assumed 1; Table 2); AFD = absorption factor for lung (assumed 1; Table 2); AFS = absorption factor for skin (0.25; Table 2); IR = soil ingestion rate for adult (0.00002 kg⋅d-1; CCME 2003); DR = soil inhalation rate (set to 0; see above); SR = soil dermal contact rate (set to 0; see above); ET = exposure term (0.275; defined for industrial land use; CCME 2003); and, BSC = background soil concentration (0 mg·kg-1; assumed). Substituting these numbers in the equation yields a value greater than 1,000,000 mg·kg-1. This concentration of DIPA cannot occur, and so this pathway was not considered for this land use and is recorded as “NA” (not applicable) in Table 3.
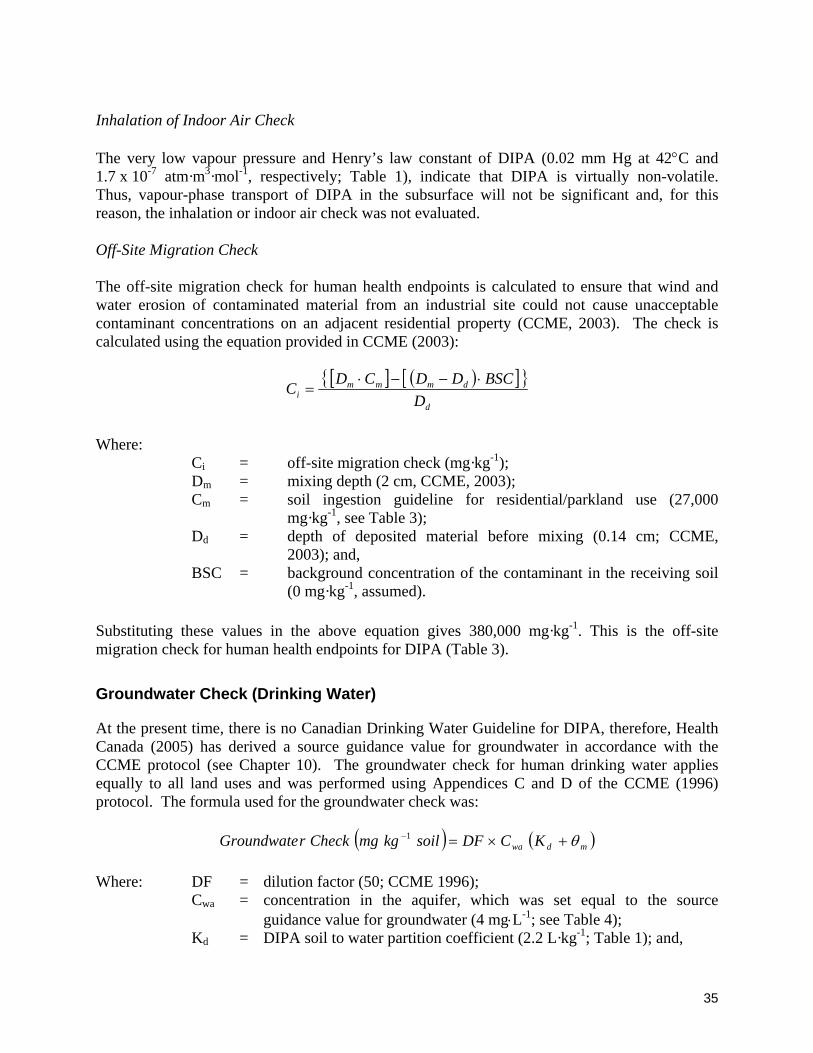
35
Inhalation of Indoor Air Check The very low vapour pressure and Henry’s law constant of DIPA (0.02 mm Hg at 42°C and 1.7 x 10⁻⁷ atm·m3·mol-1, respectively; Table 1), indicate that DIPA is virtually non-volatile. Thus, vapour-phase transport of DIPA in the subsurface will not be significant and, for this reason, the inhalation or indoor air check was not evaluated. Off-Site Migration Check The off-site migration check for human health endpoints is calculated to ensure that wind and water erosion of contaminated material from an industrial site could not cause unacceptable contaminant concentrations on an adjacent residential property (CCME, 2003). The check is calculated using the equation provided in CCME (2003):
[ ] ( )[ ]{ }d
dmmmi D
BSCDDCDC ⋅−−⋅=
Where: Ci = off-site migration check (mg·kg-1); Dm = mixing depth (2 cm, CCME, 2003); Cm = soil ingestion guideline for residential/parkland use (27,000
mg·kg-1, see Table 3); Dd = depth of deposited material before mixing (0.14 cm; CCME,
2003); and, BSC = background concentration of the contaminant in the receiving soil
(0 mg·kg-1, assumed). Substituting these values in the above equation gives 380,000 mg·kg-1. This is the off-site migration check for human health endpoints for DIPA (Table 3).
Groundwater Check (Drinking Water)
At the present time, there is no Canadian Drinking Water Guideline for DIPA, therefore, Health Canada (2005) has derived a source guidance value for groundwater in accordance with the CCME protocol (see Chapter 10). The groundwater check for human drinking water applies equally to all land uses and was performed using Appendices C and D of the CCME (1996) protocol. The formula used for the groundwater check was:
( ) ( )mdwa KCDFsoilkgmgCheckrGroundwate θ+×=−1
Where: DF = dilution factor (50; CCME 1996); Cwa = concentration in the aquifer, which was set equal to the source
guidance value for groundwater (4 mg⋅L-1; see Table 4); Kd = DIPA soil to water partition coefficient (2.2 L·kg-1; Table 1); and,
36
θm = field capacity moisture content (0.1 g g-1; CCME 1996). Substituting values from above yields 460 mg·kg-1, which represents the maximum DIPA soil concentration that is protective of the potable water supply (Table 3). Setting Canadian Guidelines for Drinking Water Quality is undertaken by Health Canada, and is outside the jurisdiction of the CCME. However, no Canadian Guideline for Drinking Water Quality currently exists for DIPA, and a guideline value is required to calculate the groundwater check (drinking water) that makes up part of the soil quality guideline protocol (CCME 1996). Accordingly, the methods used by Health Canada (1994 and 2005) to develop drinking water guidelines were used to develop a DIPA source guidance value for groundwater of 4 mg·L-1 in this document. This value is not a Canadian Guideline for Drinking Water Quality.
Data Gaps
Further data on bioconcentration of DIPA into plants, and toxicity of DIPA to livestock species would be required to calculate the soil and food ingestion guideline. Data on the toxicity of DIPA to microbial processes would be required to calculate the nutrient and energy cycling check. Data on the bioconcentration of DIPA into produce, milk, and meat, and the development of a procedure for polar compounds would be required to calculate the produce, milk, and meat check.
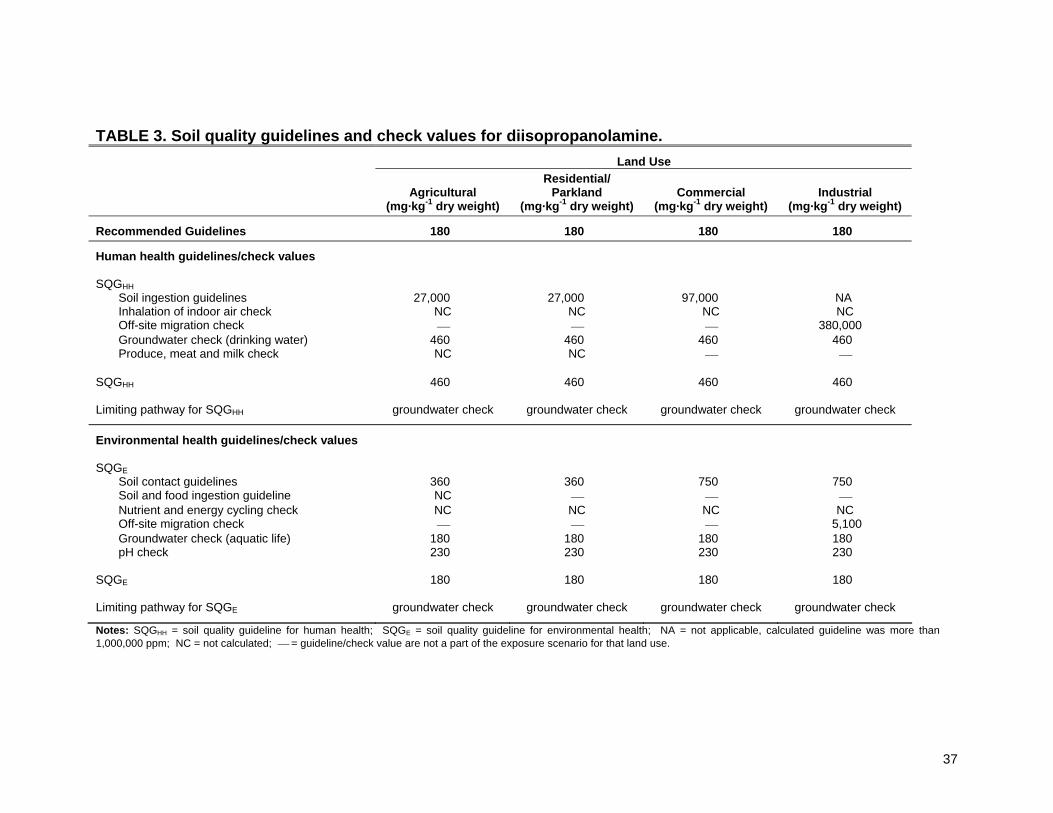
37
Notes: SQGHH = soil quality guideline for human health; SQGE = soil quality guideline for environmental health; NA = not applicable, calculated guideline was more than 1,000,000 ppm; NC = not calculated; ⎯ = guideline/check value are not a part of the exposure scenario for that land use.
TABLE 3. Soil quality guidelines and check values for diisopropanolamine. Land Use
Agricultural
Residential/ Parkland Commercial Industrial
(mg·kg-1 dry weight) (mg·kg-1 dry weight) (mg·kg-1 dry weight) (mg·kg-1 dry weight)
Recommended Guidelines 180 180 180 180
Human health guidelines/check values SQGHH
Soil ingestion guidelines 27,000 27,000 97,000 NA Inhalation of indoor air check NC NC NC NC Off-site migration check ⎯ ⎯ ⎯ 380,000 Groundwater check (drinking water) 460 460 460 460 Produce, meat and milk check NC NC ⎯ ⎯
SQGHH 460 460 460 460 Limiting pathway for SQGHH groundwater check groundwater check groundwater check groundwater check
Environmental health guidelines/check values SQGE
Soil contact guidelines 360 360 750 750 Soil and food ingestion guideline NC ⎯ ⎯ ⎯ Nutrient and energy cycling check NC NC NC NC Off-site migration check ⎯ ⎯ ⎯ 5,100 Groundwater check (aquatic life) 180 180 180 180 pH check 230 230 230 230
SQGE 180 180 180 180 Limiting pathway for SQGE groundwater check groundwater check groundwater check groundwater check
38
CHAPTER 10. DEVELOPMENT OF CANADIAN WATER QUALITY GUIDELINES Freshwater Aquatic Life
Freshwater aquatic life guidelines for DIPA were developed using “A Protocol for the Derivation of Water Quality Guidelines for the Protection of Aquatic Life;” CCME (1991b). The following sections summarize the requirements of the CCME protocol and discuss the available dataset in terms of these requirements. The toxicological dataset was summarized in Table 5, and discussed in Chapter 5. The CCME protocol defines (1) the requirements for a toxicological study to be acceptable for guideline derivation (data quality requirement), (2) the minimum required dataset for full and interim guideline development (data quantity requirement), and (3) the process for deriving guidelines. The following paragraphs provide a summary of the requirements of the CCME protocol, and assess the toxicological dataset. Data Quality The data quality requirement in the CCME protocol may be summarized as follows. For a toxicological study to be considered “secondary data.” all relevant environmental variables (e.g., temperature, pH, hardness, dissolved oxygen, etc.) should be measured and reported, and the survival of controls must be reported. In addition, for data to be considered “primary data,” tests must employ currently acceptable practices, concentrations must be measured at the beginning and end of a test, and, in general, dynamic (i.e., flow-through) tests are required. However, it should be noted that flow-through test set-ups are typically used only for fish, rather than invertebrates or algae. Data that do not conform to the requirements for primary or secondary data are “unacceptable data.” The toxicological dataset is summarized in Table 5 and the data are classified as primary, secondary, or unacceptable. Only the work completed by CAPP (2001) conformed to all the requirements for Primary Data. The study by ERAC (1998) was classified as secondary data. All other studies were classified as unacceptable data. It should be noted that studies classified as “unacceptable data” may, in fact, represent acceptable (i.e., primary or secondary) data, but insufficient information was available to confirm this. According to the CCME protocol only primary or secondary data can be used in the guideline derivation process. Data Quantity The CCME protocol requirement for the quantity of Primary and/or Secondary Data for interim freshwater aquatic life guidelines may be summarized as follows. At least two studies on freshwater fish species, and at least two studies on freshwater invertebrate species are required. The tests may be acute or chronic. One of the fish must be a cold water species, and two different classes of invertebrates must be represented, one of which includes a planktonic species resident in North America (e.g., daphnid).
39
The CCME protocol requirements for interim freshwater aquatic life guidelines were met by the Primary and Secondary Data in Table 5. The acute tests on rainbow trout and fathead minnow fulfill the requirement for tests on two freshwater fish species, with the rainbow trout fulfilling the requirement for a cold water species. Acceptable test results are available for three species of invertebrate: Daphnia magna and Ceriodaphnia dubia, representing the class Branchiopoda and Hyalella azteca, representing the class Malacostraca. Thus all the CCME protocol requirements for data quantity are met. Guideline Derivation "Guidelines are preferably derived from the lowest-observable-effect-level (LOEL) from a chronic study using a non-lethal endpoint for the most sensitive life stage of the most sensitive aquatic species investigated. The most sensitive LOEL is multiplied by an uncertainty factor of 0.1 to arrive at the guideline value" (CCME 1999). The lowest chronic LOEC for primary or secondary Data in this dataset is 16 mg⋅L-1 for the 72 hour growth endpoint for Selenastrum capricornutum (without the pH of the solution being buffered). This yields a guideline value of 1.6 mg⋅L-1. A guideline can also be calculated from acute data. This procedure can be used in the absence of sufficient chronic data or when a guideline based on the lowest chronic LOEC would not be protective of acute effects (e.g., WQG for bromoxynil [CCME 1999]). In this procedure, the lowest LC50 result is multiplied by an application factor of 0.05 (for non-persistent variables) or 0.01 (for persistent variables) to give the guideline value. For DIPA, the lowest LC50 in the acute primary or secondary data in this dataset is 289 mg⋅L-1 from the ERAC (1998) study on the 48 hour survival endpoint for Daphnia magna. Multiplying this value by the application factor for non-persistent variables (i.e., 0.05) gives a value of 14 mg⋅L-1. This value is higher than that calculated from the chronic dataset, and thus the guideline is set at 1.6 mg⋅L-1 based on the chronic dataset (Table 4). Irrigation
Irrigation water quality guidelines for DIPA were developed using the protocol (“Protocols for Deriving Water Quality Guidelines for the Protection of Agricultural Water Uses”; CCME, 1993). The toxicological data set was sufficient to derive interim guidelines (Table 3). Data in Table 3 are classified as primary toxicological data by the CCME protocol. As laid out in the protocol, species maximum acceptable toxicant concentrations (SMATC) were calculated for (1) cereals, tame hays, and pasture crops (e.g., alfalfa and timothy) and (2) other crops (e.g., lettuce and carrot). The lowest SMATC is the interim irrigation guideline. As can be seen in Table 3, the sensitivity of plants to DIPA varies strongly depending on soil type. For most plant species and endpoints, plants are most sensitive to DIPA in sand or till and least sensitive in loam; the sensitivity of plants grown in artificial soil is usually in between these other two groups. Accordingly, guidelines were calculated for “poor soil” (i.e., sand or till), and loam. The reason for this approach was to provide an overall irrigation guideline, which was
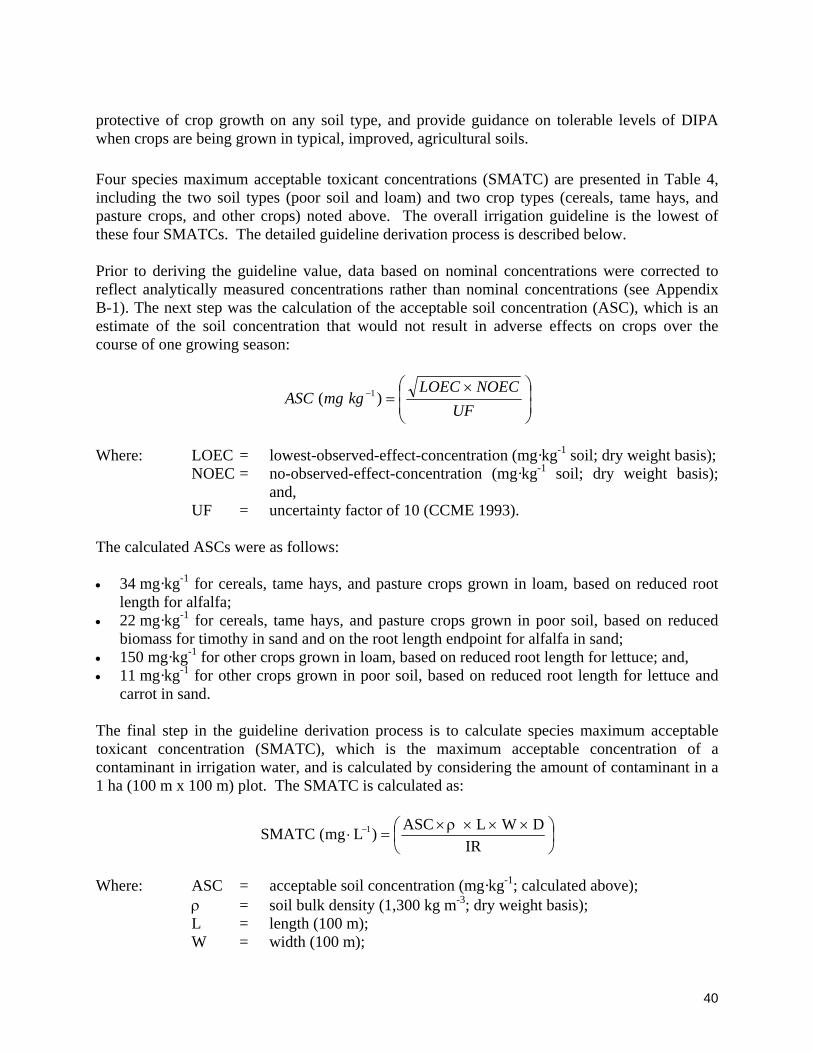
40
protective of crop growth on any soil type, and provide guidance on tolerable levels of DIPA when crops are being grown in typical, improved, agricultural soils. Four species maximum acceptable toxicant concentrations (SMATC) are presented in Table 4, including the two soil types (poor soil and loam) and two crop types (cereals, tame hays, and pasture crops, and other crops) noted above. The overall irrigation guideline is the lowest of these four SMATCs. The detailed guideline derivation process is described below. Prior to deriving the guideline value, data based on nominal concentrations were corrected to reflect analytically measured concentrations rather than nominal concentrations (see Appendix B-1). The next step was the calculation of the acceptable soil concentration (ASC), which is an estimate of the soil concentration that would not result in adverse effects on crops over the course of one growing season:
⎟⎟⎠
⎞⎜⎜⎝
⎛ ×=−
UFNOECLOEC
kgmgASC )( 1
Where: LOEC = lowest-observed-effect-concentration (mg·kg-1 soil; dry weight basis); NOEC = no-observed-effect-concentration (mg·kg-1 soil; dry weight basis);
and, UF = uncertainty factor of 10 (CCME 1993). The calculated ASCs were as follows: • 34 mg·kg-1 for cereals, tame hays, and pasture crops grown in loam, based on reduced root
length for alfalfa; • 22 mg·kg-1 for cereals, tame hays, and pasture crops grown in poor soil, based on reduced
biomass for timothy in sand and on the root length endpoint for alfalfa in sand; • 150 mg·kg-1 for other crops grown in loam, based on reduced root length for lettuce; and, • 11 mg·kg-1 for other crops grown in poor soil, based on reduced root length for lettuce and
carrot in sand. The final step in the guideline derivation process is to calculate species maximum acceptable toxicant concentration (SMATC), which is the maximum acceptable concentration of a contaminant in irrigation water, and is calculated by considering the amount of contaminant in a 1 ha (100 m x 100 m) plot. The SMATC is calculated as:
⎟⎠⎞
⎜⎝⎛ ×××ρ×
=⋅ −
IRDWLASC)Lmg(SMATC 1
Where: ASC = acceptable soil concentration (mg·kg-1; calculated above); ρ = soil bulk density (1,300 kg m-3; dry weight basis); L = length (100 m); W = width (100 m);

41
D = leaching depth (0.15 m for other crops and tame hays, cereals, and pasture crops, see note below); and,
IR = irrigation rate per year (1.2 x 10⁷ L ha-1). Note that the CCME (1993) protocol recommends a leaching depth of 0.15 m for other crops, but allows a leaching depth of up to 1.5 m for hays, cereals, and pasture crops if suitable leaching depth studies are available to support this. Studies by Luther et al. (1998) indicate that DIPA can bond to clay minerals, and so, in the absence of specific leaching studies, the conservative assumption is made that the leaching depth of DIPA is 0.15 m for all crop species. The SMATCs for cereals, tame hays, and pasture crops are 6 mg⋅L-1 in loam and 4 mg⋅L-1 in poor soil. For other crops, SMATCs are 25 mg⋅L-1 in loam and 2 mg⋅L-1 in poor soil. Therefore, the interim irrigation water quality guideline protective of all crop species, regardless of soil type, is 2 mg·L-1 (Table 4). Livestock Watering
Insufficient data were available to meet the requirements of the CCME protocol for developing livestock watering guidelines ("Protocols for Deriving Water Quality Guidelines for the Protection of Agricultural Water Uses," CCME 1993). However, effective management of existing sites with DIPA contamination requires a livestock watering guideline. Accordingly, livestock watering guidance values were developed for DIPA following the CCME protocol as closely as possible; however these values are not guidelines. The minimum toxicological dataset required by the protocol for derivation of interim guidelines is two acute or chronic studies on two or more mammalian species raised in Canada including at least one livestock species, and at least one acute or chronic study on one or more avian livestock species. The minimum dataset requirements were not therefore met, but in spite of this, it was felt that it would be useful to calculate a preliminary livestock watering guidance value based on the available data. Procedures exist in the CCME protocol for calculating a livestock watering guideline from either acute or chronic toxicological data. Available acute and chronic mammalian toxicological data for DIPA were reviewed and discussed in Chapter 7. The dermal study reported by Union Carbide (1973) was not considered due the large LD50 resulting from lowered bioavailability. The first step in the guideline derivation process was the calculation of the TDI, which was based on an extrapolation of acute to chronic data (CCME 1993):
⎟⎟⎠
⎞⎜⎜⎝
⎛×
=−−
UFLD
daybwkgmgTDI70
)( 5011
Where: LD50 = lowest lethal dose to 50% of the population (2,120 mg·kg-1 bw·day-1; Appendix A-
5); 70 = extrapolation factor from acute to chronic data (CCME 1993); and,
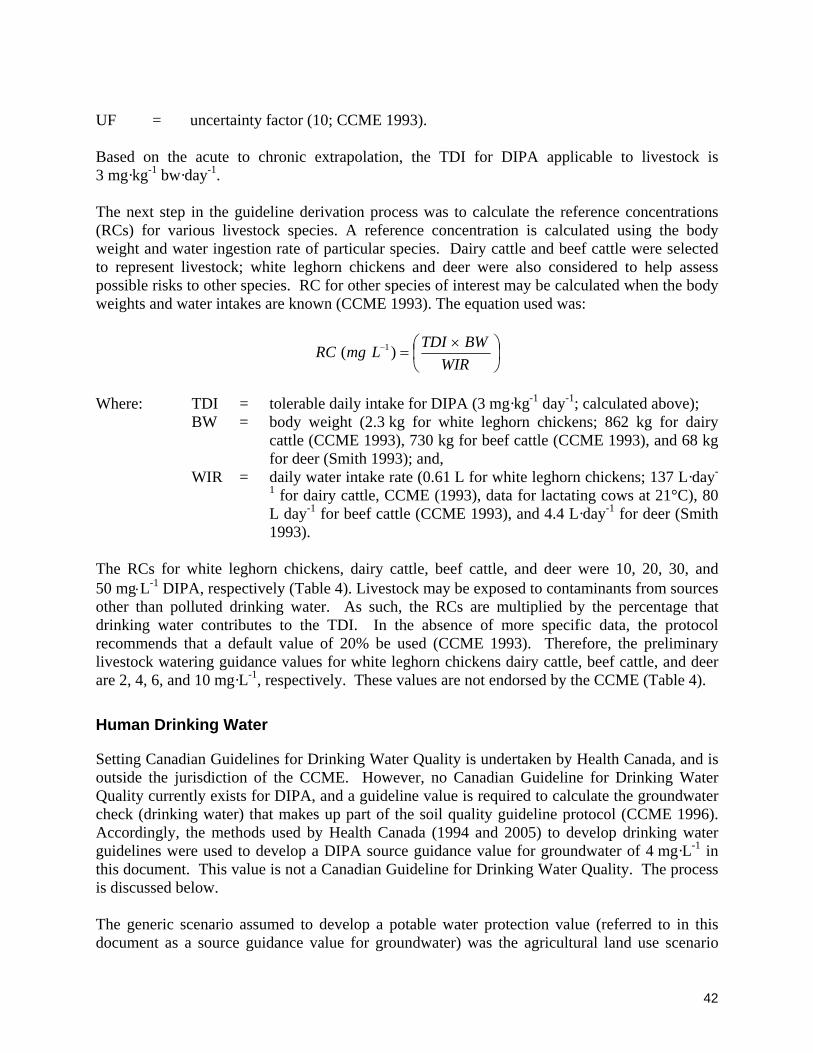
42
UF = uncertainty factor (10; CCME 1993). Based on the acute to chronic extrapolation, the TDI for DIPA applicable to livestock is 3 mg·kg-1 bw·day-1. The next step in the guideline derivation process was to calculate the reference concentrations (RCs) for various livestock species. A reference concentration is calculated using the body weight and water ingestion rate of particular species. Dairy cattle and beef cattle were selected to represent livestock; white leghorn chickens and deer were also considered to help assess possible risks to other species. RC for other species of interest may be calculated when the body weights and water intakes are known (CCME 1993). The equation used was:
⎟⎠⎞
⎜⎝⎛ ×
=−
WIRBWTDILmgRC )( 1
Where: TDI = tolerable daily intake for DIPA (3 mg·kg-1 day-1; calculated above); BW = body weight (2.3 kg for white leghorn chickens; 862 kg for dairy
cattle (CCME 1993), 730 kg for beef cattle (CCME 1993), and 68 kg for deer (Smith 1993); and,
WIR = daily water intake rate (0.61 L for white leghorn chickens; 137 L·day-
1 for dairy cattle, CCME (1993), data for lactating cows at 21°C), 80 L day-1 for beef cattle (CCME 1993), and 4.4 L·day-1 for deer (Smith 1993).
The RCs for white leghorn chickens, dairy cattle, beef cattle, and deer were 10, 20, 30, and 50 mg⋅L-1 DIPA, respectively (Table 4). Livestock may be exposed to contaminants from sources other than polluted drinking water. As such, the RCs are multiplied by the percentage that drinking water contributes to the TDI. In the absence of more specific data, the protocol recommends that a default value of 20% be used (CCME 1993). Therefore, the preliminary livestock watering guidance values for white leghorn chickens dairy cattle, beef cattle, and deer are 2, 4, 6, and 10 mg·L-1, respectively. These values are not endorsed by the CCME (Table 4). Human Drinking Water
Setting Canadian Guidelines for Drinking Water Quality is undertaken by Health Canada, and is outside the jurisdiction of the CCME. However, no Canadian Guideline for Drinking Water Quality currently exists for DIPA, and a guideline value is required to calculate the groundwater check (drinking water) that makes up part of the soil quality guideline protocol (CCME 1996). Accordingly, the methods used by Health Canada (1994 and 2005) to develop drinking water guidelines were used to develop a DIPA source guidance value for groundwater of 4 mg·L-1 in this document. This value is not a Canadian Guideline for Drinking Water Quality. The process is discussed below. The generic scenario assumed to develop a potable water protection value (referred to in this document as a source guidance value for groundwater) was the agricultural land use scenario
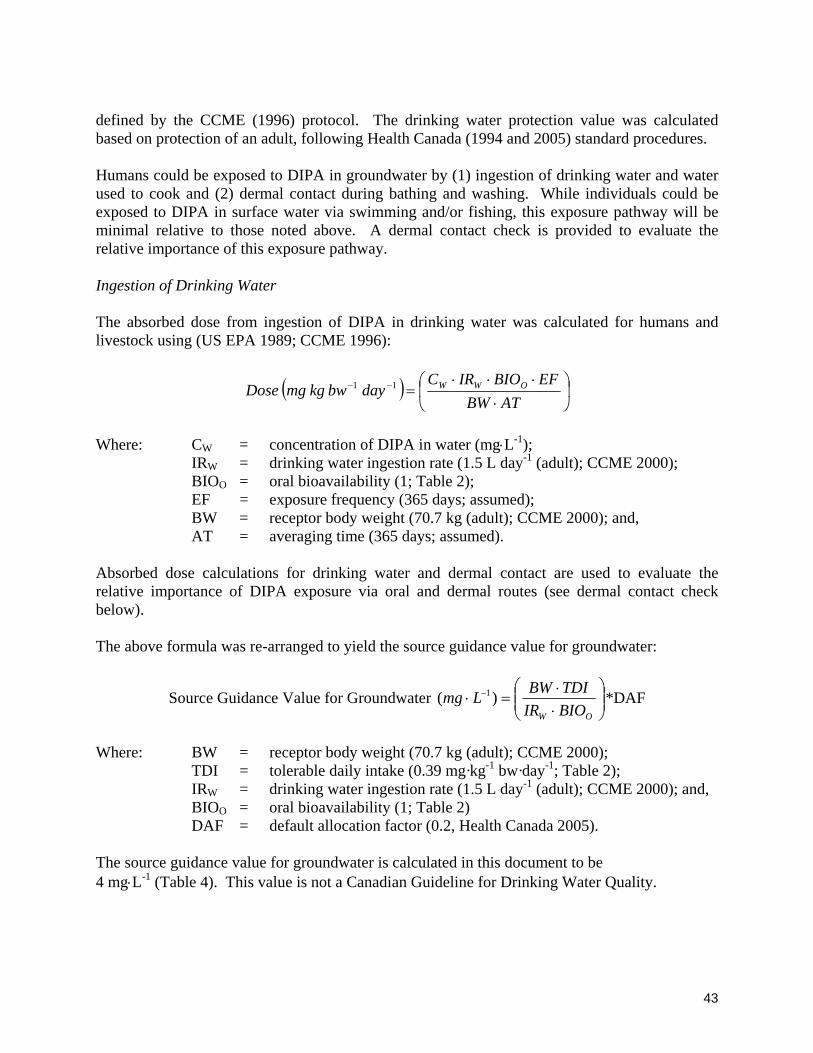
43
defined by the CCME (1996) protocol. The drinking water protection value was calculated based on protection of an adult, following Health Canada (1994 and 2005) standard procedures. Humans could be exposed to DIPA in groundwater by (1) ingestion of drinking water and water used to cook and (2) dermal contact during bathing and washing. While individuals could be exposed to DIPA in surface water via swimming and/or fishing, this exposure pathway will be minimal relative to those noted above. A dermal contact check is provided to evaluate the relative importance of this exposure pathway. Ingestion of Drinking Water The absorbed dose from ingestion of DIPA in drinking water was calculated for humans and livestock using (US EPA 1989; CCME 1996):
( ) ⎟⎠
⎞⎜⎝
⎛⋅
⋅⋅⋅=−−
ATBWEFBIOIRC
daybwkgmgDose OWW11
Where: CW = concentration of DIPA in water (mg⋅L-1); IRW = drinking water ingestion rate (1.5 L day-1 (adult); CCME 2000); BIOO = oral bioavailability (1; Table 2); EF = exposure frequency (365 days; assumed); BW = receptor body weight (70.7 kg (adult); CCME 2000); and, AT = averaging time (365 days; assumed). Absorbed dose calculations for drinking water and dermal contact are used to evaluate the relative importance of DIPA exposure via oral and dermal routes (see dermal contact check below). The above formula was re-arranged to yield the source guidance value for groundwater:
Source Guidance Value for Groundwater ⎟⎟⎠
⎞⎜⎜⎝
⎛⋅⋅
=⋅ −
OW BIOIRTDIBWLmg )( 1 *DAF
Where: BW = receptor body weight (70.7 kg (adult); CCME 2000); TDI = tolerable daily intake (0.39 mg·kg-1 bw·day-1; Table 2); IRW = drinking water ingestion rate (1.5 L day-1 (adult); CCME 2000); and, BIOO = oral bioavailability (1; Table 2) DAF = default allocation factor (0.2, Health Canada 2005). The source guidance value for groundwater is calculated in this document to be 4 mg⋅L-1 (Table 4). This value is not a Canadian Guideline for Drinking Water Quality.
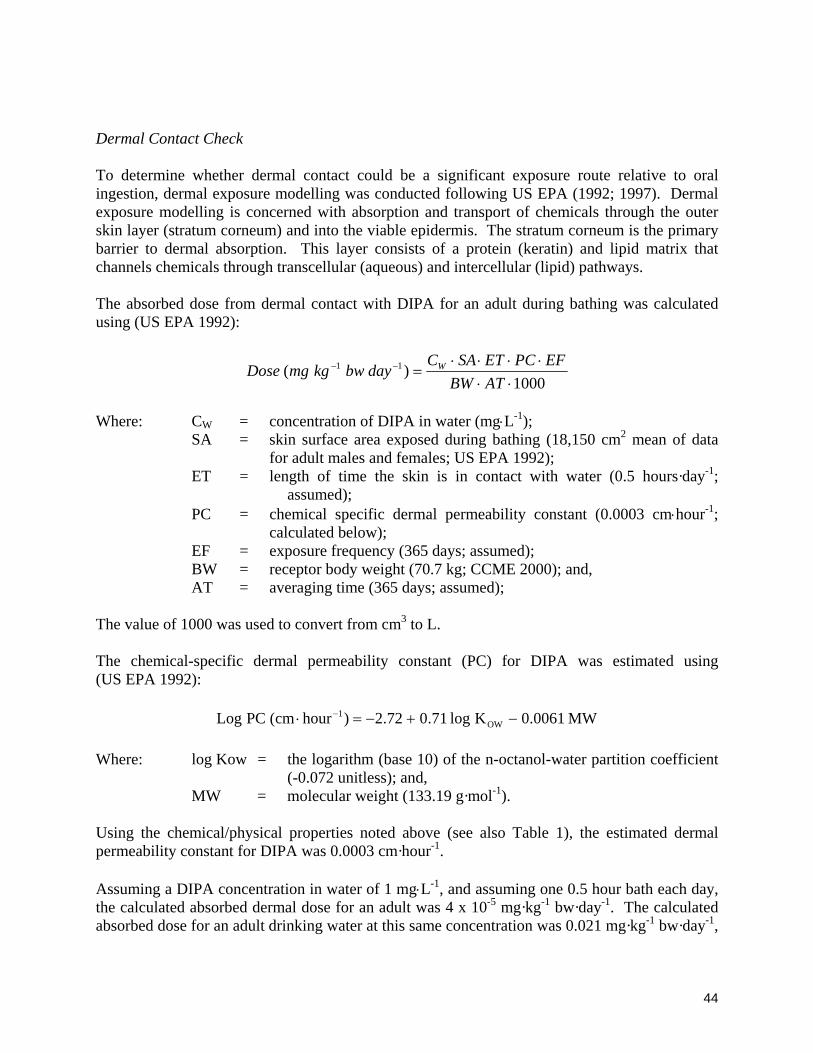
44
Dermal Contact Check To determine whether dermal contact could be a significant exposure route relative to oral ingestion, dermal exposure modelling was conducted following US EPA (1992; 1997). Dermal exposure modelling is concerned with absorption and transport of chemicals through the outer skin layer (stratum corneum) and into the viable epidermis. The stratum corneum is the primary barrier to dermal absorption. This layer consists of a protein (keratin) and lipid matrix that channels chemicals through transcellular (aqueous) and intercellular (lipid) pathways. The absorbed dose from dermal contact with DIPA for an adult during bathing was calculated using (US EPA 1992):
1000)( 11
⋅⋅⋅⋅⋅⋅
=−−
ATBWEFPCETSAC
daybwkgmgDose W
Where: CW = concentration of DIPA in water (mg⋅L-1); SA = skin surface area exposed during bathing (18,150 cm2 mean of data
for adult males and females; US EPA 1992); ET = length of time the skin is in contact with water (0.5 hours·day-1;
assumed); PC = chemical specific dermal permeability constant (0.0003 cm⋅hour-1;
calculated below); EF = exposure frequency (365 days; assumed); BW = receptor body weight (70.7 kg; CCME 2000); and, AT = averaging time (365 days; assumed); The value of 1000 was used to convert from cm3 to L. The chemical-specific dermal permeability constant (PC) for DIPA was estimated using (US EPA 1992):
MW0061.0Klog71.072.2)hourcm(PCLog OW1 −+−=⋅ −
Where: log Kow = the logarithm (base 10) of the n-octanol-water partition coefficient
(-0.072 unitless); and, MW = molecular weight (133.19 g·mol-1). Using the chemical/physical properties noted above (see also Table 1), the estimated dermal permeability constant for DIPA was 0.0003 cm·hour-1. Assuming a DIPA concentration in water of 1 mg⋅L-1, and assuming one 0.5 hour bath each day, the calculated absorbed dermal dose for an adult was 4 x 10⁻⁵ mg·kg-1 bw·day-1. The calculated absorbed dose for an adult drinking water at this same concentration was 0.021 mg·kg-1 bw·day-1,
45
assuming 1 mg⋅L-1 DIPA concentration in the drinking water supply. Therefore, the dermal pathway accounts for only approximately 0.2% of the oral dose and can be safely disregarded. Data Gaps
Freshwater Aquatic Life The dataset for freshwater aquatic life was sufficient to derive interim guidelines. For a full freshwater aquatic life guideline to be developed, the following additional studies would be required: • two chronic studies on freshwater fish species resident in North America; • two chronic studies on two invertebrate species from different classes, one of which was a
planktonic species resident in North America (e.g., a daphnid); and, • one study on a freshwater vascular plant or algal species resident in North America. All the studies for a full guideline must be of primary data quality. Marine Aquatic Life The dataset for marine aquatic life guideline was not sufficient to derive interim guidelines. The following additional toxicity tests would be required: • two acute or chronic studies on different marine fish species, including one temperate
species; and, • two acute or chronic studies on temperate marine invertebrate species from two different
classes. For a full marine guideline to be developed, the following additional studies would be required: • three studies on three species of temperate marine fish of which at least two are chronic; • two chronic studies on two temperate marine invertebrate species from different classes; and, • one study on a temperate marine vascular plant or algal species. All the studies for a full guideline must be of primary data quality. Irrigation Sufficient data were available to meet the requirements for the interim irrigation guideline. For a full irrigation guideline to be developed, the following additional studies would be required: • two chronic (i.e., full growing season) studies on cereal, tame hay, or pasture crops grown in
Canada; and, • two chronic (i.e., full growing season) studies on three or more other crop species grown in
Canada.
46
All the additional studies for a full guideline would have to be of primary data quality. Livestock Watering To comply with the requirements of the CCME (1993) protocol for an interim livestock watering guideline, the following additional studies would be required: • two acute or chronic studies on mammalian species raised in Canada, of which one is a
livestock species; and, • one acute or chronic study on an avian livestock species. In spite of this deficiency, preliminary livestock watering guidance values were derived, based on laboratory animal studies. These values are not endorsed by the CCME. Drinking Water Setting Canadian Guidelines for Drinking Water Quality is undertaken by Health Canada, and is outside the jurisdiction of the CCME. However, no Canadian Guideline for Drinking Water Quality currently exists for DIPA, and a guideline value is required to calculate the groundwater check (drinking water) that makes up part of the soil quality guideline protocol (CCME 1996). Accordingly, the methods used by Health Canada (1994 and 2005) to develop drinking water guidelines were used to develop a DIPA source guidance value for groundwater of 4 mg·L-1 in this document. This value is not a Canadian Guideline for Drinking Water Quality.
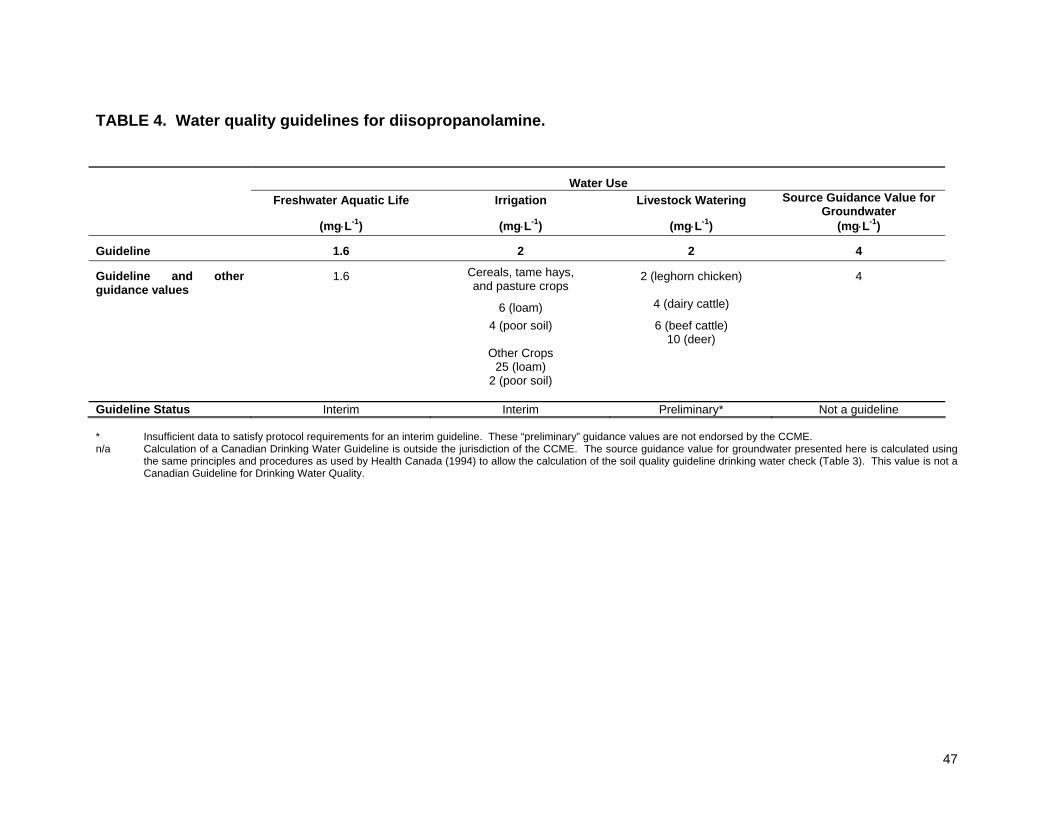
47
TABLE 4. Water quality guidelines for diisopropanolamine.
Water Use
Freshwater Aquatic Life Irrigation Livestock Watering Source Guidance Value for Groundwater
(mg⋅L-1) (mg⋅L-1) (mg⋅L-1) (mg⋅L-1)
Guideline 1.6 2 2 4
Guideline and other guidance values
1.6 Cereals, tame hays, and pasture crops
2 (leghorn chicken) 4
6 (loam) 4 (dairy cattle)
4 (poor soil) 6 (beef cattle) 10 (deer) Other Crops 25 (loam) 2 (poor soil) Guideline Status Interim Interim Preliminary* Not a guideline * Insufficient data to satisfy protocol requirements for an interim guideline. These “preliminary” guidance values are not endorsed by the CCME. n/a Calculation of a Canadian Drinking Water Guideline is outside the jurisdiction of the CCME. The source guidance value for groundwater presented here is calculated using
the same principles and procedures as used by Health Canada (1994) to allow the calculation of the soil quality guideline drinking water check (Table 3). This value is not a Canadian Guideline for Drinking Water Quality.
48
CHAPTER 11. DISCUSSION OF SOIL AND WATER QUALITY GUIDELINES Soil Quality Guidelines
Soil quality guidelines were derived for the protection of human and environmental health. The results are summarized in Table 3. Environmental Health The soil contact guidelines, off-site migration check, groundwater check, and a pH check were calculated. The limiting pathway for the environmental soil quality guideline was the groundwater check, which is 180 mg·kg-1 for all land uses. Insufficient data were available to calculate the soil and food ingestion guideline or the nutrient and energy cycling check. However, information was presented which showed that some soil microbial processes occur at high DIPA concentrations. Data gaps were discussed in the preceding section. Human Health The soil ingestion guideline, off-site migration check, and groundwater check were calculated. For each of the four land uses, the limiting pathway for the human health soil quality guideline was the groundwater check, which is 460 mg·kg-1. Insufficient data were available to calculate the produce, meat, and milk check. The inhalation of indoor air check was not calculated due to the low vapour pressure and Henry’s law coefficient of DIPA. Data gaps were discussed in the preceding section. Overall, the recommended soil quality guideline for DIPA in soil is 180 mg·kg-1 for all land uses, based on the environmental groundwater check. Water Quality Guidelines
Water quality guidelines were calculated for four water uses: freshwater aquatic life, irrigation, livestock watering, and human drinking water. The recommended guidelines are summarized in Table 4. Freshwater Aquatic Life The interim guideline for freshwater aquatic life was calculated to be 1.6 mg⋅L-1, based on a chronic growth endpoint (1.6 mg⋅L-1) for the green alga, Selenastrum capricornutum and an uncertainty factor of 0.1. Irrigation
49
Four species maximum acceptable toxicant concentration (SMATC) were calculated for irrigation. Based on the CCME protocol, SMATCs were calculated for 1) cereals, tame hays, and pasture crops and 2) other crops. For each of these two groups of plants, SMATCs were calculated for two soil types: loam and poor soil. The SMATCs for cereals, tame hays, and pasture crops are 6 mg⋅L-1 in loam and 4 mg⋅L-1 in poor soil. For other crops, the SMATCs are 25 mg⋅L-1 in loam and 2 mg⋅L-1 in poor soil. Therefore, the interim irrigation water quality guideline protective of all crop species, regardless of soil type, is 2 mg⋅L-1. Livestock Watering Insufficient data were available to meet the requirements of the CCME protocol for developing livestock watering guidelines. However, effective management of existing sites with DIPA contamination requires a livestock watering guideline. Accordingly, preliminary guidance values for this water use were calculated for dairy cattle and beef cattle, to represent likely agricultural animals. In addition, a preliminary guidance value was calculated for deer, to assist in evaluating possible risks to other species. The most sensitive species was the white leghorn chicken, for which a guideline of 2 mg⋅L-1 was calculated. The reason for the difference in sensitivity between life stages or species is related to how water consumption relates to body weight. In a situation where water was being used for the consumption of a single livestock species other than cattle, typical water ingestion rates and body weight could be used to calculate a species-specific guideline. These preliminary guidance values were based on studies on laboratory animals using appropriate safety factors, and no toxicological information was available for either a mammalian or avian livestock species. Should such data become available in the future, an interim guideline could be derived. At this time, the preliminary guidance value is not endorsed by the CCME.
50
REFERENCES ACT (American College of Toxicology). 1987. Final report on the safety assessment of
diisopropanolamine, triisopropanolamine, isopropanolamine, and mixed isopropanolamine. In: Twelfth Report of the Cosmetic Ingredient Review Expert Panel, Mildred Christian (ed.). J. Am. Coll. Toxicol. 6:53-76.
Aldrich Chemical Company. 1990. Aldrich chemical handbook. Milwaukee, Wisconsin.
Bachelor, F.W. 1976. Analysis and identification of sulfinol sludge and its degradation products. Report on work done in the Department of Chemistry, University of Calgary, sponsored by Shell Canada Resources Ltd. pp. 39.
Balsam, M.S. and E. Sagarin (eds.). 1972. Cosmetics: science and technology, 2nd ed. Wiley Interscience, New York.
BASF AG. 1987a. Department of Toxicology. Unpublished results. (87/269). 19.10.1987. Cited In: BASF 1994.
____ 1987b. Labor Oekologie; unveroeffentlichte Untersuchung. (1132/87). Cited In: BASF 1994.
____ 1988. Labor Oekologie; unveroeffentlichte Untersuchung. (1092/88). Cited In: BASF 1994.
BASF. 1994. Euclid Data Sheet: 1,1'-iminodipropan-2-ol. 32 pp.
Beyer, K.H. Jr., W.F. Bergfield, W.D. Berndt, W.V. Carlton, D.K. Hoffman, A.L. Schroeter, and R.C. Shank. 1987. Final report on the safety assessment of diisopropanolamine, triisopropanolamine, isopropanolamine and mixed isopropanolamine. J. Am. Coll. Toxicol. 6:53-76.
BIBRA (British Industrial Biological Research Association). 1991. Toxicity profile diisopropanolamine. TNO BIBRA International Ltd. (TC/RS/January 1991(n)/P.364/ T.2194M/ACN 38258). 6 pp.
Biosearch Inc. 1981a. Acute oral toxicity study on a sunscreen product containing 1 percent diisopropanolamine. Submission of unpublished data by CFTA. CFTA Code No. 2-30-6. (Cited in ACT 1987).
Biosearch Inc. 1981b. Rabbit eye irritation study on a sunscreen product containing 1 percent diisopropanolamine. Submission of unpublished data by CFTA. CFTA Code No. 2-30-7 (Cited in ACT 1987).
Bridié, A.L., C.J.M. Wolff, and M. Winter. 1979a. BOD and COD of some petrochemicals. Water Res. 13:627-630.
____ 1979b. The acute toxicity of some petrochemicals to goldfish. Water Res. 13:623-626.
CAPP (Canadian Association of Petroleum Producers). 1997. Evaluation of the fate of sulfolane and DIPA in the subsurface at sour gas processing plant sites. Report prepared by the Departments of Biological Sciences and Renewable Resources, University of Alberta. CAPP Pub#1997-0004. April 1997.
51
____ 1998. 1997 Investigation of hydrocarbon attenuation in natural wetlands, Vol. I and II. Unpublished report prepared by Komex International Ltd. File No. KI97-4545.
____ 1999. 1998 Investigation of hydrocarbon attenuation in natural wetlands, Vol. I and II. Unpublished report prepared by Komex International Ltd. File No. KI98-4545H.
____ 2000. 1999 Investigation of hydrocarbon attenuation in natural wetlands, Vol. I and II. Unpublished Report prepared by Komex International Ltd. File No. C45450105.
____ 2001. Soil and water quality guidelines for sulfolane and diisopropanolamine (DIPA): environmental and human health. Unpublished report prepared by Komex International Ltd. File No. C50560000.
CCME (Canadian Council of Ministers of the Environment). 1991a. Interim Canadian environmental quality criteria for contaminated sites. CCME EPC-CS34, September 1991.
____ 1991b. Appendix IX – A protocol for the derivation of water quality guidelines for the protection of aquatic life (April 1991). In: Canadian water quality guidelines, Canadian Council of Resource and Environment Ministers. 1987. Prepared by the Task Force on water Quality Guidelines. [Updated and reprinted with minor revisions and editorial changes in Canadian environmental quality guidelines, Chapter 4, Canadian Council of Ministers of the Environment, 1999, Winnipeg.]
____ 1996. A protocol for the derivation of environmental and human health soil quality guidelines. CCME-EPC-101E.
____ 1999. Canadian environmental quality guidelines. Canadian Council of Ministers of the Environment, Winnipeg.
____ 2000. Canada-wide standards for petroleum hydrocarbons (PHCs) in soil: scientific rationale. Canadian Council of Ministers of the Environment, Winnipeg. December 2000.
____ 2003 (draft). A protocol for the derivation of environmental and human health soil quality guidelines. Update. Canadian Council of Ministers of the Environment, Winnipeg.
Chong, N.M., 1994. Biological treatability of amine laden refinery wastewater. Wat. Sci. Techn. 30:21-28.
Chou, L.W., R.E. Speece, and R.H. Siddiqi. 1978. Acclimation and degradation of petrochemical wastewater components by methane fermentation. Biotechnol. Bioeng. Symp. 8:391-414.
Dawodu, O.F. and A. Meisen. 1993. Gas chromatographic analysis of alkanolaine solutions using capillary and packed columns. J. Chromatogr. 629:297-307.
De Zwart, D. and W. Sloof. 1987. Toxicity of mixtures of heavy metals and petrochemicals to Xenopus laevis. Bull. Environ. Contam. Toxicol. 38:345-351.
Dow (Chemical Company), 1954. Results of range finding toxicological tests on 1,1'-iminodi-2-propanol (March 4, 1954). Submission of unpublished data by CFTA. CFTA Code No. B-84-583. (Cited in ACT 1987).
52
____ 1984. Diisopropanolamine: results of a two-week toxicity study in the drinking water of CDF Fischer 344 rats. Submission of unpublished data by CFTA CFTA Code No. B-84-587. (Cited in ACT 1987).
____ 1985a. Letter from S.W. Franz to G. LeBlanc dated October 24, 1985. Progress report: Diisopropanolamine penetration and metabolism determination following dermal exposure to female Fischer 344 rats. Submission of unpublished data by CFTA. (Cited in ACT 1987).
____ 1985b. Letter from G. LeBlanc to G.N. McEwen (Dec. 6, 1985). Nitrosamines and isopropanolamines. Submission of unpublished data by CFTA. (Cited in ACT 1987).
____ 1994. Zitiert im HEDSET von DOW.23.05.1994. Unpublished report of the Dow Chemical Company. (Cited in BASF AG 1994).
____ 1995. Presentation on alkanolamine applications, properties, environmental behaviour, fate, and biodegradability. RJW – Dow – 11/95.
____ 1999. Specialty alkanolamines – isopropanolamines. Internet: http://www.dow.com/ alkanolamines/iso/iso.html.
Einarsson, S., S. Folestad, B. Josefsoon, and S. Lagerkvist. 1986. High resolution reversed-phase liquid chromatography system for the analysis of complex solutions of primary and secondary amino acids. Anal. Chem. 58.
Environment Canada. 1998a. Development of plant toxicity tests for assessment of contaminated soils. Prepared for Method Development and Application Section, Environmental Technology Centre, Environment Canada; by Aquaterra Environmental, Orton, Ontario. November 1998. 75 pp. plus appendices.
Environment Canada. 1998b. Development of earthworm toxicity tests for assessment of contaminated soils. Prepared for Method Development and Application Section, Environmental Technology Centre, Environment Canada; by Aquaterra Environmental, Orton, Ontario. December 1998. 52 pp. plus appendices.
ERAC (Environmental Research Advisory Council). 1998. Toxicity assessment of sulfolane and diisopropanolamine. Report prepared by HydroQual Laboratories and Golder Associates. ERAC Pub#1998-0005.
Exxon (Exxon Biomedical Sciences, Inc.). 1986. Letter: Toxicity of sulfolane, 2-piperdine ethanol and diisopropanolamine. 86MR 2025. (Cited in ERAC 1998).
FAO/WHO (Food and Agriculture Association/World Health Organization). 1958. Procedures for the testing of intentional food additives to establish their safety for use. Second Report of the Joint FAO/WHO Expert Committee on Food Additives, Geneva, World Health Organization (FAO Nutrition Meeting Report Series, No. 17; WHO Technical Report Series, No. 144).
Gieg, L.M., D.L. Coy, and P.M. Fedorak. 1999. Microbial mineralization of diisopropanolamine. Can. J. Microbiol. 45:377-388.
Gieg, L.M., E.A. Greene, D.L. Coy, and P.M. Fedorak. 1998. Diisopropanolamine biodegradation potential at sour gas plant sites. GW Monit. Remed. 18:158-173.
53
Goar, B.G. and T.O. Arrington. 1979. Guidelines set for handling sour gas – part 1 of sour gas treating, sour gas processing and sulfur recovery. Petroleum Publishing.
Greene, E.A., D.L. Coy, and P.M. Fedorak. 1999. Laboratory evaluations of factors affecting biodegradation of sulfolane and diisopropanolamine. Bioremed. J. 3:299-313.
Greene, J.C., C.L. Bartels, L.J. Warren-Hicks, B.R. Parkhurst, G.L. Linder, S.A. Peterson, and W.E. Miller. 1989. Protocols for short term toxicity screening of hazardous waste sites. United States Environmental Protection Agency 600/3-88-029/102 p.
Headley, J.V., K.M. Peru, and L.C. Dickson. 1999a. Ion-exchange electrospray ionization liquid chromatography mass spectrometry and tandem mass spectrometry of alkanolamines in wetland vegetation exposed to sour-gas contaminated groundwater. Rapid Comm. Mass Spectrom. 13:730-736.
____ 1999b. Gas chromatographic-mass spectrometric determination of sulfolane in wetland vegetation exposed to sour gas-contaminated groundwater. J. Chromatogr. 859:69-75.
Health Canada. 1994. Human health risk assessment for priority substances. Cat. No. En40-215/41E. Ottawa.
_____ (Water Quality and Health Bureau). Letter to C.C.M.E. 2005.
Huels, A.G., 1992. Department of Biology and Toxicology. Unpublished results (Nr. 99, 12.03.1992). (Cited in BASF AG 1995).
Issenberg, P., E.E. Conrad, J.W. Nielsen, D.A. Klein, and S.E. Miller. 1984. Determination of N-nitrosobis(2-hydroxypropyl)amine in environmental samples. In: N-Nitroso Compounds: Occurrence, Biological Effects and Relevance to Human Cancer. I.K. O’Neill, R.C. von Borstel, C.T. Miller, J. Long and H. Bartsch (eds.). IARC Sci Publ. 57:43-50. Lyon.
Jellinke, J. (ed.). 1970. Formulation and function of cosmetics, 2nd ed., Wiley-Interscience, New York.
Jones, A. and J.M. Turner. 1973. Microbial metabolism of amino alcohols. Biochem. J. 134:167-182.
Kim, J.H., C. Dobrogowska, and L.G. Hepler. 1987. Thermodynamics of ionization of aqueous alkanolamines. Can. J. Chem. 65:1726-1728.
Kirk-Othmer. 1999. Encyclopedia of chemical technology. Fourth Edition, 1999. John Wiley & Sons.
Komex International Ltd. 1999. Shell Waterton Complex: Regional sulfolane and DIPA groundwater contaminant situation, status to the end of 1998. Report prepared for and available from Shell Canada Limited. January 1999.
Konishi, Y., K. Yamamoto, H. Eimoto, M. Tsutsumi, M. Sigimura, H. Nii, and Y. Mori. 1991. Carcinogenic activity of endogenously synthesized N-nitrosobis(2-hydroxypropyl)amine in rats. In: Relevance to Human Cancer of N-nitroso Compounds, Tobacco Smoke and Mycotoxins. I.K O’Neill, J. Chen and H. Bartsch (eds.). IARC Scientific Publications, Lyon. pp. 318-321.
54
Langvardt, P.W. and R.G. Melcher. 1980. Determination of ethanol- and isopropanolamines in air at parts-per-billion levels. Anal. Chem. 52:669-671.
Lenga, R.E. 1985. The Sigma-Aldrich Library of Chemical Safety Data. Edition I. Aldrich Chemical Company. Milwaukee, WI.
Lide, D.R. (ed.). 1996. CRC handbook of chemistry and physics, 77th Edition.
Lijinsky, W., and H.W. Taylor. 1978. Comparative carcinogenicity of some derivatives of nitrosodi-n-propylamine in rats. Ecotoxicol. Environ. Safety. 2:421-426.
Luther, S.M., M.J. Dudas, and P.M. Fedorak. 1998. Sorption of sulfolane and diisopropanolamine by soils, clays and aquifer materials. J. Contam. Hydrol. 32:159-176.
Lyman, W.J., W.F. Reehl, and D.H. Rosenblatt. 1982. Handbook of chemical properties estimation methods. McGraw-Hill.
McCall, P.J., R.L. Swann, D.A. Laskowski, S.M. Unger, S.A. Vrona, and H.J. Dishburger. 1980. Estimation of chemical mobility in soil from liquid chromatographic retention times. Bull. Environ. Contam. Toxicol. 24:190-195.
Mortelmans, K., S. Haworth, T. Lawlor, W. Speck, B. Tainer, and E. Zeiger. 1986. Salmonella mutagenicity tests: II. Results from the testing of 270 chemicals. Environ. Mutagen. 8:1-119.
Nasholm, T., G. Sandberg, and A. Ericsson. 1987. Quantitative analysis of amino acids in conifer tissues by high-performance liquid chromatography and fluorescence detection of their 9-fluorenylmethyl chloroformate derivatives. J. Chromatogr. 396:225-236.
Navarre, M.G. (ed.). 1975. The chemistry and manufacture of cosmetics, 2nd ed. Continental Press. Orlando, Fla.
NIOSH (National Institute for Occupational Safety and Health). 2000. Registry of toxic effects of chemical substances for DIPA. Record Number UB6600000.
NRC (National Research Council). 1993. Pesticides in the diets of infants and children. National Academy Press. Washington, DC.
OECD (Organisation for Economic Cooperation and Development). 1984. OECD guidelines for testing of chemicals: Earthworm acute toxicity test. Organisation for Economic Cooperation and Development Guideline No. 207. Paris, France. 208 pp.
Pour, P., J. Althoff, and D. Nagel. 1977. Induction of epithelial neoplasms by local application of N-nitrosobis(2-hydroxypropyl)amine and N-nitrosobis(2-acetoxypropyl)amine. Cancer Lett. 3:109-113.
Pour, P., F.W. Kruger, J. Althoff, A. Cardesa, and U. Mohr. 1974. The effect of beta-oxidized nitrosamines on Syrian golden hamsters. 3. 2,2'dihydroxy-di-n-propylnitrosamine. J. Natl. Cancer Inst. 54:141-146.
Pour, P., S. Salmsai, R. Runge, R. Gingell, L. Wallcave, D. Nagel, and K. Stepan. 1979. Carcinogenicity of N-nitrosobis(2-hydroxypropyl)amine and N-nitrosobis(2-oxopropyl)amine in MRC rats. J. Natl. Cancer Inst. 63:181-190.
55
Pour, P., L. Wallcave, D. Nagel, and S. Salmsai. 1980. Induction of local epidermal papilloma and carcinomas by selected nitrosamines. Cancer Lett. 10:365-373.
Renwick, A. G. and N.R. Lazarus. 1998. Human variability and non-cancer risk assessment - an analysis of the default uncertainty factor. Regul Toxicol Pharmacol. 27:3-20.
Rothkopf, G.S. and R. Bartha. 1984. Structure-biodegradability correlations among xenobiotic industrial amines. J. Am. Oil Chem. Soc. 61:977-980.
Serbin, L. and D. Birkholz. 1995. A sensitive analytical procedure for the determination of primary and secondary alkanolamines in air. Am. Ind. Hyg. Assoc. J. 56:66-69.
Smith, H.C. 1993. Alberta mammals, an atlas and guide. The Provincial Museum of Alberta, Edmonton. pp. 206-207.
Solomons, W.T. and Graham. 1988. Organic chemistry, 4th Edition. John Wiley, New York.
Sorensen, J.A., R.H. Fraley, J.R. Gallagher, and C.R. Schmit. 1996. Background report on subsurface environmental issues relating to natural gas sweetening and dehydration operations. Gas Research Institute, Technical Report. March 1996.
Springborn Institute of Bioresearch, Inc. 1982a. Acute oral toxicity study on a facial sunscreen product containing 1 percent diisopropanolamine. Submission of unpublished data by CFTA. CFTA Code No. 2-30-5. (Cited in ACT 1987).
____ 1982b. Photoirradiation and primary irritation of rabbit skin by a facial sunscreen product containing 1 percent diisopropanolamine. Submission of unpublished data by CFTA. CFTA Code No. 2-30-10. (Cited in ACT 1987).
____ 1982c. Submission of unpublished data by CFTA. Rabbit eye irritation study on a facial sunscreen product containing 1 percent diisopropanolamine. CFTA Code No. 2-30-8. (Cited in ACT 1987).
SRC (Saskatchewan Research Council). 1994. Aquatic plant toxicity tests – indicators for growth inhibition and stimulation for petroleum industry waste. SRC Publication No. E-2100-8-C-93, prepared for the Canadian Association of Petroleum Producers, Saskatchewan Research Council. Saskatoon, SK. September 1994.
Toropkov, V.V. 1980a. Kliniko-morfologicheskoe issledovanie deistviia izopropanolaminov na glaza. [Clinical-morphological study on the effect of isopropanolamines on the eyes.] Gig Tr Prof Zabol. 2:48-50. (Cited in ACT 1987).
____ 1980b. Gigienicheskoe obosnovanie predel’no dopustimykh kontsetrasii mono-, di- I triizopropanolamina v vode vodoemov. [Hygienic basis for the maximum permissible concentrations of mono-, di- and triisopropanolamines in the water of reservoirs]. Gig Sanit 1980. 3:79-81. (Cited in ACT 1987).
Union Carbide. 1973. Unpublished report prepared by the Chemical Hygiene Fellowship. Miscellaneous toxicity studies. Special Report No. 36-78. December 6, 1973. Union Carbide Corporation, NY. (Cited in BIBRA 1991).
US EPA (United States Environmental Protection Agency). 1989. Risk assessment guidance for superfund, Volume I, human health evaluation manual (Part A), Interim Final. Office of
56
Emergency and Remedial Response. Washington, DC. EPA/540/1-89/002. December 1989.
____ 1992. Dermal exposure assessment: principles and applications. Office of Research and Development. Washington, DC. EPA/600/8-91/011B. January 1992.
____ 1997. Exposure factors handbook Volume 1, general factors. Office of Research and Development. Washington, DC. EPA600/P-95/002Fa. August 1997.
____ 1998. Health Effects Test Guidelines. OPPTS 870.7600 Dermal Penetration. EPA 712-C-98-350. August 1998.
Verschueren, K. 1996. Handbook of environmental data on organic chemicals, Third Edition. Van Nostrand Reinhold.
Wang, W. 1987. Root elongation method for toxicity testing of organic and inorganic pollutants. Environ. Tox. Chem. 6:409-414.
WHO (World Health Organization). 1967. Procedures for investigating intentional and unintentional food additives. Report of a WHO Scientific Group, Geneva. World Health Organization (WHO Technical Report Series, No. 348).
____ 1990. Principles for the toxicological assessment of pesticide residues in food IPCS: Environmental Health Criteria 104, 76-80. World Health Organization, Geneva.
____ 1994. Assessing human health risks of chemicals: derivation of guidance values for health-based exposure limits. IPCS: Environmental Health Criteria 170. World Health Organization, Geneva. pp. 27-31.
Williams, G.M. 1989. Methods for evaluating chemical genotoxicity. Ann. Rev. Pharmac. Toxicol. 29:189-211.
Witzaney, A.M. and P.M. Fedorak. 1996. A review of the characteristics, analyses and biodegradability of sulfolane and alkanolamines used in sour gas processing. Report prepared for and available from Shell Canada Limited. February 1996.
Wrubleski, R.M. and C.R. Drury. 1997. Chemical contamination of groundwater at gas processing plants the problem. Twenty-Third Annual Aquatic Toxicity Workshop. Calgary, Alberta, Canada. October 7-9, 1996. Canadian Technical Report of Fisheries and Aquatic Sciences. 0:3-4.
Yamamoto, K., A. Nakajima, H. Eimoto, M. Tsutsumi, H. Maruyama, A. Denda, H. Nii, Y. Mori, and Y. Konishi. 1989. Carcinogenic activity of endogenously synthesized N-nitrosobis(2-hydroxypropyl)amine in rats administered bis(2-hydroxypropyl)amine and sodium nitrite. Carcinogen. 10:1607-1611.
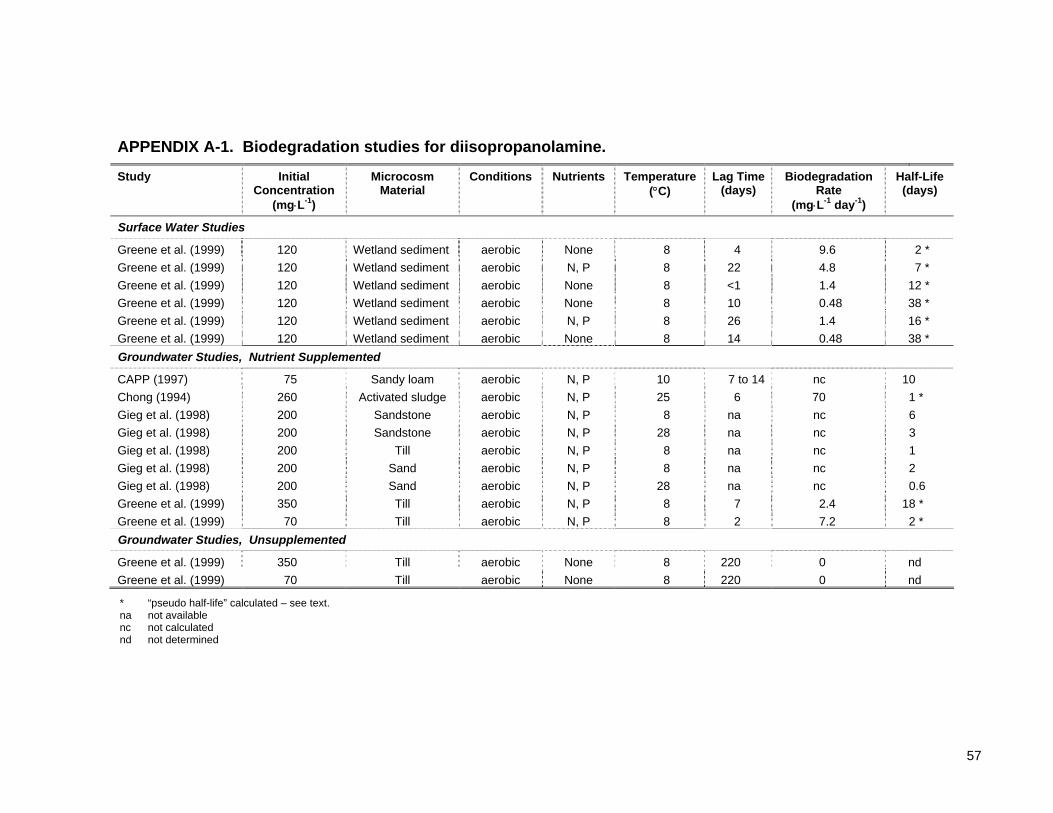
57
APPENDIX A-1. Biodegradation studies for diisopropanolamine.
Study Initial Concentration
(mg⋅L-1)
Microcosm Material
Conditions Nutrients Temperature(°C)
Lag Time(days)
Biodegradation Rate
(mg⋅L-1 day-1)
Half-Life(days)
Surface Water Studies
Greene et al. (1999) 120 Wetland sediment aerobic None 8 4 9.6 2 * Greene et al. (1999) 120 Wetland sediment aerobic N, P 8 22 4.8 7 * Greene et al. (1999) 120 Wetland sediment aerobic None 8 <1 1.4 12 * Greene et al. (1999) 120 Wetland sediment aerobic None 8 10 0.48 38 * Greene et al. (1999) 120 Wetland sediment aerobic N, P 8 26 1.4 16 * Greene et al. (1999) 120 Wetland sediment aerobic None 8 14 0.48 38 * Groundwater Studies, Nutrient Supplemented
CAPP (1997) 75 Sandy loam aerobic N, P 10 7 to 14 nc 10 Chong (1994) 260 Activated sludge aerobic N, P 25 6 70 1 * Gieg et al. (1998) 200 Sandstone aerobic N, P 8 na nc 6 Gieg et al. (1998) 200 Sandstone aerobic N, P 28 na nc 3 Gieg et al. (1998) 200 Till aerobic N, P 8 na nc 1 Gieg et al. (1998) 200 Sand aerobic N, P 8 na nc 2 Gieg et al. (1998) 200 Sand aerobic N, P 28 na nc 0.6 Greene et al. (1999) 350 Till aerobic N, P 8 7 2.4 18 * Greene et al. (1999) 70 Till aerobic N, P 8 2 7.2 2 * Groundwater Studies, Unsupplemented
Greene et al. (1999) 350 Till aerobic None 8 220 0 nd Greene et al. (1999) 70 Till aerobic None 8 220 0 nd
* “pseudo half-life” calculated – see text. na not available nc not calculated nd not determined
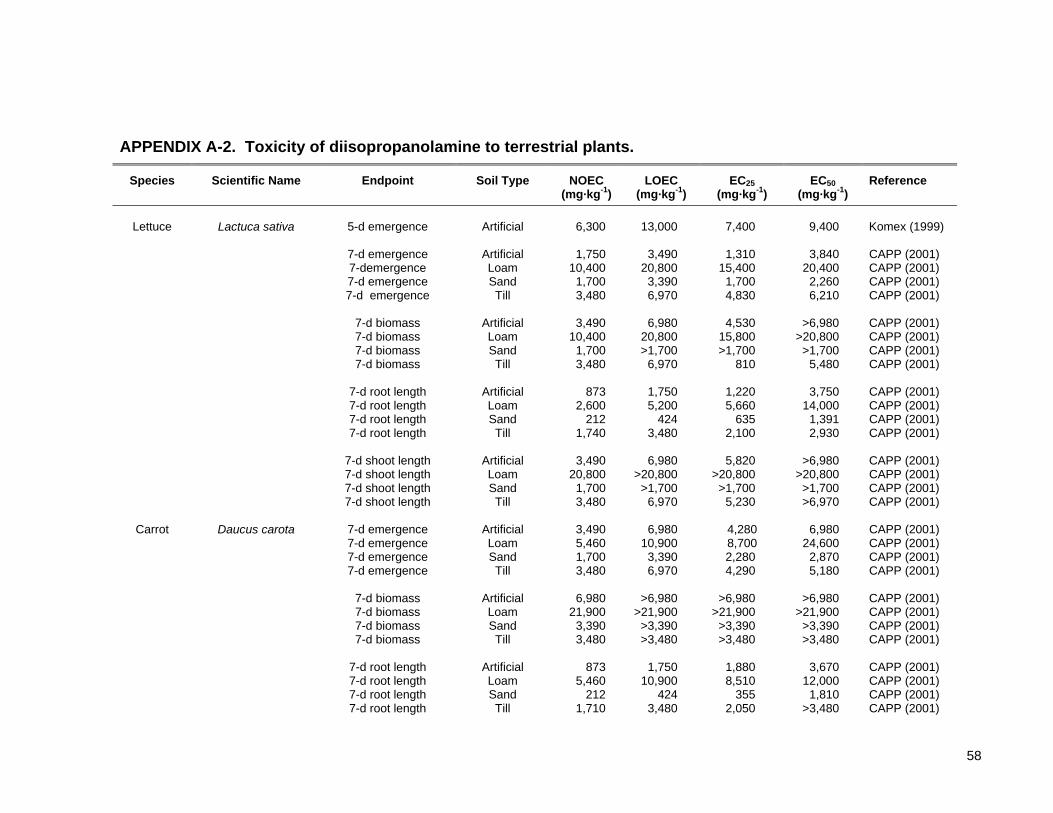
58
APPENDIX A-2. Toxicity of diisopropanolamine to terrestrial plants.
Species Scientific Name Endpoint Soil Type NOEC (mg·kg-1)
LOEC (mg·kg-1)
EC25 (mg·kg-1)
EC50 (mg·kg-1)
Reference
Lettuce Lactuca sativa 5-d emergence Artificial 6,300 13,000 7,400 9,400 Komex (1999)
7-d emergence Artificial 1,750 3,490 1,310 3,840 CAPP (2001) 7-demergence Loam 10,400 20,800 15,400 20,400 CAPP (2001) 7-d emergence Sand 1,700 3,390 1,700 2,260 CAPP (2001) 7-d emergence Till 3,480 6,970 4,830 6,210 CAPP (2001) 7-d biomass Artificial 3,490 6,980 4,530 >6,980 CAPP (2001) 7-d biomass Loam 10,400 20,800 15,800 >20,800 CAPP (2001) 7-d biomass Sand 1,700 >1,700 >1,700 >1,700 CAPP (2001) 7-d biomass Till 3,480 6,970 810 5,480 CAPP (2001) 7-d root length Artificial 873 1,750 1,220 3,750 CAPP (2001) 7-d root length Loam 2,600 5,200 5,660 14,000 CAPP (2001) 7-d root length Sand 212 424 635 1,391 CAPP (2001) 7-d root length Till 1,740 3,480 2,100 2,930 CAPP (2001) 7-d shoot length Artificial 3,490 6,980 5,820 >6,980 CAPP (2001) 7-d shoot length Loam 20,800 >20,800 >20,800 >20,800 CAPP (2001) 7-d shoot length Sand 1,700 >1,700 >1,700 >1,700 CAPP (2001) 7-d shoot length Till 3,480 6,970 5,230 >6,970 CAPP (2001)
Carrot Daucus carota 7-d emergence Artificial 3,490 6,980 4,280 6,980 CAPP (2001)
7-d emergence Loam 5,460 10,900 8,700 24,600 CAPP (2001) 7-d emergence Sand 1,700 3,390 2,280 2,870 CAPP (2001) 7-d emergence Till 3,480 6,970 4,290 5,180 CAPP (2001) 7-d biomass Artificial 6,980 >6,980 >6,980 >6,980 CAPP (2001) 7-d biomass Loam 21,900 >21,900 >21,900 >21,900 CAPP (2001) 7-d biomass Sand 3,390 >3,390 >3,390 >3,390 CAPP (2001) 7-d biomass Till 3,480 >3,480 >3,480 >3,480 CAPP (2001) 7-d root length Artificial 873 1,750 1,880 3,670 CAPP (2001) 7-d root length Loam 5,460 10,900 8,510 12,000 CAPP (2001) 7-d root length Sand 212 424 355 1,810 CAPP (2001) 7-d root length Till 1,710 3,480 2,050 >3,480 CAPP (2001)
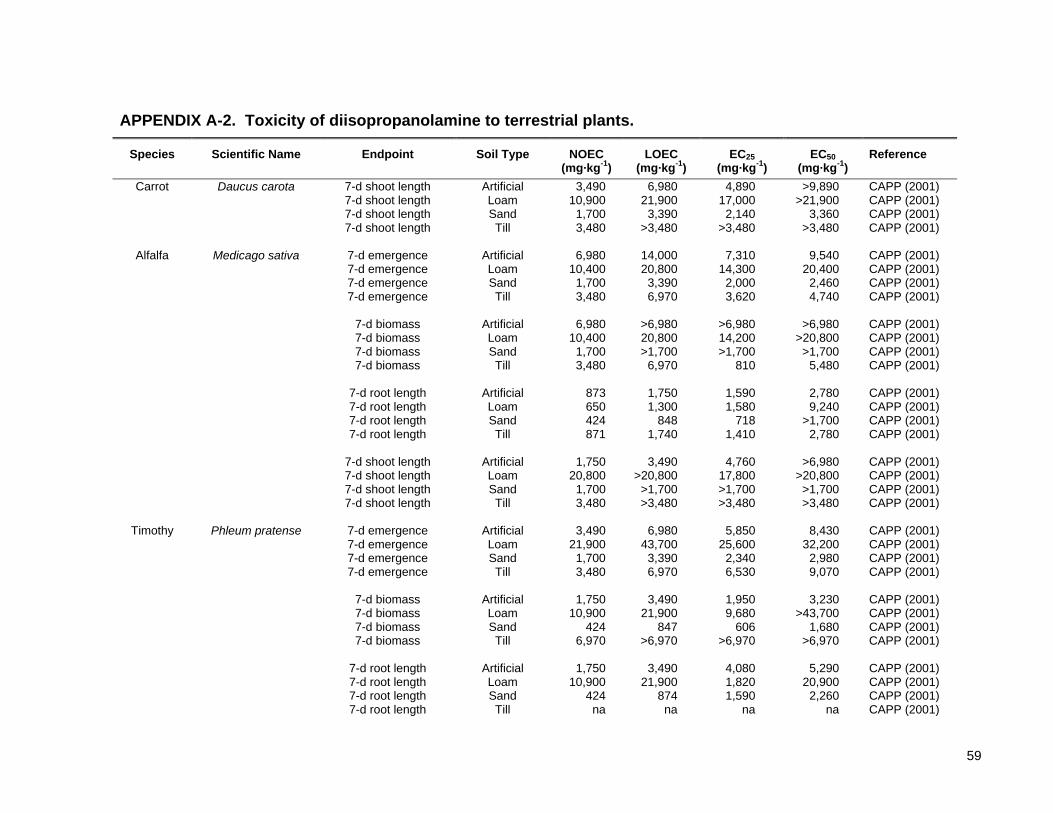
59
Scientific Name Soil Type NOEC (mg·kg-1)
LOEC (mg·kg-1)
EC25 (mg·kg-1)
EC50 (mg·kg-1)
Reference
APPENDIX A-2. Toxicity of diisopropanolamine to terrestrial plants.
Species Endpoint
Carrot Daucus carota 7-d shoot length Artificial 3,490 6,980 4,890 >9,890 CAPP (2001) 7-d shoot length Loam 10,900 21,900 17,000 >21,900 CAPP (2001) 7-d shoot length Sand 1,700 3,390 2,140 3,360 CAPP (2001) 7-d shoot length Till 3,480 >3,480 >3,480 >3,480 CAPP (2001)
Alfalfa Medicago sativa 7-d emergence Artificial 6,980 14,000 7,310 9,540 CAPP (2001) 7-d emergence Loam 10,400 20,800 14,300 20,400 CAPP (2001) 7-d emergence Sand 1,700 3,390 2,000 2,460 CAPP (2001) 7-d emergence Till 3,480 6,970 3,620 4,740 CAPP (2001) 7-d biomass Artificial 6,980 >6,980 >6,980 >6,980 CAPP (2001) 7-d biomass Loam 10,400 20,800 14,200 >20,800 CAPP (2001) 7-d biomass Sand 1,700 >1,700 >1,700 >1,700 CAPP (2001) 7-d biomass Till 3,480 6,970 810 5,480 CAPP (2001) 7-d root length Artificial 873 1,750 1,590 2,780 CAPP (2001) 7-d root length Loam 650 1,300 1,580 9,240 CAPP (2001) 7-d root length Sand 424 848 718 >1,700 CAPP (2001) 7-d root length Till 871 1,740 1,410 2,780 CAPP (2001) 7-d shoot length Artificial 1,750 3,490 4,760 >6,980 CAPP (2001) 7-d shoot length Loam 20,800 >20,800 17,800 >20,800 CAPP (2001) 7-d shoot length Sand 1,700 >1,700 >1,700 >1,700 CAPP (2001) 7-d shoot length Till 3,480 >3,480 >3,480 >3,480 CAPP (2001)
Timothy Phleum pratense 7-d emergence Artificial 3,490 6,980 5,850 8,430 CAPP (2001) 7-d emergence Loam 21,900 43,700 25,600 32,200 CAPP (2001) 7-d emergence Sand 1,700 3,390 2,340 2,980 CAPP (2001) 7-d emergence Till 3,480 6,970 6,530 9,070 CAPP (2001) 7-d biomass Artificial 1,750 3,490 1,950 3,230 CAPP (2001) 7-d biomass Loam 10,900 21,900 9,680 >43,700 CAPP (2001) 7-d biomass Sand 424 847 606 1,680 CAPP (2001) 7-d biomass Till 6,970 >6,970 >6,970 >6,970 CAPP (2001) 7-d root length Artificial 1,750 3,490 4,080 5,290 CAPP (2001) 7-d root length Loam 10,900 21,900 1,820 20,900 CAPP (2001) 7-d root length Sand 424 874 1,590 2,260 CAPP (2001) 7-d root length Till na na na na CAPP (2001)
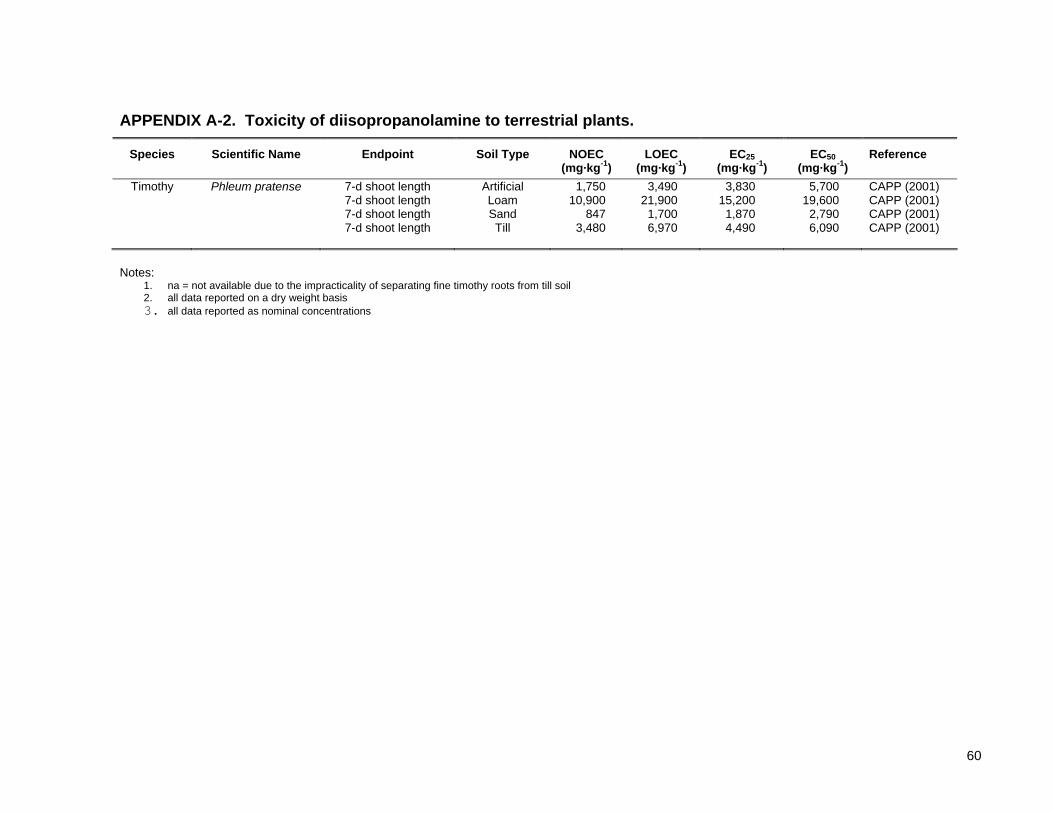
60
Scientific Name Soil Type NOEC (mg·kg-1)
LOEC (mg·kg-1)
EC25 (mg·kg-1)
EC50 (mg·kg-1)
Reference
APPENDIX A-2. Toxicity of diisopropanolamine to terrestrial plants.
Species Endpoint
Timothy Phleum pratense 7-d shoot length Artificial 1,750 3,490 3,830 5,700 CAPP (2001) 7-d shoot length Loam 10,900 21,900 15,200 19,600 CAPP (2001) 7-d shoot length Sand 847 1,700 1,870 2,790 CAPP (2001) 7-d shoot length Till 3,480 6,970 4,490 6,090 CAPP (2001)
Notes:
1. na = not available due to the impracticality of separating fine timothy roots from till soil 2. all data reported on a dry weight basis 3. all data reported as nominal concentrations
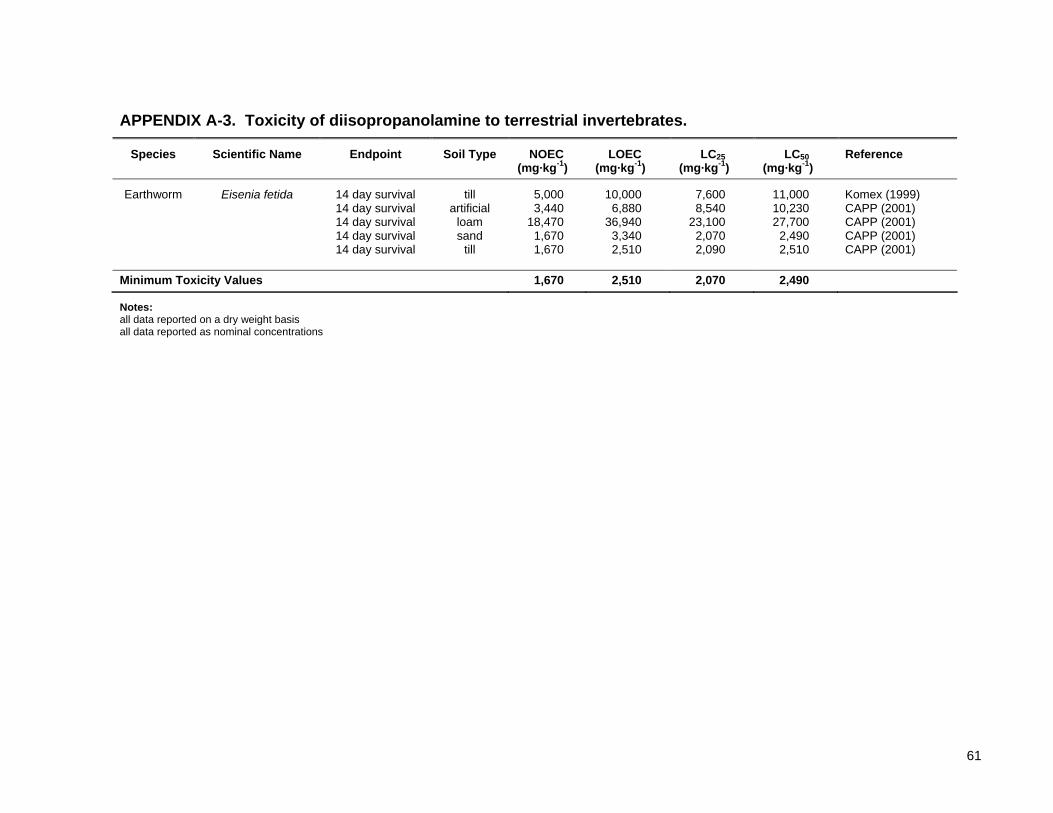
61
APPENDIX A-3. Toxicity of diisopropanolamine to terrestrial invertebrates.
Species Scientific Name Endpoint Soil Type NOEC (mg·kg-1)
LOEC (mg·kg-1)
LC25 (mg·kg-1)
LC50 (mg·kg-1)
Reference
Earthworm Eisenia fetida 14 day survival till 5,000 10,000 7,600 11,000 Komex (1999) 14 day survival artificial 3,440 6,880 8,540 10,230 CAPP (2001) 14 day survival loam 18,470 36,940 23,100 27,700 CAPP (2001) 14 day survival sand 1,670 3,340 2,070 2,490 CAPP (2001) 14 day survival till 1,670 2,510 2,090 2,510 CAPP (2001)
Minimum Toxicity Values 1,670 2,510 2,070 2,490
Notes: all data reported on a dry weight basis all data reported as nominal concentrations
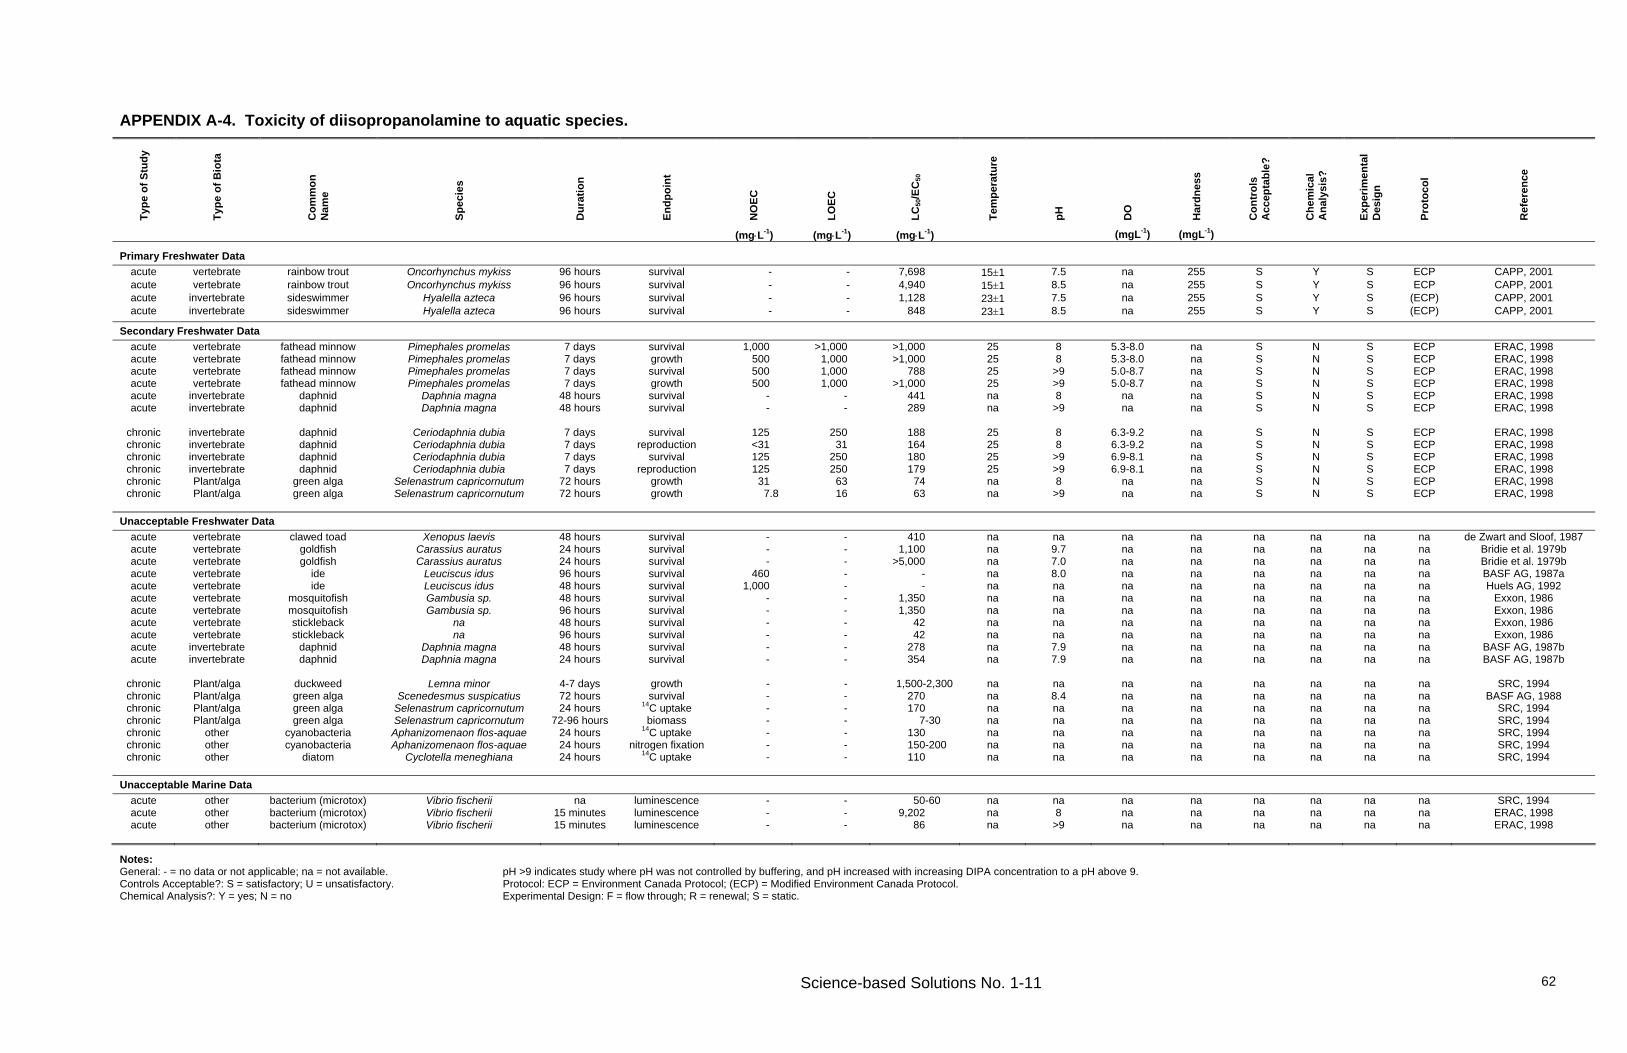
Science-based Solutions No. 1-11
62
APPENDIX A-4. Toxicity of diisopropanolamine to aquatic species. Ty
pe o
f Stu
dy
Type
of B
iota
Com
mon
N
ame
Spec
ies
Dur
atio
n
Endp
oint
NO
EC
LOEC
LC50
/EC
50
Tem
pera
ture
pH
DO
Har
dnes
s
Con
trol
s A
ccep
tabl
e?
Che
mic
al
Ana
lysi
s?
Expe
rimen
tal
Des
ign
Prot
ocol
Ref
eren
ce
(mg⋅L-1) (mg⋅L-1) (mg⋅L-1) (mgL-1) (mgL-1)
Primary Freshwater Data acute vertebrate rainbow trout Oncorhynchus mykiss 96 hours survival - - 7,698 15±1 7.5 na 255 S Y S ECP CAPP, 2001 acute vertebrate rainbow trout Oncorhynchus mykiss 96 hours survival - - 4,940 15±1 8.5 na 255 S Y S ECP CAPP, 2001 acute invertebrate sideswimmer Hyalella azteca 96 hours survival - - 1,128 23±1 7.5 na 255 S Y S (ECP) CAPP, 2001 acute invertebrate sideswimmer Hyalella azteca 96 hours survival - - 848 23±1 8.5 na 255 S Y S (ECP) CAPP, 2001
Secondary Freshwater Data acute vertebrate fathead minnow Pimephales promelas 7 days survival 1,000 >1,000 >1,000 25 8 5.3-8.0 na S N S ECP ERAC, 1998 acute vertebrate fathead minnow Pimephales promelas 7 days growth 500 1,000 >1,000 25 8 5.3-8.0 na S N S ECP ERAC, 1998 acute vertebrate fathead minnow Pimephales promelas 7 days survival 500 1,000 788 25 >9 5.0-8.7 na S N S ECP ERAC, 1998 acute vertebrate fathead minnow Pimephales promelas 7 days growth 500 1,000 >1,000 25 >9 5.0-8.7 na S N S ECP ERAC, 1998 acute invertebrate daphnid Daphnia magna 48 hours survival - - 441 na 8 na na S N S ECP ERAC, 1998 acute invertebrate daphnid Daphnia magna 48 hours survival - - 289 na >9 na na S N S ECP ERAC, 1998
chronic invertebrate daphnid Ceriodaphnia dubia 7 days survival 125 250 188 25 8 6.3-9.2 na S N S ECP ERAC, 1998 chronic invertebrate daphnid Ceriodaphnia dubia 7 days reproduction <31 31 164 25 8 6.3-9.2 na S N S ECP ERAC, 1998 chronic invertebrate daphnid Ceriodaphnia dubia 7 days survival 125 250 180 25 >9 6.9-8.1 na S N S ECP ERAC, 1998 chronic invertebrate daphnid Ceriodaphnia dubia 7 days reproduction 125 250 179 25 >9 6.9-8.1 na S N S ECP ERAC, 1998 chronic Plant/alga green alga Selenastrum capricornutum 72 hours growth 31 63 74 na 8 na na S N S ECP ERAC, 1998 chronic Plant/alga green alga Selenastrum capricornutum 72 hours growth 7.8 16 63 na >9 na na S N S ECP ERAC, 1998
Unacceptable Freshwater Data
acute vertebrate clawed toad Xenopus laevis 48 hours survival - - 410 na na na na na na na na de Zwart and Sloof, 1987 acute vertebrate goldfish Carassius auratus 24 hours survival - - 1,100 na 9.7 na na na na na na Bridie et al. 1979b acute vertebrate goldfish Carassius auratus 24 hours survival - - >5,000 na 7.0 na na na na na na Bridie et al. 1979b acute vertebrate ide Leuciscus idus 96 hours survival 460 - - na 8.0 na na na na na na BASF AG, 1987a acute vertebrate ide Leuciscus idus 48 hours survival 1,000 - - na na na na na na na na Huels AG, 1992 acute vertebrate mosquitofish Gambusia sp. 48 hours survival - - 1,350 na na na na na na na na Exxon, 1986 acute vertebrate mosquitofish Gambusia sp. 96 hours survival - - 1,350 na na na na na na na na Exxon, 1986 acute vertebrate stickleback na 48 hours survival - - 42 na na na na na na na na Exxon, 1986 acute vertebrate stickleback na 96 hours survival - - 42 na na na na na na na na Exxon, 1986 acute invertebrate daphnid Daphnia magna 48 hours survival - - 278 na 7.9 na na na na na na BASF AG, 1987b acute invertebrate daphnid Daphnia magna 24 hours survival - - 354 na 7.9 na na na na na na BASF AG, 1987b
chronic Plant/alga duckweed Lemna minor 4-7 days growth - - 1,500-2,300 na na na na na na na na SRC, 1994 chronic Plant/alga green alga Scenedesmus suspicatius 72 hours survival - - 270 na 8.4 na na na na na na BASF AG, 1988 chronic Plant/alga green alga Selenastrum capricornutum 24 hours 14C uptake - - 170 na na na na na na na na SRC, 1994 chronic Plant/alga green alga Selenastrum capricornutum 72-96 hours biomass - - 7-30 na na na na na na na na SRC, 1994 chronic other cyanobacteria Aphanizomenaon flos-aquae 24 hours 14C uptake - - 130 na na na na na na na na SRC, 1994 chronic other cyanobacteria Aphanizomenaon flos-aquae 24 hours nitrogen fixation - - 150-200 na na na na na na na na SRC, 1994 chronic other diatom Cyclotella meneghiana 24 hours 14C uptake - - 110 na na na na na na na na SRC, 1994
Unacceptable Marine Data
acute other bacterium (microtox) Vibrio fischerii na luminescence - - 50-60 na na na na na na na na SRC, 1994 acute other bacterium (microtox) Vibrio fischerii 15 minutes luminescence - - 9,202 na 8 na na na na na na ERAC, 1998 acute other bacterium (microtox) Vibrio fischerii 15 minutes luminescence - - 86 na >9 na na na na na na ERAC, 1998
Notes: General: - = no data or not applicable; na = not available. pH >9 indicates study where pH was not controlled by buffering, and pH increased with increasing DIPA concentration to a pH above 9. Controls Acceptable?: S = satisfactory; U = unsatisfactory. Protocol: ECP = Environment Canada Protocol; (ECP) = Modified Environment Canada Protocol. Chemical Analysis?: Y = yes; N = no Experimental Design: F = flow through; R = renewal; S = static.
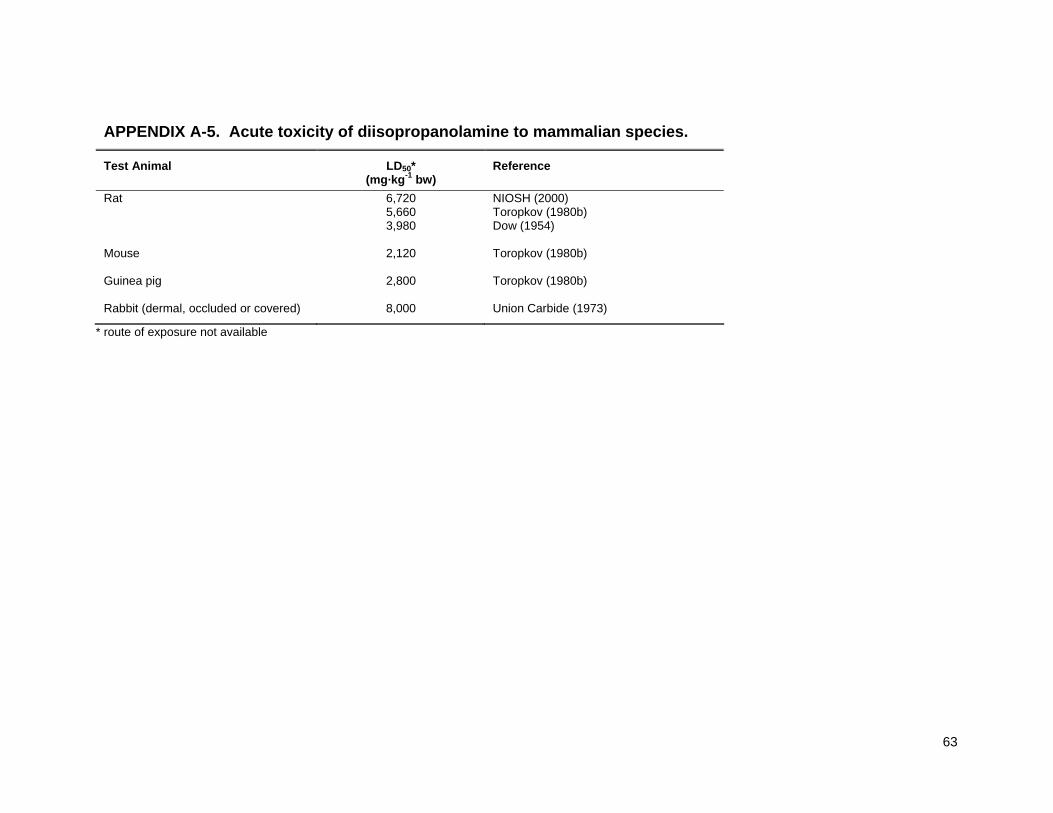
APPENDIX A-5. Acute toxicity of diisopropanolamine to mammalian species.
LD50* (mg·kg-1 bw)
Reference Test Animal
Rat 6,720 NIOSH (2000) 5,660 Toropkov (1980b) 3,980 Dow (1954) Mouse 2,120 Toropkov (1980b) Guinea pig 2,800 Toropkov (1980b) Rabbit (dermal, occluded or covered) 8,000 Union Carbide (1973)
* route of exposure not available
63
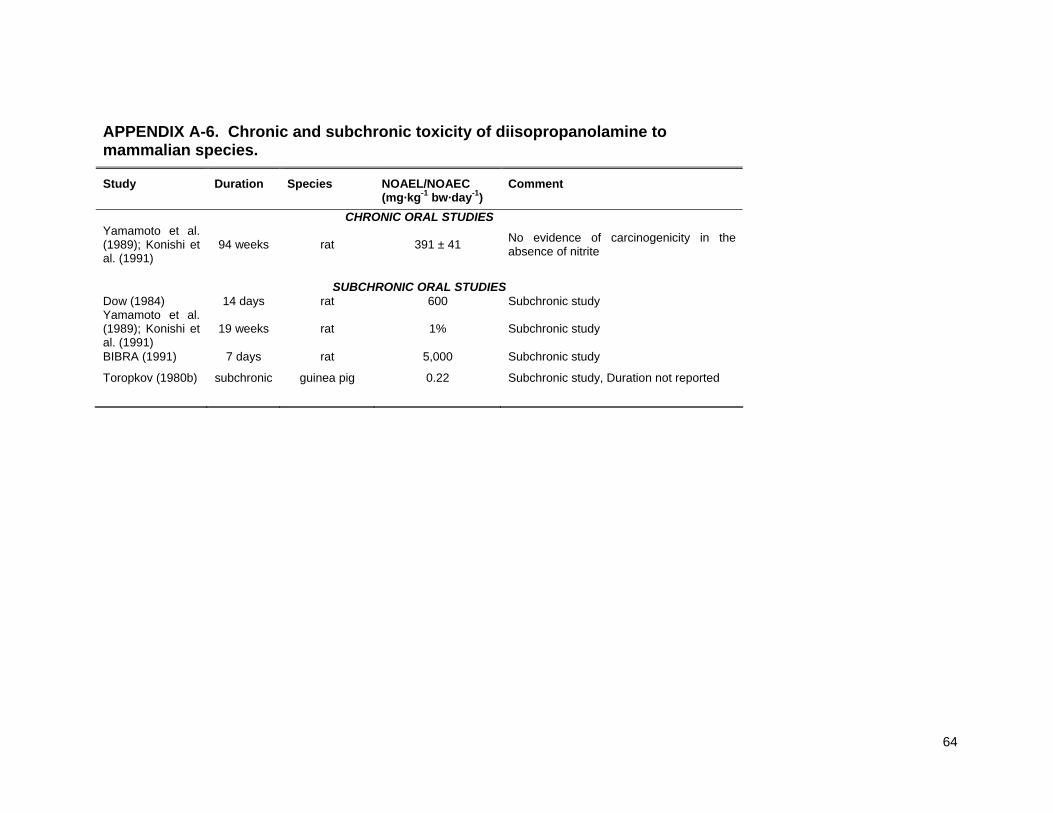
APPENDIX A-6. Chronic and subchronic toxicity of diisopropanolamine to mammalian species.
Study Duration Species NOAEL/NOAEC (mg·kg-1 bw·day-1)
Comment
CHRONIC ORAL STUDIES Yamamoto et al. (1989); Konishi et al. (1991)
94 weeks rat 391 ± 41 No evidence of carcinogenicity in the absence of nitrite
SUBCHRONIC ORAL STUDIES
Dow (1984) 14 days rat 600 Subchronic study Yamamoto et al. (1989); Konishi et al. (1991)
19 weeks rat 1% Subchronic study
BIBRA (1991) 7 days rat 5,000 Subchronic study
Toropkov (1980b) subchronic guinea pig 0.22 Subchronic study, Duration not reported
64
APPENDIX B-1. CORRECTION OF TOXICITY DATA TO REFLECT ANALYTICALLY MEASURED CONCENTRATIONS Introduction Plant and soil invertebrate toxicity tests for DIPA were reported in CAPP (2001). No chemical analyses were performed in those tests, and test results were presented in terms of nominal concentrations expressed on a dry weight basis. Concerns were raised that nominal concentrations of DIPA in soil might not be representative of the concentrations that would have been measured analytically at the start of the test. Possible reasons for this difference would include any biodegradation that might have occurred between the time that the DIPA was introduced to the soil and the time the organisms were introduced, and also the possibility that the analytical extraction methodology did not recover 100% of the DIPA from the soil. Accordingly an experimental program was initiated to spike soils with DIPA and to submit the soils for analysis 24 hours later, to allow a correction of the toxicity data, and hence the resulting guideline values, for any losses of DIPA. Definition of Nominal and Analytical Concentrations Throughout this Appendix, the concentration of a solution or a soil that is calculated from measured volumes and/or masses of DIPA, water and/or soil is referred to as the “Nominal Concentration”. The concentration of a solution or a soil that is determined by chemical analysis is referred to as the “Analytically Measured Concentration”. This Appendix describes the methodology used to determine the Analytical Recovery, and the methodology used to correct the toxicity data to reflect analytically measured concentrations. Soil Type The scope of the Analytical Mearsurement project was limited to one soil type. A till soil similar to the one used in the toxicity tests reported in CAPP (2001) was selected as a surrogate for all soils. Biodegradation was expected to be similar for all four soil types used in the CAPP (2001) work, since none of them would have microbes that were already acclimated to DIPA. Preparation of Spiked Soils Spiked soils were prepared according to the following steps which mimic the procedure used to prepare the soils in the CAPP (2001) toxicity tests: 1.5 kg of soil was prepared by drying overnight at 30°C, and sieving to 5 mm. 8 test units were prepared by measuring ~60 g dry weight of soil into 100 mm x 15 mm Petri dishes.
The exact mass of soil added to each unit was recorded. 100 ml of ~90,000 mg⋅L-1 stock DIPA solution was prepared by weighing ~9.0 g of DIPA into a
beaker, transferring to a volumetric flask, sequentially rinsing the beaker into the volumetric flask and diluting to the mark with deionized water. The exact mass of DIPA added was recorded, and the Nominal Concentration calculated.
40 ml of the stock solution was placed in a second volumetric flask, and diluted to 100 ml by adding deionized water. Two further sequential dilutions were carried out to create a dilution series of 100%, 40%, 16%, and 6.4% of the stock solution.
For each solution, 15 ml was added to each of two duplicate test units (randomly selected from the 8 prepared previously) and mixed by hand until uniform colour and moisture were achieved (approximately 3 minutes). Test units were covered and allowed to equilibrate at room temperature for 24 hours.
At the end of the 24 hour period, each pair of duplicate test units was composited by mixing by hand, and submitted to Maxxam Analytics Inc. in Calgary for DIPA analysis.
Analytical Results Analytical results for the stock solution and the spiked soils are summarized in Tables I-1 and I-2, respectively, and compared with the Nominal Concentrations calculated for each sample.
65
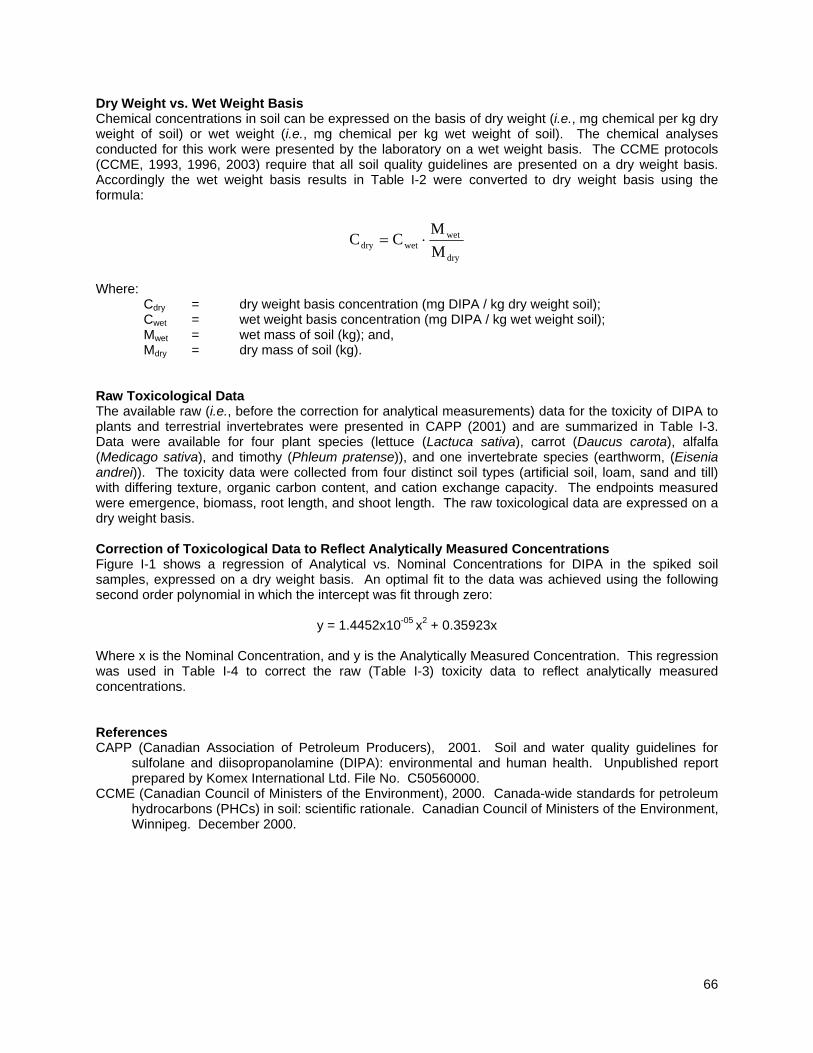
Dry Weight vs. Wet Weight Basis Chemical concentrations in soil can be expressed on the basis of dry weight (i.e., mg chemical per kg dry weight of soil) or wet weight (i.e., mg chemical per kg wet weight of soil). The chemical analyses conducted for this work were presented by the laboratory on a wet weight basis. The CCME protocols (CCME, 1993, 1996, 2003) require that all soil quality guidelines are presented on a dry weight basis. Accordingly the wet weight basis results in Table I-2 were converted to dry weight basis using the formula:
dry
wetwetdry M
MCC ⋅=
Where: Cdry = dry weight basis concentration (mg DIPA / kg dry weight soil); Cwet = wet weight basis concentration (mg DIPA / kg wet weight soil); Mwet = wet mass of soil (kg); and, Mdry = dry mass of soil (kg). Raw Toxicological Data The available raw (i.e., before the correction for analytical measurements) data for the toxicity of DIPA to plants and terrestrial invertebrates were presented in CAPP (2001) and are summarized in Table I-3. Data were available for four plant species (lettuce (Lactuca sativa), carrot (Daucus carota), alfalfa (Medicago sativa), and timothy (Phleum pratense)), and one invertebrate species (earthworm, (Eisenia andrei)). The toxicity data were collected from four distinct soil types (artificial soil, loam, sand and till) with differing texture, organic carbon content, and cation exchange capacity. The endpoints measured were emergence, biomass, root length, and shoot length. The raw toxicological data are expressed on a dry weight basis. Correction of Toxicological Data to Reflect Analytically Measured Concentrations Figure I-1 shows a regression of Analytical vs. Nominal Concentrations for DIPA in the spiked soil samples, expressed on a dry weight basis. An optimal fit to the data was achieved using the following second order polynomial in which the intercept was fit through zero:
y = 1.4452x10-05 x2 + 0.35923x Where x is the Nominal Concentration, and y is the Analytically Measured Concentration. This regression was used in Table I-4 to correct the raw (Table I-3) toxicity data to reflect analytically measured concentrations. References CAPP (Canadian Association of Petroleum Producers), 2001. Soil and water quality guidelines for
sulfolane and diisopropanolamine (DIPA): environmental and human health. Unpublished report prepared by Komex International Ltd. File No. C50560000.
CCME (Canadian Council of Ministers of the Environment), 2000. Canada-wide standards for petroleum hydrocarbons (PHCs) in soil: scientific rationale. Canadian Council of Ministers of the Environment, Winnipeg. December 2000.
66
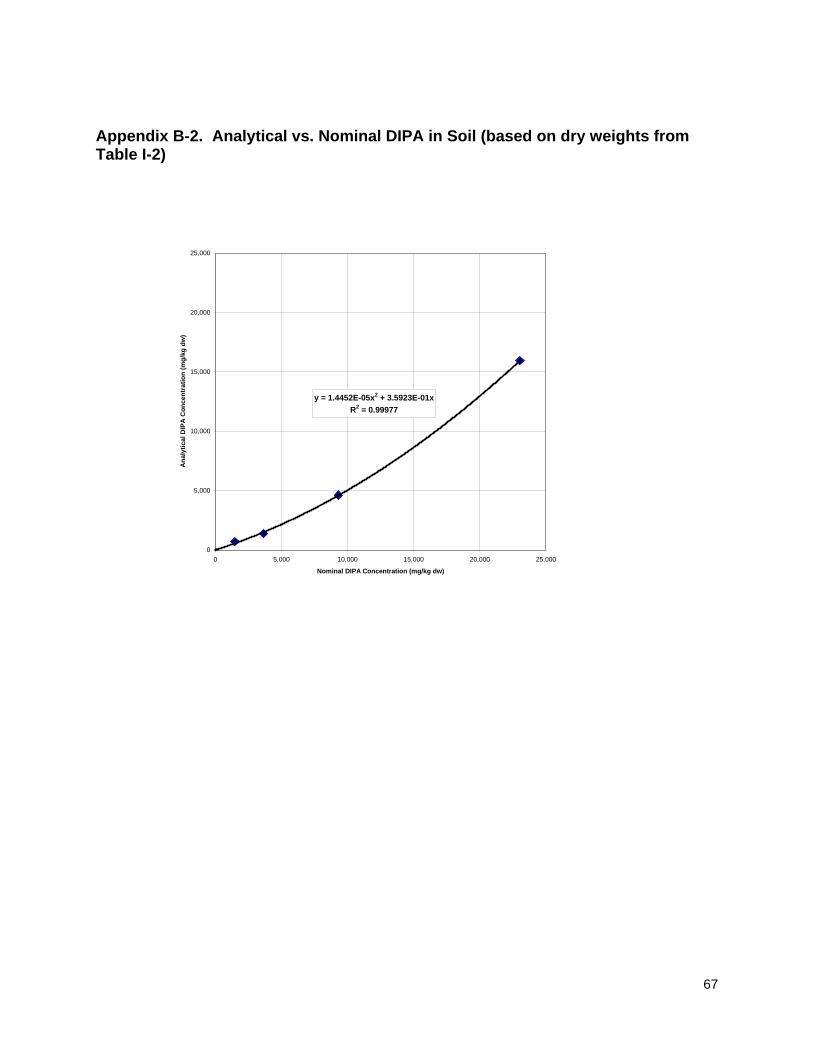
Appendix B-2. Analytical vs. Nominal DIPA in Soil (based on dry weights from Table I-2)
y = 1.4452E-05x2 + 3.5923E-01xR2 = 0.99977
0
5,000
10,000
15,000
20,000
25,000
0 5,000 10,000 15,000 20,000 25,000
Nominal DIPA Concentration (mg/kg dw)
Ana
lytic
al D
IPA
Con
cent
ratio
n (m
g/kg
dw
)
67
Appendix B-3. Nominal and Analytical Concentrations in Solutions
Nominal Values Based on Volumetric Calculations
Solution IDMass of DIPA in
100 mlMass of DIPA in
15 mlNominal
Concentration Analytical
Concentration(mg) (mg) (mg/L) (mg/L)
DIPA Stock D1 9,289.4 1,393.41 92,894 74,000DIPA 1st Dilution - 40% of D1 D2 3,715.8 557.36 37,158DIPA 2nd Dilution - 40% of D2 D3 1,486.3 222.95 14,863DIPA 3rd Dilution - 40% of D3 D4 594.5 89.18 5,945
68
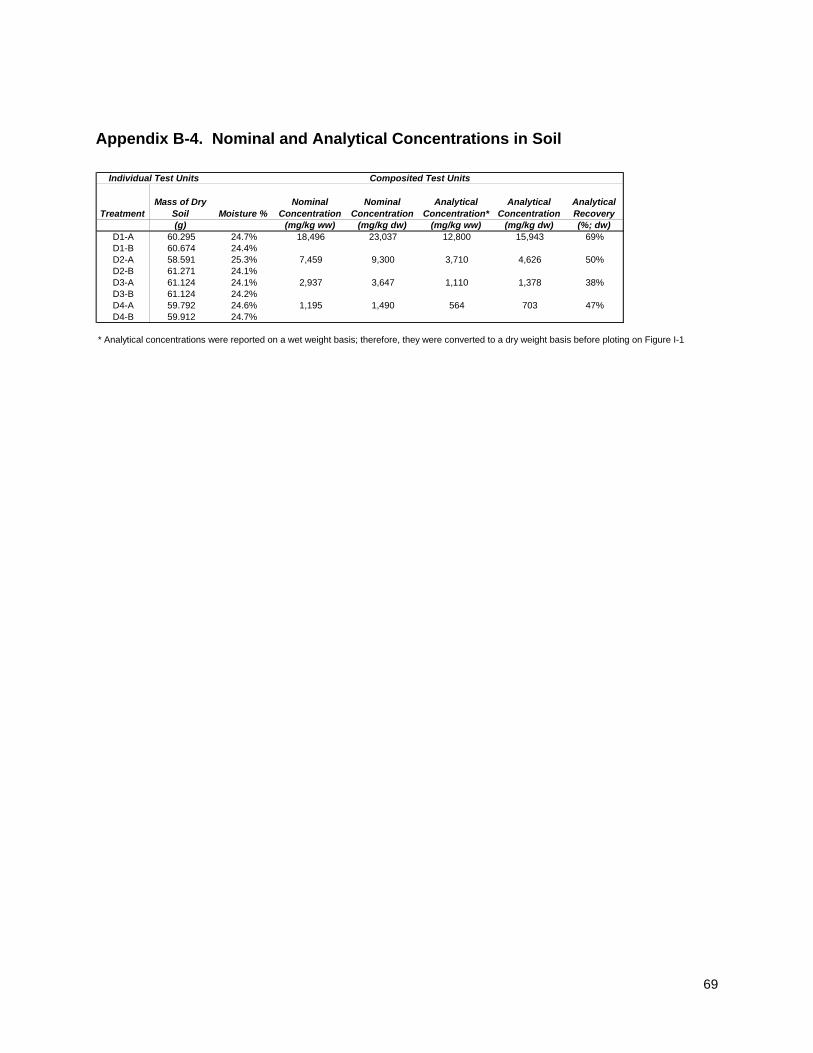
Appendix B-4. Nominal and Analytical Concentrations in Soil
Individual Test Units Composited Test Units
TreatmentMass of Dry
Soil Moisture %Nominal
Concentration Nominal
Concentration Analytical
Concentration*Analytical
ConcentrationAnalytical Recovery
(g) (mg/kg ww) (mg/kg dw) (mg/kg ww) (mg/kg dw) (%; dw)D1-A 60.295 24.7% 18,496 23,037 12,800 15,943 69%D1-B 60.674 24.4%D2-A 58.591 25.3% 7,459 9,300 3,710 4,626 50%D2-B 61.271 24.1%D3-A 61.124 24.1% 2,937 3,647 1,110 1,378 38%D3-B 61.124 24.2%D4-A 59.792 24.6% 1,195 1,490 564 703 47%D4-B 59.912 24.7%
* Analytical concentrations were reported on a wet weight basis; therefore, they were converted to a dry weight basis before ploting on Figure I-1
69
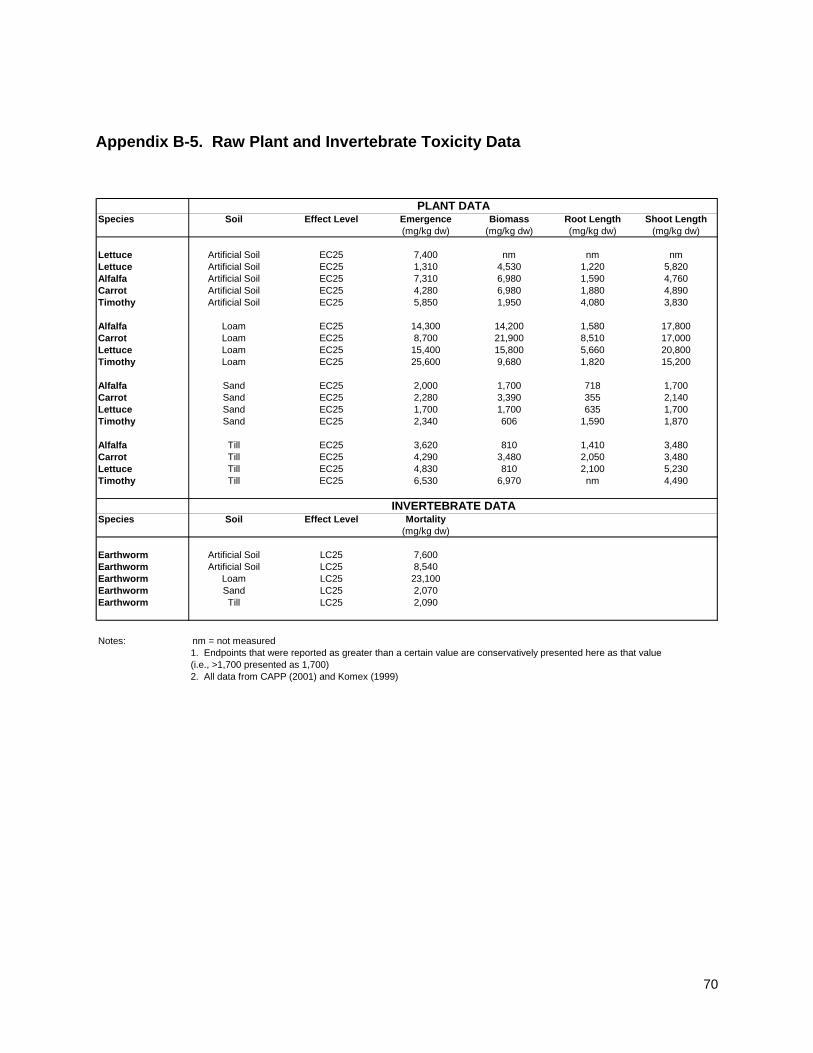
Appendix B-5. Raw Plant and Invertebrate Toxicity Data
PLANT DATASpecies Soil Effect Level Emergence Biomass Root Length Shoot Length
(mg/kg dw) (mg/kg dw) (mg/kg dw) (mg/kg dw)
Lettuce Artificial Soil EC25 7,400 nm nm nmLettuce Artificial Soil EC25 1,310 4,530 1,220 5,820Alfalfa Artificial Soil EC25 7,310 6,980 1,590 4,760Carrot Artificial Soil EC25 4,280 6,980 1,880 4,890Timothy Artificial Soil EC25 5,850 1,950 4,080 3,830
Alfalfa Loam EC25 14,300 14,200 1,580 17,800Carrot Loam EC25 8,700 21,900 8,510 17,000Lettuce Loam EC25 15,400 15,800 5,660 20,800Timothy Loam EC25 25,600 9,680 1,820 15,200
Alfalfa Sand EC25 2,000 1,700 718 1,700Carrot Sand EC25 2,280 3,390 355 2,140Lettuce Sand EC25 1,700 1,700 635 1,700Timothy Sand EC25 2,340 606 1,590 1,870
Alfalfa Till EC25 3,620 810 1,410 3,480Carrot Till EC25 4,290 3,480 2,050 3,480Lettuce Till EC25 4,830 810 2,100 5,230Timothy Till EC25 6,530 6,970 nm 4,490
INVERTEBRATE DATASpecies Soil Effect Level Mortality
(mg/kg dw)
Earthworm Artificial Soil LC25 7,600Earthworm Artificial Soil LC25 8,540Earthworm Loam LC25 23,100Earthworm Sand LC25 2,070Earthworm Till LC25 2,090
Notes: nm = not measured1. Endpoints that were reported as greater than a certain value are conservatively presented here as that value (i.e., >1,700 presented as 1,700)2. All data from CAPP (2001) and Komex (1999)
70
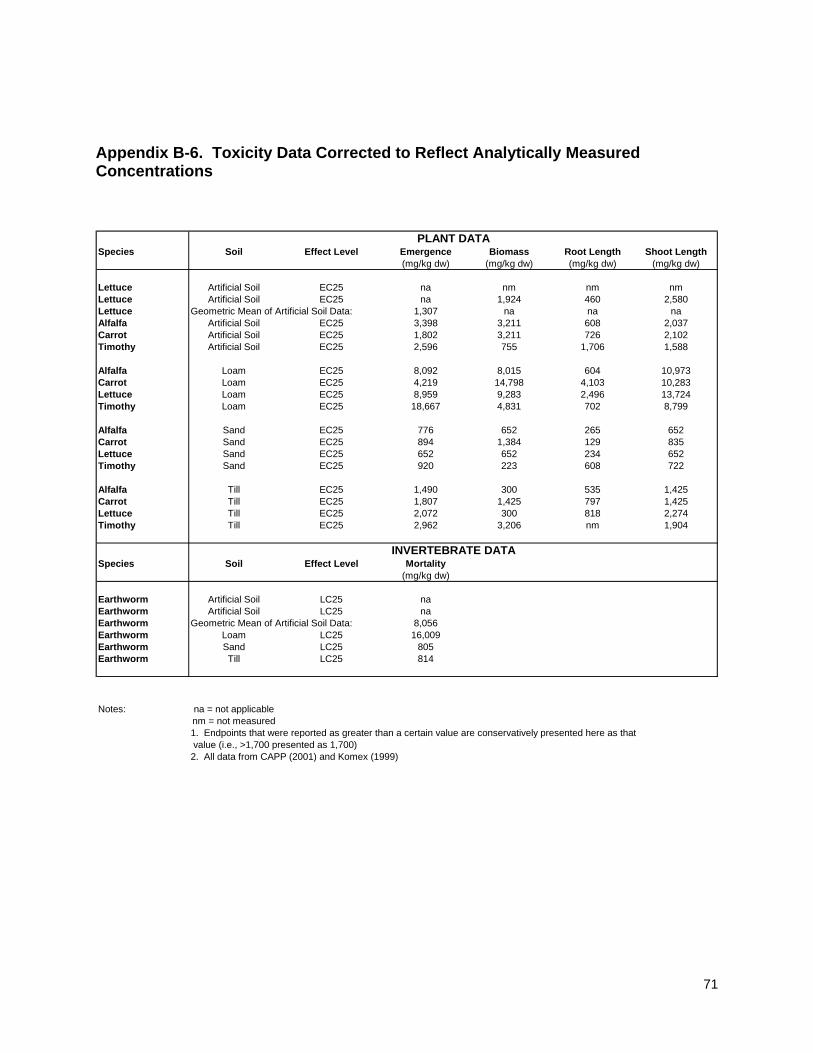
Appendix B-6. Toxicity Data Corrected to Reflect Analytically Measured Concentrations
PLANT DATASpecies Soil Effect Level Emergence Biomass Root Length Shoot Length
(mg/kg dw) (mg/kg dw) (mg/kg dw) (mg/kg dw)
Lettuce Artificial Soil EC25 na nm nm nmLettuce Artificial Soil EC25 na 1,924 460 2,580Lettuce Geometric Mean of Artificial Soil Data: 1,307 na na naAlfalfa Artificial Soil EC25 3,398 3,211 608 2,037Carrot Artificial Soil EC25 1,802 3,211 726 2,102Timothy Artificial Soil EC25 2,596 755 1,706 1,588
Alfalfa Loam EC25 8,092 8,015 604 10,973Carrot Loam EC25 4,219 14,798 4,103 10,283Lettuce Loam EC25 8,959 9,283 2,496 13,724Timothy Loam EC25 18,667 4,831 702 8,799
Alfalfa Sand EC25 776 652 265 652Carrot Sand EC25 894 1,384 129 835Lettuce Sand EC25 652 652 234 652Timothy Sand EC25 920 223 608 722
Alfalfa Till EC25 1,490 300 535 1,425Carrot Till EC25 1,807 1,425 797 1,425Lettuce Till EC25 2,072 300 818 2,274Timothy Till EC25 2,962 3,206 nm 1,904
INVERTEBRATE DATASpecies Soil Effect Level Mortality
(mg/kg dw)
Earthworm Artificial Soil LC25 naEarthworm Artificial Soil LC25 naEarthworm Geometric Mean of Artificial Soil Data: 8,056Earthworm Loam LC25 16,009Earthworm Sand LC25 805Earthworm Till LC25 814
Notes: na = not applicablenm = not measured1. Endpoints that were reported as greater than a certain value are conservatively presented here as that value (i.e., >1,700 presented as 1,700)2. All data from CAPP (2001) and Komex (1999)
71
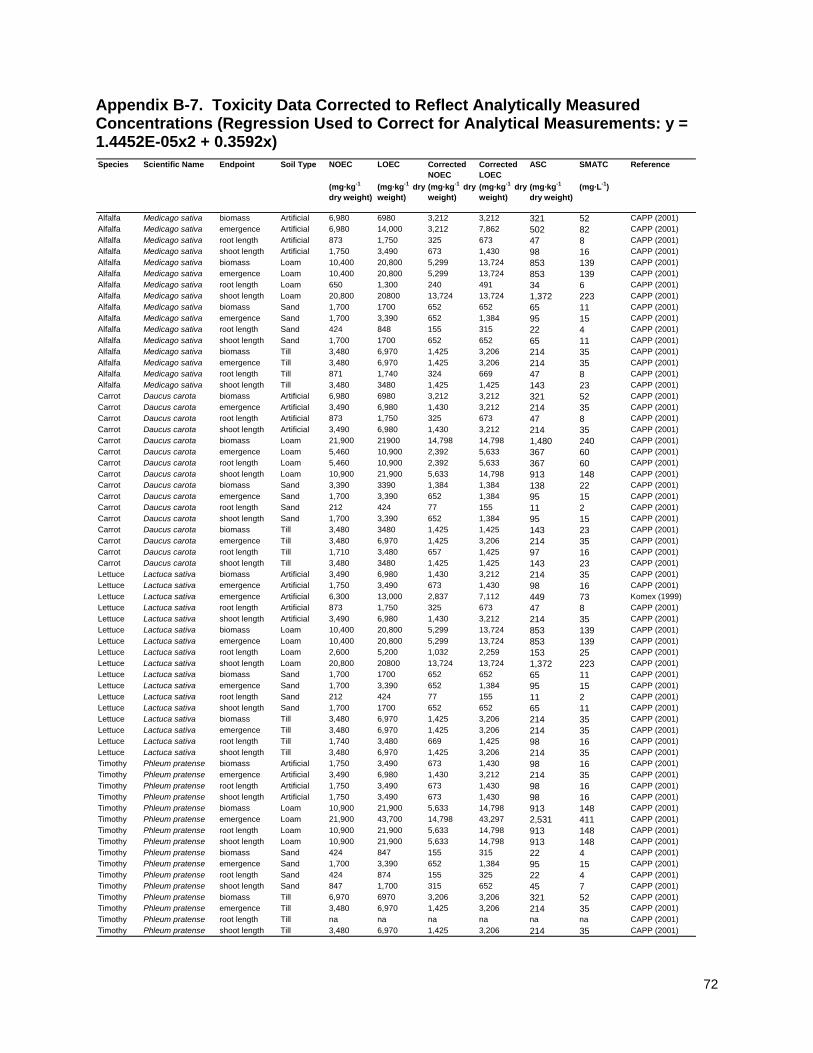
Appendix B-7. Toxicity Data Corrected to Reflect Analytically Measured Concentrations (Regression Used to Correct for Analytical Measurements: y = 1.4452E-05x2 + 0.3592x)
NOEC LOEC Corrected NOEC
Corrected LOEC
ASC SMATC
(mg·kg-1
dry weight)(mg·kg-1 dry weight)
(mg·kg-1 dry weight)
(mg·kg-1 dry weight)
(mg·kg-1
dry weight)(mg·L-1)
Alfalfa Medicago sativa biomass Artificial 6,980 6980 3,212 3,212 321 52 CAPP (2001)Alfalfa Medicago sativa emergence Artificial 6,980 14,000 3,212 7,862 502 82 CAPP (2001)Alfalfa Medicago sativa root length Artificial 873 1,750 325 673 47 8 CAPP (2001)Alfalfa Medicago sativa shoot length Artificial 1,750 3,490 673 1,430 98 16 CAPP (2001)Alfalfa Medicago sativa biomass Loam 10,400 20,800 5,299 13,724 853 139 CAPP (2001)Alfalfa Medicago sativa emergence Loam 10,400 20,800 5,299 13,724 853 139 CAPP (2001)Alfalfa Medicago sativa root length Loam 650 1,300 240 491 34 6 CAPP (2001)Alfalfa Medicago sativa shoot length Loam 20,800 20800 13,724 13,724 1,372 223 CAPP (2001)Alfalfa Medicago sativa biomass Sand 1,700 1700 652 652 65 11 CAPP (2001)Alfalfa Medicago sativa emergence Sand 1,700 3,390 652 1,384 95 15 CAPP (2001)Alfalfa Medicago sativa root length Sand 424 848 155 315 22 4 CAPP (2001)Alfalfa Medicago sativa shoot length Sand 1,700 1700 652 652 65 11 CAPP (2001)Alfalfa Medicago sativa biomass Till 3,480 6,970 1,425 3,206 214 35 CAPP (2001)Alfalfa Medicago sativa emergence Till 3,480 6,970 1,425 3,206 214 35 CAPP (2001)Alfalfa Medicago sativa root length Till 871 1,740 324 669 47 8 CAPP (2001)Alfalfa Medicago sativa shoot length Till 3,480 3480 1,425 1,425 143 23 CAPP (2001)Carrot Daucus carota biomass Artificial 6,980 6980 3,212 3,212 321 52 CAPP (2001)Carrot Daucus carota emergence Artificial 3,490 6,980 1,430 3,212 214 35 CAPP (2001)Carrot Daucus carota root length Artificial 873 1,750 325 673 47 8 CAPP (2001)Carrot Daucus carota shoot length Artificial 3,490 6,980 1,430 3,212 214 35 CAPP (2001)Carrot Daucus carota biomass Loam 21,900 21900 14,798 14,798 1,480 240 CAPP (2001)Carrot Daucus carota emergence Loam 5,460 10,900 2,392 5,633 367 60 CAPP (2001)Carrot Daucus carota root length Loam 5,460 10,900 2,392 5,633 367 60 CAPP (2001)Carrot Daucus carota shoot length Loam 10,900 21,900 5,633 14,798 913 148 CAPP (2001)Carrot Daucus carota biomass Sand 3,390 3390 1,384 1,384 138 22 CAPP (2001)Carrot Daucus carota emergence Sand 1,700 3,390 652 1,384 95 15 CAPP (2001)Carrot Daucus carota root length Sand 212 424 77 155 11 2 CAPP (2001)Carrot Daucus carota shoot length Sand 1,700 3,390 652 1,384 95 15 CAPP (2001)Carrot Daucus carota biomass Till 3,480 3480 1,425 1,425 143 23 CAPP (2001)Carrot Daucus carota emergence Till 3,480 6,970 1,425 3,206 214 35 CAPP (2001)Carrot Daucus carota root length Till 1,710 3,480 657 1,425 97 16 CAPP (2001)Carrot Daucus carota shoot length Till 3,480 3480 1,425 1,425 143 23 CAPP (2001)Lettuce Lactuca sativa biomass Artificial 3,490 6,980 1,430 3,212 214 35 CAPP (2001)Lettuce Lactuca sativa emergence Artificial 1,750 3,490 673 1,430 98 16 CAPP (2001)Lettuce Lactuca sativa emergence Artificial 6,300 13,000 2,837 7,112 449 73 Komex (1999)Lettuce Lactuca sativa root length Artificial 873 1,750 325 673 47 8 CAPP (2001)Lettuce Lactuca sativa shoot length Artificial 3,490 6,980 1,430 3,212 214 35 CAPP (2001)Lettuce Lactuca sativa biomass Loam 10,400 20,800 5,299 13,724 853 139 CAPP (2001)Lettuce Lactuca sativa emergence Loam 10,400 20,800 5,299 13,724 853 139 CAPP (2001)Lettuce Lactuca sativa root length Loam 2,600 5,200 1,032 2,259 153 25 CAPP (2001)Lettuce Lactuca sativa shoot length Loam 20,800 20800 13,724 13,724 1,372 223 CAPP (2001)Lettuce Lactuca sativa biomass Sand 1,700 1700 652 652 65 11 CAPP (2001)Lettuce Lactuca sativa emergence Sand 1,700 3,390 652 1,384 95 15 CAPP (2001)Lettuce Lactuca sativa root length Sand 212 424 77 155 11 2 CAPP (2001)Lettuce Lactuca sativa shoot length Sand 1,700 1700 652 652 65 11 CAPP (2001)Lettuce Lactuca sativa biomass Till 3,480 6,970 1,425 3,206 214 35 CAPP (2001)Lettuce Lactuca sativa emergence Till 3,480 6,970 1,425 3,206 214 35 CAPP (2001)Lettuce Lactuca sativa root length Till 1,740 3,480 669 1,425 98 16 CAPP (2001)Lettuce Lactuca sativa shoot length Till 3,480 6,970 1,425 3,206 214 35 CAPP (2001)Timothy Phleum pratense biomass Artificial 1,750 3,490 673 1,430 98 16 CAPP (2001)Timothy Phleum pratense emergence Artificial 3,490 6,980 1,430 3,212 214 35 CAPP (2001)Timothy Phleum pratense root length Artificial 1,750 3,490 673 1,430 98 16 CAPP (2001)Timothy Phleum pratense shoot length Artificial 1,750 3,490 673 1,430 98 16 CAPP (2001)Timothy Phleum pratense biomass Loam 10,900 21,900 5,633 14,798 913 148 CAPP (2001)Timothy Phleum pratense emergence Loam 21,900 43,700 14,798 43,297 2,531 411 CAPP (2001)Timothy Phleum pratense root length Loam 10,900 21,900 5,633 14,798 913 148 CAPP (2001)Timothy Phleum pratense shoot length Loam 10,900 21,900 5,633 14,798 913 148 CAPP (2001)Timothy Phleum pratense biomass Sand 424 847 155 315 22 4 CAPP (2001)Timothy Phleum pratense emergence Sand 1,700 3,390 652 1,384 95 15 CAPP (2001)Timothy Phleum pratense root length Sand 424 874 155 325 22 4 CAPP (2001)Timothy Phleum pratense shoot length Sand 847 1,700 315 652 45 7 CAPP (2001)Timothy Phleum pratense biomass Till 6,970 6970 3,206 3,206 321 52 CAPP (2001)Timothy Phleum pratense emergence Till 3,480 6,970 1,425 3,206 214 35 CAPP (2001)Timothy Phleum pratense root length Till na na na na na na CAPP (2001)Timothy Phleum pratense shoot length Till 3,480 6,970 1,425 3,206 214 35 CAPP (2001)
ReferenceSpecies Scientific Name Endpoint Soil Type
72