Embed Size (px)
Citation preview

Subdued performance for the Canadian Mining Eye in Q3 2016 A Q&A with Rick Howes,
President & CEO Dundee Precious Metals page 3
Canadian Mining EyeQ3 2016
The Canadian Mining Eye index gained 4% during Q3 2016, compared with a 42% gain in Q2 2016. The Canadian Mining Eye index modestly underperformed the S&P/TSX Composite index, which gained 5% during Q3 2016. The UK Mining Eye gained 30% during Q3 2016, with commodity equities benefiting from substantial depreciation of the pound versus the US dollar. The London Metal Exchange index (LMEX) gained 4% over the quarter. The S&P/TSX Composite Metals and Mining index declined 3% in Q3 2016, following gains of 40% in Q2 2016. The Canadian Mining Eye index’s gain was predominantly due to an increase in base metal prices, including nickel and zinc. After witnessing an increase in the past two consecutive quarters, including 29% in Q2 2016 and 21% in Q1 2016, majors
retracted by 3% in Q3 2016, signalling a pause in the index during the quarter.
Following the strong Q1 2016 operating performance by a majority of mining companies, the Q2 2016 earnings continue to be accentuated by higher production, lower all-in sustaining costs (AISC) and improved free cash flow generation. As an emerging trend, mining companies are seeking to embrace digital technologies to improve productivity and hence reduce costs through insights driven by big data and analytics, and enhanced integration. Recently, Barrick Gold Corporation and Cisco Systems Inc. announced that they have partnered as Barrick seeks to automate its equipment and use advanced sensing technology and real-time operational data for better decision-making capabilities.

2 | Canadian Mining Eye Q3 2016
200
250
300
350
400
450
500
550
600
650
Apr 15
May 15
Jun 15
Jul 14
Aug 14
Sep 14
Oct 14
Nov 14
Dec 14
Jan 15
Feb 1
5
Mar 15
Inde
x va
lue
Canadian Mining Eye index and peers, last 12 months
Source: EY, Thomson Datastream
Canadian Mining Eye UK Mining Eye (rebased)
FTSE All Share Mining (rebased) S&P/TSX Composite Metals & Mining (rebased)
S&P/ASX 300 Metals & Mining (rebased)
As such, Barrick anticipates AISC to track below US$700 per ounce by 2019 from an anticipated US$750-$790 per ounce range in 2016.1
• Gold2: Gold prices were flat in Q3 2016 compared with gains of 7% in Q2 2016 and 16% in Q1 2016. The weakness was in part due to an anticipated hike in US interest rates in November or December, as well as subdued investment in gold-linked funds.3 Despite the flat trend in the quarter, the underlying demand fundamentals remain intact for the gold sector underscored by healthy consumption trends in China, India and the US. Additionally, investors continue to view gold as a safe haven asset amid global macroeconomic challenges, coupled with the uncertainty after the recent US elections, despite a speed bump in early October.
• Base metals4: Copper prices were flat in Q3 2016 after declining by 1% in Q2 2016. Copper prices are expected to remain under pressure in 2016 due to over-supply, compounded by the advent of new mines in regions such as Mongolia and Peru. Contrastingly, both zinc and nickel prices rose in Q3 2016, increasing 13% and 12% respectively. Zinc prices are expected to gain in 2016 as it continues to operate in favorable supply deficit market conditions.
Inde
x va
lue
Canadian Mining Eye index and peers, last 12 months
Source: EY, Thomson Datastream
Canadian Mining Eye UK Mining Eye (rebased)
FTSE All Share Mining (rebased) S&P/TSX Composite Metals & Mining (rebased)
S&P/ASX 300 Metals & Mining (rebased)
-
180
230
280
330
380
430
480
530
580
630
680
730
780
Oct 15
Nov 15
Dec 15
Jan 16
Feb 1
6
Mar 16
Apr 16
May 16
Jun 16
Jul 16
Aug 16
Sep 16
Inde
x va
lue
Canadian Mining Eye index, gold, copper and LME Index over Q3 2016
Canadian Mining Eye LMEX Index (rebased) Gold (rebased) Copper (rebased)
Source: EY, Thomson Datastream
600
625
650
675
700
725
750
775
01 Jul 16
08 Jul 16
15 Jul 16
22 Jul 16
29 Jul 16
05 Aug
16
12 Aug
16
19 Aug
16
26 Aug
16
02 Sep 16
09 Sep 16
16 Sep 16
23 Sep 16
30 Sep 16
OutlookGoing forward, digitization in the mining space is expected to continue to gain traction in order to achieve improved productivity and efficient operations. The outlook for the Canadian mining industry remains positive underscored by investment in new and pending projects, supported in part by a rebound in the commodities market. However, the Canadian mining sector is expected to face labor shortages of around 127,000 workers due to a lack of recruitment activity in the past five years, according to Mining Industry Human Resources Council (MiHR).5
Inde
x va
lue
Canadian Mining Eye index, gold, copper and LME Index over Q3 2016
Canadian Mining Eye LMEX Index (rebased) Gold (rebased) Copper (rebased)
Source: EY, Thomson Datastream
600
625
650
675
700
725
750
775
01 Jul 16
08 Jul 16
15 Jul 16
22 Jul 16
29 Jul 16
05 Aug
16
12 Aug
16
19 Aug
16
26 Aug
16
02 Sep 16
09 Sep 16
16 Sep 16
23 Sep 16
30 Sep 16
1 “Barrick and Cisco Partner for the Digital Reinvention of Mining,” Press release, 12 September 2016.2 “CORO Mining Corp: Company Profile and SWOT Analysis,” Timetric, 15 September 2016.3 “Metal Matters,” Scotiabank, October 2016.4 “Commodity Price Forecasts,” Oxford Economics, September 2016. 5 “Canada’s mining industry faces workers shortage of up to 127,000,” Mining.com, 30 August 2016.

Canadian Mining Eye Q3 2016 | 3
Theophile Yameogo, EY’s Canadian Mining & Metals Advisory Services Leader, talked to Rick Howes about how the mining sector can embrace technology.
Following are the highlights of their conversation:
Q: What is your opinion about the state of the mining sector?
A: We’re at a crossroads in terms of opportunities in the mining industry. It’s similar to other industries in terms of disruptive change in the digital age. The cyclical nature of mining always drives a set of interesting behaviours. If you don’t time your business right it can cause a lot of pain, and I think that’s what we’ve just seen. We need to be more agile and flexible and able to respond to external factors more quickly, which should be possible if we rethink the way we go about designing, developing and operating our mines in this digital age of faster, smarter, better decision-making.
Q: In the market today, how is Dundee Precious Metals doing?
A: We’re doing well. We’re not a pure gold company so we’re a little more complicated than an average company our size. We have significant copper production and a tolling copper smelter, so those combinations are a bit unique. There are pros and cons to that. Diversification of your revenue stream is always the pro, but that’s subject to what the margins are in each of those businesses, so it can be a con as well. Our sense is that we’ll grow as a gold producer. It was never our plan to be a smelting business or a copper company, so our focus is now on growth in our gold production.
Q: How do you decide where to put your efforts when you have so many areas to focus on?
A: We took the time to rethink our strategy, which I think is very important. In our case, we wanted to leverage our strength around innovation to create a competitive advantage to be able to acquire and/or develop and put into production low cost gold operations. We think we have the ability to execute on that and, hopefully, generate better margins than our competitors could create for the same deposit.
Q&A with Rick Howes, President & CEO, Dundee Precious Metals

4 | Canadian Mining Eye Q3 2016
Q: Speaking of innovation, some of your peers talk about digital mining. Given that DPM is known for innovation and technology breakthroughs at Chelopech, how would you define digital mining?
A: It means a lot of different things to a lot of people. For me, the terms digital mining and digital age are a reflection of the fact that computing power and the world of digital are basically everywhere. Technology is advancing to the point that we can apply it to our operations without a significant amount of investment and has the potential to transform many aspects of our industry. That’s important to do because mining actually hasn’t reinvented itself much in the last 25 years. If you look at our underground mines today they look almost the same as they did when I joined the industry 36 years ago!
Q: Typically the major players are believed to have greater latitude in investing in innovation and technology. How did you switch the Chelopech success out of the traditional heavy investment needs?
A: I would argue that you can use a lot of off-the-shelf technology. You don’t have to reinvent everything. We did have to pioneer a few pieces of what we’ve done, but part of our strategy is to collaborate with strategic partnerships — and that minimizes the cost and the risks for us. I would say any mining company today, small or large, can move in this direction.
Q: In terms of practical strategies to drive digital mining successes, what’s your advice for the sector?
A: Having worked my way up from the floor level to CEO, I see that most underground mines today have significant upside opportunity to improve performance with little or no capital investment by eliminating the inefficiencies and waste in their processes and by sweating their assets harder. The digital technology offers the opportunity to create transparency and visibility into what goes on in the underground operation so that you identify and eliminate waste and inefficiency. Until now, almost all the information we’ve gathered as a sector has been human-provided and paper-based — and that means there’s an element of inaccuracy to it. Now, as we’re able to gather reliable data about our processes, we have a gift. It allows us to see what’s really happening, and we need to make sure we use that gift!
Q: Everyone knows everyone in this sector. How do you manage to create and sustain a competitive edge?
A: I think people believe there are more secrets out there than there really are. With the world of technology moving so fast, you might have an advantage with one technology today, but tomorrow it will be supplanted by a better one. It’s a short-held belief that you have a competitive advantage based on the technology you employ. To me, your competitive edge comes from your company’s ability to be agile and to adapt, adjust and make better decisions faster.
Q: Between Sudbury, where you spent a major part of your career, and Chelopech, where you made the technological and innovation breakthrough, is there really a cultural component to consider when it comes to digital mining in practice?
A: There are culture differences everywhere you go. You definitely have to consider the culture that is predominant where you’re operating, and navigate that culture carefully if you’re going to take some entrenched attitudes and convert a community into supporters and believers that can help drive change. The fundamental component is aligning management’s ideas and objectives — their systems and the way they want to run the business — with the cultures, attitudes and behaviours of people who are working there operationally. It takes some work to figure out how to get people to buy in, but once you do, you find the keys to unlocking the cultural barrier.
Q&A with Rick Howes, President & CEO, Dundee Precious Metals

Canadian Mining Eye Q3 2016 | 5
Fundraising in Q3 2016Total proceeds of C$2.5 billion raised by TSX- and TSXV-listed mining companies were reported in Q3 2016, which were flat sequentially but represents a considerable gain as compared to the same period a year ago. A few of the significant financings are:
Company Total proceeds (C$) Type Primary use of proceeds
IAMGOLD Corporation $302.8 million6 Secondary offering
The proceeds of around C$197.5 million will be used to fund the tender offer for its outstanding 6.75% senior notes, while the remainder will fund internal growth projects. The offering includes 5.83 million common shares issued to underwriters.
Centerra Gold Inc. $195.5 million Secondary offering
The proceeds will be used to fund in part the redemption of the secured and unsecured notes of its acquisition target, Thompson Creek Metals Company Inc. The offering includes 3.47 million common shares issued to underwriters.
Endeavour Mining Corporation
$143.8 million Secondary offering
The proceeds will be used for organic growth purposes, leveraging its West-African exploration portfolio.
Guyana Goldfields Inc. $130.0 million Secondary offering
The proceeds will be used to expand its Aurora Gold Mine, which is expected to be completed in 2017.
TMAC Resources Inc. $92.0 million Secondary offering
The offering was done by TMAC Resources and Resource Capital Fund (RCF), raising C$60 million and C$20 million respectively. Additionally, the offering includes C$12 million issued to underwriters. TMAC will use the proceeds to develop its Hope Bay gold project as well as for general corporate purposes.
Belo Sun Mining Corp. $75.0 million Secondary offering
The net proceeds will be used for pre-construction engineering activities, purchase of long lead time items, early project workings and working capital.
Selected financings announced, proposed or closed in Q3 2016
6 IAMGOLD Corporation deal of US$230 million is converted to C$ at 1.3164 rate, as of transaction announcement date of 08 August 2016. The currency conversion rate is sourced from the Bank of Canada website.

6 | Canadian Mining Eye Q3 2016
Fundraising on the TSX and TSXV, 2010–16
1 Initial public offering (IPO) — TSX and TSXV as primary exchanges of listing.2 Funds raised from follow-on issue of shares and private placements.
Mining All TSX and TSXVMining as % of all TSX and TSXV
New issues Further issues2 Total issues New issues Further issues
Total issues Total proceeds
Number of IPOs1
Proceeds in C$m
Number of money-
raising issues
Proceeds in C$m
Proceeds in C$m
Proceeds in CDN$m
Proceeds in C$m
Proceeds in C$m
%
Q3 2016 0 0 456 2,542 2,542 156 12,889 13,045 19%
Q2 2016 0 0 473 2,541 2,541 355 20,063 20,418 12%
Q1 2016 0 0 265 2,784 2,784 241 12,726 12,967 21%
Q4 2015 0 0 316 543 543 2,271 7,346 9,617 6%
Q3 2015 1 135 253 724 859 1,634 7,944 9,577 9%
Q2 2015 0 0 267 2,164 2,164 1,677 19,542 21,219 10%
Q1 2015 0 0 358 2,986 2,986 1,190 16,122 17,312 17%
Q4 2014 1 1 335 2,096 2,096 1,407 9,449 10,855 19%
Q3 2014 1 1 331 1,386 1,386 771 14,303 15,074 9%
Q2 2014 0 0 347 1,334 1,334 2,480 14,495 16,975 8%
Q1 2014 0 0 403 4,042 4,042 888 13,988 14,876 27%
Q4 2013 2 1 386 4,017 4,019 1,452 12,683 14,135 28%
Q3 2013 0 0 320 667 667 1,645 7,179 8,824 8%
Q2 2013 5 5 284 1,065 1,070 1,537 9,291 10,828 10%
Q1 2013 0 0 415 1,157 1,157 938 8,898 9,836 12%
Q4 2012 19 347 492 2,658 3,005 2,508 12,326 14,834 20%
Q3 2012 6 9 357 2,984 2,993 344 13,430 13,774 22%
Q2 2012 10 11 331 1,125 1,136 1,050 9,778 10,828 10%
Q1 2012 14 23 475 3,132 3,155 506 16,581 17,087 18%
Q4 2011 11 30 410 1,934 1,964 1,041 10,236 11,276 17%
Q3 2011 23 107 366 2,160 2,268 1,315 9,027 10,342 22%
Q2 2011 20 107 467 2,696 2,803 2,887 12,221 15,107 19%
Q1 2011 16 119 678 5,322 5,440 1,656 12,702 14,358 38%
Q4 2010 35 661 860 7,249 7,910 4,616 15,714 20,330 39%
Q3 2010 18 67 420 1,985 2,052 1,615 6,488 8,103 25%
Q2 2010 17 491 499 4,059 4,550 2,977 11,567 14,545 31%
Q1 2010 23 93 536 3,144 3,237 1,826 9,178 11,003 29%
2016 0 0 1,194 7,866 7,866 753 45,677 46,430 17%
2015 1 135 1,194 6,417 6,552 6,771 50,954 57,725 11%
2014 2 1 1,416 8,858 8,859 5,545 52,234 57,780 15%
2013 7 7 1,405 6,907 6,913 5,572 38,050 43,623 16%
2012 49 391 1,655 9,899 10,290 4,408 52,115 56,523 18%
2011 70 362 1,921 12,112 12,474 6,899 44,185 51,084 24%
2010 93 1,312 2,315 16,437 17,749 11,034 42,947 53,981 33%
Source: EY analysis of TSX and TSXV market statistics, as reported

Canadian Mining Eye Q3 2016 | 7
Joiners and leavers
Including the above, there were a total of 12 new entrants into the TSX and TSXV indices in Q3 2016.
Company Index Activity or focus
Euro Sun Mining TSX Euro Sun Mining is a development-stage mining company focused on Rovina Valley Project located in west-central Romania. It is headquartered in Toronto, Canada.
Austral Gold Limited TSXV Austral Gold Limited is a precious metals mining and exploration company with mineral assets in both Australia and South America. It is headquartered in Sydney, Australia.
Filo Mining Corp. TSXV Filo Mining Corp. deals in copper, gold and silver metals exploration in Chile and Argentina. It is headquartered in Vancouver, Canada.
Mariana Resources Ltd. TSXV Mariana Resources engages in the exploration and development of gold, silver, and copper in South America and Turkey. It is based in St. Martin, Channel Islands.
Companies joining the TSX and TSXV indices (Q3 2016)
Company Reason for delisting
Royal Gold, Inc. Voluntarily delisted due to low trading volume over a long period of time.
Kaminak Gold Corp. Delisted after its acquisition by GoldCorp Inc. (TSX:G)
Companies leaving the TSX and TSXV indices (Q3 2016)
Including the above, there were a total of 26 companies leaving the TSX and TSXV indices in Q3 2016.
0%
5%
10%
15%
20%
25%
30%
-
100,000
200,000
300,000
400,000
500,000
600,000
Min
ing
as %
of a
ll TS
X &
TSX
V
Min
ing
mar
ket
valu
e C
DN
$m
Value of TSX and TSXV mining universe and as % of all TSX and TSXV, 2009–16
Source: EY analysis of data from TSX and TSXV Market Intelligence Group, as reported; market values as at quarter end
Mining market cap Mining as a % of all TSX and TSXV (RH scale)
Q1 2009
Q2 2009
Q3 2009
Q4 2009
Q1 2010
Q2 2010
Q3 2010
Q4 2010
Q1 2011
Q2 2011
Q3 2011
Q4 2011
Q1 2012
Q2 2012
Q3 2012
Q4 2012
Q1 2013
Q2 2013
Q3 2013
Q4 2013
Q1 2014
Q2 2014
Q3 2014
Q4 2014
Q1 2015
Q2 2015
Q3 2015
Q4 2015
Q1 2016
Q2 2016
Q3 2016 0
10
20
30
40
50
60
70
Num
ber
of c
ompa
nies
TSX and TSXV mining admissions and delistings since 2008
Source: EY analysis of data from TSX and TSXV Market Intelligence Group, as reported; includes placements, introductions and readmissions; excludes transfers between TSX and TSXV
Admissions Delistings Q1 2008
Q2 2008
Q3 2008
Q4 2008
Q1 2009
Q2 2009
Q3 2009
Q4 2009
Q1 2010
Q2 2010
Q3 2010
Q4 2010
Q1 2011
Q2 2011
Q3 2011
Q4 2011
Q1 2012
Q2 2012
Q3 2012
Q4 2012
Q1 2013
Q2 2013
Q3 2013
Q4 2013
Q1 2014
Q2 2014
Q3 2014
Q4 2014
Q1 2015
Q2 2015
Q3 2015
Q4 2015
Q1 2016
Q2 2016
Q3 2016

8 | Canadian Mining Eye Q3 2016
Index constituents selected at quarter end
Q3 2016 MV (C$m)
Q3 2016 MV (C$m)
Q3 2016 MV (C$m)
New Gold 2,918 Premier Gold Mines 741 Polymet Mining 292 Alamos Gold 2,876 Silvercorp Metals 700 Bear Creek Mining 290 Centamin 2,854 Gold Standard Ventures 697 Great Panther Silver 289 Pretium Resources 2,407 Lundin Gold 670 Lithium Americas 271 IAMGOLD 2,389 NexGen Energy 608 NGEx Resources 265 NovaGold Resources 2,346 Arizona Mining 597 Katanga Mining 257 Endeavour Mining 2,346 Roxgold 572 Paladin Energy 257 Torex Gold Resources 2,254 Continental Gold 566 Sherritt International 247 First Majestic Silver 2,214 Argonaut Gold 547 Gabriel Resources 242 Silver Standard Resources 1,882 Perseus Mining 543 Chesapeake Gold 233 Ivanhoe Mines 1,776 Dundee Precious Metals 520 Alexco Resource 214 SEMAFO 1,774 Imperial Metals 498 Barkerville Gold Mines 211 Centerra Gold 1,742 Nemaska Lithium 494 Largo Resources 198 MAG Silver 1,589 Altius Minerals 484 Auryn Resources 197 TMAC Resources 1,540 Osisko Mining 472 Timmins Gold 195 Osisko Gold Royalties 1,530 Gold Reserve 460 Kennady Diamonds 189 Lucara Diamond 1,493 Teranga Gold 459 Red Eagle Mining 188 McEwen Mining 1,447 First Mining Finance 456 Atalaya Mining 176 Guyana Goldfields 1,398 Mandalay Resources 451 Bacanora Minerals 163 Fortuna Silver Mines 1,385 Belo Sun Mining 437 Americas Silver 163 China Gold International Resources 1,272 Trevali Mining 435 GoGold Resources 161 HudBay Minerals 1,226 Primero Mining 411 Midas Gold 160 Nevsun Resources 1,190 Golden Star Resources 362 Almaden Minerals 159 Kirkland Lake Gold 1,168 Wesdome Gold Mines 347 NioCorp Developments 146 Asanko Gold 1,107 Integra Gold 345 Anglo Pacific 135 Mountain Province Diamonds 1,096 Brazil Resources 334 Vista Gold 133 Dominion Diamond 1,082 Denison Mines 325 Golden Queen Mining 128 Klondex Mines 1,080 Platinum Group Metals 322 Energy Fuels 122 Sandstorm Gold 1,005 Sierra Metals 316 Stornoway Diamond 973 North American Palladium 313 Alacer Gold 958 Victoria Gold 313 Total universe MV C$m 301,147 Endeavour Silver 844 Capstone Mining 310 Top 20 MV C$m 199,767 Newmarket Gold 838 Sabina Gold & Silver 308 Total universe excl Top 20 MV C$m 101,380 Richmont Mines 830 Dalradian Resources 305 MV of Mining Eye constituents 78,402
Orocobre 796 Fission Uranium 305 MV of Mining Eye constituents as a % of MV of Total universe excl Top 20
77%
Seabridge Gold 783 Lydian International 293
MV — Market value
Shading represents index entrants
Changes to the Mining Eye indexThere were 13 changes in index constituents in Q3 2016. Pan American Silver and B2Gold moved to the Top 20 index. Taseko Mines, NioCorp Developments, Polaris Materials, Ascot Resources, Corsa Coal, Noranda, Archon Minerals, Banro, AuRico Metals, UR-Energy, and Kaminak Gold exited the index and were replaced by index entrants highlighted in the table above.
Source: EY, TSX and TSXV Market Intelligence Group
Canadian Mining Eye Q3 2016 | 9
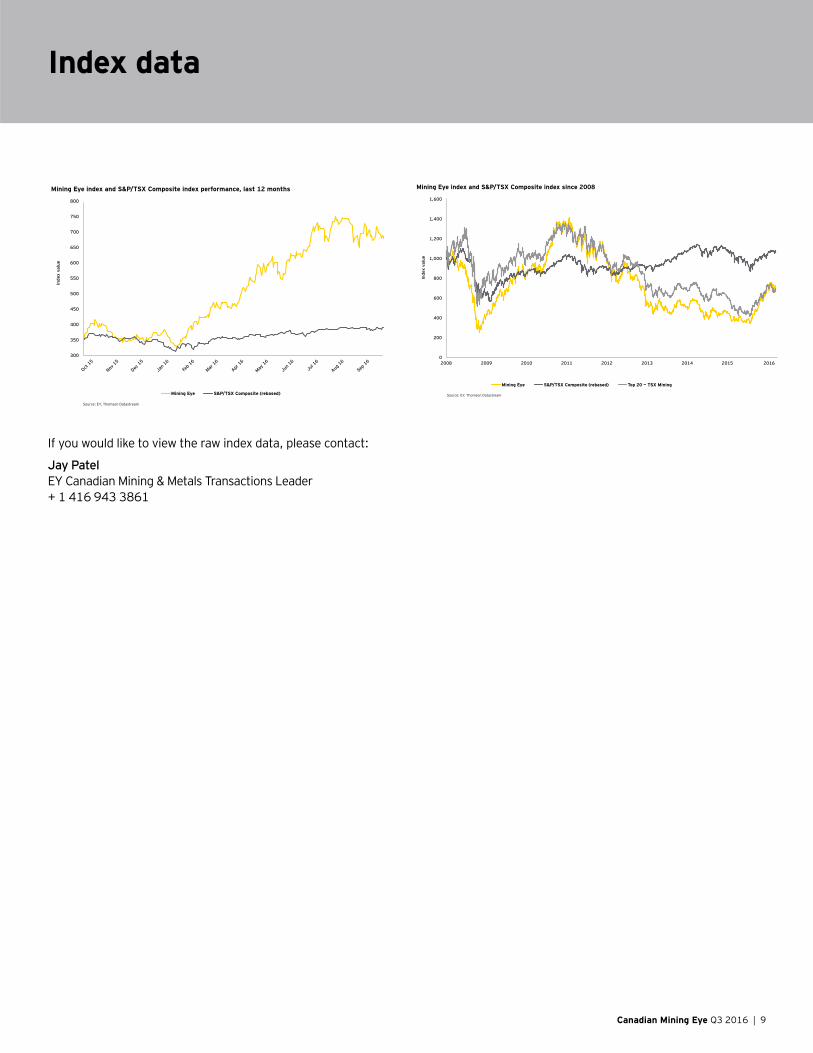
Index dataIn
dex
valu
e
Mining Eye index and S&P/TSX Composite index performance, last 12 months
Source: EY, Thomson Datastream
Mining Eye S&P/TSX Composite (rebased)
300
350
400
450
500
550
600
650
700
750
800
Oct 15
Nov 15
Dec 15
Jan 16
Feb 1
6
Mar 16
Apr 16
May 16
Jun 16
Jul 16
Aug 16
Sep 16 0
200
400
600
800
1,000
1,200
1,400
1,600
2008 2009 2010 2011 2012 2013 2014 2015 2016
Inde
x va
lue
Mining Eye index and S&P/TSX Composite index since 2008
Source: EY, Thomson Datastream
Mining Eye S&P/TSX Composite (rebased) Top 20 — TSX Mining
If you would like to view the raw index data, please contact:
Jay Patel EY Canadian Mining & Metals Transactions Leader + 1 416 943 3861

10 | Canadian Mining Eye Q3 2016
The Canadian Mining Eye tracks Canadian mining sector performance of 100 TSX and TSXV mid-tier and junior companies with market capitalizations at the end, broadly falling between C$2.9b and C$122m. These companies trade on the TSX and TSXV, though some of them are headquartered outside Canada. Movements and analysis of the index are reported quarterly. From Q1 2014, we have retroactively reset the index to Top 20 and Next 100
(from Top 25 and Next 100) based on the market capitalizations at the end of 2013. The historical data has also been reset for comparatives purpose.
All company information is sourced from publicly available sources, including company websites and regulatory announcements.
Jay PatelCanadian Mining & Metals Transactions Leader+1 416 943 [email protected]
Canadian contactsJim MacLeanCanadian Mining & Metals Leader+1 416 943 [email protected]
Blake LangillOntario Mining & Metals Leader+1 416 943 3556 [email protected]
Zahid FazalQuebec Mining & Metals Leader+1 514 879 [email protected]
Michelle GrantBC Mining & Metals Transactions Leader+1 604 899 [email protected]
Theophile YameogoCanadian Mining & Metals Advisory Leader+1 416 943 3832 [email protected]
EY Global Mining & Metals Leader Miguel Zweig +55 11 2573 3363 [email protected]
Oceania Scott Grimley +61 3 9655 2509 [email protected]
China and Mongolia Peter Markey +86 21 2228 2616 [email protected]
Japan Andrew Cowell +81 3 3503 3435 [email protected]
Africa Wickus Botha +27 11 772 3386 [email protected]
Commonwealth of Independent States Boris Yatsenko +7 495 755 98 60 [email protected]
France, Luxemburg, Maghreb, MENA Christian Mion +33 1 46 93 65 47 [email protected]
India Anjani Agrawal +91 22 6192 0150 [email protected]
United Kingdom and Ireland Lee Downham +44 20 7951 2178 [email protected]
Canada Jim MacLean +1 416 943 3674 [email protected]
Brazil Afonso Sartorio +55 11 2573 3074 [email protected]
Chile María Javiera Contreras +562 2676 1492 [email protected]
Service line contactsEY Global Advisory Leader Paul Mitchell +61 2 9248 5110 [email protected]
EY Global Assurance Leader Alexei Ivanov +495 228 3661 [email protected]
EY Global IFRS Leader Tracey Waring +61 3 9288 8638 [email protected]
EY Global Tax Leader Andrew van Dinter +61 3 8650 7589 [email protected]
EY Global Transactions Leader Lee Downham +44 20 7951 2178 [email protected]
Area contacts
EY | Assurance | Tax | Transactions | Advisory
About EYEY is a global leader in assurance, tax, transaction and advisory services. The insights and quality services we deliver help build trust and confidence in the capital markets and in economies the world over. We develop outstanding leaders who team to deliver on our promises to all of our stakeholders. In so doing, we play a critical role in building a better working world for our people, for our clients and for our communities.
EY refers to the global organization, and may refer to one or more, of the member firms ofErnst & Young Global Limited, each of which isa separate legal entity. Ernst & Young Global Limited, a UK company limited by guarantee,does not provide services to clients. For more information about our organization, please visit ey.com.
© 2016 EYGM Limited. All Rights Reserved.
SCORE 04080-164Gbl CSG 2105531
ED none
This material has been prepared for general informational purposes only and is not intended to be relied upon as accounting, tax or other professional advice. Please refer to your advisors for specific advice.
ey.com/miningmetals
How EY’s Global Mining & Metals Network can help your businessWith a volatile outlook for the sector, the global mining and metals industry is focused on how to maintain a strong and flexible balance sheet while preparing for future growth. The sector is also faced with the increased challenges of improving productivity, access to capital, dealing with increased transparency, maintaining license to operate and cybersecurity.
EY’s Global Mining & Metals Network is where people and ideas come together to help mining and metals companies meet the issues of today and anticipate those of tomorrow by developing solutions to meet these challenges. It brings together a worldwide team of professionals to help you succeed — a team with deep technical experience in providing assurance, tax, transactions and advisory services to the mining and metals sector. Ultimately it enables us to help you meet your goals and compete more effectively.