Embed Size (px)
Citation preview

Canadian Tectonics Group
Field Trip Guide
Tectonic context of km‐scale cross‐folds and foliation megaboudins in the Muskoka domain: formation in the detachment zone of a giant metamorphic core complex
by
Toby Rivers1 and Fried Schwerdtner2
1Department of Earth Sciences, Memorial University, St. John’s NL, A1B 3X5 2Department of Earth Sciences, University of Toronto, 22 Russell Street, Toronto, ON, M5S 3B1
A field excursion based out of Bracebridge, Ontario held on October 23, 2016

© Royal Ontario Museum
This field guide is dedicated to the memory of Sydney Blake Lumbers (1933‐2004), outstanding field geologist and petrographer who managed to map much of the Ontario Grenville Province between the years ~1960‐2000. Born in Toronto, Syd completed his BSc at McMaster (1958) and MSc at UBC (1960) before going to Princeton for his PhD in igneous petrology under Professor A.F. Buddington (awarded 1967). He was subsequently employed by the Ontario Department of Mines (now Ontario Geological Survey) and later the Royal Ontario Museum. At the latter institution, where he held the title of Curator of Geology, he operated an informal one‐man Grenville Survey while fulfilling the role of mineral curator. His work in igneous petrology focussed principally on alkaline rocks, including fenites and carbonatites, of which he identified, mapped and described many Grenvillian occurrences. In addition, he is also known for his ground‐breaking subdivision of intrusive rocks in the southwest Grenville Province into compositional and subsequently temporal groups that has become a backbone of our understanding of the regional tectonic evolution. Syd is remembered too for his prodigious output of geological maps in both the supracrustal and gneissic parts of the Ontario Grenville. Although some aspects of his mapping in high‐grade gneiss terranes were not without controversy (he worked at a time when high‐strain straight gneisses were commonly interpreted as metasedimentary rocks), and he retained idiosyncratic views on for example the existence of granulite‐facies metamorphism and linear fabrics, his maps were notable for their artistic quality, the realistic depiction of flowing gneissic fabrics and the ductile nature of strain (see example next page), which was uncommon at the time and perhaps reflected an influence of his older brother, a respected painter. Honest and frank with a dry sense of humour behind a somewhat gruff exterior, Syd generally kept his geological cards close to his chest, especially after the advent of lithotectonic mapping in the Grenville Province (ironically in some cases based on his maps) and his strictly lithological maps fell out of favour with part of the community. In common with many others, we have long used Syd’s maps and been aware of his mapping prowess. However, we were recently reminded again of the fidelity of his observations in our study of cross‐folds, in which we have found his representation of the complex gneissic structure to be both accurate and reliable in addition to its artistic merit. As we publish our interpretation on the transtensional origin of cross‐folding in the Ottawa River Gneiss Complex, it is both appropriate and a pleasure to recognise that it was Syd who first identified and mapped so many of the cross‐folds and provided the hard evidence for their widespread distribution. [TR, WMS and DHW, with additional biographic information from files of the ROM and SBL’s former colleagues].
2
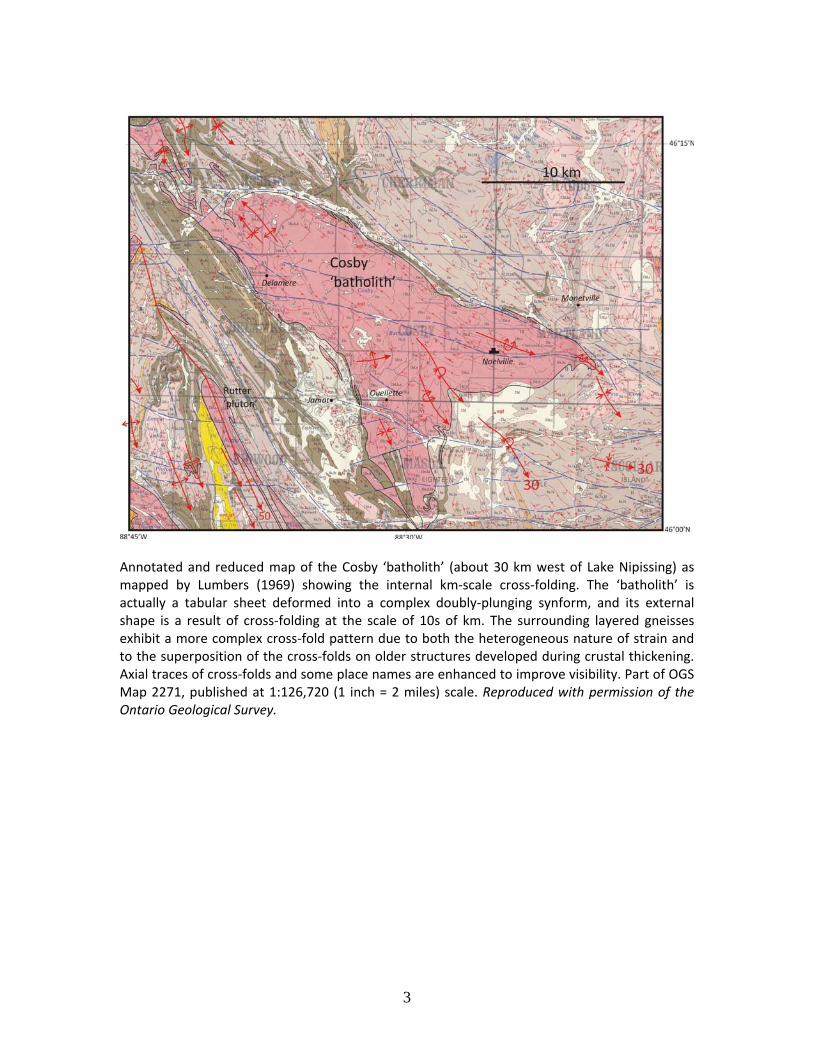
Annotated and reduced map of the Cosby ‘batholith’ (about 30 km west of Lake Nipissing) as mapped by Lumbers (1969) showing the internal km‐scale cross‐folding. The ‘batholith’ is actually a tabular sheet deformed into a complex doubly‐plunging synform, and its external shape is a result of cross‐folding at the scale of 10s of km. The surrounding layered gneisses exhibit a more complex cross‐fold pattern due to both the heterogeneous nature of strain and to the superposition of the cross‐folds on older structures developed during crustal thickening. Axial traces of cross‐folds and some place names are enhanced to improve visibility. Part of OGS Map 2271, published at 1:126,720 (1 inch = 2 miles) scale. Reproduced with permission of the Ontario Geological Survey.
3
Part 1
BACKGROUND AND TECTONIC CONTEXT
4
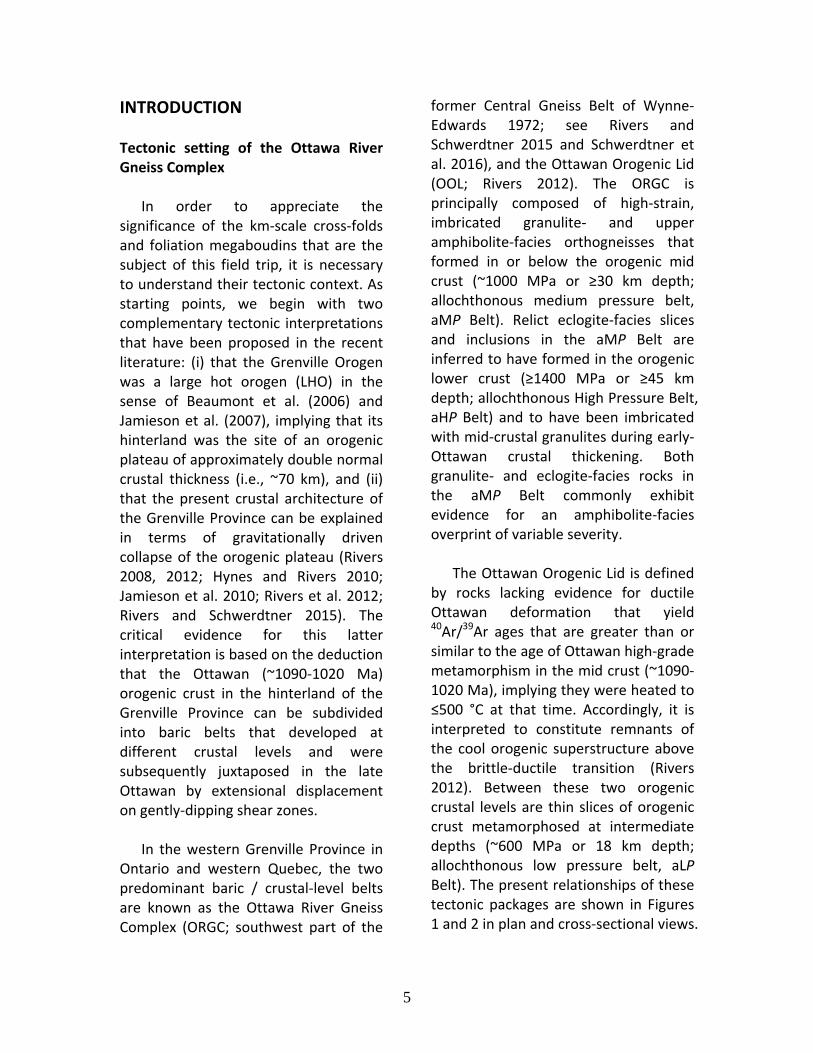
INTRODUCTION Tectonic setting of the Ottawa River Gneiss Complex In order to appreciate the significance of the km‐scale cross‐folds and foliation megaboudins that are the subject of this field trip, it is necessary to understand their tectonic context. As starting points, we begin with two complementary tectonic interpretations that have been proposed in the recent literature: (i) that the Grenville Orogen was a large hot orogen (LHO) in the sense of Beaumont et al. (2006) and Jamieson et al. (2007), implying that its hinterland was the site of an orogenic plateau of approximately double normal crustal thickness (i.e., ~70 km), and (ii) that the present crustal architecture of the Grenville Province can be explained in terms of gravitationally driven collapse of the orogenic plateau (Rivers 2008, 2012; Hynes and Rivers 2010; Jamieson et al. 2010; Rivers et al. 2012; Rivers and Schwerdtner 2015). The critical evidence for this latter interpretation is based on the deduction that the Ottawan (~1090‐1020 Ma) orogenic crust in the hinterland of the Grenville Province can be subdivided into baric belts that developed at different crustal levels and were subsequently juxtaposed in the late Ottawan by extensional displacement on gently‐dipping shear zones. In the western Grenville Province in Ontario and western Quebec, the two predominant baric / crustal‐level belts are known as the Ottawa River Gneiss Complex (ORGC; southwest part of the
former Central Gneiss Belt of Wynne‐Edwards 1972; see Rivers and Schwerdtner 2015 and Schwerdtner et al. 2016), and the Ottawan Orogenic Lid (OOL; Rivers 2012). The ORGC is principally composed of high‐strain, imbricated granulite‐ and upper amphibolite‐facies orthogneisses that formed in or below the orogenic mid crust (~1000 MPa or ≥30 km depth; allochthonous medium pressure belt, aMP Belt). Relict eclogite‐facies slices and inclusions in the aMP Belt are inferred to have formed in the orogenic lower crust (≥1400 MPa or ≥45 km depth; allochthonous High Pressure Belt, aHP Belt) and to have been imbricated with mid‐crustal granulites during early‐Ottawan crustal thickening. Both granulite‐ and eclogite‐facies rocks in the aMP Belt commonly exhibit evidence for an amphibolite‐facies overprint of variable severity. The Ottawan Orogenic Lid is defined by rocks lacking evidence for ductile Ottawan deformation that yield 40Ar/39Ar ages that are greater than or similar to the age of Ottawan high‐grade metamorphism in the mid crust (~1090‐1020 Ma), implying they were heated to ≤500 °C at that time. Accordingly, it is interpreted to constitute remnants of the cool orogenic superstructure above the brittle‐ductile transition (Rivers 2012). Between these two orogenic crustal levels are thin slices of orogenic crust metamorphosed at intermediate depths (~600 MPa or 18 km depth; allochthonous low pressure belt, aLP Belt). The present relationships of these tectonic packages are shown in Figures 1 and 2 in plan and cross‐sectional views.
5
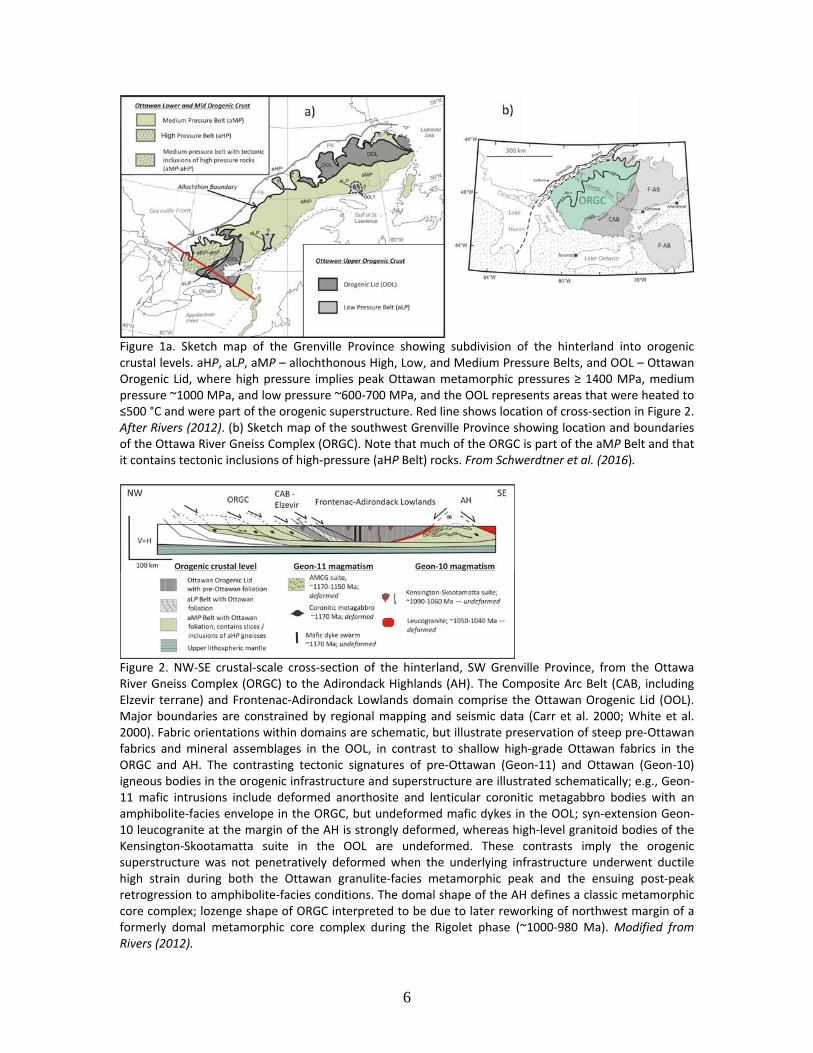
Figure 1a. Sketch map of the Grenville Province showing subdivision of the hinterland into orogenic crustal levels. aHP, aLP, aMP – allochthonous High, Low, and Medium Pressure Belts, and OOL – Ottawan Orogenic Lid, where high pressure implies peak Ottawan metamorphic pressures ≥ 1400 MPa, medium pressure ~1000 MPa, and low pressure ~600‐700 MPa, and the OOL represents areas that were heated to ≤500 °C and were part of the orogenic superstructure. Red line shows location of cross‐section in Figure 2. After Rivers (2012). (b) Sketch map of the southwest Grenville Province showing location and boundaries of the Ottawa River Gneiss Complex (ORGC). Note that much of the ORGC is part of the aMP Belt and that it contains tectonic inclusions of high‐pressure (aHP Belt) rocks. From Schwerdtner et al. (2016).
Figure 2. NW‐SE crustal‐scale cross‐section of the hinterland, SW Grenville Province, from the Ottawa River Gneiss Complex (ORGC) to the Adirondack Highlands (AH). The Composite Arc Belt (CAB, including Elzevir terrane) and Frontenac‐Adirondack Lowlands domain comprise the Ottawan Orogenic Lid (OOL). Major boundaries are constrained by regional mapping and seismic data (Carr et al. 2000; White et al. 2000). Fabric orientations within domains are schematic, but illustrate preservation of steep pre‐Ottawan fabrics and mineral assemblages in the OOL, in contrast to shallow high‐grade Ottawan fabrics in the ORGC and AH. The contrasting tectonic signatures of pre‐Ottawan (Geon‐11) and Ottawan (Geon‐10) igneous bodies in the orogenic infrastructure and superstructure are illustrated schematically; e.g., Geon‐11 mafic intrusions include deformed anorthosite and lenticular coronitic metagabbro bodies with an amphibolite‐facies envelope in the ORGC, but undeformed mafic dykes in the OOL; syn‐extension Geon‐10 leucogranite at the margin of the AH is strongly deformed, whereas high‐level granitoid bodies of the Kensington‐Skootamatta suite in the OOL are undeformed. These contrasts imply the orogenic superstructure was not penetratively deformed when the underlying infrastructure underwent ductile high strain during both the Ottawan granulite‐facies metamorphic peak and the ensuing post‐peak retrogression to amphibolite‐facies conditions. The domal shape of the AH defines a classic metamorphic core complex; lozenge shape of ORGC interpreted to be due to later reworking of northwest margin of a formerly domal metamorphic core complex during the Rigolet phase (~1000‐980 Ma). Modified from Rivers (2012).
6
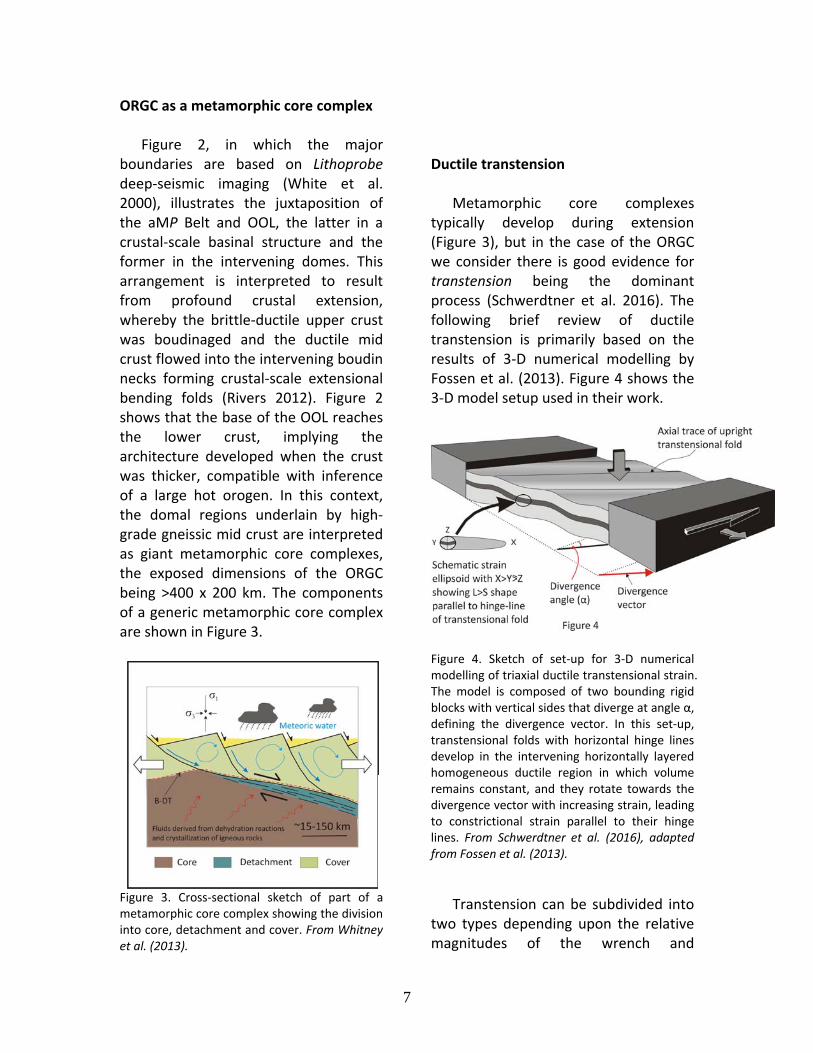
ORGC as a metamorphic core complex Figure 2, in which the major boundaries are based on Lithoprobe deep‐seismic imaging (White et al. 2000), illustrates the juxtaposition of the aMP Belt and OOL, the latter in a crustal‐scale basinal structure and the former in the intervening domes. This arrangement is interpreted to result from profound crustal extension, whereby the brittle‐ductile upper crust was boudinaged and the ductile mid crust flowed into the intervening boudin necks forming crustal‐scale extensional bending folds (Rivers 2012). Figure 2 shows that the base of the OOL reaches the lower crust, implying the architecture developed when the crust was thicker, compatible with inference of a large hot orogen. In this context, the domal regions underlain by high‐grade gneissic mid crust are interpreted as giant metamorphic core complexes, the exposed dimensions of the ORGC being >400 x 200 km. The components of a generic metamorphic core complex are shown in Figure 3.
Figure 3. Cross‐sectional sketch of part of a metamorphic core complex showing the division into core, detachment and cover. From Whitney et al. (2013).
Ductile transtension Metamorphic core complexes typically develop during extension (Figure 3), but in the case of the ORGC we consider there is good evidence for transtension being the dominant process (Schwerdtner et al. 2016). The following brief review of ductile transtension is primarily based on the results of 3‐D numerical modelling by Fossen et al. (2013). Figure 4 shows the 3‐D model setup used in their work.
Figure 4. Sketch of set‐up for 3‐D numerical modelling of triaxial ductile transtensional strain. The model is composed of two bounding rigid blocks with vertical sides that diverge at angle α, defining the divergence vector. In this set‐up, transtensional folds with horizontal hinge lines develop in the intervening horizontally layered homogeneous ductile region in which volume remains constant, and they rotate towards the divergence vector with increasing strain, leading to constrictional strain parallel to their hinge lines. From Schwerdtner et al. (2016), adapted from Fossen et al. (2013).
Transtension can be subdivided into two types depending upon the relative magnitudes of the wrench and
7
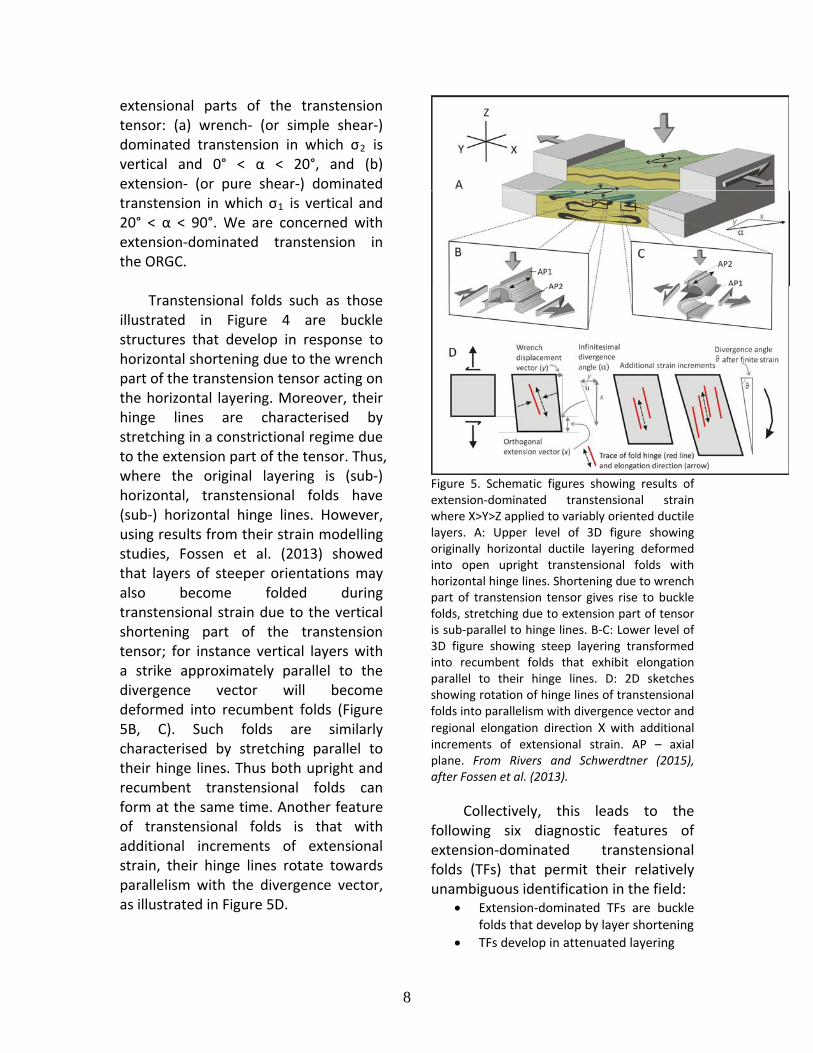
extensional parts of the transtension tensor: (a) wrench‐ (or simple shear‐) dominated transtension in which σ2 is vertical and 0° < α < 20°, and (b) extension‐ (or pure shear‐) dominated transtension in which σ1 is vertical and 20° < α < 90°. We are concerned with extension‐dominated transtension in the ORGC. Transtensional folds such as those illustrated in Figure 4 are buckle structures that develop in response to horizontal shortening due to the wrench part of the transtension tensor acting on the horizontal layering. Moreover, their hinge lines are characterised by stretching in a constrictional regime due to the extension part of the tensor. Thus, where the original layering is (sub‐) horizontal, transtensional folds have (sub‐) horizontal hinge lines. However, using results from their strain modelling studies, Fossen et al. (2013) showed that layers of steeper orientations may also become folded during transtensional strain due to the vertical shortening part of the transtension tensor; for instance vertical layers with a strike approximately parallel to the divergence vector will become deformed into recumbent folds (Figure 5B, C). Such folds are similarly characterised by stretching parallel to their hinge lines. Thus both upright and recumbent transtensional folds can form at the same time. Another feature of transtensional folds is that with additional increments of extensional strain, their hinge lines rotate towards parallelism with the divergence vector, as illustrated in Figure 5D.
Figure 5. Schematic figures showing results of extension‐dominated transtensional strain where X>Y>Z applied to variably oriented ductile layers. A: Upper level of 3D figure showing originally horizontal ductile layering deformed into open upright transtensional folds with horizontal hinge lines. Shortening due to wrench part of transtension tensor gives rise to buckle folds, stretching due to extension part of tensor is sub‐parallel to hinge lines. B‐C: Lower level of 3D figure showing steep layering transformed into recumbent folds that exhibit elongation parallel to their hinge lines. D: 2D sketches showing rotation of hinge lines of transtensional folds into parallelism with divergence vector and
regional elongation direction X with additional increments of extensional strain. AP – axial plane. From Rivers and Schwerdtner (2015), after Fossen et al. (2013).
Collectively, this leads to the following six diagnostic features of extension‐dominated transtensional folds (TFs) that permit their relatively unambiguous identification in the field:
Extension‐dominated TFs are buckle folds that develop by layer shortening
TFs develop in attenuated layering
8
Hinge lines of TFs are sub‐parallel to X, the principal regional elongation direction
Hinge lines of TFs develop in a constrictional regime, resulting in pure L or L>>S fabrics parallel to X
Axial surfaces of TFs may range from upright to recumbent orientations.
Moreover, if formed during a regime of orogenic collapse: TFs develop after the metamorphic
peak in rocks undergoing retrogression and decompression.
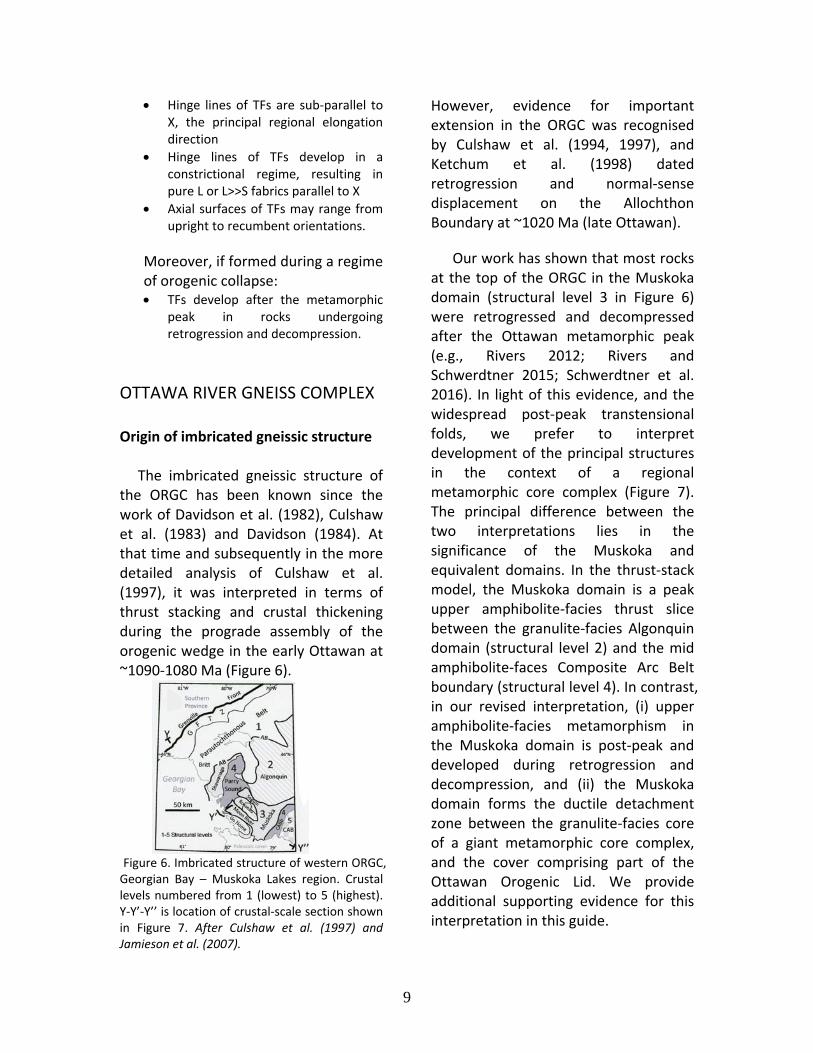
OTTAWA RIVER GNEISS COMPLEX Origin of imbricated gneissic structure The imbricated gneissic structure of the ORGC has been known since the work of Davidson et al. (1982), Culshaw et al. (1983) and Davidson (1984). At that time and subsequently in the more detailed analysis of Culshaw et al. (1997), it was interpreted in terms of thrust stacking and crustal thickening during the prograde assembly of the orogenic wedge in the early Ottawan at ~1090‐1080 Ma (Figure 6).
Figure 6. Imbricated structure of western ORGC, Georgian Bay – Muskoka Lakes region. Crustal levels numbered from 1 (lowest) to 5 (highest). Y‐Y’‐Y’’ is location of crustal‐scale section shown in Figure 7. After Culshaw et al. (1997) and Jamieson et al. (2007).
However, evidence for important extension in the ORGC was recognised by Culshaw et al. (1994, 1997), and Ketchum et al. (1998) dated retrogression and normal‐sense displacement on the Allochthon Boundary at ~1020 Ma (late Ottawan).
Our work has shown that most rocks at the top of the ORGC in the Muskoka domain (structural level 3 in Figure 6) were retrogressed and decompressed after the Ottawan metamorphic peak (e.g., Rivers 2012; Rivers and Schwerdtner 2015; Schwerdtner et al. 2016). In light of this evidence, and the widespread post‐peak transtensional folds, we prefer to interpret development of the principal structures in the context of a regional metamorphic core complex (Figure 7). The principal difference between the two interpretations lies in the significance of the Muskoka and equivalent domains. In the thrust‐stack model, the Muskoka domain is a peak upper amphibolite‐facies thrust slice between the granulite‐facies Algonquin domain (structural level 2) and the mid amphibolite‐faces Composite Arc Belt boundary (structural level 4). In contrast, in our revised interpretation, (i) upper amphibolite‐facies metamorphism in the Muskoka domain is post‐peak and developed during retrogression and decompression, and (ii) the Muskoka domain forms the ductile detachment zone between the granulite‐facies core of a giant metamorphic core complex, and the cover comprising part of the Ottawan Orogenic Lid. We provide additional supporting evidence for this interpretation in this guide.
9
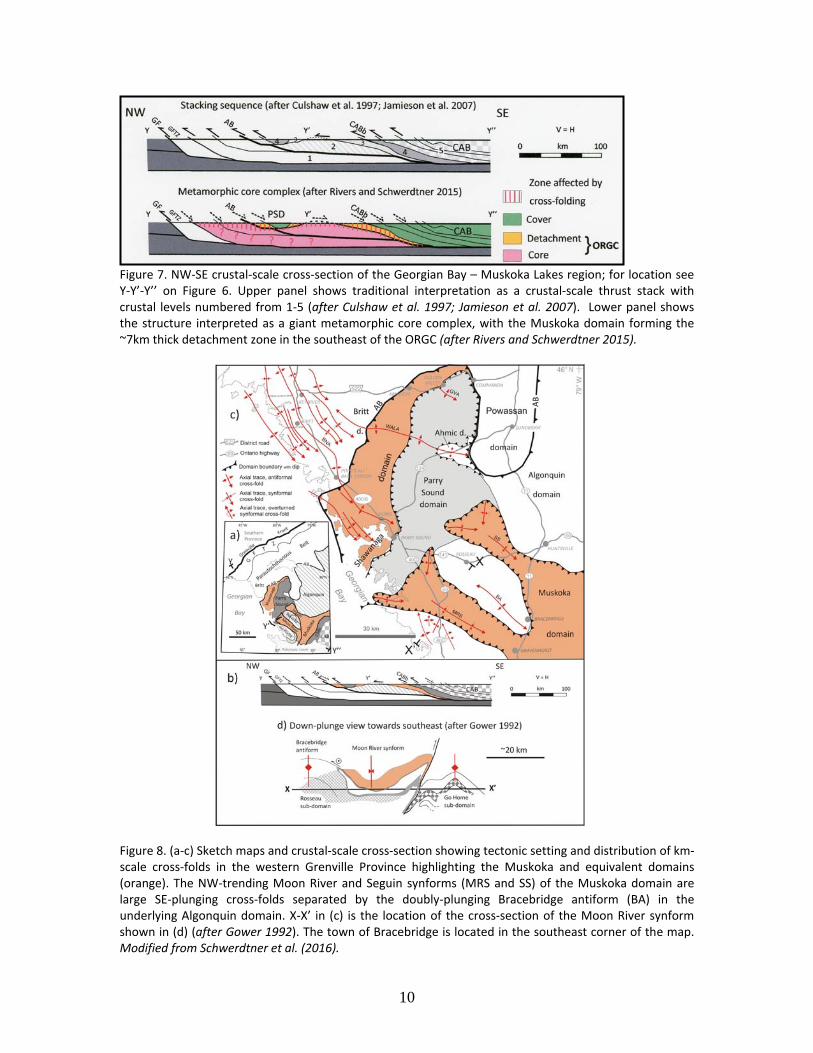
Figure 7. NW‐SE crustal‐scale cross‐section of the Georgian Bay – Muskoka Lakes region; for location see Y‐Y’‐Y’’ on Figure 6. Upper panel shows traditional interpretation as a crustal‐scale thrust stack with crustal levels numbered from 1‐5 (after Culshaw et al. 1997; Jamieson et al. 2007). Lower panel shows the structure interpreted as a giant metamorphic core complex, with the Muskoka domain forming the ~7km thick detachment zone in the southeast of the ORGC (after Rivers and Schwerdtner 2015).
10
Figure 8. (a‐c) Sketch maps and crustal‐scale cross‐section showing tectonic setting and distribution of km‐scale cross‐folds in the western Grenville Province highlighting the Muskoka and equivalent domains (orange). The NW‐trending Moon River and Seguin synforms (MRS and SS) of the Muskoka domain are large SE‐plunging cross‐folds separated by the doubly‐plunging Bracebridge antiform (BA) in the underlying Algonquin domain. X‐X’ in (c) is the location of the cross‐section of the Moon River synform shown in (d) (after Gower 1992). The town of Bracebridge is located in the southeast corner of the map. Modified from Schwerdtner et al. (2016).

Multi‐order cross‐folding Figure 8 shows the distribution, scale and tectonic setting of the km‐scale cross‐folds in the western ORGC (from Schwerdtner et al. 2016). The largest cross‐folds are in the southeastern ORGC where they control the map pattern of the Muskoka domain. However, although cross‐folding is most prominent in the amphibolite‐facies Muskoka domain, it also affects the top of the underlying granulite‐facies Algonquin and equivalent domains, as exemplified by the doubly‐plunging Bracebridge antiform. Moreover, farther northwest, cross‐folding is also prominent in the Britt domain of the Parautochthonous Belt (Figure 8c).
Field photographs of representative m‐scale cross‐folds are presented in Figure 9. Hinge lines generally plunge gently towards the southeast (the majority) or northwest. Axial surface orientations range from upright or inclined (the majority) to recumbent. On the basis of the M‐S‐Z symmetry and elongation lineations of m‐scale (2nd order) cross‐folds developed on km‐scale (1st order) structures, Schwerdtner et al. (2016) showed that the former exhibit a quasi‐mirror symmetry about the axial traces of the latter, consistent with an origin by buckling, and that their hinge lines are statistically parallel to the regional stretching lineation.
Figure 9. Field photographs of gently‐plunging, m‐scale cross‐folds illustrating the range of fold style from open to close, and axial surface orientation from upright to recumbent. A‐C are from the Moon River synform, Muskoka domain, D is from the parautochthonous Britt domain, E is from the Algonquin domain near Whitney, and F is from eastern Muskoka domain. The folded fabric is amphibolite facies in all cases. From Rivers and Schwerdtner (2015).
11
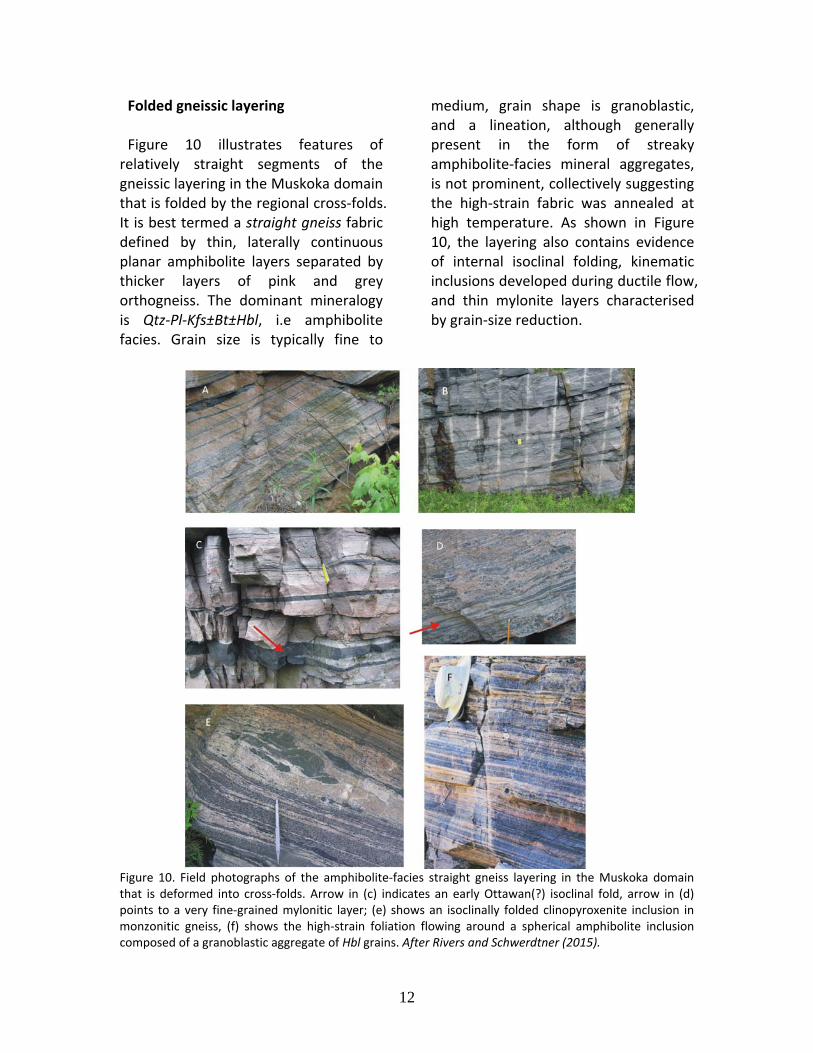
Folded gneissic layering Figure 10 illustrates features of relatively straight segments of the gneissic layering in the Muskoka domain that is folded by the regional cross‐folds. It is best termed a straight gneiss fabric defined by thin, laterally continuous planar amphibolite layers separated by thicker layers of pink and grey orthogneiss. The dominant mineralogy is Qtz‐Pl‐Kfs±Bt±Hbl, i.e amphibolite facies. Grain size is typically fine to
medium, grain shape is granoblastic, and a lineation, although generally present in the form of streaky amphibolite‐facies mineral aggregates, is not prominent, collectively suggesting the high‐strain fabric was annealed at high temperature. As shown in Figure 10, the layering also contains evidence of internal isoclinal folding, kinematic inclusions developed during ductile flow, and thin mylonite layers characterised by grain‐size reduction.
Figure 10. Field photographs of the amphibolite‐facies straight gneiss layering in the Muskoka domain that is deformed into cross‐folds. Arrow in (c) indicates an early Ottawan(?) isoclinal fold, arrow in (d) points to a very fine‐grained mylonitic layer; (e) shows an isoclinally folded clinopyroxenite inclusion in monzonitic gneiss, (f) shows the high‐strain foliation flowing around a spherical amphibolite inclusion composed of a granoblastic aggregate of Hbl grains. After Rivers and Schwerdtner (2015).
12
As noted above, a characteristic of extension‐dominated transtensional folding is that the layering becomes attenuated during the folding. Boudinage on a range of scales is ubiquitous throughout the Muskoka domain, attesting to this process, and some outcrop‐scale examples are shown in Figure 11. Typically the boudinaged layers are relatively more mafic in composition compared to the felsic material that defines the extensional bending folds in the inter‐boudin neck regions, pointing to systematic viscosity contrasts between these lithologies. In most cases, m‐scale boudinage appears to have taken place under subsolidus conditions, but Figure 11a shows a cm‐scale example of suprasolidus boudinage, with felsic leucosomes occupying the inter‐boudin gaps and spaces between disaggregated fragments of mafic layers. Examples of the evidence, in the form of retrograde rims and core‐rim contrasts in grain size, used to deduce that the amphibolite‐facies foliation in the Muskoka domain developed after peak granulite‐facies metamorphism are shown in Figures 11E‐F and 12. Such features are widespread and lead us to conclude that not only is the high‐strain straight gneiss foliation a retrograde feature, but that the cross‐folds that deform it also developed after peak granulite‐facies conditions. In addition to boudinage of relatively viscous mafic layers in heterogeneous
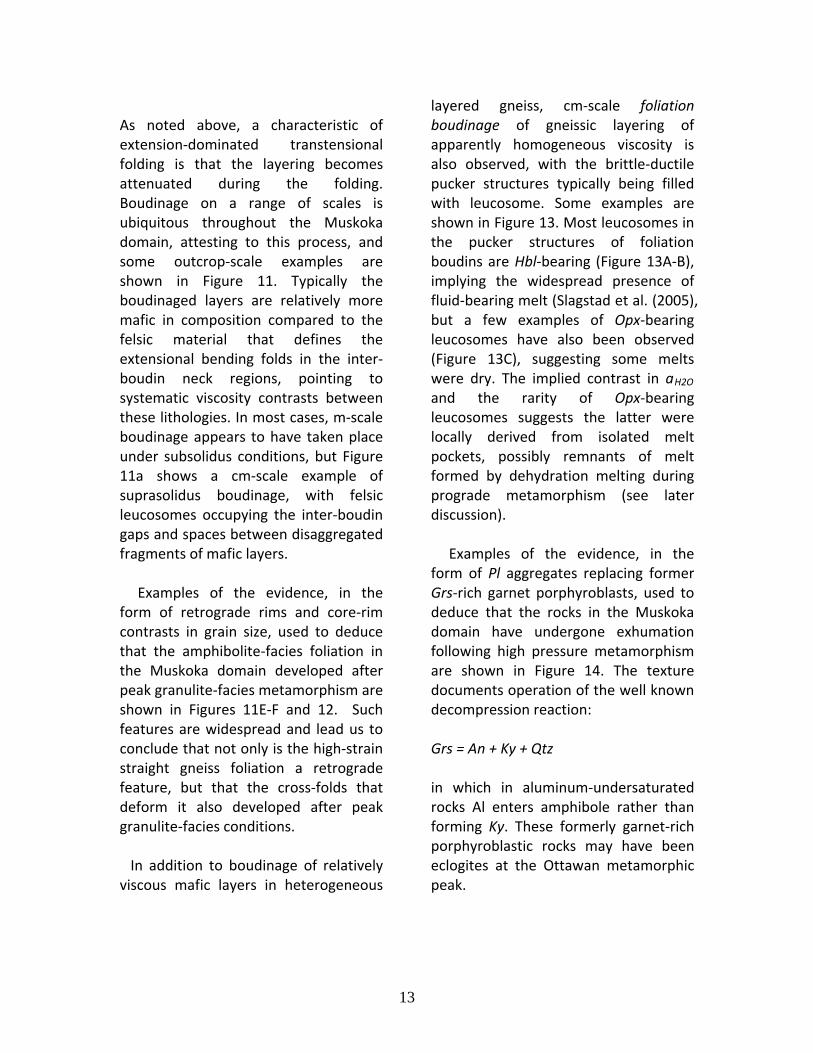
layered gneiss, cm‐scale foliation boudinage of gneissic layering of apparently homogeneous viscosity is also observed, with the brittle‐ductile pucker structures typically being filled with leucosome. Some examples are shown in Figure 13. Most leucosomes in the pucker structures of foliation boudins are Hbl‐bearing (Figure 13A‐B), implying the widespread presence of fluid‐bearing melt (Slagstad et al. (2005), but a few examples of Opx‐bearing leucosomes have also been observed (Figure 13C), suggesting some melts were dry. The implied contrast in aH2O and the rarity of Opx‐bearing leucosomes suggests the latter were locally derived from isolated melt pockets, possibly remnants of melt formed by dehydration melting during prograde metamorphism (see later discussion). Examples of the evidence, in the form of Pl aggregates replacing former Grs‐rich garnet porphyroblasts, used to deduce that the rocks in the Muskoka domain have undergone exhumation following high pressure metamorphism are shown in Figure 14. The texture documents operation of the well known decompression reaction: Grs = An + Ky + Qtz in which in aluminum‐undersaturated rocks Al enters amphibole rather than forming Ky. These formerly garnet‐rich porphyroblastic rocks may have been eclogites at the Ottawan metamorphic peak.
13

Figure 11. Examples of m‐ to cm‐scale boudinage of the straight gneiss layering, Muskoka domain. A: suprasolidus boudinage, with amphibolite boudins and fragments surrounded by Hbl‐bearing granitic leucosome; B‐D: m‐scale boudinage of amphibolite; note difference in boudin separation in B and C, and ‘fishmouth’ boudin in D. E‐F illustrate fracturing and Hbl‐armouring of pyroxene‐bearing boudins, implying retrogression during extension and formation of the straight‐gneiss layering. From Rivers and Schwerdtner (2015).
Figure 12. Outcrop evidence that the amphibolite‐facies straight gneiss fabric in the Muskoka domain is retrograde. A. Annealed Hbl‐rich layers in foliation flowing around a Cpx aggregate with a Hbl rim. B‐D. Coarse‐grained Cpx aggregates with Hbl rims in fine‐grained Hbl±Bt‐bearing foliation. E. Garnet porphyroblasts with Bt tails in strain shadows in aluminous gneiss with fine‐grained Bt foliation. F. Mafic gneiss with peritectic Opx‐bearing leucosome with thin Hbl rim. From Rivers and Schwerdtner (2015).
14
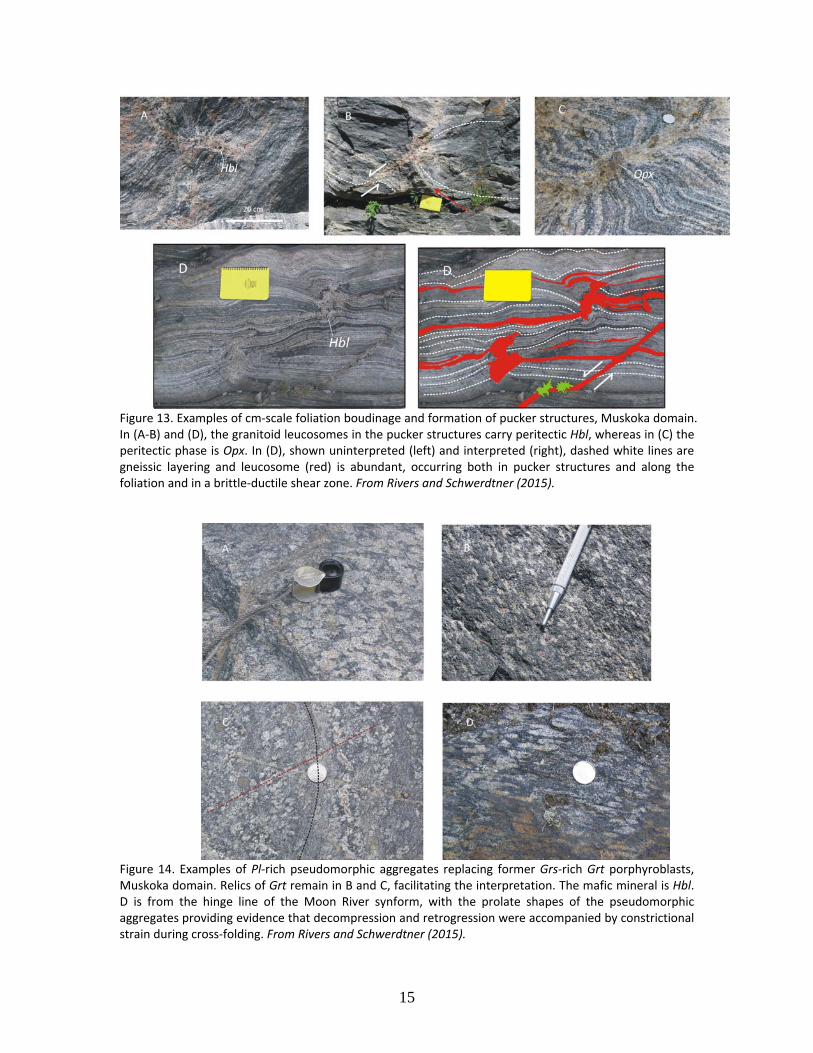
Figure 13. Examples of cm‐scale foliation boudinage and formation of pucker structures, Muskoka domain. In (A‐B) and (D), the granitoid leucosomes in the pucker structures carry peritectic Hbl, whereas in (C) the peritectic phase is Opx. In (D), shown uninterpreted (left) and interpreted (right), dashed white lines are gneissic layering and leucosome (red) is abundant, occurring both in pucker structures and along the foliation and in a brittle‐ductile shear zone. From Rivers and Schwerdtner (2015).
Figure 14. Examples of Pl‐rich pseudomorphic aggregates replacing former Grs‐rich Grt porphyroblasts, Muskoka domain. Relics of Grt remain in B and C, facilitating the interpretation. The mafic mineral is Hbl. D is from the hinge line of the Moon River synform, with the prolate shapes of the pseudomorphic aggregates providing evidence that decompression and retrogression were accompanied by constrictional strain during cross‐folding. From Rivers and Schwerdtner (2015).
15
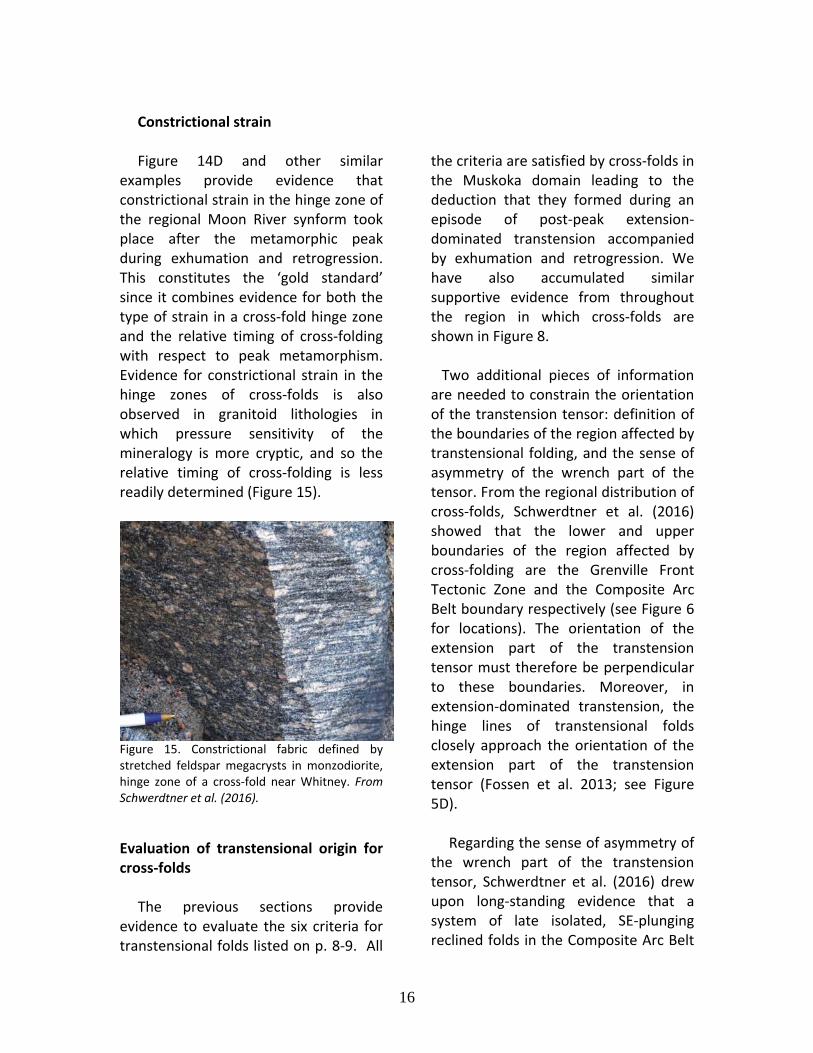
Constrictional strain Figure 14D and other similar examples provide evidence that constrictional strain in the hinge zone of the regional Moon River synform took place after the metamorphic peak during exhumation and retrogression. This constitutes the ‘gold standard’ since it combines evidence for both the type of strain in a cross‐fold hinge zone and the relative timing of cross‐folding with respect to peak metamorphism. Evidence for constrictional strain in the hinge zones of cross‐folds is also observed in granitoid lithologies in which pressure sensitivity of the mineralogy is more cryptic, and so the relative timing of cross‐folding is less readily determined (Figure 15).
16
Figure 15. Constrictional fabric defined by stretched feldspar megacrysts in monzodiorite, hinge zone of a cross‐fold near Whitney. From Schwerdtner et al. (2016).
Evaluation of transtensional origin for cross‐folds The previous sections provide evidence to evaluate the six criteria for transtensional folds listed on p. 8‐9. All
the criteria are satisfied by cross‐folds in the Muskoka domain leading to the deduction that they formed during an episode of post‐peak extension‐dominated transtension accompanied by exhumation and retrogression. We have also accumulated similar supportive evidence from throughout the region in which cross‐folds are shown in Figure 8. Two additional pieces of information are needed to constrain the orientation of the transtension tensor: definition of the boundaries of the region affected by transtensional folding, and the sense of asymmetry of the wrench part of the tensor. From the regional distribution of cross‐folds, Schwerdtner et al. (2016) showed that the lower and upper boundaries of the region affected by cross‐folding are the Grenville Front Tectonic Zone and the Composite Arc Belt boundary respectively (see Figure 6 for locations). The orientation of the extension part of the transtension tensor must therefore be perpendicular to these boundaries. Moreover, in extension‐dominated transtension, the hinge lines of transtensional folds closely approach the orientation of the extension part of the transtension tensor (Fossen et al. 2013; see Figure 5D). Regarding the sense of asymmetry of the wrench part of the transtension tensor, Schwerdtner et al. (2016) drew upon long‐standing evidence that a system of late isolated, SE‐plunging reclined folds in the Composite Arc Belt
boundary formed during an episode of foliation‐parallel sinistral shear (Hanmer 1988; Hanmer and McEachern 1992; Schwerdtner et al. 2010), such that resolution of the NW‐SE‐trending extensional component of the transtension tensor yields a sinistral wrench component on the ENE‐trending
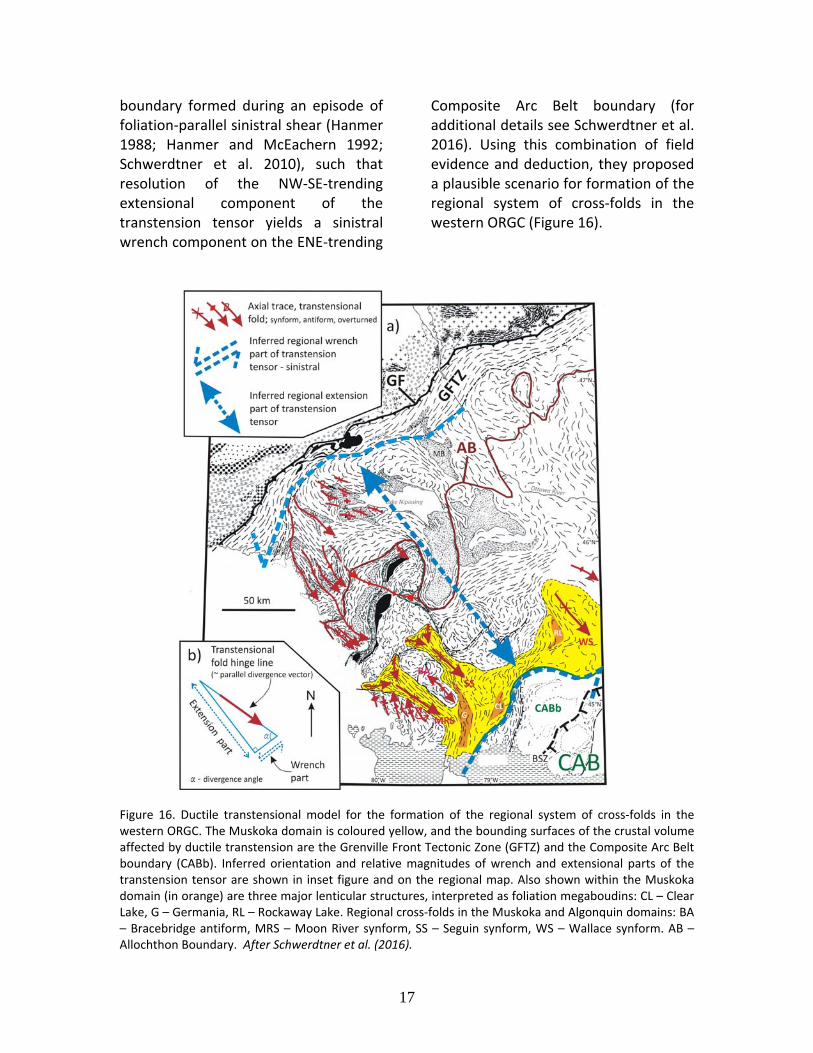
Composite Arc Belt boundary (for additional details see Schwerdtner et al. 2016). Using this combination of field evidence and deduction, they proposed a plausible scenario for formation of the regional system of cross‐folds in the western ORGC (Figure 16).
Figure 16. Ductile transtensional model for the formation of the regional system of cross‐folds in the western ORGC. The Muskoka domain is coloured yellow, and the bounding surfaces of the crustal volume affected by ductile transtension are the Grenville Front Tectonic Zone (GFTZ) and the Composite Arc Belt boundary (CABb). Inferred orientation and relative magnitudes of wrench and extensional parts of the transtension tensor are shown in inset figure and on the regional map. Also shown within the Muskoka domain (in orange) are three major lenticular structures, interpreted as foliation megaboudins: CL – Clear Lake, G – Germania, RL – Rockaway Lake. Regional cross‐folds in the Muskoka and Algonquin domains: BA – Bracebridge antiform, MRS – Moon River synform, SS – Seguin synform, WS – Wallace synform. AB – Allochthon Boundary. After Schwerdtner et al. (2016).
17
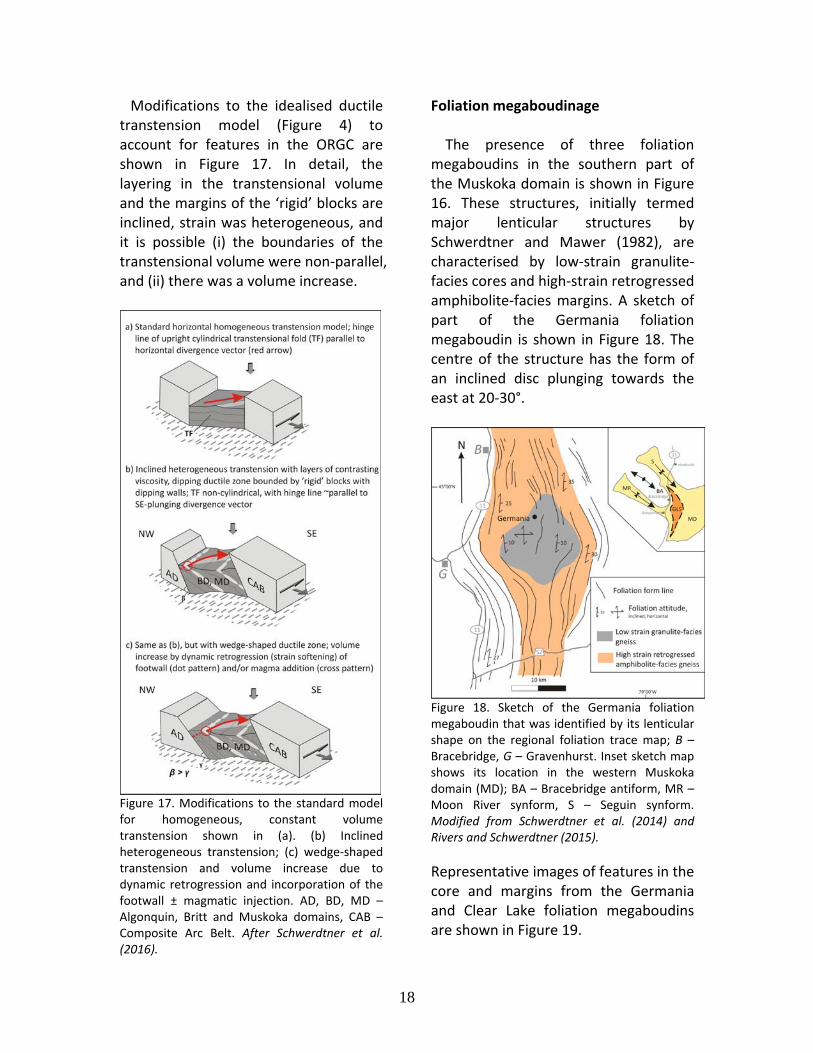
Modifications to the idealised ductile transtension model (Figure 4) to account for features in the ORGC are shown in Figure 17. In detail, the layering in the transtensional volume and the margins of the ‘rigid’ blocks are inclined, strain was heterogeneous, and it is possible (i) the boundaries of the transtensional volume were non‐parallel, and (ii) there was a volume increase.
Figure 17. Modifications to the standard model for homogeneous, constant volume transtension shown in (a). (b) Inclined heterogeneous transtension; (c) wedge‐shaped transtension and volume increase due to dynamic retrogression and incorporation of the footwall ± magmatic injection. AD, BD, MD – Algonquin, Britt and Muskoka domains, CAB – Composite Arc Belt. After Schwerdtner et al. (2016).
Foliation megaboudinage The presence of three foliation megaboudins in the southern part of the Muskoka domain is shown in Figure 16. These structures, initially termed major lenticular structures by Schwerdtner and Mawer (1982), are characterised by low‐strain granulite‐facies cores and high‐strain retrogressed amphibolite‐facies margins. A sketch of part of the Germania foliation megaboudin is shown in Figure 18. The centre of the structure has the form of an inclined disc plunging towards the east at 20‐30°.
Figure 18. Sketch of the Germania foliation megaboudin that was identified by its lenticular shape on the regional foliation trace map; B – Bracebridge, G – Gravenhurst. Inset sketch map shows its location in the western Muskoka domain (MD); BA – Bracebridge antiform, MR – Moon River synform, S – Seguin synform. Modified from Schwerdtner et al. (2014) and Rivers and Schwerdtner (2015).
Representative images of features in the core and margins from the Germania and Clear Lake foliation megaboudins are shown in Figure 19.
18
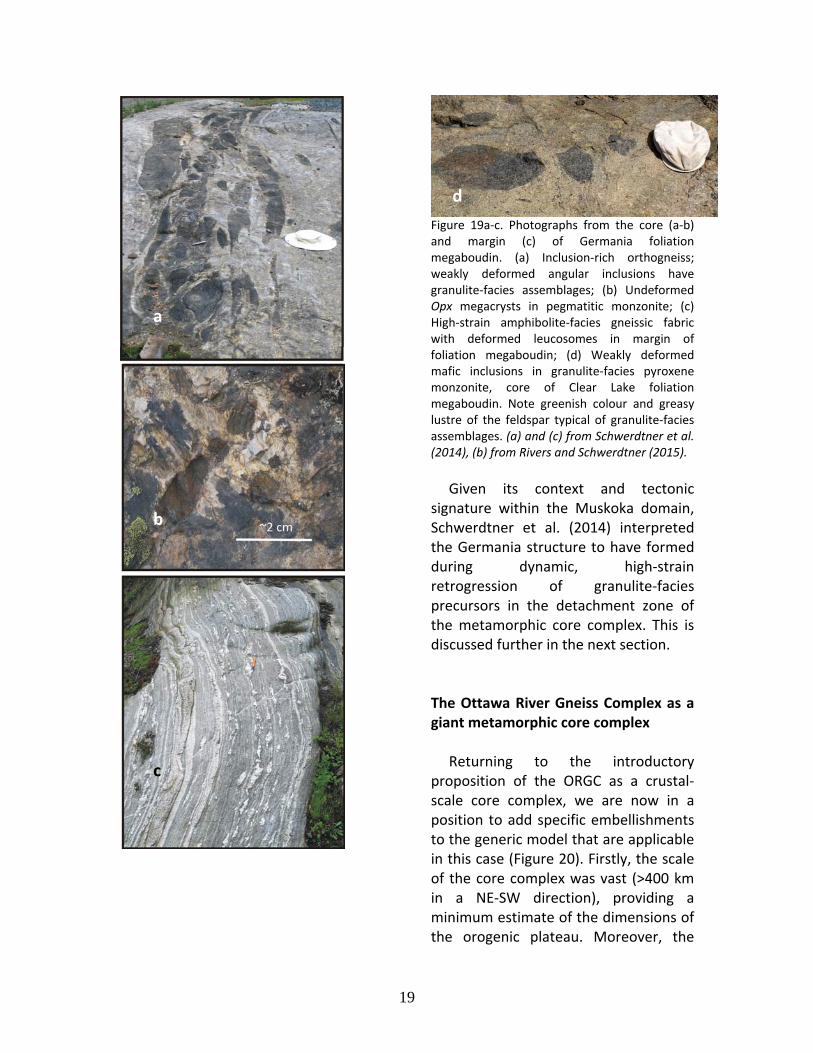
d
Figure 19a‐c. Photographs from the core (a‐b) and margin (c) of Germania foliation megaboudin. (a) Inclusion‐rich orthogneiss; weakly deformed angular inclusions have granulite‐facies assemblages; (b) Undeformed Opx megacrysts in pegmatitic monzonite; (c) High‐strain amphibolite‐facies gneissic fabric with deformed leucosomes in margin of foliation megaboudin; (d) Weakly deformed mafic inclusions in granulite‐facies pyroxene monzonite, core of Clear Lake foliation megaboudin. Note greenish colour and greasy lustre of the feldspar typical of granulite‐facies assemblages. (a) and (c) from Schwerdtner et al. (2014), (b) from Rivers and Schwerdtner (2015).
a
Given its context and tectonic signature within the Muskoka domain, Schwerdtner et al. (2014) interpreted the Germania structure to have formed during dynamic, high‐strain retrogression of granulite‐facies precursors in the detachment zone of the metamorphic core complex. This is discussed further in the next section.
b
The Ottawa River Gneiss Complex as a giant metamorphic core complex Returning to the introductory proposition of the ORGC as a crustal‐scale core complex, we are now in a position to add specific embellishments to the generic model that are applicable in this case (Figure 20). Firstly, the scale of the core complex was vast (>400 km in a NE‐SW direction), providing a minimum estimate of the dimensions of the orogenic plateau. Moreover, the
c
19

detachment zone was ~7 km thick (see Figures 6 and 7). Secondly the red bar on Figure 20A shows schematically the deep level of erosion of the ORGC, such that most of the cover has been removed revealing the underlying detachment zone and core.
Figure 20. A: Generic model of a continental metamorphic core complex, with schematic erosion level appropriate to the ORGC (red bar); after Whitney et al. (2013). B: Sketch of part of a metamorphic core complex with flow lines showing high strain at the top of the core as it becomes reworked in the detachment zone. Elliptical brown lozenges in the detachment zone represent foliation megaboudins; modified from Malavieille (1993). C: Crustal‐scale model of collapsed orogen showing flow lines in the mid and deep crust depicting gravitationally‐driven collapse; after Rey et al. (2001).
Thirdly, the widespread presence of granulite‐facies rocks in the core (e.g., Algonquin domain in Figure 6) with peak
Ottawan metamorphic temperatures of ~850 °C, juxtaposed against the Orogenic Lid in which the maximum temperature during the Ottawan was ≤500 °C, provides a qualitative metric for how much of the mid crust has been excised from the crustal section. Moreover, the visual evidence for intense, post‐peak high‐T ductile flow in the Muskoka domain (e.g., Figures 10‐11) provides a record of the mechanism and conditions by which this excision took place. Derivation of the detachment zone from the top of the hot core is illustrated schematically with flow lines in Figure 20B (modified from Malavieille 1993). In the case of the ORGC, this is compatible with observations of dynamic retrogression of granulite‐facies rocks near the base of the Muskoka domain at several locations (e.g., Rivers and Schwerdtner 2014), and with reports that the Moon River synform deforms the Parry Sound domain at their mutual contact (e.g. Wodicka et al. 2000). Figure 20B also provides a context for the major lenticular structures, such as the Germania foliation megaboudin illustrated in Figure 18 and the two others shown in Figure 16, which were derived from the core by dynamic retrogression, such that their central granulite‐facies remnants are surrounded by high‐strain amphibolite‐facies gneisses within the detachment zone. Figure 20C is a schematic illustration of the results of numerical modelling showing gravitationally‐driven orogenic
20
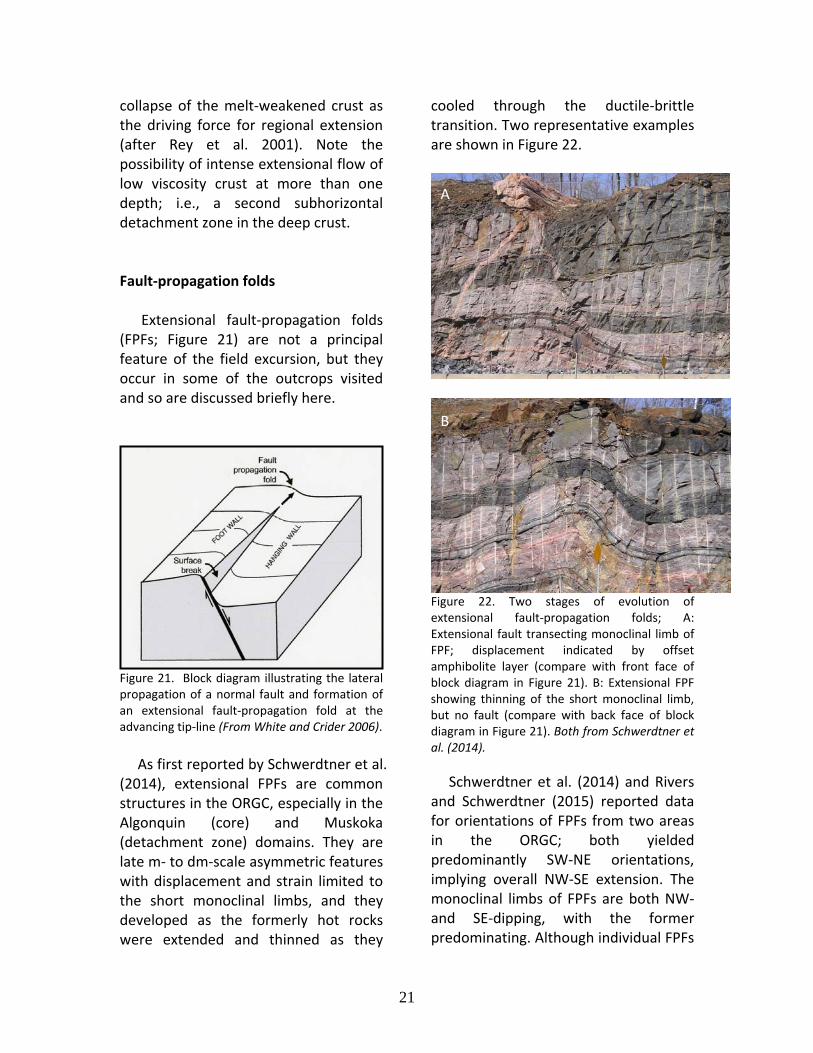
collapse of the melt‐weakened crust as the driving force for regional extension (after Rey et al. 2001). Note the possibility of intense extensional flow of low viscosity crust at more than one depth; i.e., a second subhorizontal detachment zone in the deep crust. Fault‐propagation folds Extensional fault‐propagation folds (FPFs; Figure 21) are not a principal feature of the field excursion, but they occur in some of the outcrops visited and so are discussed briefly here.
Figure 21. Block diagram illustrating the lateral propagation of a normal fault and formation of an extensional fault‐propagation fold at the advancing tip‐line (From White and Crider 2006).
As first reported by Schwerdtner et al. (2014), extensional FPFs are common structures in the ORGC, especially in the Algonquin (core) and Muskoka (detachment zone) domains. They are late m‐ to dm‐scale asymmetric features with displacement and strain limited to the short monoclinal limbs, and they developed as the formerly hot rocks were extended and thinned as they
cooled through the ductile‐brittle transition. Two representative examples are shown in Figure 22.
A
B
Figure 22. Two stages of evolution of extensional fault‐propagation folds; A: Extensional fault transecting monoclinal limb of FPF; displacement indicated by offset amphibolite layer (compare with front face of block diagram in Figure 21). B: Extensional FPF showing thinning of the short monoclinal limb, but no fault (compare with back face of block diagram in Figure 21). Both from Schwerdtner et al. (2014).
Schwerdtner et al. (2014) and Rivers and Schwerdtner (2015) reported data for orientations of FPFs from two areas in the ORGC; both yielded predominantly SW‐NE orientations, implying overall NW‐SE extension. The monoclinal limbs of FPFs are both NW‐ and SE‐dipping, with the former predominating. Although individual FPFs
21

represent limited extension of a few metres or less, they are common structures and their effect in toto is unknown.
The short monoclinal limbs of FPFs, and less commonly their axial surfaces, are sites of granite pegmatite dykes from <1 to 15 m wide, implying that when they formed the underlying crust in the metamorphic core contained abundant pockets of water‐saturated granitoid magma above its solidus. Some examples are shown in Figures 23 and 22A (in which dykes are parallel to the short monoclinal limbs and the axial surface of an FPF, respectively).
B
PFs with granite pegmatite dykes injected along their short monoclinal limbs; dip of gneissic layering is enhanced by dashed white lines to show sense of displacement at FPF. Red dots in (A) represent piercing points. (A) from Schwerdtner et al. (2014), (B‐D) from Rivers and Schwerdtner (2015).
A simple model for the emplacement mechanism of the pegmatite dykes in FPFs is presented in Figure 24.
Figure 23. Examples of dm‐scale extensional
C
A
F
D
22
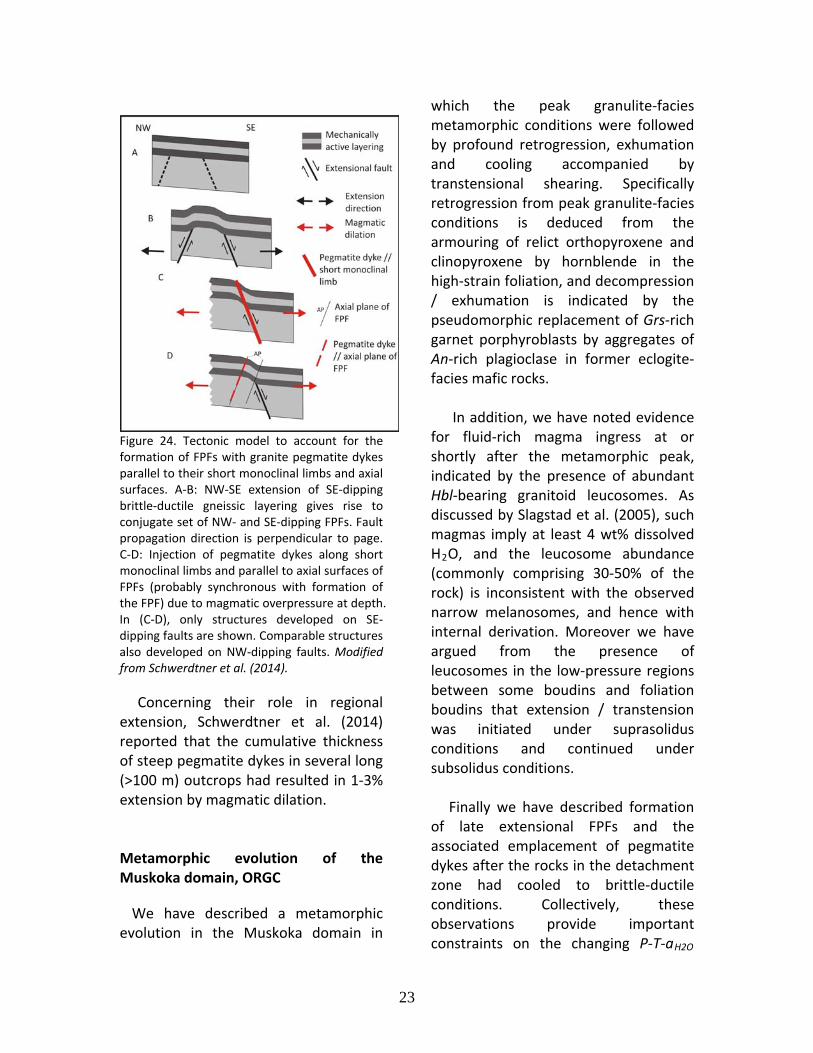
Figure 24. Tectonic model to account for the formation of FPFs with granite pegmatite dykes parallel to their short monoclinal limbs and axial surfaces. A‐B: NW‐SE extension of SE‐dipping brittle‐ductile gneissic layering gives rise to conjugate set of NW‐ and SE‐dipping FPFs. Fault propagation direction is perpendicular to page. C‐D: Injection of pegmatite dykes along short monoclinal limbs and parallel to axial surfaces of FPFs (probably synchronous with formation of the FPF) due to magmatic overpressure at depth.In (C‐D), only structures developed on SE‐dipping faults are shown. Comparable structures also developed on NW‐dipping fa
ults. Modified om Schwerdtner et al. (2014).
1‐3% xtension by magmatic dilation.
n of the uskoka domain, ORGC
on th
n a
i ,
in former eclogite‐cies mafic rocks.
n
d on a
te / un
under ubsolidus conditions.
c
t coo tle‐d
Collectively,
constraints on the changing P‐T‐aH2O
fr
Concerning their role in regional extension, Schwerdtner et al. (2014) reported that the cumulative thickness of steep pegmatite dykes in several long (>100 m) outcrops had resulted ine Metamorphic evolutioM
We have described a metamorphic evoluti in e Muskoka domain in
which the peak granulite‐facies metamorphic conditions were followed by profound retrogression, exhumation and cooling accompanied by transtensional shearing. Specifically retrogressio from peak granulite‐f cies conditions is deduced from the armouring of relict orthopyroxene and clinopyroxene by hornblende in the high‐strain foliat on and decompression / exhumation is indicated by the pseudomorphic replacement of Grs‐rich garnet porphyroblasts by aggregates of An‐rich plagioclase fa I addition, we have noted evidence for fluid‐rich magma ingress at or shortly after the metamorphic peak, indicated by the presence of abundant Hbl‐bearing granitoid leucosomes. As discussed by Slagstad et al. (2005), such magmas imply at least 4 wt% dissolved H2O, and the leucosome abundance (commonly comprising 30‐50% of the rock) is inconsistent with the observed narrow melanosomes, and hence with internal erivati . Moreover we h ve argued from the presence of leucosomes in the low‐pressure regions between some boudins and foliation boudins that ex nsion transtension was initiated der suprasolidus conditions and continueds Finally we have des ribed formation of late extensional FPFs and the associated emplacement of pegmatite dykes after he rocks in the detachment zone had led to brit uctile conditions. these observations provide important
23
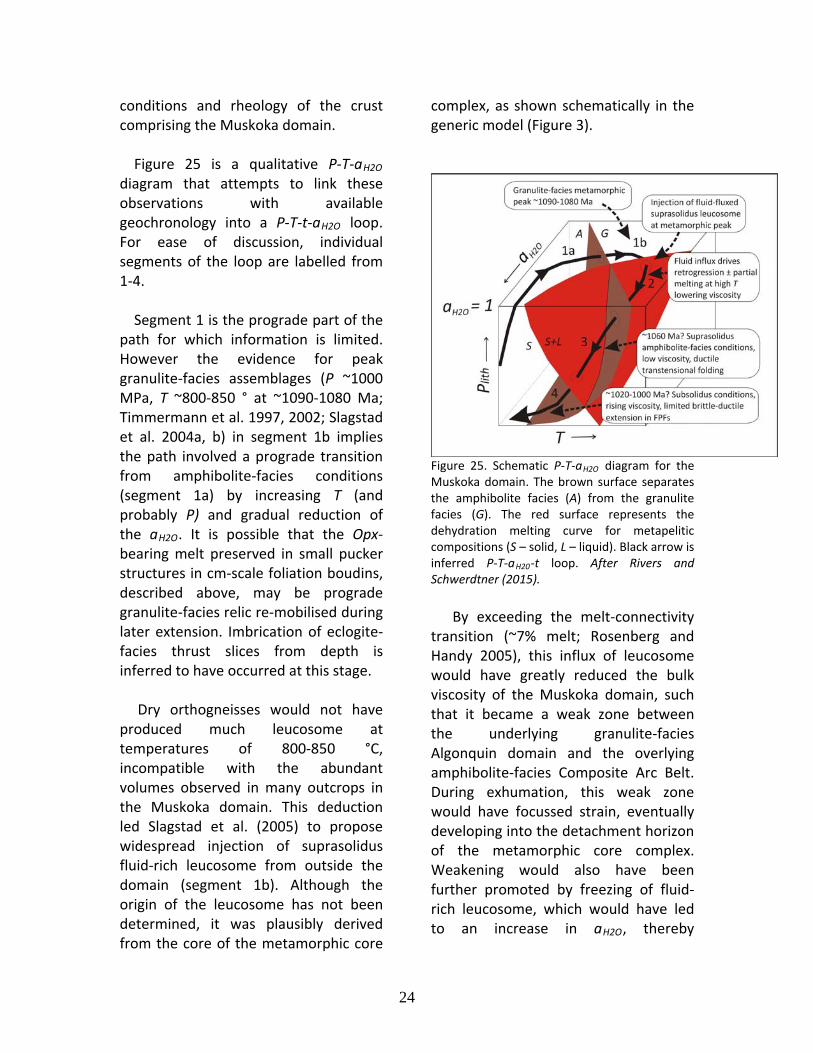
conditions and rheology of the crust comprising the Muskoka domain. Figure 25 is a qualitative P‐T‐aH2O diagram that attempts to link these observations with available geochronology into a P‐T‐t‐aH2O loop. For ease of discussion, individual segments of the loop are labelled from 1‐4. Segment 1 is the prograde part of the path for which information is limited. However the evidence for peak granulite‐facies assemblages (P ~1000 MPa, T ~800‐850 ° at ~1090‐1080 Ma; Timmermann et al. 1997, 2002; Slagstad et al. 2004a, b) in segment 1b implies the path involved a prograde transition from amphibolite‐facies conditions (segment 1a) by increasing T (and probably P) and gradual reduction of the aH2O. It is possible that the Opx‐bearing melt preserved in small pucker structures in cm‐scale foliation boudins, described above, may be prograde granulite‐facies relic re‐mobilised during later extension. Imbrication of eclogite‐facies thrust slices from depth is inferred to have occurred at this stage. Dry orthogneisses would not have produced much leucosome at temperatures of 800‐850 °C, incompatible with the abundant volumes observed in many outcrops in the Muskoka domain. This deduction led Slagstad et al. (2005) to propose widespread injection of suprasolidus fluid‐rich leucosome from outside the domain (segment 1b). Although the origin of the leucosome has not been determined, it was plausibly derived from the core of the metamorphic core
complex, as shown schematically in the generic model (Figure 3).
Figure 25. Schematic P‐T‐aH2O diagram for the Muskoka domain. The brown surface separates the amphibolite facies (A) from the granulite facies (G). The red surface represents the dehydration melting curve for metapelitic compositions (S – solid, L – liquid). Black arrow is inferred P‐T‐aH20‐t loop. After Rivers and Schwerdtner (2015).
By exceeding the melt‐connectivity transition (~7% melt; Rosenberg and Handy 2005), this influx of leucosome would have greatly reduced the bulk viscosity of the Muskoka domain, such that it became a weak zone between the underlying granulite‐facies Algonquin domain and the overlying amphibolite‐facies Composite Arc Belt. During exhumation, this weak zone would have focussed strain, eventually developing into the detachment horizon of the metamorphic core complex. Weakening would also have been further promoted by freezing of fluid‐rich leucosome, which would have led to an increase in aH2O, thereby
24

promoting pervasive retrogression and recrystallization (segment 2). The timing of initiation of retrogression and decompression is not well constrained, but retrogression may have been underway by ~1060 Ma (Bussy et al. 1995; Timmermann et al. 1997, 2002; Slagstad et al. 2004a, b), and was probably pervasive in much of the domain by ~1020 Ma (Ketchum et al. 1998). There are no robust constraints on the timing of the transition from suprasolidus to subsolidus conditions (segments 3 and 4 respectively), but formation of subsolidus brittle‐ductile extensional FPFs in segment 4 probably occurred between 1020‐1000 Ma. In summary, the post‐peak part of the P‐T‐aH2O loop implies gradual, but profound changes in these variables over an interval of ~90 Ma, the long duration bracketing both the period of high‐temperature cooling of the deep crust from ≥800 °C to ~500 °C and gravitationally‐driven orogenic collapse. This implies cooling was very slow (~3 °C.Ma‐1), presumably due to high heat flow resulting from the large thermal mass of the underlying deeply buried lower crust. As we have seen, these changes in P‐T‐aH2O promoted and accompanied equally significant changes in the viscosity of the Muskoka domain, with profound weakening at the metamorphic peak being followed by gradual strengthening during cooling and freezing of leucosomes. The role of the Muskoka domain as a low‐viscosity, melt‐weakened zone has been proposed previously by others (e.g., Timmermann et al. 1997; 2002;
Slagstad et al. 2004b, 2005; Jamieson et al. 2007, 2010), but in a different context. These authors interpreted the melt‐weakening to have developed during the prograde segment of the P‐T‐t path and suggested that the Muskoka domain could represent the site of the channel during channel flow. We do not deny the feasibility of this proposition, but given that we have interpreted most of the dominant structure and metamorphism in the Muskoka domain to be post‐peak, we have not seen convincing evidence to support it either. In summary, we feel that the data better support the deduction that the Muskoka domain was the site of the detachment zone in a regional post‐peak metamorphic core complex. Collapsed LHO hypothesis Despite the need for much additional study to fill in details, we believe the available data support the interpretation of the ORGC as a giant metamorphic core complex. The deduction that its upper level, the Muskoka domain, forms the detachment zone separating the core from the overlying cover composed of the Composite Arc Belt provides a coherent context for the post‐peak development of the cross‐folds and foliation megaboudins that are the foci of this field excursion. However, we acknowledge that unlike the Adirondack Highlands domain the ORGC does not have the typical domical shape of a metamorphic core complex indicative of formation by extensional bending. As noted in the caption to Figure 2, we
25
26
interpret this to be due to later thrusting and imbrication of its northwest margin during the Rigolet phase of the Grenvillian Orogeny at ~1000‐980 Ma. If we are correct in this deduction, it would appear that the western Grenville Province is one of the best and most profound examples of a collapsed large hot orogen described so far. The Collapsed LHO hypothesis (Rivers 2015) is testable and it is our hope that this field guide will provide an introduction that stimulates others to engage in its rigorous evaluation. Acknowledgements and a concluding comment We thank Dennis Waddington for assembling Table 1 in Part 2 of the field guide and for a careful review of the manuscript. The ideas presented here are the product of several decades of field mapping and follow‐up laboratory studies by the authors and many many others, discussions with colleagues in a range of disciplines, and a distillation of what we have considered to be relevant
literature over the years. Since the availability of crustal‐scale seismic data in ~1990 and numerical modelling of orogenesis and orogenic collapse a few years later, we have been mindful of the scale of some deep‐crustal processes and have endeavoured to enlarge our horizons accordingly. However, in so doing it becomes necessary to generalise results and interpretations to a regional scale, making them more difficult to substantiate in detail – the classical scale problem in geology. In this context, we note that the deductions of km‐scale cross‐folds and megaboudins described in this field guide are supported by abundant evidence for geometrically similar structures at the m‐ and dm‐scales observed in outcrop. This self‐similarity across order‐of‐magnitude variations in scale is encouraging, of course, but it must be borne in mind that gravitationally‐driven orogenic collapse is by definition a large‐scale process and robust manifestation of its operation in the ORGC and elsewhere in the Grenville Orogen will require integration of many additional detailed and regional studies.
References Beaumont, C., Nguyen, M.H., Jamieson, R.A., and Ellis, S. 2006. Crustal flow modes in large hot orogens. In Channel Flow, Ductile Extrusion and Exhumation in Continental Collision Zones. Edited by R.D. Law, M.P. Searle, and L. Godin. Geological Society of London, Special Publication 268: 91‐145. Bussy, F., Krogh, T.E., Klemens, W.P., and Schwerdtner, W,M. 1995. Tectonic and metamorphic events in the westernmost Grenville Province, central Ontario: new results from high‐precision zircon geochronology. Canadian Journal of Earth Sciences, 32, 660‐671. doi:10.1139/e95‐055. Carr, S.D., Easton, R.M., Jamieson, R.A., and Culshaw, N.G. 2000. Geologic transect across the Grenville orogen of Ontario and New York. Canadian Journal of Earth Sciences, 37: 193‐216. Culshaw, N.G., Davidson, A., and Nadeau, L. 1983. Structural subdivisions in the Parry Sound – Algonquin region, Ontario. In Current Research, Part B. Geological Survey of Canada, Paper 83 – 1B, 243‐252. Culshaw, N G., Ketchum, J.W.F., Wodicka, N., and Wallace, P. 1994. Deep‐crustal ductile extension following thrusting in the southwestern Grenville Province, Ontario. Canadian Journal of Earth Sciences, 31: 160‐175. Culshaw, N.G., Jamieson, R.A., Ketchum, J.W.F., Wodicka, N., Corrigan, D., and Reynolds, P.H. 1997. Transect across the southwestern Grenville orogen, Georgian Bay, Ontario: polystage convergence and extension in the lower orogenic crust. Tectonics, 16: 966‐982. Davidson, A., 1984. Identification of ductile shear zones in the southwestern Grenville Province of the Canadian Shield. In Precambrian Tectonics Illustrated. Edited by A. Kröner and R. Greiling. E. Schweizerbart’sche
Verlagsbuchhandlung, Stuttgart, Germany, 263‐279. Davidson, A., Culshaw, N.G., Nadeau, L. 1982. A tectono‐metamorphic framework for part of the Grenville Province, Ontario. In Current Research, Part A. Geological Survey of Canada, Paper 82‐1A, 275‐290. Dickin, A.P. and McNutt, R.H. 1990. Nd model age mapping of Grenville lithotectonic domains: Mid‐Proterozoic crustal evolution in Ontario. In Mid‐Proterozoic Laurentia‐Baltica, edited by Gower, C.F, Rivers, T., and Ryan, A.B., Geological Association of Canada, Special Paper 38: 79‐94. Dickin, A.P., Moretton, K., and North, R. 2008. Isotopic mapping of the Allochthon Boundary Thrust in the Grenville Province of Ontario, Canada. Precambrian Research: 167, 260‐266. Dickin, A.P., Herrell, M., Moore, E., Cooper, D., and Pearson, S. 2014. Nd isotope mapping of allochthonous Grenvillian klippen: Evidence for widespread ‘ramp‐flat’ thrust geometry in the SW Grenville Province. Precambrian Research, 246: 268‐280. Fossen, H., Teyssier, C., and Whitney, D.L. 2013. Transtensional folding. Journal of Structural Geology, 56: 89‐102. Gower, R.J.W. 1992. Nappe emplacement direction in the Central Gneiss Belt, Grenville Province, Ontario, Canada; evidence for oblique collision. Precambrian Research, 59: 73‐94. Hanmer, S. 1988. Ductile thrusting at mid‐crustal level. Canadian Journal of Earth Sciences, 25: 1049‐1059. Hanmer, S. and McEachern, S. 1992. Kinematical and rheological evolution of a crustal‐scale ductile thrust zone, Central Metasedimentary Belt, Grenville orogen, Ontario. Canadian Journal of Earth Sciences, 29: 1779‐1790.
27

Hynes, A., and Rivers, T. 2010. Protracted continental collision–evidence from the Grenville Orogen. Canadian Journal of Earth Sciences, 47: 592‐620. Jamieson, R.A., Beaumont, C., Nguyen, M.H., and Culshaw, N.G. 2007. Synconvergent ductile flow in variable‐strength ductile crust: Numerical models with application to the western Grenville orogen. Tectonics 26, TC5005, 1‐23. Jamieson, R.A., Beaumont, C., Warren, C.J. and Nguyen, M.H. 2010. The Grenville orogen explained? Applications and limitations of integrating numerical models with geological and geophysical data. Canadian Journal of Earth Sciences, 47: 517‐539. Ketchum, J.W.F., Heaman, L.M., Krogh, T.E., Culshaw, N.G., and Jamieson, R.A. 1998. Timing and thermal influence of late orogenic extension in the lower crust: a U‐Pb geochronological study from the southwest Grenville orogen, Canada. Precambrian Research, 89: 25‐45.
Lumbers, S.B., 1969. Burwash, Nipissing, Parry Sound and Sudbury districts. Map 2271, scale 1:126,720 (I inch to 2 miles). Ontario Geological Survey.
Lumbers, S.B. 1996. Mapping Muskoka’s rocks. Rotunda Magazine (Royal Ontario Museum, Toronto), 29: 27‐35. Lumbers, S.B., and Vertolli, V.M. 2000a. Precambrian geology, Bracebridge area. Ontario Geological Survey, Preliminary Map P.3412, NTS: 31E/4, scale 1:50,000. Lumbers, S.B., and Vertolli, V.M. 2000b. Precambrian geology, Lake Joseph area. Ontario Geological Survey, Preliminary Map P.3411, NTS: 31E/3, scale 1:50,000. Lumbers, S.B., Vertolli, V.M., and Schwerdtner, W.M. 2000. Precambrian geology, Gravenhurst area. Ontario Geological Survey,
Preliminary Map P.3409, NTS: 31D/14, scale 1:50,000. Malavieille, J. 1993. Late orogenic extension in mountain belts: insights from the Basin and Range and the late Paleozoic Variscan belts. Tectonics, 12 (5): 1115‐1130. doi: 10.1029.93TC01129. McMullen, S.M. 1999. Tectonic evolution of the Bark Lake area, eastern Central Gneiss Belt, Ontario Grenville: Constraints from geology, geochemistry and U‐Pb geochronology. MSc thesis, Carleton University, Ottawa, ON. 175p. Nadeau, L. and van Breemen, O. 1998. Plutonic ages and tectonic setting of the Algonquin and Muskoka allochthons, Central Gneiss Belt, Grenville Province, Ontario. Canadian Journal of Earth Sciences, 35: 1423‐1438. Rey, P., Vanderhaegue, O., and Teyssier, C. 2001. Gravitational collapse of the continental crust: definition, regimes and modes. Tectonophysics, 342: 435‐449.
Rivers, T. 2008. Assembly and preservation of lower, mid and upper orogenic crust in the Grenville Province–implications for the evolution of large hot long‐duration orogens. Precambrian Research, 167 (3‐4): 237‐259. doi:10.1016/j.precambres.2008.08.005 Rivers, T. 2012. Upper‐crustal orogenic lid and mid‐crustal core complexes: signature of a collapsed orogenic plateau in the hinterland of the Grenville Province. Canadian Journal of Earth Sciences 49: 1‐42. doi: 10.1139/E11‐114
Rivers, T. 2015. Tectonic setting and evolution of the Grenville Orogen: An assessment of progress over the last 40 years. Geoscience Canada, 42: 77‐124. http://dx.doi.org/10.12789/geocanj.2014.41.057
28

Rivers, T., and Schwerdtner, W.S. 2014. New ideas on the post‐peak development of the Central Gneiss Belt in the Muskoka Region. Friends of the Grenville field trip guide, 45p. Accessible at <friendsofthegrenville.org>
Rivers, T., and Schwerdtner, W.S. 2015. Post‐peak evolution of the Muskoka domain, western Grenville Province: ductile detachment in a crustal‐scale metamorphic core complex. Geoscience Canada, 42: 403‐436. doi.org/10.12789/geocanj.2015.42.080
Rivers, T., Culshaw, N.G., Hynes, A., Indares, A. Jamieson, R., and Martignole, J. 2012. The Grenville Orogen – a post‐Lithoprobe perspective. In Tectonic Styles in Canada: the Lithoprobe perspective, edited by J.A. Percival, F.A. Cook, and R.M. Cloves. Geological Association of Canada, Special Paper 49, 97‐238. Rosenberg, C.L., and Handy, M.R. 2005. Experimental deformation of partially melted granite revisited: implications for the continental crust. Journal of Metamorphic Geology, 23: 19‐28. doi:10.1111/j.1525‐1315.2005.00555.x Schwerdtner, W.M., and Mawer, C. K. 1982. Geology of the Gravenhurst region, Grenville Structural Province, Ontario. In Current Research, part B. Geological Survey of Canada, Paper 82‐1B, 197‐207. Schwerdtner, W.M., Lu, S.J. and Landa, D., 2010. S/Z buckle folds as shear‐sense indicators in the ductile realm: Field examples from the Grenville Province of Ontario and the Appalachians of South Carolina. In: From Rodinia to Pangea: The Lithotectonic Record of the Appalachian Region, Geological Society of America. Edited by Tollo, R.P., Bartholomew, M.J., Hibbard, J.P., and Karabinos, P.M., Geological Society of America, Boulder, Colorado. Memoir 206, 773‐794. doi:10.1130/2010.1206 (30). Schwerdtner, W.M., Rivers, T., Zeeman, B., Wang, C.C., Tsolas, J., Yang, J., and Ahmed, M.
2014. Post‐convergent structures in lower parts of the 1090‐1050 Ma (early‐Ottawan) thrust‐sheet stack, Grenville Province of Ontario, southern Canadian Shield. Canadian Journal of Earth Sciences, 51: 243‐265. dx.doi.org/10.1139/cjes‐2013‐0108. Schwerdtner, W.M., Rivers, T., Tsolas, J., Waddington, D.H., Page, S., and Yang, J. 2016. Transtensional origin of multi‐order cross‐folds in a high grade gneiss terrane, southwestern Grenville Province: formation during post‐peak gravitational collapse. Canadian Journal of Earth Sciences. Published 29 July 2016 in electronic form; currently available at e‐First on the CJES website. Slagstad, T., Culshaw, N.G., Jamieson, R.A., and Ketchum, J.W.F. 2004a. Early Proterozoic tectonic history of the southwestern Grenville Province, Ontario: Constraints from geochemistry and geochronology of high‐grade gneisses. In Proterozoic tectonic evolution of the Grenville orogen in North America, edited by Tollo, R.P., Corriveau, L., McLelland, J., and Bartholomew, M.J., Geological Society of America, Boulder, Colorado, Memoir 197: 209‐241. Slagstad, T., Hamilton, M.A., Jamieson, R.A., and Culshaw, N.G. 2004b. Timing and duration of melting in the mid orogenic crust: Constraints from U‐Pb (SHRIMP) data, Muskoka and Shawanaga domains, Grenville Province, Ontario, Canadian Journal of Earth Sciences, 41: 1339‐1365. Slagstad, T., Jamieson, R.A., and Culshaw, N.G. 2005. Formation, crystallization and migration of melt in the mid‐orogenic crust: Muskoka domain migmatites, Grenville Province, Ontario. Journal of Petrology, 46: 1339‐1365. http://dx.doi.org/10.1139/e04‐068. Slagstad, T., Culshaw, N.G., Daly, J.S., and Jamieson, R.A. 2009. Western Grenville Province holds key to midcontinental Granite‐Rhyolite Province enigma. Terra Nova, 21: 181‐187.
29
Timmermann, H., Parrish, R.R., Jamieson, R.A., and Culshaw, N.G. 1997. Time of metamorphism beneath the Central Metasedimentary Belt Boundary Thrust Zone, Grenville Orogen, Ontario: Accretion at 1080 Ma? Canadian Journal of Earth Sciences, 34: 1023‐1029. Timmermann, H., Jamieson, R.A., Parrish, R.R., Culshaw, N.G. 2002. Coeval migmatites and granulites, Muskoka domain, southwestern Grenville Province, Ontario. Canadian Journal of Earth Sciences, 39: 239‐258. White, D.J., Forsyth, A.D., Asudeh, I., Carr, S.D., Wu, H., Easton, R.M., and Mereu, R.F. 2000. A seismic‐based cross‐section of the Grenville orogen in southern Ontario and western Québec. Canadian Journal of Earth Sciences, 37: 183‐192. White, I.R., and Crider, J.G. 2006. Extensional fault‐propagation folds: mechanical models and observations from the Modoc Plateau, northeastern California. Journal of Structural Geology, 28: 1352‐1370. doi: 10.1016.j.jsg2006.03.028 Whitney, D.L., Teyssier, C., Rey, P., and Buck, W.R. 2013. Continental and oceanic core complexes. GSA Bulletin, 125: 273‐298. Wodicka, N., Parrish, Ketchum, J.W.F., Jamieson, R.A. 2000. Grenvillian metamorphism of monocyclic rocks, Georgian Bay, Ontario, Canada: implications for convergence history. Canadian Mineralogist, 38: 471‐510. Wynne‐Edwards, H.R. 1972. The Grenville Province. In Variations in Tectonic Styles in Canada. Edited by R.A. Price and R.J.W. Douglas, Geological Association of Canada, Special Paper 11, p. 263‐334.
30
31
Part 2
FIELD GUIDE
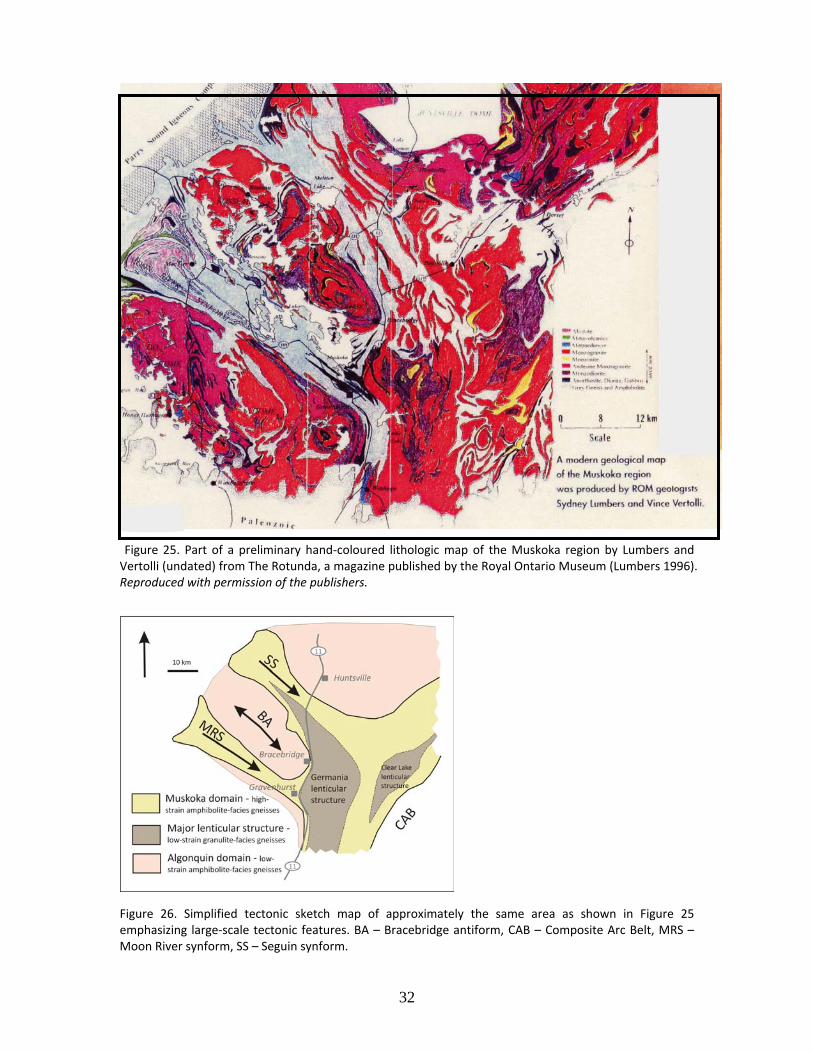
Figure 25. Part of a preliminary hand‐coloured lithologic map of the Muskoka region by Lumbers and Vertolli (undated) from The Rotunda, a magazine published by the Royal Ontario Museum (Lumbers 1996). Reproduced with permission of the publishers.
Figure 26. Simplified tectonic sketch map of approximately the same area as shown in Figure 25 emphasizing large‐scale tectonic features. BA – Bracebridge antiform, CAB – Composite Arc Belt, MRS – Moon River synform, SS – Seguin synform.
32
Regional geology The geological map (Figure 25) provides an example of the complexity of the ORGC on a regional scale and the difficulty, rigour and artistic talent required to portray the geology of a gneiss complex. As with many survey maps, this is a lithological map – Lumbers mapped lithologies systematically and precisely, naming units after their inferred protoliths. Most units in the map area are orthogneisses, coloured as follows: yellow is monzonite, the two red shades are monzogranite and andesine monzogranite, dark purple is monzodiorite, black is anorthosite, diorite and gabbro, grey is grey gneiss and amphibolite. Note that although given protolith names, all units exhibit foliated to gneissic textures, as readily deduced from their flowing shapes. Information in the following paragraphs about the age, chemistry and isotopic signature of the main units was obtained from map legends in Lumbers and Vertolli (2000a, b) and Lumbers et al. (2000) and the journal literature (modified from Rivers and Schwerdtner 2014). The several map units can be reduced to two main groups, Grey gneiss and an AMCG suite. Grey gneiss: Composite heterogeneous unit composed of variable proportions of dioritic, granodioritic to tonalitic gneiss with amphibolite layers and inclusions. Slivers of probable metasedimentary rocks (mostly marble) occur locally. Unit is variably gneissic due to partial melting and injection, and commonly layered due to high strain.
Monzonite, monzogranite, andesine monzogranite, monzodiorite, anorthosite, diorite and gabbro – components of an AMCG suite. More homogeneous units with local preservation of relict igneous textures, they are generally foliated/lineated and locally flaggy in areas of high strain. The felsic varieties are difficult to distinguish from each other without knowledge of modal abundances of quartz and feldspars and plagioclase composition, but they are generally less pervasively gneissic than Grey gneiss. Geochronological determinations of the crystallization age of the Grey gneiss unit suggest it is ≥1460 Ma, whereas the AMCG suite was emplaced between ~1460‐1430 Ma (e.g., Nadeau and van Breemen 1998; McMullen 1999; Slagstad et al. 2004a). Both units exhibit evidence for high‐grade metamorphism (granulite to amphibolite facies) that is inferred from geochronological data to have taken place during the Ottawan phase of the Grenvillian Orogeny (~1090‐1020 Ma), e.g., Timmermann et al. 1997, 2002; McMullen 1999; Slagstad et al. 2004a, 2009). Geochemical analyses indicate the major components of the Grey gneiss exhibit chemical coherence, supporting their grouping into a suite and linkage by fractional crystallization (Slagstad et al. 2004a, 2009). Major element analyses indicate the suite exhibits a calc‐alkaline trend, has SiO2 from ~47‐71 wt.%, FeOt/(FeOt+MgO) ratios <0.8, and straddles t boundary between metaluminous and peraluminous compositions, all features typical of
he
33
continental arcs (Slagstad et al. 2004a). Trace element abundances normalized against primitive mantle are characterised by negative Nb, P, and Ti anomalies, typical of magmatic arcs in general (Slagstad et al. 2004a). On the other hand, mafic inclusions and layers in the suite are tholeiitic and have REE patterns similar to continental flood basalts, leading Slagstad et al. (2004a) to suggest they formed from a basaltic underplate derived by asthenospheric melting. The grey gneisses have yielded Nd model ages normalised to depleted mantle (tDM) in the range 1.6‐1.5 Ga (Dickin and McNutt 1990; Dickin et al. 2008, 2014; Slagstad et al. 2009), that are only slightly older than their crystallization ages (1480‐1430 Ma; Timmermann et al. 1997; Nadeau and van Breemen 1998; McMullen 1999), implying they are juvenile. Collectively, these data have been interpreted to imply the Grey gneiss suite composed the plutonic part of a continental‐margin arc on SE Laurentia during the Mesoproterozoic (e.g., Carr et al. 2000; Muskoka arc of Slagstad al. 2009). The AMCG suite, on the other hand, exhibits an A‐type trend with enrichment of Fe, F and HFSE, and the occurrence of alkali‐rich amphibole and pyroxene. Nd model ages (tDM) for these intrusions are also juvenile, in the range 1.5‐1.4 Ga, and Slagstad et al. (2009) considered they likely developed inboard of the continental margin in an extended back‐arc setting.
Lithologic versus lithotectonic mapping Apart from Figure 25, all the maps in this guide are lithotectonic maps, designed to emphasize the large‐scale structures and tectonic relationships. For instance, Figure 26 is a very simplified lithotectonic sketch map of approximately the same area as Figure 25. Note that the NW‐trending Moon River synform underlain by Grey gneiss shows up clearly on Lumbers and Vertolli’s lithological map, the circular outlines of refolded monzodiorite sheets defining the Bracebridge antiform are apparent, as are the outlines of the Germania and Clear Lake major lenticular structures. However, the Seguin synform had not yet been clearly identified by Lumbers at the time of publication. It is instructive to consider the differences between Figures 25 and 26 and how the latter was derived. Although as noted some features illustrated on Figure 26 are visible in Figure 25, the legend of the former figure shows that the tectonic sketches also embody linked information on metamorphic conditions, including prograde / retrograde evolution, and structural features including fabric orientation, intensity of strain, the nature and distribution of L‐S shape fabrics, and cross‐folds and foliation megaboudins in this case. Moreover, as shown by Schwerdtner et al. (2016), the regional cross‐folds also exhibit a distinctive negative signature on magnetic maps (especially the first vertical derivative of the magnetic gradient). No single map has yet been devised to effectively show all these
34
features, although there is an obvious role for GIS and the superposition of overlays with different types of information. The take‐home message from Figures 25 and 26 and the field trip in general is the old one that careful observation and
mapping of outcrop‐scale features can yield essential information about the regional tectonic evolution. We encourage participants to look carefully at the outcrops and come prepared to scale‐up interpretations to features of regional scale.
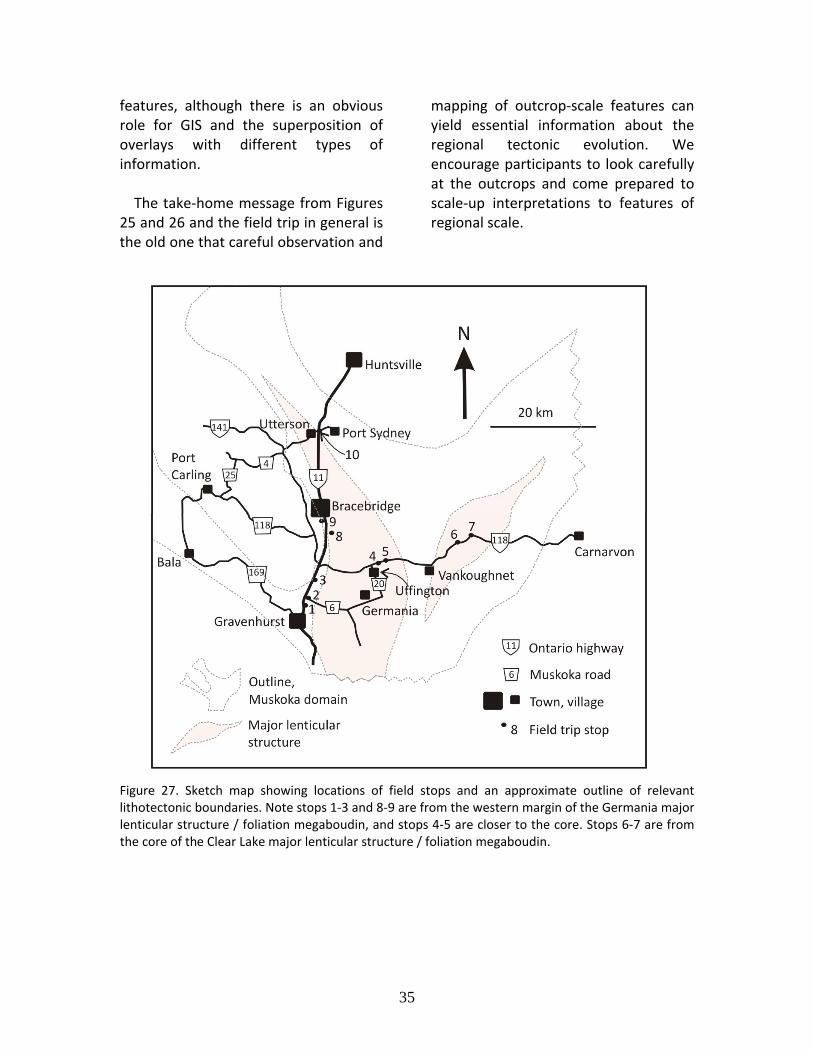
Figure 27. Sketch map showing locations of field stops and an approximate outline of relevant lithotectonic boundaries. Note stops 1‐3 and 8‐9 are from the western margin of the Germania major lenticular structure / foliation megaboudin, and stops 4‐5 are closer to the core. Stops 6‐7 are from the core of the Clear Lake major lenticular structure / foliation megaboudin.
35

Road log
Stop locations are indicated by UTM grid in the field trip guide. Equivalent latitudes and longitudes are given in Table 1 at the end of the road log.
36

Main field trip – October 23, 2016
Starting from the parking lot of the Quality Inn Bracebridge, drive southeast along
Ecclestone Drive (Hwy. 118) to the interchange with Hwy. 11, and enter its southbound
lanes via Exit 182. Proceed south past the town of Gravenhurst, and exit the southbound
lanes of Hwy. 11 via Ure Road, close to a Hardee’s restaurant. Turn east onto Sedore
Road and pass over Hwy. 11. Turn north a short distance east of the overpass, and
proceed on Beaver Ridge Road to join the northbound lanes of Hwy. 11. Travel north
along Hwy. 11 past Exit169 and Gull Lake, and reach Stop 1, about 100 m (??) south of
the Exit 175 to Doe Lake Road (Muskoka Road 6). Park on the broad soft shoulder of
Hwy. 11.
Safety: Leave as much space as possible between the road pavement and the left side of
your vehicles. Pay special attention to fast-moving cars in the northbound lanes.
Stop 1: Near the western margin of Germania lenticular structure; E0630666, N4976716 Inter-layering between marble breccia and straight gneiss, interpreted as severely
deformed metasedimentary strata transposed into a major ductile shear zone at the
boundary between the Moon River subdomain (southern tail) and the eastern Muskoka
domain (Schwerdtner and Mawer 1982, their Figs. 26.2-3; Davidson 1984; Wodicka et al.
2000, their Fig. 1). Less probably, the marble breccia may represent a late-orogenic
aegerine-calcite-carbonatite dike intruded into the granitoid gneisses of the Muskoka
domain (Lumbers et al. 2000, OGS Map P.3409). Regardless of origin, the marble
breccia and associated straight gneiss occur in the Gravenhurst boundary segment of the
westernmost Germania lenticular structure. We will examine the rocks in question, and
try to judge on structural and lithological grounds whether the brecciation resulted from
the ductility contrast between the impure marble and associated silicate rocks, during
mid- to upper-crustal regional deformation.
37

Follow the curved lane of Exit 175 and turn east onto Doe Lake Road (MR 6). Stop 2 is
about 200 m east of Exit 175, opposite the southwest end of MR1 (Gravenhurst Parkway),
at the T-junction with MR 6.
Stop 2: Southeast of T-junction between MR 1 and MR 6; E0631180, N4977392
Mafic-rich Grey Gneiss (Lumbers et al. 2000) and subordinate marble with m-scale
amphibolite boudins in the highly strained marginal zone of the northern Germania
lenticular structure. Note the mesoscopic recumbent fold in the subhorizontal foliation
(possibly formed during early-Ottawan crustal thickening and high-grade
metamorphism), and the mechanical disaggregation within the tails of triaxial lenticular
boudins (probably formed during crustal thinning and associated retrogression).
Return to Hwy.11 and continue north for ~ 4 km to Stop 3, ~1.5 km southwest of Muskoka
Airport. Park your vehicles on the broad soft shoulder of the northbound lane
Safety: Pay careful attention to the traffic on Hwy.11, which can be busy even on Sunday
mornings.
Stop 3: Large road cut on the northbound lanes of Hwy 11, Gravenhurst bypass;
E0631976, N4979663
Amphibolite-facies, mafic-rich Grey Gneiss (Lumbers et al. 2000) in the western
marginal zone of the Germania lenticular structure. Examine the assemblage of
metamorphic minerals and their high-strain fabrics and abundant leucosome, together
with mesoscopic structures such as late-stage pegmatite dikes and an extensional fault-
propagation fold. Note that although the pervasive high-strain fabric is defined by
amphibolite-facies mineral assemblages, relict granulite-facies assemblages are preserved
in some mesoscopic boudins.
Continue north on Hwy. 11 to the interchange with Hwy. 118 (Exit 182), and then drive
east on Hwy. 118 past the T-junction with MR 20 and the hamlet of Uffington. To visit
Stop 4, turn north into the property #2323, and find a convenient parking spot on the large
parking lot near Hwy. 118. Then walk about 50 m east to a pair of road cuts at the north side
of the highway.
38
Stop 4: Road cuts near eastern margin of the Germania lenticular structure;
E0645305, N4984616
View high-strain, amphibolite-facies Grey Gneiss (Lumbers and Vertolli 2000a) and an
associated mass of hornblende-bearing (retrogressed) metagabbro containing plagioclase-
rich pseudomorphs after garnet near the eastern margin of the Germania lenticular
structure. The pseudomorphs have been strained to various degrees, especially at the
margin of the gabbro body, and some contain irregular relics of garnet porphyroblasts.
The heterogeneous break-down of garnet attests to a pressure drop attributable to regional
denudation (exhumation), and points to crustal thinning during orogenic collapse of the
Ottawan thrust-sheet stack (Rivers 2012; Schwerdtner et al. 2014).
Continue east on Highway 118 to its junction with Prospect Lake Road. Drive south on
that road to a small public park with a sandy beach and toilet facilities (E0646422,
N4983780). Break for lunch and inspect small exposures of well-foliated and lineated Grey
Gneiss along cottage road adjacent to the beach (optional). After lunch, drive north on
Prospect Lake Road to a large rock cut at the junction with Hwy. 118.
Stop 5: Large rock cut at the north side of Hwy 118; E0646910, N4985194
Well-foliated Grey Gneiss and Monzogranite (Units 2 and 7, respectively, of Lumbers
and Vertolli 2000a) near the eastern margin of the Germania lenticular structure.
Prominent among different mesoscopic structures is a m-scale extensional fault-
propagation fold. The SE-dipping slip plane is occupied by a pair of potassic pegmatite
dikes. Note offset of mafic wall rocks at the contact of the dike pair.
Time permitting we will view the granulite-facies rocks in the core of the Clear Lake
lenticular structure / foliation megaboudin at stops 6 and 7, both situated on Hwy 118,
east of Vankoughnet. From the junction of Prospect Lake Road, drive east along Hwy.
118 to the T-junction with Black River Road, and, for parking purposes, turn north onto
that road. Then walk a short distance east along Hwy. 118 towards the bridge across
Black River, and view the clean rock cuts on the north side of the highway.
39

Stop 6: Hwy.118, west of Black River bridge, near core of Clear Lake lenticular
structure; E0658156, N4988265
Partly retrogressed, granulite-facies monzonitic orthogneiss near the core of the Clear
Lake lenticular structure, the eastern neighbour of the Germania lenticular structure (see
Figs. 15, 26-27). Large, well preserved orthopyroxene crystals are present locally, and
cm- to m-scale, sub-spherical to quasi-ellipsoidal xenoliths in monzonite can be seen,
attesting to preservation of peak granulite-facies assemblages and relatively low
magnitudes of total rock strain on the outcrop scale.
Drive across Black River bridge and continue east along Hwy 118 to the western boundary
of Haliburton district. Park at the wide entrance to the microwave tower south of Hwy. 118.
Stop 7, optional: Hwy. 118 at western boundary of Haliburton district; E0660396,
N4989057
Weakly strained, granulite-facies rocks are well-exposed in local rock cuts along Hwy.
118. These rocks appear to characterize the core of the Clear Lake lenticular structure,
which remains to be studied in greater detail.
Drive west on Hwy. 118 and return to the interchange with Hwy. 11. Then continue north
along Hwy 11 to Exit 184 (Fredrick Street) in Bracebridge. Follow the exit ramp east to
Fredrick Street, and drive east on it for a short distance to the corner of the unpaved
Latvian Road. Drive NNW on Latvian Road to Stop 8, featuring a series of large road
cuts above and northeast of the highway interchange. Park along a straight segment of
Latvian Road.
Stop 8, optional: Latvian Road, above and northeast of Exit 184; E0634372,
N4985460
Large blasted outcrops of straight granitoid gneiss in the southwest margin of the
northwestern tail of the Germania lenticular structure / foliation megaboudin characterize
the walls of the local interface between the eastern Muskoka domain and the Rosseau
40

subdomain. View a variety of well-exposed mesoscopic structures such as dismembered
mafic boudins.
Drive west and cross Hwy. 11 at the Fredrick Street interchange and then follow Muskoka
Road 37 into central Bracebridge (~2.5 km). At the junction between Muskoka Roads 37 and
16, drive southwest along Wharf Road for about 300 m to a narrow parking lot at the western
shore of Muskoka River.
Stop 9: Wharf Road in Bracebridge, opposite narrow parking lot at Muskoka River;
E0633112, N4988386
Fresh road cuts of variably foliated granitoid rocks in the southwest hinge zone of the
noncylindrical Bracebridge antiform, a km-scale cross-fold (Fig. 8c). At this locality in the
fold closure, the foliation strikes approximately NE, in contrast to the NW-SE regional
structural trend. Close inspection of ostensibly massive granitoid rocks shows them to be
subhorizontally lineated and weakly foliated, with L>S or L>>S mineral-shape fabrics.
Throughout the ORGC, L>>S shape fabrics abound in the hinge zones of km-scale cross-
folds, especially in metaplutonic rocks with weak pre-fold strain.
Drive NE along Wharf Road to Muskoka Road 37, and follow it northwestward to the
junction with Taylor Road (Muskoka Road 42). Drive NE along this road to the northbound
lanes of Hwy. 11. Then drive north along Hwy. 11 towards Port Sydney and take Exit 207
(interchange with Hwy. 141). Stop 9 is at the large road cuts along Hwy. 141, immediately
east of the wide overpass of Hwy. 11. Park along the broad shoulders of Hwy. 141 under the
overpass or at a suitable place east of it.
Stop 10, optional: Large rock cuts along Hwy. 141, immediately east of the wide
overpass of Hwy. 11, between Utterson village and Port Sydney; E0632428, N5008086
Moderately to highly strained, migmatitic amphibolite-facies Grey Gneiss in the
northwest tail of the Germania lenticular structure. Note mafic boudins at the south side
of the highway, some of which carry plagioclase-rich pseudomorphs after former garnet.
There are several potassic pegmatite dikes exposed, and upright to inclined NW-trending
cross-folds of the high-strain fabric are common.
End of field trip
41

42
Canadian Tectonics Group ‐ Field Trip Stops ‐ Sunday October 23, 2016
Stop Lat (N)
Long (W)
UTM Coordinates
Deg Min Sec Deg Min Sec Proj'n Zone Easting Northing
1 44 55 54.77 79 20 38.69 NAD27 17T 630666 4976716
2 44 56 16.37 79 20 12.56 NAD27 17T 631180 4977392
3 44 57 30.27 79 19 38.97 NAD27 17T 631976 4979663
4 45 0 5.95 79 9 22.59 NAD27 17T 645305 4984616
5 45 0 18.26 79 8 12.07 NAD27 17T 646910 4985194
6 45 1 48.32 78 59 33.17 NAD27 17T 658156 4988265
7 45 2 14.14 78 57 46.90 NAD27 17T 660396 4989057
8 45 0 47.24 79 17 43.42 NAD27 17T 634372 4985460
9 45 2 18.32 79 18 34.75 NAD27 17T 633112 4988386
10 45 12 50.09 79 18 44.12 NAD27 17T 632428 5008086
DHW: 29 September 2016
Table 1. UTM co-ordinates and latitudes/longitudes of field trip stops