Embed Size (px)
Citation preview

THE ANTI-CANCER ACTIVITY OF THE NATURAL
PRODUCT, FUCOIDAN, IN HAEMATOLOGICAL
MALIGNANCIES
by
Farzaneh Atashrazm, BSc, MSc
Menzies Institute for Medical Research
University of Tasmania
Submitted in fulfilment of the requirements for the degree of
Doctor of Philosophy
University of Tasmania
November, 2015


Page vii
Publication arising from the period of my candidature:
Paper: Fucoidan and Cancer: A Multifunctional Molecule with Anti-Tumour Potential Publisher: Marine Drugs; Submitted: 24 Feb 2015; Accepted: 3 Apr 2015
Paper: Fucoidan suppresses the growth of human acute promyelocytic leukaemia cells in vitro
and in vivo Publisher: Journal of Cellular Physiology; Submitted: 12 Jun 2015; Accepted: 30 Jul 2015
Paper: Fucoidan enhances the therapeutic potential of arsenic trioxide and all-trans retinoic
acid in acute promyelocytic leukaemia, in vitro and in vivo (Undergoing Peer Review)
Data arising from this thesis has been presented at the following scientific
meetings:
• Poster Presentation. 44th Annual Scientific Meeting of International Society for Experimental Haematology (Kyoto, Japan, 15-17 September 2015). Anti-tumour activity of fucoidan in acute promyelocytic leukaemia and its synergy with arsenic trioxide and ATRA in vitro and in vivo.
• Oral Presentation. 5th Congress of the International Society for Applied Phycology (ISAP) - Seaweed as anti-cancer Symposium- (Sydney, 22-27 June 2014). Atashrazm F, Lowenthal RM, Dickinson JL, Holloway AF, Woods G. Irhimeh M. Anti-tumour activity of fucoidan through inhibition of Erk activation in human acute promyelocytic leukaemia.
• Poster presentation: 19th Congress of European Haematology Association (Milan, Italy 2014). Atashrazm F, Lowenthal RM, Dickinson JL, Holloway AF, Woods G. Arsenic trioxide and fucoidan synergizes to induce apoptosis in acute promyelocytic leukaemia.
• Poster presentation: 26th International Lorne Cancer Conference (Lorne, Australia 2014). Atashrazm F, Lowenthal RM, Dickinson JL, Holloway AF. Induction of Apoptosis by Fucoidan in Human Acute Promyelocytic Leukaemia cells.
• Oral presentation: Tasmanian Haematology, Immunology and Neoplastic Group (THING) Meeting. (Port Arthur, Tasmania 2013). Atashrazm F, Lowenthal RM, Dickinson JL, Holloway AF. Induction of apoptosis by fucoidan in human leukaemia cells.

Page viii
Awards resulting from thesis material
2012 International Postgraduate Research Scholarship (IPRS)
2014 David Collins Leukaemia Foundation Professional Development Award for 2014
2014 Travel grant to attend to the 26th International Lorne Cancer Conference
2014 Finalist of the Australian Society for Medical Research (ASMR) Postgraduate Student Competition
2015 Travel grant to attend to the 44th Annual Scientific Meeting, International Society for Experimental Haematology

Page ix
This dissertation is lovingly dedicated to my inspirational mother, Azar, for the
greatest influence on my life. Her measureless support, help, encouragement
and constant love have sustained me throughout my life.
DEDICATION
Page x
I would never have been able to finish my dissertation without the guidance of my supervisory
team, help from friends, and support from my family.
I would like to express my sincerest gratitude to my supervisor, Professor Ray Lowenthal for
providing the opportunity to undertake this work with him. I am grateful for his tremendous
support and encouragement throughout my research period. I have been extremely lucky to
have a supervisor who cared so much about my work and provided an extremely friendly
atmosphere on a professional and personal level.
I would like to acknowledge my incredible primary supervisor Associate Professor Jo
Dickinson who has supported me throughout my research with her knowledge and outstanding
guidance. At many stages in the course of this research project I benefited from her support
and I am thankful of her for providing me with an excellent atmosphere for doing research.
A special thank you to my inspirational co-supervisor, Professor Greg Woods. It was an
absolute honour and pleasure for me having him as my supervisor in the 3rd year of my PhD. I
am grateful for his invaluable helps, and his encouragement and insightful criticism.
I am also grateful to Dr Adele Holloway for her guidance and practical advice during the
research project. I am honoured to have her as my co-supervisor who guided me through my
PhD study.
I would also like to acknowledge the support I received from staff and fellow students at the
cancer genetics group, Menzies Institute for Medical Research (UTAS) especially our research
assistant Mr James Marthick for all his technical helps, who always gave full attention to me
to solve my problems. I would like to acknowledge Dr Russell Thompson for answering all my
statistical questions and Dr Rebekah McWhirter who patiently assisted me for ethics
application process.
I am deeply thankful to staff of the animal facility, Menzies Institute for Medical Research
(UTAS) particularly Ms Peta Lawrie for teaching me the in-vivo techniques and especially for
her outstanding patience, enthusiasm, helps and encouragements.
ACKNOWLEDGEMENT

Page xi
My sincere thanks are extended also to all staff and post-graduate students in Menzies Institute
who helped me throughout my PhD. Thank you to Mr Mark Cozens and Dr Terry Pinfold, who
assisted me in flow cytometry settings and to Ms Jocelyn Darby for her technical assistance.
I am truly thankful for the tremendous support and love from my friends here in Hobart and in
Iran who made this journey incredible, especially Dr Hussain Khan who was always supporting
me and encouraging me with his best wishes. I am most indebted for his extreme patience and
advice during challenging time of this journey.
Last but not least, special gratitude is conveyed to my lovely family; especially my wonderful
parents. Thank you for always loving me, believing in me and supporting me during all the
challenges and ups and downs. I am also thankful to my sister, Fatemeh, and my brother,
Mehran, for the great joys and happiness they have brought to me.

Page xii
List of Abbreviations
µg Microgram µL Microliters µm Micrometer µM Micromolar ADCC Antibody-dependent cellular cytotoxicity ALL Acute lymphoblastic leukaemia AML Acute myelogenous leukaemia ANOVA Analysis of variance Apaf-1 Apoptotic protease activating factor 1 APL Acute promyelocytic leukaemia ATLL Adult T cell leukaemia-lymphoma ATO Arsenic trioxide ATRA All-trans retinoic acid Bax Bcl-2 associated X protein Bcl B-cell lymphoma BID BH3 interacting-domain death agonist BM Bone marrow BSA Bovine serum albumin b.w. Body weight Ca2+ Calcium CD Cluster of differentiation CDK Cyclin-dependent kinase CDKI Cyclin-dependent kinase inhibitor CLL Chronic lymphocytic leukaemia CML Chronic myelocytic leukaemia CO2 Carbon dioxide CTL Cytotoxic T lymphocytes CTV Cell trace violet CXCL12 Chemokine (C-X-C motif) ligand 12 CXCR-4 C-X-C chemokine receptor type 4 Da Dalton dATP Deoxyadenosine triphosphate DC Dendritic cell DD Death domain del Deletion DIC Disseminated intravascular coagulation DISC Death inducing signalling complex DMSO Dimethyl sulfoxide DNA Deoxyribonucleic acid DS Differentiation syndrome DTT Dithiothreitol ECM Extracellular matrix EGF Epidermal growth factor ELISA Enzyme-linked immunosorbent assay ERK Extracellular-signal-regulated kinase FAB French American British

Page xiii
FACS Fluorescence activated cell Sorter (Flow cytometry) FADD Fas-Associated protein with death domain FCS Foetal calf serum FDA Food and Drug Administration g gram G0 Gap 0 G1 Gap 1 G2 Gap 2 GAPDH Glyceraldehyde phosphate dehydrogenase G-CSF Granulocyte colony-stimulating factor GSH glutathione h hour HCL Hydrochloric acid HM Haematological malignancy HMW High molecular weight HPC Haematopoietic progenitor cell HRP Horseradish peroxidase HSC Haematopoietic stem cell HSCT Haematopoietic stem cell transplantation HTLV Human T-lymphotropic virus IAP Inhibitors of apoptosis protein IFN Interferon Ig Immunoglobulin IL Interleukin IP Intraperitoneal ITGA Integrin alpha IV Intravenous kDa Kilo Dalton kg Kilogram Lin Lineage LMW Low molecular weight m Meter M Mitosis M Molar MAPK Mitogen-activated protein kinase MDS Myelodysplastic syndrome MEK MAPK/ERK kinase mg Milligram Mgcl2 Magnesium chloride miRNA MicroRNA mRNA Messenger ribonucleic acid mm Millimetre MM Multiple myeloma MMP-9 Matrix metalloproteinase 9 MNC Mononuclear cell MW Molecular weight NaCl Sodium chloride NaOH Sodium hydroxide
Page xiv
NHL Non-Hodgkin’s lymphoma NK Natural killer NO Nitric oxide NOD-SCID Non-obese diabetic/severe combined immunodeficiency OD Optical density PAC-1 Procaspase-activating compound-1 PARP-1 Poly (ADP-ribose) polymerase-1 PC Progenitor cells PCR Polymerase chain reaction PBS Phosphate buffer saline PB Peripheral blood PBSC Peripheral blood stem cell PCR Polymerase chain reaction PI3K Phosphatidyl inositol-3 kinase PI3P Phosphatidylinositol 3-phosphate PMA Phorbol myristate acetate PML Promyelocytic leukaemia PSGL-1 P-selectin glycoprotein ligand-1 RA Retinoic acid RARα Retinoic acid receptor-alpha RNA Ribonucleic acid RNase Ribonuclease ROS Reactive oxygen species RPMI Roswell park memorial institute S Synthesis SC Subcutaneous SCF Stem cell factor SCID Severe combined immunodeficiency SDS Sodium dodecyl sulphate SDS-PAGE Sodium dodecyl sulphate polyacrylamide gel electrophoresis SP1 Specificity protein 1 t Translocation TGF Transforming growth factor Th T helper TNF Tumour necrosis factor TNT Tris-sodium-tween solution TRADD TNF receptor type 1-associated death domain protein TRAIL TNF-related apoptosis-inducing ligand Tris Tris(hydroxymethyl)amniomethane uPAR Uri-kinase receptor UV Ultraviolet VCAM Vascular cell adhesion molecule V volt VEGF Vascular endothelia growth factor WBC White blood cell WHO World Health Organisatiom XIAP X-linked inhibitor of apoptosis

Page xv
Table of Contents
Declarations .............................................................................................................................. ii List of Abbreviations ............................................................................................................... xii Abstract ...................................................................................................................................... 1
Chapter One – Literature Review ................................................................................ 3 1.1 Haematological Malignancies ............................................................................................ 4
1.1.1 Leukaemia ................................................................................................................................. 4 1.1.2 Acute Myeloid Leukaemia ........................................................................................................ 5 1.1.3 Acute Promyelocytic Leukaemia ............................................................................................. 10
1.1.3.1 APL Pathophysiology ..................................................................................................................... 10 1.1.3.2 APL Treatment ................................................................................................................................ 14
1.2 Cellular Processes in Tumourigenesis ............................................................................. 16 1.2.1 Apoptosis ................................................................................................................................. 17
1.2.1.1 Apoptosis Initiation ......................................................................................................................... 19 1.2.1.2 Apoptosis Pathways ........................................................................................................................ 19 1.2.1.3 Apoptosis Regulatory Proteins ........................................................................................................ 25 1.2.1.4 Apoptosis Deregulation and Leukaemogenesis ............................................................................... 25 1.2.1.5 Apoptosis: Therapeutic Implications ............................................................................................... 26
1.2.2 Cell Cycle ................................................................................................................................ 28 1.2.2.1 Cell Cycle Stages ............................................................................................................................ 29 1.2.2.2 Cell Cycle Regulation ..................................................................................................................... 31 1.2.2.3 Cell Cycle Deregulation and Leukaemogenesis .............................................................................. 32 1.2.2.4 Cell Cycle: Therapeutic Implications .............................................................................................. 32
1.2.3 Signal Transduction Pathways ................................................................................................. 33 1.2.3.1 Signal Transduction Pathway Deregulation and Leukaemogenesis ................................................ 34 1.2.3.2 Signal Transduction: Therapeutic Implications ............................................................................... 36
1.2.4 The Role of Immune System in Tumourigenesis .................................................................... 36 1.2.4.1 Immune Response: Therapeutic Implications ................................................................................. 37
1.2.5 Cancer Therapy Complications ............................................................................................... 38 1.2.6 A Role for Natural Products for Cancer Treatment ................................................................. 39
1.3 Fucoidan............................................................................................................................ 40 1.3.1 Fucoidan Structure ................................................................................................................... 41 1.3.2 Fucoidan Sources ..................................................................................................................... 41
1.3.2.1 Undaria pinnatifida .......................................................................................................................... 41 1.3.2.2 Fucus vesiculosus ............................................................................................................................ 42
1.3.3 Fucoidan Metabolism .............................................................................................................. 43 1.3.4 Fucoidan Biological Properties................................................................................................ 44 1.3.5 Fucoidan’s Anti-Cancer Potential ............................................................................................ 44
1.3.5.1 Fucoidan and Cell Cycle ................................................................................................................. 45 1.3.5.2 Fucoidan and the Apoptosis Pathway ............................................................................................. 45 1.3.5.3 Fucoidan and Angiogenesis ............................................................................................................ 47 1.3.5.4 Fucoidan and Metastasis ................................................................................................................. 47 1.3.5.5 Fucoidan and Signalling Pathways.................................................................................................. 48 1.3.5.6 Fucoidan and the Immune System .................................................................................................. 49

Page xvi
1.3.5.7 Fucoidan and Malignant Transformation in Vitro and in Vivo ........................................................ 49 1.3.5.8 Fucoidan as a Synergistic Anti-Cancer Agent................................................................................. 50
1.4 Research Aims ................................................................................................................... 52
Chapter Two – Materials and Methods .................................................................... 53
2.1 Cell Culture ....................................................................................................................... 54 2.1.1 Cell Line Characteristics ......................................................................................................... 54
2.1.1.1 HL60 Cell Line ............................................................................................................................... 54 2.1.1.2 NB4 Cell Line ................................................................................................................................. 54 2.1.1.3 K562 Cell Line ................................................................................................................................ 54 2.1.1.4 KG-1a Cell Line .............................................................................................................................. 54 2.1.1.5 Kasumi-1 Cell Line ......................................................................................................................... 55 2.1.1.6 Yac-1 Cell Line ............................................................................................................................... 55
2.1.2 Cell Culture.............................................................................................................................. 55 2.1.2.1 Thawing Cell Lines ......................................................................................................................... 56 2.1.2.2 Culturing Cell Lines ........................................................................................................................ 56 2.1.2.3 Cryopreservation of Cell Lines ....................................................................................................... 56
2.2 Cell Treatments ................................................................................................................. 56
2.3 DNA Content Analysis (Cell Cycle Assay) ....................................................................... 57 2.3.1 Reagents................................................................................................................................... 57 2.3.2 DNA Content Analysis (Cell Cycle Assay) ............................................................................. 58
2.4 WST-8 Cell Proliferation Assay ....................................................................................... 58
2.5 DNA Fragmentation TUNEL Assay ................................................................................ 59
2.6 Annexin V/PI Apoptosis Detection Assay ........................................................................ 59 2.6.1 Reagents................................................................................................................................... 59 2.6.2 Annexin V/PI Apoptosis Detection Assay .............................................................................. 60
2.7 Western Blot Analysis of Cytoplasmic and Nuclear Proteins ......................................... 60 2.7.1 Preparation of Cytoplasmic and Nuclear Protein Extracts ...................................................... 60 2.7.2 SDS-PAGE and Western Blotting ........................................................................................... 61 2.7.3 Protein Detection ..................................................................................................................... 61
2.8 Analysis of Fucoidan ........................................................................................................ 62
2.9 In Vivo Experiments ......................................................................................................... 63 2.9.1 Animals .................................................................................................................................... 63 2.9.2 Mice Identification System ...................................................................................................... 63 2.9.3 Mice Health Monitoring .......................................................................................................... 64 2.9.4 Animal Treatment .................................................................................................................... 64
2.9.4.1 Oral Administration of Fucoidan .................................................................................................... 65 2.9.4.2 Intraperitoneal Injection of Fucoidan .............................................................................................. 66 2.9.4.3 Intravenous Injection of Fucoidan ................................................................................................... 66 2.9.4.4 Intraperitoneal Injection of Arsenic Trioxide .................................................................................. 66 2.9.4.5 Intraperitoneal Injection of ATRA .................................................................................................. 66
2.9.5 Establishment of Human Leukaemia Xenograft Models ......................................................... 67 2.9.6 Tumour Volume Measurement ................................................................................................ 67 2.9.7 Animals Euthanasia ................................................................................................................. 67 2.9.8 Tumour Volume Doubling Time ............................................................................................. 68 2.9.9 Assessment of the Tumour Mass ............................................................................................. 68
2.9.9.1 Tumour Mass Cell Suspension Preparation .................................................................................... 68

Page xvii
2.9.9.2 Cell Surface Marker Analysis ......................................................................................................... 68 2.9.10 Natural Killer Cell Activity ................................................................................................... 68
2.9.10.1 Preparation of Splenic Mononuclear Cells .................................................................................... 69 2.9.10.2 Preparation of Yac-1 Target Cells ................................................................................................. 69 2.9.10.3 Cell Trace Violet and PI staining Assay........................................................................................ 70
2.10 Statistical Analysis .......................................................................................................... 71
Chapter Three – Cytotoxic Effects of Fucoidan on AML Cells ....................... 72
3.1 Introduction ....................................................................................................................... 73
3.2 Experimental Design ........................................................................................................ 74
3.3 Results................................................................................................................................ 75 3.3.1 Fucoidan Characteristics ...................................................................................................... 75
3.3.1.1 Endotoxin Level Assay in Fucoidan ............................................................................................... 75 3.3.1.2 Analysis of the Two Fucoidan Preparations .................................................................................... 75
3.3.2 Purified Fucoidans from U. pinnatifida and F. vesiculosus (Marinova Pty. Ltd.) Did Not Suppress the Growth of AML Cells ................................................................................................. 77 3.3.3 Cytotoxicity Activity of Fucoidan (Sigma-Aldrich Co.) in AML Cells .................................. 86
3.3.3.1 Fucoidan Inhibited Cell Proliferation in NB4, HL60 and K562 Cell Lines .................................... 86 3.3.3.2 Fucoidan Increased Sub-G0/G1 Fraction in NB4 and HL60 Cells. ................................................ 86 3.3.3.3 Fucoidan Induced Apoptosis in NB4 and HL60 Cells. ................................................................... 90 3.3.3.4 Fucoidan-Induced Apoptosis was Caspase Dependent ................................................................... 95 3.3.3.5 Fucoidan Changed the expression of Cell Cycle Proteins ............................................................... 99 3.3.3.6 Fucoidan Deactivated ERK1/2 and Decreased Phosphorylation of AKT on Thr308 Residue. ..... 100 3.3.3.7 Cellular Signalling and Fucoidan .................................................................................................. 101
3.4 Discussion........................................................................................................................ 104 3.4.1 Fucoidan Metabolism and Variable Activities of Fucoidan from Different Sources ............ 104 3.4.2 Cytotoxic Effects of Fucoidan on different AML cells ......................................................... 107
Chapter Four –Prophylactic Anti-Tumour Activity of Fucoidan in AML 111 4.1 Introduction ..................................................................................................................... 112
4.2 Experimental Design ...................................................................................................... 114 4.2.1 Analysis of Prophylactic Activity of Fucoidan in Vivo ......................................................... 114 4.2.1 Analysis of Immunomodulatory Activity of Fucoidan in Vivo ............................................. 114
4.3 Results.............................................................................................................................. 115 4.3.1 Oral Fucoidan Delayed the AML Appearance and Growth in Mice ..................................... 115 4.3.2 Fucoidan Increased Splenic NK-cell Activity in Vivo ........................................................... 118
4.4 Discussion........................................................................................................................ 123 4.4.1 Protective Effect of Fucoidan against AML development in Mice ....................................... 123 4.4.2 Immunomodulatory Activity of Fucoidan in Vivo ................................................................. 124
Chapter Five – Investigation of Possible Synergistic Effects of Fucoidan and ATO in APL Treatment in Vitro and in Vivo .............................................. 126
5.1 Introduction ..................................................................................................................... 127
5.2 Experimental Design ...................................................................................................... 129 5.2.1 The synergistic Effect of fucoidan with ATO in APL Cell Apoptosis in Vitro ..................... 129 5.2.2 The Synergistic Anti-Tumour Activity of fucoidan with ATO in APL-Bearing Mice ......... 129
5.3 Results.............................................................................................................................. 130

Page xviii
5.3.1 Fucoidan Increases the Anti-proliferative Activity of ATO in APL Cells in Vitro. .............. 130 5.3.2 Fucoidan Synergises with ATO in ATO-Mediated Apoptosis in APL Cells. ....................... 136 5.3.3 High Dose Fucoidan Delayed Tumour Growth ..................................................................... 139 5.3.4. Co-treatment of Fucoidan with ATO Significantly Delayed the Growth of APL in Mice. .. 142
5.4 Discussion........................................................................................................................ 145 5.4.1 Synergistic Effect of Fucoidan with ATO in Vitro ................................................................ 145 5.4.2 Therapeutic Potential of Fucoidan in APL-Bearing Mice ..................................................... 147 5.4.3 Synergistic Effect of Fucoidan with ATO in Vivo ................................................................. 147
Chapter Six – Investigation of Possible Synergistic Effects of Fucoidan and ATRA in APL Treatment in Vitro and in Viv o ................................................... 149
6.1 Introduction ..................................................................................................................... 150
6.2 Experimental Design ...................................................................................................... 155 6.2.1 The Synergistic Effect of Fucoidan with Low Doses of ATRA+ATO in APL Cell Differentiation in vitro .................................................................................................................... 155 6.2.2 The synergistic Anti-Tumour Activity of fucoidan with ATRA in APL-Bearing Mice ....... 155
6.3 Results.............................................................................................................................. 156 6.3.1 Fucoidan Enhances ATRA-Induced Differentiation in APL Cells........................................ 156 6.3.2 Fucoidan Combined with ATRA and ATO Enhances G0/G1 arrest in APL Cells. .............. 162 6.3.3 Co-treatment of Fucoidan with ATRA Significantly Delayed the Growth of APL in Mice. 165 6.3.4 Fucoidan Significantly Increased the Differentiation of APL Cells in Vivo. ........................ 168
6.4 Discussion........................................................................................................................ 172 6.4.1 Synergistic Effect of Fucoidan with ATRA and ATO in Vitro ............................................. 172 6.4.2 Synergistic Effect of Fucoidan with ATRA in Vivo .............................................................. 175
Chapter Seven – Conclusion and Future Directions .......................................... 177
Final Discussion and Conclusion ........................................................................................ 178 Future Directions ............................................................................................................................ 185
References .......................................................................................................................... 187
Appendix A- Reagents ........................................................................................................... 213
Appendix B- Methods............................................................................................................ 215
Appendix C- Monitoring Sheets ........................................................................................... 216
Appendix D-Results............................................................................................................... 218
Page 1
Abstract
Leukaemia is the most common form of haematological malignancy and includes a group of
diseases characterised by an uncontrolled growth of malignant haematopoietic cells. It accounts
for about 33% and 3% of cancer cases in children and adults, respectively. Worldwide,
approximately 350,000 new cases of leukaemia are diagnosed each year, with more than
250,000 deaths. Acute myeloid leukaemia (AML) is the most common form of acute
leukaemia, accounting for around 85% of adult cases, and a leading cause of cancer death in
young adults. Although chemotherapy is often effective in the treatment of AML, at least in
the short term, the agents currently in use are associated with a wide range of side effects
including increasing the risk of developing therapy-related cancers. Therefore, there is
considerable interest in the anti-cancer potential of natural agents with lower toxicities.
Fucoidan is a fucose-rich sulphated polysaccharide that exists in the cell wall matrix of brown
seaweeds. This component has shown immunomodulatory and anti-tumour activities.
However, the underlying mechanisms of these activities remain largely unknown.
Herein, the anti-tumour activities of fucoidan were examined in in vitro and in vivo models of
AML, and its activity as a potential adjunct therapy was investigated. Investigation of the
effects of fucoidan on leukaemic cells (NB4; a t(15;17) positive acute promyelocytic
leukaemia, KG-1a; a minimally differentiated AML, HL60; a t(15;17) negative acute
promyelocytic leukaemia and K562; an acute erythroleukaemia cell line) revealed evidence
that fucoidan has a selective inhibitory effect on acute promyelocytic leukaemia (APL) and not
other types of AML cells, initiating apoptosis. Examination of the pathways mediating the
observed apoptotic mechanisms revealed the observed effect was caspase-dependent as it was
significantly attenuated by pre-treatment with a pan-caspase inhibitor. P21/WAF1/CIP1 was
significantly up-regulated leading to cell cycle arrest. Fucoidan decreased the activation of
ERK1/2, and down-regulated the activation of AKT through hypo-phosphorylation of Thr(308)
residue but not Ser(473).
The anti-tumour activity of fucoidan was supported by in-vivo evidence which demonstrated
that oral doses of fucoidan significantly delayed tumour growth in the APL xenograft model in
athymic Balb/c nude mice, potentially by increasing the cytolytic activity of NK cells. This is
the first study to reveal the anti-tumour activity of fucoidan on leukaemia in vivo. The selective
inhibitory effect of fucoidan on APL cells and its protective effect against APL development
in mice may prove that fucoidan may be useful in treatment of certain types of leukaemias.
APL is one of the most aggressive types of AML characterised by differentiation arrest and
accumulation of abnormal promyelocytes. Current APL therapies are associated with various
side effects such as hyper-leucocytosis and differentiation syndrome which occurs in a quarter
of the patients and is a serious and potentially fatal complication. There is therefore interest in

Page 2
the possibility of reducing the incidence of these morbidities through the use of adjunctive
therapies which permit lower doses of toxic therapies to be used whilst maintaining efficacy.
Herein, the synergistic effects of fucoidan on current APL therapy, arsenic trioxide (ATO) and
all-trans retinoic acid (ATRA), were investigated. In vitro, the effect of fucoidan combined
with both therapeutic and lower doses of these drugs was examined in APL cells. Fucoidan in
combination with ATO enhanced apoptosis in APL cells at both therapeutic and lower doses
of ATO as indicated by an increased sub G0/G1 population, DNA fragmentation and annexin
V positive apoptotic cells. Furthermore, the combination of fucoidan with low doses of ATRA
and ATO significantly enhanced cell differentiation as indicated by G0/G1 arrest and increased
CD11b expression. The triple combination of these agents resulted in the greatest myeloid
differentiation in APL cells compared to single or double combinations.
The efficacy of fucoidan as an adjuvant to the anti-leukaemic activity of ATO or ATRA was
identified in vivo in athymic Balb/c nu/nu mice bearing APL. Tumour growth was monitored
by measurement of tumour size and survival. When fucoidan and sub-therapeutic doses of ATO
were administered in APL-bearing mice, the median survival and tumour volume doubling
time significantly increased in mice treated with fucoidan alone and combined with ATO but
not ATO alone compared to the control group.
When fucoidan plus low dose ATRA were administered as the therapy regimen in APL-bearing
mice, the median survival and tumour volume doubling time significantly increased in all
treated groups compared to the control group. Moreover, the differentiation of APL cells
obtained from animal’s tumour mass significantly increased in mice treated with fucoidan
alone and fucoidan+ATRA but not ATRA alone compared to the control group. A further novel
finding was that the differentiated APL cells derived from the excised tumour mass exhibited
a down regulation of CD44 in fucoidan+ATRA treated mice. The presence of differentiated
leukaemic cells with low or no expression of CD44 may be associated with decreased migration
of these cells in APL.
Taken together these findings provide important evidence that fucoidan may prove an effective
adjuvant therapeutic agent in the treatment of selected leukaemia sub-type APL and may permit
lower doses of ATO and ATRA to be employed to achieve better efficacy of treatment
accompanied by lower toxicity.

Page 3
Chapter One – Literature Review
Literature Review

Chapter 1 Literature Review
Page 4
1.1 Haematological Malignancies
Haematological malignancies (HMs) are tumours of the haematopoietic or lymphoid tissues,
accounting for nearly 9% of all cancers (excluding non-melanoma skin cancers). Although
there is no identifiable cause for most patients, factors such as exposure to ionising radiation,
certain chemicals, genetic predisposition, viral infection and Down’s syndrome are associated
with increased risk of these diseases (1).
Haematological malignancies are classified into three major types; 1. leukaemia; cancer of
immature or abnormal white blood cells, 2. lymphoma; cancer of the lymphoid tissues leading
to accumulation of abnormal lymphocytes in lymph nodes and other tissues; and 3. multiple
myeloma which is cancer of plasma cells originating in bone marrow. Figure 1.1 represents the
amount of estimated new cases of leukaemia, lymphoma and myeloma in 2015 in Australia
(2).
Figure 1.1. Estimated new cases (%) of leukaemia, lymphoma, and myeloma in
Australia, 2015*. Source: Australian Institute of Health and Welfare; 2014 (2). * Total percentage does not add up to 100% due to rounding in the calculation of individual percentages.
1.1.1 Leukaemia
Leukaemias are a group of malignancies involving the uncontrolled proliferation of immature
or abnormal white blood cells in bone marrow and peripheral blood (3). Leukaemias are the
leading cause of cancer deaths in males younger than 40 and females younger than 20 years

Chapter 1 Literature Review
Page 5
(4). Worldwide, approximately 350,000 new cases of leukaemia are diagnosed each year. There
are more than 250,000 deaths. According to a report by Australian Institute of Health and
Welfare, 2774 people were diagnosed with different types of leukaemias in 2011, and there
were 1368 deaths due to this cancer in 2012 (5).
Haematopoietic cells contain two major lineages; myeloid which gives rise to granulocytes,
monocytes/macrophages, megakaryocytes and erythrocytes; and lymphoid which produces
different types of lymphocytes (Figure 1.2). Leukaemia may derive from either of these two
lineages (6). Leukaemias are also categorised into acute and chronic types depending on the
rate of the progression and whether mature or immature WBCs are involved. In acute
leukaemias, the number of non-functional immature WBCs increases rapidly without
differentiating into mature cells. Acute leukaemias develop quickly and have a poor prognosis
if untreated. In contrast, chronic leukaemias mostly involve proliferation of mature WBCs and
tends to progress slowly (6).
There are four major types of leukaemias: acute lymphoblastic leukaemia (ALL), acute
myeloid leukaemia (AML), chronic lymphocytic leukaemia (CLL) and chronic myeloid
leukaemia (CML). Among all types of leukaemia, AML causes the most deaths in Australia
and worldwide (1, 7).
1.1.2 Acute Myeloid Leukaemia
Acute myeloid leukaemia (AML) is characterised by rapid production and accumulation of
immature myeloid cells. It is the most common form of acute leukaemia accounting for 25%
of all adult leukaemias in USA, Australia and Europe (8, 9). AML is regarded as a highly
malignant neoplasm and has the lowest survival rate of all leukaemias (8). The age of onset of
AML has two peaks (Figure 1.3). It is the most common form of acute leukaemia during the
first few months of life and also becomes the most frequent form of acute leukaemia in the
middle and later years of life, with median age of 60. The increase in incidence of AML could
be secondary due to the progression of the very common myelodysplastic syndrome (MDS) in
elderly patients to AML. More than 80% of patients with MDS are over the age of 60 (10), and
it has been reported that 30% of MDS cases evolve into AML (11).

Chapter 1 Literature Review
Page 6
Figure 1.2. Overview of normal haematopoiesis (12)

Chapter 1 Literature Review
Page 7
Various etiological factors have been associated with AML occurrence, such as exposure to
radiation, viruses, chemical agents such as benzene and previous treatment with
chemotherapeutic agents (6). However, most of the AML cases are not known to be linked with
these factors.
Figure 1.3. Age-specific incidence rates for AML (all races), 2007-2011 (13).
Different subtypes of AML have been categorised. The French-American-British (FAB)
classification and the newer World Health Organisation (WHO) classification are two of the
main systems that have been used to classify AML. In 1976, the FAB group classified AMLs
into 8 different subtypes according to morphology (maturity of the leukaemic cells) and
cytochemical reactions of the cells’ enzymes (Table 1.1). In 2001, a new classification of AML
was introduced by WHO, in which the genetic changes, and biologic and clinical features of
the disease were incorporated into the FAB scheme (3). The 2008 revision of the WHO
classification of AML is outlined in Table 1.2.
The treatment of AML varies and depends on age, AML subtype and clinical history of
patients. The main treatment for AML includes intensive chemotherapy which is composed of
two stages: remission induction therapy to eradicate the leukaemic cells and induce remission;
and consolidation therapy which begins after remission induction therapy (14). The goal of the
latter stage is to destroy any remaining leukaemic cell and to prevent relapse. Other treatment
strategies include radiation therapy and stem cell transplantation.

Chapter 1 Literature Review
Page 8
Table 1.1. The FAB classification of acute myeloid leukaemia (6)
Subtypes Name Cytogenetics
AML-M0 Undifferentiated acute myeloblastic leukaemia
AML-M1 Acute myeloblastic leukaemia with minimal maturation
AML-M2 Acute myeloblastic leukaemia with maturation t(8;21)(q22;q22), t(6;9)
AML-M3 Acute promyelocytic leukaemia (APL) t(15;17)
AML-M4 Acute myelomonocytic leukaemia Inv(16)(p13q22), del(16q)
AML-M5 Acute monocytic leukaemia Del (11q), t(9;11), t(11;19)
AML-M6 Acute erythroid leukaemia
AML-M7 Acute megakaryoblastic leukaemia t(1;22)

Chapter 1 Literature Review
Page 9
Table 1.2. 2008 WHO classification of acute myeloid leukaemia (3)
AML with recurrent genetic abnormalities
AML with t(8;21)(q22;q22); RUNX1-RUNX1T1; AML with inv(16)(p13.1q22) or t(16;16)(p13.1;q22) CBFB-MYH11 APL with t(15;17)(q22;q12); PML-RARA AML with t(9;11)(p22;q23); MLLT3-MLL AML with t(6;9)(p23;q34); DEK-NUP214 AML with inv(3)(q21q26.2) or t(3;3)(q21;q26.2); RPN1-EVI1 AML (megakaryoblastic) with t(1;22)(p13;q13); RBM15-MKL1 Provisional entity: AML with mutated NPM1 Provisional entity: AML with mutated CEBPA
Acute myeloid leukaemia with myelodysplasia-related changes Therapy-related myeloid neoplasms Acute myeloid leukaemia, not otherwise specified
AML with minimal differentiation AML without maturation AML with maturation Acute myelomonocytic leukaemia Acute monoblastic/monocytic leukaemia Acute erythroid leukaemia
Pure erythroid leukaemia Erythroleukaemia, erythroid/myeloid
Acute megakaryoblastic leukaemia Acute basophilic leukaemia Acute panmyelosis with myelofibrosis
Myeloid Sarcoma

Chapter 1 Literature Review
Page 10
1.1.3 Acute Promyelocytic Leukaemia
Acute promyelocytic leukaemia (APL) or AML-M3 is one of the most aggressive subtypes of
AML, characterised by accumulation of abnormal promyelocytes in bone marrow. It accounts
for around 10-12% of all AML cases (15) with the unusual average age of 30-40 years, which
is remarkably lower than that of other subtypes (60-70 year) (16).
Due to its unique biologic characteristics compared to the other subtypes of AML, APL is
characterised by distinct clinical features, associated with an apparent bleeding tendency (6).
In the late 1950s, APL was first described as a hyper-acute fatal illness associated with a
haemorrhagic syndrome based on this distinctive clinical symptom (17, 18).
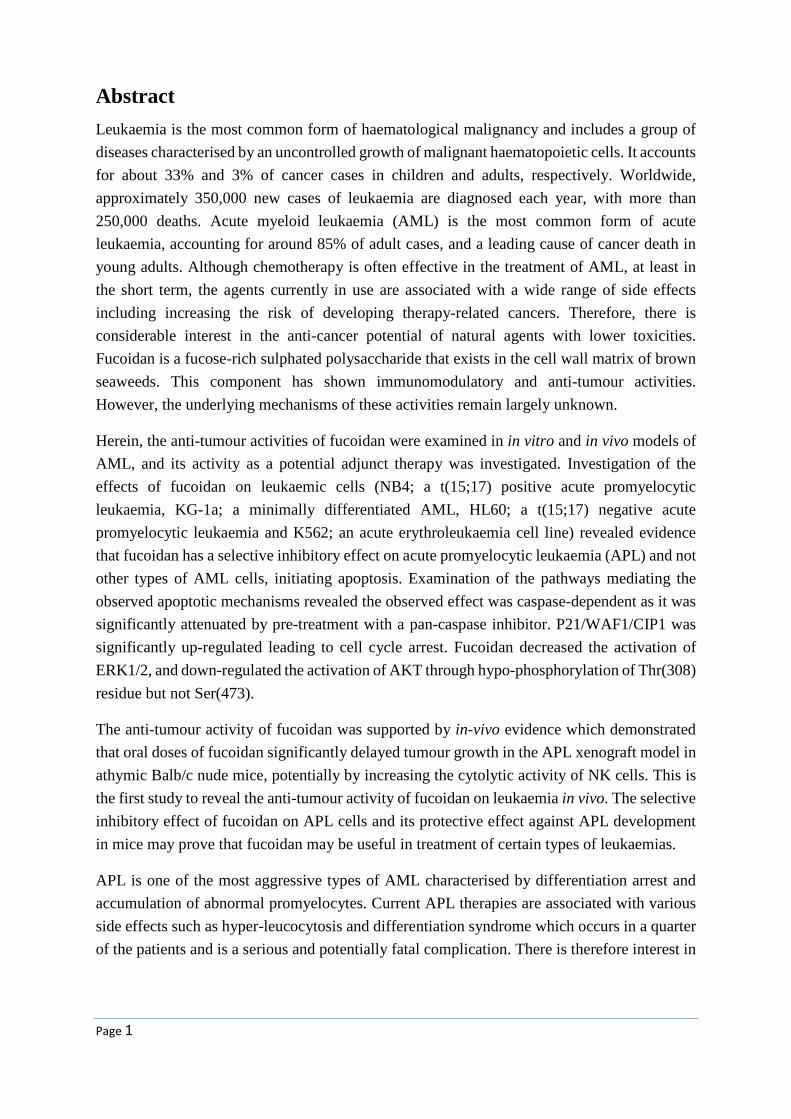
Morphologically, abundant amount of azurophilic granules are present within the malignant
cells. The clumps of these granules form structures known as Auer rods which are found in
most cases of APL (Figure 1.4). The frequently-observed haemorrhagic complications such as
disseminated intravascular coagulation (DIC) occur due to presence of pro-coagulant materials
in APL cell granules (6).
1.1.3.1 APL Pathophysiology
The chromosomal translocation t(15;17)(q22;q21) is the characteristic chromosomal
abnormality in more than 95% of APL cases (19). The t(15;17) translocation involves fusion
of segment of the PML gene on the long arm of chromosome 15 with segment of the retinoic
acid receptor alpha (RARα) gene on the long arm of chromosome 17 (Figure 1.5) (20). The
PML gene encodes the promyelocytic leukaemia protein PML which functions as a nuclear
transcription factor and tumour suppressor. The RARα gene encodes transcription factor
retinoic acid receptor alpha which is mainly expressed in haematopoietic cells. The RARα
protein regulates the expression of a wide range of genes involved in proliferation,
differentiation and maturation of WBCs, in particular from the promyelocyte stage (21).
The fusion of PML and RARα genes encodes a hybrid protein, PML-RARα, with altered
functions. It attaches to the genes involved in maturation with high affinity, resulting in
transcriptional repression of those genes. The affected promyelocytes lose their differentiation
capability and cannot give rise to mature cells (22) (Figure 1.6).
Chapter 1 Literature Review
Page 11
Figure 1.4. Acute promyelocytic leukaemia blood smear. APL with t(15;17) shows predominantly abnormal promyelocytes (×500). Inset (top right): Abnormal promyelocytes
with bundles of Auer rods. (6)

Chapter 1 Literature Review
Page 12
Figure 1.5. Chromosomal translocation between PML and RARα genes (23)

Chapter 1 Literature Review
Page 13
Figure 1.6. The mutant PML-RARα blocks promyelocytes differentiation (23)

Chapter 1 Literature Review
Page 14
1.1.3.2 APL Treatment
At the time of the first description of APL in the late 1950s, the front-line treatment for APL
was similar to other subtypes of AML including chemotherapeutic drugs such as daunorubicin.
In 1973, due to relatively low rate of complete remission in patients, the remission induction
therapy phase was changed to chemotherapy composed of an anthracycline (daunorubicin,
idarubicin, or others) and cytosine arabinoside (Ara-C), which led to an increased rate of
complete remission from 55% to 75-80% in newly diagnosed patients (24-26). However, due
to the unique clinical features of APL and the high likelihood of haemorrhagic complications
the death rate was still high and the median duration of complete remission remained low.
Since it was discovered that the accumulation of malignant promyelocytes in APL occurs as a
result of differentiation arrest, in the early 1970s new insight into developing differentiation-
based therapy rather than cell death-based therapy was offered (26). All-trans retinoic acid
(ATRA) and arsenic trioxide (ATO) were further introduced as potential molecules targeting
differentiation in APL cells. In a newly published clinical trial, the combination of ATO with
ATRA and idarubicin was used in induction therapy, and ATO with ATRA were used as
consolidation therapy (27).
1.1.3.2.1 All-Trans Retinoic Acid (ATRA)
Retinoids are a family of molecules that are chemically and structurally related to vitamin A
(retinol). Retinol, presents in the diet, is stored in the liver and can be converted to various
derivatives such as ATRA, 9-cis-RA, 13-cis-RA, and retinal (28). These chemical compounds
are present in human plasma and exert diverse physiological functions such as regulation of
cell proliferation and differentiation (29).
In 1980s, following introduction of the differentiation-based therapies, the synthetic form of
retinoic acid (RA) was shown to trigger morphological and functional maturation in APL cell
lines (28). In the first clinical trial, all patients who received ATRA underwent clinical
remission, with a gradual differentiation of malignant promyelocytes in bone marrow and
peripheral blood. This success was further confirmed by several clinical trials which reported
complete remission of 85-90% in patients treated with ATRA (30, 31). However, continuous
ATRA therapy led to progressive resistance to the drug leading to relapse within 3-6 months

Chapter 1 Literature Review
Page 15
in almost all patients (32). Subsequently it was found that the combination of ATRA and
chemotherapy such as anthracyclines was more beneficial than each alone. This not only
resulted in higher overall complete remission rates up to 95%, but also decreased the incidence
of differentiation syndrome (DS) in newly diagnosed patients (26). DS is a life-threatening
complication which is postulated to be caused by therapy-induced cytokine release from
myeloid cells as they undergo differentiation. Clinical features may include fevers, dyspnoea
with pulmonary infiltrates, effusions and renal failure (33).
Today, the combination of ATRA and anthracycline-based chemotherapy is the first line of
APL treatment in newly-diagnosed patients (22), resulting in 12-year progression-free survival
rate of about 70%. However, relapse and death occur in 30% of patients within five years (28).
1.1.3.2.2 Arsenic Trioxide (ATO)
Arsenic trioxide (ATO) or white arsenic is an inorganic form of arsenic derived from minerals
such as realgar or orpiment (34). ATO has been used in traditional Chinese medicine for
thousands of years. In the late 18th and early 19th centuries, ATO was introduced for treating
periodic fever and chronic myelogenous leukaemia. Although its usage was limited as it was
highly poisonous and induced severe toxicities in patients (34, 35).
In early 1990s, intravenous injection of crude solutions of ATO containing 1% of the
component induced complete remission in 65% of APL patients with 30% survival rate after
10 years (36). Impressively, ATO was shown to be more effective in relapsed APL patients or
in patients who developed resistance to chemotherapy or ATRA than newly diagnosed patients
(26). In 2000, the Food and Drug Administration (FDA) approved administration of ATO for
the treatment of induction of remission and consolidation in patients with APL who are
refractory to, or relapsed from, retinoid and anthracycline chemotherapy, and whose APL is
characterised by the presence of the t(15;17) translocation or PML/RAR-alpha gene expression
(37, 38). Recently, oral formulations of ATO have been developed and are entering clinical
practice (39).
Chapter 1 Literature Review
Page 16
1.1.3.2.3 Combination of ATRA and ATO
New insights provided by research using combined treatment of ATO and ATRA led to this
chemotherapy being offered in 1998 (26). Subsequently, cell culture and animal studies
revealed a significantly increased cell death in acute promyelocytic leukaemia NB4 cell line
and a marked increase in survival of APL-bearing animals (40, 41). In the first phase of initial
clinical trials it was revealed that even though the complete remission rates in ATRA single,
ATO single and combined groups were similar, the time to achieve the complete remission was
significantly shorter in the combination group (42). After 18 months follow up, 100% of the
cases in the combination group remained in complete remission, while APL relapsed in nearly
20% of the single therapy groups. The combination of oral ATRA and intravenous ATO is now
considered as the standard treatment for relapsed APL (39). ATRA plus ATO is also used as
induction therapy in elderly patients and in patients who cannot tolerate the anthracycline-
based therapy (43). However, despite the promising results from various clinical trials, the
efficacy and safety of ATO+ATRA or ATO+ATRA+chemotherapy are still unclear and
several pilot studies investigating their use for remission induction in newly diagnosed patients
and other stages are ongoing (44, 45). In a recent multi-central randomized clinical trial, Zhu
et al. tested the efficacy and safety of an oral formula of ATO and compared with intravenous
ATO in newly diagnosed APL patients (46). Their findings showed that the oral formula of
ATO plus ATRA was not inferior to intravenous ATO plus ATRA as first-line treatment of
APL as the disease free survival was 98.1% and 95.5% in oral and intravenous ATO
respectively. These results suggest that oral ATO plus ATRA could be considered as first-line
treatment option for APL treatment.
Although there have been advances in APL treatment, the early death rate related to
hemorrhagic complications is still high. Besides, relapses, drug resistance and significant side-
effects of current treatments still remain clinical challenges. Therefore, new APL treatment
strategies are needed to increase the disease free survival rate and improve the clinical outcome.
1.2 Cellular Processes in Tumourigenesis
During tumour development, various crucial cellular pathways are disrupted. Over the last
decades, the major hallmarks of cancers have been identified as follows; 1. Self-sufficiency in

Chapter 1 Literature Review
Page 17
growth signals, 2. Insensitivity to death signals, 3. Apoptosis evasion, 4. Unlimited replicative
potential and immortality, 5. Angiogenesis, 6. Invasion and metastasis to other tissue, (47) 7.
Reprogramming energy metabolism and 7. Immune response destruction (48). These acquired
capabilities are shared between almost all types of cancers.
Unlike the traditional cancer therapies that kill rapidly proliferating cells and affect both tumour
and normal cells, novel therapeutic agents are designed to target the molecules which are
abnormally expressed only in tumour cells. These tumour-specific structures could be either
surface antigens; such as polymorphic epithelial mucin (PEM) which is aberrantly glycosylated
and overexpressed in a variety of epithelial cancers (49), or intracellular molecules; such as
phosphatase of regenerating liver-3 (PRL-3) which is overexpressed in gastric carcinoma (50).
In this regard, our understanding from the cancer hallmarks and involved pathways has
enormously advanced anti-cancer treatments. In this section, the main involved cellular and
molecular pathways, the role of their defects in cancer development, and their therapeutic
implication in cancer will be reviewed.
1.2.1 Apoptosis
Until recently, accelerated or deregulated cell proliferation was believed to be the only
causative factor for cancer. Kerr et al. however hypothesised that hyperplasia and malignant
neoplasms can result from reduced programmed cell death known as apoptosis rather than
increased unlimited proliferation only (51). Apoptosis is an active multi-step cell self-destruct
program that can potentially occur in each cell in the body, leading to the removal of unwanted
cell.
During apoptosis, the chromosomal DNA is fragmented as a consequence of cleavage between
nucleosomes. These DNA fragments can then be broken into small pieces of around 50
nucleotides. Eventually, cleavage of proteins that are responsible for integrity of cytoplasm and
organelles leads to cell self-shrinkage and formation of fragments known as
aapoptotic bodies (Figure 1.7). The apoptotic bodies can be recognised and phagocytosed by
macrophages (52).

Chapter 1 Literature Review
Page 18
Due to the crucial role of apoptosis in abnormal cell removal, the molecules involved in
apoptosis are broadly recruited for anti-cancer drug development. Therefore, understanding the
apoptotic pathway and involved molecules as well as the role of relevant impairments causing
cancers would help in designing therapeutic agents.
Figure 1.7 Apoptotic bodies (53)

Chapter 1 Literature Review
Page 19
1.2.1.1 Apoptosis Initiation
A variety of exogenous and endogenous agents initiate the apoptosis process including the
agents that cause DNA damage (e.g. ionising radiation and cytotoxic drugs such as alkylating
agents), the factors that activates the death receptors (e.g. some hormones), the biochemical
agents which enhance the downstream components of apoptotic system such as phosphates and
kinase inhibitors (e.g. perylenequinone antibiotic calphostin C), and the factors which mediate
the apoptosis process by direct cell membrane damage (e.g. heat and other stressors) (54).
1.2.1.2 Apoptosis Pathways
Apoptosis initiation by stimuli results in activation of a number of molecules and proteolytic
enzymes, causing the progression of the apoptosis cascade (Figure 1.8). Caspases or cysteine-
aspartic proteases known as the executioner proteins in apoptosis cascade are a family of
cysteine proteases and have a pivotal role in this process (55). Caspases are divided into initial
caspases which trigger the initial steps of the apoptosis; and effector caspases which function
at the later stages of apoptosis leading to the cleavage of crucial molecules. The initial phase
of apoptosis can be carried out either through activation of the cell death receptors (extrinsic
pathway) or via the mitochondrial signalling (intrinsic pathway). In the extrinsic pathway,
transmembrane death receptors transmit the death signals to the apoptotic machinery, while the
intrinsic pathway is activated in response to death signals derived from inside the cell such as
DNA damage. These signals cause permeabilisation of mitochondria and subsequently release
of cytochrome C. Both pathways trigger the activation of effector caspases.
1.2.1.2.1 Extrinsic Pathway
A large number of death signals trigger the extrinsic pathway through attachment to death
receptors located on cell surface. Different cell-surface death receptors have been characterised
so far, which belong to the tumour necrosis factor (TNF) receptor gene superfamily. The Fas
receptor, TNF-α receptor-1 and TRAIL receptors DR-4 and DR-5 are

Chapter 1 Literature Review
Page 20
Figure 1.8. Apoptosis related molecules (56)

Chapter 1 Literature Review
Page 21
the main death receptors (Table 1.3). UV radiation is an example of a stimulus which induces
the extrinsic pathway of apoptosis through Fas clustering on the surface of keratinocytes.
All death receptors contain a homologous cytoplasmic domain named Death Domain (DD)
which includes approximately 80 amino acids and is responsible for transmitting the death
signal into the intracellular signalling pathways. The DDs of activated death receptors recruit
the DDs in adapter molecules such as FADD and TRADD and cause formation of death
inducing signalling complex (DISC) (Figure 1.9). The DISC contains a multi-protein complex
such as several caspase 8 molecules. The activated caspase 8 then directly cleaves and activates
the downstream effector caspases.
Table 1.3 Death receptors and their ligands
Death receptors Ligands for death receptors
Fas (CD95) CD95L (FasL)
TNFR1 (p55, CD120a) TNF and Lymphotoxin alpha
DR3 (Apo3) Apo3L
DR4 TRAIL (Apo2L)
DR5 (Apo2) TRAIL (Apo2L)

Chapter 1 Literature Review
Page 22
Figure 1.9. Apoptosis extrinsic pathway (57)

Chapter 1 Literature Review
Page 23
1.2.1.2.2 Intrinsic Pathway
Intracellular stimuli and non-receptor mediated signals such as DNA damage, viral infection,
hypoxia and high level of Ca2+ are responsible for the intrinsic apoptosis pathway. These
stimuli induce changes in the inner membrane of mitochondria and lead to mitochondria
transmembrane potential loss. Upon this, the mitochondrial membrane permeability increases
and pro-apoptotic molecules such as cytochrome C are released into the cytosol. The released
cytochrome C accompanied by dATP bind to a protein named Apoptotic Protease Activating
Factor 1 (Apaf-1) which is the core of caspase-activating signal complex (Figure 1.10). In the
absence of cytosolic cytochrome C, Apaf-1 is in monomeric form, but upon presence and
binding to the cytochrome C, Apaf-1 forms an oligomeric holoenzyme complex called
apoptosome which triggers the cleavage of procaspase 9 to caspase 9. The activated caspase 9
then activates the downstream executive caspases and promotes the caspase cascade in the later
stage of the apoptosis.
Intrinsic and extrinsic pathways can be cross-linked together through a BH3 only family protein
named BH3 interacting-domain death agonist (BID). Following the cleavage and activation of
BID by caspase 8, the truncated BID is translocated to mitochondria and triggers release of
cytochrome C (Figure 1.10).
1.2.1.2.3 Common Pathway
Activation of either caspase 8 through the extrinsic pathway or caspase 9 through the intrinsic
pathway results in the activation of effector or executive caspases including caspases 3, 6 and
7. It is believed that caspase 3 is the main executive caspase. In nuclei, caspase 3 cleaves and
activates endonucleases such as Caspase-Activated DNase (CAD) which causes DNA
fragmentation, degradation and chromatin condensation (52). Another role of caspase 3 is the
proteolytic cleavage of poly(ADP-ribose)polymerase-1 (PARP-1), a nuclear enzyme involved
in DNA repair and DNA stability. In addition, it mediates the disruption of cytoskeletal
molecules such as gelsolin which is the core of actin polymerisation. The cleavage of gelsolin
then results in actin filaments depolymerisation and cytoskeletal disruption (58).

Chapter 1 Literature Review
Page 24
Figure 1.10. Apoptosis intrinsic pathway (57)

Chapter 1 Literature Review
Page 25
1.2.1.3 Apoptosis Regulatory Proteins
Cell survival is regulated by a balance between pro-apoptotic and anti-apoptotic signals. A
large group of apoptosis regulatory proteins including oncogenes and tumour suppressor
proteins have been characterised (59).
Members of a protein family named Bcl-2 family (B-cell lymphoma 2) play pivotal roles in the
regulation of the intrinsic apoptosis pathway. Bcl-2 family includes 25 either pro-apoptotic
(such as Bax, Bak, BAD) or anti-apoptotic (such as Bcl-2 and Bcl-xL) proteins that reside in
outer membrane of mitochondria and contribute to the regulation of apoptosis pathway. The
anti-apoptotic proteins block the release of cytochrome C from mitochondria and inhibit
apoptosis cascade permitting cell survival. In contrast, the pro-apoptotic proteins alter the
mitochondrial membrane permeability, induce cytochrome C release and promote cell death
(60).
Inhibitors of apoptosis proteins (IAPs) are other anti-apoptotic proteins which interact with
caspases and inhibit their activation. X-linked inhibitor of apoptosis (XIAP) is one of the IAP
members which binds to and inhibits three caspases 3, 7 and 9 (61).
1.2.1.4 Apoptosis Deregulation and Leukaemogenesis
A well-known mechanism for tumourigenesis is disrupted balance between pro and anti-
apoptotic proteins. Characterisation and cloning of the protein Bcl-2, one of the main anti-
apoptotic proteins in the Bcl-2 family, opened new insight into understanding the impact of
apoptosis in tumour development as its mutation and overexpression enhanced cell survival.
Bcl-2 derives its name from its original discovery in B-cell lymphomas. The chromosomal
translocation t(14;18) involving Bcl-2 gene on chromosome 18 and immunoglobulin heavy-
chain locus (IgH) on chromosome 14 is associated with human B-cell follicular lymphoma.
The juxtaposition of these genes results in enhanced transcription and overexpression of the
Bcl-2 protein in the cells (62), thereby promoting long-lived follicular precursor and memory
B-cells (63).
There are some pro-apoptotic Bcl-2 family proteins whose defect can also cause HM. Many
frame-shift mutations in the Bax gene have been identified in T-cell acute lymphoblastic

Chapter 1 Literature Review
Page 26
leukaemia cell lines (64). These mutations lead to a decreased level of proteins or dysfunctional
ones and cause impaired apoptosis within the tumour cells.
Another mechanism by which apoptosis contributes to cancer formation is reduced caspase
level or function. In 2002, Devarajan et al. reported undetectable caspase-3 mRNA levels in
breast and cervical cancers and substantially decreased levels of caspase 3 mRNA in ovarian
tumour cells (65). The irregular caspase expression has also been shown in HM pathogenesis.
In 2003, Takeuchi et al. reported frame-shift mutations within the coding repeats of caspase 5
gene in lymphoid leukaemia/lymphoma cell lines (66).
The third mechanism for contribution of apoptosis in tumourigenesis is abnormal death
receptor signalling. Several impairments related to death signalling have been clarified so far.
Loss of expression of death receptors, non-functional receptors and lack of proper death signals
are examples of death receptor signalling defects (67). Fas receptor also known as CD95 or
APO1, is a death receptor on the membrane of target cell. Fas ligand or CD95L is a soluble
protein which binds to the Fas receptor and causes trimerisation of the Fas receptor. Alterations
in Fas receptor or Fas ligand level or function can cause interaction failure or excessive use of
these proteins leading to neoplastic transformation. For instance, to balance peripheral
lymphocyte homeostasis, Fas is widely expressed on activated T and B-cells. Disruption of the
Fas/Fas L pathway has been reported to be highly associated with lympho-proliferation and
increased risk of lymphoid neoplasms. For instance, several somatic mutations in Fas gene
have been identified in non-Hodgkin lymphoma (68).
1.2.1.5 Apoptosis: Therapeutic Implications
In 1975, Searle et al. proposed that the chemotherapeutic agents induce apoptosis in the tumour
cell (69). Since then, a large number of drugs have been designed, which either inhibit the anti-
apoptotic molecules or enhance the expression and function of pro-apoptotic molecules. Here,
the anti-cancer agents are classified into drugs which target 1. extrinsic pathway molecules, 2.
intrinsic pathway molecules or 3. caspases.

Chapter 1 Literature Review
Page 27
1.2.1.5.1 Therapies Targeting Extrinsic Pathway Molecules
Activation of death receptors by anti-cancer agents such as death receptor agonists has shown
promising results in different malignant cells. MegaFasL as an example is a novel Fas agonist
and its usage as an effective regimen in haematological malignancy cells has been shown in
the last decade (70, 71). However, despite the potential anti-tumour activity of Fas agonists and
also TNF agonists, when they were used in vivo in murine models, they induced severe toxicity
in hepatocytes and also caused haemorrhagic necrosis (72, 73).
TRAIL (TNF-related apoptosis-inducing ligand) is another TNF family molecule which
induces cell death through binding to the death receptors DR4 and DR5. TRAIL agonists
including recombinant TRAIL natural ligand or monoclonal antibodies also trigger the
apoptosis during cancer therapy. It has been shown that TRAIL agonists act more selectively
than the other death receptor agonists and their systemic administration to animal models is
associated with less toxicity. Also, some pre-clinical studies have demonstrated that
recombinant TRAIL or antibodies against DR4 and DR5 enhance the efficacy of radiotherapy.
Administration of TRAIL agonists in combination with chemotherapeutic agents such as
doxorubicin has brought about profound apoptosis progression in animal models (74).
1.2.1.5.2 Therapies Targeting Mitochondrial Pathway Molecules
This group includes the agents that perform their activities on the inner membrane of
mitochondria. The potential anticancer drugs in this group mostly target the Bcl-2 family. Some
of these agents inhibit activity of anti-apoptotic proteins such as Bcl-2 and Bcl-xl or down-
regulate their expression. Others increase the activity of pro-apoptotic molecules such as Bax
and Bad to promote the mitochondrial apoptosis pathway.
“Oblimersen Sodium” is an antisense oligonucleotide which targets the inhibition of Bcl2
protein. At the molecular level, it binds to and degrade the Bcl-2 mRNA, leading to decreased
Bcl-2 protein translation. Pre-clinical and clinical studies have indicated that administration of
oblimersen sodium combined with chemotherapeutic agents increases their anti-cancer effects.
In a clinical trial, administration of oblimersen sodium to CLL patients who had previously
received chemotherapy resulted in reduction of hepatosplenomegaly, lymph node size and
lymphocyte count (75).

Chapter 1 Literature Review
Page 28
Another strategy includes designing small molecules which inhibit anti-apoptotic proteins. For
instance, ABT-737 and ABT-263 bind to anti-apoptotic protein such as Bcl-2 and Bcl-X(L)
with high affinity leading to their inhibition (76). ABT-199 is another small molecule Bcl-2
inhibitor, which has recently received breakthrough designation by FDA for certain types of
chronic lymphoma leukaemia (77). Findings from a phase I clinical trial showed an overall
response rate of 84% in 56 patients with high risk relapsed or refractory CLL, including 20%
complete remission (78).
1.2.1.5.3 Therapies Targeting Caspases
Due to the importance of caspases in the apoptosis pathway, targeting the initial and effector
caspases is a potential anti-tumour therapeutic strategy. In this regard, some small molecule
caspase activators have been developed to activate the effector caspases directly. Procaspase-
Activating Compound-1 (PAC-1) is the first-developed procaspase activating agent which
promotes apoptosis through triggering caspase 3 activation (79).
Caspase-based gene therapy is another strategy which recruits caspases for promotion of
apoptosis. Caspase 8 expression is frequently silenced by transcription factors such as SP1 and
ETS-like which are responsible for caspase 8 promoter hypermethylation and inactivation. 5-
aza-2’deoxycytidine (5-AZA) is a specific inhibitor of DNA methylation which demethylates
the caspase 8 regulatory sequences, enhances the activity of caspase 8 promoter and therefore
the expression of caspase 8 leading to apoptosis progress (80).
1.2.2 Cell Cycle
The cell division process is an ordered series of events within cells which lead to cell replication
and production of two daughter cells. The processes from one cell division to the another is
named “cell cycle” which is characterised by distinct biochemical steps (81). The whole cell
cycle takes different amounts of time depending on the organism. For instance, cell division in
bacteria like Escherichia coli takes around 20-30 minutes, and unicellular yeast divide every

Chapter 1 Literature Review
Page 29
90-120 minutes (82, 83). One complete cell cycle takes around 24 hours in most mammalian
cells (81).
1.2.2.1 Cell Cycle Stages
The cell cycle events are classified into four main phases (Figure 1.11). The step where the
division of the cell occurs and two daughter cells are formed is known as mitotic phase (M
phase). Since each daughter cell needs to receive the same amount of genetic complement from
the mother cell, the parent cell needs to duplicate its DNA prior to cell division. The DNA
synthesis process is carried out during a stage named synthesis phase (S phase). Furthermore,
there are two gaps during the cell cycle; the first gap is located between the end of M phase
and onset of DNA synthesis, known as gap 1 phase (G1 phase) and the second gap is between
the end of DNA synthesis and onset of M phase (G2 phase). At G1 phase, the cell grows and
new organelles in addition to many proteins and RNAs are synthesised. These molecules are
required for cell growth and DNA synthesis prior to division. At G2 phase, the repair systems
are activated to correct any DNA damage that may have occurred during S phase. Total G1, S
and G2 phases are known as a single phase called interphase (84). The majority of the cell
cycle process takes place in interphase. In a proliferating human cell, interphase typically needs
20 hours to be completed while mitosis phase takes only less than an hour (81) .
Before cell entry to the S phase, cells might pause in the G1 phase and enter to a state of
quiescency called G0 phase. In G0 phase, the cell is neither dividing nor preparing to divide.
At any one time, most of the cells in the mammalians body are in G0 phase. Some cell types
such as neuronal cells and heart muscle cells remain in G0 phase during the life span of the
whole organism, whereas some specialised cells such as haematopoietic, gut epithelium and
skin cells are always proliferating (85).

Chapter 1 Literature Review
Page 30
Figure 1.11. Average time spent in each phase of the cell cycle in a human cell

Chapter 1 Literature Review
Page 31
It is important to know that there is a small difference between a G0 cell and a quiescent cell.
Quiescent cells are those which have reached a state of terminal differentiation and never re-
enter the G1 phase, whereas G0 cells may enter the cell cycle if needed.
1.2.2.2 Cell Cycle Regulation
There are several checkpoints within the cells that prevent them from entering the next step
while they have not completed the previous step. Also, there should be certain checkpoints
which allow G cells or newly divided cells to re-enter the cell cycle.
The central molecules which positively regulate the cell cycle are called cyclin-dependent
kinases (CDKs). CDKs are small serine/threonine protein kinases that have low enzymatic
activity. CDKs have regulatory subunits referred as “cyclins” whose attachment to CDKs leads
to CDK activation. CDKs 1, 2, 4 and 6 and cyclins A, B, D and E are the main CDKs and
cyclins that function in specific phases of the cell cycle (81). CDKs 2, 4 and 6 are G1-specific
CDKs. Cyclin D-CDK 4-6 complexes help the cell to progress toward late G1 phase. CDK2
however functions in late G1 phase and is responsible for G1 phase completion and cell entry
to S phase (81). Progression from either S to G2 or from G2 to M phase is dependent on cyclin
A expression (85) whereas cyclin B-CDK1 complex promotes M phase progression (86).
A different group of proteins have been identified as negative regulators of the cell cycle. These
proteins are referred as cyclin-dependent kinase inhibitor protein (CDKIs or CKIs). CDKIs
which function as tumour suppressor genes normally inhibit G1-specific CDKs and lead to cell
cycle arrest at G1 phase. p16, p19, p21/WAF1 and p27 are examples of CDKIs which inhibit
CDK2, CDK4, CDK6 or G1 related cyclin-CDK complexes (81).
Cell cycle progression is also regulated by a variety of external signals such as growth factors
and stress stimuli. These stimuli affect cell cycle through different signal transduction
pathways. The Ras/Raf/MAPK pathway is one of the main signalling pathways which controls
the cell cycle mainly through the activation of G1 cyclin-CDK complexes (87).

Chapter 1 Literature Review
Page 32
1.2.2.3 Cell Cycle Deregulation and Leukaemogenesis
The final aim of the cell cycle is to replicate exactly one copy of DNA, not more and not less,
to produce two identical chromosomes during synthesis phase and then to segregate the
chromosomes equally between two daughter cells. Defects in the process can lead to serious
abnormalities.
The role of deregulation of the cell cycle components in haematological malignancy
development and progression has been well established. Due to the high rate of haematopoietic
cell turn over, maintaining the balance between cell death and cell proliferation is an essential
element for normal haematopoiesis. B-cell chronic lymphocytic leukaemia (B-CLL) is a well-
identified example of haematological malignancies in which tumour cells accumulate through
reduction of cell death process rather than high proliferation. In contrast, Burkitt lymphoma is
a type of haematological malignancies which is characterised by high proliferation index and
increased activity of cell cycle promoters.
In 2010, Gladkikh et al. examined the expression of cyclin D1 in different types of lymphomas
compared with normal mature B-cells and showed a four-fold increase in cyclin D1 expression
in mantle cell lymphoma (MCL) compared to normal lymphocytes (88). Cyclin E is also a
proto-oncogene whose amplification and overexpression have been reported in ALL and AML
(89, 90).
As discussed above, CDK inhibitors negatively regulate cell cycle. The deregulation of CDKI
gene has been reported in leukaemia development. p16INK4 for instance is a critical regulator
of CDK activity, which specifically binds to CDK4 or CDK6 and inhibits cell cycle progression
(91). The homozygous deletion of chromosome 9 (del9p21) containing p16INK4 gene resulting
in its complete or partial loss has been documented in different types of haematological
malignancies (92).
1.2.2.4 Cell Cycle: Therapeutic Implications
Over the last several years, our understanding about the role of genetic alterations in CDKs,
CDKIs and other cell cycle molecules in carcinogenesis have opened new insights into
designing anti-cancer agents which target these molecules. CDKs, which are the key motor of

Chapter 1 Literature Review
Page 33
cell cycle progression are known to be upregulated in malignancies. Many novel synthetic
CDK inhibitors have been developed to inhibit CDKs expression and induce cell cycle arrest
in the tumour cells. These anti-cancer agents can either directly target the catalytic activity of
CDKs or target the regulatory mechanisms that contribute to CDK activity.
Flavopiridol is a pan CDK inhibitor, which binds to, and inhibits CDKs 1, 2, 4, 6 and 7 and
leads to cell cycle arrest at the G1 to S as well as G2 to M points. Several clinical trials have
assessed the proliferation inhibitory effect of flavopiridol on a variety of human malignancies.
In a clinical trial, a novel schedule with specific doses of flavopiridol was employed in patients
with refractory CLL who had high-risk cytogenetic abnormalities. It was reported that 45% of
patients attained a high response with durable remissions (93).
Seliciclib or CYC202 is another CDK inhibitor, which inhibits multiple CDKs. This agent
selectively blocks CDK2–cyclin E, CDK2–cyclin A, CDK7–cyclin H and CDK9–cyclin T1.
CYC202 has been shown to increase the sub G0/G1 population and down-regulates cyclins D1
and H in mantle cell lymphoma cell lines (94).
1.2.3 Signal Transduction Pathways
The signals created by extracellular stimuli are transmitted to the downstream effector cells by
a series of phosphorylation steps through pathways known as signal transduction pathways.
The transduced signal into nuclei up-regulates or down-regulates certain genes on DNA, which
are associated with various cellular processes such as proliferation, growth, apoptosis and
differentiation (95). Ras/Raf/MEK/MAPK, PI3K/Akt, JAK/STAT and Wnt signalling
pathways are examples of signal transduction pathways which play key roles in cell
proliferation and apoptosis.
The Ras/Raf/MEK/MAPK pathway is one of the best categorised signal transduction pathways
in cell biology (96). The external stimuli such as growth factors first activate Ras protein by
GDP-GTP exchange (Figure 1.12). Activated Ras phosphorylates and activates different
transduction molecules like serine-threonine kinase Raf. Activated Raf then phosphorylates
MEK (MAPK/ERK kinase), which subsequently phosphorylates MAPK (Mitogen-Activated
Protein Kinase) molecules such as ERK1 and ERK2. Upon phosphorylation, the activated

Chapter 1 Literature Review
Page 34
ERK1 and ERK2 translocate into nuclei where they activate their substrates; transcription
factors which can further change gene expression (97).
PI3K/Akt/mTOR is another important signalling pathway that regulates numerous cellular
functions such as angiogenesis, metabolism, survival and apoptosis. The proto-oncogene AKT
is the main enzyme in this pathway, which mainly inhibits apoptosis (98). Upon the pathway
activation, phosphatidylinositol tri phosphate (PIP3) is produced by phosphoinositide 3-kinase.
PIP3 acts as plasma membrane docking site for proteins such as AKT (Figure 1.12). Akt is then
phosphorylated and activated by kinase activity of another molecule and transduces the signals
into nuclei through phosphorylation and activation of downstream molecules (99).
1.2.3.1 Signal Transduction Pathway Deregulation and Leukaemogenesis
Defects in signal transduction pathways are highly linked with oncogenic transformations. The
ERK pathway is the best-studied mammalian cell signalling pathway and its deregulation has
been associated with one-third of all human cancers (96). The ERK pathway is mostly
associated with cell proliferation, thus its overexpression contributes to tumourigenesis. As
explained above, Raf and Ras groups are the initiator molecules of this pathway. The mutations
occurring on these early stage molecules are the leading causes of consecutive activation of
ERK pathway resulting in cancer development. For instance, B-Raf mutation alone is found in
66% of malignant melanomas and is seen in various other malignancies such as colon and
pancreatic cancers at lower frequencies (100). The ERK pathway deregulation has been
reported in haematological malignancies as well. Okuda et al. showed that
hyperphosphorylation and activation of proto-oncogene Raf-1 is highly associated with clonal
evolution of myeloid leukaemic cells. Ras mutations are also seen in nearly 40% of patients
with MM and in about 30% of myelodysplastic syndromes and AMLs (101, 102).
PI3K/Akt/mTOR contains various oncoproteins and tumour suppressors, and deregulation of
these components can mediate tumour development. Constitutive activation of PI3k/AKT
pathway has been reported in half of AML cases (103). As AKT is a survival factor, its
overactivation is highly associated with tumour survival and drug resistance. Blackburn et al.

Chapter 1 Literature Review
Page 35
Figure 1.12. Overview of main signal transduction pathways involved in cell
proliferation and apoptosis

Chapter 1 Literature Review
Page 36
reported that at least 50% of relapse-driving leukaemic cells evolved genetic lesions and
epigenetic modifications that acquired AKT activation (104). They showed that inhibition of
AKT pathway in acute lymphoblastic leukaemia restored the malignant cell responses to
chemotherapy.
1.2.3.2 Signal Transduction: Therapeutic Implications
Signalling pathway molecules have high potential to be exploited as targets for cancer
treatment. As mentioned, mutant up-regulated B-Raf is commonly seen in various cancers and
therefore B-Raf inhibitors are amongst the best potential therapeutic candidates. Two B-Raf
inhibitors namely BAY43-9006 (Sorafenib) and PLX4032 (Vemurafenib) have obtained FDA
approval and are in clinical use in advanced renal cell and hepatocellular carcinomas and in
late-stage melanoma, respectively (105).
RAS genes are the most commonly mutated oncogenes in human cancers and thus designing
therapeutic agents inhibiting Ras activity is of considerable interest. Enzyme Farnesyl
transferase (FTase) is responsible for activating the inactive cytosolic Ras. Synthetic inhibitors
of FTase (FTIs) have shown promising activities in treating haematological cancers in clinical
trials (106).
Inhibitors of PI3k/AKT/mTOR pathway are other examples of anti-cancer agents.
Administration of these agents caused partial response in patients with gynaecological and
breast cancer (107). It is also well established that inhibition of PI3k/AKT/mTOR pathway can
restore the tumour cells sensitivity to chemotherapy and radiotherapy. Therefore, their
combination with chemotherapy can increase the efficacy of standard treatments (108).
Amongst the PI3k inhibitors in development, idelalisib is the most studied compound in
haematological malignancies, and was recently granted a full FDA approval to treat patients
with relapsed CLL (109, 110).
1.2.4 The Role of Immune System in Tumourigenesis
Immuno-oncology research has provided strong evidence that tumour cells can be recognised
by the immune system and destroyed or controlled by complex immune pathways. Cancer
development has been shown to be accompanied by immune suppression in many types of

Chapter 1 Literature Review
Page 37
cancers, leading tumour cells to escape from immune system. The mechanism of this escape
varies. Loss of tumour antigens, which normally make them recognisable to immune cells, and
loss of tumour cell sensitivity to T-cells or natural killer (NK) cells are examples. Moreover,
alterations in cytokine production by tumour cells or immune cells can provide a beneficial
tumour microenvironment for cancer cells, as those can inhibit the immune cell activity (111).
Our understanding from the mechanisms by which immune cells and molecules lose their
immunosurveillance ability has opened new insights into developing immunotherapy
approaches for cancer treatment. Designing these strategies has helped us to boost immune
system responses against cancers. These strategies, for instance, can suppress the unfavourable
tumour microenvironment which is caused by suppressive cytokines produced by tumour cells
and immune cells. Specific anti-tumour immunity has been achieved by using antibodies
designed for certain tumours or using agents which induce T-cell expansion (112).
1.2.4.1 Immune Response: Therapeutic Implications
Over the last two decades cancer immunotherapy (exploiting immune system mechanisms to
treat cancers) has become a main focus of anti-neoplastic agent research. One of these
approaches is to administer cancer vaccines by which the immune system would be able to
recognise tumour cells. Another method is the use of passive immunotherapy by administration
of monoclonal antibodies. The designed antibodies are specific for tumour specific antigens
and therefore their binding to the tumour cell surface helps the immune system to recognise
and kill the tumour cells. This approach promotes antibody-dependent cellular cytotoxicity
(ADCC), whereby immune cells such as NK cells recognise the antibody-coated tumour cells,
bind to them and destroy the cancer cells by cytolytic activity.
Rituximab, a monoclonal anti-CD20 antibody, is one of the best categorised chimeric
monoclonal antibodies, which is widely used in patients with certain types of leukaemias and
lymphomas. CD20 is highly expressed on neoplastic B-lymphocytes and using anti-CD20
along with chemotherapeutic agents has improved the outcome of patients with B-cell
neoplasms. It has been identified that binding of rituximab and CD20 triggers NK-cells to
mediate ADCC (113).

Chapter 1 Literature Review
Page 38
Targeting immune checkpoints that maintain physiologic self-tolerance has been a focus of
cancer immunotherapy in recent years. Cytotoxic T-lymphocyte antigen-4 (CTLA-4) is a
protein receptor that regulates the immune system and tolerance through inhibition of T-cells.
Clinical and pre-clinical data have shown that blockade of CTLA-4 using anti-CTLA-4
monoclonal antibody therapy is a promising approach for a number of cancers, particularly
advanced melanoma (114). It is believed that suppression of inhibitory signals leads to the
generation of an antitumor T-cell response, and therefore CTLA-4 blockade results in direct
activation of CD4+ and CD8+ effector cells (115). Programmed cell death protein 1 (PD-1) is
another immune checkpoint, that down-regulates immune system by preventing the activation
of T-cells, and its blockade by monoclonal anti-PD-1 antibodies restores the immune function
in the tumour microenvironment in melanoma, renal and non-small cell lung cancers (116).
Another approach of cancer immunotherapy is use of immune cells such as NK cells and
cytotoxic T-cells. To increase the cytotoxic activity of immune cells in patients, these cells are
isolated from the patient’s body, activated in vitro, enriched and then transfused back to patient
(117). Another method is to administer therapeutic cytokines such as alpha/beta interferons to
stimulate and activate the immune cells in vivo (118).
1.2.5 Cancer Therapy Complications
Despite promising tumour growth-inhibitory effects in pre-clinical tests, many potential
therapies fail in clinical trials when adverse unexpected side effects become apparent.
Traditionally anti-cancer chemotherapy targets rapidly dividing cells. Therefore, normal cells
which have high-proliferating potential are also affected. Novel therapeutic agents are designed
to target specific molecules (targeted therapy). However, these targeted therapies are not
always completely free of side effects either. For instance, usage of the B-Raf enzyme inhibitor
vemurafenib, the first targeted molecular therapy, is highly associated with a rapid emergence
of acquired resistance and adverse dermatological effects. It also stimulates B-Raf expression
in V600E B-Raf negative patients, promoting melanoma growth (105, 119). Monoclonal
antibodies are another example of targeted therapy as they specifically target the cancer
antigens located on tumour cells. Monoclonal antibodies are generally safer than chemotherapy
and the side effects mainly include mild allergic reactions such as urticaria. However, they can

Chapter 1 Literature Review
Page 39
also cause severe reactions such as infusion reactions and serum sickness. Rituximab (anti-
CD20), as an example, generally causes only mild toxicities. However, severe complications
such as anaphylactic reactions, high risk of tumour lysis syndrome in patients who have high
burden of circulatory tumour cells, and myocardial infarction have been reported (120).
1.2.6 A Role for Natural Products for Cancer Treatment
Toxicity, drug resistance and increased risk of developing secondary cancers from
chemotherapeutic chemicals often limit their efficacy in cancer treatment. Concerns over these
complications have generated interest in exploiting natural products, as they are generally safer
and have multi-functional mechanism of action for cancer treatment. In the last decades,
organic substances derived naturally from microbes and plants; either in their unmodified
(naturally occurring) or synthetically modified analogues, have provided a number of useful
cancer chemotherapeutic drugs (121). Taxol is an examples of these molecules, which is used
to treat a number of cancers such as breast and colon cancers. It was first isolated from bark of
the Pacific yew, Taxus brevifolia (122).
Due to the multi-functional properties, natural products are also being tested as adjuvants for
use in synergy with chemotherapeutic agents. For example those with immunomodulatory
effects can reduce immune suppression and the associated increased risk of infection. In
George et al. (123) study, Indukantha Ghritha, a polyherbal preparation consisting of 17 plant
components, was used as an adjuvant to cyclophosphamide cancer chemotherapy and shown
to stimulate the haematopoietic system and induce leucopoiesis in tumour-bearing mice. When
administrated in combination with cyclophosphamide, it reversed myelosuppression induced
by cyclophosphamide suggesting its potential to minimise or reverse chemotherapy-induced
leucopenia.
Polysaccharides include a large family of diverse biopolymers constituted by monosaccharide
residues linked together by O-glycosidic linkage and can be seen in both natural and semi-
synthetic forms (124). Due to structural diversity, polysaccharides display the highest
biological properties among macromolecules. Many natural polysaccharides obtained from
natural sources such as plants and algae have demonstrated anti-cancer properties. The
multifunctional structure of natural polysaccharides also allows them to be used in conjugation

Chapter 1 Literature Review
Page 40
with anti-cancer agents which lack physiochemical and biopharmaceutical properties (124,
125). Among those, fucoidan derived from brown seaweeds has gained significance in the
treatment of cancer.
1.3 Fucoidan
(This section has been substantially published in Atashrazm et al. 2015 (126))
Seaweeds have been a part of diets in China, Japan, and Korea since ancient civilization.
Approximately, 400 different types of seaweeds are consumed by humans as food and for
medical purposes (127). In the 11th century, in “The Canon of Medicine” -an encyclopaedia of
medicine compiled by Persian polymath Avicenna (Bu-Ali Sina)-, the medical values of algae
of different species were described. Among those, the usage of marine algae in treatment of
tumours, vesicles, and joint pain has been proposed (128).
Polysaccharides are of the main functional components in the structure of seaweeds. Fucoidan
is a sulphated polysaccharide that exists in cell wall matrix of different species of brown
seaweeds such as mozuku, limumoui, bladderwrack and wakame. Variant forms of fucoidan
have been also recognised in some marine invertebrates (129) such as sea urchins (130) and
sea cucumbers (131). The first isolation of fucoidan was carried out by Professor Kylin from a
slimy ingredient of Kombu in 1913 (132). Research studies based on fucoidan functional
activities and biological properties started to gain importance in early 1970’s. These studies
have reported the potent physiological and biochemical properties of fucoidan such as its
cytotoxic activities (133-135).
Due to its heterogeneity and natural source, fucoidan remains unexploited as a basis of
therapeutics. It is believed that pharmaceutical companies prefer “druggable” small molecules
rather than larger and polydisperse compounds (136). In recent decade, few companies have
attempted to produce fucoidan for research use. In limited studies, commercially available
heterogeneous fucoidans have been examined in several clinical trials mainly for their anti-
coagulant and anti-viral properties. It is suggested that reproducibly defined fucoidan fractions
could be created from controlled sources of seaweed, using modern extraction and
characterization methods. As suggested by Fitton (136), high quality defined fucoidan could

Chapter 1 Literature Review
Page 41
be produced to standards suitable as ingredients in medical devices and even cross the threshold
into drug development route”.
1.3.1 Fucoidan Structure
Fucoidan is a heterogeneous sulphated polysaccharide and its chemical composition differs
based on the seaweeds source, harvesting time, and local climate conditions (137, 138).
Fucoidan mainly consists of sulphated L-fucose with a fucose content of 34-44% (139) and
can contain a large quantity of other monosaccharaides such as galactose, mannose, xylose and
uronic acid all of which make up less than 10% of the total fucoidan structure. The degree of
sulphation varies between 4-8% based on the harvesting location and season (138). The
molecular weight (MW) of fucoidan also differs mainly according to the type of the seaweed
from which it is isolated (132).
1.3.2 Fucoidan Sources
Fucoidan is widely extracted from different sources of seaweeds such as Fucus vesiculosus,
Cladosiphon okamuranus and Sargassum muticum. Among those, Undaria pinnatifida and
Fucus vesiculosus are two major sources of fucoidan that have been shown to have powerful
biological activities in vitro and in vivo.
1.3.2.1 Undaria pinnatifida
Undaria pinnatifida also called wakame or Japanese kelp can reach an overall length of about
0.5-3 metres (Figure 1.13). Wakame is edible seaweed and is widely consumed in Asian
countries. The extracted fucoidan from this alga has been classified by the United States FDA
as GRAS (Generally Regarded as Safe).
This seaweed is native to Japan, Korea and China, however, it has been spread out from its
origin to other sites of the world such as the Atlantic and Mediterranean coasts of Europe (140-
142) and shores of New Zealand (143), Argentina (144) and Australia (145, 146).

Chapter 1 Literature Review
Page 42
1.3.2.2 Fucus vesiculosus
Fucus vesiculosus is the scientific name for brown macro algae named bladderwrack. It
contains a main midrib while paired spherical vesicles surround it (Figure 1.14). Its colour
varies from light yellow to brownish-green and its maximum length reaches to around 2-3 feet.
Bladderwrack is found on the coasts of the North Sea and the Atlantic and Pacific Oceans.
Figure 1.13. Undaria pinnatifida
Figure 1.14. Fucus vesiculosus

Chapter 1 Literature Review
Page 43
1.3.3 Fucoidan Metabolism
Fucoidanase, the enzyme responsible for fucoidan hydrolysis, has only been found in brown
seaweed and marine microorganisms such as some marine bacteria and fungi (147) and not in
humans. It is possible that the acidic conditions in the stomach could degrade fucoidan,
however it has been reported that the low gastric pH has restricted effects on fucoidan (148).
Transport across Gut
Investigations over fucoidan transportation across the gut have shown that small amounts of
dietary fucoidan can be endocytosed and cross the intestinal wall directly without breaking
down (148). In Tokita et al. study, 10 volunteers were given oral fucoidan and the
concentrations of fucoidan in the serum and urine were analysed. Fucoidan was detectable 3
hours after administration and increased to 100 ng/mL in serum and 1000 ng/mL in urine.
Although, the rate of absorption in the small intestine was highly variable among the
participants. The MW of fucoidan in serum was similar to administered fucoidan indicating
that fucoidan was not hydrolysed by digestive enzymes (149). However, the MW of the
fucoidan detected in urine was significantly smaller than the ingested fucoidan suggesting that
fucoidan is degraded in the excretory system and possibly the kidney and not by intestinal
enzymes or normal flora.
Transport across Cell Membrane
To evaluate the fucoidan uptake process by cells, the internalisation of low molecular weight
(LMW) fucoidan into rabbit smooth muscle cells (SMCs) was analysed. Fucoidan was shown
to be internalised by endocytosis at 6 hours. The number of vesicles containing fucoidan
increased in the peri-nuclear region at 24 hours, but nuclear internalisation was not observed
at any time during the study (150). However, examining the transport of a native fucoidan from
Cladosiphon okamuranus with MW of 80 KDa revealed a poor permeation of fucoidan across
the human colon adenocarcinoma Caco-2 cell monolayer (151).
Regarding the specific ligands by which fucoidan binds to the cell surface, several molecules
have been proposed including class A macrophage scavenger receptors for fucoidan attachment
to macrophages (152) as well as adhesion molecules such as integrins (153), L-selectin and P-
selectin (154). However, Aisa et al. reported the anti-tumour activity of fucoidan on human

Chapter 1 Literature Review
Page 44
HS-Sultan lymphoma cells while these cells lack selectin on their surface indicating that
fucoidan exerted its activity through selectin-independent mechanisms (155). Two main
pathways have been described for receptor-mediated endocytosis including the clathrin-
dependent and the caveolae/lipid raft-dependent endocytic pathways. In recent studies, it has
been revealed that endocytosis of fucoidan is performed by caveolae-dependent pathway (156).
1.3.4 Fucoidan Biological Properties
A century after discovery of fucoidan, only recently, the biomedical potentials of fucoidans
have been elucidated. It has been reported that this agent has effect on the immune system and
can enhance rapid haematopoietic stem cell mobilization (134). Kim et al. studied the
immunomodulatory effects of fucoidan on dendritic cells and indicated that viability of
dendritic cells and production of some important immune system proteins such as TNF-α and
IL-12 increased in the presence of fucoidan (157). Additionally, fucoidan has been reported as
an antiviral (135) and antioxidant (158) agent. All research conducted on fucoidan have proved
it to be non-allergenic with no significant toxicological effects in human and animals. Human
trials involving orally administration of fucoidan to healthy volunteers showed no adverse
effect on liver, renal and haematopoietic function over a period of three months (128).
1.3.5 Fucoidan’s Anti-Cancer Potential
The anti-cancer property of fucoidan has been demonstrated in vivo and in vitro in different
types of cancers. Nevertheless, it has been rarely used for its anti-cancer activity in clinical
trials. Fucoidan mediates its activity through various mechanisms such as induction of cell
cycle arrest, apoptosis and immune system activation. Additional activities of fucoidan have
been reported that may be linked to the observed anti-cancer properties and these include
induction of inflammation through immune system, oxidative stresses and stem cell
mobilisation (159).

Chapter 1 Literature Review
Page 45
1.3.5.1 Fucoidan and Cell Cycle
Fucoidan induces cell death through modulation of cell cycle and results in accumulation of
sub-G0/G1 cells (dead cells/apoptotic cells) in a variety of cell types (155, 160). It can also
induce cell cycle arrest in other phases; Riou et al. (161) and Mourea et al. (162) reported arrest
in G1 phase in a chemo-resistant non-small-cell bronchopulmonary carcinoma line by fucoidan
from Ascophyllum nodosum and Bifurcaria bifurcate, respectively.
In an investigation of its mechanism of action, fucoidan demonstrated significant down
regulation of cyclin D1, cyclin D2 and CDK4 in cancer cells (163-165). The crude fucoidan
from Fucus vesiculosus increased the level of p21/WAF1/CIP1 in human prostate cancer PC3
cells and down-regulated E2F; a transcription factor that controls progression of cells from G1
to S phase (163).
In a recent study, fucoidan down-regulated cyclin E, CDK2, CDK4 resulting in G0/G1 arrest
in human bladder cancer 5637 cells. Furthermore, immunoprecipitation assays revealed a
significant increase in the binding of p21/WAF1/CIP1 to CDK2 and CDK4 in cells treated with
fucoidan, suggesting that the induced G0/G1 arrest is due to suppression of CDK activity
following direct binding of this CDK inhibitor to CDKs 2 and 4 (166). Table 1.4 summarises
findings of studies examining the effects of fucoidan on cell cycle.
1.3.5.2 Fucoidan and the Apoptosis Pathway
Several studies examining a variety of cancers such as haematopoietic, lung, breast and colon
cancers have shown that fucoidan-mediated cell death occurs through triggering apoptosis
(Table 1.4) (160, 167, 168). A very low dose of fucoidan from F. vesiculosus (20 µg/mL)
activated common caspases 3 and 7 in human colon cancer cells (167), whereas it induced the
same activity in T-cell leukaemia at a much higher concentration (3 mg/mL) (165). Caspase 8
and 9 are also activated by fucoidan (167). Yamasaki-Miyamoto et al. showed that pre-
treatment with caspase 8 inhibitor completely blocked fucoidan mediated apoptosis in MCF-7
breast cancer cell line (168). In contrast, in Zhang et al. study (160), the mediated apoptosis by
fucoidan from Cladosiphon okamuranus in MCF-7 human breast cancer cell line was shown
to be caspase independent. As cytochrome C and apoptosis inducing factor (AIF) increased in

Chapter 1 Literature Review
Page 46
Table 1.4. Effects of fucoidan on cell cycle and apoptosis molecules Ref Cell Type Fucoidan
Source
Dose
(µg/mL)
Effects on Cell Cycle Effects on Apoptosis Pathways
Extrinsic Intrinsic Common
(155) lymphoma HS-sultan cells
F. vesiculosus
100 • ↑ sub G0/G1 • No G0/G1 or G2/M arrest
- • ↓ MMP • Caspase 3 activation
(165) HTLV-1 infected T-cell HUT-102-
cells
C. okamurans
3000 • G1 arrest • ↓ cyclin D2, c-myc • No changes in p21,p53
Apoptosis was reversed by caspase 8 inhibitor
• Caspase 9 activation • No changes in Bcl-2 and Bcl-XL • ↓survivin, cIAP-2
• Apoptosis was reversed by caspase 3 inhibitor
(169) Hepatocellular carcinoma
Okinawa mozuku
22.5 • ↑ G2/M phase in HAK-1A, KYN-2, KYN-3 cell lines - • No clear caspase 9 activation in HAK-1B cell line
• No clear caspase 3 activation in HAK-1B cells
(168) Breast cancer MCF7 cells
Not mentioned
1000 • ↑ sub-G1 fraction • Caspase 8 activation
• Caspase 9 activation • ↓ Bid, cytosolic Bax, ↑ Bax, cytochrome C
• Caspase 7 activation • PARP cleavage
(170) Acute leukaemia NB4 and HL-60
cells
F. vesiculosus
150 • ↑ sub-G1 fraction • Caspase 8 activation • caspase 9 activation • No changes in Bcl-2 or Bax. • ↓ Mcl-1, ↑ cytochrome C
• PARP cleavage • Caspase 3 activation
(167) Colon cancer HT-29 and HCT116
cells
F. vesiculosus
20 - • Caspase 8 activation • ↑ Fas, DR5, TRAIL • No significant effects on
FasL and DR4
• Caspase 9 activation • ↑ cytochrome C, Smac/Diablo, Bak, t-Bid • No changes in Bcl-2, Bcl-xL, Bax, Bad, Bim,
Bik, ↓ XIAP, survivin
• PARP cleavage • Caspase 3 and 7 activation
(171) Lung cancer A549 cells
U. pinnatifida
50, 100, 200
• ↑ Sub‐G1frction - • Caspase‐9 activation • ↓ Bcl‐2 , ↑ Bax
• ↓ procaspase‐3 • PARP cleavage
(160) Human breast cancer MCF-7
cells
Cladosiphon novae-
caledoniae
82, 410, 820
• ↑Sub-G1 • No significant changes in cell cycle distribution
• No changes in caspase-8 • Mitochondrial dysfunction • AIF and cytochrome C release • No cleavage of caspase-9 and Bid. • ↓ Bcl-2, Bcl-xl ,↑ Bax, Bad
• No activation of PARP and caspase-7
• All caspase inhibitors failed to attenuate FE-induced apoptosis
(172) Hela cells Sargassum filipendula
1500 - - • No effect on caspase 9 activation • ↑ cytosol AIF
• No effect on caspase 3 (Caspase independent)
(164) Breast cancer MCF-7 cells
F. vesiculosus
400, 800, 1000
• G1 phase arrest • ↑ Sub G0/G1 ↓ cyclin D1 and CDK-4 gene expression
• Caspase-8 activation • ↓ Bcl-2, ↑ Bax • Release of cytochrome C and APAf-1
• Caspase-dependent pathway
(163) Prostate cancer PC-3 cells
U. pinnatifida
100 • G0/G1 phase arrest • ↓ E2F-1, ↑ p21Cip1/Waf
• DR5, caspase-8 activation
• ↓ Bcl-2 , ↑ Bax, • Caspase 9 activation
• Caspase-3 activation • PARP cleavage
(173) Hepatocellular Carcinoma
SMMC-7721 cells
U. pinnatifida
1000 • Non-significant accumulation in S-phase • Caspase-8 activation
• Caspase-9 activation • MMP dissipation, Cytochrome C release • ↓ Bcl-2, ↑ Bax • ↓ XIAP, livin mRNA expression
• Caspase-3 activation
(166) Human bladder carcinoma 5637 and T-24 cells
F. vesiculosus
100 • ↑ G1-phase, p21WAF1 • ↓ Cyclin E, D1, DK2, CDK4 - - - • No change in p27KIP,p53 • ↑ p21WAF1 and CDK4 binding

Chapter 1 Literature Review
Page 47
the cytosol, it was concluded that fucoidan performed its activity through mechanisms altering
mitochondrial function.
Fucoidan also affects other components of extrinsic and intrinsic pathways. Analysing the
extrinsic pathway, 20 µg/mL crude fucoidan from F. vesiculosus increased the levels of the
death receptors Fas, DR5 and TRAIL but not FasL and DR4 in human colon cancer cell lines
(167). Contradictory results have been described in the expression of Bcl-2 family members in
response to fucoidan (Table 1.4). Treatment of MDA-MB231 breast cancer cells with 820
µg/mL of low molecular weight (LMW) fucoidan resulted in a significant decrease in anti-
apoptotic proteins Bcl-2, Bcl-xl and Mcl-1 (174). In contrast, no changes in expression of Bcl-
2, Bcl-xl, Bad, Bim and Bik were observed in colon cancer cells when they were treated with
20 µg/mL fucoidan from Fucus vesiculosus (167). Taken together, these findings suggest that
fucoidan may interact with several components of the apoptosis pathway.
1.3.5.3 Fucoidan and Angiogenesis
Fucoidan inhibits the formation of new vessels by which tumour cells receive their oxygen and
required nutrients. Fucoidan inhibited the binding of VEGF, a key angiogenesis promoting
molecule, to its cell membrane receptor (175). Xue et al. examined the anti-angiogenic
properties of fucoidan in 4T1 mouse breast cancer cells both in vitro and in vivo and observed
a significant dose-dependent decrease in VEGF expression in cells treated with fucoidan (176).
Further, in a mouse breast cancer model using 4T1 cells, intraperitoneal injections of 10 mg/kg
body weight fucoidan from F. vesiculosus markedly reduced the number of microvessels.
1.3.5.4 Fucoidan and Metastasis
Fucoidan significantly decreased tumour cell metastasis to the lungs in animals that were
intravenously injected with rat mammary adenocarcinoma 13762 MAT cells (177). It was first
reported that fucoidan inhibits cell invasion through competing with tumour cell binding with
laminin in the basement membrane (178). Subsequent studies then revealed that fucoidan binds
to fibronectin with high affinity and prevents attachment of tumour cells (179).

Chapter 1 Literature Review
Page 48
Tumour invasion requires the secretion of proteolytic enzymes by tumour cells to break down
the extracellular matrix (ECM) proteins (e.g. collagen, fibronectin and laminin), with the
matrix metalloproteinases (MMPs) MMP-2 and MMP-9 playing a major role. Fucoidan
attenuates both expression and activity of these enzymes (180).
Selectin inhibition by fucoidan interferes with tumour cell–platelet interaction. When highly
metastatic MDA-MB-231 breast cancer cells were plated in platelet-coated plates in the
presence or absence of 100 µg/mL fucoidan the number of cells attached to the platelets
decreased by 80% in the presence of fucoidan (181). Interaction of tumour cells with platelets
is one of the key factors in facilitating the early steps of tumour cell migration. During tumour
cell migration, most circulating tumour cells do not survive attack from immune cells or the
shear forces of the blood stream. However, they can attach to platelets to induce platelet
aggregation allowing the tumour cell cluster to survive in the micro-vascular system. It was
concluded that fucoidan inhibited P-selectin residing on the platelet surface and led to reduced
number of attached tumour cells. Fucoidan can also inhibit other adhesion molecules such as
integrins residing on the tumour cell surface and can modify distribution of their subunits.
1.3.5.5 Fucoidan and Signalling Pathways
The Ras/Raf/MAPK pathway is often hyperphosphorylated in a variety of human cancers.
Various studies have shown that fucoidan inhibits tumour cell proliferation by decreasing
ERKs activity through reduction of its phosphorylation (155, 182).
JNK and p38 are other MAPK superfamily members whose activity is altered by fucoidan.
Fucoidan induced cell death in breast cancer cells through phosphorylation and of JNK and
p38 after 30 minutes. The fucoidan-induced apoptosis significantly annulled in the presence of
JNK inhibitor, indicating critical role of JNK in fucoidan-mediated apoptosis (160).
Similarly, the PI3K/Akt, GSK and Wnt pathways have been shown to be triggered by fucoidan.
Akt over-activation is linked with drug resistance and tumour cell survival. Most of the studies
have reported inactivation of Akt by fucoidan. PI3k, an upstream molecule of Akt, is also
inhibited by fucoidan (180). Upregulation of the Wnt signalling pathway is believed to have a
critical role in prostate cancer development, survival and progression. Fucoidan from F.

Chapter 1 Literature Review
Page 49
vesiculosus activated GSK-3β in PC3 human prostate cancer cells resulting in hypo-
phosphorylation and inactivation of β-catenin (163).
1.3.5.6 Fucoidan and the Immune System
The effects of fucoidan on molecules of the immune system have been studied both in-vitro
and in-vivo and effects on both cellular and humoral elements have been described. Fucoidan
increases both activity and number of NK cells in vivo (183, 184). Increase in the number of
cytotoxic T-cells (CTLs) has also been reported. A high-molecular-weight (HMW) fucoidan
from Cladosiphon okamuranus (200–300 KDa) induced a large increase in the proportion of
murine cytotoxic T cells (185). Investigation of the role of fucoidan on dendritic cell (DC)-
mediated T-cell cytotoxicity has revealed that the stimulation of CTLs was more effective in
fucoidan-treated DCs as CTLs co-cultured with fucoidan-treated DCs exerted a high level of
specific lysis of breast cancer cells (186).
In a recent study, the role of fucoidan in DCs function and its adjuvant effect have been
examined in vivo. Fucoidan was systemically administrated to mice by intraperitoneal
injection. Examination of the spleen DCs revealed up-regulation of maturation markers as well
as production of IL-6, IL-12 and TNF-α. Fucoidan was then used as an adjuvant in vivo with
ovalbumin antigen and induced Th1 mediated immune response and CTL activation (187).
1.3.5.7 Fucoidan and Malignant Transformation in Vitro and in Vivo
Few studies have reported the potential of fucoidan to inhibit neoplastic transformation. Teas
et al. fed rats with dietary seaweed (Laminira) for 55 days and administrated the carcinogen
7,12-dimethylbenz(a) anthracene intragastrically. Following 26 weeks monitoring,
experimental rats showed a significant delay in the median time for tumour appearance (19 vs
11 weeks in the control group) (188).
Transforming growth factor β1 (TGFβ1) is believed to promote tumour development and
metastasis through epithelial to mesenchymal transition (EMT), a process that enables
epithelial cells migrate to distant areas during late stages of breast cancer development (189).
To trigger tumour progression, TGFβ1 recruits TGF receptors (TGFR) residing on the cell
surface. The investigations of effects of fucoidan on TGFβ1-promoted carcinogenesis in MDA-

Chapter 1 Literature Review
Page 50
MB-231 breast cancer cells have indicated that fucoidan decreased the expression of TGFRs
and affected the downstream signalling molecules which are involved in TGFβ1-mediated
EMT (190).
Epidermal growth factor (EGF) is another carcinogenesis promoter, which induces tumour
transformation through overexpression and activation of EGF receptor (EGFR). EGFR has a
key role in cell proliferation and differentiation and many carcinomas arise from its mutations
(191). Lee et al. examined the role of fucoidan on the activation of EGFR and EGF-mediated
neoplastic transformation (192). They utilised murine JB6 Cl41 epidermal cells and induced
cell transformation by EGF in the presence of fucoidan from L. guryanovae. Fucoidan
markedly reduced the EGFR activation through hypo-phosphorylation. It also inhibited EGF-
tumourigenic activity through inhibition of AP-1, a transcription factor responsible for cell
proliferation regulation.
1.3.5.8 Fucoidan as a Synergistic Anti-Cancer Agent
The ability of fucoidan to synergise with standard anti-cancer agents and/or reduce toxicity has
recently been investigated. Ikeguchi et al. examined the synergistic effect of a HMW fucoidan
with colorectal cancer chemotherapy agents; oxaliplatin plus 5-fluorouracil/leucovorin
(FOLFOX) or irinotecan plus 5-fluorouracil/leucovorin (FOLFIRI). The test patients received
150 mL/day for 6 months of liquid that contained 4.05 g fucoidan. From the commencement
of chemotherapy, toxicities and chemotherapy efficiency were compared. Fucoidan showed no
side effects such as allergic dermatitis. Diarrhoea, neurotoxicity and myelo-suppression were
not suppressed by fucoidan, whereas general fatigue was significantly decreased from 60% to
10%. The patients were followed for approximately 15 months and the survival rate of the
patients who received fucoidan was longer than that of the control participants; however the
difference was not significant, probably due to the small numbers (193).
Fucoidan affects the migration and invasion of multiple myeloma (MM) cells treated with
chemotherapy drug cytarabine. The human myeloma cell lines RPMI8226 and U266 were
treated with crude fucoidan from F. vesiculosus for 72 hours and then cytarabine for 6 hours.
Fucoidan reduced cell migration and down-regulated expression of CXCR4 and MMP-9 (194).
Fucoidan from Saccharina cichorioides has been reported to synergise with the anti-tumour

Chapter 1 Literature Review
Page 51
activity of low dose resveratrol on invasive and highly motile HCT 116 colon cancer cell line
(195). In the colony formation assay, fucoidan plus resveratrol reduced the colony number by
60% compared to 34% and 27% in resveratrol alone or fucoidan alone, respectively.
Zhang et al. studied the combinatory effect of fucoidan and three commonly used anti-cancer
agents; cis-platin (CDDP), tamoxifen (TAM) and paclitaxel (Taxol) on signal transduction
pathways. Fucoidan from Cladosiphon navae-caledoniae plus anti-cancer agents reduced the
ERK phosphorylation in MDA-MB-231 breast cancer cells compared to untreated control or
fucoidan alone (196). Dietary fucoidan synergistically reduced cell growth in the OE33 cell
line when it was combined with lapatinib, a targeted therapy that acts as a tyrosine kinase
inhibitor in advanced HER2-positive breast cancer cells (197).

Chapter 1 Literature Review
Page 52
1.4 Research Aims
The focus of this PhD project was to investigate the biological anti-tumour activities of the alga
derived polysaccharide, fucoidan, on acute myeloid leukaemia cells. It was hypothesised that
fucoidan exerts anti-tumour activity in AML cells and augments the efficacy of standard AML
therapy.
This study aimed to assess the inhibitory role of fucoidan on AML cell proliferation in vitro
and in vivo, and to investigate the effect of fucoidan when combined with standard
chemotherapeutic regimens in inhibition of AML cell growth in vitro and in vivo. The specific
aims of this project were to:
1. Determine if fucoidan has cytotoxic activity against AML cell lines, in vitro
2. Characterise the mechanisms by which fucoidan induces cell death in AML cells
3. Identify if fucoidan has anti-tumour property as a prophylactic agent during AML development, in vivo, and to characterise the underlying mechanisms
4. Determine the synergistic effects of fucoidan with standard chemotherapy regimens for AML, both in vitro and in vivo

Page 53
Materials and Methods
Chapter Two – Materials and Methods

Chapter 2 Materials and Methods
Page 54
2.1 Cell Culture
2.1.1 Cell Line Characteristics
2.1.1.1 HL60 Cell Line
HL60 is a human acute promyelocytic leukaemia (APL) cell line (198). Morphologically, these
cells display a myeloblastic/promyelocytic feature; large, basophilic cytoplasm containing
azurophilic granules and rounded nuclei with 2-4 distinct nucleoli. The HL60 cells are negative
for translocation t(15;17) which is the karyotypic marker of most cases of APL in humans. In
immunophenotyping analysis, the majority of HL60 cells are positive for CD13 (the pan-
myeloid marker), CD15 (granulocytes-associated antigen), CD11a (Integrin) and CD44
(hyaluronic acid receptor). These cells are non-adherent and grow in a suspension culture with
a doubling time varying between 24 to 40 hours.
2.1.1.2 NB4 Cell Line
NB4 is a human APL cell line which unlike HL60 carries the specific chromosomal
translocation t(15;17) (199). Morphologically, NB4 cells are abnormal large promyelocytes
with hyper-granular cytoplasm and prominent nuclei. In analysis of surface markers, NB4 cells
are positive for CD13, CD15, and CD44 and also show low expression of CD11b. The NB4
cells grow in a suspension culture with a doubling time of 24-36 hours.
2.1.1.3 K562 Cell Line
K562 is an erythroleukaemia type cell line derived from a patient with chronic myelogenous
leukaemia in blastic crisis (200). Morphologically, K562 cells are lymphoblastic; round small
cells with large round nuclei and high nuclear to cytoplasm (N/C) ratio. These cells are non-
adherent and their doubling time is around 24 hours.
2.1.1.4 KG-1a Cell Line
KG-1a is a human undifferentiated myeloblastic leukaemia and is a sub-clone of the KG-1 cell
line (201). KG-1a represents an early or primitive stage of development and is generally

Chapter 2 Materials and Methods
Page 55
irresponsive to colony stimulating factor and is unable to differentiate into further mature cells.
Morphologically, KG-1a cells are small round cells with presence of 1-2% giant myeloblasts.
These cells are leukaemia stem cell-like cells and highly express CD34 while are negative for
CD38. KG-1a grows slowly with doubling time of approximately 50 hours.
2.1.1.5 Kasumi-1 Cell Line
Kasumi-1 cells are human acute myeloblastic leukaemia cells containing translocation t(8;21)
representative of AML-M2 in the FAB classification (202). Morphologically, these cells show
myeloid maturation; the myeloblasts are the major cells with variation in size and N/C ratio.
Kasumi cells express CD13, CD33 and are negative for CD34. The doubling time is around
40-45 hours.
2.1.1.6 Yac-1 Cell Line
Yac-1 cell line is a mouse T-cell lymphoma which was induced by inoculation of Moloney
leukaemia virus into a new-born mouse (203). Morphologically, Yac-1 cells are small round to
oval lymphoblasts and can form clusters in suspension. The most important feature of these
cells is their sensitivity to the cytolytic function of NK-cells. The non-adherent Yac-1 cells
grow rapidly and their doubling time is around 20 hours.
2.1.2 Cell Culture
The K562 cell line was purchased from Sigma-Aldrich. The other cell lines were stored in
liquid nitrogen at Menzies Institute for Medical Research. The cells were thawed and used for
experiments when they reached log phase. The cells were cultured in RPMI-1640
supplemented with 10% heat inactivated fetal calf serum (JRH Biosciences, Australia), 2 mM
L-glutamine and 1% penicillin/streptomycin solution (5000 U/mL penicillin G and 5000
µg/mL streptomycin, Sigma Aldrich, U.S.A). For the Kasumi-1 cell line, the RPMI-1640
medium was supplemented with 20% heat inactivated fetal calf serum.

Chapter 2 Materials and Methods
Page 56
2.1.2.1 Thawing Cell Lines
Cell line vials were removed from either the -80°C freezer or vapour phase of liquid nitrogen
and thawed in a water bath at 37°C. The thawed cells were transferred to a 15 mL BD Falcon™
conical tube (Becton, Dickinson and Company Biosciences, U.S.A) and 10 mL media was
gradually added to cells. After centrifugation (500 g for 5 minutes), 10 mL of fresh medium
was added and the cells were transferred to cell culture flasks (Becton, Dickinson and Company
Biosciences, U.S.A) and incubated at 37°C with 5% CO2.
2.1.2.2 Culturing Cell Lines
Cells were cultured in either 25 cm2 or 75 cm2 BD Falcon™ cell culture flasks. Cells were
counted using a haemocytometer using trypan blue exclusion to assay viability. Cells were
maintained at a concentration between 1 × 10⁵ and 1 × 10⁶ cells/ mL by sub-culturing the cells
every 2-3 days.
2.1.2.3 Cryopreservation of Cell Lines
Cells were collected by centrifugation at 500 g for 5 minutes and resuspended in media at 1 ×
107 cells/ mL. Equal volume of media containing 20% DMSO was gradually added to the cell
suspension. Aliquots (1 mL) were transferred to CryoTubes. Tubes were placed in a -80 °C
freezer in a box insulated with cotton wool to slow freezing, and then transferred to the vapour-
phase of liquid nitrogen for storage.
2.2 Cell Treatments
Cell lines were treated with the following reagents for variable doses and times as indicated in
Table 2.1.

Chapter 2 Materials and Methods
Page 57
Table 2.1 Cell treatments
Reagents Stock Preparation Treatment
Purified fucoidan from Undaria
pinnatifida (Marinova Pty Ltd)
10 mg/mL in PBS (filtered through
a 0.21-µm syringe filter (Millipore)
Variable doses for variable
times as indicated.
Purified fucoidan from Fucus
vesiculosus (Marinova Pty Ltd)
10 mg/mL in PBS (filtered through
a 0.21-µm syringe filter (Millipore)
Variable doses for variable
times as indicated.
Fucoidan from Fucus
vesiculosus (Sigma-Aldrich)*
10 mg/mL in PBS (filtered through
a 0.21-µm syringe filter (Millipore)
Variable doses for variable
times as indicated.
Phorbol Myristate Acetate
(PMA, Boehringer Mannheim,
Australia)
1 mg/mL in DMSO 20 ng/mL for 48 hours.
Pan-Caspase Inhibitor Z-VAD-
FMK (Abcam)
10 mM in DMSO 40 µM for 1 hour.
Arsenic Trioxide
(ATO, Sigma-Aldrich)
Stock: 10 mM in 1.65 M NaOH.
Working solution: 100 µM in PBS.
0.25, 0.5 and 1 µM for
variable times as indicated.
All-Trans Retinoic Acid
(ATRA, Sigma-Aldrich)
Stock: 10 mM in absolute ethanol.
Working solution: 100 µM in PBS.
0.25, 0.5 and 1 µM for
variable times as indicated.
* The endotoxin level of the crude fucoidan solution (Sigma-Aldrich) was detected using chromogenic LAL endpoint assay (GenScript, U.S.A).
2.3 DNA Content Analysis (Cell Cycle Assay)
2.3.1 Reagents
2.3.1.1 Propidium Iodide (PI) Solution
PI powder was purchased from Sigma-Aldrich, U.S.A (Cat. No. P4170). The powder was
dissolved in PBS to a concentration of 1 mg/mL and stored at 4 °C, protected from light.
2.3.1.2 RNase A solution
DNAase-free RNase A solution (100 mg/mL; 7000 units/mL) was purchased from Qiagen (Cat.
No. 194101). A 10 mg/mL RNase A working solution was freshly prepared by diluting the
RNase A solution in PBS.

Chapter 2 Materials and Methods
Page 58
2.3.1.3 DNA Content Staining Solution
The DNA content staining solution was made freshly. For each sample, 40 µL of PI solution
(see 2.3.1.1) and 10 µL of prepared RNase A (see 2.3.1.2) were added to 950 µL of PBS.
2.3.2 DNA Content Analysis (Cell Cycle Assay)
Evaluation of the cell cycle phase distribution and sub-G0/G1 population was performed using
propidium iodide staining as described previously (204). In brief, approximately 1-2 × 10⁶ cells
were harvested following treatment as indicated, pelleted (500 g for 5 minutes) and washed in
cold PBS. Cells were resuspended in 500 µL cold PBS and put on ice. To fix the cells, 4 mL
of ice-cold 70% ethanol was added to cells drop wise with mixing. Cells were stored at -20°C
overnight.
The ethanol was aspirated after centrifugation (500 g for 10 minutes) and cells were washed
once in PBS (500 g for 5 minutes). The cells were resuspended in 1 mL DNA content staining
solution, transferred into 12×75 mm Polystyrene test tubes (BD Company, Cat. No. 352052)
and incubated at room temperature for 30 minutes in the dark. Cell cycle was analysed using
the FACSCantoTMII flow cytometer (BD Biosciences, U.S.A). The data was analysed by
Kaluza Software (BD Biosciences, U.S.A).
2.4 WST-8 Cell Proliferation Assay
Cell proliferation was assessed using water-soluble tetrazolium salt WST-8 (Sigma-Aldrich).
The assay is based on the extracellular reduction of WST-8 (205) by the glycolytic NAD(P)H
production of viable cells. The WST-8 reduction produces yellow-colour formazan dye and
generates colour which is directly proportional to the number of the living cells. According to
the manufacturer’s instructions, 10 µL of WST-8 solution was added to 100 µL treated cells in
a 96-well Corning® cell culture micro-culture plate for the last 4 hours of incubation. Finally,
the absorbance was determined at 450 nm by spectrophotometry (SpectraMax® Plus384,
Molecular Devices, U.S.A).

Chapter 2 Materials and Methods
Page 59
2.5 DNA Fragmentation TUNEL Assay
The presence of fragmented DNA was detected using the Apo-BrdU TUNEL apoptosis assay
kit (Invitrogen Ltd) according to the manufacturer’s protocol. In brief, 1-2 × 10⁶ cells were
harvested following treatment as indicated, pelleted (500 g for 5 minutes) and washed with
PBS and resuspended in 0.5 mL PBS. Paraformaldehyde (5 mL at 1%) was added to the
suspension and tubes were put on ice for 15 minutes. To remove the paraformaldehyde, cells
were centrifuged (500 g for 5 minutes) and washed twice with 5 mL PBS. The cell pellet was
resuspended in 0.5 mL PBS. Five mL of 70% ethanol was added and cells were stored for 18
hours in a -20°C freezer. After 18 hours, the experimental samples in addition to a 1 mL aliquot
of manufacturer-supplied positive and negative control cells (containing approximately 1 × 10⁶
cells) were centrifuged at 500 g for 5 minutes and the ethanol was removed by aspiration. Cells
were washed twice with wash buffer provided by the kit. The cell pellet was resuspended in 50
µL of DNA-labelling solution (10 µL of reaction buffer, 0.75 µL of terminal deoxynucleotidyl
transferase, 8.0 µL of 5-Bromo-2’-deoxyuridine 5’-triphosphate (BrdUTP) and 31.25 µL of
Milli-Q water) and incubated at 37°C on heat-block for 60 minutes.
Following the incubation time, 1 mL of provided rinse buffer was added to each tube and cells
were centrifuged (500 g for 5 minutes). This step was repeated and then 100 µL antibody
staining solution containing Alexa Fluor® 488 dye-labeled anti-BrdU antibody was added to
the cell pellet and cells were incubated at room temperature for 30 minutes. Finally, 500 µL
PBS was added to the tubes and the presence of DNA fragmentation was analysed by
FACSCantoTMII flow cytometer (BD Biosciences).
Note 1. The peak emission of Alexa Fluor® 488 is 519 nm and was measured in the FL-1
channel.
2.6 Annexin V/PI Apoptosis Detection Assay
2.6.1 Reagents
Annexin V binding buffer and annexin V-FITC antibody were purchased from Abcam. To
prepare the 1X annexin V binding buffer, the 10X annexin V binding buffer was diluted in

Chapter 2 Materials and Methods
Page 60
PBS. To prepare the 1X annexin V-FITC antibody, the 5X annexin V-FITC antibody was
diluted in 1X annexin V binding buffer.
2.6.2 Annexin V/PI Apoptosis Detection Assay
The presence of early and late apoptosis was detected using annexin V/PI apoptosis assay as
described previously (206). Briefly, 1 × 10⁵ cells were harvested following treatment as
indicated, pelleted (500 g for 5 minutes) and washed with PBS and resuspended in 500 µL of
1X annexin V binding buffer. Five µL of 1X annexin V-FITC antibody was added to the cell
suspension and tubes were incubated at room temperature for 10 minutes. Propidium iodide
solution (2.3.1.1) was added to each sample (1 µL) and cells were incubated at room
temperature for an extra 5 minutes. The presence of different stages of apoptosis was analysed
by FACSCantoTMII flow cytometer (BD Biosciences) and data was analysed using Kaluza
Software (BD Biosciences, U.S.A)
2.7 Western Blot Analysis of Cytoplasmic and Nuclear Proteins
2.7.1 Preparation of Cytoplasmic and Nuclear Protein Extracts
For this protocol, 25 mL cells at 5 × 10⁵ cells/mL (i.e. 1.25 × 10⁷ cells total) were used.
Additional sample tubes and buffers were pre-cooled for over an hour prior to extraction.
Nuclear and cytoplasmic extracts were prepared from a modified method (207). Briefly, cells
were harvested following treatment as indicated, pelleted (500 g for 5 minutes at 4 °C) and
washed twice in 10 mL of ice-cold PBS. The resulting cell pellet was resuspended in 750 µL
of lysis buffer (containing 10 mM NaCl, 10 mM Tris (pH 7.4), 3 mM MgCl2, 0.1 mM EDTA
(pH 8.0), 0.5% Igepal) and incubated on ice for 5 minutes to lyse the cells. Following
centrifugation (500 g for 5 minutes at 4 ºC) the supernatant containing the cytoplasmic protein
fraction was transferred to a fresh tube and placed on ice. The remaining nuclei pellet was
washed in 750 µL of lysis buffer without Igepal (containing 10 mM NaCl, 10 mM Tris (pH
7.4), 3 mM MgCl2, 0.2 mM EDTA (pH 8.0)) and centrifuged at 500 g for 5 minutes and 4 ºC.
The nuclei were then resuspended in 25 µL of nuclei lysis buffer (containing 400 mM NaCl,
7.5 mM MgCl2, 0.1 mM EDTA (pH 8.0), 1 mM DTT) and 1 µL of protease inhibitor

Chapter 2 Materials and Methods
Page 61
(containing aprotinin, leupeptin, complete EDTA-Free Protease Inhibitor Cocktail (Roche
Applied Science, Switzerland)) to be incubated for 15 minutes on ice with shaking ensuring
nuclear lysis. The suspension was centrifuged at 15,000 g for 5 minutes and 4 ºC and
supernatant containing the nuclear proteins was transferred to a fresh tube. Protein
concentration was measured using Bradford assay (208) (see Appendix B).
2.7.2 SDS-PAGE and Western Blotting
To separate proteins according to their molecular weight, SDS-PAGE (sodium dodecyl
sulphate-poly-acrylamide gel electrophoresis) was performed. Briefly, protein extracts (10-20
µg) were combined with an equal volume of 2X sample loading buffer (10 µL containing: 120
mM Tris HCl (pH 6.8), 20% glycerol, 4% SDS, 0.04% Bromophenol blue, 5% β-
mercaptoethanol) and heated at 95 ºC for 5 minutes on a heat block. Spectra™ Multicolor
Broad Range Protein ladder (10-260 kDa) (ThermoScientific, U.S.A) and 20 µL of samples
were carefully loaded on the 12% Mini-PROTEAN® TGX™ pre-cast gel (Bio-Rad, U.S.A)
with sufficient SDS-PAGE running buffer (192 mM glycine, 25 mM Tris (pH 8.0), 0.1%
sodium dodecyl sulphate). Samples were initially electrophoresed for 15 minutes at 100 V and
were subsequently subjected to 150 V until completion.
The separated proteins were transferred from gel onto a 0.45 µM nitrocellulose membrane
(Bio-Rad, U.S.A) using a wet transfer. The transfer assembly (consisted of the gel and membrane
in direct contact surrounded by two layers of filter paper (Whatman, U.S.A) and a support pad on
either side pressed together by the support grid) was placed in the transfer apparatus, immersed
in western transfer buffer (20mM Tris (pH 8.3, 150 mM glycine, 20% methanol) and transfer
was facilitated by 100 V for 90 minutes at 4 °C.
2.7.3 Protein Detection
The membrane was placed in blocking reagent (Blocking reagent (Roche Applied Sciences,
Switzerland) diluted 1:10 in 1X TNT (10 mM Tris (pH 8.0), 150 mM NaCl, 0.05% Tween)
and incubated at room temperature for 1 hour with shaking. The membrane was incubated with
a specific dilution of primary antibody (see Appendix A) overnight at 4 ºC followed by three

Chapter 2 Materials and Methods
Page 62
10-minute washes with 1X TNT at room temperature with shaking. The membrane was
incubated in 5 mL of secondary antibody (see Appendix A) for 45 minutes at room temperature
followed by three 10-minute washes with 1X TNT at room temperature with shaking.
To visualise the membrane, it was incubated with a mixture of 1 mL of SuperSignal® West
Pico Stable Peroxide Solution and 1 mL of Pico Luminol/Enhancer solution (ThermoScientific,
U.S.A) for 5-10 minutes with shaking in minimal light. Excess chemiluminescent complex was
removed and the membrane was exposed for adequate lengths of time up to 10 minutes using
the Chemi-Smart 5000 (Vilber Lourmat, France).
2.8 Analysis of Fucoidan
The constituents of fucoidan was determined in the laboratory of Marinova Pty Ltd. These
experiments were performed by spectrophotometric analysis of fucoidan as follows: Total
carbohydrate content was determined by spectrophotometric analysis of the hydrolysed
compound in the presence of phenol, based on a method described by Dubois et al. (209).
Sulphate content was analysed spectrophotometrically using a BaSO4 precipitation method
(BaCl2 in gelatin), based on the work of Dodgson (210, 211). Analysis of polyphenol content
was also determined spectrophotometrically, using a method based on the Folin-Ciocalteu
reagent (phosphomolybdate/phosphotungstate) (212-214). The carbohydrate profile was
determined using a GC-based method for the accurate determination of individual
monosaccharide ratios in a sample. This method relies on the preparation of acetylated alditol
derivatives of the hydrolysed samples (215). Molecular weight profiles were determined by
Gel Permeation Chromatography, with the aid of a Size-Exclusion Column, and were reported
relative to Dextran standards.
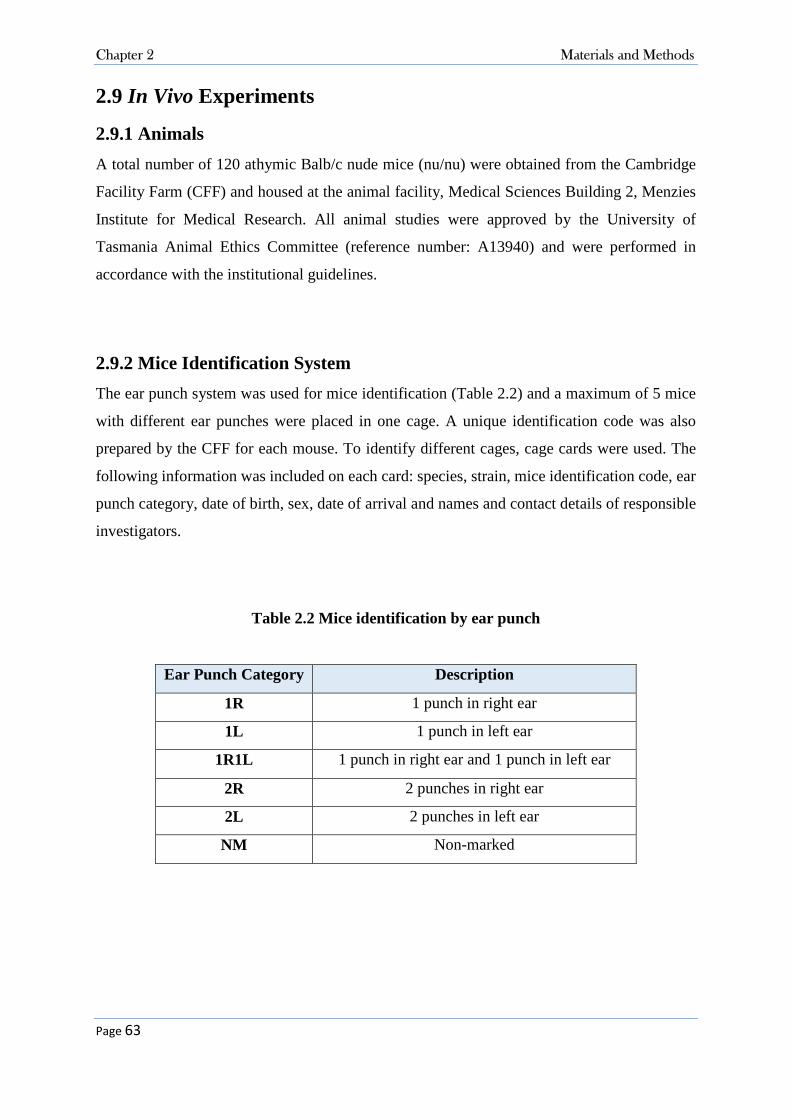
Chapter 2 Materials and Methods
Page 63
2.9 In Vivo Experiments
2.9.1 Animals
A total number of 120 athymic Balb/c nude mice (nu/nu) were obtained from the Cambridge
Facility Farm (CFF) and housed at the animal facility, Medical Sciences Building 2, Menzies
Institute for Medical Research. All animal studies were approved by the University of
Tasmania Animal Ethics Committee (reference number: A13940) and were performed in
accordance with the institutional guidelines.
2.9.2 Mice Identification System
The ear punch system was used for mice identification (Table 2.2) and a maximum of 5 mice
with different ear punches were placed in one cage. A unique identification code was also
prepared by the CFF for each mouse. To identify different cages, cage cards were used. The
following information was included on each card: species, strain, mice identification code, ear
punch category, date of birth, sex, date of arrival and names and contact details of responsible
investigators.
Table 2.2 Mice identification by ear punch
Ear Punch Category Description
1R 1 punch in right ear
1L 1 punch in left ear
1R1L 1 punch in right ear and 1 punch in left ear
2R 2 punches in right ear
2L 2 punches in left ear
NM Non-marked

Chapter 2 Materials and Methods
Page 64
2.9.3 Mice Health Monitoring
A monitoring sheet was prepared for each experiment (see Appendix C) and all animals were
checked daily. Changes in behaviour, food or water consumption, aggression, muscular rigidity
and reaction to handling were recorded. Mice were weighed daily and the weight was recorded.
2.9.4 Animal Treatment
Mice were treated with different substances as indicated in Table 2.3. As shown, various
injection routes including intraperitoneal (IP), Sub-cutaneous (SC) and intravenous (IV) were
used in the experiments. The following general requirements were applied: 1. the pH of
solutions injected was verified to be 7.3 to 7.45; 2. isotonic sterilised solutions were warmed
to body temperature when injecting either IV or IP; 3. where different substances were to be
injected, both chemicals were combined in a single solution.
Table 2.3 Animal treatments
Substance Route Stock Preparation*
Fucoidan (Sigma-Aldrich) Oral 70 mg/mL fucoidan in Milli-Q water
Fucoidan (Sigma-Aldrich) IP 20 mg/mL fucoidan in sterile PBS
Fucoidan (Sigma-Aldrich) IV 2 mg/mL fucoidan in sterile PBS
All-Trans Retinoic Acid
(ATRA) (Sigma-Aldrich)
IP A stock of 100 mM ATRA (30 mg/mL) was prepared by
dissolving ATRA powder in DMSO.
Arsenic trioxide (ATO)
(Sigma-Aldrich)
IP A stock of 300 mM (59.34 mg/mL) ATO was prepared
by dissolving ATO powder in 1.65 M NaOH.
*All stock solutions were filtered through a 0.21-µm syringe filter (Millipore). To prepare the solutions for injection, stock solutions were diluted in sterile PBS.
For S.C injection, the animal was restrained with the non-dominant hand. The syringe was held
with the dominant hand with the bevel of the needle facing upwards. The needle was inserted

Chapter 2 Materials and Methods
Page 65
and the skin was gently tented upwards with the needle to confirm that the needle was in the
subcutaneous space. The solution was injected and the plunger was depressed until the solution
was fully administered. The animal was placed back into its cage and observed for any
complications. For S.C injections, a needle of 26 gauge × 1/2 in. 0.45 mm × 13 mm
(Becton Dickinson) was used. If the injection was successful, a small swelling under the skin
was seen.
For IP injections, the animal was restrained with the non-dominant. The syringe was held with
the dominant hand with the bevel of the needle facing upwards. The substance was injected
into the lower right quadrant of the abdomen towards the head at a 30‐40o angle. The solution
was injected and the plunger was depressed until the solution was fully administered. The
animal was placed back into the cage and observed for any complications. For IP injection, a
needle of 30 gauge × 1/2 in. (Becton Dickinson) was used.
For IV injection, the two lateral tail veins were used. The animal was restrained in a rodent
cone-shaped restrainer. The tail was swabbed with 70% alcohol and rotated ¼ turn to place the
tail veins dorsally for easier injection. The needle was approached at a 15-20° angle at the distal
portion of the tail and inserted parallel to the tail vein penetrating 2-4 mm into the lumen while
keeping the bevel of the needle face upwards and the material was injected slowly. A successful
injection resulted in the material entering the vein with no resistance and blanching of the tail
vein for the duration of the injection.
2.9.4.1 Oral Administration of Fucoidan
150 µg/g body weight (b.w.) fucoidan was orally administered. Mouse weight was measured
daily and the required amount of fucoidan was mixed with peanut butter and a paste was
prepared. For each mouse the peanut butter paste was prepared freshly just before feeding
(Figure 2.1). The prepared fucoidan-peanut butter paste was put on a wooden applicator stick
and put in the cage with a single mouse. Each mouse was not returned to its own cage until the
entire paste was eaten. The control group was fed with peanut butter mixed with Milli-Q water
in the same manner.

Chapter 2 Materials and Methods
Page 66
Figure 2.1. Preparation of fucoidan for oral administration. 1) The required amount of fucoidan was added to peanut butter. 2) Fucoidan was mixed with peanut butter. 3) The
prepared paste was put on a wooden applicator stick. 4) The fucoidan paste was put in the cage with a single mouse
2.9.4.2 Intraperitoneal Injection of Fucoidan
Either low dose of 30 µg/g b.w. or high dose of 100 µg/g b.w. of fucoidan was administered
by injection according to the mice weight measured daily. An injection volume of 200 µL of
freshly prepared solution was injected into the lower quadrant of abdomen as described (see
Section 2.9.4).
2.9.4.3 Intravenous Injection of Fucoidan
One daily dose of 6 µg/g b.w. fucoidan was administered by injection according to the mice
weight measured each day. An injection volume of 200 µL of freshly prepared solution was
injected into the lower quadrant of the abdomen as described (see Section 2.9.4).
2.9.4.4 Intraperitoneal Injection of Arsenic Trioxide
One daily dose of 2.5 µg/g b.w. ATO was administrated by injection according to the mice
weight measured each day. An injection volume of 200 µL of freshly prepared solution was
injected into the lower quadrant of the abdomen as described (see Section 2.9.4).
2.9.4.5 Intraperitoneal Injection of ATRA
One dose of 1.5 µg/g b.w. ATRA was administrated three times a week by injection according
to the mice weight measured each day. An injection volume of 200 µL of freshly prepared
solution was injected into the lateral tail veins as described (see Section 2.9.4).

Chapter 2 Materials and Methods
Page 67
2.9.5 Establishment of Human Leukaemia Xenograft Models
Acute promyelocytic leukaemia NB4 cell line was cultured in RPMI as explained in 2.1.2.2.
The medium was replaced with fresh RPMI medium 3 to 4 hours before harvesting. Cells were
centrifuged at or below 500 g for 5 minutes and washed twice with 20 mL of sterile PBS free
of serum. Cells were resuspended in sterile PBS at the final concentration of 2.5 × 10⁷ cells/mL
and transferred to sterile CryoVials. For each mouse, a volume of 200 µL of the prepared cell
suspension containing 5 × 10⁶ cells was injected. Cells were injected subcutaneously in the
right flank of each mouse as described in 2.9.4. Mice injected with NB4 cells were monitored
daily for tumour burden appearance.
2.9.6 Tumour Volume Measurement
Tumour volume was measured daily and the results were recorded in the monitoring sheet. The
measuring surface was cleaned and dried. A flexible plastic ruler was sprayed with ethanol
70% and dried. The general restrain following by lifting the animal with the non-dominant
hand was performed and the tumour location was faced toward the investigator. The length and
width of the tumour was measured in millimeter (mm) three times and the mean value was
recorded. To calculate the tumour volume, the below formula was used:
Tumour Volume (mm3) = �
� × (length × width2)
The tumour volume was recorded in the monitoring sheet (see Appendix C) and the experiment
was terminated if the tumour size reached 1000 mm3.
2.9.7 Animals Euthanasia
Animals were humanely sacrificed using carbon dioxide as per the AVMA Guidelines on
Euthanasia 2013 (216).

Chapter 2 Materials and Methods
Page 68
2.9.8 Tumour Volume Doubling Time
The tumour volume doubling time and tumour growth rate were calculated by the algorithm
provided by http://www.doubling-time.com (217).
2.9.9 Assessment of the Tumour Mass
2.9.9.1 Tumour Mass Cell Suspension Preparation
To remove the tumour mass, an incision was made in the area of the tumour using dissecting
scissors and microscopic forceps (Met-App Co.) and the tumour mass was carefully removed.
Fresh tissue sample was dissected and mixed with 2 mL PBS and filtered through a 40 µM
sterile nylon mesh strainer (Fisher Scientific, Cat. No. 352340). The cell suspension was then
washed with PBS (500 g for 5 minutes) and the cell pellet was resuspended in 2 mL sterile
PBS.
2.9.9.2 Cell Surface Marker Analysis
The cell surface markers of the tumour mass removed from mice were analysed using various
antibodies by flow cytometry. The prepared cell suspension (50 µL) was mixed with 5 µL of
desired cell surface antibodies or the appropriate isotype negative controls in 12×75 mm
polystyrene test tubes and incubated at 4 °C for 30 minutes. PBS (500 mL) containing 10%
paraformaldehyde was added to the mixture, and the expression of cell markers was analysed
with FACSCantoTMII flow cytometer (BD Biosciences, U.S.A). The flow cytometry results
were analysed with Kaluza Software (BD Biosciences, U.S.A).
2.9.10 Natural Killer Cell Activity
To analyse the cytolytic activity of mice splenic natural killer (NK) cells, the spleen
mononuclear cells (MNCs) were used as effector cells and the NK sensitive Yac-1 cell line was
used as target cell. The activity of NK cells in lysing these cells was measured with Cell Trace
Violet and PI cytotoxicity assay using flow cytometry.

Chapter 2 Materials and Methods
Page 69
2.9.10.1 Preparation of Splenic Mononuclear Cells
Animals were sacrificed (see 2.9.8) and the mouse body was placed on its back and sprayed
with 70% ethanol. A small incision was made in the left side of the peritoneum and the spleen
was gently pulled and the connective tissues behind it were torn. The removed spleen was
dissected and filtered through 40 µM sterile nylon mesh strainer (Fisher Scientific, Cat. No.
352340). To do this, the spleen pieces were placed on the strainer and mashed and minced
using a syringe plunger firmly so the connective tissue remained on the top of the strainer and
the cells were filtered through by adding PBS. The cell suspension was washed with PBS (500
g for 5 minutes) and resuspended in 5 mL of PBS.
To isolate the MNCs, the prepared splenic cell suspension was gently homogenised and slowly
added to a tube previously loaded with 5 ml of Ficoll-paque®-1077 (Sigma Company, Cat. No.
10771). The tube was carefully loaded into the centrifuge buckets without disturbing the layers.
The mixture was centrifuged (400 g, for 30 minutes) using slow acceleration and deceleration
rates. After centrifugation, the following layers were visible in the tube from top to bottom:
PBS, a layer of MNCs, Ficoll-Paque, and erythrocytes and poly-morphonuclear cells presented
in pellet form. The MNC layer was recovered and washed with sterile PBS (500 g for 10
minutes). The cell pellet was completely resuspended in the remaining PBS and mixed with
complete RPMI media at 107 cells/ mL.
2.9.10.2 Preparation of Yac-1 Target Cells
The Yac-1 target cells were labelled with CellTraceTM Violet (CTV) fluorescent dye (Life
technologies Inc. Cat. No. C34557). Briefly, 1 × 10⁶ Yac-1 cells were pelleted and mixed with
1 mL of pre-warmed sterile PBS. The cells were mixed with 1 µL of stock CTV and incubated
for 20 minutes at room temperature with gentle agitation and protected from light. The unbound
dye remained in solution was the quenched by adding 5 mL of pre-warmed RPMI media (10%
FCS) and incubated for an extra 5 minutes at room temperature. Finally cells were pelleted and
resuspended in RPMI at 105 cells/ mL.

Chapter 2 Materials and Methods
Page 70
2.9.10.3 Cell Trace Violet and PI staining Assay
A 96-well plate was prepared with 100 µL serial halving dilutions of splenic mononuclear cells
with a range from 100:1 to 3:1 of effector cells: target cells (Figure 2.2). This was achieved by
adding 200 µL of prepared MNCs in the 100:1 wells and 100 µL of RPMI media in the rest of
the dilution wells. The MNCs (100 µL) was then transferred as a serial dilution through the
relevant wells from 100:1 to 3:1. Finally, 100 µL of CTV-labelled Yac-1 cells were added to
each well. A control well (0:1) was prepared with addition of 100 µL RPMI in 100 µL Yac-1
cell and no MNCs. All samples were loaded in triplicates.
Plates were incubated for 4 hours at 37 °C with 5% CO2. PI solution (2.3.1.1) was diluted 1:25
with PBS and added to the wells right before analysis (25 µL). The amount of lysed Yac-1 cells
representing NK cell cytotoxic activity was analysed using flow cytometry within two hours.
Flow cytometry data was analysed using Kaluza Software and the data was normalised by
subtracting the percentage of spontaneous cell death observed in the wells with target cells only.
Note 1. The peak emission of CTV is 450 nm and was measured in the FL-1 channel.
Figure 2.2. Cell trace violet and PI staining assay

Chapter 2 Materials and Methods
Page 71
2.10 Statistical Analysis
Data were analysed for significance using GraphPad Prism 5 Software. In-vitro experiments
were performed in duplicate or triplicate. p values were determined using the Student’s t-test
accompanied by analysis of variance (ANOVA) as indicated in Figure legends. For in vivo
experiments, a Kaplan-Meier survival curve was used to estimate the fraction of mice living
for the certain amount of time after treatment. A p value of less than 0.05 was considered
significant.

Page 72
Cytotoxic Effects of Fucoidan on
AML Cells
Chapter Three – Cytotoxic Effects of Fucoidan on AML

Chapter 3 Cytotoxic Effects of Fucoidan on AML Cells
Page 73
3.1 Introduction
Although chemotherapy is often effective in the treatment of AML, at least in the short term,
the agents currently in use are associated with undesirable side effects and low survival rate
(218). Concerns over toxicities from chemotherapeutic chemicals have generated interest in
exploiting natural products for cancer treatment (219). Among those, fucoidan derived from
brown seaweeds has gained significance in the treatment of cancer.
Different experimental studies have shown the tumour-suppressive activity of fucoidan in
various human cancer cells, including gastric adenocarcinoma (220), prostate cancer (163),
breast cancer (160), lung carcinoma (171) and colorectal cancer (167). Low toxicity and the in
vitro cytotoxic effects of fucoidan on cancer cells make it a suitable choice for cancer
prevention or treatment.
Despite evidence for the tumour inhibitory effect of fucoidan in different cancer types, there
are only few studies which have examined the anti-proliferative property of fucoidan in
haematological malignancies. Aisa et al. and Haneji et al. have reported that fucoidan induces
apoptosis in human lymphoma HS-Sultan and adult T-cell leukaemia cell lines, respectively
(155, 165). The first aim of this thesis chapter was to investigate whether anti-proliferative
effects of fucoidan were observed in myeloid leukaemias in vitro.
Several studies have examined the mechanisms underlying the observed anti-tumour activities
and provided some clues to the key pathways involved. Roles in apoptotic protein regulation
(220), caspase activation (164) oxidative stress induction and mitochondrial dysfunction (167)
have been reported. However the inconsistent and contradictory evidence to date has been
challenging to interpret and the mechanisms of action of fucoidan remains unclear. The second
aim of this chapter was to examine the mechanisms by which fucoidan affect cell growth in
AML cells, and if the cytotoxic responses were observed in AML cells. To test this, a wide
range of cellular and molecular pathways including cell proliferation, apoptosis, cell cycle and
different signal transduction pathways were examined in AML cells after treatment with
fucoidan.

Chapter 3 Cytotoxic Effects of Fucoidan on AML Cells
Page 74
3.2 Experimental Design
Fucoidan from different seaweed sources were obtained and their inhibitory effects were
compared in AML cell growth.
The composition and characteristics of fucoidan from F. vesiculosus (Sigma-Aldrich Co.) and
purified fucoidan from U. pinnatifida (Marinova Pty. Ltd.) were assessed and compared (see
Section 2.8). Endotoxin contamination was a potential concern for the fucoidan preparation
therefore whether endotoxin was present in the fucoidan preparation was determined (see
Section 2.2).
AML cell lines including NB4, HL60 and K562 cells (see Section 2.1.1) were treated with
Marinova Pty. Ltd. supplied purified fucoidan derived from two seaweed sources (U.
pinnatifida and F. vesiculosus) where indicated with doses ranging from 10 to 2000 µg/mL.
AML cell lines including NB4, HL60, K562 and KG-1a cells were then treated with fucoidan
from F. vesiculosus (Sigma-Aldrich Co.) at various doses ranging from 10 up to 100 µg/mL.
Cell proliferation was measured with WST-8 proliferation assay (see Section 2.4). Cell death
and apoptosis were analysed by measuring DNA content, annexin V/PI and DNA
fragmentation assays (see Sections 2.3, 2.5 and 2.6). To investigate the mechanisms by which
fucoidan induced apoptosis, the expression of various proteins in cell cycle, apoptosis and
signal transduction pathways were assessed using Western blotting (see Section 2.7).

Chapter 3 Cytotoxic Effects of Fucoidan on AML Cells
Page 75
3.3 Results
(This section has been substantially published in Atashrazm et al. 2015 (221))
3.3.1 Fucoidan Characteristics
3.3.1.1 Endotoxin Level Assay in Fucoidan
To evaluate the pyrogenicity and endotoxin contamination, the endotoxin level was measured
in fucoidan. According to the "Guidelines on the Validation of the Limulus Amebocyte Lysate
Test" defined by the FDA (12/87), the endotoxin level for human and animal parenteral drugs,
biological products and medical devices must be ≤0.5 Endotoxin Units/ml (222). The
endotoxin level of the fucoidan preparation was measured utilising the standard curve
generated from E. coli endotoxin standards. Less than 0.1 EU/mL endotoxin was detected in
fucoidan preparation, which is considered as non-pyrogenic.
3.3.1.2 Analysis of the Two Fucoidan Preparations
The characteristics of two sources of fucoidan were evaluated; fucoidan from F. vesiculosus
supplied by Sigma-Aldrich Co. and purified fucoidan from U. pinnatifida supplied by
Marinova Pty. Ltd. The experiments for characterisation of the fucoidan constituents were
performed by Samuel S Karpiniec at Marinova Pty. Ltd. The results for the compositional
analysis of the fucoidans from Sigma-Aldrich Co. and Marinova Pty. Ltd. are shown in Table
3.1. As indicated, fucoidan from F. vesiculosus (Sigma-Aldrich Co.) had lower molecular
weight and less fucose content compared to the Marinova Pty. Ltd. supplied fucoidan from U.
pinnatifida. The amount of other monosaccharaides in addition to sulphate content were similar
in fucoidan from both sources. The amount of uronic acid in fucoidan from Sigma-Aldrich Co.
was 4 fold higher than that of fucoidan from Marinova Pty. Ltd. The purity of the fucoidan
from Sigma-Aldrich Co. was near 80% compared to 98% in purified fucoidan (Marinova Pty.
Ltd.). In addition, 3.9% polyphenol was found in the Sigma-Aldrich Co. supplied fucoidan
structure.

Chapter 3 Cytotoxic Effects of Fucoidan on AML Cells
Page 76
Table 3.1. Composition and monosaccharide constituents of fucoidan from different
sources
Fucoidan from F. vesiculosus
(Sigma-Aldrich Co.)
Fucoidan from U. pinnatifida
(Marinova Pty. Ltd.)
Molecular Weight (kDa) 20.7 61.7
Fucoidan (%) 79.3 98.0
Total Carbohydrate (%) 55.9 67.5
Uronic Acid (%) 5.9 1.4
Polyphenol (%) 3.9 -
Cations (%) 6.4 11.9
Sulphate (%) 26.9 26.6
Monosaccharide
Composition
(%)
Fucose 38.2 53.3
Xylose 2.7 2.3
Mannose 0.4 0.8
Galactose 3.5 3.1
Glucose 0.1 0.0

Chapter 3 Cytotoxic Effects of Fucoidan on AML Cells
Page 77
3.3.2 Purified Fucoidans from U. pinnatifida and F. vesiculosus (Marinova
Pty. Ltd.) Did Not Suppress the Growth of AML Cells
To determine whether fucoidan inhibits the growth of AML cells through either cell cycle arrest
or cell death, cell cycle progression was assessed in cells treated with purified fucoidan
(Marinova Pty. Ltd.). This was performed by DNA quantitation whereby DNA is labelled and
the amount of measured dye quantitated (84). Figure 3.1 (left) displays the typical DNA content
histogram in a healthy cell population. As indicated, the G0/G1 phase cells have the least
amount of staining intensity as they have the least amount of genetic material (only one copy
of DNA). G2/M phase cells, in contrast, have the highest amount of staining intensity as they
contain the highest amount of DNA (two copies of chromosomes). Since the S phase cells are
synthetising DNA, they have different amounts of DNA varying from one copy to two copies.
The cell cycle histogram not only gives us information about the status of the living cells, but
also detects the dead cells. As DNA is degraded in the late stages of the death process, a large
number of small DNA fragments accumulate in the cells, which can then leach out. Since these
dying cells have a lower DNA content, they can be observed in the cell cycle histogram as a
hypo-diploid or sub G0/G1 peak (223). Figure 3.1 compares the cell cycle histogram between
a normal cell population and a dead cell population.
Figure 3.1. Cell cycle histogram in healthy (left) and apoptotic (right) population (224)

Chapter 3 Cytotoxic Effects of Fucoidan on AML Cells
Page 78
Phorbol 12-myristate 13-acetate (PMA) was used as a positive control, to ensure that cells were
responding to chemical agents as expected and to assess efficacy of the assay methodology.
PMA is a diester of phorbol which induces G0/G1 cell cycle arrest in a variety of cell types.
The leukaemic cells were treated with 20 ng/mL PMA for 48 hours and DNA content was
measured using PI staining. As shown in Figure 3.2, PMA inhibited cell proliferation in K562,
NB4 and HL60 cells, which was indicated by G0/G1 arrest in all three cell lines.
To investigate the growth inhibitory effect of fucoidan, acute myeloid leukaemia cell lines
HL60, NB4 and K562 were treated with the two different purified fucoidans from Marinova
Pty. Ltd. as indicated with doses up to 150 µg/mL. After 48 hours, the DNA content was
analysed using PI staining. Neither fucoidan preparations influenced the proportion of cells
present in each of the cell cycle phases as measured by flow cytometry at any of the given
doses (Figures 3.3, 3.4, 3.5) in the experimental time frame. A similar result was observed in
each of the cell lines examined.
Furthermore, very high doses of the two purified fucoidans from Marinova Pty. Ltd (for up to
2 mg/mL) were used and no changes were observed in any phases of the cell cycle for either
fucoidan preparations. Figures 3.6 and 3.7 display DNA content in HL60 cells after treatment
with very high dose of the two purified fucoidans from Marinova Pty. Ltd.
DNA fragmentation was also assessed in fucoidan-treated cells at a low (150 µg/mL) and a
very high dose (2000 µg/mL). In agreement with the DNA content results, the purified fucoidan
(Marinova Pty. Ltd.) did not induce DNA fragmentation in the treated cell lines (Figure 3.8).
In summary, purified fucoidans from two sources of U. pinnatifida and F. vesiculosus supplied
by Marinova Pty. Ltd. did not affect cell proliferation, DNA content and DNA fragmentation
in different AML cell lines as indicated. Due to inconsistency with literature, this was further
examined by analysing the anti-proliferative activity of a commercially available fucoidan
extract, which is the most common source of experimental fucoidan used in literature.

Chapter 3 Cytotoxic Effects of Fucoidan on AML Cells
Page 79
Figure 3.2. DNA content analysis in AML cells treated with PMA. HL60, NB4 and K562 cell lines were treated with 20 ng/mL PMA, and cell cycle phase distribution was measured
using PI staining and quantitated by flow cytometry.
Green population: G0/G1 phase cells, Blue population: S phase cells, Purple population: G2/M phase cells

Chapter 3 Cytotoxic Effects of Fucoidan on AML Cells
Page 80
Figure 3.3. DNA content analysis in HL60 cells. HL60 cells were treated with increasing doses (from 50 µg/mL to 150 µg/mL) of fucoidan from U. pinnatifida (Marinova Pty. Ltd.),
and cell cycle phase distribution was measured using PI staining and quantitated by flow cytometry.
Red population: Sub-G0/G1 phase cells, Green population: G0/G1 phase cells, Blue population: S phase cells, Purple population: G2/M phase cells

Chapter 3 Cytotoxic Effects of Fucoidan on AML Cells
Page 81
Figure 3.4. DNA content analysis in NB4 cells. NB4 cells were treated with increasing doses (from 50 µg/mL to 150 µg/mL) of fucoidan from U. pinnatifida (Marinova Pty. Ltd.),
and cell cycle phase distribution was measured using PI staining and quantitated by flow cytometry.
Red population: Sub-G0/G1 phase cells, Green population: G0/G1 phase cells, Blue population: S phase cells, Purple population: G2/M phase cells

Chapter 3 Cytotoxic Effects of Fucoidan on AML Cells
Page 82
Figure 3.5. DNA content analysis in K562 cells. K562 cells were treated with increasing doses (from 50 µg/mL to 150 µg/mL) of fucoidan from U. pinnatifida (Marinova Pty. Ltd.),
and cell cycle phase distribution was measured using PI staining and quantitated by flow cytometry.
Red population: Sub-G0/G1 phase cells, Green population: G0/G1 phase cells, Blue population: S phase cells, Purple population: G2/M phase cells

Chapter 3 Cytotoxic Effects of Fucoidan on AML Cells
Page 83
Figure 3.6. DNA content analysis in HL60 cells treated with high dose fucoidan. HL60 cells were treated with low (150 µg/mL) and high (2000 µg/mL) doses of fucoidan from U.
pinnatifida (Marinova Pty. Ltd), and cell cycle phase distribution was measured using PI staining and quantitated by flow cytometry.
Red population: Sub-G0/G1 phase cells, Green population: G0/G1 phase cells, Blue population: S phase cells, Purple population: G2/M phase cells
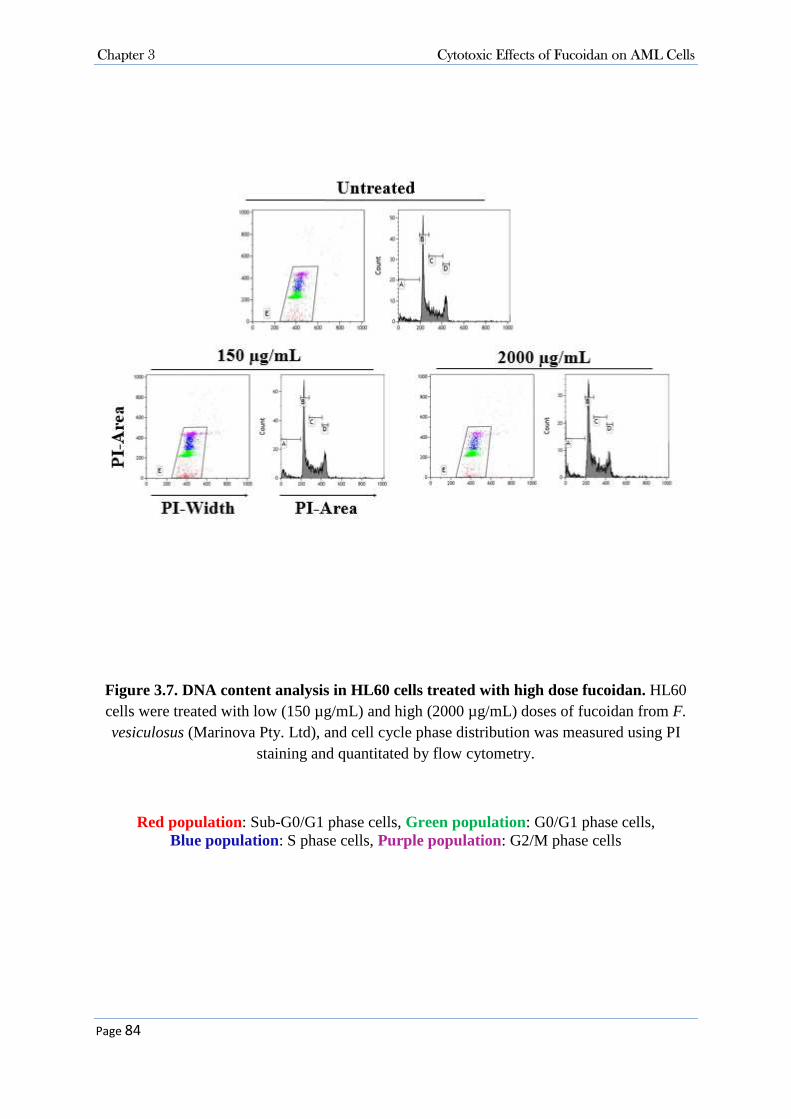
Chapter 3 Cytotoxic Effects of Fucoidan on AML Cells
Page 84
Figure 3.7. DNA content analysis in HL60 cells treated with high dose fucoidan. HL60 cells were treated with low (150 µg/mL) and high (2000 µg/mL) doses of fucoidan from F. vesiculosus (Marinova Pty. Ltd), and cell cycle phase distribution was measured using PI
staining and quantitated by flow cytometry.
Red population: Sub-G0/G1 phase cells, Green population: G0/G1 phase cells, Blue population: S phase cells, Purple population: G2/M phase cells

Chapter 3 Cytotoxic Effects of Fucoidan on AML Cells
Page 85
Figure 3.8. DNA fragmentation assay in AML cells. HL60, NB4 and K562 cell lines were treated with low (150 µg/mL) and high (2000 µg/mL) doses of fucoidan from U. pinnatifida,
and DNA fragmentation was assessed using TUNEL assay.
Red population: Dead cells with DNA fragmentation, Black population: Live cells

Chapter 3 Cytotoxic Effects of Fucoidan on AML Cells
Page 86
3.3.3 Cytotoxicity Activity of Fucoidan (Sigma-Aldrich Co.) in AML Cells
Fucoidan from F. vesiculosus was obtained from Sigma-Aldrich Co. and its cytotoxicity and
antiproliferative activities were examined in different types of AML.
3.3.3.1 Fucoidan Inhibited Cell Proliferation in NB4, HL60 and K562 Cell Lines
To investigate the proliferation inhibitory effects of this fucoidan preparation on AML cells,
cell lines were treated with increasing doses of fucoidan and after 48 hours cell proliferation
was measured with the WST-8 proliferation assay (Figure 3.9). The results indicated that
fucoidan differentially inhibited cell growth in selected leukaemia cell sub-types; it inhibited
the proliferation of acute promyelocytic leukaemia NB4 and HL60 cell lines in a dose
dependent manner with the level of cell proliferation decreased to less than 10% at
concentrations of 25 and 50 µg/mL in NB4 and HL60 cells, respectively. To a lesser extent,
fucoidan reduced the proliferation of K562 cells and the amount of cell proliferation remained
more than 70% at a dose of 100 µg/mL. In contrast, fucoidan had almost no effect on KG-1a
cell proliferation.
3.3.3.2 Fucoidan Increased Sub-G0/G1 Fraction in NB4 and HL60 Cells.
To investigate whether the reduced proliferation in NB4 and HL60 cells was due to cell cycle
arrest or increased cell death, cells were treated with fucoidan and DNA content was evaluated
for up to 48 hours using PI staining. The percentage of sub-G0/G1 fraction representing the
dead cell population significantly increased in both HL60 and NB4 cells in a time dependent
manner (Figure 3.10 A, B). Table 3.2 shows the percentage of cells in each phase of the cell
cycle as measured by PI staining using flow cytometry.
Furthermore, the effects of fucoidan on cell cycle was determined in K562 and KG-1a cell
lines. A cell cycle arrest in G0/G1 accompanied by a decrease in S and M phases was observed
in fucoidan-treated K562 cells (Figure 3.10 C); approximately 60% of the cells treated with
fucoidan were in the non-proliferative fraction compared to around 40% in untreated cells
(Table 3.2).
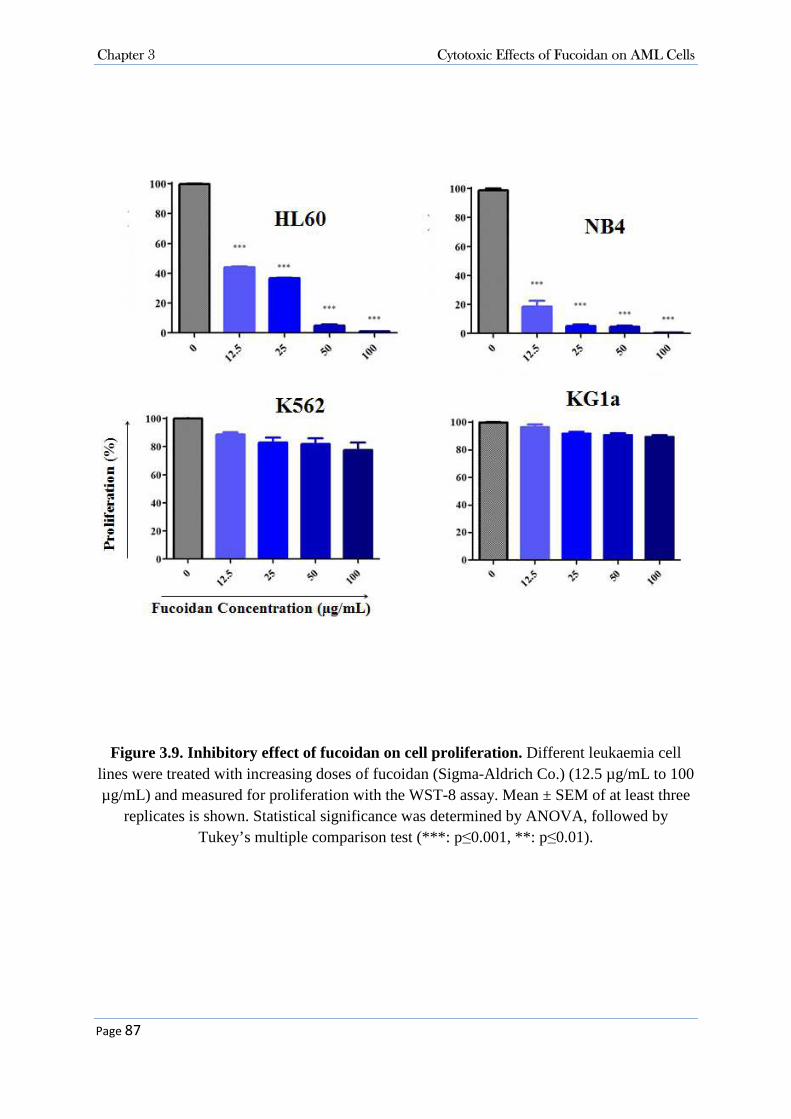
Chapter 3 Cytotoxic Effects of Fucoidan on AML Cells
Page 87
Figure 3.9. Inhibitory effect of fucoidan on cell proliferation. Different leukaemia cell lines were treated with increasing doses of fucoidan (Sigma-Aldrich Co.) (12.5 µg/mL to 100 µg/mL) and measured for proliferation with the WST-8 assay. Mean ± SEM of at least three
replicates is shown. Statistical significance was determined by ANOVA, followed by Tukey’s multiple comparison test (***: p≤0.001, **: p≤0.01).

Chapter 3 Cytotoxic Effects of Fucoidan on AML Cells
Page 88
Figure 3.10. Representative DNA content analysis. A, B) HL60 and NB4 cells were treated with 100 µg/mL fucoidan and DNA content was analysed for up to 48 hours. The sub-G0/G1dead cell fraction increased in a time-dependent manner (p≤0.001). C, D) K562 and KG-1a cells
were respectively treated with 100 µg/mL fucoidan for 48 hours and DNA content was analysed.

Chapter 3 Cytotoxic Effects of Fucoidan on AML Cells
Page 89
Table 3.2. Cell cycle phases distribution. DNA content was assessed in different AML cell lines after treatment with 100 µg/mL fucoidan for 48 hours. Data represents Mean ± SEM of three independent experiments. Statistical significance was determined by two-way ANOVA,
followed by Bonferroni post-test (***: p≤0.001).
Cell line Fucoidan Sub G0/G1 (%) G0/G1 (%) S (%) M (%)
HL60 Untreated 2.5 ± 1.26 48.4 ± 1.26 29.0 ± 1.04 18.8 ± 3.27
Treated 78.7 ± 2.45*** 8.3 ± 1.35 7.0 ± 2.95 6.3 ± 1.81
NB4 Untreated 5.9 ± 2.45 43.3 ± 2.46 32.3 ± 1.72 16.2 ± 1.34
Treated 97.5 ± 3.004*** 1.5 ± 1.98 0.6 ± 0.68 0.1 ± 0.11
K562 Untreated 3.3 ± 0.20 42.6 ± 4.66 30.4 ± 3.05 21.5 ± 1.79
Treated 9.0 ± 0.80 58.3 ± 2.482 24.4 ± 0.92 7.7 ± 1.69
KG-1a Untreated 1.6 ± 0.41 61.1 ± 1.08 15.9 ± 0.66 20.7 ± 1.85
Treated 1.3 ± 0.40 60.3 ± 1.19 16.0 ± 1.19 21.6 ± 1.14

Chapter 3 Cytotoxic Effects of Fucoidan on AML Cells
Page 90
Unlike the HL60, NB4 and K562 cell lines, the undifferentiated AML cell line KG-1a was
resistant to the cell cycle modulatory effects of fucoidan (Figure 3.10 D). This was consistent
with the proliferation assay results as fucoidan neither induced cell cycle arrest nor sub-G0/G1
dead cell population in KG-1a cells (Table 3.2).
Taken together, the results indicate that fucoidan reduced proliferation of HL60 and NB4 cell
lines at the sub-G0/G1 stage and reduced proliferation of K562 cells at the G0/G1 stage, but
did not inhibit the KG-1a cell growth.
3.3.3.3 Fucoidan Induced Apoptosis in NB4 and HL60 Cells.
The observed reduced cell proliferation in NB4, HL60 and K562 cells and increased sub-
G0/G1 dead cell population in HL60 and NB4 cells were further examined. The annexin V/PI
apoptosis assay and DNA fragmentation TUNEL assays were employed to measure apoptosis
and evaluate mechanisms of cell death induced by fucoidan.
The annexin V/PI apoptosis assay permits the distinction between apoptosis and necrosis to be
observed. During the earliest stages of apoptosis there is a loss of asymmetry of the plasma
membrane, which results in the translocation of the phosphatidylserine (PS) from the inner side of
the cell membrane to the surface. The exposed PS can then bound to annexin V. In the very earliest
stages of apoptosis the membrane remains impermeable to the dye PI. Upon the loss of membrane
integrity at the late stages of apoptosis however PI passes through the cell. Necrotic cells are also
permeable to PI but its binding to annexin V is relatively low and this allows discrimination of
early and late apoptotic cells from necrotic cells (225) (Figure 3.11).
Figure 3.11. Healthy and apoptotic cells with markers for detection of apoptosis (226)

Chapter 3 Cytotoxic Effects of Fucoidan on AML Cells
Page 91
As shown in Figures 3.12 and 3.13, the annexin V/PI apoptosis assay revealed that fucoidan
significantly increased apoptosis in HL60 (p≤0.01) and NB4 cells (p≤0.001). Consistent with
the proliferation and DNA content assay results, fucoidan failed to induce apoptosis in K562
and KG-1a cell lines (Figure 3.12).
DNA fragmentation, which is a feature of late apoptosis, was examined in fucoidan-treated
cells by TUNEL assay in triplicate and the mean values were analysed (Figure 3.14). DNA
fragmentation significantly increased in HL60 and NB4 cells in a dose dependent manner.
Compared to untreated cells, the percentage of cells containing fragmented DNA increased
from less than 1% to 88.9% in NB4 cells and to 54.8% in HL60 cells treated with 100 µg/mL
fucoidan (p≤0.01, p≤0.001). In contrast, the DNA fragmentation amount remained unchanged
in K562 and KG-1a cells treated with up to 100 µg/mL fucoidan (less than 1%).
Taken together, these results indicate that apoptosis induction by fucoidan within tumour cells
is cell-type specific and further that promyelocytic cells were more sensitive to fucoidan’s
action. In the next step, the underpinning mechanisms of the fucoidan’s activity in induction
of apoptosis was investigated.
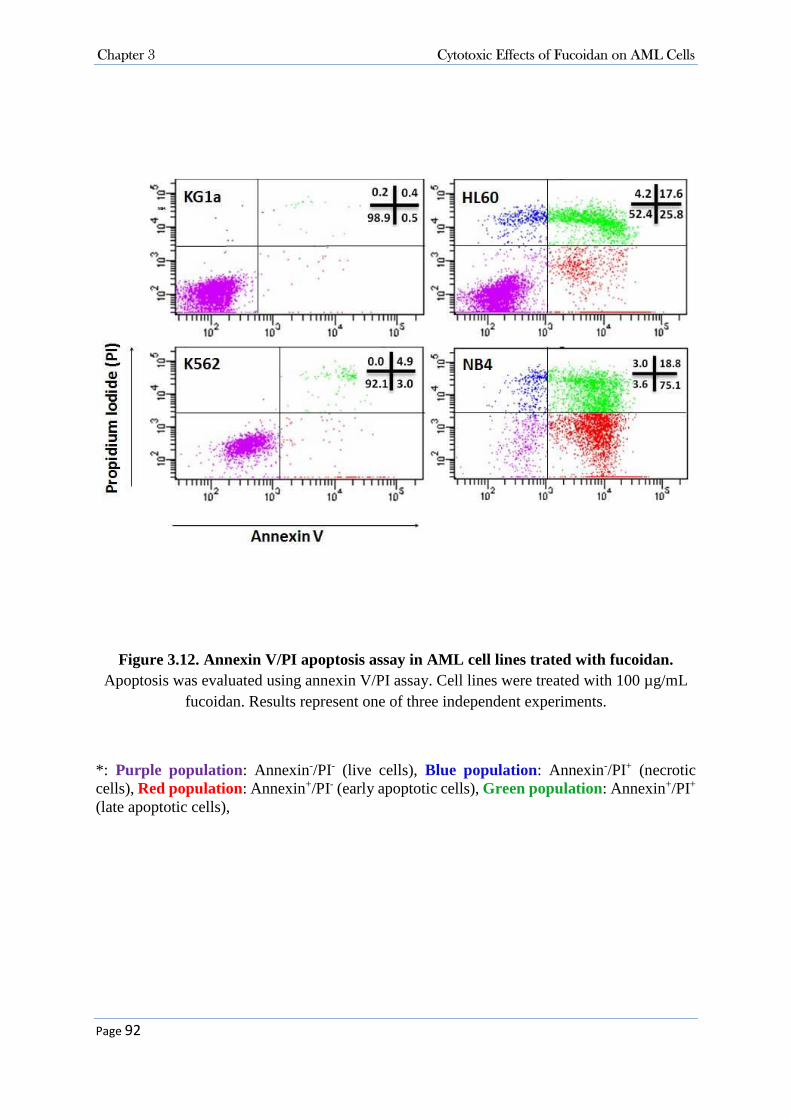
Chapter 3 Cytotoxic Effects of Fucoidan on AML Cells
Page 92
Figure 3.12. Annexin V/PI apoptosis assay in AML cell lines trated with fucoidan. Apoptosis was evaluated using annexin V/PI assay. Cell lines were treated with 100 µg/mL
fucoidan. Results represent one of three independent experiments.
*: Purple population: Annexin-/PI- (live cells), Blue population: Annexin-/PI+ (necrotic cells), Red population: Annexin+/PI- (early apoptotic cells), Green population: Annexin+/PI+ (late apoptotic cells),
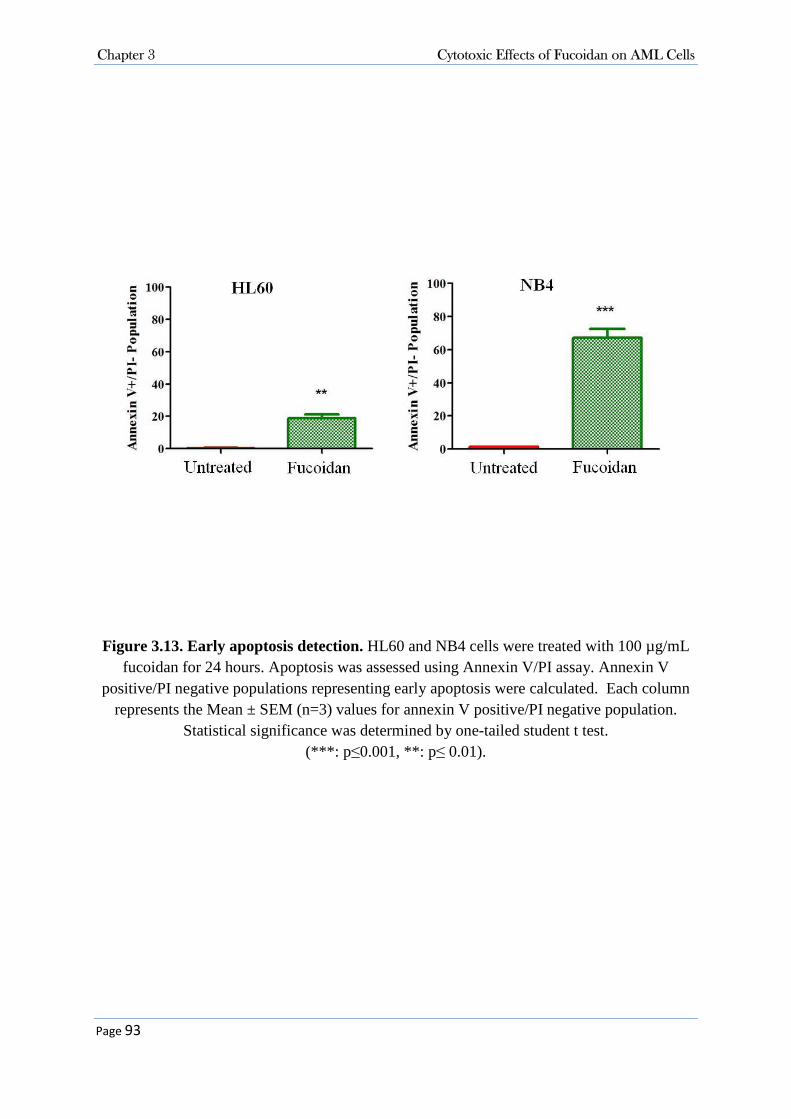
Chapter 3 Cytotoxic Effects of Fucoidan on AML Cells
Page 93
Figure 3.13. Early apoptosis detection. HL60 and NB4 cells were treated with 100 µg/mL fucoidan for 24 hours. Apoptosis was assessed using Annexin V/PI assay. Annexin V
positive/PI negative populations representing early apoptosis were calculated. Each column represents the Mean ± SEM (n=3) values for annexin V positive/PI negative population.
Statistical significance was determined by one-tailed student t test. (***: p ≤0.001, **: p≤ 0.01).

Chapter 3 Cytotoxic Effects of Fucoidan on AML Cells
Page 94
Figure 3.14. DNA fragmentation TUNEL assay. HL60, NB4, K562 and KG-1a cells were treated with increaing doses of fucoidan (from 10-100 µg/mL) and DNA fragmentation was
measured using the TUNEL assay. Mean ± SEM of at least three replicates is shown. Statistical significance was determined by ANOVA, followed by Tukey’s multiple
comparison test (***: p≤ 0.001, **: p≤ 0.01).

Chapter 3 Cytotoxic Effects of Fucoidan on AML Cells
Page 95
3.3.3.4 Fucoidan-Induced Apoptosis was Caspase Dependent
As NB4 cells showed the highest sensitivity to fucoidan, the further experiments were
conducted on NB4 cells. To determine the mechanisms by which fucoidan induces apoptosis,
the activation of caspase 3 as well as the cleavage of poly ADP ribose polymerase (PARP), a
downstream target of activated caspase 3 in isolated nuclei, were examined using Western
blotting. Since fucoidan caused near 100% NB4 cells death within 48 hours, the shorter
incubation time of 24 hours was selected for this assay in order to obtain sufficient amount of
protein. Fucoidan decreased the level of pro-caspase 3 and increased the cleaved activated
caspase 3 in treated cells in a dose dependent manner correlated with the detection of cleaved
PARP (Figure 3.15).
In order to examine the importance of caspase participation in apoptosis-induced by fucoidan,
cell proliferation and annexin V apoptosis assays were performed in the presence of the caspase
inhibitor Z-VAD-fmk in NB4 cells. In the WST-8 assay, the caspase inhibitor Z-VAD-fmk was
protective and partially ameliorated the anti-proliferative effect of fucoidan (p≤0.001) (Figure
3.16 A). In the annexin V/PI apoptosis assay, the inhibitory effect of fucoidan was completely
annulled in the presence of Z-VAD-fmk (p≤0.001) (Figure 3.16 B), indicating that caspase
activation is required for fucoidan activity.
The expression of various apoptosis, cell cycle and signalling pathway related molecules were
then examined. For these experiments, a dose of 50 µg/mL and the incubation time of 24 hours
were selected in order to obtain sufficient amount of protein.
To evaluate different apoptosis pathways, the expression of death receptors DR5 and Fas, pro-
apoptotic molecule Bax and anti-apoptotic molecule Bcl-xl in addition to the activation of
caspases 8 and 9 were examined. There was an increase in the amount of cleaved activated
caspase 8, which correlated to DR5 activation (Figure 3.17 A). No change in Fas expression
was observed. Caspase 9, the key caspase in the intrinsic pathway, was also activated by
fucoidan. Fucoidan increased expression of the pro-apoptotic molecule Bax but did not affect
expression of the anti-apoptotic molecule Bcl-xl (Figure 3.17 B).

Chapter 3 Cytotoxic Effects of Fucoidan on AML Cells
Page 96
Figure 3.15. Analysis of caspase 3 activation and PARP cleavage in fucoidan-induced apoptosis by Western blot. NB4 cells were treated with various concentrations of fucoidan
for 24 hours and cytoplasmic and nuclear fractions were isolated. GAPDH and SP1 were used as cytoplasmic and nuclear loading controls, respectively.

Chapter 3 Cytotoxic Effects of Fucoidan on AML Cells
Page 97
Figure 3.16. Effects of caspase inhibitor on fucoidan induced apoptosis. NB4 cells were pre-treated with Caspase inhibitor Z-Vad-fmk (40µM) for 1 hour followed by treatment with fucoidan for 24 hours. A) Cell proliferation was assesed using WST-8 proliferaton assay. B) Apoptosis was analysed using Annexin V/PI apoptosis assay. Mean ± SEM of at least three replicates is shown. Statistical significance was determined by two-way ANOVA,
followed by Bonferroni post-test (***: p≤ 0.001).

Chapter 3 Cytotoxic Effects of Fucoidan on AML Cells
Page 98
Figure 3.17. Analysis of the expression of apoptosis related proteins in A) extrinsic pathway B) intrinsic pathway by Western blot. NB4 cells were treated with 50 µg/mL fucoidan for 24 hours and cytoplasmic fraction was isolated. Protein expression levels of
cleaved caspase 8, DR5, Fas, cleaved caspase 9, Bcl-xl and Bax were analysed using specific antibodies. The cytoplasmic protein β-actin was used as loading control.

Chapter 3 Cytotoxic Effects of Fucoidan on AML Cells
Page 99
3.3.3.5 Fucoidan Changed the expression of Cell Cycle Proteins
Since fucoidan altered the distribution of cell cycle phases in NB4 cell lines, the expression of
cell cycle regulatory proteins P21/WAF1/CIP1 and cyclin D1 were examined using Western
blotting. The cyclin dependent kinase inhibitor P21/WAF1/CIP1 is a negative cell-cycle-
regulatory protein. Treatment with 50 µg/mL fucoidan for 24 hours induced a marked increase
in P21/WAF1/CIP1 expression in NB4 cells. No changes were seen in cyclin D1 expression
(Figure 3.18).
Figure 3.18. Analysis of the expression of cell cycle related proteins by Western blot. NB4 cells were treated with 50 µg/mL fucoidan for 24 hours and nuclear fraction was
isolated. Protein expression and P21/WAF1/CIP1 and cyclin D1 were analysed using specific antibodies. The nuclear protein SP-1 was used as loading control.

Chapter 3 Cytotoxic Effects of Fucoidan on AML Cells
Page 100
3.3.3.6 Fucoidan Deactivated ERK1/2 and Decreased Phosphorylation of AKT on Thr308
Residue.
MAPK and PI3k/AKT signal transduction pathways play major roles in cell proliferation and
apoptosis, hence both expression and activation levels of two main kinases were examined in
these pathways; ERK in the MAPK pathway and AKT in the P13K pathway. Whilst total
protein expression level of these two enzymes was not altered with fucoidan treatment of NB4
cells, the phosphorylation of both AKT and ERK1/2 enzymes was clearly down-regulated
(Figure 3.19), AKT is a serine/threonine-specific protein kinase and has two different
phosphorylation sites; Thr308 and Ser473. By examining the phosphorylation status of AKT
at both sites it was found that fucoidan did not alter the phosphorylation of AKT on the Ser473
site in APL cells, but it down-regulated the phosphorylation of AKT on the Thr308 residue as
indicated.
Figure 3.19. Analysis of the signal transduction pathways involvement in fucoidan-mediated apoptosis by Western blot. NB4 cells were treated with 50 µg/mL fucoidan for 24 hours. Protein expression and phosphorylation levels of ERK and AKT were analysed using
specific antibodies. The cytoplasmic protein β-actin was used as loading control.

Chapter 3 Cytotoxic Effects of Fucoidan on AML Cells
Page 101
3.3.3.7 Cellular Signalling and Fucoidan
To investigate whether fucoidan enters into the cells or functions as an extracellular stimulus,
NB4 cells were pre-treated with various concentrations of monensin, an endocytosis blocker,
for 2 hours following treatment with fucoidan for 24 hours. Cell proliferation was analysed
using WST-8 proliferation assay. It was observed that the endocytosis blockage did not prevent
the NB4 cell growth inhibition induced by fucoidan (Figure 3.20). However, since the
endocytosis blocker itself had growth-inhibitory effect and reduced the proliferation of NB4
cells, the obtained combined-(fucoidan+blocker)-treated-cells data were normalised according
to blocker only-treated cells. After normalization, no significant difference was observed
between fucoidan-treated cells with or without pre-treatment with endocytosis blocker (Figure
3.21). Pre-treatment with endocytosis blocker did not restore the reduced cell proliferation
caused by fucoidan.

Chapter 3 Cytotoxic Effects of Fucoidan on AML Cells
Page 102
Figure 3.20. WST-8 proliferation assay in NB4 cells pre-treated with endocytosis blocker; monensin. NB4 cells were pre-treated with an endocytosis blocker for 2 hours
following treatment with fucoidan for 24 hours. Cell proliferation was assessed using WST-8 proliferation assay. Mean ± SEM of at least three replicates is shown. Statistical significance
was determined by two-way ANOVA, followed by Bonferroni post-test. (***: p ≤ 0.001, *: p≤ 0.05)

Chapter 3 Cytotoxic Effects of Fucoidan on AML Cells
Page 103
Figure 3.21. WST-8 proliferation assay in cells pre-treated with endocytosis blocker, monensin, after data normalization. NB4 cells were pre-treated with an endocytosis
blocker for 2 hours following treatment with fucoidan for 24 hours. Cell proliferation was assessed using WST-8 proliferation assay. The data were normalised according to blocker-only-treated cells. Mean ± SEM of at least three replicates is shown. Statistical significance
was determined by two-way ANOVA, followed by Bonferroni post-test. (***: p ≤ 0.001, **: p≤ 0.01*: p≤ 0.05)

Chapter 3 Cytotoxic Effects of Fucoidan on AML Cells
Page 104
3.4 Discussion
Analysis of the tumour inhibitory effect of fucoidan in various types of AML revealed that
fucoidan specifically inhibited the growth of the APL cell lines NB4 and HL60. The growth-
inhibitory potential of fucoidan in APL cells was mainly due to activation of caspases and
inactivation of pro-survival signalling pathways. The data presented here also shows the
differing activity of fucoidan from different sources.
3.4.1 Fucoidan Metabolism and Variable Activities of Fucoidan from
Different Sources
Despite the promising findings about the anti-cancer effect of fucoidan, there are still
challenges impeding utilization of fucoidan in the clinic. The overall review of the literature
demonstrates wide variability of the effects of fucoidan in different studies. The differences
and the controversies between the results mainly stem from the variable nature of fucoidan
(including its structure and molecular weight) depending on its source, amongst other factors.
In this thesis, fucoidan extracts from various sources revealed different activities. The purified
fucoidans from two seaweed sources (U. pinnatifida and F. vesiculosus) supplied by Marinova
Pty. Ltd. did not affect cell proliferation and DNA content even at the very high doses of 2
mg/mL. In contrast, the fucoidan from F. vesiculosus from Sigma-Aldrich Co. highly inhibited
the growth of AML cell lines.
It is well known that the difference in molecular backbone structures of fucoidan extracts can
result in differences in their bio-properties. Fucoidan structure differs depends on various
factors such as the harvest season, seaweed sources, the parts of the plant, extraction and the
purification methods used and the stage of development of the algae. The fucoidan extract from
F. vesiculosus supplied by Sigma-Aldrich Co. is prepared by dissolving the crude fucoidan in
deionised water, acidified to precipitate algenic acid, centrifuged, filtered and lyophilised
whereas Marinova Pty. Ltd. supplied fucoidans are extracted using a cold water technique. We
believe that differential structural changes observed in the composition analysis of different
fucoidans could have been due to different extraction methods.
Sulphate content has the most essential role in bioactivity of fucoidan. The use of de-sulphated
and over-sulphated fucoidan with the sulphate content varying from 6% to 41% has shown that

Chapter 3 Cytotoxic Effects of Fucoidan on AML Cells
Page 105
the minimum necessary sulphate content for anti-proliferative activity of fucoidan against
CCL39 fibroblast cells is 20% (227). Here, fucoidans from both sources had almost similar
amount of near 27% sulphate, as a result sulphate content cannot be the reason for the
differential results. The position of sulphate groups in the molecule structure has also a key
role in the function of polysaccharides (228), which was not analysed in this study.
Molecular weight is another factor which plays role in fucoidan bioactivity. Here, the MW for
purified fucoidan from U. pinnatifida from Marinova Pty Ltd. was three times more than that
of the fucoidan from F. vesiculosus from Sigma-Aldrich Co. (60 kDa vs 20 kDa). Cho and
colleagues produced three fucoidan fractions with molecular weights of <5, 5–30 and >30 kDa
and compared their anti-cancer activity in vitro. Interestingly, the F5-30K revealed the most
tumour growth inhibitory effect despites the sulphate amount in F<5K was greater than that of
two other fractions (229).
Another significant difference between Sigma-Aldrich Co. and Marinova Pty Ltd. supplied
fucoidans was presence of significantly higher amount of uronic acid in the structure of
fucoidan from Sigma-Aldrich Co. (more than 4 fold). Uronic acids are acidic carbohydrates,
structurally similar to monosaccharaides -except having carboxyl group (COOH) instead of
CH2OH radical in monosaccharaides (230)-, and can be located in the repeating units of
polysaccharides (231). Uronic acids are stable structures in the fucoidan molecule and can be
prevalently bound to sulphate groups. Different studies have indicated a critical role for uronic
acid in the biological activity of polysaccharides (232). In addition, due to the significance of
uronic acid in polysaccharide functionality, new studies have attempted to assemble more
active molecules by synthesis of uronic acid building blocks (233).
Rosenberg et al. (234) compared the structure of highly active and relatively inactive
preparations of heparin, a sulphated polysaccharide which has marked structural and functional
resemblance to fucoidan (235), and showed that the highly active heparin contained a greater
number of uronic acid residues than the relatively inactive substance. In addition, in highly
active heparin, a large number of non-sulphated uronic acid residues were located in a
restricted region of the molecule or at penultimate positions within the polysaccharide chain,
whereas the sulphated uronic acids presented in the main structure. In another study, the anti-
tumour activity of 31 different polysaccharides isolated from a brown seaweed against Ehrlich
carcinoma was tested in mice. Among those, only L-fucan and fucoidan containing

Chapter 3 Cytotoxic Effects of Fucoidan on AML Cells
Page 106
approximately 10% uronic acid exhibited anti-tumour potential (236). Here, the amount of
uronic acid in Marinova Pty. Ltd. supplied purified fucoidan from U. pinnatifida was near 1.5%
compared to 6% in Sigma-Aldrich Co. supplied fucoidan from F. vesiculosus. Although the
position of sulphate and uronic acid on fucoidans’ structure was not examined in this study, the
significantly low amount of uronic acid in purified fucoidan molecule from Marinova Pty. Ltd.
might explain its inactivity.
One factor that can make the results challengeable is the presence of 3.9% polyphenol in the
fucoidan from Sigma-Aldrich Co. Polyphenol is a phytochemical widely distributed in plants
including marine plants such as seaweeds and is reported to have anti-oxidant and cytotoxic
effects (237). As purification of the product was not carried out, it is not clear how much the
presence of 3.9% polyphenols could have interfered with the cytotoxic effects of the fucoidan.
Another important unanswered question is that whether fucoidan penetrates into the cell and
directly performs its activities or remains outside of the cells and exerts its functions through
attachment to surface receptors and downstream molecules. To answer to this question, cells
were pre-treated with an endocytosis blocker (monensin) to prevent the entrance of fucoidan
into the cells. The cell proliferation was then analysed 24 hours after treatment with fucoidan.
Upon NB4 cell treatment with monensin (alone or in combination with fucoidan), it was
observed that the monensin itself decreased the NB4 cell proliferation. Monensin is a
monovalent ion-selective ionophore that prevents the internalization of a variety of ligands. It
also acts as a Golgi apparatus plug and interferes with vesicular transport. It is established that
monensin decreases cell proliferation and induces cell death through mitochondrial damage
and dilatation of the Golgi apparatus in various tumour cells (238). Park et al. showed the
antiproliferative effects of monensin through cell cycle-related proteins such as p27 in AML
cell lines (239). Data obtained in this project is consistent with these findings. Similar to
monensin, fucoidan induces apoptosis via different apoptosis and cell cycle related proteins.
This may explain the enhanced reduction of cell proliferation in NB4 cells when they were co-
treated with both fucoidan and monensin.
The data represented here showed that the endocytosis blocker did not restore the apoptosis
mediated by fucoidan. Since the monensin itself had growth inhibitory effect, the combination
data were normalised accordingly and yet still endocytosis blockage did not restore the reduced
cell proliferation by fucoidan suggesting that fucoidan’s action is not associated with its

Chapter 3 Cytotoxic Effects of Fucoidan on AML Cells
Page 107
entrance into the cell. Nevertheless, since hydrophobicity of the molecule plays a crucial role
in its transport across the membrane I believe that this result is not strong enough to conclude
that fucoidan does not enter the cells and performs its action via surface receptors and
downstream molecules. In 2002, Deux et al. evaluated the internalisation of LMW fucoidan
into rabbit smooth muscle cells (SMCs). Fucoidan was shown to be internalised by endocytosis
at 6 h and the number of vesicles containing fucoidan increased in the peri-nuclear region at 24
h. However, they did not observe fucoidan’s nuclear internalisation at any time during the study
(150). In contrast, Kimura et al. investigated the transport of a native fucoidan from
Cladosiphon okamuranus (MW: 80 kDa) and reported a poor permeation of fucoidan across
the human colon adenocarcinoma Caco-2 cell monolayer (151). To investigate this further, it
is suggested that the penetration of fucoidan be analysed using high-performance liquid
chromatography (HPLC) in whole cell lysate after treatment with fucoidan. This could also be
assessed using cell imaging system when an antibody against fucoidan becomes available.
3.4.2 Cytotoxic Effects of Fucoidan on different AML cells
In this chapter, the examination of tumour inhibitory effect of fucoidan in various types of
AML showed that fucoidan specifically induced apoptosis in APL cell lines (NB4 and HL60),
but not other AML cell lines. HL-60 cells are negative for t(15;17) whereas NB4 cells are
positive for t(15;17). The induced cell death was observed in both cell lines indicating that the
translocation t(15;17) is not required for fucoidan activity.
Induction of apoptosis is one of the key pathways exploited by anti-cancer agents and is
activated through either the extrinsic pathway which is activated by a death receptor located on
the cell membrane or the intrinsic pathway which is activated by Bcl-2 family followed by
downstream mitochondrial signals. Kim et al. and Lee et al. reported that fucoidan from a
similar source as ours induced tumour cells apoptosis via activation of caspases (167, 240). In
contrast, Costa et al. demonstrated that the apoptosis mediated by fucoidan (from Sargassum
filipendula) in Hela cells was caspase-independent (172). Zhang et al. however reported that
fucoidan from Mozuku increased activation of caspase 9 only and not caspases 7 or 8 in MCF-
7 breast cancer cells (160). These results imply that the action of fucoidan is highly dependent
on cell type and fucoidan source. In this thesis, fucoidan activated caspase 8 and this was
correlated to activation of death receptor DR5 (TNF-related apoptosis-inducing ligand

Chapter 3 Cytotoxic Effects of Fucoidan on AML Cells
Page 108
(TRAIL) receptor II). Caspase 9 was also activated by fucoidan’s action and this was correlated
with upregulation of the pro-apoptotic molecule Bax. The pan-caspase inhibitor, Z-VAD-fmk,
significantly prevented fucoidan-mediated apoptosis, suggesting that caspases are essential in
fucoidan-induced apoptosis. Taken together, fucoidan induces apoptosis in APL cells through
both intrinsic and extrinsic pathways.
The cyclin dependent kinase inhibitor P21/WAF1/CIP1 is a negative cell-cycle-regulatory
protein. Transcriptional activation of P21/WAF1/CIP1, either p53-dependent or independent,
inhibits the accumulation of cyclin-CDK complexes and therefore causes G1/S and G2/M
arrest. The cell cycle arrest caused by P21/WAF1/CIP1 has also been shown to stimulate the
cleavage of caspase 9 resulting in apoptosis within the cell (241). Data presented here
demonstrated that fucoidan led to accumulation of P21/WAF1/CIP1 in APLL cells. This is
supported by others (163, 166) who have demonstrated the involvement of fucoidan in
P21/WAF1/CIP1 upregulation in prostate and bladder cancer cell lines, respectively.
MAPK and PI3/AKT are key components of the signalling pathways involved in cell
proliferation and transmit signals through enzymes such as Raf, MEK, ERK and AKT (155).
Since fucoidan has been shown to target cell survival and apoptosis processes, it is
hypothesised that the mechanism of action is inducing changes in the activation of signalling
pathway molecules. Here, expression and activation of two kinases involved in these key
signalling molecules were evaluated; ERK and AKT in the MAPK and P13K pathways
respectively. Fucoidan reduced activation of both enzymes through hypo-phosphorylation, but
it did not alter their total expression levels.
PI3K/AKT is a signal transduction pathway whose activation mediates multiple biological
processes such as cell survival, growth and proliferation and inhibits apoptosis. AKT is one of
the key enzymes in this pathway and, as mentioned, fucoidan suppressed AKT activation,
leading to cell death. Our findings regarding the observed inactivation of AKT are similar to
those of others (171, 242). It has also been reported that AKT over-activation is associated with
drug resistance, tumour cell survival and migration (243). AKT activation occurs following
phosphorylation of two different residues: Thr308 (in the activation loop) and Ser473 (in the
C-terminal hydrophobic motif). Activation of Thr308 and not Ser473 correlates with poor
prognosis in AML (244). The analysis of the phosphorylation of AKT in both Thr308 and
Ser473 residues indicated that fucoidan did not alter the phosphorylation of AKT on the Ser473

Chapter 3 Cytotoxic Effects of Fucoidan on AML Cells
Page 109
site in APL cell lines, but it down-regulated the phosphorylation of AKT on the Thr308 residue.
This is the first study that has reported a selective effect of fucoidan on AKT phosphorylation
sites.
In this study, fucoidan markedly inactivated ERK. Studies by Patel et al. and Aisa et al. also
showed that the anti-mitogenic property of fucoidan is mediated by hypo-phosphorylation and
deactivation of ERK1/ERK2 in vascular smooth muscle cells and in human lymphoma cells,
respectively (155, 182). In contrast, Hsu and colleagues proposed that fucoidan causes ERK
activation rather than inactivation (190). It is known that the ERK signalling pathway is
complex and induces a range of different responses including cell proliferation, differentiation,
migration and even apoptosis depending on cell type, the type of stimulus and duration of
activation. For instance, it is generally believed that the ERKs progress cell proliferation in
most types of cells, while in some studies, the ERKs have shown pro-apoptotic (and not
mitogenic) influences on renal cell lines (245). In contrast to this thesis, Jin and colleagues
reported activation of ERK in NB4 and HL60 cells (170). It should be highlighted that duration
of activation and timing are the main variables in signal transduction pathways studies. ERK
activation was measured after 24 hours but in the study by Jin et al., the ERK activation was
measured after only 15 minutes.
In contrast to APL cell lines, fucoidan did not induce apoptosis in the AML cell lines KG-1a
and K562. This cell-type specific growth inhibitory activity of fucoidan has been previously
reported. Fukahori et al. examined 6 different hepatocarcinoma cell lines revealing selective
and differing inhibitory effects of fucoidan (169). Cell lineage and maturation stage of
haematopoietic cells are governed by altered regulation and differential expression of sets of
genes in different pathways and these differences are likely to affect the cell response to drugs.
The CD34+/CD38- cells isolated from both K562 and KG-1a cell lines are reported to have less
phosphorylated p38 MAPK than those isolated from human cord blood (246). It has been
suggested that this reduced phosphorylation of p38 may reduce the sensitivity of these cell
types to activation of apoptosis. Xiao et al. showed that modification of p38 through over-
phosphorylation induced growth arrest and apoptosis in both K562 and KG-1a cell lines (246).
Previously published studies have also reported that fucoidan induces apoptosis in monocytic
U937 cells through p38 activation (247). Here, it is hypothesised that lower phosphorylation

Chapter 3 Cytotoxic Effects of Fucoidan on AML Cells
Page 110
of p38 in K562 and KG-1a cell lines could possibly protect them against the anti-tumour
activity of fucoidan.
In agreement with data obtained here, Jin et al. also reported that fucoidan does not induce
apoptosis in K562 cells (170). However, the cell proliferation study in this project revealed that
fucoidan slightly decreased proliferation of K562 cells after 48 hours. To investigate this
further, the DNA content was analysed and a marked increase in G0/G1 cell population was
found in treated K562 cells. This indicates that fucoidan induces cell cycle arrest without
switching on the apoptosis pathway in this cell type. Unlike the NB4, HL60 and K562 cell
lines, the undifferentiated AML cell line KG-1a was resistant to the growth inhibitory function
of fucoidan. In DNA content analysis, fucoidan induced neither cell cycle arrest nor sub G0/G1
dead cell population.
In summary, it is concluded that fucoidan’s action against tumour cells is cell-type specific and
further that APL cells showed higher response to fucoidan. Fucoidan was found to reduce the
activation of ERK1/2 and AKT in APL cells and induce the activation of caspases 8, 9 and 3
where fucoidan’s action was attenuated using a pan-caspase inhibitor.

1
Page 111
Chapter Four –Prophylactic Anti-Tumour Activity of Fucoidan in
AML
Prophylactic Anti-Tumour
Activity of Fucoidan in AML
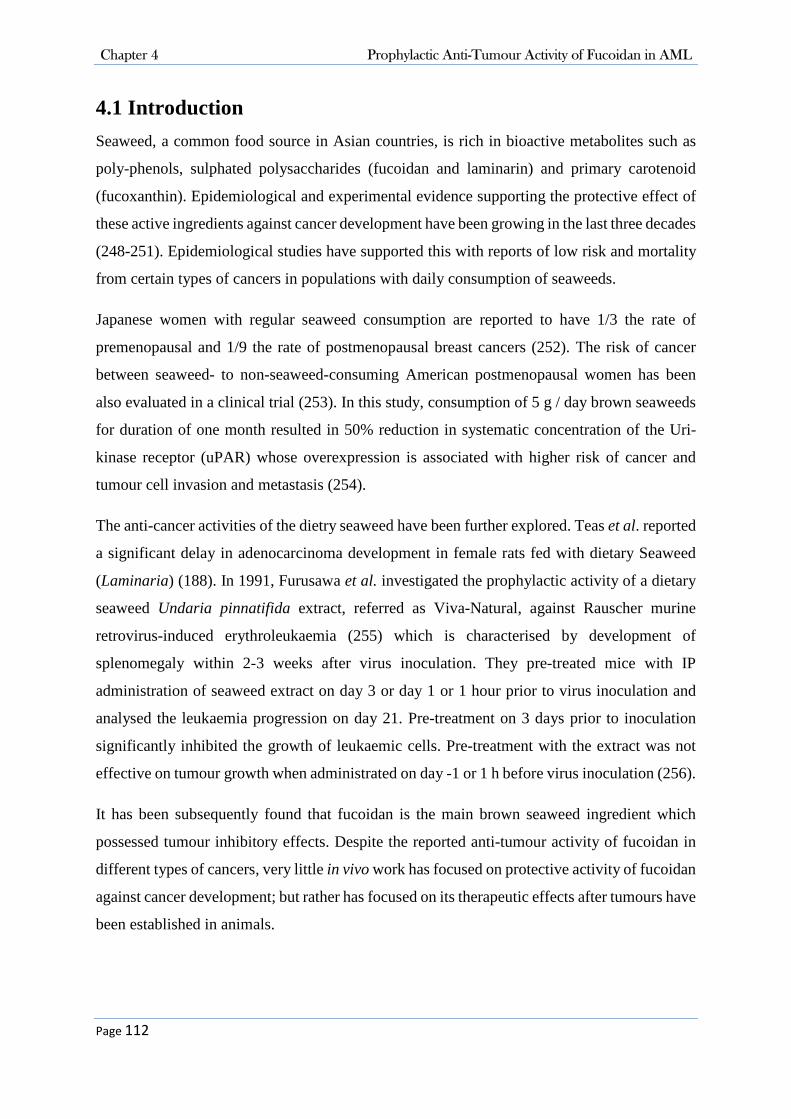
Chapter 4 Prophylactic Anti-Tumour Activity of Fucoidan in AML
Page 112
4.1 Introduction
Seaweed, a common food source in Asian countries, is rich in bioactive metabolites such as
poly-phenols, sulphated polysaccharides (fucoidan and laminarin) and primary carotenoid
(fucoxanthin). Epidemiological and experimental evidence supporting the protective effect of
these active ingredients against cancer development have been growing in the last three decades
(248-251). Epidemiological studies have supported this with reports of low risk and mortality
from certain types of cancers in populations with daily consumption of seaweeds.
Japanese women with regular seaweed consumption are reported to have 1/3 the rate of
premenopausal and 1/9 the rate of postmenopausal breast cancers (252). The risk of cancer
between seaweed- to non-seaweed-consuming American postmenopausal women has been
also evaluated in a clinical trial (253). In this study, consumption of 5 g / day brown seaweeds
for duration of one month resulted in 50% reduction in systematic concentration of the Uri-
kinase receptor (uPAR) whose overexpression is associated with higher risk of cancer and
tumour cell invasion and metastasis (254).
The anti-cancer activities of the dietry seaweed have been further explored. Teas et al. reported
a significant delay in adenocarcinoma development in female rats fed with dietary Seaweed
(Laminaria) (188). In 1991, Furusawa et al. investigated the prophylactic activity of a dietary
seaweed Undaria pinnatifida extract, referred as Viva-Natural, against Rauscher murine
retrovirus-induced erythroleukaemia (255) which is characterised by development of
splenomegaly within 2-3 weeks after virus inoculation. They pre-treated mice with IP
administration of seaweed extract on day 3 or day 1 or 1 hour prior to virus inoculation and
analysed the leukaemia progression on day 21. Pre-treatment on 3 days prior to inoculation
significantly inhibited the growth of leukaemic cells. Pre-treatment with the extract was not
effective on tumour growth when administrated on day -1 or 1 h before virus inoculation (256).
It has been subsequently found that fucoidan is the main brown seaweed ingredient which
possessed tumour inhibitory effects. Despite the reported anti-tumour activity of fucoidan in
different types of cancers, very little in vivo work has focused on protective activity of fucoidan
against cancer development; but rather has focused on its therapeutic effects after tumours have
been established in animals.
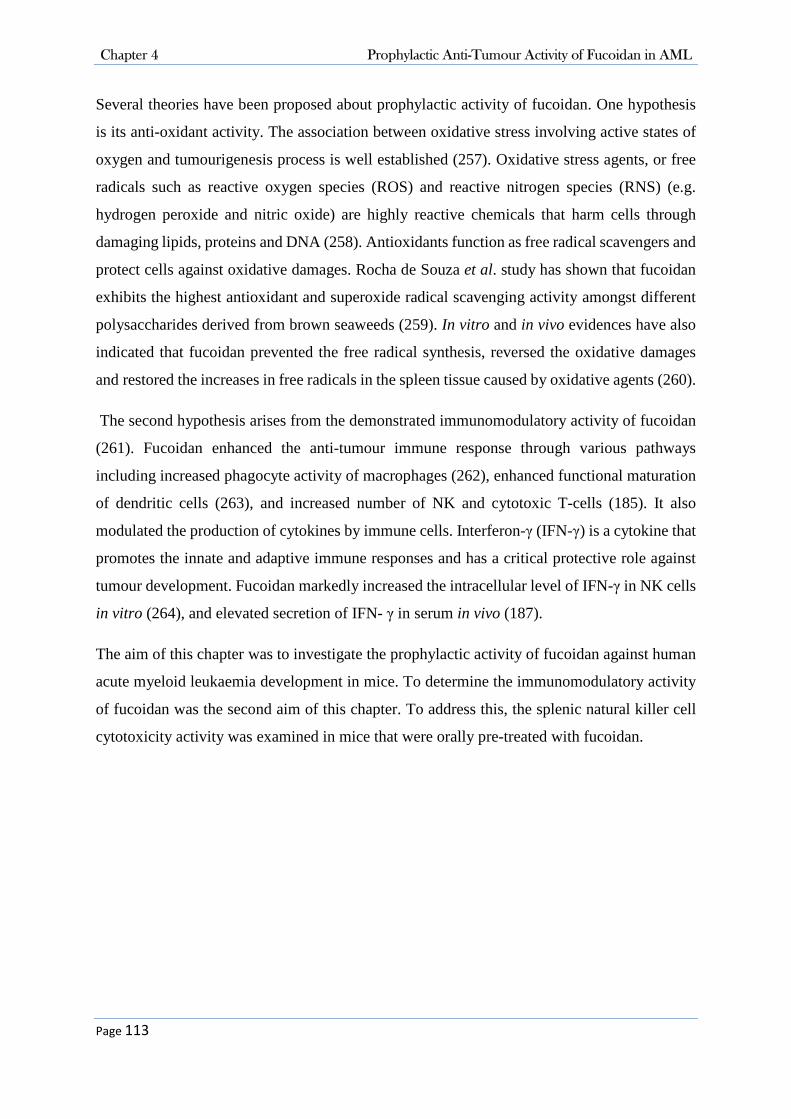
Chapter 4 Prophylactic Anti-Tumour Activity of Fucoidan in AML
Page 113
Several theories have been proposed about prophylactic activity of fucoidan. One hypothesis
is its anti-oxidant activity. The association between oxidative stress involving active states of
oxygen and tumourigenesis process is well established (257). Oxidative stress agents, or free
radicals such as reactive oxygen species (ROS) and reactive nitrogen species (RNS) (e.g.
hydrogen peroxide and nitric oxide) are highly reactive chemicals that harm cells through
damaging lipids, proteins and DNA (258). Antioxidants function as free radical scavengers and
protect cells against oxidative damages. Rocha de Souza et al. study has shown that fucoidan
exhibits the highest antioxidant and superoxide radical scavenging activity amongst different
polysaccharides derived from brown seaweeds (259). In vitro and in vivo evidences have also
indicated that fucoidan prevented the free radical synthesis, reversed the oxidative damages
and restored the increases in free radicals in the spleen tissue caused by oxidative agents (260).
The second hypothesis arises from the demonstrated immunomodulatory activity of fucoidan
(261). Fucoidan enhanced the anti-tumour immune response through various pathways
including increased phagocyte activity of macrophages (262), enhanced functional maturation
of dendritic cells (263), and increased number of NK and cytotoxic T-cells (185). It also
modulated the production of cytokines by immune cells. Interferon-γ (IFN-γ) is a cytokine that
promotes the innate and adaptive immune responses and has a critical protective role against
tumour development. Fucoidan markedly increased the intracellular level of IFN-γ in NK cells
in vitro (264), and elevated secretion of IFN- γ in serum in vivo (187).
The aim of this chapter was to investigate the prophylactic activity of fucoidan against human
acute myeloid leukaemia development in mice. To determine the immunomodulatory activity
of fucoidan was the second aim of this chapter. To address this, the splenic natural killer cell
cytotoxicity activity was examined in mice that were orally pre-treated with fucoidan.

Chapter 4 Prophylactic Anti-Tumour Activity of Fucoidan in AML
Page 114
4.2 Experimental Design
4.2.1 Analysis of Prophylactic Activity of Fucoidan in Vivo
The acute promyelocytic leukaemia NB4 cells were selected as they were sensitive to fucoidan.
NB4 cells provide a suitable model for xenograft human APL. Five to seven week old BALB/c
athymic nu/nu mice were randomly divided into two groups; the control group (n=8) and the
fucoidan group (n=9) (Table 4.1). The animals in the fucoidan group were daily fed with 150
µg/g b.w. fucoidan from F. vesiculosus (Sigma-Aldrich Co.) mixed with peanut butter for two
weeks (see Section 2.9.4.1). The control group was fed with the same amount of peanut butter
mixed with vehicle (distilled water). The animal’s body weight was measured daily in both
groups until the end of the study and doses were calculated daily according to body weight.
After 14 days, NB4 cells were injected subcutaneously in the right flank of each mouse and the
xenograft tumour appearance and growth were monitored daily. When the transplanted tumour
volume reached 1000 mm3, the mice were humanely euthanised (see Section 2.9.7). Tumour
volume doubling time and tumour growth rate were calculated for each mouse.
Table 4.1. The Number and Gender of Mice Used for Prophylactic Study
Control Fucoidan Female 4 4 Male 4 5 Total 8 9
4.2.1 Analysis of Immunomodulatory Activity of Fucoidan in Vivo
To investigate the underpinning mechanism of the prophylactic activity of fucoidan on tumour
growth, the immunomodulatory effect of fucoidan and its role in mice’s NK cell function was
investigated. To do this, twelve 5-7 week old male BALB/c athymic nu/nu mice were randomly
divided into two groups; the control group (n=6) and the fucoidan group (n=6). Animals were
fed with 150 µg/g b.w. fucoidan (Sigma Co.) or distilled water in peanut butter (as described
in Chapter 2). After 14 days, the mice were humanely euthanised with inhalation of CO2 and
the cytotoxic activity of spleen NK cells was investigated using flow cytometry (see Section
2.9.10).

Chapter 4 Prophylactic Anti-Tumour Activity of Fucoidan in AML
Page 115
4.3 Results
(This section has been substantially published in Atashrazm et al. 2015 (221))
4.3.1 Oral Fucoidan Delayed the AML Appearance and Growth in Mice
To analyse the protective activity of fucoidan on leukaemia development, 17 mice were pre-
fed with fucoidan followed by tumour cell injection and the effect of orally administered
fucoidan on subcutaneous xenograft tumour development was examined. Three out of eight
female mice including 1 in control group and 2 in fucoidan group did not develop tumour for
up to 50 days. As a result the experimental animals were limited into 14 mice: 7 in each control
and fucoidan group. No signs of toxicity were observed in mice fed with fucoidan.
No significant difference was observed in body weight in animals and it slightly increased in
both control mice and fucoidan mice; mean ± SD of body weight gain was 3.25±1.65 g and
3.85±1.95 g in control and fucoidan groups, respectively (see Appendix D).
Significant anti-tumour activity was observed in mice fed with fucoidan compared to the
control (p≤0.001) (Figure 4.1). Following inoculation with NB4 cells the subcutaneous tumour
mass appeared in less than 10 days in 5 out of 7 mice in the control group and 2 out of 7 mice
in the pre-treated fucoidan group. The mean of doubling time for the tumour mass was 1.8 days
in the control group compared to 4.64 days in the fucoidan group. The growth rate which is the
number of volume doublings that occurred per day was also calculated. The mean of tumour
growth rate was 0.37 in the control group and 0.23 in the fucoidan groups.
The tumour size reached the end point in less than 12 days after tumour appearance in all mice
in the control group compared to 1 mouse in the fucoidan group. Figure 4.2 shows the tumour
mass at day 19 after tumour cell injection in two representative mice from fucoidan and control
groups. Figure 4.3 compares the tumour volume in both groups at four-day intervals for up to
12 days when all mice in control group were sacrificed.

Chapter 4 Prophylactic Anti-Tumour Activity of Fucoidan in AML
Page 116
Figure 4.1. Tumour appearance and growth in mice fed with vehicle or fucoidan. Mice were fed with fucoidan or vehicle for 14 days (n=7/group). NB4 cells were injected into mice and tumour volume was measured daily. Each line represents the daily tumour volume in one
mouse in fucoidan group (green) and control group (red).
* Due to tumour rupture, two mice (1/group) were sacrificed before the tumour size reached the end point.
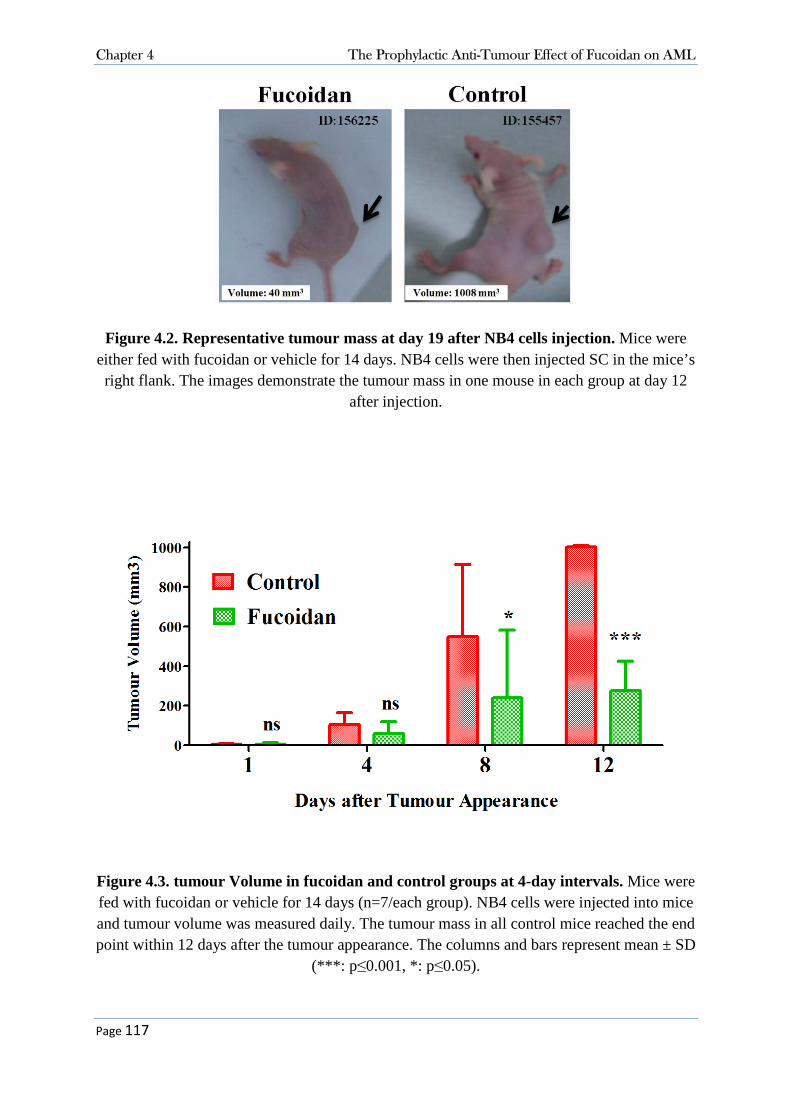
Chapter 4 The Prophylactic Anti-Tumour Effect of Fucoidan on AML
Page 117
Figure 4.2. Representative tumour mass at day 19 after NB4 cells injection. Mice were either fed with fucoidan or vehicle for 14 days. NB4 cells were then injected SC in the mice’s right flank. The images demonstrate the tumour mass in one mouse in each group at day 12
after injection.
Figure 4.3. tumour Volume in fucoidan and control groups at 4-day intervals. Mice were fed with fucoidan or vehicle for 14 days (n=7/each group). NB4 cells were injected into mice and tumour volume was measured daily. The tumour mass in all control mice reached the end point within 12 days after the tumour appearance. The columns and bars represent mean ± SD
(***: p ≤0.001, *: p≤0.05).

Chapter 4 The Prophylactic Anti-Tumour Effect of Fucoidan on AML
Page 118
4.3.2 Fucoidan Increased Splenic NK-cell Activity in Vivo
Given our observation and the known immunomodulatory activity of fucoidan, it was
hypothesised that fucoidan increases the cytotoxic activity of splenic NK cells when it is orally
administrated. Twelve additional mice were fed with either fucoidan or distilled water (6 in
each group) for 14 days and the mice were humanely euthanised and their spleen was removed.
The viability of isolated splenic mononuclear cells (MNCs) was assessed using trypan blue
exclusion and was more than 90% for all animals.
To measure the ability of MNCs to lyse the NK cell-sensitive YAC-1 cells, the target YAC-1
cells were first labelled with the fluorescent dye CellTrace™ Violet (CTV). As shown in Figure
4.4A, YAC-1 cells 100% labelled with CTV was established before being used for the
experiment. The CTV+ YAC-1 cells were then combined with effector MNCs at effector cells
to target cells ratios of 3:1, 6:1, 12:1, 25:1, 50:1 and 100:1. Each sample was plated in triplicate
and a control YAC-1 cell sample was included. After 4 hours incubation, the dead YAC-1 cells
were measured using PI staining with flow cytometer. The amount of spontaneous dead YAC-
1 cells was measured in YAC-1 control wells only (Figure 4.4B). To calculate the specific
YAC-1 cell lysis by NK cells, the amount of spontaneous dead YAC-1 cells in control wells
was subtracted from the results of the experiments (Figure 4.4C). The results for one
representative mouse in each group are shown in Figures 4.5 and 4.6.
As shown in Figure 4.7, the cytotoxic activity of NK cells from the fucoidan group was higher
than that of the control group in all six effector to target cells ratios (p=0.3). The difference
was statistically significant at 50:1 and 100:1 effector:target cells ratio (p≤0.05, p≤0.001
respectively). This result suggests that consumption of fucoidan can modulate the innate
immune system by increasing the cytolytic activity of NK cells.

Chapter 4 The Prophylactic Anti-Tumour Effect of Fucoidan on AML
Page 119
Figure 4.4. Flow cytomety histograms for NK cell cytotoxicity assay in one representative experiment. The YAC-1 cells were labelled with CTV and used as targets for splenic NK cells as effectors. Left histograms show cell population based on size (FSC) and granularity (SSC). Debris was excluded and the remaining cells were gated as “Gate A”. Middle histograms show PI versus CTV in “Gate A” population. The CTV+ cells were gated as “Gate B”. Right histograms show PI versus CTV in “Gate B” population. Results from this histogram were used for calculation.
A) “CTV-labelled target cells only” without PI. This control was used to ensure all target cells were labelled with CTV. As shown in the middle graph, all YAC-1 cells were 100% labelled with CTV. The CTV+ cells were gated and used for NK cell-mediated cytotoxicity analysis. B) “CTV-labelled target cells only” with PI. The 0:1 effector to target cells were used as the minimum control cells. The amount of PI+ dead YAC-1 cells (green population) was calculated as spontaneous cell death. C) CTV-labelled target cells plus effector cells. Splenic mononuclear cells obtained from each mouse were added to the target cells. The amount of PI+ dead YAC-1 cells (green population) was calculated. The percentage of spontaneous dead cells was subtracted from these results.
Red population: live target cells (CTV+/PI-), Green population: dead target cells (CTV+/PI+), Purple population: effector cells (CTV-)

Chapter 4 The Prophylactic Anti-Tumour Effect of Fucoidan on AML
Page 120
Figure 4.5. NK cell cytotoxicty assay in one representative mouse in control group. Mice were fed with vehicle for 14 days (n=6). Splenic mononuclear cells were isolated and NK cell cytotoxicity was analysed using flow cytometry. The CTV+ YAC-1 cells were used as targets for splenic NK cells (effectors). The dead YAC-1 cells were analysed with PI staining. Each histogram demonstrates the live (red) and dead (green) YAC-1 cells in various dilutions of effector:target. To measure the spontaneous cell death, minimum control cells (0:1) containing target cells only were prepared. Results represent one of three replicates in 1 out of 6 mice.
Red population: CTV+/PI- (live target cells), Green population: CTV+/PI+ (dead target cells)

Chapter 4 The Prophylactic Anti-Tumour Effect of Fucoidan on AML
Page 121
Figure 4.6. NK cell cytotoxicty assay in one representative mouse in fucodian group. Mice were fed with fucoidan for 14 days (n=6). Splenic mononuclear cells were isolated and NK cell cytotoxicity was analysed using flow cytometry. The CTV+ YAC-1 cells were used as targets for splenic NK cells (effectors). The dead YAC-1 cells were analysed with PI staining. Each histogram demonstrates the live (red) and dead (green) YAC-1 cells in various dilutions of effector:target. To measure the spontaneous cell death, minimum control cells (0:1) containing target cells only were prepared. Results represent one of three replicates in 1 out of 6 mice.
Red population: CTV+/PI- (live target cells), Green population: CTV+/PI+ (dead target cells)

Chapter 4 The Prophylactic Anti-Tumour Effect of Fucoidan on AML
Page 122
Figure 4.7. Splenic NK cell cytotoxicity. Percentage of dead targets cells (YAC-1 cells) in mice fed with fucoidan (green) and control mice (red) were calculated (n=6/group). Data
represent mean ± SD. Statistical significance was determined by two-way ANOVA, followed by Bonferroni post-test (***: p≤ 0.001, *: p≤0.05).

Chapter 4 The Prophylactic Anti-Tumour Effect of Fucoidan on AML
Page 123
4.4 Discussion
Data in this chapter presents evidence that fucoidan has protective effects against development
of acute promyelocytic leukaemia in a xenograft mouse model. APL appearance and growth
were significantly delayed in mice that were pre-fed with fucoidan. This was possibly through
modulation of immune system as fucoidan enhanced cytolytic activity of NK cells in mice.
4.4.1 Protective Effect of Fucoidan against AML development in Mice
A large number of epidemiologic, animal and laboratory studies indicate that dietary factors
play a key role in cancer prevention and progression. Several studies have associated
consumption of seaweeds containing fucoidan with low risk of cancers (265). The preventive
effect is highly related to the anti-inflammatory and immunomodulatory activities of this
component. Herein, the prophylactic effects of fucoidan on an acute myeloid leukaemia mouse
model were examined. Development of APL following NB4 cell inoculation was investigated
in mice that were pre-fed with fucoidan and it was observed that fucoidan significantly
protected mice against APL development.
Few studies have shown that fucoidan inhibits the neoplastic transformation. In a study by Teas
et al., a group of female Sprague-Dawley rats were fed with dietary seaweed (laminira) for 34
days and then were given carcinogen 7,12-dimethylbenz(a) anthracene. Feeding was continued
per day for the entire period of the study. The animals were monitored for 26 weeks and the
rate of tumour development was examined. Experimental rats showed a significant delay in
tumour appearance; the median time from carcinogen administration until first tumour
appearance was 19 weeks in the seaweed-fed rats and 11 weeks in the control rats (253). The
delayed tumour appearance observed in Teas et al. study is similar to results in this Chapter.
Although mice were treated for a shorter period of time than their study and feeding was not
continued after tumour inoculation, fucoidan still could protect the animals against tumour
development.
In a recent study by Huang et al, oral administration of fucoidan prophylactically alleviated
cachectic symptom of lung carcinoma (266). In their study inoculation of Lewis lung
carcinoma cells in mice resulted in body weight loss in tumour-bearing animals compared to
non-bearing-tumour control mice. But mice orally fed with fucoidan (1 or 3 mg /mouse) had
significant increase in the body weight compared to tumour-bearing mice receiving water. In
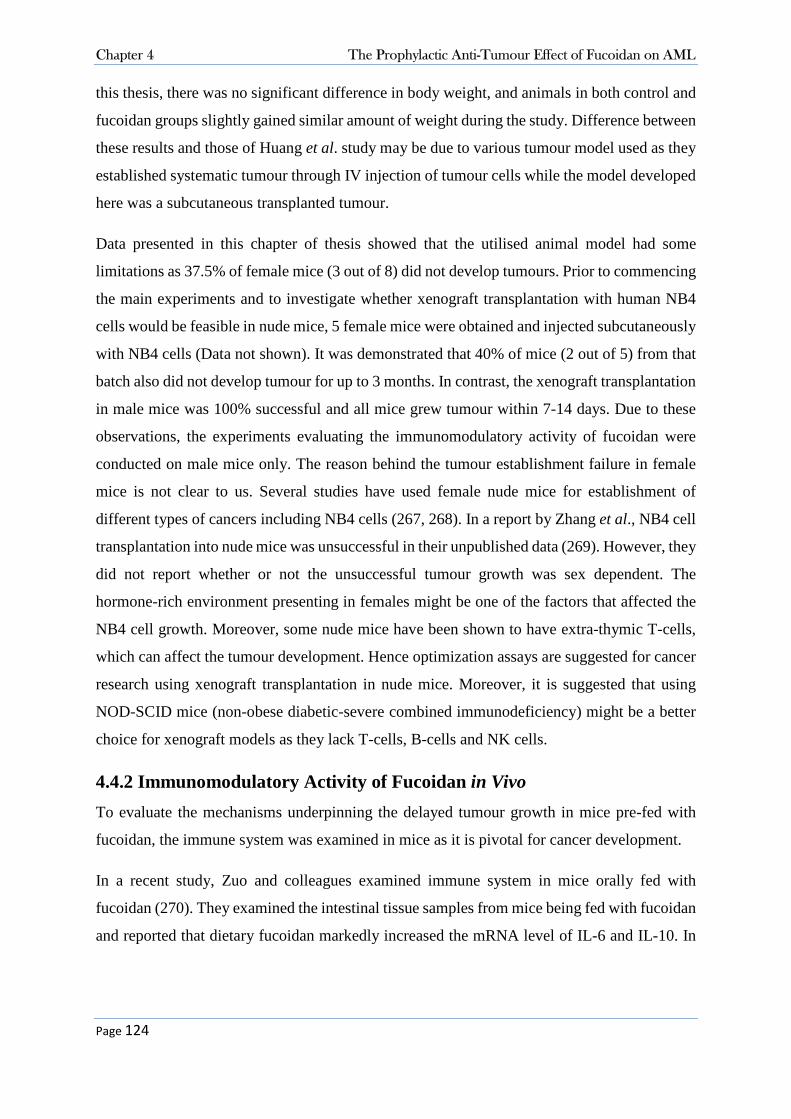
Chapter 4 The Prophylactic Anti-Tumour Effect of Fucoidan on AML
Page 124
this thesis, there was no significant difference in body weight, and animals in both control and
fucoidan groups slightly gained similar amount of weight during the study. Difference between
these results and those of Huang et al. study may be due to various tumour model used as they
established systematic tumour through IV injection of tumour cells while the model developed
here was a subcutaneous transplanted tumour.
Data presented in this chapter of thesis showed that the utilised animal model had some
limitations as 37.5% of female mice (3 out of 8) did not develop tumours. Prior to commencing
the main experiments and to investigate whether xenograft transplantation with human NB4
cells would be feasible in nude mice, 5 female mice were obtained and injected subcutaneously
with NB4 cells (Data not shown). It was demonstrated that 40% of mice (2 out of 5) from that
batch also did not develop tumour for up to 3 months. In contrast, the xenograft transplantation
in male mice was 100% successful and all mice grew tumour within 7-14 days. Due to these
observations, the experiments evaluating the immunomodulatory activity of fucoidan were
conducted on male mice only. The reason behind the tumour establishment failure in female
mice is not clear to us. Several studies have used female nude mice for establishment of
different types of cancers including NB4 cells (267, 268). In a report by Zhang et al., NB4 cell
transplantation into nude mice was unsuccessful in their unpublished data (269). However, they
did not report whether or not the unsuccessful tumour growth was sex dependent. The
hormone-rich environment presenting in females might be one of the factors that affected the
NB4 cell growth. Moreover, some nude mice have been shown to have extra-thymic T-cells,
which can affect the tumour development. Hence optimization assays are suggested for cancer
research using xenograft transplantation in nude mice. Moreover, it is suggested that using
NOD-SCID mice (non-obese diabetic-severe combined immunodeficiency) might be a better
choice for xenograft models as they lack T-cells, B-cells and NK cells.
4.4.2 Immunomodulatory Activity of Fucoidan in Vivo
To evaluate the mechanisms underpinning the delayed tumour growth in mice pre-fed with
fucoidan, the immune system was examined in mice as it is pivotal for cancer development.
In a recent study, Zuo and colleagues examined immune system in mice orally fed with
fucoidan (270). They examined the intestinal tissue samples from mice being fed with fucoidan
and reported that dietary fucoidan markedly increased the mRNA level of IL-6 and IL-10. In

Chapter 4 The Prophylactic Anti-Tumour Effect of Fucoidan on AML
Page 125
addition, a significant increase in IgA expression was observed in intestinal samples, which
probably occurred upon upregulation of the aforementioned cytokines.
Recently, Zhang et al. showed that IP injection of 50 µg/g b.w. fucoidan significantly increased
the percentage and cell number of NK cells in C57BL/6 mice (264). Here, we also investigated
the effect of fucoidan on NK cells which are the key component of body’s innate immune
system. Although, the focus of this thesis was on the effects of fucoidan on NK cell function.
Although athymic nude mice lack T-cells, they have functional NK cells. NK cells are a subset
of lymphocytes, characterised by their ability to kill tumour cells spontaneously. Data
presented showed that the cytolytic activity of NK cells in mice that were fed with fucoidan for
two weeks significantly increased compared to the control group. This was shown by the
amount of dead target cells in fucoidan group which was higher than that of the control group
in all six effector:target cells ratios with a maximum of 1.6 fold at 100:1 ratio. Maruyama et al.
have similarly reported higher NK cell activity in fucoidan-treated mice. Although, they report
2.3 fold higher than the control group which could be as a result of the different route of
administration as they injected 50 µg/g b.w. of fucoidan intraperitoneally (271).
NK cells mediate their anti-cancer function through cytokine production and also by regulating
cytokine production of other immune cells. IFNγ is a major anti-cancer cytokine produced by
immune cells such as T-cells and NK cells, and itself modulates NK cell function. A clinical
trial has shown that the amount of IFNγ producing immune cells increased to 114% in
individuals given a fucoidan mix orally for 30 days. In a recent in vitro study, fucoidan
treatment activated NK cells and stimulated the production of IFN-γ by them (264). These data
support the involvement of activated NK cells –and potentially through increased IFNγ- in
delaying the tumour growth in the in vivo experiments in this thesis.
In conclusion, it was found that consumption of fucoidan even over a very short time period
could protect the animals against APL development and growth and suggested that fucoidan
intake has a prominent effect to enhance the immune cell activity and to eliminate the tumour
cell development.

1
Page 126
Chapter Five – Synergistic Effects of Fucoidan and ATO in APL
Treatment in Vitro and in Vivo
Investigation of Possible Synergistic Effects
of Fucoidan and ATO in APL Treatment
in Vitro and in Vivo

Chapter 5 Investigation of Possible Synergistic Effects of Fucoidan and ATO in APL Treatment in Vitro and in Vivo
Page 127
5.1 Introduction
Although therapeutic strategies using ATRA plus anthracycline-based chemotherapy increases
the cure rate in majority of new cases of APL, potential short-term and long-term side effects
are reported (272). Hyper-leucocytosis and differentiation syndrome (DS) are some short-term
sequelae (273), and extra-medullary diseases at the recurrence (274), secondary cancers such
as myelodysplastic syndrome (275), and delayed cardiomyopathy (276) are examples of the
long term side effects.
Arsenic trioxide (ATO) is the most active single agent in APL treatment. Single administration
of ATO induces complete remission in approximately 85-90% of the patients (277, 278).
Currently, ATO is administrated for refractory or relapsed APL, or older patients who are
unable to tolerate anthracycline-based therapies (38). However, clinical trials are under way to
evaluate if revised strategies incorporating ATO in the treatment of newly diagnosed cases of
APL could possibly prevent the above mentioned complications caused by
ATRA+chemotherapies.
ATO acts through multiple mechanisms. It induces apoptosis, inhibits proliferation and
angiogenesis and stimulates cell differentiation (279). Interestingly, ATO has a dose-dependent
dual effect on abnormal promyelocytes; at high concentrations of 0.5-2 µM, ATO induces
apoptosis in malignant promyelocytes, while at low doses of 0.1-0.5 µM, it induces partial
differentiation (32). Apoptosis is mediated by down regulation of the anti-apoptotic molecule
Bcl-2 expression both at mRNA and protein level, disruption of mitochondrial transmembrane
potentials ( m), induction of accumulation of ROS and modulation and degradation of the
PML-RARα hybrid protein (280).
Administration of ATO has been linked with several mild to moderate haematologic and non-
haematologic side effects. ATO is reported to induce leucocytosis in about 50% of the cases
and also mild to severe hepatic toxicities in a large number of the patients (281, 282). Similar
to ATRA, its usage can cause development of the potentially fatal complication, DS,
characterised by fever, acute respiratory distress, acute renal failure and potentially death (273).
In spite of its high efficacy in induction of complete remission in a majority of the patients
(283), the 2-year disease free survival remains quite low (42%) in refractory patients (282).

Chapter 5 Investigation of Possible Synergistic Effects of Fucoidan and ATO in APL Treatment in Vitro and in Vivo
Page 128
Therefore, it is of interest to develop complementary treatment strategies which increase the
efficacy of current treatment while minimizing the toxicities.
This dissertation has outlined the potential advantages of natural products, and the growing
interest in their anti-cancer activities. Due to their multi-functional properties, natural products
are also being tested as adjuvants for use in synergy with chemotherapeutic agents.
In recent years, there is an emerging body of work investigating the combined effects of
fucoidan with standard anti-tumour agents. For example, fucoidan from Saccharina
cichorioides was reported to synergise with the anti-tumour activity of low dose resveratrol on
the invasive and highly motile HCT 116 colon cancer cell line (195). In a xenograft
transplantation study, the effect of fucoidan alone or in combination with cyclophosphamide
was examined on tumour growth. Nine days after the injection of Lewis lung carcinoma cells
into C57BL/6 mice, fucoidan from Fucus evanescens was administered to animals alone or
combined with cyclophosphamide. The fucoidan group showed marked anti-tumour (33%
tumour growth inhibition) and anti-metastatic (29% reduction of the number of metastases)
activities. Although fucoidan did not exhibit a synergistic effect with cyclophosphamide on
primary tumour growth, but significantly decreased the lung cancer cell metastasis (284).
In Chapters 3 and 4 of this thesis, fucoidan was shown to possess antiproliferative activities in
human APL cell lines both in vitro and in vivo. It is postulated that the induction of apoptosis
by ATO is via mitochondrial dysfunction and further cleavage of PARP1 which is a crucial
enzyme involved in DNA repair (285). In Chapter 3, fucoidan was shown to induce apoptosis
through a caspase-dependent mechanism and further inactivation of PARP-1 in the acute
promyelocytic leukaemia NB4 and HL60 cell lines. Both fucoidan and ATO cleave PARP-1
but through two different pathways, therefore it was hypothesised that the combination of these
two agents could synergistically enhance apoptosis in APL cells and that fucoidan may
potentiate the anti-tumour activity of the APL standard treatment ATO.

Chapter 5 Investigation of Possible Synergistic Effects of Fucoidan and ATO in APL Treatment in Vitro and in Vivo
Page 129
5.2 Experimental Design
5.2.1 The synergistic Effect of fucoidan with ATO in APL Cell Apoptosis in Vitro
The chromosomal t(15;17) translocation positive human APL cell line NB4 was treated with
low concentration of fucoidan from F. vesiculosus (10 and 20 µg/mL) alone, ATO alone (0.25,
0.5, 1 µM) or combination (see Section 2.2). After 48 hours, cell proliferation and apoptosis
were analysed using WST-8 proliferation, Annexin V/PI, DNA fragmentation and cell cycle
assays (see Sections 2.3 to 2.6).
The non-APL Kasumi-1 AML cell line was used as control and similarly treated as described
above for up to 96 hours. Cell proliferation was assessed using the colorimetric WST-8 cell
proliferation assay (see Section 2.4).
5.2.2 The Synergistic Anti-Tumour Activity of fucoidan with ATO in APL-Bearing
Mice
An optimization experiment was performed to determine the route and the dose of fucoidan
administration. A subcutaneous xenograft tumour was established in 14 female BALB/c nu/nu
athymic mice (see Section 2.9.5) and fucoidan was delivered with different doses (high and
low) and routes (IP and IV) once tumours was appeared. The best route and dose were selected
for the rest of the experiments in chapters 5 and 6 of the thesis.
To examine the anti-tumour effects of fucoidan and its synergy with ATO, 28 mice (n=7/group)
were randomly divided into four treatment groups; the control, fucoidan, ATO and
fucoidan+ATO. A subcutaneous xenograft tumour was established by injecting NB4 cells in
the right flank of mice (see Section 2.9.5). Treatment was commenced following tumour
appearance at the following doses: 100 µg/g body weight (b.w.) fucoidan, 2.5 µg/g b.w. ATO
or in combination, daily. The control group was treated with IP injection of vehicle (sterile
PBS). Mouse weight and tumour volume were measured daily. Once tumour volume reached
1000 mm3, this time point was considered as the end point and the mice were humanely
euthanised with inhalation of CO2 (see Section 2.9.7). Tumour volume doubling time was
calculated for each mouse.

Chapter 5 Investigation of Possible Synergistic Effects of Fucoidan and ATO in APL Treatment in Vitro and in Vivo
Page 130
5.3 Results
5.3.1 Fucoidan Increases the Anti-proliferative Activity of ATO in APL Cells
in Vitro.
The acute promyelocytic leukaemia NB4 cell line was treated with fucoidan plus clinical and
sub-clinical doses of ATO for 48 hours, and cell proliferation and apoptosis were evaluated
using different assays.
NB4 cell proliferation was significantly decreased when cells were co-treated with fucoidan
and ATO, compared to single treatment with either agents (Figures 5.1, 5.2). The decreased
proliferation was observed in both low (0.25, 0.5 µM) and clinical doses of ATO (1 µM).
At lowest dose of 0.25 µM ATO, combination of 10 µg/mL fucoidan with ATO resulted in
decreased cell proliferation to approximately 80%. Whereas combination of 20 µg/mL of
fucoidan with ATO reduced the cell proliferation to near 60%. According to the results
obtained, fucoidan at the concentration of 20 µg/mL was used for the rest of the apoptosis
experiments.
In the clinic, ATO is only used for treatment of acute promyelocytic leukaemia and not for
other sub-types of AML as it is not effective in treatment of other subtypes (286). To examine
whether the ATO activity observed was specific to APL cells, the non-APL t(8;21) positive
AML Kasumi-1 cell line was similarly treated with ATO plus fucoidan. Neither combined
fucoidan+ATO nor single treatment with fucoidan and ATO decreased the proliferation of
Kasumi-1 cells and the percentage of viable cells in all groups remained at >80% for up to 96
hours (Figure 5.3).
To investigate whether the reduced cell proliferation in NB4 cells was due to cell death or cell
cycle arrest, the DNA content of the NB4 cells treated with fucoidan+ATO was analysed using
flow cytometry. The amount of the sub-G0/G1 population, which represents dead cells,
significantly increased when cells were treated with fucoidan+ATO compared to ATO alone
at both therapeutic and sub-therapeutic doses (p≤0.001) (Figure 5.4). Table 5.1 displays
distribution of all cell cycle phases in NB4 cells.

Chapter 5 Investigation of Possible Synergistic Effects of Fucoidan and ATO in APL Treatment in Vitro and in Vivo
Page 131
Figure 5.1. Inhibitory effects of ATO plus 10 µg/mL fucoidan on APL cell proliferation. NB4 cells were treated with low to high doses of ATO with or without fucoidan for 48 hours and cell proliferation was evaluated using the WST-8 assay. Mean ± SEM of at least three
replicates is shown. Statistical significance was determined by two-way ANOVA, followed by Bonferroni post-test (***:p≤ 0.001, *:p≤ 0.05).

Chapter 5 Investigation of Possible Synergistic Effects of Fucoidan and ATO in APL Treatment in Vitro and in Vivo
Page 132
Figure 5.2. Inhibitory effects of ATO plus 20 µg/mL fucoidan on APL cell proliferation. NB4 cells were treated with low to high doses of ATO with or without fucoidan for 48 hours,
and cell proliferation was evaluated using the WST-8 assay. Mean ± SEM of at least three replicates is shown. Statistical significance was determined by two-way ANOVA, followed
by Bonferroni post-test (***: p ≤ 0.001).

Chapter 5 Investigation of Possible Synergistic Effects of Fucoidan and ATO in APL Treatment in Vitro and in Vivo
Page 133
Figure 5.3. Inhibitory effects of ATO combined with fucoidan on non-APL Kasumi-1 cell proliferation. Kasumi-1 cells were treated with low and high doses of ATO with or
without 20 µg/mL fucoidan, and cell proliferation was evaluated using WST-8 assay after 96 hours. Mean ± SEM of at least three replicates is shown. Statistical significance was
determined by ANOVA, followed by Tukey’s multiple comparison test.

Chapter 5 Investigation of Possible Synergistic Effects of Fucoidan and ATO in APL Treatment in Vitro and in Vivo
Page 134
Table 5.1. Cell cycle phase distribution. NB4 cells were treated with various doses of ATO with or without fucoidan (20 µg/mL), and DNA content was assessed using flow cytometry
after 48 hours. Data represents mean ± SEM of at least three replicates.
Sub G0/G1 G0/G1 S Mitosis
ATO
0.25 µM
Control 1.93 ± 0.30 42.46 ± 1.39 22.34 ± 0.06 31.67 ± 1.34
Fucoidan 18.34 ± 1.75 28.66 ± 1.42 22.38 ± 2.70 29.18 ± 3.38
ATO 2.73 ± 1.08 45.10 ± 0.54 20.22 ± 0.41 30.39 ± 0.87
Combination 20.69 ± 1.54 31.30 ± 0.09 25.8 ± 2.68 19.44 ± 2.04
ATO
0.5 µM
Control 1.93 ± 0.30 42.46 ± 1.39 22.34 ± 0.06 31.67 ± 1.34
Fucoidan 18.34 ± 1.75 28.66 ± 1.42 22.38 ± 2.70 29.18 ± 3.38
ATO 2.39 ± 1.08 46.10 ± 0.54 20.22 ± 0.41 29.39 ± 0.87
Combination 25.57 ± 0.86 38.42 ± 1.38 15.20 ± 0.34 18.14 ± 1.66
ATO
1.0 µM
Control 1.93 ± 0.30 42.46 ± 1.39 22.34 ± 0.06 31.67 ± 1.34
Fucoidan 18.34 ± 1.75 28.66 ± 1.42 22.38 ± 2.70 29.18 ± 3.38
ATO 15.13 ± 0.40 39.81 ± 3.82 16.56 ± 0.80 25.50 ± 2.11
Combination 74.51 ± 2.26 7.29 ± 1.36 9.28 ± 2.28 6.76 ± 0.70

Chapter 5 Investigation of Possible Synergistic Effects of Fucoidan and ATO in APL Treatment in Vitro and in Vivo
Page 135
Figure 5.4. Effects of ATO plus fucoidan on accumulation of sub G0/G1 dead cells. NB4 cells were treated with various doses of ATO with or without fucoidan (20 µg/mL) and cell
cycle was analysed after 48 hours. Sub G0/G1 population representing the dead cells significantly increased when fucoidan was combined with ATO at both clinical and low
doses. Mean ± SEM of at least three replicates is shown. Statistical significance was determined by two-way ANOVA, followed by Bonferroni post-test.
(***: p ≤ 0.001, *: p ≤ 0.05)

Chapter 5 Investigation of Possible Synergistic Effects of Fucoidan and ATO in APL Treatment in Vitro and in Vivo
Page 136
5.3.2 Fucoidan Synergises with ATO in ATO-Mediated Apoptosis in APL
Cells.
To determine if cell death was due to apoptosis, the annexin V/PI assay was employed. Figure
5.5 shows a representative flow cytometry result for each treatment. As shown, combination of
fucoidan with ATO significantly enhanced apoptosis in NB4 cells. At low doses of ATO, the
percentage of apoptotic cells (annexin V positive cells) increased from approximately 6% (0.25
µM ATO only) to 32% (fucoidan+0.25 µM ATO) and from 5% (0.5 µM ATO only) to 52%
(fucoidan+0.5 µM ATO) (p≤0.001). At the therapeutic dose of 1 µM ATO, the percentage of
apoptotic cells increased from approximately 18% (ATO only) to 71% (fucoidan+ATO)
(p≤0.001).
Furthermore, the TUNEL assay was employed to measure the amount of DNA fragmentation;
which is one of the main features of apoptosis. Consistent with the annexin V/PI assay data,
co-treatment of fucoidan with ATO significantly enhanced apoptosis compared to treatment
with ATO only (p≤0.001). As shown in Figure 5.6, the mean percentage of cells with
fragmented DNA increased to 42.5% (fucoidan+0.25 µM ATO), 60% (fucoidan+0.5 µM
ATO), and 79% (fucoidan+1 µM ATO) compared to 1.5%, 1% and 12%, respectively, for the
same doses of ATO alone.

Chapter 5 Investigation of Possible Synergistic Effects of Fucoidan and ATO in APL Treatment in Vitro and in Vivo
Page 137
Figure 5.5. Representative annexin V/PI apoptosis assay. NB4 cells were treated with increasing doses of ATO with or without fucoidan (20 µg/mL) and apoptosis was measured using annexin V/PI apoptosis assay. Results represent flow cytometry histograms of one of
three replicates.

Chapter 5 Investigation of Possible Synergistic Effects of Fucoidan and ATO in APL Treatment in Vitro and in Vivo
Page 138
Figure 5.6. DNA fragmentation. The percentage of apoptotic cells with fragmented DNA significantly increased when fucoidan (20 µg/mL) was combined with ATO at both low and
high doses. Mean ± SEM of at least three replicates is shown. Statistical significance was determined by two-way ANOVA, followed by Bonferroni post-test (***: p ≤ 0.001).

Chapter 5 Investigation of Possible Synergistic Effects of Fucoidan and ATO in APL Treatment in Vitro and in Vivo
Page 139
5.3.3 High Dose Fucoidan Delayed Tumour Growth
To optimise the route and the dose of fucoidan administration, 14 female mice were divided
into three groups according to the dose (low or high) and the route (IP or IV) of fucoidan
administration as follow:
1. IP low dose (30 µg/g b.w.)
2. IP high dose (100 µg/g b.w.)
3. IV (6 µg/g b.w.)
A subcutaneous xenograft tumour was established in mice and treatments were applied daily
at the mentioned conditions. Out of 14 mice, 5 mice (2 in each IP group and 1 in IV group) did
not develop tumours for up to 50 days. These mice were excluded from the experiments and
data analysis. The number of mice in different groups was therefore restricted to 9 animals as
shown in Figure 5.7.
In the 9 remaining mice, a visible tumour mass (4~10 mm3) appeared in 8 mice after 8-14 days.
The tumour appeared in the last mouse at day 20.
Despite using different techniques, attempts to administer fucoidan through IV injection failed.
Due to the small size of nude mice and thin tail blood vessels, fucoidan could not be injected
IV for more than 2 or 3 days. As a result, the IV injection was excluded from the experiments
and the three mice in IV group were transferred to the IP groups (Figure 5.7).
Figure 5.8 displays the tumour appearance and growth for the optimization assay. The tumour
size in all mice in IP-low dose group reached the end point (1000 mm3) in less than 12 days
after the treatment commenced. In the IP-high dose group, the tumour size reached the end
point between days 13 to 26. The high dose treatment did not induce any side effects (such as
weight loss and/or behavioural changes) in the mice. As a result, the dose of 100 µg/g b.w. and
IP injection route were selected for the main experiments in this Chapter and Chapter 6.

Chapter 5 Investigation of Possible Synergistic Effects of Fucoidan and ATO in APL Treatment in Vitro and in Vivo
Page 140
Figure 5.7. Total animal number used in optimization assay. The number of animals decreased due to tumour establishment and IV injection failure.
Final animal number due to IV injection failure
IP low dose (n=5) IP high dose (n=4)
Reduced animal number due to tumour establishment failure
IP low dose (n=3) IP high dose (n=3) IV (n=3)
Initial experimental animal number
IP low dose (n=5) IP high dose (n=5) IV (n=4)

Chapter 5 Investigation of Possible Synergistic Effects of Fucoidan and ATO in APL Treatment in Vitro and in Vivo
Page 141
Figure 5.8. Tumour mass growth in mice treated with different doses of fucoidan. Xenograft tumour was established in mice with injection of NB4 cells and treatment with low and high doses of fucoidan (IP) was commenced after tumour appearance. Tumour volume was measured daily. Each graph represents the daily tumour volume of one mouse in high-
dose (green) and low dose (red) groups (n=4 in low dose/n=5 in high dose groups).
* Due to tumour rupture, one mouse in the IP-low dose group was sacrificed at day 6 of treatment.

Chapter 5 Investigation of Possible Synergistic Effects of Fucoidan and ATO in APL Treatment in Vitro and in Vivo
Page 142
5.3.4. Co-treatment of Fucoidan with ATO Significantly Delayed the Growth
of APL in Mice.
To evaluate the possible synergy of ATO and fucoidan in vivo, a subcutaneous xenograft APL
mass was established in 28 male nude mice (n=7/group) and single or combined treatments of
fucoidan and ATO were commenced following tumour appearance. Tumour mass volume was
monitored and median survival was identified using the Kaplan-Meier survival analysis.
A visible tumour mass (4~10 mm3) appeared after 8-14 days in all 28 mice. During the
treatment, none of the mice showed any side effects (e.g. weight loss or behavioural changes)
to the administered doses. Of the 7 mice treated with fucoidan+ATO, only 2 mice completed
the full 28-days treatment. All remaining mice were sacrificed as per animal ethics guidelines
prior to 28-days treatment as tumour volume reached 1000 mm3.
Treatment with “fucoidan only” and “fucoidan+ATO” significantly slowed the increase in
tumour mass with the tumours in these animals reaching the maximal end point much later than
the control group (p≤0.05). The median survival of the mice was 14.5, 18.5, 16.5 and 20 days
in control, fucoidan alone, ATO alone and combination groups, respectively (Figure 5.9).
Although a higher median survival in combination group was observed, the difference between
treated groups was not statistically significant.
Tumour aggressiveness was evaluated by tumour volume doubling time which increased in
treated groups compared to the control group. The mean tumour volume doubling time was
2.72, 3.70, 3.42 and 3.86 days in control, fucoidan, ATO and combination groups, respectively
(Figure 5.10).

Chapter 5 Investigation of Possible Synergistic Effects of Fucoidan and ATO in APL Treatment in Vitro and in Vivo
Page 143
Figure 5.9. The Kaplan-Meier survival analysis over 28 days of treatment. Mice with APL were treated with vehicle (red), fucoidan (green), ATO (blue) and their combination (purple) and their life span was analysed over 28 days of treatment (n=7/ group). p values
refer to comparison between each treatment group with the control group.
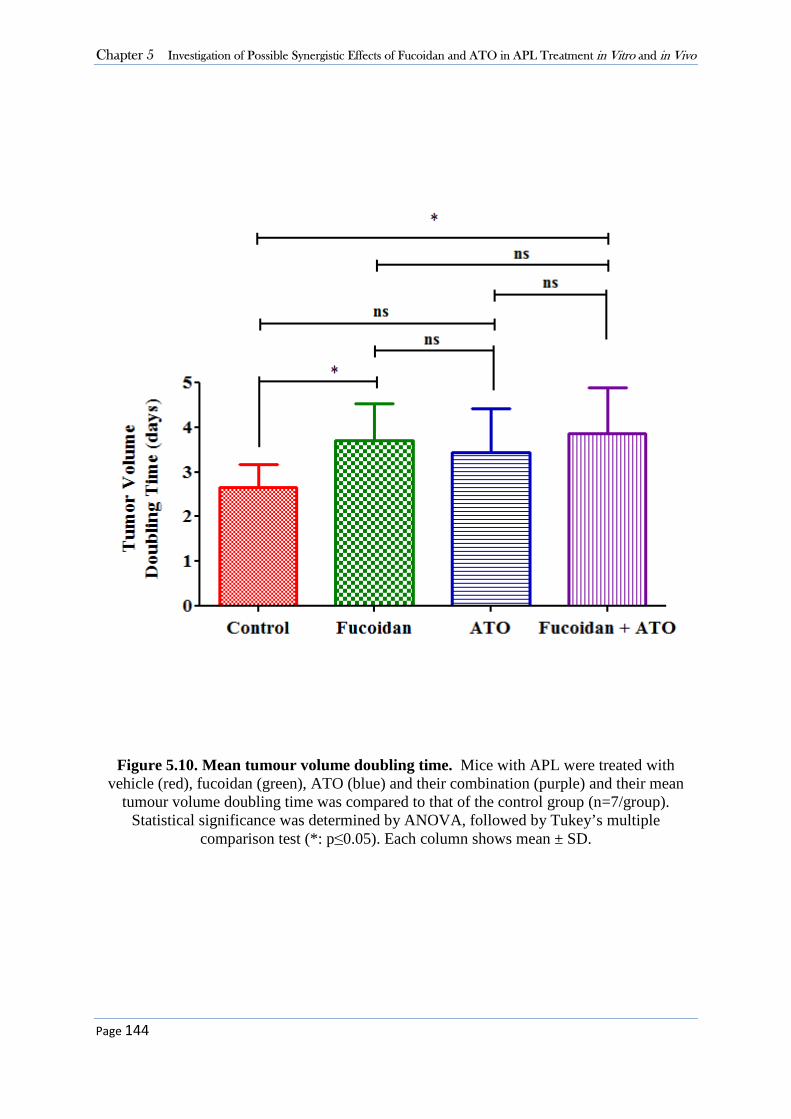
Chapter 5 Investigation of Possible Synergistic Effects of Fucoidan and ATO in APL Treatment in Vitro and in Vivo
Page 144
Figure 5.10. Mean tumour volume doubling time. Mice with APL were treated with vehicle (red), fucoidan (green), ATO (blue) and their combination (purple) and their mean
tumour volume doubling time was compared to that of the control group (n=7/group). Statistical significance was determined by ANOVA, followed by Tukey’s multiple
comparison test (*: p≤0.05). Each column shows mean ± SD.

Chapter 5 Investigation of Possible Synergistic Effects of Fucoidan and ATO in APL Treatment in Vitro and in Vivo
Page 145
5.4 Discussion
Herein, the synergistic effects of fucoidan with ATO in ATO-induced apoptosis was examined
in vitro and in vivo. Evidence provided here supports the hypothesis that combining fucoidan
with ATO enhanced apoptosis at both clinically-used and low doses of ATO, in vitro. In
addition, enhanced survival and delayed tumour growth were observed in APL-bearing mice
when treated with combined fucoidan and ATO. This is the first study to examine the potential
therapeutic activity of fucoidan in leukaemia in vivo.
5.4.1 Synergistic Effect of Fucoidan with ATO in Vitro
In the last decade, combined treatment of natural components with chemotherapeutic agents
has gained considerable attention. The potential synergistic activities of these agents could be
exploited to reduce the toxicity of chemotherapy by achieving the same (or even higher)
efficacy at lower doses. ATO was first used for APL treatment in the early 1990s and improved
the complete remission rate in APL patients (280). Further studies and clinical trials showed
that it induced a sustained molecular remission when it was used alone in relapsed patients (37,
38). However, the currently used clinical doses of ATO has been accompanied with
morbidities.
Few studies have examined the combinatory activity of natural derived compounds with ATO
in treatment of APL. Lu et al. reported that combination of a crude methanolic extract
of Mucuna macrocarpa with ATO suppressed proliferation of APL cell line HL60 and
increased apoptosis through accumulation ROS (287). Fan et al. also showed that addition of
resveratrol, a stilbene enriched in red wine, to ATO significantly enhanced the anti-cancer
effect of ATO in APL cell line NB4 (288). In a recent investigation, the synergistic activity of
Icarrin, a natural flavonoid derived from several plants, with ATO was evaluated in NB4 cell
apoptosis (289). The combination of these extracts resulted in continuous accumulation of ROS
and excessive cellular oxidative stress.
As mentioned before, the clinical doses of 1 µM of ATO can cause side effects in patients. The
aforementioned studies have used high doses of ATO; from 2 to 12 µM, which are considerably
higher than clinical doses. Here, it was postulated that lower concentrations of ATO could
attenuate its undesirable side effects. Therefore APL cells were co-treated with lower doses of
Chapter 5 Investigation of Possible Synergistic Effects of Fucoidan and ATO in APL Treatment in Vitro and in Vivo
Page 146
ATO and compared the outcomes with therapeutic doses. Addition of fucoidan to ATO
significantly increased the efficacy of ATO in induction of apoptosis in NB4 cells both at low
and clinical doses of ATO.
It should be noted that due to the cytotoxic effect of fucoidan in NB4 cells, ultra-low
concentrations of fucoidan were used in this chapter than previously used in Chapter 3 (10-20
µg/mL vs 50-100 µg/mL). The lower doses of fucoidan allowed us to identify the effect of
fucoidan on ATO-induced apoptosis, and yet even the combination of this low concentration
of fucoidan with ATO decreased cell proliferation to less than 20% compared to around 80%
in ATO-alone treated cells.
It is well known that ATO induces apoptosis at higher doses whereas it induces myeloid
differentiation at lower doses. Here, as expected, high dose of ATO (1 µM) increased the sub-
G0/G1 dead cell population in the cell cycle assay. Consistent with the literature, lower doses
of ATO (0.25 and 0.5 1 µM) did not induce apoptosis in APL cells and did not increase the sub
G0/G1 dead cell population. However, they induced G0/G1 arrest with 42% cells in control
compared to near 46% in ATO-treated cells. The slight G0/G1 arrest within 48 hours could be
associated with initiation of differentiation in APL cells in response to low dose ATO. This
effect will be discussed in detail in Chapter 6.
AKT, a serine/threonine kinase, is a key molecule in PI3K/AKT signaling pathway which
inhibits apoptosis and is reported to be frequently upregulated in various tumours (290). The
results of Chapter 3 of this thesis together with other studies have shown that fucoidan down-
regulates the activity of AKT (163, 180). Further, there are several reports that show that ATO
triggers apoptosis via inhibition of AKT (291, 292). Evidence indicates that fucoidan and ATO
trigger the same pathway and therefore it could be postulated that double inhibition of AKT
may explain the observed synergistic activity.
Evidence shows that apoptosis mediated by ATO is caspase independent (293, 294). It induces
apoptosis through down-regulation of anti-apoptotic molecule Bcl-2 expression, induction of
accumulation of reactive oxygen species (ROS) and disruption of mitochondrial
transmembrane potentials ( m), eventually resulting in increased cleavage of PARP-1 and
subsequent cell death. PARP-1 is a nuclear enzyme which modifies various nuclear proteins
involved in different cellular processes. PARP-1 has a key role in DNA repair and cell recovery

Chapter 5 Investigation of Possible Synergistic Effects of Fucoidan and ATO in APL Treatment in Vitro and in Vivo
Page 147
from DNA damage through maintenance of genomic integrity and its inactivation is highly
associated with apoptosis (295). Cleavage of PARP-1 is one of the main mechanisms triggered
by a wide range of anti-cancer agents. Similar to ATO, in Chapter 3 it was shown that fucoidan
significantly increased the cleavage of PARP-1, however through a caspase dependent process.
Thereby, although fucoidan and ATO recruits different pathways, both agents eventually
induce cleavage of PARP-1 (285). This may explain the severe induced DNA fragmentation
when ATO was combined with fucoidan (80%) compared to when it was used alone (about
15%).
5.4.2 Therapeutic Potential of Fucoidan in APL-Bearing Mice
Next, the therapeutic effects of fucoidan on APL-bearing mice was examined and its synergy
with current APL therapies was evaluated in vivo.
In previous in vivo studies examining the therapeutic effect of fucoidan, the range of utilised
doses mostly resides between 5 to 500 µg/g b.w. To select the more effective dose, Lee and
colleagues treated mice with a range of 0, 10, 50, 100, 200 and 400 µg/g b.w. fucoidan 24 hrs
and 1 hr before irradiating the mice. The mice injected with 100 µg/g b.w. fucoidan showed
the best survival rate at 30 days post-irradiation (296). Here, mice were treated with 30 µg/g
b.w. and 100 µg/g b.w. and it was found that the mice treated with high doses of fucoidan had
delayed tumour growth compared to the low-dose treated group, suggesting the therapeutic
potential of fucoidan in treatment of mice bearing APL.
Similar to Chapter 4 (see Sections 4.3.1 and 4.4), the utilised mouse model had some limitations
and female mice were less susceptible to developing tumours. Thereby, subsequent
experiments were conducted on male mice.
5.4.3 Synergistic Effect of Fucoidan with ATO in Vivo
Despite many in vitro studies investigating the synergistic activity of fucoidan with anti-cancer
drugs, in vivo studies have been limited. Alekseyenko et al. reported that in C57Bl/6 mice
fucoidan significantly potentiated the anti-metastatic, but not anti-tumour activity of the
chemotherapeutic agent cyclophosphamide (284). In a clinical trial, fucoidan similarly did not

Chapter 5 Investigation of Possible Synergistic Effects of Fucoidan and ATO in APL Treatment in Vitro and in Vivo
Page 148
affect the efficacy of standard chemotherapeutic agents in patients with colorectal cancer, but
reduced the toxicities of chemotherapy (193). The previous reported experiments in this
Chapter and Chapter 4 provided evidence that fucoidan was effective in delaying tumour
growth in vivo. These data led to examining the combinatory therapeutic effects of fucoidan
with low doses of ATO in APL-bearing mice.
Unlike other AML subtypes, early death is the primary cause of treatment failure in patients
with APL, mainly due to the toxicity of therapeutic agents themselves (297). This toxicity has
been reported in in vivo studies as well. In an in vivo study, Jing and colleagues treated APL-
bearing mice with 8 µg/g b.w. of ATO and reported toxicity with weight loss and early-
treatment associated deaths in mice (40). Lallemand-Breitenbach et al. also reported that 10
µg/g b.w. of ATO was toxic and caused many early deaths due to hepatic toxicity and
widespread pulmonary edema (41). Hence, they used a reduced dose of 5 µg/g b.w. ATO in
mice bearing APL. In this thesis, with the assumption that the lower concentrations could
attenuate the side effects of these drugs, the dose was reduced even further (2.5 µg/g b.w. ATO)
and no toxicity was observed when it was used alone or in combination with fucoidan.
Treatment with fucoidan plus low dose ATO increased the tumour volume doubling time
compared to the control (p=0.0175) and ATO alone (p=0.56) groups. The survival rate in the
combination group was the highest between all treated groups, although it was only significant
compared to the control group but not the single fucoidan and single ATO treated groups.
ATO alone did not have a significant impact on mouse survival and the tumour doubling time
compared to the control group. The utilised low dose may explain the non-significant anti-
tumour effects of ATO alone in these investigations. More importantly, in contrast with studies
by Jin et al and Lallemand-Breitenbach et al., no toxicity was observed when this low dose of
ATO was used alone or in combination with fucoidan. Even though very low doses were used,
the efficacy of combined treatment was still higher than that of standard APL treatment alone.
In conclusion, the data presented in this chapter suggest that the usage of fucoidan as a
supplementary agent to the APL standard treatment ATO may represent a promising new
strategy for management of APL.

Page 149
Chapter Six – Synergistic Effects of Fucoidan with ATRA in APL
Treatment in Vitro and in Vivo
Investigation of Possible Synergistic Effects of
Fucoidan and ATRA in APL Treatment in
Vitro and in Vivo

Chapter 6 Investigation of Possible Synergistic Effects of Fucoidan and ATRA in APL Treatment in Vitro and in Vivo
Page 150
6.1 Introduction
The PML/RARα gene product of the chromosomal t(15;17) translocation blocks the differentiation
of malignant promyelocytes in APL (22). In the late 1970s, the hypothesis of inducing
differentiation rather than apoptosis in tumour cells was proposed and drugs with differentiation-
inducing property were developed (26). ATRA was the first successful differentiation-based therapy
used in patients with APL. However it could only induce transient remission (298). Further pre-
clinical studies showed a dramatic synergy between ATRA and arsenic trioxide in inducing
differentiation and clearing the APL cells in animal models (41). Today, ATO+ATRA is a standard
therapeutic strategy which provides an effective differentiation-based therapy, potentially avoiding
use of anthracycline-based chemotherapy.
Retinoic acid receptor alpha (RARα) is a ligand-dependent transcription factor that regulates the
expression of a number of genes involved in cell differentiation and proliferation. In normal
promyelocytes, RARα binds to the promoter region of target genes and recruits various molecules
such as nuclear co-repressor proteins (N-coR). These molecules form complexes with histone
deacetylase enzymes (HDACs), leading to transcriptional repression and differentiation block (28).
ATRA is a retinoid derivative which is present physiologically in human plasma. At normal
physiological concentrations (10-9 to 10-8 M), conformational changes occurs in the RARα, leading
to dissociation of the co-repressors/HDAC complex and re-expression of differentiation-related
proteins (Figure 6.1A). In malignant promyelocytes the fusion protein PML-RARα is attached to
the gene promoters and at physiological concentrations, ATRA cannot dissociate the co-
repressors/HDAC complex, causing the persistence of transcriptional repression and differentiation
arrest (28, 283) (Figure 6.1B). At higher pharmacological doses of ATRA, within range of 10-7 to
10-6 M, the co-receptor proteins are removed, relieving transcriptional repression complexes leading
to terminal differentiation of abnormal promyelocytes (Figure 6.1C). This is known as the
“reactivation” model. The terminally differentiated mature cells arising from neoplastic clones
eventually undergo apoptosis (299).
An additional model for the ATRA-mediated differentiation has been proposed. ATRA has been
shown to induce the catabolism of the PML-RARα fusion protein through binding to and targeting
the RARα moiety for ubiquitin/proteasome pathway. The degradation of the fusion protein can thus
promote differentiation in abnormal promyelocytes (300). This is known as the “de-repression”
model. Figure 6.2 represents the two proposed models.

Chapter 6 Investigation of Possible Synergistic Effects of Fucoidan and ATRA in APL Treatment in Vitro and in Vivo
Page 151
Figure 6.1. Proposed mechanisms of actions of ATRA on nuclear co-repressor complex and PML-RAR α fusion protein in APL. In the absence of ATRA, RARα associate with the co-
repressor/HDAC complex, which induces reorganization of chromatin structure into a repressed state that is inaccessible to basal transcription factors. A) In the normal promyelocyte,
physiological doses of ATRA binds to RARα, dissociate the co-repressor complex and causes association of a co-activator such as SRC-1 (301) allowing the access of transcription factors and transcription activation. B) In APL, physiological doses of ATRA is not sufficient to dissociate
PML-RARα fusion protein from the co-repressor complex. C) In APL, pharmacological doses of ATRA are required to dissociate the PML-RARα from co-repressor complex and activate
transcription and differentiation (Modified image from (302)).

Chapter 6 Investigation of Possible Synergistic Effects of Fucoidan and ATRA in APL Treatment in Vitro and in Vivo
Page 152
Figure 6.2. Reactivation and de-repression models for the role of ATRA and ATO in induction of differentiation in APL cells. Two current models of ATRA action on
differentiation through gene transcription re-activation (top) and action of ATRA and ATO on degradation of PML-RAR or de-repression (bottom) ((Modified image from (298)).
Chapter 6 Investigation of Possible Synergistic Effects of Fucoidan and ATRA in APL Treatment in Vitro and in Vivo
Page 153
As discussed in Chapter 5, ATO induces both partial differentiation and apoptosis in leukaemic
promyelocytes. Similar to ATRA, ATO induces the degradation of the PML-RARα fusion protein,
but through targeting the PML moiety (303). Promyelocytic leukaemia (PML) protein is a tumour
suppressor protein involved in the regulation of apoptosis, and therefore its degradation upon ATO
exposure induces apoptosis in malignant promyelocytes. In terms of the ATO-mediated partial
differentiation, it does not change the nuclear receptor signalling and therefore the transcription
“reactivation” model cannot account for its action. As mentioned above, ATO degrades PML-RAR
fusion protein. Thus, it has been proposed that ATO induces differentiation through abrogation of
PML/RARα-mediated gene repression (the “de-repression” model) (304) (Figure 6.2).
It is notable that the advantage of ATRA plus ATO therapy is reduced toxicity compared to standard
ATRA plus anthracycline-based chemotherapy. However, despite the enormous improvement in
APL treatment, the use of ATRA plus ATO is not free of side effects. Several clinical trials have
reported that the prolonged administration of high doses of ATRA results in resistance (32).
Moreover, this combination can cause differentiation syndrome; a potentially fatal complication
which occurs in approximately 25% of APL patients (281). It has also been reported that the
efficiency of myeloid cell differentiation could be diminished due to down-regulation of RARα in
the duration of the treatment (305). Therefore, it is of interest to develop complementary treatment
strategies which increase the sensitivity of myeloid cells to the action of ATRA+ATO therapy. New
adjuvants permitting lower doses of ATRA and ATO to be used could also reduce the toxicity of
current treatment regimens in some patients.
As discussed in the previous chapters, fucoidan induces strong anti-tumour activities in various
tumour cells and has been shown to be non-toxic when consumed. In recent years, some studies
have investigated the synergistic effects of fucoidan with standard anti-cancer agents. Lv et al.
showed that fucoidan reduced the migration and invasion of multiple myeloma (MM) cells treated
with the chemotherapy drug cytarabine (194). Dietary fucoidan synergistically reduced cell growth
in the OE33 cell line when it was combined with lapatinib, a targeted therapy that acts as a tyrosine
kinase inhibitor in advanced HER2-positive breast cancer cells (197). In Chapter 5 of this thesis,
the study of combined effects of fucoidan and the APL standard treatment ATO showed that
fucoidan synergistically increased apoptosis induced by ATO in APL cells in vitro.

Chapter 6 Investigation of Possible Synergistic Effects of Fucoidan and ATRA in APL Treatment in Vitro and in Vivo
Page 154
Here, it is hypothesised that fucoidan synergistically enhances the effects of current APL therapeutic
regimens, ATRA and ATO, in APL cell differentiation. It has been well documented that exposure
of APL cells to ATRA at a concentration of 1 µM results in 95% of cells differentiating
accompanied by loss of their capacity to proliferate (306). ATO however induces APL cell partial
differentiation at lower doses of 0.1 to 0.5 µM. Since the clinical doses of 1 µM of ATRA and ATO
can cause side effects in patients, it is hypothesised that the reduced concentrations could reduce
the side effects of these drugs. Therefore, the synergistic effects of fucoidan with ATRA+ATO were
investigated in APL cell myeloid differentiation at sub-pharmacological doses in vitro and in vivo.

Chapter 6 Investigation of Possible Synergistic Effects of Fucoidan and ATRA in APL Treatment in Vitro and in Vivo
Page 155
6.2 Experimental Design
6.2.1 The Synergistic Effect of Fucoidan with Low Doses of ATRA+ATO in APL
Cell Differentiation in vitro
The chromosomal t(15;17) translocation positive human APL cell line NB4 was treated with ultra-
low dose (5 µg/mL) of fucoidan from F. vesiculosus alone, 0.5 µM ATRA alone, 0.5 µM ATO
alone or in combinations for 120 hours (see Section 2.2). Monitoring of NB4 cell differentiation
was performed by quantitation of the cell surface myeloid differentiation marker CD11b and cell
cycle assay by flow cytometry (see Section 2.3).
6.2.2 The synergistic Anti-Tumour Activity of fucoidan with ATRA in APL-
Bearing Mice
To examine the anti-tumour activity of fucoidan and its synergy with ATRA, 32 mice (n=8/group)
were randomly divided into four treatment groups; the control, fucoidan, ATRA and
fucoidan+ATRA. A subcutaneous xenograft tumour was established by injecting NB4 cells in the
right flank of mice (see Section 2.9.5). Treatment was commenced by IP injection following tumour
appearance at the following doses: 100 µg/g b.w. fucoidan (daily), 1.5 µg/g b.w. ATRA (three
times a week) or in combination. The control group was treated with sterile vehicle (see Section
2.9.4). Mouse weight and tumour volume were measured daily. Once tumour volume reached 1000
mm3, this time point was considered as the end point and the mice were humanely euthanised with
inhalation of CO2 (see Section 2.9.7). Tumour volume doubling time was calculated for each mouse.
At the end point, tumour mass was removed and tumour cell differentiation was analysed by CD11b
expression.

Chapter 6 Investigation of Possible Synergistic Effects of Fucoidan and ATRA in APL Treatment in Vitro and in Vivo
Page 156
6.3 Results
6.3.1 Fucoidan Enhances ATRA-Induced Differentiation in APL Cells.
Increasing surface expression of CD11b is a marker of myeloid cells undergoing differentiation
(307). To identify the expression level of CD11b, cells were incubated with anti-CD11b antibody
and isotype-matched negative control and analysed by flow cytometry. The intensity of CD11b
expression was determined using mean fluorescent intensity (MFI). This was first optimised using
untreated NB4 cells (Figure 6.3). As shown in Figure 6.3, the signals lower than 101 contributed to
“neg/low” CD11b expression (non-differentiated cells) and signals higher than 101 contributed to
“high” CD11b expression (differentiated cells).
Myeloid differentiation was assessed by quantitating CD11b expression following treatment with
low doses of ATRA and ATO for 48, 72, 96 and 120 hours. The non-differentiated or low-
differentiated CD11bneg/low cells were excluded from the analysis. The percentage of CD11bhigh cells
was quantified as differentiated cells. As shown in Figure 6.4 and 6.5, the CD11b expression
increased in ATRA-treated cells from 48 hours and reached a maximum of 83.5% after 120 hours.
In contrast, the differentiation induced by ATO was delayed; with increases after 96 hours and
reached 20% after 120 hours compared to 2.66% at time zero. For the rest of the experiments, 120
hours was selected for incubation time for the differentiation assay.
To determine the effect of combining fucoidan with ATRA and ATO on APL cell differentiation,
NB4 cells were treated with fucoidan, sub-clinical doses of ATRA and ATO, or in combination for
120 hours and differentiation was measured by expression of CD11b as described above. Figure 6.6
demonstrates representative flow cytometry histograms in cells treated with single or combination
of different compounds as indicated. As shown, 0.5 µM ATRA increased the differentiated cells
from approximately 6% to 83%, while addition of fucoidan to ATRA increased the differentiated
cells to 94%. Low-dose ATO similarly increased the differentiated cells from 6% to 14% while
ATO+fucoidan enhanced the percentage of differentiated cells to 20.2%. Finally, APL cells treated
with all three reagents in combination resulted in a 99% CD11bhigh cells after the 5-day incubation
period, compared to 87% when cells were co-treated with ATRA+ATO.
Taken together, combined treatment of fucoidan with ATRA and ATO significantly increased
myeloid differentiation in APL cells after 120 hours (Figure 6.7). Fucoidan alone did not affect
myeloid differentiation in APL cells in vitro compared to untreated control (Figure 6.7).

Chapter 6 Investigation of Possible Synergistic Effects of Fucoidan and ATRA in APL Treatment in Vitro and in Vivo
Page 157
Figure 6.3. Cell differentiation assay. NB4 cells were labelled with isotype negative control (left) and CD11b (right) antibody. The non-specific antibody binding was excluded using the
isotype negative antibody (left histogram-D-). According to the level of CD11b expression in the right histogram, the fluorescent intensity of 101 was determined as the cut off for differentiation. To quantify the cell differentiation, the percentage of CD11bhigh cells (signals higher than 101)
was analysed.

Chapter 6 Investigation of Possible Synergistic Effects of Fucoidan and ATRA in APL Treatment in Vitro and in Vivo
Page 158
Figure 6.4. Cell differentiation assay. NB4 cells were treated with ATRA (0.5 µM) or ATO (0.5 µM), and CD11b expression was analysed by flow cytometry at various time points for up to 120 hours. Each peak with different colour represents the expression of CD11b at different time
points compared to the control (red peak). The table below demonstrates the percentage of differentiated NB4 cells (CD11bhigh) induced by ATRA and ATO.

Chapter 6 Investigation of Possible Synergistic Effects of Fucoidan and ATRA in APL Treatment in Vitro and in Vivo
Page 159
Figure 6.5. Representative cell differentiation assay at various time points. NB4 cells were treated with ATRA (0.5 µM) or ATO (0.5 µM), and CD11b expression was analysed by flow cytometry at various time points for up to 120 hours. Low and high CD11b expressing cells were determined using fluorescence intensity (Above demonstrative histogram). Changes in CD11b expression in different treatment conditions are
demonstrated in below dot plots with different colours. Green population indicates non/low differentiated population (CD11bneg/low), and Blue population indicates differentiated cells (CD11bhigh).

Chapter 6 Investigation of Possible Synergistic Effects of Fucoidan and ATRA in APL Treatment in Vitro and in Vivo
Page 160
Figure 6.6. Representative cell differentiation analysis. NB4 cells were treated with ATRA alone (0.5 µM), ATO alone (0.5 µM), fucoidan alone (5 µg/mL) or in combination. CD11b
expression was analysed by flow cytometry after 120 hours. CD11bneg/low cells were excluded, and the CD11bhigh population was calculated. In dot plot histograms, green population indicates
differentiated population while red population represents non-differentiated cells.
Dot plot (left) histogram: Red population: non/low differentiated CD11bneg/low population, Green population: CD11bhight differentiated cells.

Chapter 6 Investigation of Possible Synergistic Effects of Fucoidan and ATRA in APL Treatment in Vitro and in Vivo
Page 161
Figure 6.7. Effects of combination of fucoidan with ATRA and ATO on cell differentiation. NB4 cells were treated with ATRA alone (0.5 µM), ATO alone (0.5 µM), fucoidan alone (5
µg/mL) or in combination, and CD11b expression was analysed after 120 hours. Mean ± SEM of at least three replicates is shown. Statistical significance was determined by ANOVA, followed by
Tukey’s multiple comparison test (***: p≤0.001, **: p≤ 0.01).

Chapter 6 Investigation of Possible Synergistic Effects of Fucoidan and ATRA in APL Treatment in Vitro and in Vivo
Page 162
6.3.2 Fucoidan Combined with ATRA and ATO Enhances G0/G1 arrest in APL
Cells.
Cells undergoing differentiation normally stop dividing and exit the cell cycle dividing phases.
Hence, the DNA content was assessed and the percentage of the non-dividing G0/G1 population,
indicative of differentiation, was analysed in APL cells treated with single or combination of
fucoidan, ATRA and ATO (Figure 6.8). Consistent with the observed changes in CD11b expression,
a significant increase in the non-dividing G0/G1 population was observed in cells co-treated with
ATRA+fucoidan compared to ATRA alone, and in cells co-treated with ATRA+ATO+fucoidan
compared to ATRA+ATO (Table 6.1). Figure 6.9 compares the G0/G1 arrest in NB4 cells treated
with different agents.
It should be noted that at the very low doses of fucoidan used, the amount of the sub G0/G1 dead
cell population did not change in treated cells compared to the untreated cells (Table 6.1).
Table 6.1. Cell cycle phase distribution. NB4 cells were treated with ATRA (0.5 µM) and ATO (0.5 µM) with or without fucoidan (5 µg/mL), and DNA content was assessed using flow
cytometry after 120 hours. Data represents mean ± SEM of at least three replicates.
G0/G1 S Mitosis
Agents alone
Control 60.64 ± 0.41 20.65 ± 1.1 18.07 ± 0.89
Fucoidan 65.10 ± 1.54 20.77 ± 1.44 13.3 ± 0.10
ATRA 76.01 ± 1.05 8.53 ± 1.00 15.12 ± 0.08
ATO 64.40 ± 0.95 18.29 ± 1.29 16.64 ± 0.31
Combination
ATRA+fucoidan 84.28 ± 1.81 5.24 ± 0.21 10.24 ± 1.61
ATO+fucoidan 66.01 ± 2.95 21.94 ± 1.77 11.38 ± 1.02
ATRA + ATO 82.44 ± 0.53 6.78 ± 0.06 10.58 ± 0.65
ATRA+ATO+fucoidan 89.86 ± 1.11 4.42 ± 0.94 5.41 ± 0.16

Chapter 6 Investigation of Possible Synergistic Effects of Fucoidan and ATRA in APL Treatment in Vitro and in Vivo
Page 163
Figure 6.8. Representative cell cycle analysis. NB4 cells were treated with fucoidan alone (5 µg/mL), ATRA alone (0.5 µM), ATO alone (0.5
µM), or combinations of these agents. Cell cycle was assessed using flow cytometry. Results represent one of the three replicates. Dot plot (left) histogram: Green population: G0/G1 phase. Blue population: S phase. Yellow population: G2/M phase

Chapter 6 Investigation of Possible Synergistic Effects of Fucoidan and ATRA in APL Treatment in Vitro and in Vivo
Page 164
Figure 6.9. Effects of combination of fucoidan with ATRA and ATO on accumulation of the non-dividing G0/G1 cells. NB4 cells were treated with ATRA alone (0.5 µM), ATO
alone (0.5 µM), fucoidan alone (5 µg/mL) or combinations of these agents, and DNA content was analysed after 120 hours. Mean ± SEM of at least three replicates is shown. Statistical significance was determined by ANOVA, followed by Tukey’s multiple comparison test.
(**: p≤0.01, *: p≤0.05)

Chapter 6 Investigation of Possible Synergistic Effects of Fucoidan and ATRA in APL Treatment in Vitro and in Vivo
Page 165
6.3.3 Co-treatment of Fucoidan with ATRA Significantly Delayed the
Growth of APL in Mice.
To evaluate the possible synergy of fucoidan and ATRA in vivo, a subcutaneous xenograft APL
mass was established in 32 nude mice (n=8/group), and single or combined treatments of
fucoidan and ATRA were commenced following tumour appearance. Tumour mass volume
was monitored and median survival was identified using the Kaplan-Meier survival analysis.
A visible tumour mass (4~10 mm3) appeared after 8-14 days in all 32 mice. During the
treatment, none of the mice showed any side effects (e.g. weight loss or behavioural changes)
to the administered doses. One animal in the fucoidan alone group and one animal in the ATRA
alone group completed the full 28-days treatment. All remaining mice were sacrificed as per
animal ethics guidelines prior to 28-days treatment as tumour volume reached 1000 mm3.
Treatment with all three treated groups significantly slowed the increase in tumour mass with
the tumours in these animals reaching the maximal end point much later than the control group.
The median survival of the mice was 13, 19, 19 and 19.5 days in control, fucoidan alone, ATRA
alone and combination groups, respectively (Figure 6.10). No significant difference was seen
between treatment groups with each other.
Tumour aggressiveness was evaluated by tumour volume doubling time which decreased in all
treatment groups compared to the control group. The mean tumour volume doubling time was
2.43, 3.92, 3.42 and 3.53 days in control, fucoidan, ATO and combination groups, respectively
(Figure 6.11) indicating that the tumour in the control group grew more quickly than in treated
mice. No significant difference was seen between treatment groups with each other.

Chapter 6 Investigation of Possible Synergistic Effects of Fucoidan and ATRA in APL Treatment in Vitro and in Vivo
Page 166
Figure 6.10. The Kaplan-Meier survival analysis over 28 days of treatment. Mice with APL were treated with vehicle (red), fucoidan (green), ATRA (blue) and their combination (purple) and their life span was analysed over 28 days of treatment (n=8/group). p values
refer to comparison between each treatment group with the control group.

Chapter 6 Investigation of Possible Synergistic Effects of Fucoidan and ATRA in APL Treatment in Vitro and in Vivo
Page 167
Figure 6.11. Mean tumour volume doubling time. Mice with APL were treated with vehicle (red), fucoidan (green), ATRA (blue) and their combination (purple) and their mean tumour doubling time was compared to that of the control group (n=8/group). Each column
shows mean ± SD. Statistical significance was determined by ANOVA, followed by Tukey’s multiple comparison test (**:p≤0.01, *: p≤0.05).

Chapter 6 Investigation of Possible Synergistic Effects of Fucoidan and ATRA in APL Treatment in Vitro and in Vivo
Page 168
6.3.4 Fucoidan Significantly Increased the Differentiation of APL Cells in
Vivo.
At the end of the in-vivo study of the combinatory effect of fucoidan plus ATRA, the tumour
mass was removed from the mice and myeloid differentiation was assessed. To do this, a cell
suspension from the removed tumour mass was prepared following labelling with anti-CD11b
antibody. Since almost all NB4 cells express CD44, tumour cells were identified by CD44
expression. CD44 is an adhesion molecule which is highly expressed in more than 95% of the
NB4 cells and its expression does not change upon differentiation and maturation. To analyse
myeloid differentiation, CD11bhighCD44+ cells were quantified.
Figure 6.12 shows representative CD11b expression histograms in tumour mass obtained from
one representative mouse in each treatment group. As shown, a significant increase in
differentiation was observed in tumour mass treated with fucoidan alone (p≤0.05) and
ATRA+fucoidan (p≤0.05). The mean values of differentiated cells were approximately 10%,
24%, 19% and 22% in control, fucoidan, ATRA and combination groups, respectively (Figure
6.13). There was no significant difference between treated groups with each other.
Furthermore, a different immunophenotypic pattern in expression of CD44 and CD11b was
observed in different treatment groups (Blue population in Figure 6.12). Evaluating the
expression of CD44 on differentiated cells, the ratio of CD11bhighCD44- cells to
CD11bhighCD44+ cells was calculated (Figure 6.14). As shown in Figure 6.14, compared to the
control group, the ratio was reversed in mice treated with ATRA+fucoidan, indicating that the
percentage of CD44-negative differentiated cells was higher than the CD44-positive
differentiated cells. This ratio was 0.58, 0.83, 0.87 and 1.14 in control, fucoidan alone, ATRA
alone and combination groups, respectively, indicating decreased expression of CD44 in mice
treated with fucoidan+ATRA.

Chapter 6 Investigation of Possible Synergistic Effects of Fucoidan and ATRA in APL Treatment in Vitro and in Vivo
Page 169
Figure 6.12. Representative flow cytometry analysis of CD11b expression in cells obtained from tumour mass. The tumour-bearing mice were treated with fucoidan, ATRA
and combination, and differentiation was assessed using CD11b expression. Histograms show the flow cytometry results from one representative tumour mass in each treated group. The percentage of differentiated CD11bhigh cells was calculated (left graphs). The graphs in the
right hand column demonstrate the expression of CD11b and CD44. Blue population: CD11bhigh , Green and Gray populations: CD11blow
Red populations: CD11bneg
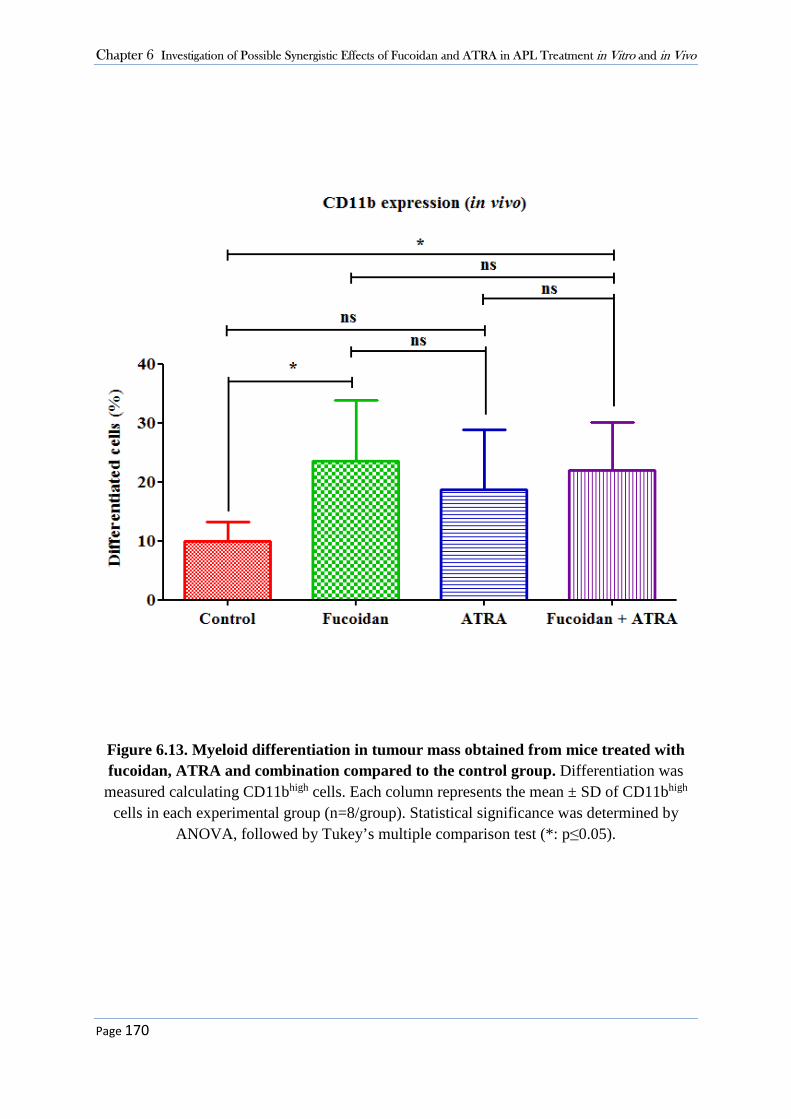
Chapter 6 Investigation of Possible Synergistic Effects of Fucoidan and ATRA in APL Treatment in Vitro and in Vivo
Page 170
Figure 6.13. Myeloid differentiation in tumour mass obtained from mice treated with fucoidan, ATRA and combination compared to the control group. Differentiation was measured calculating CD11bhigh cells. Each column represents the mean ± SD of CD11bhigh
cells in each experimental group (n=8/group). Statistical significance was determined by ANOVA, followed by Tukey’s multiple comparison test (*: p≤0.05).

Chapter 6 Investigation of Possible Synergistic Effects of Fucoidan and ATRA in APL Treatment in Vitro and in Vivo
Page 171
Figure 6.14. The ratio between CD44-/CD11b+ to CD44+/CD11b+ cells in tumour mass obtained from mice. Mice with APL were treated with vehicle, fucoidan, ATRA and
combination. Expression of CD44 and CD11b was measured using flow cytometry and the ratio between CD44-negative to CD44-positive differentiated cells was calculated in each
experimental group. Statistical significance was determined by ANOVA, followed by Tukey’s multiple comparison test (**: p≤0.01). Each column represents the mean ratio of
CD44- to CD44+ differentiated cells with error bars the SD.

Chapter 6 Investigation of Possible Synergistic Effects of Fucoidan and ATRA in APL Treatment in Vitro and in Vivo
Page 172
6.4 Discussion
Herein, the synergistic effects of fucoidan with ATRA and ATO in induction of myeloid
differentiation was investigated. It was found that combining fucoidan with sub-therapeutic
doses of ATRA and ATO enhanced myeloid differentiation in vitro. In addition, enhanced
survival and delayed tumour growth were observed in APL-bearing mice when treated with
combined fucoidan and low doses of ATRA. Analysis of myeloid differentiation in the tumour
mass obtained from mice showed that treatment with fucoidan alone and combined with ATRA
significantly increased tumour cell differentiation, in vivo. This is the first study to show that
treatment of mice with fucoidan+ATRA down-regulates the expression of the adhesion
molecule CD44 in APL cells.
6.4.1 Synergistic Effect of Fucoidan with ATRA and ATO in Vitro
Severe toxicity is frequently observed in newly diagnosed APL patients treated with traditional
chemotherapeutic agents. Several studies and trials have investigated whether the combination
of ATRA+ATO with minimal or no chemotherapy can replace standard therapy (308).
Haematological remission is observed in 80-90% of refractory and relapsed patients treated
with ATRA+ATO (272), however the use of this combination in newly diagnosed and high-
risk patients remains clinically challenging and can induce serious complications such as
hyperleucocytosis and differentiation syndrome (309, 310). Therefore, the use of adjuvants
increasing the efficiency of ATO+ATRA on the one hand and decreasing the risk of side effects
on the other gained strong interest.
Fucoidan’s biological activities such as anti-tumour and immunomodulatory effects are highly
relevant to its potential as an adjuvant therapy. In a recent study by Zuo et al., the role of
fucoidan in minimising intestinal mucositis induced by chemotherapy was examined in mice
(270). Mucositis is a common problem in patients under chemotherapy and is related to
significant morbidity and rarely mortality. Zuo et al. developed a mouse model of mucositis
induced by the chemotherapy drug cyclophosphamide and showed that administration of
fucoidan significantly reduced the intestinal damage caused by chemotherapy. This was
accompanied by an improved intestinal immune system as fucoidan altered the expression of
intestinal immune system cytokines and maintained the Th1/Th2 immune balance. Fucoidan

Chapter 6 Investigation of Possible Synergistic Effects of Fucoidan and ATRA in APL Treatment in Vitro and in Vivo
Page 173
has also been shown to increase the efficacy of chemotherapeutic agents. Zhang et al. reported
that combining fucoidan with standard chemotherapeutic agents increased apoptosis in breast
cancer cell lines, potentially through induction of oxidative stress (196). To the best of our
knowledge, there is no study examining the combinatory effect of fucoidan with standard
treatments in leukaemias.
Failure to differentiate is a feature of the abnormal promyelocytes in APL (286). ATRA and
ATO are two main standard differentiation-based therapies which stimulate terminal and partial
differentiation of the accumulated abnormal promyelocytes, respectively (40, 311). The
selective growth inhibitory effect of fucoidan in APL cells was demonstrated in Chapter 3.
Results in Chapter 5 also provided evidence that fucoidan has synergistic effect with standard
APL therapy regimen (ATO) in induction of apoptosis. Here, further investigations were
carried out to determine whether fucoidan can enhance the effectiveness of ATRA+ATO in
induction of differentiation in APL cells.
CD11b or integrin alpha M (ITGAM) is the alpha subunit of the heterodimeric integrin alpha
M beta 2 (αMβ2) protein which is also known as macrophage antigen-1 (Mac-1) or complement
receptor 3 (CR3). This adhesion molecule is highly expressed on the surface of many
leucocytes (312). The surface expression of CD11b is gradually increased upon the myeloid
differentiation and maturation and hence its overexpression is an indicator of differentiation.
Previous studies have analysed the ATRA-mediated granulocytic differentiation of NB4 cells
at various time points. Yang et al. analysed the expression profiles of more than 12,000 genes
in NB4 cells after treatment with 1 µM ATRA at various time points (from 12 to 96 hours),
and compared them to those of untreated cells (314). Differentiation markers began to increase
after 24 hours with the maximum differentiation (more than 85%) at 96 hours after ATRA
treatment. Here, the expression of CD11b was analysed in NB4 cells after treatment with
ATRA from 48 to 120 hours, and the maximum differentiation was observed after 120 hours
of treatment. The same analysis were conducted in NB4 cells treated with ATO. The
granulocytic differentiation began 72-96 hours after the ATO treatment compared to the
control. This is consistent with the literature as it is well documented that ATO induces only
partial differentiation and slight changes in CD11b expression in NB4 cells compared to the
terminal differentiation induced by ATRA (315).

Chapter 6 Investigation of Possible Synergistic Effects of Fucoidan and ATRA in APL Treatment in Vitro and in Vivo
Page 174
Cell cycle assay is another tool for analysing cell differentiation. In vitro, proliferating cells are
characterised by an active cell cycle leading to cellular divisions. With initiation of the
differentiation process, cells exit from the dividing phases of the cell cycle. This is observed
with decrease in the fraction of cells in S phase and mitosis phase parallel with increase in the
non-dividing G0/G1 phase fraction (316). In this Chapter, the cell cycle status was measured
to assess the differentiation after 120 hours. The amount of the S-phase population decreased
from approximately 21% to 8% in the ATRA-treated NB4 cells. This decrease was consistent
with the literature (314).
After the optimization assays, NB4 cells were treated with fucoidan plus sub-clinical doses of
ATRA and ATO. In this chapter, an ultra-low dose of fucoidan was selected for the
differentiation assay to minimise the fucoidan-mediated apoptosis in NB4 cells over the 120-
hour incubation time. Co-stimulation of NB4 cells with fucoidan and ATRA+ATO resulted in
synergistic induction of myeloid differentiation characterised by increased expression of
CD11b and G0/G1 arrest. When fucoidan was combined with ATRA+ATO, almost all cells
underwent differentiation. In contrast, when cells were treated with ATRA alone or
ATRA+ATO, a proportion of cells remained undifferentiated. During chemotherapy, the drug-
resistant cell population is the main source of cancer recurrence in patients. The findings of
this thesis suggest that the number of resistant cells in response to ATRA could be limited in
patients by addition of fucoidan to the standard APL regimen.
ATRA and ATO induce differentiation through the degradation of the oncoprotein PML-
RARα, the main barrier of differentiation in APL cells (317). Previous studies on fucoidan’s
anti-cancer effects have shown that fucoidan mostly regulates the protein levels rather than
mRNA levels. Hence it will be worthwhile to investigate the effects of fucoidan on the
expression of PML-RARα fusion protein as it might alter the expression of the fusion protein
or enhance its degradation through regulating the ubiquitin/proteasome pathway.
Although fucoidan significantly increased APL cell differentiation when it was combined with
ATRA and ATO, fucoidan alone had almost no effect on NB4 cell differentiation in vitro.
Reports examining differentiation response in other cell types have been reported, for example
in osteoblasts and mesenchymal stem cells. In a recent study, fucoidan significantly increased
differentiation in human mesenchymal stem cells at doses between 0.1-1 µg/mL after 120
hours. Differentiation was however markedly decreased at 5 and 10 µg/mL fucoidan (318).
Chapter 6 Investigation of Possible Synergistic Effects of Fucoidan and ATRA in APL Treatment in Vitro and in Vivo
Page 175
Here, differentiation was not altered when cells were treated with lower or higher doses of
fucoidan alone (1 µg/mL and 20 µg/mL) (data were not shown).
6.4.2 Synergistic Effect of Fucoidan with ATRA in Vivo
Following the in vitro findings, the synergistic effects of fucoidan with ATRA were examined
in vivo. Several in vivo studies have reported side effects caused by high doses of ATO and
ATRA. In a study by Jing et al., 10 µg/g ATRA increased the lifespan of mice bearing APL.
However, combination of this dose of ATRA with ATO was toxic with weight loss and early
therapy-associated death (40). Here, lower concentration of ATRA (1.5 µg/g b.w.) was
employed, with the presumption that this may minimise the toxicities of the anti-cancer drugs.
Due to small size of the utilised nude mice and risk of toxicity, administration of higher
concentrations of ATRA was impossible. Knowing that previously published papers used at
least 5 µg/gr b.w. of ATRA, at the beginning of the study a dose of 2.5 µg/gr b.w. of ATRA
was selected for the in vivo investigations, but initiation of treatment led to the early death of
animals where two mice died two days after treatment commencement (data were not shown).
As a result the ATRA dose was further reduced to 1.5 µg/gr b.w. and observed no toxicity
when it was used alone or in combination with fucoidan.
To address the effects of fucoidan on APL cell differentiation in vivo, the myeloid
differentiation of the tumour mass obtained from mice treated with fucoidan and ATRA was
lastly measured. In contrast with the in vitro findings, in which fucoidan alone had little effects
on NB4 cell differentiation, in vivo, fucoidan alone induced 1.3-fold more differentiation in
NB4 cells than did ATRA alone. Granulocytic differentiation includes a highly regulated
process which occurs upon stimulation of several cytokines (319). The microenvironment and
cellular cross talk are other critical factors that can influence the maturation and differentiation
process. As fucoidan has been shown to change the production of various cytokines in vivo
(320), it is suggested that the different results between fucoidan’s action in vivo and in vitro
could be explained by the effect of fucoidan on alteration of the cytokines that have regulatory
effects on myeloid maturation. Fucoidan also affects the mobilization of the white blood cells
from bone marrow to the peripheral blood through various mechanisms. Irhimeh et al. showed
that fucoidan increased the expression of CXCR4 on haematopoietic stem cells resulting in the
migration of these cells into the circulatory blood (321). Furthermore, it has been reported that

Chapter 6 Investigation of Possible Synergistic Effects of Fucoidan and ATRA in APL Treatment in Vitro and in Vivo
Page 176
fucoidan has a synergistic effect with granulocyte colony stimulating factor (G-CSF) to alter
leucocyte trafficking and mobilization (321). Changes in the pattern of circulatory blood cells
combined with the altered stimulation of cytokine production by immune cells could lead to a
different microenvironment around engrafted NB4 cells compared to in-vitro-cultured NB4
cells. G-CSF is a major cytokine, which increases granulocytic differentiation (322). Synergy
of fucoidan with G-CSF in induction of differentiation is another hypothesis which needs to be
investigated in future studies.
The combined fucoidan and ATRA treatment of mice bearing APL not only caused myeloid
differentiation, but reduced CD44 expression. This was not observed in those mice treated with
ATRA or fucoidan alone. Evaluating the expression of CD44 on differentiated cells, the ratio
of CD44- cells to CD44+ cells was measured, and it was found that when mice were treated
with combined agents, the pattern of CD44 expression reversed upon maturation compared to
the other groups. The observed reversal following combined ATRA+fucoidan treatment could
be suggestive of two hypotheses: 1. the differentiating cells have lost their CD44 upon
maturation 2. the existing CD44- cells have undergone higher amount of maturation than the
existing CD44+ cells. However, since more than 95% of NB4 cells express CD44 at high level,
the second hypothesis seems implausible.
CD44 is an adhesion molecule involved in cell proliferation, differentiation, migration and
angiogenesis (323). It is well documented that upregulation of CD44 on cancer cells is
correlated with poor prognosis as it can enhance cell migration and metastasis (324). As
mentioned above, development of the differentiation syndrome caused by ATRA and ATO is
one of the main clinical challenges in treatment of APL, whereby the accumulated
differentiated young neutrophils infiltrate into various body sites, particularly lungs, and cause
fatal complications (325). The observed increase in differentiated cells with low or no
expression of CD44 in mice treated with fucoidan+ATRA adds further evidence that it may
decrease the migration of these cells. However, further analysis including developing murine
models of differentiation syndrome following treatment with ATRA plus fucoidan is needed.

Page 177
Chapter Seven – Conclusion and Future Direction
Conclusion and Future Directions

Chapter 7 Conclusion and Future Directions
Page 178
Final Discussion and Conclusion
This thesis focussed on examining the anti-tumour activity of the natural product, fucoidan, in
haematological malignancies (HMs) both in vitro and in vivo. The chemical composition of
fucoidan from different seaweed sources and their cytotoxicity activity on HMs were analysed
and compared. In-vitro studies indicated that fucoidan selectively inhibited the growth of acute
promyelocytic leukaemia (APL) cell lines through activation of apoptotic molecules and
inactivation of signal transduction molecules involved in cell survival. The anti-tumour activity
of fucoidan was supported by an in-vivo evidence which demonstrated that oral doses of
fucoidan prior to inoculation with a human APL cell line significantly delayed tumour growth
in the xenograft model, potentially by increasing the cytolytic activity of NK cells. In addition,
significant synergy between fucoidan and anti-leukaemic activity of APL standard treatments
ATO and ATRA was observed in the APL cells in vitro. In vivo, treatment of APL-bearing
mice with fucoidan plus ATRA and fucoidan plus ATO resulted in delayed tumour growth and
significantly prolonged the tumour volume doubling time compared to the control group.
There is considerable scope to improve treatment efficiency outcomes as the high mortality
and morbidity associated with relapse, drug resistance and the risk of the development of
therapy related cancers have remained unchanged in last decades. The challenges in the
successful treatment of HMs arise largely because of the nature of the cancer. The
dissemination of leukaemic cells in HMs limits the use of localised therapeutic strategies such
as surgery and radiation (326). Further, by generating key growth and survival signals, bone
marrow stroma provides a nurturing environment for leukaemic cells, leading to tumour
progression, and resistance against the cytotoxic effects of chemotherapeutic agents (327).
Identification of novel and potent agents that target the cancer cell death while having
minimum impact on normal cells is the main key toward developing successful therapeutic
strategies. Thereby, agents with anti-cancer activity and reduced toxicity such as some natural
products have attracted strong interest. The multifunctional properties of many natural products
many of which are also known to be well tolerated make them ideal targets in anti-cancer
research. Vinblastine and vincristine, for instance, are amongst the main chemotherapeutic
agents, that are derived from the Madagascar periwinkle known as rosy periwinkle (328). The
usage of these drugs in childhood leukaemia has improved the survival rate from 10% to 95%.

Chapter 7 Conclusion and Future Directions
Page 179
Eribulin is another natural-based anticancer agent, that has been developed from a sea sponge
and its usage in metastatic breast cancer was approved by FDA in 2010 (329).
Fucoidan is a water soluble polysaccharide derived from brown seaweeds, and is consumed as
a regular part of diet in Asian countries. Recent epidemiological studies have linked the
consumption of seaweeds containing fucoidan with low risk of certain cancer types particularly
female breast cancer (252). The biological properties of fucoidans derived from Undaria
pinnatifida and Fucus vesiculosus have been under recent investigations. However, there are
few studies on the growth inhibitory effects of these fucoidans in HMs. This is the first study
to investigate the anti-tumour activity of fucoidan in HMs in vivo.
Different factors such as the source of fucoidan, the time and location of harvesting and the
extraction method can affect the fucoidan’s bioactivities (137). Fucoidan from two sources of
Undaria pinnatifida and Fucus vesiculosus was used in this study. The purified fucoidan from
Undaria pinnatifida and Fucus vesiculosus (Marinova Pty. Ltd) used in Chapter 3 are extracted
by a neutral cold process and ultrafiltration. This process leaves the product with its native
structure intact with a high molecular weight. These fucoidans were found to have no cytotoxic
activity in any of the leukaemic cells utilised. Wang and colleagues extracted fucoidan from
the sporophyll of Undaria pinnatifida using hot water extraction and alcohol grade
precipitation (330). The product had a purity of >90% with the molecular weight of 104 kDa
and contained 21% sulphate. At the dose of 250 µg/mL, this purified fucoidan inhibited growth
in mouse hepatocarcinoma cells. The fucoidan from Undaria pinnatifida used in this thesis had
almost similar characteristics to that of Wang et al., with a purity of 99%, MW of 61.2 kDa
and a sulphate content of 26.6%. However, even at very high doses of 2.5 mg/mL it did not
affect the leukaemia cell growth and cell cycle. This difference can possibly be explained by
factors such as cell types and other structural characteristics.
Fucoidan from Fucus vesiculosus obtained from Sigma Co. was further utilised and tested. This
Fucus fucoidan is the one most commonly reported to be used in research in this field. It is
produced using acid hydrolysis and ethanol precipitation. The chemical constituent analysis in
this thesis revealed structural differences between two fucoidan sources. For instance, the
fucoidan from Sigma Co. had three times lower MW than that produced by Marinova Pty. Ltd.
In addition, the purity of this fucoidan was near 80% compared to 98% in fucoidan from
Marinova Pty. Ltd. In contrast with the purified fucoidan (Marinova Pty. Ltd.), the fucoidan

Chapter 7 Conclusion and Future Directions
Page 180
from Sigma Co. revealed strong cytotoxic activity in some AML cell lines. To ensure to avoid
false results, the endotoxin level of the commercial fucoidan was measured and no endotoxin
activity was detected.
The reason for the observed difference in results obtained from different fucoidans is not clear,
although this has been noticed by others. Mak et al. isolated crude fucoidan from Undaria
pinnatifida with 70% fucoidan purity and prepared three different fractions with higher purities,
and compared the biological properties of these fractions with fucoidan from Fucus vesiculosus
(Sigma Co.) (249). Cell proliferation assay in various cell lines showed that their own crude
fucoidan had the highest cytotoxic activity than purified fractions and commercial fucoidan
against the MCF-7 breast cancer cells and A-549 lung cancer cells. Another study by
Choosawad et al. also reported a stronger inhibitory effect of crude fucoidan from Utricularia
aurea on KB nasopharynx cancer cells than its purified fractions (331). It is generally believed
that fucoidans with lower MW and higher sulphate content have higher growth inhibitory effect
on cancer cells. However, in the Mak et al. report, the crude fucoidan had the highest MW and
lowest sulphate content compared to those of the purified fractions but had the highest anti-
cancer activity. Here, the different fucoidan preparations utilised had similar sulphate content.
This could suggest that sulphate content in the range of 20% might not have a large impact on
the fucoidan bio-properties.
Another difference between the three fucoidans studied in this thesis is the presence of 3.9%
polyphenols in the fucoidan from Sigma Co. Polyphenols are phytochemicals widely
distributed in plants and marine plants such as seaweeds and have been reported to have anti-
oxidant and cytotoxic effects (237). It is not clear how much the presence of 3.9% polyphenols
contributed to the cytotoxic effects of the fucoidan. In a recent study, Yang et al. showed that
the polyphenol extracted from the brown seaweed Laminaria japonica Aresch had anti-
proliferative activity on P388 leukaemia cell line with the IC50 value of >200 µg/mL (p>0.05)
(332). To the best of our knowledge, the previously published articles studying the anti-cancer
activity of fucoidan have not examined polyphenol content of their fucoidans.
Fucoidan has been shown to be non-toxic in normal tissues. For in-vitro studies, some
researchers have utilised normal cells such as normal fibroblasts alongside tumour cell lines,
and have examined the proliferation inhibitory effect of fucoidan on both tumour and normal
cells. These studies have revealed that fucoidan did not induce apoptosis within normal cells

Chapter 7 Conclusion and Future Directions
Page 181
at the doses which were toxic for the studied cancer cell lines. In vivo and clinical trials using
fucoidan from different sources have also reported no or mild side effects. For instance, long-
term administration of fucoidan from Undaria pinnatifida in a form of 560 mg capsules did not
induce side effects even when the participants took 4 capsules a day (333).
In this dissertation, it was determined that fucoidan from Fucus vesiculosus (Sigma Co.)
effectively and selectively induced cell death in the APL cell lines NB4 and HL60 but did not
have any inhibitory effect on proliferation of the minimally differentiated AML cell line KG-
1a. It also slightly reduced the proliferation of the acute erythroleukaemic cell line K562
through induction of cell cycle arrest and not cell death. The induced cell death in APL cells
was revealed to have features characteristic of apoptosis and not necrosis. Necrosis is a
pathological cell death that causes inflammation upon the release of the cellular content in the
surrounding environment. In contrast, during apoptosis the intracellular contents are not
released and inflammation does not occur in the cellular environment. Therefore, the type of
cell death induced by fucoidan makes it a desirable therapeutic agent.
Speculation of fucoidan’s targets leading to its wide range of activities including cell death
process in cancer cells is still a matter of debate and controversy. Here, fucoidan induced
apoptosis through reducing the activation of survival molecules ERK1/2 and AKT in APL
cells. It also hyper-activated the apoptosis enzymes caspases 8, 9 and 3, and its cytotoxic
activity was attenuated using a pan-caspase inhibitor indicating that fucoidan’s apoptosis
induction is caspase dependent in APL cells.
Consumption of fucoidan even over a very short time period was found to significantly delay
the development and growth of APL, suggesting that fucoidan intake may enhance the immune
cell activity. Other studies have also shown that fucoidan can inhibit neoplastic transformation
in other in vivo models. In a chemical carcinogen rat model, fucoidan delayed the median time
for tumour appearance when fucoidan was intraperitoneally administrated for 34 days prior to
carcinogen exposure (253). In a recent study, the prophylactic activity of oral fucoidan in the
prevention of Lewis Lung Carcinoma cell invasion and metastasis was investigated (266).
Fucoidan prophylactically inhibited lung metastasis colonisation of tumour cells in C57BL/6
mice.

Chapter 7 Conclusion and Future Directions
Page 182
Treatment with fucoidan alone has been shown to be effective in multiple cancer types in vivo.
Many bioactive substances function to modulate multiple pathways including apoptosis, cell
proliferation and differentiation. Therefore, use of combinations of such natural compounds
with two or more targeted anti-cancer agents may achieve a more successful outcome.
APL is one of the most aggressive types of AML with the unusually young average age of 40
years. Despite the improvement in APL survival rate, drug resistance and side effects such as
hyperleucocytosis and differentiation syndrome remain the clinical challenges. Here, the anti-
tumour activity of fucoidan in different types of AML was examined, and it was found that
fucoidan treatment inhibited APL cell proliferation. This finding led us to examine whether
fucoidan combined with standard APL treatments would have therapeutic benefit.
A strong synergistic effect on apoptosis was noted in fucoidan and ATO treated cells.
Combination treatment led to significant increase in DNA fragmentation and annexin V
positive apoptotic cells. ATO plus ATRA traditionally targets the differentiation of malignant
promyelocytes. As ATO can additionally induce apoptosis in APL cells, the involvement of
ATO plus other therapeutic strategies in induction of apoptosis in promyelocytes is a target of
cancer research studies. Treatment of human cervix carcinoma cells with ATO and ionised
radiation enhanced apoptosis with loss of mitochondrial membrane potential and activation of
caspases (334). The combination of ATO with the tyrosine kinase inhibitor imatinib also
significantly increased chronic myelocytic leukaemic cell apoptosis through activation of the
apoptosis intrinsic pathway, compared to stress-mediated apoptosis induced by ATO alone
(335). ATO is currently administrated in refractory APL but not in newly diagnosed cases. This
work is in agreement with other aforementioned studies (334, 335) that show more effective
apoptotic action can be achieved using ATO plus other therapies rather than ATO alone. This
observed synergy raises the possibility that ATO combined with other therapeutic agents such
as fucoidan in newly diagnosed APL patients may be a viable option particularly arising from
our observation of synergism between fucoidan with low doses of ATRA and ATO. These
findings could be beneficial in clinics as the administration of lower doses of ATRA and ATO
could reduce their observed toxicities.
The synergistic effect of fucoidan on APL cell differentiation induced by ATRA and ATO was
further determined in the human APL cell line, NB4. Triple combinations of these agents were
found to induce the strongest influence on cell cycle arrest compared to single or any double

Chapter 7 Conclusion and Future Directions
Page 183
combinations of the compounds. The cell cycle arrest observed was consistent with the data
obtained from the differentiation assay and the triple combination resulted in the highest
amount of differentiated cells where almost all cells underwent differentiation. In NB4 cells
treated with dual combination of ATRA+ATO, a small proportion of resistant cells (~15%)
remained undifferentiated. The primary cause of relapse is drug resistance and therefore
incomplete clearance of tumour cells. The findings presented in this thesis have implications
for improving treatment response in APL cells as the addition of fucoidan to standard
ATRA+ATO therapy could overcome resistance and relapse in APL.
Although combination of low dose fucoidan with ATRA or ATO synergistically enhanced the
differentiation, no dual dose dependent effect was observed for fucoidan alone treatment such
as was seen in ATO-treated APL cells. As mentioned before, ATO induces apoptosis at higher
doses while it induces myeloid differentiation at lower doses. In contrast, fucoidan only
induced cell death at higher dose but did not induce differentiation at the lower dose when it
was administered alone.
Finally, the synergy of fucoidan+ATO or fucoidan+ATRA was investigated in vivo. The
combination of ATRA plus fucoidan retarded tumour growth as indicated by increased tumour
volume doubling time. However, overall the maximal effect was observed in fucoidan+ATO
treated mice. Approximately 28% of the mice treated with fucoidan+ATO completed the full
treatment program, with tumour volume reaching the end point after 28 days compared to none
in fucoidan+ATRA treated mice. Furthermore, the tumour volume doubling time was maximal
in fucoidan+ATO treated mice compared to all other groups in all studies. This could be
because of the very low dose of ATRA used here due to toxicity encountered as described
previously. This low dose may explain the lower efficacy of fucoidan+ATRA compared to
fucoidan+ATO treatment and to the in vitro results.
The anti-tumour activity of fucoidan treatment as a single agent was demonstrated, and
consistent outcomes were achieved. Further, in combination with ATRA and ATO, fucoidan
was again demonstrated to potentiate the anti-tumour activities. The results obtained from the
optimisation assay (see Section 5.3.3), the fucoidan+ATO assay (see Section 5.3.4) and the
fucoidan+ATRA assay (see Section 6.3.3) reveal the anti-tumour activity of fucoidan alone
treatment compared to the control group in APL-bearing mice. Figure 7.1 compares the tumour
volume doubling time and the median survival in fucoidan alone treated mice and the control

Chapter 7 Conclusion and Future Directions
Page 184
group in two independent assays in Chapters 5 and 6. As shown, almost similar outcomes were
observed in the fucoidan treated mice in both studies. The reproducibility and observed
consistent anti-cancer activity of fucoidan when used alone strengthens the hypothesis that
fucoidan has anti-tumour activity against APL.
Figure 7.1. Comparison of the data obtained in two independent studies in Chapters 5 and 6. Results show tumour volume doubling time and median survival in the control (blue) and fucoidan alone (green) treated mice from studies in Chapter 5 (left) and Chapter 6 (right).
When the differentiation activity of fucoidan treatment alone was assessed, myeloid
differentiation of APL cells was observed in vivo, while no such effect was observed in vitro.
We believe that fucoidan treatment alters the microenvironment around engrafted NB4 cells
compared to in-vitro-cultured NB4 cells. Fucoidan’s influences on cell cross-talk and cytokine
production in vivo may explain the induced differentiation in APL cells in mice.
Another novel observation was to identify the altered ratio of CD44- cells to CD44+ cells in the
tumour masses of those mice treated with fucoidan+ATRA compared to single treatment and
control groups. It is not clear whether co-treatment of ATRA with fucoidan reduced the
expression of CD44 upon differentiation or induced differentiation of existing CD44- NB4 cells
more than the CD44+ NB4 cells. Although as it is known that almost 95% of the NB4 cells
express CD44 on their surface, reduction in CD44 expression appears plausible. CD44 plays a
major role in migration of tumour cells to other sites of the body and therefore downregulation
of CD44 by combined fucoidan and ATRA may reduce the migration of APL cells in
differentiation syndrome caused by ATRA and ATO. Although, this remains to be proven and
further investigation on the underpinning mechanisms of this action should be undertaken. This
could be analysed by labelling the CD44- NB4 cells prior to injection into mice.

Chapter 7 Conclusion and Future Directions
Page 185
Future Directions
This thesis provides the first evidence that the combination of fucoidan with APL standard
therapy delays APL growth and enhances the survival of APL-bearing mice. More animal
experiments using larger numbers and additional treatment groups such as a triple combination
of fucoidan, ATRA and ATO are suggested. Also, future studies which examine systemic
leukaemia closely mimicking circulatory leukaemia cells in humans should be undertaken with
establishment of APL via injection of the tumour cells intravenously. The use of NOD/SCID
mice would permit tumour burden to be examined in the absence of NK cells, B-cells and T-
cells, and tumour establishment would be more successful. NOD-SCID mice can also tolerate
higher doses of ATRA compared to nude mice.
The research presented in this thesis also provides evidences for immunomodulatory activity
of fucoidan through changes in NK cell behaviour in vivo. Whether the increased activity of
NK cells were due to increased numbers or function remains to be determined. In addition, the
role of fucoidan on other immune response elements such as IFN- level could be examined in
future studies.
As it is hypothesised that fucoidan reduces the toxicity of ATRA and ATO through its
immunomodulatory effects, it is worthwhile to analyse the protective activity of fucoidan on
differentiation syndrome which is one of the main features of ATRA and ATO therapies. This
could be done by establishment of differentiation syndrome model in mice bearing systemic
APL treated with high dose ATRA, and assessing specific outcomes such as lung edema and
pulmonary effusion which are indicators of differentiation syndrome.
This thesis also provides solid evidence of synergy of fucoidan plus ATO plus ATRA in vitro
in NB4 cell differentiation. The combination of fucoidan+ATRA+ATO resulted in myeloid
differentiation of >99% of treated cells compared to 87% when cells were treated with
ATRA+ATO. ATRA and ATO induce differentiation through degradation of the oncoprotein
PML-RARα, the main barrier of differentiation in APL cells (317). Further future
investigations to examine the effects of fucoidan on the expression of PML-RARα fusion
protein are suggested.
This work provides evidence about the protective effect of fucoidan in prevention and delayed
growth of APL. These data have implications for future epidemiological studies. Randomised
Chapter 7 Conclusion and Future Directions
Page 186
controlled trials may seek to evaluate the effect of dietary fucoidan supplementation or brown
seaweed intake on leukaemia prevention. These data could also be a basis for clinical trials in
order to assess the association between oral administration of fucoidan and immune system
functions such as NK cell activity as was shown in this project.

Page 187
References
1. American Cancer Society. Cancer Facts & Figures 2014. Atlanta: American Cancer Society 2014.
2. Australian Institute of Health and Welfare 2014. Cancer in Australia, An overview 2014. Cancer Series no 90 Cat no CAN 88 Canberra: AIHW.
3. Vardiman JW, Thiele J, Arber DA, Brunning RD, Borowitz MJ, Porwit A, et al. The 2008 revision of the World Health Organization (WHO) classification of myeloid neoplasms and acute leukemia: rationale and important changes. Blood. 2009;114(5):937-51.
4. Juliusson G, Lazarevic V, Horstedt AS, Hagberg O, Hoglund M. Acute myeloid leukemia in the real world: why population-based registries are needed. Blood. 2012;119(17):3890-9.
5. Australian Institute of Health and Welfare & Australasian Association of Cancer Registries 2012. Cancer in Australia: An overview 2012. Cancer series no 74 Cat no CAN 70 Canberra: AIHW.
6. Hutchison RE, Schexneider KI. Leukocytic disorders. In: McPherson RA, Pincus MR, editors. Henry's Clinical Diagnosis and Management by Laboratory Methods. 22 ed2011.
7. Australian Institute of Health and Welfare 2012. Cancer survival and prevalence in Australia: period estimates from 1982 to 2010. Cancer Series no 69 Cat no CAN 65 Canberra: AIHW.
8. Deschler B, Lubbert M. Acute myeloid leukemia: epidemiology and etiology. Cancer. 2006;107(9):2099-107.
9. Schiffer CA, Stone RM. Acute Myeloid Leukemia in Adults. In: Kufe DW, Pollock RE, Weichselbaum RR, Bast RC, Gansler TS, Holland JF, et al., editors. Holland-Frei Cancer Medicine. 6 ed: Hamilton (ON): BC Decker; 2003. p. 1.
10. Samiev D, Bhatt VR, Armitage JD, Maness LJ, Akhtari M. A primary care approach to myelodysplastic syndromes. Korean journal of family medicine. 2014;35(3):111-8.
11. Padua RA, McGlynn A, McGlynn H. Molecular, cytogenetic and genetic abnormalities in MDS and secondary AML. Cancer treatment and research. 2001;108:111-57.
12. Häggström M. Hematopoiesis. In: Image:Hematopoiesis_(human)_diagram.png, editor. Wikipedia2009.
13. SEER (Surveillance Epidemiology and End Results). Cancer Statistics Review, 1975-2011. National Cancer Institute; 2014.

Page 188
14. Schlenk RF. Post-remission therapy for acute myeloid leukemia. Haematologica. 2014;99(11):1663-70.
15. Ravandi F, Estey EH, Appelbaum FR, Lo-Coco F, Schiffer CA, Larson RA, et al. Gemtuzumab ozogamicin: time to resurrect? Journal of clinical oncology : official journal of the American Society of Clinical Oncology. 2012;30(32):3921-3.
16. Avvisati G, Mele A, Stazi MA, Vegna ML, Pasquini P, Mandelli F. Epidemiology of acute promyelocytic leukemia in Italy. APL Collaborating Group. Annals of oncology : official journal of the European Society for Medical Oncology / ESMO. 1991;2(6):405-8.
17. Hillestad LK. Acute promyelocytic leukemia. Acta medica Scandinavica. 1957;159(3):189-94.
18. Bernard J, Mathe G, Boulay J, Ceoard B, Chome J. [Acute promyelocytic leukemia: a study made on 20 cases]. Schweizerische medizinische Wochenschrift. 1959;89:604-8.
19. Roussel MJ, Lanotte M. Maturation sensitive and resistant t(15;17) NB4 cell lines as tools for APL physiopathology: nomenclature of cells and repertory of their known genetic alterations and phenotypes. Oncogene. 2001;20(49):7287-91.
20. Rowley JD, Golomb HM, Dougherty C. 15/17 translocation, a consistent chromosomal change in acute promyelocytic leukaemia. Lancet. 1977;1(8010):549-50.
21. Pandolfi PP. Oncogenes and tumor suppressors in the molecular pathogenesis of acute promyelocytic leukemia. Human molecular genetics. 2001;10(7):769-75.
22. Tallman MS, Altman JK. Curative strategies in acute promyelocytic leukemia. Hematology / the Education Program of the American Society of Hematology American Society of Hematology Education Program. 2008;2008:391-9.
23. Palmer M, Chan A, Dieckmann T, Honek T. Cell type-specific anticancer drugs. In: Palmer M, Chan A, Dieckmann T, Honek T, editors. Notes to biochemical pharmacology: Wiley; 2013.
24. Tallman MS, Nabhan C, Feusner JH, Rowe JM. Acute promyelocytic leukemia: evolving therapeutic strategies. Blood. 2002;99(3):759-67.
25. Sanz MA, Jarque I, Martin G, Lorenzo I, Martinez J, Rafecas J, et al. Acute promyelocytic leukemia. Therapy results and prognostic factors. Cancer. 1988;61(1):7-13.
26. Wang ZY, Chen Z. Acute promyelocytic leukemia: from highly fatal to highly curable. Blood. 2008;111(5):2505-15.
27. Iland HJ, Collins M, Bradstock K, Supple SG, Catalano A, Hertzberg M, et al. Use of arsenic trioxide in remission induction and consolidation therapy for acute promyelocytic leukaemia in the Australasian Leukaemia and Lymphoma Group (ALLG) APML4 study: a non-randomised phase 2 trial. The Lancet Haematology. 2015;2(9):e357-66.
Page 189
28. Özpolat B. Acute promyelocytic leukemia and differentiation therapy: molecular mechanisms of differentiation, retinoic acid resistance and novel treatments. Turkish Journal of Hematology. 2009;26:47-61.
29. Lotan R. Effects of vitamin A and its analogs (retinoids) on normal and neoplastic cells. Biochimica et biophysica acta. 1980;605(1):33-91.
30. Huang ME, Ye YC, Chen SR, Zhao JC, Gu LJ, Cai JR, et al. All-trans retinoic acid with or without low dose cytosine arabinoside in acute promyelocytic leukemia. Report of 6 cases. Chin Med J (Engl). 1987;100(12):949-53.
31. Lo Coco F, Nervi C, Avvisati G, Mandelli F. Acute promyelocytic leukemia: a curable disease. Leukemia. 1998;12(12):1866-80.
32. Warrell RP, Jr. Retinoid resistance in acute promyelocytic leukemia: new mechanisms, strategies, and implications. Blood. 1993;82(7):1949-53.
33. Montesinos P, Sanz MA. The differentiation syndrome in patients with acute promyelocytic leukemia: experience of the pethema group and review of the literature. Mediterranean journal of hematology and infectious diseases. 2011;3(1):e2011059.
34. Liu J, Lu Y, Wu Q, Goyer RA, Waalkes MP. Mineral arsenicals in traditional medicines: orpiment, realgar, and arsenolite. The Journal of pharmacology and experimental therapeutics. 2008;326(2):363-8.
35. Zhu J, Chen Z, Lallemand-Breitenbach V, de The H. How acute promyelocytic leukaemia revived arsenic. Nature reviews Cancer. 2002;2(9):705-13.
36. Sun HD, Ma L, Hu XC, Zhang TD. Ai-lin 1 treated 32 cases of acute promyelocytic leukemia. Chinese Journal of Integrative Medicine. 1992;12:170-1.
37. Antman KH. Introduction: the history of arsenic trioxide in cancer therapy. The oncologist. 2001;6 Suppl 2:1-2.
38. Mayorga J, Richardson-Hardin C, Dicke KA. Arsenic trioxide as effective therapy for relapsed acute promyelocytic leukemia. Clinical journal of oncology nursing. 2002;6(6):341-6.
39. Falchi L, Verstovsek S, Ravandi-Kashani F, Kantarjian HM. The evolution of arsenic in the treatment of acute promyelocytic leukemia and other myeloid neoplasms: Moving toward an effective oral, outpatient therapy. Cancer. 2015.
40. Jing Y, Wang L, Xia L, Chen GQ, Chen Z, Miller WH, et al. Combined effect of all-trans retinoic acid and arsenic trioxide in acute promyelocytic leukemia cells in vitro and in vivo. Blood. 2001;97(1):264-9.
41. Lallemand-Breitenbach V, Guillemin MC, Janin A, Daniel MT, Degos L, Kogan SC, et al. Retinoic acid and arsenic synergize to eradicate leukemic cells in a mouse model of acute promyelocytic leukemia. The Journal of experimental medicine. 1999;189(7):1043-52.

Page 190
42. Shen ZX, Shi ZZ, Fang J, Gu BW, Li JM, Zhu YM, et al. All-trans retinoic acid/As2O3 combination yields a high quality remission and survival in newly diagnosed acute promyelocytic leukemia. Proceedings of the National Academy of Sciences of the United States of America. 2004;101(15):5328-35.
43. Tallman MS. Treatment of relapsed or refractory acute promyelocytic leukemia. Best practice & research Clinical haematology. 2007;20(1):57-65.
44. Long ZJ, Hu Y, Li XD, He Y, Xiao RZ, Fang ZG, et al. ATO/ATRA/anthracycline-chemotherapy sequential consolidation achieves long-term efficacy in primary acute promyelocytic leukemia. PloS one. 2014;9(8):e104610.
45. Lo-Coco F, Avvisati G, Vignetti M, Thiede C, Orlando SM, Iacobelli S, et al. Retinoic acid and arsenic trioxide for acute promyelocytic leukemia. The New England journal of medicine. 2013;369(2):111-21.
46. Zhu HH, Wu DP, Jin J, Li JY, Ma J, Wang JX, et al. Oral tetra-arsenic tetra-sulfide formula versus intravenous arsenic trioxide as first-line treatment of acute promyelocytic leukemia: a multicenter randomized controlled trial. Journal of clinical oncology : official journal of the American Society of Clinical Oncology. 2013;31(33):4215-21.
47. Hanahan D, Weinberg RA. The hallmarks of cancer. Cell. 2000;100(1):57-70.
48. Pecorino L. Introduction; what is cancer. Molecular Biology of Cancer: Mechanisms, Targets, and Therapeutics: Oxford University Press; 2012. p. 3.
49. Nath S, Mukherjee P. MUC1: a multifaceted oncoprotein with a key role in cancer progression. Trends in molecular medicine. 2014;20(6):332-42.
50. Xing X, Lian S, Hu Y, Li Z, Zhang L, Wen X, et al. Phosphatase of regenerating liver-3 (PRL-3) is associated with metastasis and poor prognosis in gastric carcinoma. Journal of translational medicine. 2013;11:309.
51. Kerr J, Wyllie A, Currie A. Apoptosis: a basic biological phenomenon with wide-ranging implications in tissue kinetics. British Journal of Cancer. 1972;26(4):239-57.
52. Elmore S. Apoptosis: a review of programmed cell death. Toxicol Pathol. 2007;35(4):495-516.
53. Abadeer A. Cell Death and Cell Renewal. The Cell: A Molecular Approach. 5 ed: Sinauer Associates, Inc.; 2011.
54. Kam P, Ferch N. Apoptosis: mechanisms and clinical implications. Anaesthesia. 2000;55(11):1081-93.
55. Lawen A. Apoptosis-an introduction. BioEssays. 2003;25(9):888-96.
56. http://www.hixonparvo.info/model.html. Apoptosis Pathway. In: apoptosis.jpg, editor.

Page 191
57. Favaloro B, Allocati N, Graziano V, Di Ilio C, De Laurenzi V. Role of apoptosis in disease. Aging. 2012;4(5):330-49.
58. Kothakota S, Azuma T, Reinhard C, Klippel A, Tang J, Chu K, et al. Caspase-3-generated fragment of gelsolin: effector of morphological change in apoptosis. Science (New York, NY). 1997;278(5336):294-8.
59. Gewies A. Introduction to Apoptosis 2003 [July 2015]. Available from: http://www.ihcworld.com/_books/apointro.pdf.
60. Kasibhatla S, Tseng B. Why target apoptosis in cancer treatment? Molecular cancer therapeutics. 2003;2(6):573-80.
61. Wilkinson J, Cepero E, Boise LH, Duckett C. Upstream regulatory role for XIAP in receptor-mediated apoptosis. Molecular and cellular biology. 2004;24(16):7003-14.
62. Johnson P, Watt S, Betts D, Davies D, Jordan S, Norton A, et al. Isolated follicular lymphoma cells are resistant to apoptosis and can be grown in vitro in the CD40/stromal cell system. Blood. 1993;82(6):1848-57.
63. Ott G, Rosenwald A. Molecular pathogenesis of follicular lymphoma. Haematologica. 2008;93(12):1773-6.
64. Inoue K, Kohno T, Takakura S, Hayashi Y, Mizoguchi H, Yokota J. Frequent microsatellite instability and BAX mutations in T cell acute lymphoblastic leukemia cell lines. Leukemia research. 2000;24(3):255-62.
65. Devarajan E, Sahin A, Chen JS, Krishnamurthy R, Aggarwal N, Brun A, et al. Down-regulation of caspase 3 in breast cancer: a possible mechanism for chemoresistance. Oncogene. 2002;21(57):8843-51.
66. Takeuchi S, Takeuchi N, Fermin A, Taguchi H, Koeffler H. Frameshift mutations in caspase-5 and other target genes in leukemia and lymphoma cell lines having microsatellite instability. Leukemia research. 2003;27(4):359-61.
67. Ozoren N, El-Deiry WS. Cell surface Death Receptor signaling in normal and cancer cells. Seminars in cancer biology. 2003;13(2):135-47.
68. Gronbaek K, Straten P, Ralfkiaer E, Ahrenkiel V, Andersen M, Hansen N, et al. Somatic Fas mutations in non-Hodgkin's lymphoma: association with extranodal disease and autoimmunity. Blood. 1998;92(9):3018-24.
69. Searle J, Lawson T, Abbott P, Harmon B, Kerr J. An electron-microscope study of the mode of cell death induced by cancer-chemotherapeutic agents in populations of proliferating normal and neoplastic cells. The Journal of pathology. 1975;116(3):129-38.
70. Greaney P, Nahimana A, Lagopoulos L, Etter A, Aubry D, Attinger A, et al. A Fas agonist induces high levels of apoptosis in haematological malignancies. Leukemia research. 2006;30(4):415-26.

Page 192
71. Nahimana A, Aubry D, Lagopoulos L, Greaney P, Attinger A, Demotz S, et al. A novel potent Fas agonist for selective depletion of tumor cells in hematopoietic transplants. Blood cancer journal. 2011;1(12):e47.
72. Ogasawara J, Watanabe-Fukunaga R, Adachi M, Matsuzawa A, Kasugai T, Kitamura Y, et al. Lethal effect of the anti-Fas antibody in mice. Nature. 1993;364(6440):806-9.
73. Havell E, Fiers W, North R. The antitumor function of tumor necrosis factor (TNF), I. Therapeutic action of TNF against an established murine sarcoma is indirect, immunologically dependent, and limited by severe toxicity. The Journal of experimental medicine. 1988;167(3):1067-85.
74. Wang S, Ren W, Liu J, Lahat G, Torres K, Lopez G, et al. TRAIL and doxorubicin combination induces proapoptotic and antiangiogenic effects in soft tissue sarcoma in vivo. Clinical Cancer Research. 2010;16(9):2591-604.
75. Borthakur G, O’Brien S. Pharmacology and clinical potential of oblimersen sodium in the treatment of chronic lymphocytic leukemia. Blood and Lymphatic Cancer: Targets and Therapy. 2012;2:137-43.
76. Kline M, Rajkumar S, Timm M, Kimlinger T, Haug J, Lust J, et al. ABT-737, an inhibitor of Bcl-2 family proteins, is a potent inducer of apoptosis in multiple myeloma cells. Leukemia. 2007;21(7):1549-60.
77. Cang S, Iragavarapu C, Savooji J, Song Y, Liu D. ABT-199 (venetoclax) and BCL-2 inhibitors in clinical development. Journal of hematology & oncology. 2015;8(1):129.
78. Davids MS, Pagel JM, Kahl B, .S., Wierda WG, Miller TP, Gerecitano JF, et al. Bcl-2 Inhibitor ABT-199 (GDC-0199) Monotherapy Shows Anti-Tumor Activity Including Complete Remissions In High-Risk Relapsed/Refractory (R/R) Chronic Lymphocytic Leukemia (CLL) and Small Lymphocytic Lymphoma (SLL). Blood. Nov 2013;122(21):872.
79. Peterson Q, Goode D, West D, Ramsey K, Lee JJ, Hergenrother P. PAC-1 Activates Procaspase-3 in Vitro through Relief of Zinc-Mediated Inhibition. Journal of molecular biology. 2009;388(1):144-58.
80. Tamm I, Wagner M, Schmelz K. Decitabine activates specific caspases downstream of p73 in myeloid leukemia. Annals of hematology. 2005;84 Suppl 1:47-53.
81. Lodish H, Berk A, Zipursky SL, Matsudaira P, Baltimore D, Darnell J. Overview of the Cell Cycle and Its Control. Molecular Cell Biology. 4 ed. New York: W. H. Freeman; 2000.
82. Sbia M, Parnell EJ, Yu Y, Olsen AE, Kretschmann KL, Voth WP, et al. Regulation of the yeast Ace2 transcription factor during the cell cycle. The Journal of biological chemistry. 2008;283(17):11135-45.
83. Vats P, Yu J, Rothfield L. The dynamic nature of the bacterial cytoskeleton. Cellular and molecular life sciences : CMLS. 2009;66(20):3353-62.

Page 193
84. Jayat C, Ratinaud MH. Cell cycle analysis by flow cytometry: principles and applications. Biol Cell. 1993;78(1-2):15-25.
85. Malumbres M, Barbacid M. Milestones in cell division : To cycle or not to cycle: a critical decision in cancer. Nature Reviews Cancer. 2001;1(December):222-31.
86. Pagano M, Pepperkok R, Verde F, Ansorge W, Draetta G. Cyclin A is required at two points in the human cell cycle. The EMBO Journal. 1992;11(3):961-71.
87. Lavoie JN, L'Allemain G, Brunet A, Muller R, Pouyssegur J. Cyclin D1 expression is regulated positively by the p42/p44MAPK and negatively by the p38/HOGMAPK pathway. The Journal of biological chemistry. 1996;271(34):20608-16.
88. Gladkikh A, Potashnikova D, Korneva E, Khudoleeva O, Vorobjev I. Cyclin D1 expression in B-cell lymphomas. Experimental hematology. 2010;38(11):1047-57.
89. Scuderi R, Palucka KA, Pokrovskaja K, Bjorkholm M, Wiman KG, Pisa P. Cyclin E overexpression in relapsed adult acute lymphoblastic leukemias of B-cell lineage. Blood. 1996;87(8):3360-7.
90. Iida H, Towatari M, Tanimoto M, Morishita Y, Kodera Y, Saito H. Overexpression of cyclin E in acute myelogenous leukemia. Blood. 1997;90(9):3707-13.
91. Della Ragione F, Mercurio C, Iolascon A. Cell cycle regulation and human leukemias: the role of p16INK4 gene inactivation in the development of human acute lymphoblastic leukemia. Haematologica. 1995;80(6):557-68.
92. Ogawa S, Hirano N, Sato N, Takahashi T, Hangaishi A, Tanaka K, et al. Homozygous loss of the cyclin-dependent kinase 4-inhibitor (p16) gene in human leukemias. Blood. 1994;84(8):2431-5.
93. Byrd JC, Lin TS, Dalton JT, Wu D, Phelps MA, Fischer B, et al. Flavopiridol administered using a pharmacologically derived schedule is associated with marked clinical efficacy in refractory, genetically high-risk chronic lymphocytic leukemia. Blood. 2007;109(2):399-404.
94. Lacrima K, Valentini A, Lambertini C, Taborelli M, Rinaldi A, Zucca E, et al. In vitro activity of cyclin-dependent kinase inhibitor CYC202 (Seliciclib, R-roscovitine) in mantle cell lymphomas. Annals of oncology : official journal of the European Society for Medical Oncology / ESMO. 2005;16(7):1169-76.
95. Berg J, ymoczko JL, Stryer L. Signal-Transduction Pathways: An Introduction to Information Metabolism. Biochemistry. 5 ed. New York: W.H. Freeman; 2002.
96. Dhillon AS, Hagan S, Rath O, Kolch W. MAP kinase signalling pathways in cancer. Oncogene. 2007;26(22):3279-90.
97. Giehl K, Skripczynski B, Mansard A, Menke A, Gierschik P. Growth factor-dependent activation of the Ras-Raf-MEK-MAPK pathway in the human pancreatic carcinoma cell line

Page 194
PANC-1 carrying activated K-ras: implications for cell proliferation and cell migration. Oncogene. 2000;19(25):2930-42.
98. Hemmings BA, Restuccia DF. The PI3K-PKB/Akt Pathway. Cold Spring Harbor perspectives in biology. 2015;7(4).
99. Robey RB, Hay N. Is Akt the "Warburg kinase"?-Akt-energy metabolism interactions and oncogenesis. Seminars in cancer biology. 2009;19(1):25-31.
100. Brose MS, Volpe P, Feldman M, Kumar M, Rishi I, Gerrero R, et al. BRAF and RAS mutations in human lung cancer and melanoma. Cancer research. 2002;62(23):6997-7000.
101. Hallek M, Bergsagel PL, Anderson KC. Multiple myeloma: increasing evidence for a multistep transformation process. Blood. 1998;91(1):3-21.
102. Janssen JW, Steenvoorden AC, Lyons J, Anger B, Bohlke JU, Bos JL, et al. RAS gene mutations in acute and chronic myelocytic leukemias, chronic myeloproliferative disorders, and myelodysplastic syndromes. Proceedings of the National Academy of Sciences of the United States of America. 1987;84(24):9228-32.
103. Park S, Chapuis N, Tamburini J, Bardet V, Cornillet-Lefebvre P, Willems L, et al. Role of the PI3K/AKT and mTOR signaling pathways in acute myeloid leukemia. Haematologica. 2010;95(5):819-28.
104. Blackburn JS, Liu S, Wilder JL, Dobrinski KP, Lobbardi R, Moore FE, et al. Clonal evolution enhances leukemia-propagating cell frequency in T cell acute lymphoblastic leukemia through Akt/mTORC1 pathway activation. Cancer cell. 2014;25(3):366-78.
105. Cohen PR, Bedikian AY, Kim KB. Appearance of New Vemurafenib-associated Melanocytic Nevi on Normal-appearing Skin: Case Series and a Review of Changing or New Pigmented Lesions in Patients with Metastatic Malignant Melanoma After Initiating Treatment with Vemurafenib. The Journal of clinical and aesthetic dermatology. 2013;6(5):27-37.
106. Lancet JE, Gojo I, Gotlib J, Feldman EJ, Greer J, Liesveld JL, et al. A phase 2 study of the farnesyltransferase inhibitor tipifarnib in poor-risk and elderly patients with previously untreated acute myelogenous leukemia. Blood. 2007;109(4):1387-94.
107. Janku F, Tsimberidou AM, Garrido-Laguna I, Wang X, Luthra R, Hong DS, et al. PIK3CA mutations in patients with advanced cancers treated with PI3K/AKT/mTOR axis inhibitors. Molecular cancer therapeutics. 2011;10(3):558-65.
108. Khan KH, Yap TA, Yan L, Cunningham D. Targeting the PI3K-AKT-mTOR signaling network in cancer. Chinese journal of cancer. 2013;32(5):253-65.
109. Furman RR, Sharman JP, Coutre SE, Cheson BD, Pagel JM, Hillmen P, et al. Idelalisib and rituximab in relapsed chronic lymphocytic leukemia. The New England journal of medicine. 2014;370(11):997-1007.

Page 195
110. Forcello N, Saraiya N. Idelalisib: The First-in-Class Phosphatidylinositol 3-Kinase Inhibitor for Relapsed CLL, SLL, and Indolent NHL. Journal of the advanced practitioner in oncology. 2014;5(6):455-9.
111. Finn OJ. Immuno-oncology: understanding the function and dysfunction of the immune system in cancer. Annals of oncology : official journal of the European Society for Medical Oncology / ESMO. 2012;23 Suppl 8:viii6-9.
112. Highfill SL, Cui Y, Giles AJ, Smith JP, Zhang H, Morse E, et al. Disruption of CXCR2-mediated MDSC tumor trafficking enhances anti-PD1 efficacy. Science translational medicine. 2014;6(237):237ra67.
113. Wang SY, Racila E, Taylor RP, Weiner GJ. NK-cell activation and antibody-dependent cellular cytotoxicity induced by rituximab-coated target cells is inhibited by the C3b component of complement. Blood. 2008;111(3):1456-63.
114. O'Day SJ, Hamid O, Urba WJ. Targeting cytotoxic T-lymphocyte antigen-4 (CTLA-4): a novel strategy for the treatment of melanoma and other malignancies. Cancer. 2007;110(12):2614-27.
115. Wolchok JD, Saenger Y. The mechanism of anti-CTLA-4 activity and the negative regulation of T-cell activation. The oncologist. 2008;13 Suppl 4:2-9.
116. Philips GK, Atkins M. Therapeutic uses of anti-PD-1 and anti-PD-L1 antibodies. International immunology. 2015;27(1):39-46.
117. Terunuma H, Deng X, Dewan Z, Fujimoto S, Yamamoto N. Potential role of NK cells in the induction of immune responses: implications for NK cell-based immunotherapy for cancers and viral infections. International reviews of immunology. 2008;27(3):93-110.
118. Smyth MJ, Cretney E, Kershaw MH, Hayakawa Y. Cytokines in cancer immunity and immunotherapy. Immunological reviews. 2004;202:275-93.
119. Huang V, Hepper D, Anadkat M, Cornelius L. Cutaneous toxic effects associated with vemurafenib and inhibition of the BRAF pathway. Archives of dermatology. 2012;148(5):628-33.
120. Dotan E, Aggarwal C, Smith MR. Impact of Rituximab (Rituxan) on the Treatment of B-Cell Non-Hodgkin's Lymphoma. P & T : a peer-reviewed journal for formulary management. 2010;35(3):148-57.
121. Khazir J, Riley DL, Pilcher LA, De-Maayer P, Mir BA. Anticancer agents from diverse natural sources. Natural product communications. 2014;9(11):1655-69.
122. Kingston DG. The shape of things to come: structural and synthetic studies of taxol and related compounds. Phytochemistry. 2007;68(14):1844-54.

Page 196
123. George SK, Rajesh R, Kumar SS, Sulekha B, Balaram P. A polyherbal ayurvedic drug--Indukantha Ghritha as an adjuvant to cancer chemotherapy via immunomodulation. Immunobiology. 2008;213(8):641-9.
124. Caliceti P, Salmaso S, Bersani S. Polysaccharide-Based Anticancer Prodrugs. In: Reddy LH, Couvreur P, editors. Macromolecular Anticancer Therapeutics: Springer New York; 2010. p. 163-6.
125. Aravind SR, Joseph MM, Varghese S, Balaram P, Sreelekha TT. Antitumor and immunopotentiating activity of polysaccharide PST001 isolated from the seed kernel of Tamarindus indica: an in vivo study in mice. TheScientificWorldJournal. 2012;2012:361382.
126. Atashrazm F, Lowenthal RM, Woods GM, Holloway AF, Dickinson JL. Fucoidan and Cancer: A Multifunctional Molecule with Anti-Tumor Potential. Marine drugs. 2015;13(4):2327-46.
127. Jimenez-Escrig A, Goni Cambrodon I. Nutritional evaluation and physiological effects of edible seaweeds. Archivos latinoamericanos de nutricion. 1999;49(2):114-20.
128. Irhimeh M.R. Clinical haemopoietic implications of fucoidan treatment. Australia: University of Tasmania; 2008.
129. Vasseur E. Chemical studies on the jelly coat of the sea-urchin egg. Acta Chemistry Scandinavia. 1948;2:900-13.
130. Mulloy B, Ribeiro A, Alves A, Vieira R, Mourao P. Sulfated fucans from echinoderms have a regular tetrasaccharide repeating unit defined by specific patterns of sulfation at the O-2 and O-4 positions. J Biol Chem. 1994(269):22113-23.
131. Ribeiro A, Vieira R, Mourao P, Mulloy B. A sulfated a-L-fucan from sea cucumber. Carbohydrate Research. 1994; 255:225-40.
132. Bo Li B, Lu F, Wei X, Zhao R. Fucoidan: Structure and Bioactivity. Molecules (Basel, Switzerland). 2008;13:16711695.
133. Mak WWF. Extraction, Characterization and Antioxidant Activity of Fucoidan from New Zealand Undaria pinnatifida (Harvey) Suringar: Auckland University of Technology; 2012.
134. Frenette P, Weiss L. Sulfated glycans induce rapid hematopoietic progenitor cell mobilization: evidence for selectin dependent and independent mechanisms. Blood. 2000;96:2460-8.
135. Lee JB, Hayashi K, Hashimoto M, Nakano T, Hayashi T. Novel antiviral fucoidan from sporophyll of Undaria pinnatifida (Mekabu). Chemical & pharmaceutical bulletin (Tokyo). 2004;52(9):1091-4.
136. Fitton JH. Therapies from fucoidan; multifunctional marine polymers. Marine drugs. 2011;9(10):1731-60.

Page 197
137. Mabeau S, Kloareg B, Joseleau J. Fractionation and analysis of fucans from brown algae. Phytochemistry. 1990;29:2441-5.
138. Black WAP. The seasonal variation in the combined L-fucose content of the common British Laminariaceae and fucaceae. J Sci Food Agr. 1954;5(9):445-8.
139. Kloareg B, Demarty M, Mabeau S. Polyanionic characteristic of purified sulphated homofucans from brown algae. International journal of biological macromolecules. 1986;8:380-6.
140. Curiel D, Bellemo G, Marzocchi M, Scattolin M, Parisi G. Distribution of introduced Japanese macroalgae Undaria pinnatifida, Sargassum muticum (Phaeophyta) and Antithamnion pectinatum (Rhodophyta) in the Lagoon ofVenice. Hydrobiologia. 1998;385:17-22.
141. Castric-Fey A, Beaupoil C, Bouchain J, Pradier E, L’Hardy-Halos M. The introduced alga Undaria pinnatifida (Laminariales, Alariaceae) in the rocky shore ecosystem of the St. Malo area: growth rate and longevity of the sporophyte. Botanica Marina. 1999;42:83-96.
142. Fletcher R, Manfredi C. The occurrence of Undaria pinnatifida (Phaeophyceae, Laminariales) on the south coast of England. Botanica Marina. 1995;38:355–8.
143. Hay C, Luckens P. The Asian kelp Undaria pinnatifida (Phaeophyta: Laminariales) found in a New Zealand Harbour. New Zealand Journal of Botany. 1987;25:329-32.
144. Casas G, Piriz M. Surveys of Undaria pinnatifida (Laminariales, Phaeophyta) in Golfo Nuevo, Argentina. Hydrobiologia. 1996; 326/327:231–15.
145. Campbell S, Bite J, Burridge T. Seasonal patterns in the photosynthetic capacity, tissue pigment, and nutrient content of different developmental stages of Undaria pinnatifida (Phaeophyta: Laminariales) in Port Phillip Bay, South-Eastern Australia. Botanica Marina. 1999;42:231–41.
146. Sanderson J. A preliminary survey of the introduced macroalga, Undaria pinnatifida (Harvey) Suringar on the east coast of Tasmania. Botanica Marina. 1990;33:153–7.
147. Silchenko AS, Kusaykin MI, Kurilenko VV, Zakharenko AM, Isakov VV, Zaporozhets TS, et al. Hydrolysis of fucoidan by fucoidanase isolated from the marine bacterium, Formosa algae. Marine drugs. 2013;11(7):2413-30.
148. Irhimeh MR, Fitton JH, Lowenthal RM, Kongtawelert P. A quantitative method to detect fucoidan in human plasma using a novel antibody. Methods and findings in experimental and clinical pharmacology. 2005;27(10):705-10.
149. Tokita Y, Nakajima K, Mochida H, Iha M, Nagamine T. Development of a fucoidan-specific antibody and measurement of fucoidan in serum and urine by sandwich ELISA. Bioscience, biotechnology, and biochemistry. 2010;74(2):350-7.

Page 198
150. Deux JF, Meddahi-Pelle A, Le Blanche AF, Feldman LJ, Colliec-Jouault S, Bree F, et al. Low molecular weight fucoidan prevents neointimal hyperplasia in rabbit iliac artery in-stent restenosis model. Arteriosclerosis, thrombosis, and vascular biology. 2002;22(10):1604-9.
151. Kimura R, Rokkaku T, Takeda S, Senba M, Mori N. Cytotoxic effects of fucoidan nanoparticles against osteosarcoma. Marine drugs. 2013;11(11):4267-78.
152. Thelen T, Hao Y, Medeiros AI, Curtis JL, Serezani CH, Kobzik L, et al. The class A scavenger receptor, macrophage receptor with collagenous structure, is the major phagocytic receptor for Clostridium sordellii expressed by human decidual macrophages. Journal of immunology (Baltimore, Md : 1950). 2010;185(7):4328-35.
153. Yamasaki Y, Yamasaki M, Tachibana H, Yamada K. Important role of beta1-integrin in fucoidan-induced apoptosis via caspase-8 activation. Bioscience, biotechnology, and biochemistry. 2012;76(6):1163-8.
154. Ding Z, Issekutz TB, Downey GP, Waddell TK. L-selectin stimulation enhances functional expression of surface CXCR4 in lymphocytes: implications for cellular activation during adhesion and migration. Blood. 2003;101(11):4245-52.
155. Aisa Y, Miyakawa Y, Nakazato T, Shibata H, Saito K, Ikeda Y, et al. Fucoidan induces apoptosis of human HS-sultan cells accompanied by activation of caspase-3 and down-regulation of ERK pathways. Am J Hematol. 2005;78(1):7-14.
156. Zhu XD, Zhuang Y, Ben JJ, Qian LL, Huang HP, Bai H, et al. Caveolae-dependent endocytosis is required for class A macrophage scavenger receptor-mediated apoptosis in macrophages. The Journal of biological chemistry. 2011;286(10):8231-9.
157. Kim M, Joo H. Immunostimulatory effects of fucoidan on bone marrow-derived dendritic cells. Immunology Letters. 2008;115(2):138-43.
158. Zhao X, Xue C, Cai Y, Wang D, Fang Y. The study of antioxidant activities of fucoidan from Laminaria japonica. High Technology Letters. 2005;11:91-4.
159. Kwak JY. Fucoidan as a marine anticancer agent in preclinical development. Marine drugs. 2014;12(2):851-70.
160. Zhang Z, Teruya K, Eto H, Shirahata S. Fucoidan extract induces apoptosis in MCF-7 cells via a mechanism involving the ROS-dependent JNK activation and mitochondria-mediated pathways. PloS one. 2011;6(11):e27441.
161. Riou D, Colliec-Jouault S, Pinczon du Sel D, Bosch S, Siavoshian S, Le Bert V, et al. Antitumor and antiproliferative effects of a fucan extracted from ascophyllum nodosum against a non-small-cell bronchopulmonary carcinoma line. Anticancer research. 1996;16(3a):1213-8.
162. Moreau D, Thomas-Guyon H, Jacquot C, Jugé M, Culioli G, Ortalo-Magné A, et al. An extract from the brown alga Bifurcaria bifurcata induces irreversible arrest of cell proliferation

Page 199
in a non-small-cell bronchopulmonary carcinoma line. Journal of applied phycology. 2006;18:87-93.
163. Boo HJ, Hong JY, Kim SC, Kang JI, Kim MK, Kim EJ, et al. The anticancer effect of fucoidan in PC-3 prostate cancer cells. Marine drugs. 2013;11(8):2982-99.
164. Banafa AM, Roshan S, Liu YY, Chen HJ, Chen MJ, Yang GX, et al. Fucoidan induces G1 phase arrest and apoptosis through caspases-dependent pathway and ROS induction in human breast cancer MCF-7 cells. Journal of Huazhong University of Science and Technology Medical sciences = Hua zhong ke ji da xue xue bao Yi xue Ying De wen ban = Huazhong keji daxue xuebao Yixue Yingdewen ban. 2013;33(5):717-24.
165. Haneji K, Matsuda T, Tomita M, Kawakami H, Ohshiro K, Uchihara JN, et al. Fucoidan extracted from Cladosiphon okamuranus Tokida induces apoptosis of human T-cell leukemia virus type 1-infected T-cell lines and primary adult T-cell leukemia cells. Nutrition and cancer. 2005;52(2):189-201.
166. Cho TM, Kim WJ, Moon SK. AKT signaling is involved in fucoidan-induced inhibition of growth and migration of human bladder cancer cells. Food Chem Toxicol. 2014;64:344-52.
167. Kim EJ, Park SY, Lee JY, Park JH. Fucoidan present in brown algae induces apoptosis of human colon cancer cells. BMC gastroenterology. 2010;10.
168. Yamasaki-Miyamoto Y, Yamasaki M, Tachibana H, Yamada K. Fucoidan induces apoptosis through activation of caspase-8 on human breast cancer MCF-7 cells. J Agric Food Chem. 2009;57(18):8677-82.
169. Fukahori S, Yano H, Akiba J, Ogasawara S, Momosaki S, Sanada S, et al. Fucoidan, a major component of brown seaweed, prohibits the growth of human cancer cell lines in vitro. Mol Med Rep. 2008;1(4):537-42.
170. Jin JO, Song MG, Kim YN, Park JI, Kwak JY. The mechanism of fucoidan-induced apoptosis in leukemic cells: involvement of ERK1/2, JNK, glutathione, and nitric oxide. Mol Carcinog. 2010;49(8):771-82.
171. Boo H, Hyun J, Kim S, Kang J, Kim M, Kim S, et al. Fucoidan from Undaria pinnatifida Induces Apoptosis in A549 Human Lung Carcinoma Cells. Phytotherapy Research. 2011;25(7):1082-6.
172. Costa LS, Telles CB, Oliveira RM, Nobre LT, Dantas-Santos N, Camara RB, et al. Heterofucan from Sargassum filipendula induces apoptosis in HeLa cells. Marine drugs. 2011;9(4):603-14.
173. Yang L, Wang P, Wang H, Li Q, Teng H, Liu Z, et al. Fucoidan derived from Undaria pinnatifida induces apoptosis in human hepatocellular carcinoma SMMC-7721 cells via the ROS-mediated mitochondrial pathway. Marine drugs. 2013;11(6):1961-76.

Page 200
174. Zhang Z, Teruya K, Eto H, Shirahata S. Induction of apoptosis by low-molecular-weight fucoidan through calcium- and caspase-dependent mitochondrial pathways in MDA-MB-231 breast cancer cells. Bioscience, biotechnology, and biochemistry. 2013;77(2):235-42.
175. Koyanagi S, Tanigawa N, Nakagawa H, Soeda S, Shimeno H. Oversulfation of fucoidan enhances its anti-angiogenic and antitumor activities. Biochemical pharmacology. 2003;65(2):173-9.
176. Xue M, Ge Y, Zhang J, Wang Q, Hou L, Liu Y, et al. Anticancer properties and mechanisms of fucoidan on mouse breast cancer in vitro and in vivo. PloS one. 2012;7:e43483.
177. Coombe DR, Parish CR, Ramshaw IA, Snowden JM. Analysis of the inhibition of tumour metastasis by sulphated polysaccharides. International journal of cancer Journal international du cancer. 1987;39(1):82-8.
178. Soeda S, Ishida S, Shimeno H, Nagamatsu A. Inhibitory effect of oversulfated fucoidan on invasion through reconstituted basement membrane by murine Lewis lung carcinoma. Japanese journal of cancer research : Gann. 1994;85(11):1144-50.
179. Liu JM, Bignon J, Haroun-Bouhedja F, Bittoun P, Vassy J, Fermandjian S, et al. Inhibitory effect of fucoidan on the adhesion of adenocarcinoma cells to fibronectin. Anticancer research. 2005;25(3b):2129-33.
180. Lee H, Kim JS, Kim E. Fucoidan from seaweed Fucus vesiculosus inhibits migration and invasion of human lung cancer cell via PI3K-Akt-mTOR pathways. PloS one. 2012;7(11):e50624.
181. Cumashi A, Ushakova NA, Preobrazhenskaya ME, D'Incecco A, Piccoli A, Totani L, et al. A comparative study of the anti-inflammatory, anticoagulant, antiangiogenic, and antiadhesive activities of nine different fucoidans from brown seaweeds. Glycobiology. 2007;17(5):541-52.
182. Patel MK, Mulloy B, Gallagher KL, O'Brien L, Hughes AD. The antimitogenic action of the sulphated polysaccharide fucoidan differs from heparin in human vascular smooth muscle cells. Thrombosis and haemostasis. 2002;87(1):149-54.
183. Ale MT, Maruyama H, Tamauchi H, Mikkelsen JD, Meyer AS. Fucoidan from Sargassum sp. and Fucus vesiculosus reduces cell viability of lung carcinoma and melanoma cells in vitro and activates natural killer cells in mice in vivo. International journal of biological macromolecules. 2011;49(3):331-6.
184. Azuma K, Ishihara T, Nakamoto H, Amaha T, Osaki T, Tsuka T, et al. Effects of oral administration of fucoidan extracted from Cladosiphon okamuranus on tumor growth and survival time in a tumor-bearing mouse model. Marine drugs. 2012;10(10):2337-48.
185. Shimizu J, Wada-Funada1 U, Mano1 M, Matahira Y, Kawaguchi M, Wada M. Proportion of Murine Cytotoxic T Cells is Increased by High Molecular-Weight Fucoidan Extracted from Okinawa mozuku (Cladosiphon okamuranus). Journal of Health Science. 2005;51:394-7.

Page 201
186. Hu Y, Cheng SC, Chan KT, Ke Y, Xue B, Sin FW, et al. Fucoidin enhances dendritic cell-mediated T-cell cytotoxicity against NY-ESO-1 expressing human cancer cells. Biochemical and biophysical research communications. 2010;392(3):329-34.
187. Jin JO, Zhang W, Du JY, Wong KW, Oda T, Yu Q. Fucoidan can function as an adjuvant in vivo to enhance dendritic cell maturation and function and promote antigen-specific T cell immune responses. PloS one. 2014;9(6):e99396.
188. Teas J, Harbison ML, Gelman RS. Dietary seaweed (Laminaria) and mammary carcinogenesis in rats. Cancer research. 1984;44(7):2758-61.
189. Wakefield LM, Roberts AB. TGF-beta signaling: positive and negative effects on tumorigenesis. Current opinion in genetics & development. 2002;12(1):22-9.
190. Hsu HY, Lin TY, Hwang PA, Tseng LM, Chen RH, Tsao SM, et al. Fucoidan induces changes in the epithelial to mesenchymal transition and decreases metastasis by enhancing ubiquitin-dependent TGFbeta receptor degradation in breast cancer. Carcinogenesis. 2013;34(4):874-84.
191. Humphrey PA, Wong AJ, Vogelstein B, Zalutsky MR, Fuller GN, Archer GE, et al. Anti-synthetic peptide antibody reacting at the fusion junction of deletion-mutant epidermal growth factor receptors in human glioblastoma. Proceedings of the National Academy of Sciences of the United States of America. 1990;87(11):4207-11.
192. Lee NY, Ermakova SP, Zvyagintseva TN, Kang KW, Dong Z, Choi HS. Inhibitory effects of fucoidan on activation of epidermal growth factor receptor and cell transformation in JB6 Cl41 cells. Food Chem Toxicol. 2008;46(5):1793-800.
193. Ikeguchi M, Yamamoto M, Arai Y, Maeta Y, Ashida K, Katano K, et al. Fucoidan reduces the toxicities of chemotherapy for patients with unresectable advanced or recurrent colorectal cancer. Oncology letters. 2011;2(2):319-22.
194. Lv J, Xiao Q, Wang L, Liu X, Wang X, Yang Z, et al. Fucoidan prevents multiple myeloma cell escape from chemotherapy-induced drug cytotoxicity. Fitoterapia. 2013;84:257-63.
195. Vishchuk OS, Ermakova SP, Zvyagintseva TN. The effect of sulfated (1-->3)-alpha-l-fucan from the brown alga Saccharina cichorioides Miyabe on resveratrol-induced apoptosis in colon carcinoma Cells. Marine drugs. 2013;11(1):194-212.
196. Zhang Z, Teruya K, Yoshida T, Eto H, Shirahata S. Fucoidan extract enhances the anti-cancer activity of chemotherapeutic agents in MDA-MB-231 and MCF-7 breast cancer cells. Marine drugs. 2013;11(1):81-98.
197. Oh B, Kim J. Anticancer effect of fucoidan in combination with tyrosine kinase inhibitor lapatinib. Evid Based Complement Alternat Med. 2014;2014:865375.
198. Collins SJ, Gallo RC, Gallagher RE. Continuous growth and differentiation of human myeloid leukaemic cells in suspension culture. Nature. 1977;270(5635):347-9.

Page 202
199. Lanotte M, Martin-Thouvenin V, Najman S, Balerini P, Valensi F, Berger R. NB4, a maturation inducible cell line with t(15;17) marker isolated from a human acute promyelocytic leukemia (M3). Blood. 1991;77(5):1080-6.
200. Andersson LC, Nilsson K, Gahmberg CG. K562--a human erythroleukemic cell line. International journal of cancer Journal international du cancer. 1979;23(2):143-7.
201. Koeffler HP, Golde DW. Acute myelogenous leukemia: a human cell line responsive to colony-stimulating activity. Science (New York, NY). 1978;200(4346):1153-4.
202. Asou H, Tashiro S, Hamamoto K, Otsuji A, Kita K, Kamada N. Establishment of a human acute myeloid leukemia cell line (Kasumi-1) with 8;21 chromosome translocation. Blood. 1991;77(9):2031-6.
203. Wright SC, Bonavida B. YAC-1 variant clones selected for resistance to natural killer cytotoxic factors are also resistant to natural killer cell-mediated cytotoxicity. Proceedings of the National Academy of Sciences of the United States of America. 1983;80(6):1688-92.
204. Castro J, Ribo M, Navarro S, Nogues MV, Vilanova M, Benito A. A human ribonuclease induces apoptosis associated with p21WAF1/CIP1 induction and JNK inactivation. BMC cancer. 2011;11:9-21.
205. Kanemura Y, Mori H, Kobayashi S, Islam O, Kodama E, Yamamoto A, et al. Evaluation of in vitro proliferative activity of human fetal neural stem/progenitor cells using indirect measurements of viable cells based on cellular metabolic activity. Journal of neuroscience research. 2002;69(6):869-79.
206. Schutte B, Nuydens R, Geerts H, Ramaekers F. Annexin V binding assay as a tool to measure apoptosis in differentiated neuronal cells. Journal of neuroscience methods. 1998;86(1):63-9.
207. Schreiber E, Matthias P, Muller MM, Schaffner W. Rapid detection of octamer binding proteins with 'mini-extracts', prepared from a small number of cells. Nucleic acids research. 1989;17(15):6419.
208. Bradford MM. A rapid and sensitive method for the quantitation of microgram quantities of protein utilizing the principle of protein-dye binding. Analytical biochemistry. 1976;72:248-54.
209. DuBois M, Gilles KA, Hamilton JK, Rebers PA, Smith F. Colorimetric Method for Determination of Sugars and Related Substances. Analytical Chemistry,. 1956;28(3):350-6.
210. Dodgson KS. Determination of inorganic sulphate in studies on the enzymic and non-enzymic hydrolysis of carbohydrate and other sulphate esters. The Biochemical journal. 1961;78:312-9.
211. Dodgson KS, Price RG. A note on the determination of the ester sulphate content of sulphated polysaccharides. The Biochemical journal. 1962;84:106-10.

Page 203
212. Bruce W, Zoecklein., Kenneth C, Fugelsang., Barry H, Gump., Fred S, Nury. Wine analysis and production: Springer Science+Business Media New York 1995.
213. Jiménez-Escrig A, Jiménez-Jiménez I, Pulido R, Saura-Calixto F. Antioxidant activity of fresh and processed edible seaweeds. J Sci Food Agr. 2001;81(5):530-4.
214. Zhang Q, Zhang J, Shen J, Silva A, Dennis D, A., Barrow C, J. A Simple 96-Well Microplate Method for Estimation of Total Polyphenol Content in Seaweeds. J Appl Phycol. 2006;18(3-5):445-50.
215. Morvai-Vitányi M, Molnár-Perl I, Knausz D, Sass P. Simultaneous GC derivatization and quantification of acids and sugars. Chromatographia. 1993;36(1):204-6.
216. American Veterinary Medical Association. AVMA guidelines on euthanasia, 2013 update [July 2015]. Available from: http://www.avma.org/issues/animal_welfare/euthanasia.pdf.
217. Roth V. Doubling time 2006 [10 Jan 2015]. Available from: http://www.doubling-time.com/compute.php.
218. Micallef IN, Rohatiner AZ, Carter M, Boyle M, Slater S, Amess JA, et al. Long-term outcome of patients surviving for more than ten years following treatment for acute leukaemia. Br J Haematol. 2001;113:443-5.
219. Senderowicz AM. Flavopiridol: the first cyclin-dependent kinase inhibitor in human clinical trials. Investigational new drugs. 1999;17(3):313-20.
220. Park HS, Kim GY, Nam TJ, Deuk Kim N, Hyun Choi Y. Antiproliferative activity of fucoidan was associated with the induction of apoptosis and autophagy in AGS human gastric cancer cells. Journal of food science. 2011;76(3):T77-83.
221. Atashrazm F, Lowenthal RM, Woods GM, Holloway AF, Karpiniec SS, Dickinson JL. Fucoidan Suppresses the Growth of Human Acute Promyelocytic Leukemia Cells In Vitro and In Vivo. Journal of cellular physiology. 2015.
222. U.S. Food and Drug Administration. Guidance for Industry: Pyrogen and Endotoxins Testing: Questions and Answers 2012 [10 Jan 2015]. Available from: http://www.fda.gov/drugs/guidancecomplianceregulatoryinformation/guidances/ucm314718.htm.
223. Rabinovitch P. Introduction to cell cycle analysis: Phoenix Flow Systems, Inc.; [cited 2015 27.4.15]. Available from: http://www.phnxflow.com/Introduction%20to%20Cell%20Cycle%20Analysis.pdf.
224. Ferreira AK, Meneguelo R, Pereira A, Mendonca Filho O, Chierice GO, Maria DA. Anticancer effects of synthetic phosphoethanolamine on Ehrlich ascites tumor: an experimental study. Anticancer research. 2012;32(1):95-104.

Page 204
225. Vermes I, Haanen C, Steffens-Nakken H, Reutelingsperger C. A novel assay for apoptosis. Flow cytometric detection of phosphatidylserine expression on early apoptotic cells using fluorescein labelled Annexin V. Journal of immunological methods. 1995;184(1):39-51.
226. Hingorani R, Deng J, Elia J, McIntyre C, Mittar D. Detection of Apoptosis Using the BD Annexin V FITC Assay on the BD FACSVerse™ System. In: Biosciences. B, editor. BD Biosciences2011. p. 2.
227. Haroun-Bouhedja F, Ellouali M, Sinquin C, Boisson-Vidal C. Relationship between sulfate groups and biological activities of fucans. Thrombosis research. 2000;100(5):453-9.
228. Ale MT, Mikkelsen JD, Meyer AS. Important determinants for fucoidan bioactivity: a critical review of structure-function relations and extraction methods for fucose-containing sulfated polysaccharides from brown seaweeds. Marine drugs. 2011;9(10):2106-30.
229. Cho ML, Lee BY, You SG. Relationship between oversulfation and conformation of low and high molecular weight fucoidans and evaluation of their in vitro anticancer activity. Molecules (Basel, Switzerland). 2010;16(1):291-7.
230. Codee JD, Christina AE, Walvoort MT, Overkleeft HS, van der Marel GA. Uronic acids in oligosaccharide and glycoconjugate synthesis. Topics in current chemistry. 2011;301:253-89.
231. Garron ML, Cygler M. Structural and mechanistic classification of uronic acid-containing polysaccharide lyases. Glycobiology. 2010;20(12):1547-73.
232. Rosenberg RD, Lam L. Correlation between structure and function of heparin. Proceedings of the National Academy of Sciences of the United States of America. 1979;76(3):1218-22.
233. Adibekian A, Bindschadler P, Timmer MS, Noti C, Schutzenmeister N, Seeberger PH. De novo synthesis of uronic acid building blocks for assembly of heparin oligosaccharides. Chemistry (Weinheim an der Bergstrasse, Germany). 2007;13(16):4510-22.
234. Rosenberg RD, Armand G, Lam L. Structure-function relationships of heparin species. Proceedings of the National Academy of Sciences of the United States of America. 1978;75(7):3065-9.
235. Giraux JL, Tapon-Bretaudiere J, Matou S, Fischer AM. Fucoidan, as heparin, induces tissue factor pathway inhibitor release from cultured human endothelial cells. Thrombosis and haemostasis. 1998;80(4):692-5.
236. Zhuang C, Itoh H, Mizuno T, Ito H. Antitumor active fucoidan from the brown seaweed, umitoranoo (Sargassum thunbergii). Bioscience, biotechnology, and biochemistry. 1995;59(4):563-7.
237. Vijayabaskar P, Shiyamala V. Antioxidant properties of seaweed polyphenol from Turbinaria ornata (Turner) J. Agardh, 1848. Asian Pac J Trop Biomed. 2012;2(1).

Page 205
238. Souza AC, Machado FS, Celes MR, Faria G, Rocha LB, Silva JS, et al. Mitochondrial damage as an early event of monensin-induced cell injury in cultured fibroblasts L929. Journal of veterinary medicine A, Physiology, pathology, clinical medicine. 2005;52(5):230-7.
239. Park WH, Lee MS, Park K, Kim ES, Kim BK, Lee YY. Monensin-mediated growth inhibition in acute myelogenous leukemia cells via cell cycle arrest and apoptosis. International journal of cancer Journal international du cancer. 2002;101(3):235-42.
240. Lee HE, Choi ES, Shin JA, Lee SO, Park KS, Cho NP, et al. Fucoidan induces caspase-dependent apoptosis in MC3 human mucoepidermoid carcinoma cells. Experimental and therapeutic medicine. 2014;7(1):228-32.
241. Gillham CM, Reynolds J, Hollywood D. Predicting the response of localised oesophageal cancer to neo-adjuvant chemoradiation. World journal of surgical oncology. 2007;5:97.
242. Hyun JH, Kim SC, Kang JI, Kim MK, Boo HJ, Kwon JM, et al. Apoptosis inducing activity of fucoidan in HCT-15 colon carcinoma cells. Biol Pharm Bull. 2009;32(10):1760-4.
243. Osaki M, Oshimura M, Ito H. PI3K-Akt pathway: its functions and alterations in human cancer. Apoptosis : an international journal on programmed cell death. 2004;9:667-76.
244. Gallay N, Dos Santos C, Cuzin L, Bousquet M, Simmonet Gouy V, Chaussade C, et al. The level of AKT phosphorylation on threonine 308 but not on serine 473 is associated with high-risk cytogenetics and predicts poor overall survival in acute myeloid leukaemia. Leukemia. 2009;23(6):1029-38.
245. Zhuang S, Schnellmann RG. A death-promoting role for extracellular signal-regulated kinase. The Journal of pharmacology and experimental therapeutics. 2006;319(3):991-7.
246. Xiao Y, Zou P, Wang J, Song H, Zou J, Liu L. Lower phosphorylation of p38 MAPK blocks the oxidative stress-induced senescence in myeloid leukemic CD34(+)CD38 (-) cells. J Huazhong Univ Sci Technolog Med Sci. 2012;32(3):328-33.
247. Park HS, Hwang HJ, Kim GY, Cha HJ, Kim WJ, Kim ND, et al. Induction of apoptosis by fucoidan in human leukemia U937 cells through activation of p38 MAPK and modulation of Bcl-2 family. Marine drugs. 2013;11(7):2347-64.
248. Namvar F, Mohamad R, Baharara J, Zafar-Balanejad S, Fargahi F, Rahman HS. Antioxidant, antiproliferative, and antiangiogenesis effects of polyphenol-rich seaweed (Sargassum muticum). BioMed research international. 2013;2013:604787.
249. Mak W, Wang SK, Liu T, Hamid N, Li Y, Lu J, et al. Anti-Proliferation Potential and Content of Fucoidan Extracted from Sporophyll of New Zealand Undaria pinnatifida. Frontiers in nutrition. 2014;1:9.
250. Miao HQ, Elkin M, Aingorn E, Ishai-Michaeli R, Stein CA, Vlodavsky I. Inhibition of heparanase activity and tumor metastasis by laminarin sulfate and synthetic phosphorothioate

Page 206
oligodeoxynucleotides. International journal of cancer Journal international du cancer. 1999;83(3):424-31.
251. Kotake-Nara E, Sugawara T, Nagao A. Antiproliferative effect of neoxanthin and fucoxanthin on cultured cells. Fisheries Science. 2005;71(2):459-61.
252. Reddy BS, Cohen LA, McCoy GD, Hill P, Weisburger JH, Wynder EL. Nutrition and its relationship to cancer. Advances in cancer research. 1980;32:237-345.
253. Teas J, Vena S, Cone DL, Irhimeh M. The consumption of seaweed as a protective factor in the etiology of breast cancer: proof of principle. Journal of applied phycology. 2013;25(3):771-9.
254. Kotzsch M, Bernt K, Friedrich K, Luther E, Albrecht S, Gatzweiler A, et al. Prognostic relevance of tumour cell-associated uPAR expression in invasive ductal breast carcinoma. Histopathology. 2010;57(3):461-71.
255. Furusawa E, Furusawa S, Chou SC. Antileukemic activity of Viva-Natural, a dietary seaweed extract, on Rauscher murine leukemia in comparison with anti-HIV agents, azidothymidine, dextran sulfate and pentosan polysulfate. Cancer letters. 1991;56(3):197-205.
256. Harada H, Kamei Y. Selective cytotoxicity of marine algae extracts to several human leukemic cell lines. Cytotechnology. 1997;25(1-3):213-9.
257. Goldstein BD, Witz G. Free radicals and carcinogenesis. Free radical research communications. 1990;11(1-3):3-10.
258. Ahmed S, Othman NH. Honey as a potential natural anticancer agent: a review of its mechanisms. Evidence-based complementary and alternative medicine : eCAM. 2013;2013:829070.
259. Rocha de Souza MC, Marques CT, Guerra Dore CM, Ferreira da Silva FR, Oliveira Rocha HA, Leite EL. Antioxidant activities of sulfated polysaccharides from brown and red seaweeds. Journal of applied phycology. 2007;19(2):153-60.
260. Omar HM, Saadeldin HM, Badary MS, Al-khatib BY, Abdelgaffar SK. The immunomodulating and antioxidant activity of fucoidan on the splenic tissue of rats treated with cyclosporine A. The Journal of Basic & Applied Zoology. 2013;66(5):243-54.
261. Maruyama H, Tamauchi H, Iizuka M, Nakano T. The role of NK cells in antitumor activity of dietary fucoidan from Undaria pinnatifida sporophylls (Mekabu). Planta medica. 2006;72(15):1415-7.
262. Furusawa E, Furusawa S. Anticancer activity of a natural product, viva-natural, extracted from Undaria pinnantifida on intraperitoneally implanted Lewis lung carcinoma. Oncology. 1985;42(6):364-9.

Page 207
263. Yang M, Ma C, Sun J, Shao Q, Gao W, Zhang Y, et al. Fucoidan stimulation induces a functional maturation of human monocyte-derived dendritic cells. International immunopharmacology. 2008;8(13-14):1754-60.
264. Zhang W, Oda T, Yu Q, Jin JO. Fucoidan from Macrocystis pyrifera has powerful immune-modulatory effects compared to three other fucoidans. Marine drugs. 2015;13(3):1084-104.
265. Michikawa T, Inoue M, Shimazu T, Sawada N, Iwasaki M, Sasazuki S, et al. Seaweed consumption and the risk of thyroid cancer in women: the Japan Public Health Center-based Prospective Study. European journal of cancer prevention : the official journal of the European Cancer Prevention Organisation (ECP). 2012;21(3):254-60.
266. Huang TH, Chiu YH, Chan YL, Chiu YH, Wang H, Huang KC, et al. Prophylactic administration of fucoidan represses cancer metastasis by inhibiting vascular endothelial growth factor (VEGF) and matrix metalloproteinases (MMPs) in Lewis tumor-bearing mice. Marine drugs. 2015;13(4):1882-900.
267. An JJ, Shi KJ, Wei W, Hua FY, Ci YL, Jiang Q, et al. The ROS/JNK/ATF2 pathway mediates selenite-induced leukemia NB4 cell cycle arrest and apoptosis in vitro and in vivo. Cell death & disease. 2013;4:e973.
268. Hampson P, Wang K, Ersvaer E, McCormack E, Schuler J, Fiebig HH, et al. Up-regulation of anti-apoptotic genes confers resistance to the novel anti-leukaemic compound PEP005 in primary AML cells. Oncoscience. 2014;1(8):529-39.
269. Zhang SY, Zhu J, Chen GQ, Du XX, Lu LJ, Zhang Z, et al. Establishment of a human acute promyelocytic leukemia-ascites model in SCID mice. Blood. 1996;87(8):3404-9.
270. Zuo T, Li X, Chang Y, Duan G, Yu L, Zheng R, et al. Dietary fucoidan of Acaudina molpadioides and its enzymatically degraded fragments could prevent intestinal mucositis induced by chemotherapy in mice. Food & function. 2015;6(2):415-22.
271. Maruyama H, Tamauchi H, Hashimoto M, Nakano T. Antitumor activity and immune response of Mekabu fucoidan extracted from Sporophyll of Undaria pinnatifida. In Vivo. 2003;17(3):245-9.
272. Tallman MS, Altman JK. How I treat acute promyelocytic leukemia. Blood. 2009;114(25):5126-35.
273. Patatanian E, Thompson DF. Retinoic acid syndrome: a review. Journal of clinical pharmacy and therapeutics. 2008;33(4):331-8.
274. Specchia G, Lo Coco F, Vignetti M, Avvisati G, Fazi P, Albano F, et al. Extramedullary involvement at relapse in acute promyelocytic leukemia patients treated or not with all-trans retinoic acid: a report by the Gruppo Italiano Malattie Ematologiche dell'Adulto. Journal of clinical oncology : official journal of the American Society of Clinical Oncology. 2001;19(20):4023-8.

Page 208
275. Lobe I, Rigal-Huguet F, Vekhoff A, Desablens B, Bordessoule D, Mounier C, et al. Myelodysplastic syndrome after acute promyelocytic leukemia: the European APL group experience. Leukemia. 2003;17(8):1600-4.
276. Thomas X, Le QH, Fiere D. Anthracycline-related toxicity requiring cardiac transplantation in long-term disease-free survivors with acute promyelocytic leukemia. Annals of hematology. 2002;81(9):504-7.
277. Shen ZX, Chen GQ, Ni JH, Li XS, Xiong SM, Qiu QY, et al. Use of arsenic trioxide (As2O3) in the treatment of acute promyelocytic leukemia (APL): II. Clinical efficacy and pharmacokinetics in relapsed patients. Blood. 1997;89(9):3354-60.
278. Soignet SL, Maslak P, Wang ZG, Jhanwar S, Calleja E, Dardashti LJ, et al. Complete remission after treatment of acute promyelocytic leukemia with arsenic trioxide. The New England journal of medicine. 1998;339(19):1341-8.
279. Miller WH, Jr., Schipper HM, Lee JS, Singer J, Waxman S. Mechanisms of action of arsenic trioxide. Cancer research. 2002;62(14):3893-903.
280. Zhang TD, Chen GQ, Wang ZG, Wang ZY, Chen SJ, Chen Z. Arsenic trioxide, a therapeutic agent for APL. Oncogene. 2001;20(49):7146-53.
281. Calleja EM, Warrell RP, Jr. Differentiating agents in pediatric malignancies: all-trans-retinoic acid and arsenic in acute promyelocytic leukemia. Current oncology reports. 2000;2(6):519-23.
282. Niu C, Yan H, Yu T, Sun HP, Liu JX, Li XS, et al. Studies on treatment of acute promyelocytic leukemia with arsenic trioxide: remission induction, follow-up, and molecular monitoring in 11 newly diagnosed and 47 relapsed acute promyelocytic leukemia patients. Blood. 1999;94(10):3315-24.
283. Zhou GB, Zhang J, Wang ZY, Chen SJ, Chen Z. Treatment of acute promyelocytic leukaemia with all-trans retinoic acid and arsenic trioxide: a paradigm of synergistic molecular targeting therapy. Philos Trans R Soc Lond B Biol Sci. 2007;362(1482):959-71.
284. Alekseyenko TV, Zhanayeva SY, Venediktova AA, Zvyagintseva TN, Kuznetsova TA, Besednova NN, et al. Antitumor and antimetastatic activity of fucoidan, a sulfated polysaccharide isolated from the Okhotsk Sea Fucus evanescens brown alga. Bulletin of experimental biology and medicine. 2007;143(6):730-2.
285. Kang YH, Yi MJ, Kim MJ, Park MT, Bae S, Kang CM, et al. Caspase-independent cell death by arsenic trioxide in human cervical cancer cells: reactive oxygen species-mediated poly(ADP-ribose) polymerase-1 activation signals apoptosis-inducing factor release from mitochondria. Cancer research. 2004;64(24):8960-7.
286. Petrie K, Zelent A, Waxman S. Differentiation therapy of acute myeloid leukemia: past, present and future. Curr Opin Hematol. 2009;16(2):84-91.

Page 209
287. Lu KH, Lee HJ, Huang ML, Lai SC, Ho YL, Chang YS, et al. Synergistic Apoptosis-Inducing Antileukemic Effects of Arsenic Trioxide and Mucuna macrocarpa Stem Extract in Human Leukemic Cells via a Reactive Oxygen Species-Dependent Mechanism. Evidence-based complementary and alternative medicine : eCAM. 2012;2012:921430-44.
288. Fan Y, Chen M, Meng J, Yu L, Tu Y, Wan L, et al. Arsenic trioxide and resveratrol show synergistic anti-leukemia activity and neutralized cardiotoxicity. PloS one. 2014;9(8):e105890.
289. Wang Z, Zhang H, Dai L, Song T, Li P, Liu Y, et al. Arsenic Trioxide and Icariin Show Synergistic Anti-leukemic Activity. Cell biochemistry and biophysics. 2015.
290. Altomare DA, Testa JR. Perturbations of the AKT signaling pathway in human cancer. Oncogene. 2005;24(50):7455-64.
291. Jemal A, Thomas A, Murray T, Thun M. Cancer statistics, 2002. CA: a cancer journal for clinicians. 2002;52(1):23-47.
292. Mann KK, Colombo M, Miller WH, Jr. Arsenic trioxide decreases AKT protein in a caspase-dependent manner. Molecular cancer therapeutics. 2008;7(6):1680-7.
293. Scholz C, Wieder T, Starck L, Essmann F, Schulze-Osthoff K, Dorken B, et al. Arsenic trioxide triggers a regulated form of caspase-independent necrotic cell death via the mitochondrial death pathway. Oncogene. 2005;24(11):1904-13.
294. Xie J, Zhang M, Song YP, Hu K, Ren JJ, Zhang YJ. [Caspase-independent apoptosis induced by arsenic trioxide in human multiple myeloma cell RPMI8226]. Zhongguo shi yan xue ye xue za zhi / Zhongguo bing li sheng li xue hui = Journal of experimental hematology / Chinese Association of Pathophysiology. 2012;20(1):107-11.
295. Chaitanya GV, Steven AJ, Babu PP. PARP-1 cleavage fragments: signatures of cell-death proteases in neurodegeneration. Cell communication and signaling : CCS. 2010;8:31.
296. Lee J, Kim J, Moon C, Kim SH, Hyun JW, Park JW, et al. Radioprotective effects of fucoidan in mice treated with total body irradiation. Phytotherapy research : PTR. 2008;22(12):1677-81.
297. Prebet T, Gore SD. Treatment of acute promyelocytic leukemia for older patients. Journal of the National Comprehensive Cancer Network : JNCCN. 2011;9(3):337-42.
298. de The H, Le Bras M, Lallemand-Breitenbach V. The cell biology of disease: Acute promyelocytic leukemia, arsenic, and PML bodies. The Journal of cell biology. 2012;198(1):11-21.
299. Martin SJ, Bradley JG, Cotter TG. HL-60 cells induced to differentiate towards neutrophils subsequently die via apoptosis. Clin Exp Immunol. 1990;79(3):448-53.
300. Yoshida H, Kitamura K, Tanaka K, Omura S, Miyazaki T, Hachiya T, et al. Accelerated degradation of PML-retinoic acid receptor alpha (PML-RARA) oncoprotein by all-trans-

Page 210
retinoic acid in acute promyelocytic leukemia: possible role of the proteasome pathway. Cancer research. 1996;56(13):2945-8.
301. Spencer TE, Jenster G, Burcin MM, Allis CD, Zhou J, Mizzen CA, et al. Steroid receptor coactivator-1 is a histone acetyltransferase. Nature. 1997;389(6647):194-8.
302. Guidez F, Ivins S, Zhu J, Soderstrom M, Waxman S, Zelent A. Reduced retinoic acid-sensitivities of nuclear receptor corepressor binding to PML- and PLZF-RARalpha underlie molecular pathogenesis and treatment of acute promyelocytic leukemia. Blood. 1998;91(8):2634-42.
303. Zhong S, Muller S, Ronchetti S, Freemont PS, Dejean A, Pandolfi PP. Role of SUMO-1-modified PML in nuclear body formation. Blood. 2000;95(9):2748-52.
304. Zhu J, Lallemand-Breitenbach V, de The H. Pathways of retinoic acid- or arsenic trioxide-induced PML/RARalpha catabolism, role of oncogene degradation in disease remission. Oncogene. 2001;20(49):7257-65.
305. Ying M, Zhou X, Zhong L, Lin N, Jing H, Luo P, et al. Bortezomib sensitizes human acute myeloid leukemia cells to all-trans-retinoic acid-induced differentiation by modifying the RARalpha/STAT1 axis. Molecular cancer therapeutics. 2013;12(2):195-206.
306. Adamson PC. All-Trans-Retinoic Acid Pharmacology and Its Impact on the Treatment of Acute Promyelocytic Leukemia. The oncologist. 1996;1(5):305-14.
307. Prudovsky I, Popov K, Akimov S, Serov S, Zelenin A, Meinhardt G, et al. Antisense CD11b integrin inhibits the development of a differentiated monocyte/macrophage phenotype in human leukemia cells. European journal of cell biology. 2002;81(1):36-42.
308. Estey E, Garcia-Manero G, Ferrajoli A, Faderl S, Verstovsek S, Jones D, et al. Use of all-trans retinoic acid plus arsenic trioxide as an alternative to chemotherapy in untreated acute promyelocytic leukemia. Blood. 2006;107(9):3469-73.
309. Camacho LH, Soignet SL, Chanel S, Ho R, Heller G, Scheinberg DA, et al. Leukocytosis and the retinoic acid syndrome in patients with acute promyelocytic leukemia treated with arsenic trioxide. Journal of clinical oncology : official journal of the American Society of Clinical Oncology. 2000;18(13):2620-5.
310. Guo XH, Yasen H, Jiang M, Hao JP, Abulaiti D, Chen R. [Retinoic acid in treating acute promyelocytic leukemia with hyperleukocytosis and its therapeutic strategy]. Zhongguo shi yan xue ye xue za zhi / Zhongguo bing li sheng li xue hui = Journal of experimental hematology / Chinese Association of Pathophysiology. 2008;16(2):439-41.
311. Chen GQ, Shi XG, Tang W, Xiong SM, Zhu J, Cai X, et al. Use of arsenic trioxide (As2O3) in the treatment of acute promyelocytic leukemia (APL): I. As2O3 exerts dose-dependent dual effects on APL cells. Blood. 1997;89(9):3345-53.
312. Solovjov DA, Pluskota E, Plow EF. Distinct roles for the alpha and beta subunits in the functions of integrin alphaMbeta2. The Journal of biological chemistry. 2005;280(2):1336-45.
Page 211
313. Spangrude GJ, Heimfeld S, Weissman IL. Purification and characterization of mouse hematopoietic stem cells. Science (New York, NY). 1988;241(4861):58-62.
314. Yang L, Zhao H, Li SW, Ahrens K, Collins C, Eckenrode S, et al. Gene expression profiling during all-trans retinoic acid-induced cell differentiation of acute promyelocytic leukemia cells. The Journal of molecular diagnostics : JMD. 2003;5(4):212-21.
315. Kinjo K, Kizaki M, Muto A, Fukuchi Y, Umezawa A, Yamato K, et al. Arsenic trioxide (As2O3)-induced apoptosis and differentiation in retinoic acid-resistant acute promyelocytic leukemia model in hGM-CSF-producing transgenic SCID mice. Leukemia. 2000;14(3):431-8.
316. Kolly C, Suter MM, Muller EJ. Proliferation, cell cycle exit, and onset of terminal differentiation in cultured keratinocytes: pre-programmed pathways in control of C-Myc and Notch1 prevail over extracellular calcium signals. The Journal of investigative dermatology. 2005;124(5):1014-25.
317. Dos Santos GA, Kats L, Pandolfi PP. Synergy against PML-RARa: targeting transcription, proteolysis, differentiation, and self-renewal in acute promyelocytic leukemia. The Journal of experimental medicine. 2013;210(13):2793-802.
318. Kim BS, Kang HJ, Park JY, Lee J. Fucoidan promotes osteoblast differentiation via JNK- and ERK-dependent BMP2-Smad 1/5/8 signaling in human mesenchymal stem cells. Experimental & molecular medicine. 2015;47:e128.
319. Coffer PJ, Koenderman L, de Groot RP. The role of STATs in myeloid differentiation and leukemia. Oncogene. 2000;19(21):2511-22.
320. Byon YY, Kim MH, Yoo ES, Hwang KK, Jee Y, Shin T, et al. Radioprotective effects of fucoidan on bone marrow cells: improvement of the cell survival and immunoreactivity. Journal of veterinary science. 2008;9(4):359-65.
321. Irhimeh MR, Fitton JH, Lowenthal RM. Fucoidan ingestion increases the expression of CXCR4 on human CD34+ cells. Experimental hematology. 2007;35(6):989-94.
322. Nakajima H, Ihle JN. Granulocyte colony-stimulating factor regulates myeloid differentiation through CCAAT/enhancer-binding protein epsilon. Blood. 2001;98(4):897-905.
323. Liu J, Bi G, Wen P, Yang W, Ren X, Tang T, et al. Down-regulation of CD44 contributes to the differentiation of HL-60 cells induced by ATRA or HMBA. Cellular & molecular immunology. 2007;4(1):59-63.
324. Elliott VA, Rychahou P, Zaytseva YY, Evers BM. Activation of c-Met and upregulation of CD44 expression are associated with the metastatic phenotype in the colorectal cancer liver metastasis model. PloS one. 2014;9(5):e97432.
325. Rego EM, De Santis GC. Differentiation syndrome in promyelocytic leukemia: clinical presentation, pathogenesis and treatment. Mediterranean journal of hematology and infectious diseases. 2011;3(1):e2011048.

Page 212
326. Crawford S. Is it time for a new paradigm for systemic cancer treatment? Lessons from a century of cancer chemotherapy. Frontiers in pharmacology. 2013;4:68.
327. Burger JA. Nurture versus nature: the microenvironment in chronic lymphocytic leukemia. Hematology / the Education Program of the American Society of Hematology American Society of Hematology Education Program. 2011;2011:96-103.
328. Lucas DM, Still PC, Perez LB, Grever MR, Kinghorn AD. Potential of plant-derived natural products in the treatment of leukemia and lymphoma. Current drug targets. 2010;11(7):812-22.
329. Donoghue M, Lemery SJ, Yuan W, He K, Sridhara R, Shord S, et al. Eribulin mesylate for the treatment of patients with refractory metastatic breast cancer: use of a "physician's choice" control arm in a randomized approval trial. Clinical cancer research : an official journal of the American Association for Cancer Research. 2012;18(6):1496-505.
330. Wang P, Liu Z, Liu X, Teng H, Zhang C, Hou L, et al. Anti-metastasis effect of fucoidan from Undaria pinnatifida sporophylls in mouse hepatocarcinoma Hca-F cells. PloS one. 2014;9(8):e106071.
331. Choosawad D, Leggat U, Dechsukhum C, Phongdara A, Chotigeat W. Antitumour activities of fucoidan from the aquatic plant Utricularia aurea lour. J Sci Technol. 2005;27 (Suppl. 3):799-807.
332. Yang H, Zeng M, Dong S, Liu Z, Li R. Anti-proliferative activity of phlorotannin extracts from brown algae Laminaria japonica Aresch. Chinese Journal of Oceanology and Limnology. 2010;28(1):122-30.
333. Cooper R, Dragar C, Elliot K, Fitton JH, Godwin J, Thompson K. GFS, a preparation of Tasmanian Undaria pinnatifida is associated with healing and inhibition of reactivation of Herpes. BMC complementary and alternative medicine. 2002;2:11.
334. Chun YJ, Park IC, Park MJ, Woo SH, Hong SI, Chung HY, et al. Enhancement of radiation response in human cervical cancer cells in vitro and in vivo by arsenic trioxide (As2O3). FEBS letters. 2002;519(1-3):195-200.
335. Du Y, Wang K, Fang H, Li J, Xiao D, Zheng P, et al. Coordination of intrinsic, extrinsic, and endoplasmic reticulum-mediated apoptosis by imatinib mesylate combined with arsenic trioxide in chronic myeloid leukemia. Blood. 2006;107(4):1582-90.

Page 213
Appendix A- Reagents
Reagent Preparation
1M NaCl 5.84 gr NaCl powder was dissolved in 100 mL Milli-Q water and stored at 2-8°C.
1 M Tris 12.114 gr Tris powder was dissolved in 100 mL Milli-Q water and stored at 2-8°C.
1 M MgCl2 9.52 gr MgCl2 powder was dissolved in 100 mL Milli-Q water and stored at 2-8°C.
0.5 M EDTA 1.46 gr EDTA powder was dissolved in 10 mL Milli-Q water and stored at 2-8°C.
0.5 M Tris
HCl, pH 6.8
12.1 gr of Tris base was dissolved in 150 mL of Milli-Q water water. pH was
adjusted to 6.8 using concentrated HCl and the total volume to 200 mL was made
up with Milli-Q water. The solution was stored at 2-8 °C.
1.65 M NaOH 66 mg NaOH powder was dissolved in 1 mL Milli-Q water.
protease
inhibitor
cocktail
Complete protease inhibitor cocktail tablets were purchased from Roche Co. (Cat.
No. 04693116001). Each tablet was dissolved in 2 mL Milli-Q water and aliquots
were stored in -20 °C freezer.
10% Igepal The Igepal solution was purchased from Sigma-Aldrich, U.S.A. To make the 10%
Igepal, 2 mL of the stock solution was diluted in 18 mL Milli-Q water and was
stored at 2-8 °C.

Page 214
Primary and secondary antibodies utilised for Western blot
Affinity MW (KD) Host Dilution* Supplier (Cat. No.)
Anti-Pro Caspase 3 32 Rabbit 1:100 Abcam (ab136812)
Anti-Caspase 3 17 Rabbit 1:100 Abcam (ab136812)
Anti-PARP 89 Rabbit 1:100 Abcam (ab136812)
Anti-Pro Caspase 8 55 Goat 1:200 Santa Cruz (sc-6134)
Anti- Caspase 8 18 Goat 1:200 Santa Cruz (sc-6134)
Anti-Pro Caspase 9 46 Rabbit 1:200 Santa Cruz (sc-8355)
Anti- Caspase 9 35 Rabbit 1:200 Santa Cruz (sc-8355)
Anti-ERK 42,44 Rabbit 1:1000 Cell Signalling (4695P)
Anti-p-ERK 42,44 Rabbit 1:2000 Cell Signalling (4370P)
Anti-AKT 60 Rabbit 1:1000 Cell Signalling (4691P)
Anti-p-AKT(Ser) 60 Rabbit 1:2000 Cell Signalling (4060P)
Anti-p-AKT(Thr) 60 Rabbit 1:1000 Cell Signalling (2965P)
Anti-Bcl-xl 26,30 Rabbit 1:1000 Cell Signalling (2764P)
Anti-DR5 40,48 Rabbit 1:1000 Cell Signalling (8074P)
Anti-Fas 40-50 Rabbit 1:1000 Cell Signalling (4233S)
Anti-Bax 21 Rabbit 1:1000 Cell Signalling (5023P)
Anti-Cyclin D1 36 Mouse 1:2000 Cell Signalling (2926P)
Anti-Waf1/Cip1 21 Mouse 1:2000 Cell Signalling (2946P)
Anti-Actin 42 Rabbit 1:1000 Abcam (ab184111)
Anti-GAPDH 36 Mouse 1:5000 Millipore (MAB374)
Anti-SP1 90 Rabbit 1:1000 Santa Cruz (sc-59)
Secondary Antibodies Labelled with HRP
Anti-
Rabbit/Mouse**
Goat 1:250 Abcam (ab136812)
Anti-Rabbit Goat 1:1000 Dako (P0448)
Anti-Goat Rabbit 1:1000 Dako (P0160)
Anti-Mouse Rabbit 1:1000 Dako (P0260)
* Various antibody dilutions were diluted in 10 mL of 1X TNT with 1% 10X blocking reagent. **: Cocktail secondary antibody for anti-caspase 3 and anti-PARP was provided by the supplier in the kit
Page 215
Appendix B- Methods
Quantitation of Protein by Bradford Assay
Bradford dye reagent was purchased from Bio-Rad, U.S.A and stored in the fridge. To measure
the proteins concentrations, the dye reagent was diluted 1:5 with Milli-Q water. The extracts
were diluted 1:10 with Milli-Q water and serial dilutions of bovine serum albumin (BSA) were
used to further standard curve construction (i.e. 0.1 mg/mL, 0.15 mg/mL, 0.2 mg/mL, 0.25
mg/mL, 0.5 mg/mL and 1.0 mg/mL samples of BSA were prepared from 10 mg/mL, BSA;
Invitrogen™, U.S.A). 990 µL of the diluted Bradford dye reagent was added in 10 µL of each
extract and each diluted BSA standard. Absorbance was measured at 595 nm using the
SpectraMax® Plus384 Absorbance Reader (Molecular Devices, U.S.A). The results were
entered in Microsoft Excel 2010 and BSA standard curve was created. Sample protein
concentrations were determined in comparison to the BSA standard curve.

Page 216
Appendix C –Monitoring Sheets
Animal monitoring sheet after tumour cells injection
Project code: A13940
Aim
…….
Mouse Ear tag- ID
……………………..
Cage
…….
Tumour injection date
……………………
Treatment start
……………………..
Termination date
………………………
Tumour Appearance Monitoring
Day Date Weight Condition/comment
1
2
3
4
5
6
7
8
9
10
11
12
13
14
15
16
17

Page 217
Animal monitoring sheets during Treatment
Tumour Development
Day Date Weight Tumour measurement Width x Length (Volume)
Condition/comment
1 × ( )
2 × ( )
3 × ( )
4 × ( )
5 × ( )
6 × ( )
7 × ( )
8 × ( )
9 × ( )
10 × ( )
11 × ( )
12 × ( )
13 × ( )
14 × ( )
15 × ( )
16 × ( )
17 × ( )
20 × ( )
21 × ( )
22 × ( ) 23 × ( ) 24 × ( ) 25 × ( ) 26 × ( ) 27 × ( )
28 × ( )
Project code: A13940
Aim
…….
Mouse Ear tag- ID
……………………..
Cage
…….
Tumour injection date
……………………
Treatment start
……………………..
Termination date
………………………

Page 218
Appendix D-Results Chapter 4. Daily body weight in mice fed with peanut butter and vehicle (control group)
Day before tumour injection Control 1 Control 2 Control 3 Control 4 Control 5 Control 6 Control 7
1 12 12.1 21.52 18.75 22.45 12.3 23.6
2 12.78 12 21.3 18.83 22.36 12.81 23.84
3 13.36 12.25 21.88 18.73 23.07 12.95 24.44
4 13.5 12.48 21.93 19.13 23.11 13.25 24.6
5 13.7 12.26 21.88 19.66 23.23 12.99 24.7
6 13.75 12.2 21.54 19.55 23.04 12.99 23.84
7 13.84 12.6 21.6 19.5 23.5 13.25 24.23
8 14.01 12.95 21.8 19.91 23.1 13.6 24.65
9 13.48 12.6 21.71 19.23 22.9 13.32 24.14
10 13.57 12.8 21.64 19.31 22.6 13.7 23.85
11 14.15 13.22 21.33 19.73 22.81 14.12 23.06
12 14.54 13.49 21.47 19.81 22.9 14.61 23.19
13 14.73 13.45 21.56 19.8 22.76 14.43 23.32
14 15.04 13.2 21.8 19.72 22.83 14.8 23.6
Day after tumour injection
1 15.3 13.33 21.64 19.73 22.6 14.81 24.21
2 15.68 13.71 21.61 20.06 22.81 14.94 24.26
3 15.66 13.6 21.35 20.22 22.7 14.9 24.57
4 15.8 13.9 21.88 20.34 23.28 15.54 24.48
5 16.1 14.01 21.84 20.68 23.7 15.03 24.17
6 16.3 14.15 22.36 21.4 24.02 15.42 24.64
7 15.91 14.32 22.13 21.28 23.31 15.46 24.4
8 16.5 14.2 22.4 21.1 23.71 15.14 24.81
9 16.23 14.8 22.14 21.65 23.73 15.6 24.54
10 16.3 14.65 23.61 21.74 24.86 16.16 25.45
11 15.98 14.8 22.6 21.29 24.5 16.35 25.4
12 16.5 15 22.5 20.85 24.7 16.38 25.8
13 16.14 15.32 22.36 20.82 24.07 16.92 24.49
14 16.26 15.1 22.4 20.73 24.5 17.41 25
15 16.62 15.26 22.91 21.55 24.61 17.78 25.25
16 16.58 15.41 23.11 21.68 End Point 17.86 25.29
17 17.11 15.48 22.97 21.2 End Point 24.42
18 17.47 15.61 End Point End Point 25.8
19 End Point End Point 24.9
20 24.69
21 25.25
22 25.8
23 25.4
24 End Point

Page 219
Chapter 4. Daily body weight in mice fed with peanut butter and fucoidan (fucoidan group)
Day before tumour injection Fucoidan 1 Fucoidan 2 Fucoidan 3 Fucoidan 4 Fucoidan 5 Fucoidan 6 Fucoidan 7
1 11.87 14.9 23.13 13 23.74 11.8 21.99
2 12.1 15.45 23.52 13.28 24.18 12.2 21.95
3 12.6 15.7 23.4 13.6 14.32 12.44 22.68
4 12.71 16 23.5 13.9 24.51 12.7 22.69
5 13 16.2 23.4 14.01 24.75 13.03 22.85
6 13.4 16.35 23.99 14.27 24 13.29 22.4
7 13.5 16.09 23.6 14 24.32 13.09 22.76
8 13.67 15.9 24.13 13.98 24.65 13.35 23
9 13.31 15.8 24.03 13.73 24.01 12.86 23.08
10 13.34 16.04 24.11 13.74 23.29 12.9 23.14
11 13.7 16.23 24.2 14.2 23.9 13.4 23.39
12 14.01 16.56 24.15 14.56 23.47 13.63 23
13 14.01 16.03 24.23 14.3 23.5 13.23 23.1
14 14.12 16.46 24.1 14.65 23.81 14.57 22.8
Day after tumour injection
1 14.1 16.31 24.4 14.01 24.41 14.3 23.4
2 14 16.13 24.8 14.27 24.42 13.5 23.62
3 14.25 16.44 24.93 14 23.81 13.7 23.4
4 14.38 16.47 24.31 13.98 24.34 13.66 23.6
5 14.72 16.93 24.47 13.73 24.1 14.28 23.6
6 14.33 16.98 24.36 13.74 24.68 14.67 23.9
7 14.36 17.23 23.83 14.2 25.05 14.8 23.81
8 14.69 17.56 23.87 14.56 24.78 14.96 23.91
9 14.7 17.48 23.96 14.46 24.79 14.9 24.11
10 15.12 17.45 24.26 14.53 24.26 15.23 23.91
11 15.33 17.8 23.7 14.78 25 15.22 24.21
12 14.89 18.1 23.69 14.6 25.4 15.54 23.96
13 15.26 18 23.5 14.9 25.2 15.36 24.48
14 15.6 18.32 23.17 14.52 25.3 15.72 23.97
15 15.88 18.4 23.59 14.31 24.75 15.78 24.43
16 15.81 18.68 23.02 14.5 25.07 15.73 24.15
17 16.38 19.1 23.91 14.52 25.01 15.78 24.1
18 16.11 20.1 End Point 14.95 25.1 15.91 23.92
19 16.42 20.36 15.2 24.72 15.9 23.75
20 16.12 20.8 15.73 25.16 15.54 23.58
21 16.98 End Point 15.68 25.72 16.14 23.53
22 17.47 16.4 26.51 16.4 24.39
23 17.6 16.8 26.5 16.52 24.06
24 17.47 16.65 25.15 16.83 23.69
25 17.25 16.08 25.28 16.86 23.6
26 17.73 17.01 26.3 16.7 23.47
27 17.27 17.08 26.24 17.1 24.18
28 17.2 17.52 25.98 16.88 23.9
29 17.39 17.6 26.25 17 23.93
30 End Point 17.91 25.8 17.23 23.59
31 End Point 26.24 17.17 23.78
32 25.57 End Point 23.5

Page 220
Continue from last page
Day after tumour injection Fucoidan 6 Fucoidan 1
33 26.23 23.36
38 25.99 23.65
43 26.12 23.91
48 End Point 23.5
53 23.46
58 23.97
63 23.8
68 23.5
73 24.98
78 24.6
83 24.83
87 End Point