Embed Size (px)
Citation preview

[CANCER RESEARCH 53. 5528-5534, November 15, 1
Microvascular Mechanisms of Change in Tumor Blood Flow Due to Angiotensin II,Epinephrine, and Methoxamine: A Functional Morphometric Study1
Kaism oslii MorÃ,2Qiu-Hang Zhang, Sachiko Saito, Shigeru Tanda, Hao-Chuan Li, and Maroh Suzuki
Defwrtrnenl oj Turnar Mìcrtn-ircitìatìun.Institute of Development. Aging and Cancer. Ttdittktt University. 4-1 Seirvo-maclti, Aohu-kit, Sendai WW, Japan
ABSTRACT
To elucidate the microvascular mechanisms of change in tumor bloodflow elicited by vasopressors, a functional morphometric study of the s.c.microcirculation within a rat transparent chamber was performed. Arte-riolar vessels were classified centripetally (a2-a5) according to Strahler's
method. Arteriolar pressure in each segment both under normotensionand under hypertension induced by angiotensin II, epinephrine, or meth-
oxamine was measured using a microocclusion technique. Vasoconstriction was estimated by changes in vessel diameters. In addition, tissue bloodflow of the subcutis and s.c. tumor (LY80, a variant of Yoshida sarcoma)under the same conditions was measured with the hydrogen clearancemethod. By comparing the sites of the greatest pressure drop and thevasoconstriction induced by each vasopressor, we assessed the sites ofvascular resistance (VR) which showed increases due to these vasopressors. The greatest VR increase elicited by angiotensin II occurred acrossaïvessels. On the other hand, the sites of VR increase due to epinephrinewere in a3 vessels and larger vessels upstream from a3 arterioles. The VRincrease induced by methoxamine was much smaller than that induced byepinephrine. We conclude that the fact that the sites of increased VR differwith each vasopressor is the primary reason that various vasopressorshave been found to produce different changes in tumor blood flow.
INTRODUCTION
To enhance therapeutic efficacy in cancer chemotherapy, there isevidence to suggest that it is important to increase TBF3 because
delivery of anticancer drugs to tumor tissue is strongly dependent onTBF (1-3). Over the last 30 years, many investigators have attempted
to increase TBF by vasopressor agents, but most such trials have notbeen successful. In 1977 we discovered that elevation of MABP bycontinuous venous infusion of All produced a 2-3-fold increase in
TBF and that this increase was selective and specific to tumor vesselsas long as the MABP was kept under 150 mmHg (4. 5). The Increasein TBF by All brought about an increase in the perfused tumorvascular area (6) and an enlargement of the hydrostatic pressuredifference between tumor vessels and extravascular spaces (7). Thesechanges of microhemodynamics in tumor microcirculation, in turn,led to enhancement of delivery of anticancer drugs (8, 9) and oxygen(10) to tumor tissue. All-induced hypertension is now considered to be
a reliable method to increase TBF significantly and continuously (11).All-induced hypertension chemotherapy, a clinical therapeutic modal
ity based on this functional characteristic of tumor microcirculation,was pioneered by Sato et al. (12) in 1978 and has been verifiedexperimentally (4, 13) and clinically (14-16) to be superior to con
ventional cancer chemotherapy although it has not been widely applied to clinical practice yet outside of Japan. On the other hand, TBFgenerally decreased or did not change following injection of mostadrencrgic vasopressors (2, 17, 18). It is most probable that the different changes in TBF by All and these adrenergic vasopressors are
Received 5/24/93; accepted 9/14/43.The costs of publication of this article were defrayed in part by the payment of page
charges. This article must therefore be hereby marked advertisement in accordance withIX U.S.C. Section 1734 solely to indicate Ihis fact.
1This study was supported in part by a Grant-in-Aid from the Japanese Foundation for
Multidisciplinary Treatment of Cancer.2 To whom requests for reprints should be addressed.1The abbreviations used arc: TBF. tumor blood How; All, angiotensin II; VR, vascular
resistance; MABP. mean arterial blood pressure.
due to the site of increased VR being more central or more peripheralthan terminal arterioles modified by the tumor because the bloodsupply to tumor tissue is usually controlled by the vessels (19).
In the present study, we compared the site of VR increased by Allwith that by the adrenergic vasopressors, epinephrine and methoxamine, in s.c. tissue within the rat transparent chamber. In the firstseries of experiments, using a microocclusion technique (20), therelationship between the MABP and the blood pressure of each arte-
riolar segment during i.v. injection of the vasopressors was analyzed.In addition, we measured the rate of constriction of arterioles inresponse to the administered drugs. In the second series, changes intissue blood flow in both the subcutis and the tumor were measuredsimultaneously by the hydrogen clearance method (21) before andduring the infusion of these vasopressors. The aim of this study is toclarify the microvascular mechanisms of TBF change during the administration of vasopressor drugs.
MATERIALS AND METHODS
Rats and Tumor. Male Donryu rats (Crj-Donryu; Charles River Japan Co.,Ltd.. Yokohama. Japan), weighing 20(1-220 g each, were used for microvas
cular pressure measurements and vitalseopic observation using the transparentchamber in a skintbld. The same strain of rats, weighing 360-400 g each, was
used for measurement of tissue blood flow. The tumor used was LY80 (22), avariant of the Yoshida sarcoma, which has been maintained in our laboratoryby successive i.p. transplantation. Cells (2 X 10 h) in 0.1 ml were injected s.c.
into the hack of each rat. The tumor size was measured with calipers, and thevolume (V) was calculated by the following formula:
"(Õ) x d\ x d2 x c/3
where rfl. tl2. and </3 were the long axis, short axis, and height of the tumor
nodule, respectively.Drugs. Angiotensin II (Angiotensin II human type; Toa Eiyo Ltd.. Tokyo,
Japan), epinephrine (Bosmin; Daiichi Pharmaceutical Co.. Ltd., Tokyo, Japan),and methoxamine HCI (Mexan; Nippon Shinyaku Co., Ltd., Kyoto. Japan)were used as vasopressor agents. Sodium pcntobarbital (Nemhutal: AbbottLaboratories, North Chicago. IL) and enflurane (Ethranc; Abbott Laboratories)were used for anesthesia.
Blood Pressure Measurement and Elevation. MABP was measured by acatheter (PE-50; Clay Adams Co.. Persippany, NJ) inserted to the right femoral
artery. The pressure in the catheter was recorded with a pressure transducer(TNF-R; Spectramed Medical Produels) the output of which was fed into anamplifier (6M82; NEC-Sanei Co., Tokyo, Japan) adapted for measurement of
MABP. MABP was elevated by continuous infusion into the tail vein ofvasopressors dissolved in 0.9% NaCl solution at a determined concentration.The concentrations of All. epinephrine and methoxamine were 2.5 fig/ml, 0.1mg/ml, and 1.0 mg/ml, respectively. These concentrations were selected as theminimum levels which satisfied the condition that MABP elevated to 150mmHg within I min under an injection rate of 0.02-0.05 ml/min. Vasopressors
were infused with microinfusion pump (Compact Syringe Pump; Harvard
Apparatus Co., Inc., Millis, MA).Anesthesia. All experiments were performed under the administration of
an anesthetic in a controlled temperature box (24.5 ±0.3°C) fitted with a
suction duct. Rats were anesthetized with pentobarhital sodium (30 mg/kg byi.m. injection) and enflurane (1.0-1.5% in the inhaled carrier gas at 1 liter/min)on a heated stage at 34°C.The concentration of enflurane was controlled by
5528
on June 14, 2018. © 1993 American Association for Cancer Research. cancerres.aacrjournals.org Downloaded from
\IICH\MSMS 01 TIMOR BLOOD FLOW CIIANOLS
means of an anesthetic apparatus for small laboratory animals (22). The construction of the anesthetic apparatus and its usage were described previously(22).
Classification of Artcrioles. In the rat subcutis. arterial vessels branchaway stepwise from large arterioles to terminal arterioles (23). True capillariesbranch off from terminal arterioles. The trend in current vessel classification ofmicrocirculation is to categorize vessels numerically according to the order ofbranching (24, 25). According to the classification, the largest arteriole whichenters the tissue is referred to as a first-order arteriole. 1A. Successive branchesfrom the 1A are defined as second-order arterioles, 2A, and so on. In the
present study, however, we could not determine 1A arterioles because theobserved area was restricted to that within the transparent chamber. Therefore,we ordered vessel segments according to Strahler's nomenclature (2ft). Order
1 was assigned to true capillaries and order 2 was assigned to terminal arterioles. The vessels from which terminal arterioles originated were order 3 andprogressively higher orders were assigned to larger arterioles. Fig. I illustratesschematically the vessel ordering defined in the present report. Correspondingvessels are numbered. To avoid confusing the centripetal vessel orderingadopted in the present study with the centrifugal vessel ordering reported bymany authors, we used a small letter instead of a capital letter for each term.An order 2 vessel is thus expressed as a2, not 2A. Order 4 or 5 vessels werethe highest orders found within the rat transparent chamber.
Measurement of Microvascular Pressure. The system for measurementof microvascular pressure consists of a rat transparent chamber, a microneedlefor pressing microvessels. and a micropressure converter with which to precisely change the pressure of the lip of the needle (20). One side of the chamberhas a window, made of acrylic plate, and the other side has an 11-fj.m-thick
polyvinylidene chloride film membrane. To keep the tissue thickness betweenthe window and membrane constant, the face of the thin film is kept tlat againsta supportive plate, which is removed when the pressure is to be measured. Theessential part of the apparatus is shown in Fig. 2. A micromanipulator (ML-9;
Narishige Scientific Instrument Lab. Co., Tokyo, Japan) is used to bring the topof the steel needle (SPRON 100; Sendai Seimitsu Material Res. Lab. Co. Ltd.,Sendai. Japan) into contact with the under surface of the skin beneath thetransparent chamber.
The pressure of microvessels was designated as 0 cm H2O when the top ofthe needle was in contact with the vessel over the thin film membrane. Whenthe pressure was increased by raising the water column, the vessel was pressed,resulting in stoppage of blood flow through the microvesscl (20). In arteriolarvessels, blood flow soon recirculates by reason of cardiac pulsation. However,blood flow can be completely halted by a small further increase in the heightof the water column. The pressure required for the first and second stoppage ofblood How corresponded approximately to the minimum and maximum bloodpressure of arterioles, respectively. In the microocclusion technique, a sphyg-
mogram cannot be recorded. However, there seemed to be few dicrotic wavesin the arteriolar pulse, judging from the waveform recording which has been
Fig. 1. Schematic represenlalion of the arrangement of arterioles and venulcs in the rats.c. m¡crocirail al ion. Arterioles classified numerically according to Strahler's nomencla
ture. /, true capillaries; a2, terminal arterioles; a3-a5, arterioles; v, venules; arrows,direction of flow.
RAT
Fig. 2. Diagram of the apparatus lor measurement of microvascular pressure of the s.c.tissue ¡nthe rat transparent chamber. /. objective; 2, polyvinylidene chloride film (thickness = II (xm); 3, steel needle (diameter, 100 /¿m);4, stage; 5, water; 6. thin rubbermembrane; 7, supportive plate. M. connected to micromanipulator; IV,connected to watercolumn.
ô 50X
I 40
30
20
10
(20)
(32)
(25)
(15)
a4 a3 a2 capillary
Vessel Type
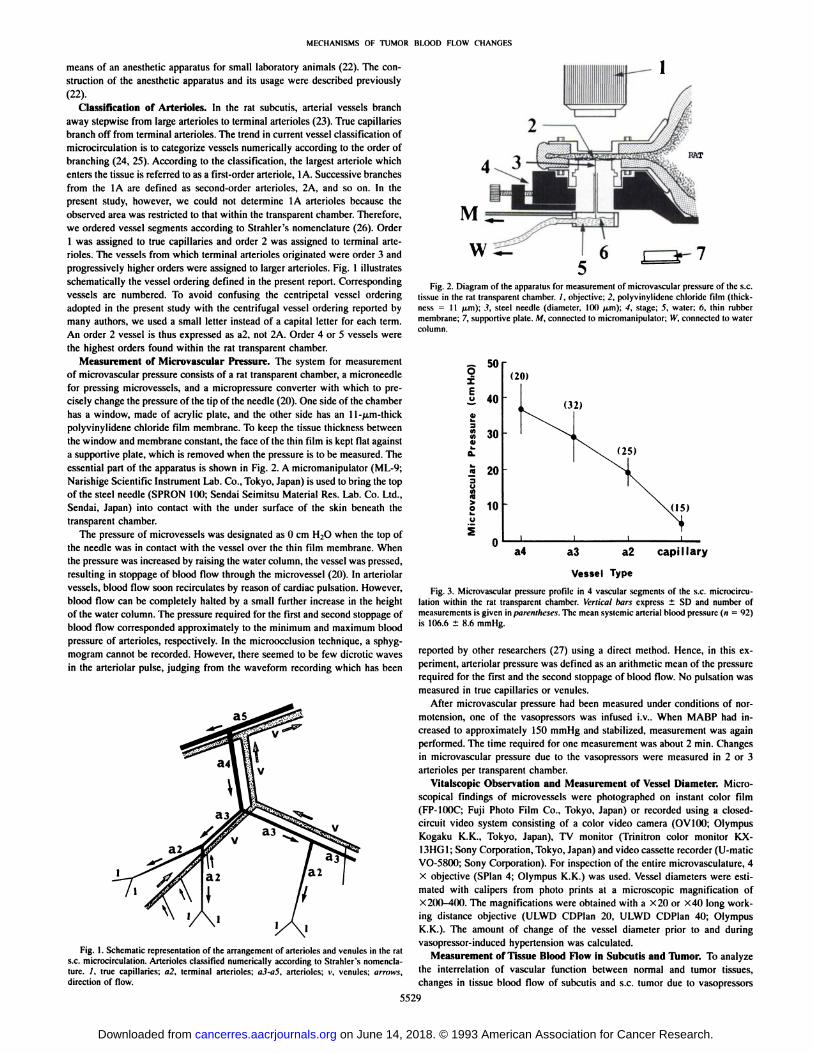
Fig. 3. Microvascular pressure profile ¡n4 vascular segments of the s.c. microcirculation within the rat transparent chamber. Vertical bars express ±SD and number ofmeasurements is given in piirfnllu'M'*. The mean systemic arterial blood pressure («= 92)
is 106.6 ±8.6 mmHg.
reported by other researchers (27) using a direct method. Hence, in this experiment, arteriolar pressure was defined as an arithmetic mean of the pressurerequired for the first and the second stoppage of blood flow. No pulsation wasmeasured in true capillaries or venulcs.
After microvascular pressure had been measured under conditions of nor-
motension, one of the vasoprcssors was infused i.V.. When MABP had increased to approximately 150 mmllg and stabilized, measurement was againperformed. The time required for one measurement was about 2 min. Changesin microvascular pressure due to the vasopressors were measured in 2 or 3arterioles per transparent chamber.
Vitalscopic Observation and Measurement of Vessel Diameter. Microscopical findings of microvessels were photographed on instant color film(FP-IOOC; Fuji Photo Film Co., Tokyo, Japan) or recorded using a closed-
circuit video system consisting of a color video camera (OV100: OlympusKogaku K.K.. Tokyo, Japan). TV monitor (Trinitron color monitor KX-13HG1; Sony Corporation. Tokyo, Japan) and video cassette recorder (U-maticVO-5800; Sony Corporation). For inspection of the entire microvasculature, 4
X objective (SPIan 4; Olympus K.K.) was used. Vessel diameters were estimated with calipers from photo prints at a microscopic magnification ofX200-400. The magnifications were obtained with a X20 or X40 long work
ing distance objective (ULWD CDPIan 20, ULWD CDPIan 40; OlympusK.K.). The amount of change of the vessel diameter prior to and duringvasopressor-induced hypertension was calculated.
Measurement of Tissue Blood Flow in Subcutis and Tumor. To analyzethe interrelation of vascular function between normal and tumor tissues,changes in tissue blood flow of subcutis and s.c. tumor due to vasopressors
5529
on June 14, 2018. © 1993 American Association for Cancer Research. cancerres.aacrjournals.org Downloaded from

MECHANISMS OF TUMOR BLOOD FLOW CHANGES
Table 1 Effects of angiotensin ¡I,epinephrine, and methoxamine on microvessel pressure in each vascular segment in ¡hes.c. tissue void of tumor"
VasopressorAH
(2.5(ig/ml)Tola!Epincphrine
(0. 1mg/ml)Tola!Mclhoxaminc
(1.0mg/ml)TotalVessel
typea4a3•2cap.•4i3«2a4a3a2n20322515921219124315141544N104.7
±8.6105.8±9.2110.0±8.1105.3±6.9106.6±8.6107.9±6.9103.9±8.5107.1±8.9105.9±8.2106.9±7.1109.6±6.0109.0±6.2108.5±6.4MABP(mmHg)160.0159.3159.5150.3158.0164.0158.2164.2161.5165.7166.8163.6165.3H±8.0±
10.1±9.4±
7.4±9.6±9.7±8.1±
8.4±8.9±6.2±5.5±
8.6±6.9Change
(%)+
52.8+50.6+45.0+42.7+48.2+52.0+52.3+53.3+52.5+55.0+52.2+50.1+
52.437.129.319.75.035.929.621.637.529.320.7Vessel
(cmN±7.8±8.2±3.6±
1.9±7.9±9.9±
2.7±7.7±5.4±6.5pressure
H2O)53.439.826.34.246.032.619.745.333.923.1II±
14.0*±
lo.r±5.8*±1.6*±
13.9*±13.1*±6.5'±
15.0*±7.8*±6.6"Change(%)+43.9+35.8+33.5-16.0+
28.1+10.1-8.8+
20.8+15.7+
11.6
" Vesselpressure was measured before and during administration of each vasopressor. Values are expressed as the means ±SD. n, number of measurements; N, normotension; H,
hypertension.bP< 0.05.CP< 0.001.d Not significant.
Table 2 Effects of angiolensin II, epinephrine, and methoxamine on vessel diameter in each vascular segment in the s.c. tissue void of tumor"
VasopressorAH
(2.5/ig/ml)TotalEpinephrinc
(0.1mg/ml)TotalMethoxamine
(1.0mg/ml)TotalVessel
typea5.4a3i2a5•Ai3a2a4a3aMABP
(mmHg)n2222V177(121417841918936N104.0104.0109.4111.9108.3108.0105.1105.8108.0106.0106.7107.08.58.18.56.38.44.28.08.36.07.76.04.1108.1
±6.8107.1±5.2H152.0
±11.3158.5±9.3159.2±10.1160.2±8.4159.2±9.3163.0±4.2162.1±7.2162.2±6.9165.1±3.9162.8±6.5158.9±10.3154.6±8.4153.6±5.4155.5±8.4Change
(%)+46.2+52.4+45.5+43.2+47.0+50.9+54.2+53.3+52.9+53.6+48.9+44.5+42.1+
45.2Vessel
diameter(M-m)N56.3
±8.843.8±12.032.5±9.821.3±5.967.5
±3.549.5±10.632.4±7.124.4±6.546.0
±13.328.1±11.620.1±4.6H62.5
±3.536.0±12.8*24.0±9.3C14.5±5.5*43.2
±8.026.6±10.4*17.4±6.6*11.9±5.5*42.6
±13.6*23.5±12.6*16.2±4.3*Change
(%)+
11.0-17.8-26.2-31.9-36.0-46.3-46.3-51.2-7.4-16.4-19.4
a Vessel diameter was measured before and during administrationof each vasopressor.Values are expressed as the means ±SD. n, number of measurements; N. normotension; H.
hypertension.* P < 0.05.CP< 0.001.
were measured simultaneously. A tissue blood flow meter with 2 separateamplifiers (PHG-201; Unique Medical Co., Tokyo, Japan) was used. In thepresent experiment, 2 hydrogen electrodes (UHE-201C; Unique Medical Co.)and the same number of reference electrodes (UHE-001; Unique Medical Co.)
were used per rat. One electrode was inserted into tumor tissue and the otherelectrode was inserted into the s.c. tissue of the back. Reference electrodeswere placed on s.c. pouchs in the caudal region. The distance between twoelectrodes was 2-3 cm. This arrangement is appropriate for the present ex
periments because the microvasculature of the tissue is composed of a largenumber of microvascular modules which respond in the same manner tostimuli (28, 29).
Tissue blood flow of subcutis and s.c. tumor was measured when the longaxis of the tumor nodule reached approximately 2 cm at 7-11 days after
transplantation of tumor cells. Details of the method for measurement of tissueblood flow have been published in our previous reports (5, 22, 30). Measurements of TBF were performed over a period of 7 h between 10a.m. and 5 p.m.because there was circadian variation of TBF (31).
Statistical Analysis. All data were presented as mean ±SD. The nonpara-
metric Wilcoxon test was used for comparison of vessel pressures, vesseldiameters, and tissue blood flows because they did not show Gussian distributions. P < 0.05 was accepted as significant.
RESULTS
Pressure Distribution in Arterioles and True Capillaries of s.c.Tissue within a Chamber. The operation for installing a chamber, inspite of the extreme care with which it was carried out, necessarily
involved some degree of injury. However, recovery of the chamberarea took place within 4 days, if the bleeding sustained at the time ofoperation was kept to a minimum. Arteriolar vessels in areas devoidof inflammation were in a state of moderate contraction. In the case ofexcessive bleeding during the operation, true capillaries and arterioleswere in a state of dilatation even 2 weeks following chamber installation. Inflammatory arterioles were omitted from the subjects ofmeasurement. Fig. 3 shows microvascular pressures in four vascularsegments of rat s.c. microcirculation within the chamber. The means±SD (sample numbers) during the control period were: a4, 37.1 ±7.8 cm H2O (n = 20); a3, 29.3 ±8.2 cm H2O (n = 32); a2, 19.7 ±3.6 cm H2O (n = 25); and true capillary, 5.0 ±1.9 cm H2O (n = 15).The mean ±SD of MABP was 106.6 ±8.6 mmHg (n = 92).
Although there was some overlap between adjacent categories, thegreatest pressure drop that occurred in the s.c. microcirculation withinthe chamber was found between a2 and true capillary vessels.
Changes in Microvascular Pressure Due to Vasopressors. Table1 shows the changes in pressure of arteriolar vessels and true capillaries due to All, epinephrine, and methoxamine. When MABP wasincreased from 106.6 ±8.6 to 158.0 ±9.6 mmHg (n = 92) due to
continuous venous infusion of All, the pressures of all arteriolarsegments increased significantly (a4, P < 0.05; a3, P < 0.001; a2, P< 0.05). The changes in pressure of a4, a3, and a2 vessels were+43.9, +35.8, and +33.5%, respectively. On the other hand, thepressures of true capillaries decreased slightly (P < 0.05). Blood flow
5530
on June 14, 2018. © 1993 American Association for Cancer Research. cancerres.aacrjournals.org Downloaded from
MECHANISMS OF TUMOR BLOOD KI.OW CIIAMil-.S
through the capillary bed obviously decreased under All-induced hy
pertension. The greatest pressure drop elicited by All and hence thelargest resistance to blood flow was encountered between a2 and truecapillary vessels. When MABP was increased from 105.9 ±8.2 to161.5 ±8.9 mmHg (n = 43) by epinephrine, the pressures of a4 and
a3 vessels increased significantly. Although it is not statistically significant, the pressure of a2 vessels had a tendency to decrease underepinephrine-induced hypertension. Blood flow was often observed to
cease entirely in the a2 vessels. The changes in a4, a3, and a2 were+28.1, +10.1, and -8.8%, respectively. A comparatively large pres
sure drop was found between a4 and a3 and between a3 and a2vessels. With an increase of MABP from 108.5 ±6.4 to 165.3 ±6.9mmHg (n = 44) by methoxamine, the pressures of a4, a3, and a2
vessels increased significantly. The changes in a4, a3, and a2 were+ 20.8, +15.7, and +11.6%, respectively. Although the pressures ofall arteriolar vessels including a2 vessels were increased, the increaseelicited by methoxamine was smaller than that by All.
Changes in Vessel Diameter of Arteriolar Vessels due to Vaso-
pressors. Table 2 shows the changes in the diameter of arteriolarvessels due to vasopressors. When MABP was increased from 108.3±8.4 to 159.2 ±9.3 mmHg (n = 70) by All, the vessel diameters of
a4, a3, and a2 vessels decreased significantly. The changes in vesseldiameters of a5, a4, a3, and a2 were +11.0, -17.8, -26.2, and -31.9%,
respectively. The smaller the arteriolar segment, the greater the percent of vasoconstriction became during All-induced hypertension.
When MABP was increased from 106.0 ±7.7 to 162.8 ±6.5 mmHg(n = 41) by epinephrine, significant vasoconstriction was observed in
all arterioles studied. The changes in a5, a4, a3 and a2 vessels were-36.0, -46.3, -46.3, and -51.2%, respectively. With an increase inMABP from 107.1 ±5.2 to 155.5 ±8.4 mmHg (n = 36) due to
methoxamine, the vessel diameters of a4, a3, and a2 decreasedslightly, but again significantly. The changes in a4, a3, and a2 were-7.4, -16.4, and -19.4%, respectively.
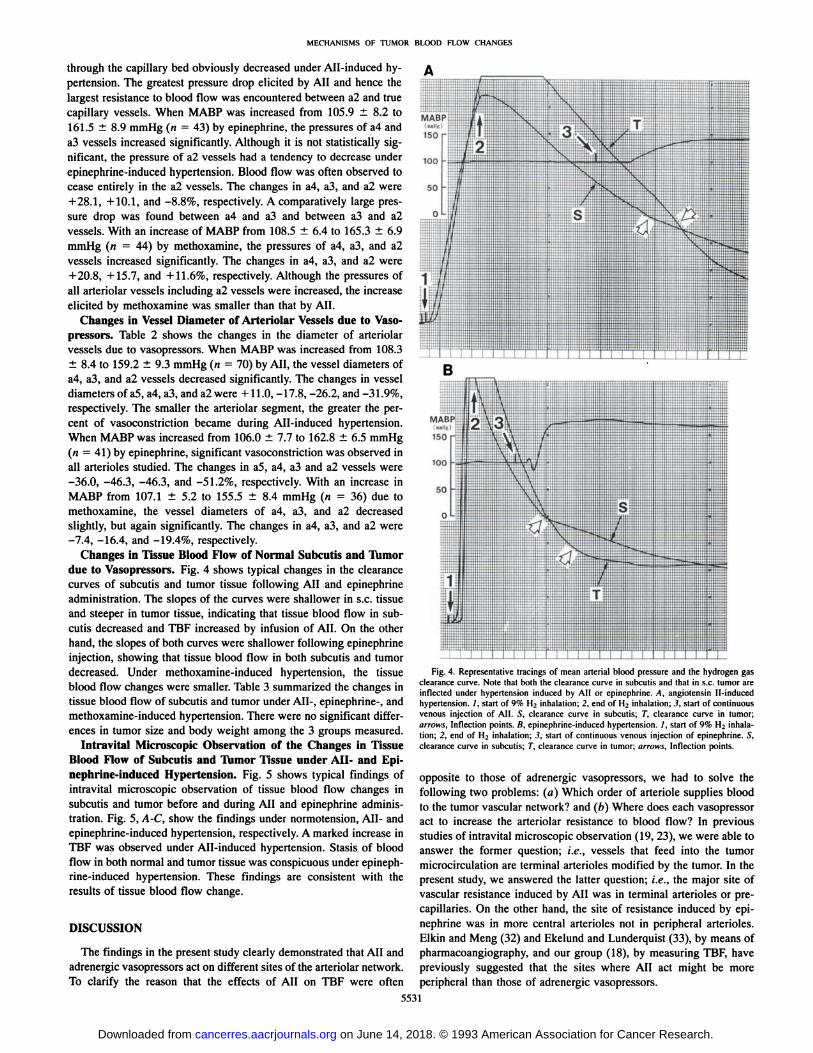
Changes in Tissue Blood Flow of Normal Subcutis and Tumordue to Vasopressors. Fig. 4 shows typical changes in the clearancecurves of subcutis and tumor tissue following All and epinephrineadministration. The slopes of the curves were shallower in s.c. tissueand steeper in tumor tissue, indicating that tissue blood flow in subcutis decreased and TBF increased by infusion of All. On the otherhand, the slopes of both curves were shallower following epinephrineinjection, showing that tissue blood flow in both subcutis and tumordecreased. Under methoxamine-induced hypertension, the tissue
blood flow changes were smaller. Table 3 summarized the changes intissue blood flow of subcutis and tumor under All-, epinephrine-, andmethoxamine-induced hypertension. There were no significant differ
ences in tumor size and body weight among the 3 groups measured.Intravital Microscopic Observation of the Changes in Tissue
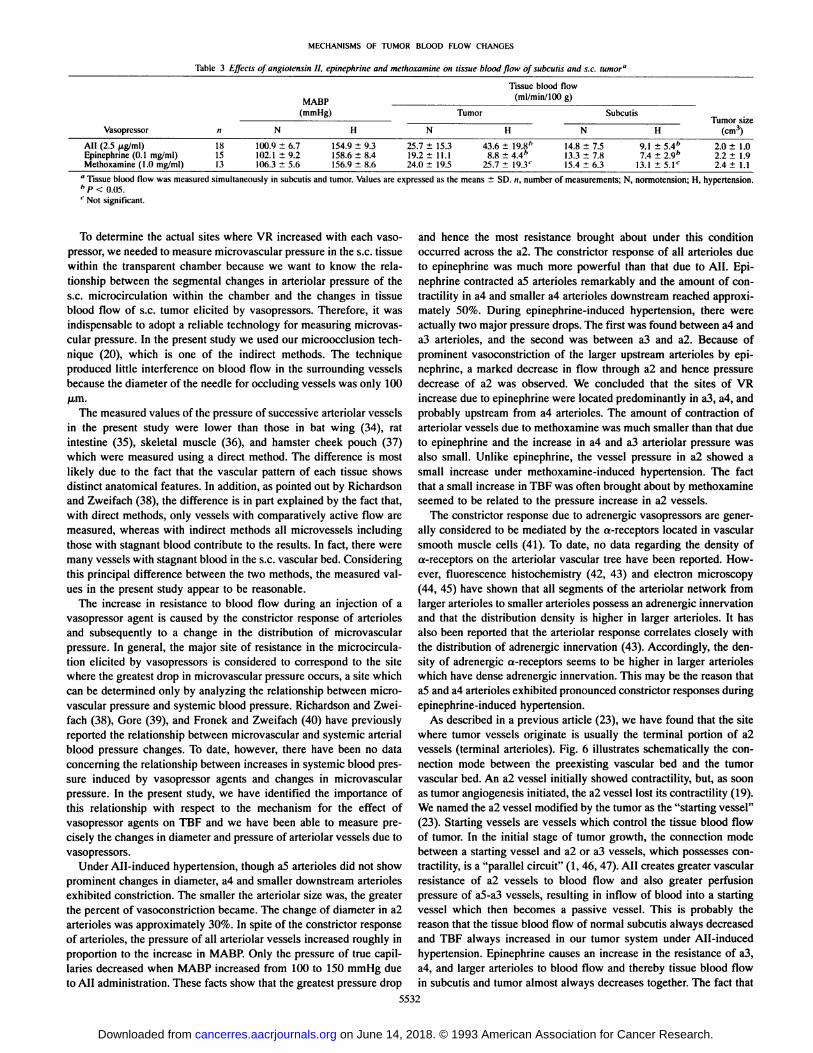
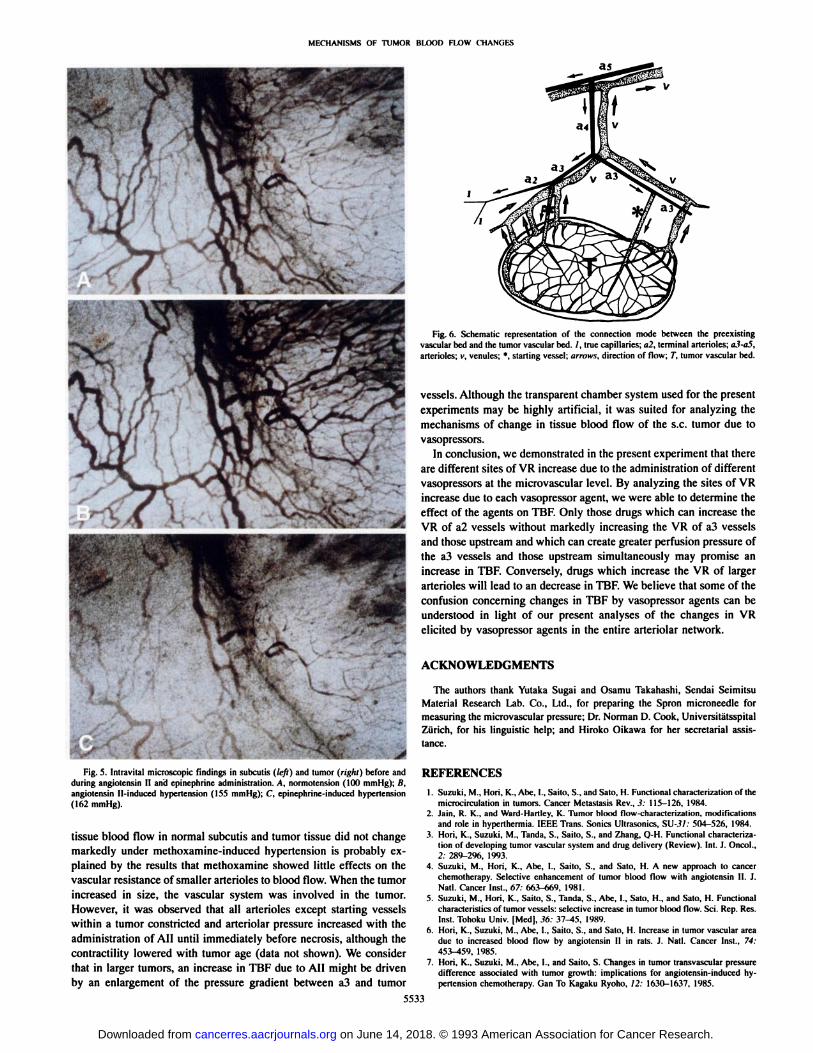
Blood Flow of Subcutis and Tumor Tissue under AH- and Epinephrine-induced Hypertension. Fig. 5 shows typical findings of
intravital microscopic observation of tissue blood flow changes insubcutis and tumor before and during All and epinephrine administration. Fig. 5, A-C, show the findings under normotension, All- andepinephrine-induced hypertension, respectively. A marked increase inTBF was observed under All-induced hypertension. Stasis of blood
flow in both normal and tumor tissue was conspicuous under epinephrine-induced hypertension. These findings are consistent with the
results of tissue blood flow change.
DISCUSSION
The findings in the present study clearly demonstrated that All andadrenergic vasopressors act on different sites of the arteriolar network.To clarify the reason that the effects of All on TBF were often
Fig. 4. Representative tracings of mean arterial blood pressure and the hydrogen gasclearance curve. Note that both the clearance curve in subcutis and that in s.c. tuinflected under hypertension induced by All or epinephrine. A, angiotcnsinhypertension. /, start of 9% H2 inhalation; 2, end of H2 inhalation:.?, start of covenous injection of All. S, clearance curve in subcutis; T, clearance curve inarrows. Inflection points. R. epinephrine-induced hypertension. /, start of 9% H
nducedtinuoustumor;inhala
tion; 2. end of Hi inhalation; 3. start of continuous venous injection of epinephrine. S,clearance curve in subcutis; 7",clearance curve in tumor; arrows. Inflection points.
opposite to those of adrenergic vasopressors, we had to solve thefollowing two problems: (a) Which order of arteriole supplies bloodto the tumor vascular network? and (/>) Where does each vasopressoract to increase the arteriolar resistance to blood flow? In previousstudies of intravital microscopic observation (19, 23), we were able toanswer the former question; i.e., vessels that feed into the tumormicrocirculation are terminal arterioles modified by the tumor. In thepresent study, we answered the latter question; i.e., the major site ofvascular resistance induced by All was in terminal arterioles or pre-
capillaries. On the other hand, the site of resistance induced by epinephrine was in more central arterioles not in peripheral arterioles.Elkin and Meng (32) and Ekelund and Lunderquist (33), by means ofpharmacoangiography, and our group (18), by measuring TBF, havepreviously suggested that the sites where All act might be moreperipheral than those of adrenergic vasopressors.
5531
on June 14, 2018. © 1993 American Association for Cancer Research. cancerres.aacrjournals.org Downloaded from
MECHANISMS OF TUMOR BLOOD FLOW CHANGES
Table 3 Effects of augioÃensin II, epinephrine and methoxamine on tissue blood flow of suhculis ami s.c. tumor"
VasoprcssorAll
(2.5 fig/ml)Epincphrine (0.1 mg/ml)Methoxamine (1.1) mg/ml)n18
1513MABP(niniHglTissue
blood flow(ml/min/UX)g)N
HHXI.9
102.1106.3±
6.7 154.9 ±±9.2 158.6 ±±5.6 156.9 ±9.3
8.48.6N25.7±15.3
19.2 ±11.124.0 ±19.5Tumor43.6
8.825.7H±
19.8h±4.4"±19.3'N14.8
±7.513.3 ±7.815.4 ±6.3SuhculisH9.1
±7.4±
13.1 ±5.4"2.9*5.1CTumor
size(cm3)2.0
±1.02.2 ±1.92.4 ±1.1
" Tissue blood flow was measured simultaneously in suhculis and lumor. Values are expressed as the means ±SD. «,number of measurements; N, normotcnsion: H, hypertension.b P < 0.05.' Not significant.
To determine the actual sites where VR increased with each vaso-
pressor, we needed to measure microvascular pressure in the s.c. tissuewithin the transparent chamber because we want to know the relationship between the segmental changes in arteriolar pressure of thes.c. microcirculation within the chamber and the changes in tissueblood flow of s.c. tumor elicited by vasopressors. Therefore, it wasindispensable to adopt a reliable technology for measuring microvascular pressure. In the present study we used our microocclusion technique (20), which is one of the indirect methods. The techniqueproduced little interference on blood flow in the surrounding vesselsbecause the diameter of the needle for occluding vessels was only 100/urn.
The measured values of the pressure of successive arteriolar vesselsin the present study were lower than those in bat wing (34), ratintestine (35), skeletal muscle (36), and hamster cheek pouch (37)which were measured using a direct method. The difference is mostlikely due to the fact that the vascular pattern of each tissue showsdistinct anatomical features. In addition, as pointed out by Richardsonand Zweifach (38), the difference is in part explained by the fact that,with direct methods, only vessels with comparatively active flow aremeasured, whereas with indirect methods all microvessels includingthose with stagnant blood contribute to the results. In fact, there weremany vessels with stagnant blood in the s.c. vascular bed. Consideringthis principal difference between the two methods, the measured values in the present study appear to be reasonable.
The increase in resistance to blood flow during an injection of avasoprcssor agent is caused by the constrictor response of arteriolesand subsequently to a change in the distribution of microvascularpressure. In general, the major site of resistance in the microcirculation elicited by vasopressors is considered to correspond to the sitewhere the greatest drop in microvascular pressure occurs, a site whichcan be determined only by analyzing the relationship between micro-
vascular pressure and systemic blood pressure. Richardson and Zweifach (38), Gore (39), and Fronek and Zweifach (40) have previouslyreported the relationship between microvascular and systemic arterialblood pressure changes. To date, however, there have been no dataconcerning the relationship between increases in systemic blood pressure induced by vasopressor agents and changes in microvascularpressure. In the present study, we have identified the importance ofthis relationship with respect to the mechanism for the effect ofvasopressor agents on TBF and we have been able to measure precisely the changes in diameter and pressure of arteriolar vessels due tovasopressors.
Under All-induced hypertension, though a5 arterioles did not show
prominent changes in diameter, a4 and smaller downstream arteriolesexhibited constriction. The smaller the arteriolar size was, the greaterthe percent of vasoconstriction became. The change of diameter in a2arterioles was approximately 30%. In spite of the constrictor responseof arterioles, the pressure of all arteriolar vessels increased roughly inproportion to the increase in MABP. Only the pressure of true capillaries decreased when MABP increased from 100 to 150 mmHg dueto All administration. These facts show that the greatest pressure drop
and hence the most resistance brought about under this conditionoccurred across the a2. The constrictor response of all arterioles dueto epinephrine was much more powerful than that due to All. Epi-
nephrine contracted a5 arterioles remarkably and the amount of contractility in a4 and smaller a4 arterioles downstream reached approximately 50%. During epinephrine-induced hypertension, there were
actually two major pressure drops. The first was found between a4 anda3 arterioles, and the second was between a3 and a2. Because ofprominent vasoconstriction of the larger upstream arterioles by epinephrine, a marked decrease in flow through a2 and hence pressuredecrease of a2 was observed. We concluded that the sites of VRincrease due to epinephrine were located predominantly in a3, a4, andprobably upstream from a4 arterioles. The amount of contraction ofarteriolar vessels due to methoxamine was much smaller than that dueto epinephrine and the increase in a4 and a3 arteriolar pressure wasalso small. Unlike epinephrine, the vessel pressure in a2 showed asmall increase under methoxamine-induced hypertension. The fact
that a small increase in TBF was often brought about by methoxamineseemed to be related to the pressure increase in a2 vessels.
The constrictor response due to adrenergic vasopressors are generally considered to be mediated by the a-receptors located in vascular
smooth muscle cells (41). To date, no data regarding the density ofa-receptors on the arteriolar vascular tree have been reported. How
ever, fluorescence histochemistry (42, 43) and electron microscopy(44, 45) have shown that all segments of the arteriolar network fromlarger arterioles to smaller arterioles possess an adrenergic innervationand that the distribution density is higher in larger arterioles. It hasalso been reported that the arteriolar response correlates closely withthe distribution of adrenergic innervation (43). Accordingly, the density of adrenergic a-receptors seems to be higher in larger arterioles
which have dense adrenergic innervation. This may be the reason thata5 and a4 arterioles exhibited pronounced constrictor responses duringepinephrine-induced hypertension.
As described in a previous article (23), we have found that the sitewhere tumor vessels originate is usually the terminal portion of a2vessels (terminal arterioles). Fig. 6 illustrates schematically the connection mode between the preexisting vascular bed and the tumorvascular bed. An a2 vessel initially showed contractility, but, as soonas tumor angiogenesis initiated, the a2 vessel lost its contractility (19).We named the a2 vessel modified by the tumor as the "starting vessel"
(23). Starting vessels are vessels which control the tissue blood flowof tumor. In the initial stage of tumor growth, the connection modebetween a starting vessel and a2 or a3 vessels, which possesses contractility, is a "parallel circuit" (1, 46, 47). All creates greater vascular
resistance of a2 vessels to blood flow and also greater perfusionpressure of a5-a3 vessels, resulting in inflow of blood into a starting
vessel which then becomes a passive vessel. This is probably thereason that the tissue blood flow of normal subcutis always decreasedand TBF always increased in our tumor system under All-induced
hypertension. Epinephrine causes an increase in the resistance of a3,a4, and larger arterioles to blood flow and thereby tissue blood flowin subcutis and tumor almost always decreases together. The fact that
5532
on June 14, 2018. © 1993 American Association for Cancer Research. cancerres.aacrjournals.org Downloaded from
MF.e IIANISMS Ol TUMOR HI.(X)D H.OW CHAM il S
as
Fig. ft. Schematic representation of the connection meide between the preexistingvascular bed and the tumor vascular bed. /. true capillaries; «2.terminal arterioles; a.l-aS,arterioles; v, venules; *. starling vessel; arrows, direction of flow; T. tumor vascular bed.
vessels. Although the transparent chamber system used for the presentexperiments may he highly artificial, it was suited for analyzing themechanisms of change in tissue blood flow of the s.c. tumor due tovasopressors.
In conclusion, we demonstrated in the present experiment that therearc different sites of VR increase due to the administration of differentvasopressors at the microvascular level. By analyzing the sites of VRincrease due to each vasopressor agent, we were able to determine theeffect of the agents on TBF. Only those drugs which can increase theVR of a2 vessels without markedly increasing the VR of a3 vesselsand those upstream and which can create greater perfusion pressure ofthe a3 vessels and those upstream simultaneously may promise anincrease in TBF. Conversely, drugs which increase the VR of largerarterioles will lead to an decrease in TBF. We believe that some of theconfusion concerning changes in TBF by vasopressor agents can beunderstood in light of our present analyses of the changes in VRelicited by vasopressor agents in the entire arteriolar network.
ACKNOWLEDGMENTS
The authors thank Yutaka Sugai and Osamu Takahashi. Sondai SeimitsuMaterial Research Lab. Co., Ltd., for preparing the Spron microncedle formeasuring the microvascular pressure: Dr. Norman D. Cook, UniversitätsspitalZürich,for his linguistic help; and Hiroko Oikawa for her secretarial assistance.
Fig. 5. Intravital microscopic findings in subculis ((<•/()and tumor (ridili} before and REFERENCES
during angiotensin II and epinephrine administration. A. normotension (HH) mmHg); K.angiotensin Il-induced hypertension (155 mmHg); (". epinephrine-induced hypertension
(162 mmHg).
tissue blood flow in normal subcutis and tumor tissue did not changemarkedly under methoxamine-induced hypertension is probably ex
plained by the results that methoxamine showed little effects on thevascular resistance of smaller arterioles to blood flow. When the tumorincreased in size, the vascular system was involved in the tumor.However, it was observed that all arterioles except starting vesselswithin a tumor constricted and arteriolar pressure increased with theadministration of All until immediately before necrosis, although thecontractility lowered with tumor age (data not shown). We considerthat in larger tumors, an increase in TBF due to All might be drivenby an enlargement of the pressure gradient between a3 and tumor
1. Suzuki, M.. Hori. K., Abe. I., Saito. S., and Sato, H. Functional characterization of themicrocirculation in lumors. Cancer Metastasis Rev., 3: 115-126, 1984.
2. Jain. R. K.. and Ward-Hartley. K. Tumor blood tlow-charaeteri/alion, modificationsand role in hypcrthcrmia. IEEE Trans. Sonics Ultrasonics, SU-.?/: 504-526, 1984.
3. Mori. K.. Suzuki, M.. Tanda, S.. Sailo, S., and Zhang, 0-H. Functional characterization of developing tumor vascular system and drug delivery (Review). Int. J. Oncol.,2: 289-296, 1993.
4. Suzuki, M., Hori, K., Abe, I.. Saito, S., and Sato, H. A new approach to cancerchemotherapy. Selective enhancement of tumor blood How with angiotensin II. 1.Nail. Cancer Inst., f>7: 663-669, 1981.
5. Suzuki, M.. Hori. K., Sailo. S.. Tanda, S.. Abe. I., Sato, H., and Sato, H. Functionalcharacteristics of tumor vessels: selective increase in tumor blood tlow. Sci. Rep. Res.Inst. Tohoku Univ. [Med], ,?6: 37-45, 1989.
h. Hori. K., Suzuki. M., Abe, I., Saito, S.. and Sato, H. Increase in tumor vascular areadue to increased blood flow by angiotensin II in rals. J. Nati. Cancer Inst., 74:453-459, 1985.
7. Hori. K.. Suzuki. M.. Abe. I., and Saito, S. Changes in tumor transvascular pressuredifference associated with tumor growth: implications for angioiensin-induced hypertension chemotherapy. Oan To Kagaku Ryoho. 12: 1630-1637, 1985.
5533
on June 14, 2018. © 1993 American Association for Cancer Research. cancerres.aacrjournals.org Downloaded from
MECHANISMS OF TUMOR BLOOD FLOW CHANGES
8. Abe. I.. Hori, K.. Sailo. S., Tanda, S., Li, Y, and Suzuki. M. Increased intratumorconccnlralion of fluorcscein-isothiocyanatc-labeled neocarzinostatin in rats underangiotcnsin-induced hypertension. Jpn. J. Cancer Res.. 79: 874-879, 1988.
9. Suzuki. M., Hori, K., Sailo, S., Tanda, S., Shinozaki, M., and Zhang, 0-H. Biomi-croscopic analysis of intralumor concentration of daunorubicin in rats under angio-tcnsin-induced hypertension with TV system. Kosankinbyo Kenkyusho Zasshi. 42:189-193, 1990.
10. Suzuki, M.. Hori, K.. Abc, I., Saito, S., and Sato. H. Selective increase in tumoroxygen tension with angiotensin II. Invasion Metastasis, 2: 33-39, 1982.
11. Trotter, M. J., Chaplin, D. J., and Olive, P. L. Effect of angiotensin II on intermittenttumour blood flow and acute hypoxia in the murine SCCVII carcinoma. Eur. J.Cancer, 27: 887-893, 1991.
12. Sato, H.. Sato, K., Sato, Y, Asamura, M., Kanamaru, R., Sugiyama. Z., Kitahara, T..Mimatü,Y. Wakui. A., Suzuki, M., Hori, K., Abe, I., Saito, S., and Sato, H. Inducedhypertension chemotherapy of cancer patients by selective enhancement of drugdelivery to tumor tissue with angiotensin II. Sci. Rep. Res. Inst. Tohoku Univ. [MedJ,28: 32-44, 1981.
13. Zhang, 0-H., Suzuki. M.. Sailo, S., Hori, K., Tanda. S., Abe, I., and Shinozaki. M.Effectiveness of chemotherapy under angiotensin II-induced hypertension on advanced CNS leukemia. Kosankinbyo Kenkyusho Zasshi, 42: 171-181, 1990.
14. Sato, H.. Urushiyama, M.. Sugiyama. K.. Ishizuka, K., Hoshi, M.. and Wakui. A. Doseintensity and clinical response in advanced gastric carcinoma patients treated withinduced hypertension chemotherapy. Gan To Kagaku Ryoho, 17: 564-569, 1990.
15. Sato, H., Wakui, A.. Hoshi, M., Kurihara. M., Yokoyama, M.. and Shimizu. H.Randomized controlled trial of induced hypertension chemotherapy (IHC) usingangiotensin II human (TY-10721) in advanced gastric carcinoma (TY-10721 IHCStudy Group Report). Gan To Kagaku Ryoho. 18: 451-460, 1991.
16. Nakamura, M., Takahashi, T.. Sato, H., Hoshi. M., Wakui, A., and Kanamaru. R.Histopathologic.il evaluation on the effect of induced hypertension chemotherapypresurgically performed in patients with advanced carcinoma of the stomach. TohokuJ. Exp. Med.. 167: 27-37, 1992.
17. Edlich, R. F.. Rogers. W.. DeShazo, C. V., and Ausi, J. B. Effect of vasoactive drugson tissue blood flow in the hamster melanoma. Cancer Res., 26: 1420-1424, 1966.
18. Li, Y, Hori, K., Suzuki, M., Abe, I.. Saito. S., and Tanda, S. The effects of variousvasoactive agents on tumor blood flow in rats. Kosankinbyo Kenkyusho Zasshi, 40:295-303, 1988.
19. Hori, K., Suzuki. M.. Tanda, S., and Saito, S. Characterization of helerogeneousdistribution of tumor blood flow in the rat. Jpn. J. Cancer Res., 82: 109-117, 1991.
20. Hori. K., Suzuki. M., Abe. I., Saito, S.. and Sato, H. A micro-occlusion techniquefor measurement of the microvascular pressure in tumor and subcutis. Gann, 74:122-127, 1983.
21. Aukland. K.. Bower. B. F.. and Berliner, R. W. Measurement of local blood flow withhydrogen gas. Circ. Res., 14: 164-187, 1964.
22. Hori, K., Suzuki, M., Tanda. S., Saito. S.. Shinozaki, M., and Zhang, 0-H. Fluctuations in tumor blood flow under normotension and the effect of angiotensin II-inducedhypertension. Jpn. J. Cancer Res., 82: 1309-1316, 1991.
23. Hori. K., Suzuki. M.. Tanda. S.. and Saito. S. In vivo analysis of tumor vascularizationin the ral. Jpn. J. Cancer Res., 81: 279-288, 1990.
24. Engelson, E. T.. Schmid-Schönbein. G. W., and Zweifach. B. W. The microvascula-
ture in skeletal muscle. II. Arteriolar network anatomy in normotensive and spontaneously hypertensive rats. Microvasc. Res., 31: 356-374 1986.
25. le Nobel, J. L. M. L., Tangelder, G. J., Slaaf, D. W., van Essen, H., Reneman. R. S.,and Struyker-Boudier, H. A. J. A functional morphometric study of the cremastermuscle microcirculation in young spontaneously hypertensive rats. J. Hypertens., 8:741-748, 1990.
26. Strahler, A. N. Quantitative analysis of watershed geomorphology. Trans. Am. Geo-phys. Union, 38: 913-920, 1957.
27. Zweifach, B. W. Quantitative studies of microcirculatory structure and function. I.Analysis of pressure distribution in the terminal vascular bed in cat mesentery. Circ.Res., 34: 843-857, 1974.
28. Frasher, W. G.. and Wayland. H. A repeating modular organization of the microcir-cutation of cat mesentery. Microvasc. Res.. 4: 62-76, 1972.
29. Sobin. S. S., and Tremer. H. M. Three-dimensional organization of microvascular
beds as related to function. In: G. Kaley and B. M. Altura (eds.). Microcirculation,Vol. 1, pp. 43-67. Baltimore: University Park Press. 1977.
30. Tanda, S., Hori, K., Saito. S., Shinozaki. M.. Zhang. Q-H., and Su/uki. M. Comparison of the effects of intravenously bolus-administered endolhelin-1 and infused an
giotensin II on the subcutaneous tumor blood flow in aneslhetized rats. Jpn. J. CancerRes., 82: 958-963, 1991.
31. Hori. K.. Suzuki. M.. Tanda. S.. Saito. S.. Shinozaki. M.. and Zhang. Q-H. Orcadian
variation of tumor blood flow in rat subcutaneous tumors and its alteration byangiolensin II-induced hypertension. Cancer Res., 52: 912-916, 1992.
32. Elkin. M., and Meng. C-H. The effects of angiotensin on renal vascularity in dogs.Am. J. Roentgenol.. 98: 927-934, 1966.
33. Ekelund. L.. and Lunderquist. A. Pharmacoangiography with angiotensin. Radiology.lili: 533-540. 1974.
34. Wiederhielm, C. A., and Weston. B. V. Microvascular. lymphatic, and tissue pressuresin the unancsthetized mammal. Am. J. Physiol.. 225: 992-996. 1973.
35. Bohlen, H. G.. and Gore. R. W. Comparison of microvascular pressures and diametersin the innervated and denervated rat intestine. Microvasc. Res.. 14: 251-264. 1977.
36. Meininger. G. A, Fehr. K. L., and Yates, M. B. Anatomic and hemodynamic characteristics of the blood vessels feeding the cremasler skeletal muscle in the rat. Microvasc. Res., 33: 81-97, 1987.
37. Davis. M. J.. Ferrer. P. N., and Gore, R. W. Vascular anatomy and hydrostatic pressureprofile in the hamster cheek pouch. Am. J. Physiol., 250: H29I-H303, 1986.
38. Richardson. D. R., and Zweifach, B. W. Pressure relationships in the macro- andmicrocirculation of the mesentery. Microvasc. Res., 2: 474—J88, 1970.
39. Gore, R. W. Pressures in cat mescntcric arterioles and capillaries during changes insystemic arterial blood pressure. Circ. Res.. 34: 581-591, 1974.
40. Fronek. K., and Zweifach, B. W. Microvascular pressure distribution in skeletalmuscle and the effect of vasodilation. Am. J. Physiol., 22«:791-796, 1975.
41. Marshall. J. M. The influence of the sympathetic nervous system on individualvessels of the microcirculation of skeletal muscle of the rat. J. Physiol. (London), 332:169-186, 1982.
42. Furness. J. B., and Marshall. J. M. Correlation of the directly observed responses ofmesenteric vessels of the rat to nerve stimulation and noradrenaline with the distribution of adrenergic nerves. J. Physiol. (1-ondon), 239: 75-88, 1974.
43. Fleming, B. P.. Gibbins. I. L.. Morris, J. L.. and Cannon, B. J. Noradrenergic andpeptidergic innervation of the extrinsic vessels and microcirculation of the rat cremaster muscle. Microvasc. Res., 38: 255-268, 1989.
44. Rhodin. J. A. G. The ultrastructure of mammalian arterioles and precapillary sphincters. J. Ultrastruct. Res., 18: 181-223, 1967.
45. Burnstock, G. Innervation of vascular smooth muscle: histochemistry and electronmicroscopy. Clin. Exp. Pharmacol. Physiol.(Suppl.), 2 :7-20. 1975.
46. Kruuv, J. A., Inch. W. R., and McCredie, J. A. Blood flow and oxygénationof tumorsin mice. II. Effects of vasodilator drugs. Cancer (Phila.), 20: 60-65, 1967.
47. Chan. R. C., Babbs. C. F.. Vetter. R. J.. and Lámar,C. H. Abnormal response of tumorvasculaturc to vasoactive drugs. J. Nati. Cancer Inst.. 72: 145-150. 1984.
5534
on June 14, 2018. © 1993 American Association for Cancer Research. cancerres.aacrjournals.org Downloaded from
1993;53:5528-5534. Cancer Res Katsuyoshi Hori, Qiu-Hang Zhang, Sachiko Saito, et al. Morphometric Studyto Angiotensin II, Epinephrine, and Methoxamine: A Functional Microvascular Mechanisms of Change in Tumor Blood Flow Due
Updated version
http://cancerres.aacrjournals.org/content/53/22/5528
Access the most recent version of this article at:
E-mail alerts related to this article or journal.Sign up to receive free email-alerts
Subscriptions
Reprints and
To order reprints of this article or to subscribe to the journal, contact the AACR Publications
Permissions
Rightslink site. Click on "Request Permissions" which will take you to the Copyright Clearance Center's (CCC)
.http://cancerres.aacrjournals.org/content/53/22/5528To request permission to re-use all or part of this article, use this link
on June 14, 2018. © 1993 American Association for Cancer Research. cancerres.aacrjournals.org Downloaded from