Embed Size (px)
Citation preview
Cancer Res Treat. 2014;46(2):109-123
pISSN 1598-2998, eISSN 2005-9256
http://dx.doi.org/10.4143/crt.2014.46.2.109
Special Article Open Access
Cancer Statistics in Korea: Incidence, Mortality, Survival, and Prevalence in 2011
│ http://www.cancerresearchandtreatment.org ││ http://www.e-crt.org │
109Copyright ⓒ 2014 by the Korean Cancer AssociationThis is an Open-Access article distributed under the terms of the Creative Commons Attribution Non-Commercial License (http://creativecommons.org/
licenses/by-nc/3.0/)which permits unrestricted non-commercial use, distribution, and reproduction in any medium, provided the original work is properly cited.
1The Korea Central Cancer Registry,2National Cancer Control Institute, National Cancer Center, Goyang, Korea
Purpose
This study aimed to report nationwide cancer statistics in Korea, including incidence,
mortality, survival, and prevalence, and their trends.
Materials and Methods
Incidence data from 1993 to 2011 were obtained from the Korea National Cancer
Incidence Database, and vital status was followed through December 31, 2012.
Mortality data from 1983 to 2011 were obtained from Statistics Korea. Crude and
age-standardized rates for incidence, mortality, and prevalence, and relative survival
were calculated.
Results
A total of 218,017 cancer cases and 71,579 cancer deaths were reported to have
occurred in 2011, and there were 1,097,253 prevalent cases identified in Korea as
of January 1, 2012. Over the past 13 years (1999-2011), overall incidence rates have
increased by 3.4% per year. The incidence rates of liver and cervical cancers have
decreased, while those of thyroid, breast, prostate, and colorectal cancers have
increased. Notably, thyroid cancer increased by 23.3% per year in both sexes, and
became the most common cancer since 2009. The mortality for all cancers combined
decreased by 2.7% per year from 2002 to 2011. Five-year relative survival rates of
patients diagnosed in the last 5 years (2007-2011) have improved by 25.1%
compared with those from 1993 to 1995.
Conclusion
Overall cancer mortality rates have declined since 2002 in Korea, while incidence
has increased rapidly and survival has improved.
Key words
Incidence, Mortality, Survival, Prevalence, Neoplasms, Korea
Introduction
Cancer has been the leading cause of death in Korea since1983 [1] and is the most burdensome disease [2]. More than200,000 new cancer cases are diagnosed in Korea each year,and cancer is responsible for one in four total deaths [3]. Thisarticle reports the most recent nationwide cancer statistics inKorea, including incidence, mortality, survival, prevalence,and their trends.
1. Data sources
The Ministry of Health and Welfare, Korea, initiated a nationwide hospital-based cancer registry called the KoreaCentral Cancer Registry (KCCR) in 1980. The registry collected 80-90% of cancer cases annually from more than 180training hospitals throughout the country. In 1999, the KCCRexpanded cancer registration to cover the entire populationunder the Population-Based Regional Cancer Registry program. Details of the history, objectives, and activities of
Kyu-Won Jung,MS1,2
Young-Joo Won, PhD1,2
Hyun-Joo Kong,MS1,2
Chang-Mo Oh,MD, PhD1,2
Duk Hyoung Lee,MD, PhD2
Jin Soo Lee,MD, PhD1
+ + + + + + + + + + + + + + + + + + + + + + + + + + + + + + + + + + + + + + + + + + + + + + + + + + + + + + + + + + + ++ + + + + + + + + + + + + + + + + + + + + + + + + + + + + + + + + + + + + + + + + + + + + + + + + + + + + + + + + + + ++ + + + + + + + + + + + + + + + + + + + + + + + + + + + + + + + + + + + + + + ++ + + + + + + + + + + + + + + + + + + ++ + + + + + + + + + + + + + + + + + + + + + + + + + + + + + + + + + + + + + + ++ + + + + + + + + + + + + + + + + + + ++ + + + + + + + + + + + + + + + + + + ++ + + + + + + + + + + + + + + + + + + ++ + + + + + + + + + + + + + + + + + + ++ + + + + + + + + + + + + + + + + + + ++ + + + + + + + + + + + + + + + + + + +
Correspondence: Young-Joo Won, PhD
The Korea Central Cancer Registry,
National Cancer Center, 323 Ilsan-ro,
Ilsandong-gu, Goyang 410-769, Korea
Tel: 82-31-920-2015
Fax: 82-31-920-2179
E-mail: [email protected]
Received March 9, 2014
Accepted March 18, 2014
학회지(46-2)_in 14. 4. 14. 오후 1:55 페이지 109
Cancer Res Treat. 2014;46(2):109-123
110 CANCER RESEARCH AND TREATMENT
the KCCR have been documented elsewhere [4]. Incidencedata for 1999-2011 were obtained from the Korea NationalCancer Incidence Database (KNCI DB). The completeness ofincidence data for 2011 was 97.1%, as determined by the Ajikimethod [5].
Cancer cases were classified according to the InternationalClassification of Diseases for Oncology, 3rd edition [6] andconverted according to the International Classification of Diseases, 10th edition (ICD-10) [7]. The survival analysisused 2,197,413 cancer cases first diagnosed between 1993 and2011 from the KNCI DB, and followed vital status until December 31, 2012.
Mortality data from 1983 to 2011 were obtained from Statistics Korea [1]. Cause of death was coded and classifiedaccording to ICD-10 [7]. Population data were also obtainedfrom Statistics Korea using the resident registration popula-tion on July 1 of specified years.
2. Analysis
Crude rates (CRs) and age-specific rates of cancer inci-dence and mortality were calculated. Age-standardized rates(ASRs) were calculated using Segi’s world standard popula-tion [8]. Cumulative risks of cancer, which represent theprobability of developing cancer during one’s lifetime, werealso calculated. Changes in the annual ASRs of cancer inci-dence were examined by calculating the annual percentagechange over a time period as (exp(b)‒1)×100, where b is theslope of the regression of log ASR for a given calendar year[9].
Prevalence was also calculated to assess cancer burden,which includes new and pre-existing cancer patients diag-nosed during a given time period still alive on an index date.Using cancer incidence database data from 1999 to 2011, wedefined prevalent cases as patients who were diagnosed
Site/TypeNew cases Deaths Prevalent casesa)
Both Male Female Both Male Female Both Male Female
All sites 218,017 110,151 107,866 71,579 44,860 26,719 1,097,253 491,505 605,748
Lip, oral cavity, 2,876 2,102 774 940 727 213 15,525 10,517 5,008
and pharynx
Esophagus 2,245 2,053 192 1,507 1,368 139 6,813 6,157 656
Stomach 31,637 21,344 10,293 9,719 6,321 3,398 188,995 125,526 63,469
Colon and rectum 28,112 17,157 10,955 7,660 4,351 3,309 154,816 92,236 62,580
Liver 16,463 12,189 4,274 10,946 8,226 2,720 47,698 35,689 12,009
Gallbladderb) 4,993 2,479 2,514 3,701 1,825 1,876 13,531 6,895 6,636
Pancreas 5,080 2,807 2,273 4,379 2,394 1,985 6,379 3,504 2,875
Larynx 1,108 1,042 66 387 354 33 8,143 7,651 492
Lung 21,753 15,167 6,586 15,867 11,503 4,364 48,795 31,857 16,938
Breast 16,015 73 15,942 2,018 19 1,999 117,652 523 117,129
Cervix uteri 3,728 - 3,728 989 - 989 41,077 - 41,077
Corpus uteri 1,921 - 1,921 217 - 217 13,563 - 13,563
Ovary 2,010 - 2,010 901 - 901 12,918 - 12,918
Prostate 8,952 8,952 - 1,403 1,403 0 42,157 42,157 -
Testis 226 226 - 20 20 0 1,979 1,979 -
Kidney 3,989 2,722 1,267 834 583 251 23,076 15,549 7,527
Bladder 3,549 2,847 702 1,169 853 316 23,779 19,358 4,421
Brain and CNS 1,592 847 745 1,214 663 551 8,013 4,160 3,853
Thyroid 40,568 7,006 33,562 389 116 273 215,178 33,112 182,066
Hodgkin lymphoma 259 163 96 49 36 13 1,812 1,154 658
Non-Hodgkin lymphoma 4,367 2,396 1,971 1,389 809 580 23,627 12,837 10,790
Multiple myeloma 1,050 589 461 661 357 304 3,431 1,842 1,589
Leukemia 2,862 1,598 1,264 1,557 904 653 13,672 7,527 6,145
Other and ill-defined 12,662 6,392 6,270 3,663 2,028 1,635 64,624 31,275 33,349
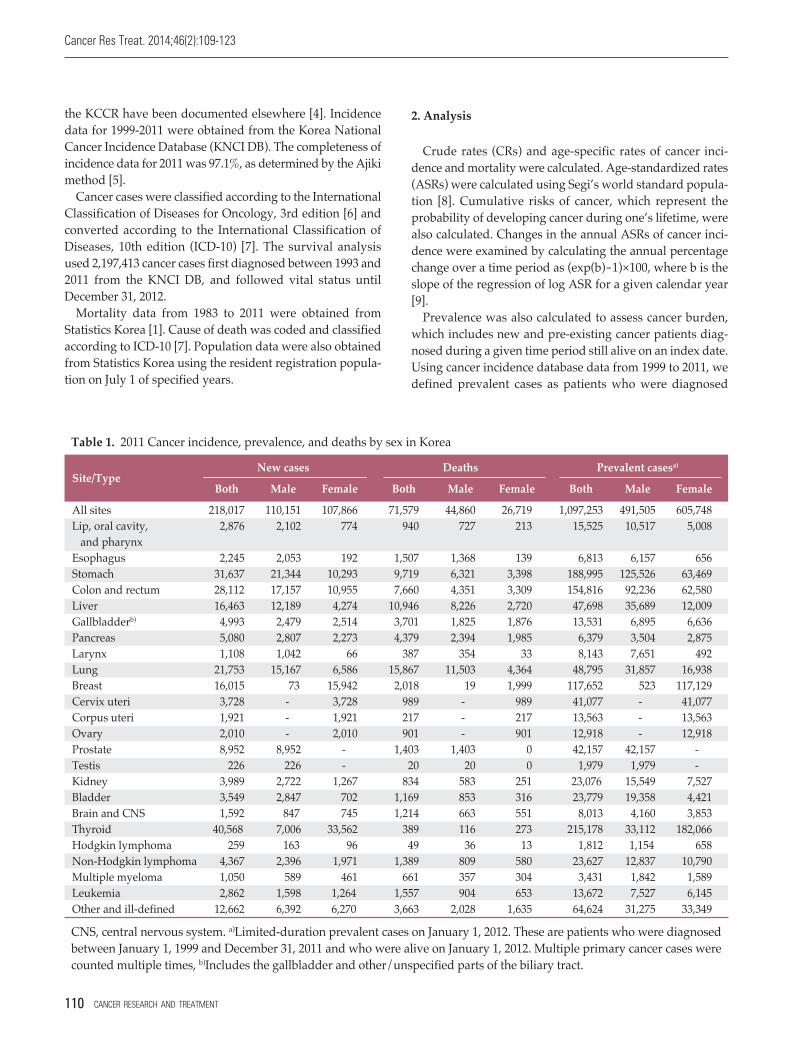
CNS, central nervous system. a)Limited-duration prevalent cases on January 1, 2012. These are patients who were diagnosedbetween January 1, 1999 and December 31, 2011 and who were alive on January 1, 2012. Multiple primary cancer cases werecounted multiple times, b)Includes the gallbladder and other/unspecified parts of the biliary tract.
Table 1. 2011 Cancer incidence, prevalence, and deaths by sex in Korea
학회지(46-2)_in 14. 4. 14. 오후 1:55 페이지 110
Kyu-Won Jung, Cancer Statistics in Korea, 2011
VOLUME 46 NUMBER 2 APRIL 2014 111
between January 1, 1999 and December 31, 2011, and stillalive on January 1, 2012. We calculated limited-durationprevalences, namely, 1- and 5-year prevalences. For example,the 5-year prevalence was calculated as the number of peoplealive on January 1, 2012 who had been diagnosed with cancerwithin the previous 5 years. We applied this countingmethod using the SEER*Stat software [10] to calculate thenumber of cases while adjusting for patients lost to follow-up.
The survival duration for each case was determined as theinterval between the date of initial diagnosis and the date ofdeath, date of loss to follow-up, or closing date for follow-up. Observed survival rates were calculated using the life-table method and relative survival rates with the EdererII method [11] were based on an algorithm written in SAS byPaul Dickman [12], with some minor modifications.
Selected Findings
1. Incidence
The overall number of incident cancer cases, deaths, andprevalent cases by sex and cancer site for 2011 in Korea areshown in Table 1. A total of 218,017 incident cancer cases and71,579 deaths were reported to occur in 2011. As of January1, 2012, 1,097,253 prevalent cancer cases diagnosed between1999 and 2011 were identified. The cumulative risk of devel-oping cancer during one’s lifetime in 2011 was 38.1% formales and 33.8% for females.
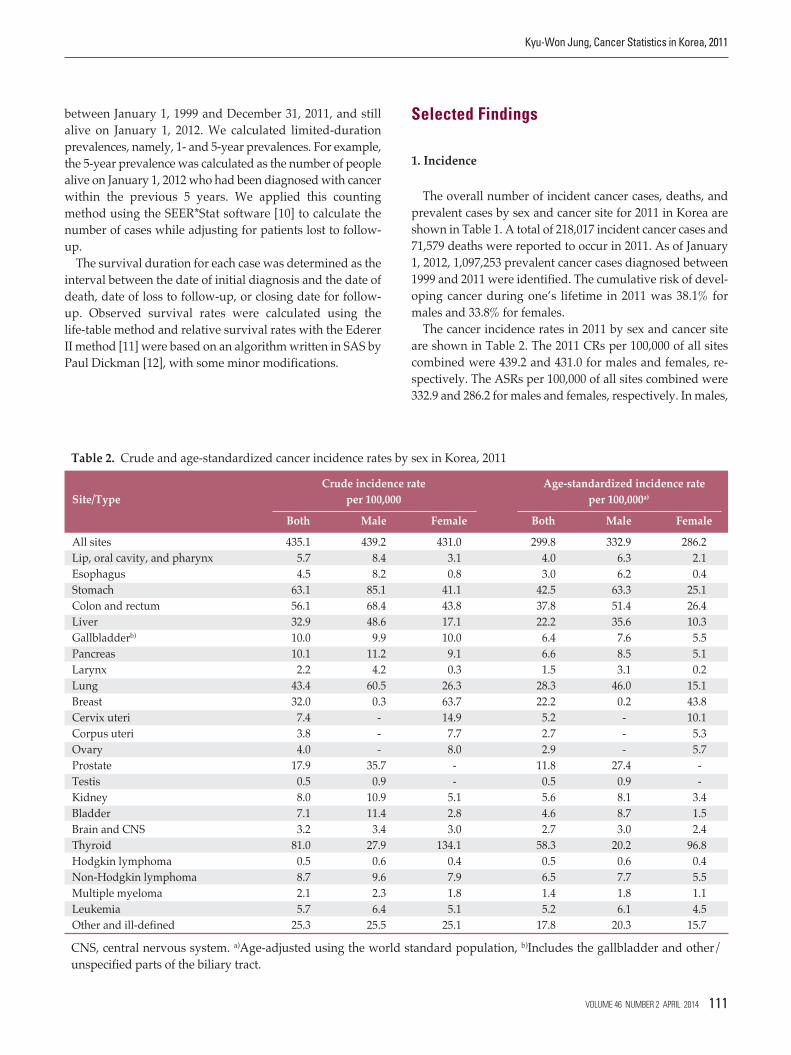
The cancer incidence rates in 2011 by sex and cancer siteare shown in Table 2. The 2011 CRs per 100,000 of all sitescombined were 439.2 and 431.0 for males and females, re-spectively. The ASRs per 100,000 of all sites combined were332.9 and 286.2 for males and females, respectively. In males,
Crude incidence rate Age-standardized incidence rate
Site/Type per 100,000 per 100,000a)
Both Male Female Both Male Female
All sites 435.1 439.2 431.0 299.8 332.9 286.2
Lip, oral cavity, and pharynx 5.7 8.4 3.1 4.0 6.3 2.1
Esophagus 4.5 8.2 0.8 3.0 6.2 0.4
Stomach 63.1 85.1 41.1 42.5 63.3 25.1
Colon and rectum 56.1 68.4 43.8 37.8 51.4 26.4
Liver 32.9 48.6 17.1 22.2 35.6 10.3
Gallbladderb) 10.0 9.9 10.0 6.4 7.6 5.5
Pancreas 10.1 11.2 9.1 6.6 8.5 5.1
Larynx 2.2 4.2 0.3 1.5 3.1 0.2
Lung 43.4 60.5 26.3 28.3 46.0 15.1
Breast 32.0 0.3 63.7 22.2 0.2 43.8
Cervix uteri 7.4 - 14.9 5.2 - 10.1
Corpus uteri 3.8 - 7.7 2.7 - 5.3
Ovary 4.0 - 8.0 2.9 - 5.7
Prostate 17.9 35.7 - 11.8 27.4 -
Testis 0.5 0.9 - 0.5 0.9 -
Kidney 8.0 10.9 5.1 5.6 8.1 3.4
Bladder 7.1 11.4 2.8 4.6 8.7 1.5
Brain and CNS 3.2 3.4 3.0 2.7 3.0 2.4
Thyroid 81.0 27.9 134.1 58.3 20.2 96.8
Hodgkin lymphoma 0.5 0.6 0.4 0.5 0.6 0.4
Non-Hodgkin lymphoma 8.7 9.6 7.9 6.5 7.7 5.5
Multiple myeloma 2.1 2.3 1.8 1.4 1.8 1.1
Leukemia 5.7 6.4 5.1 5.2 6.1 4.5
Other and ill-defined 25.3 25.5 25.1 17.8 20.3 15.7
CNS, central nervous system. a)Age-adjusted using the world standard population, b)Includes the gallbladder and other/unspecified parts of the biliary tract.
Table 2. Crude and age-standardized cancer incidence rates by sex in Korea, 2011
학회지(46-2)_in 14. 4. 14. 오후 1:55 페이지 111
Cancer Res Treat. 2014;46(2):109-123
112 CANCER RESEARCH AND TREATMENT
Table 3. The top 10 leading causes of death in Korea for 2011
Rank Cause of death No. of deaths Percentage of all deathsAge-standardized death rate
per 100,000a)
All causes 257,396 100.0 331.9
1 Cancer 71,579 27.8 91.8
2 Cerebrovascular disease 25,404 9.9 30.3
3 Heart disease 24,944 9.7 30.5
4 Intentional self-harm (suicide) 15,906 6.2 23.4
5 Diabetes mellitus 10,775 4.2 13.0
6 Pneumonia 8,606 3.3 10.2
7 Chronic lower respiratory diseases 6,959 2.7 8.0
8 Disease of liver 6,751 2.6 9.0
9 Transport accidents 6,316 2.5 9.7
10 Hypertensive diseases 5,038 2.0 5.9
Others 75,118 29.2 99.9
Source: Mortality data, 2011, Statistics Korea [1]. a)Age-adjusted using the world standard population.
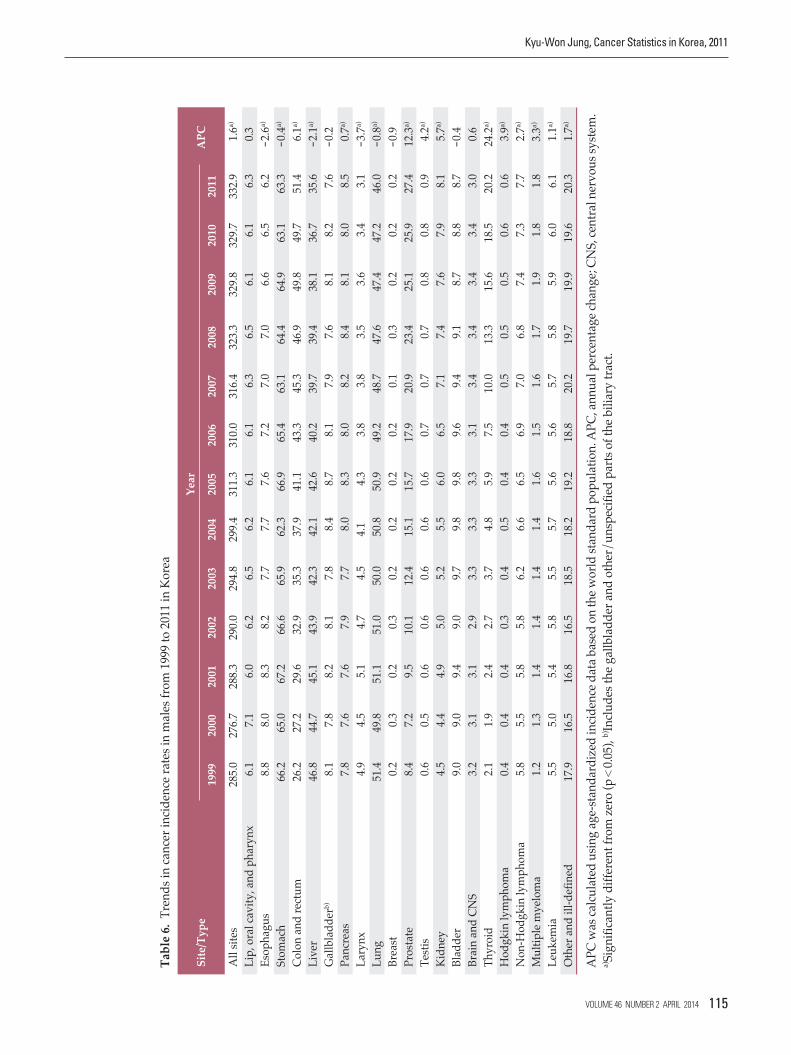
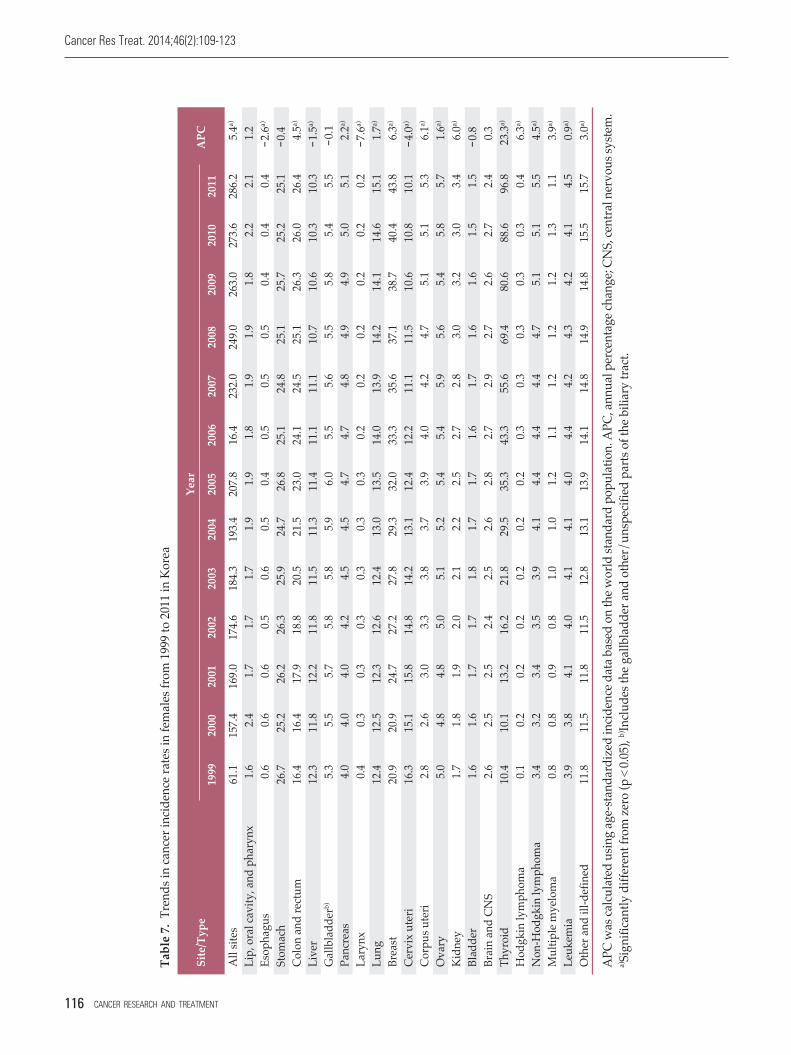
the five leading primary cancer sites were stomach (CR, 85.1;ASR, 63.3), colon and rectum (CR, 68.4; ASR, 51.4), lung (CR,60.5; ASR, 46.0), liver (CR, 48.6; ASR, 35.6), and prostate (CR,35.7; ASR, 27.4), which together accounted for 67.9% of allnewly diagnosed cancers in 2011. In females, the most common cancer site was thyroid (CR, 134.1; ASR, 96.8), followed by breast (CR, 63.7; ASR, 43.8), colon and rectum(CR, 43.8; ASR, 26.4), stomach (CR, 41.1; ASR, 25.1), and lung(CR, 26.3; ASR, 15.1), which together accounted for 71.7% ofall newly diagnosed cancers. Thyroid cancer alone accountedfor 31.1% of incident cases (n=33,562) among females in 2011.
2. Mortality
A total of 71,579 cancer deaths were reported in Korea for2011, accounting for 27.8% of all deaths (Table 3). In 2011, theCRs per 100,000 for all sites combined were 178.9 and 106.7in males and females, respectively. The ASRs per 100,000 forall sites combined were 137.3 and 59.1 for males and females,respectively. Cancers of the lung, liver, stomach, andcolon/rectum were the main leading causes of cancer death,together accounting for approximately 61.7% of all cancerdeaths in 2011 (Table 4).
In males, the five most common sites of cancer death in2011 were lung (CR, 45.9; ASR, 35.0), liver (CR, 32.8; ASR,24.3), stomach (CR, 25.2; ASR, 19.3), colon and rectum (CR,17.3; ASR, 13.4), and pancreas (CR, 9.5; ASR, 7.3). In women,lung cancer (CR, 17.4; ASR, 9.1) was the leading cause of cancer death in 2011, followed by stomach (CR, 13.6; ASR,7.1), colon and rectum (CR, 13.2; ASR, 6.9), liver (CR, 10.9;ASR, 6.1), and breast (CR, 8.0; ASR, 5.2).
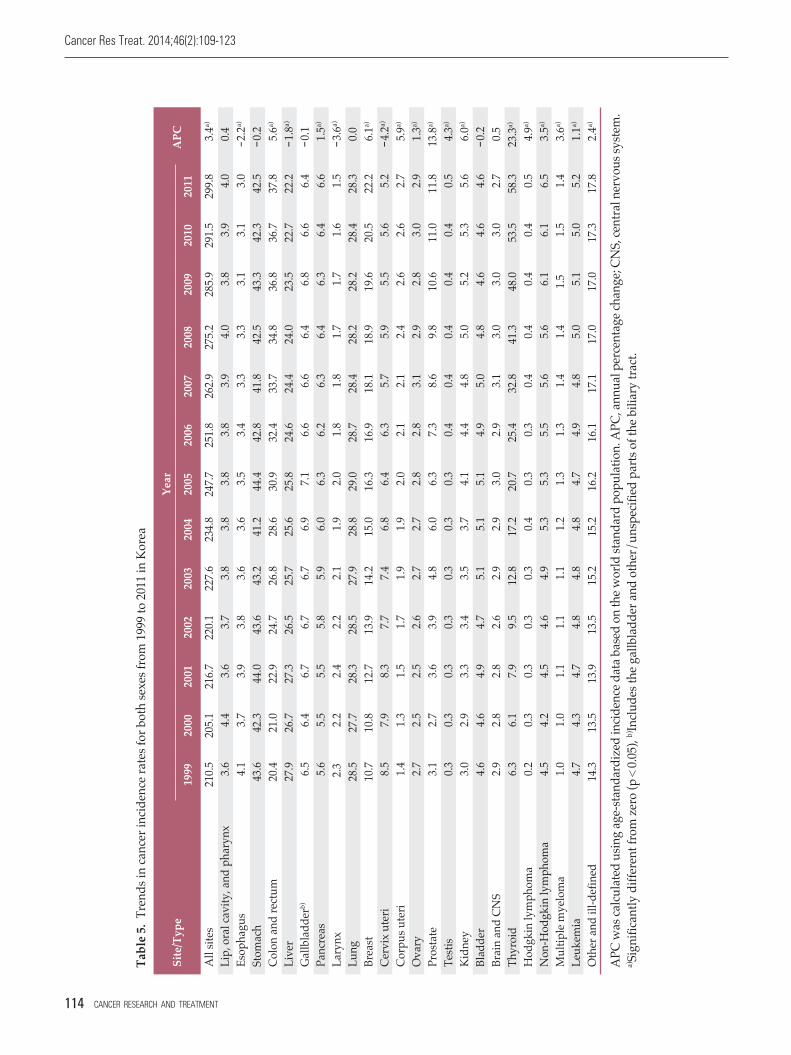
3. Trends in cancer incidence
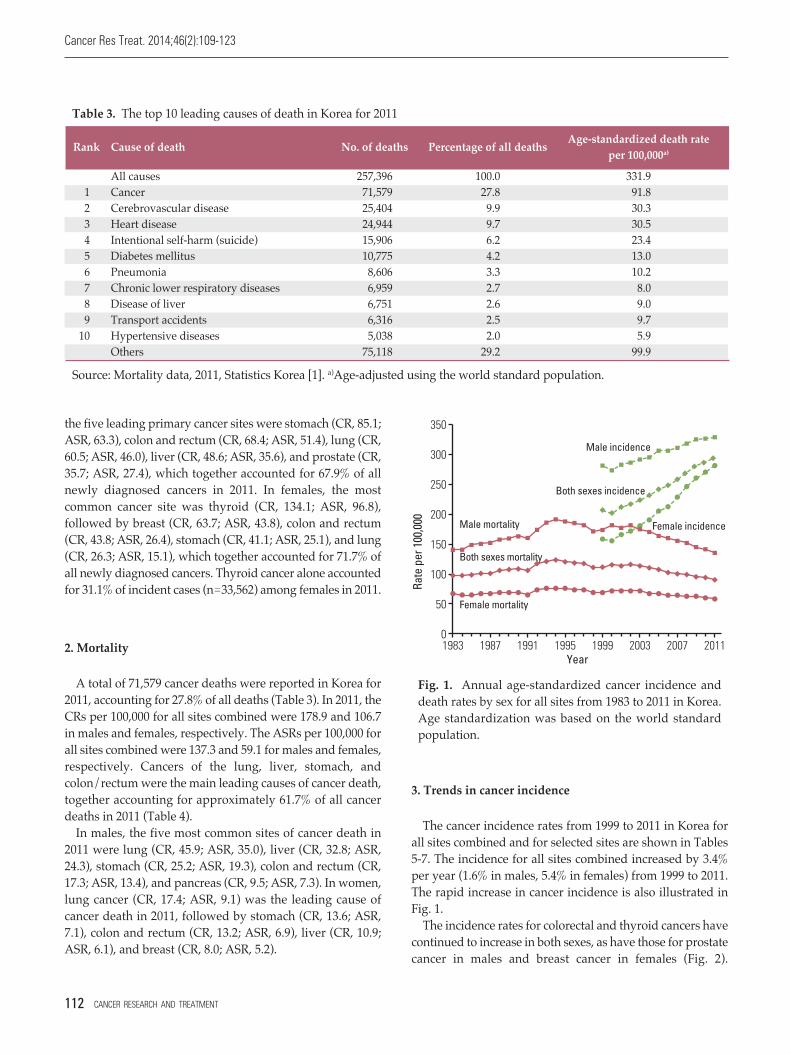
The cancer incidence rates from 1999 to 2011 in Korea forall sites combined and for selected sites are shown in Tables5-7. The incidence for all sites combined increased by 3.4%per year (1.6% in males, 5.4% in females) from 1999 to 2011.The rapid increase in cancer incidence is also illustrated inFig. 1.
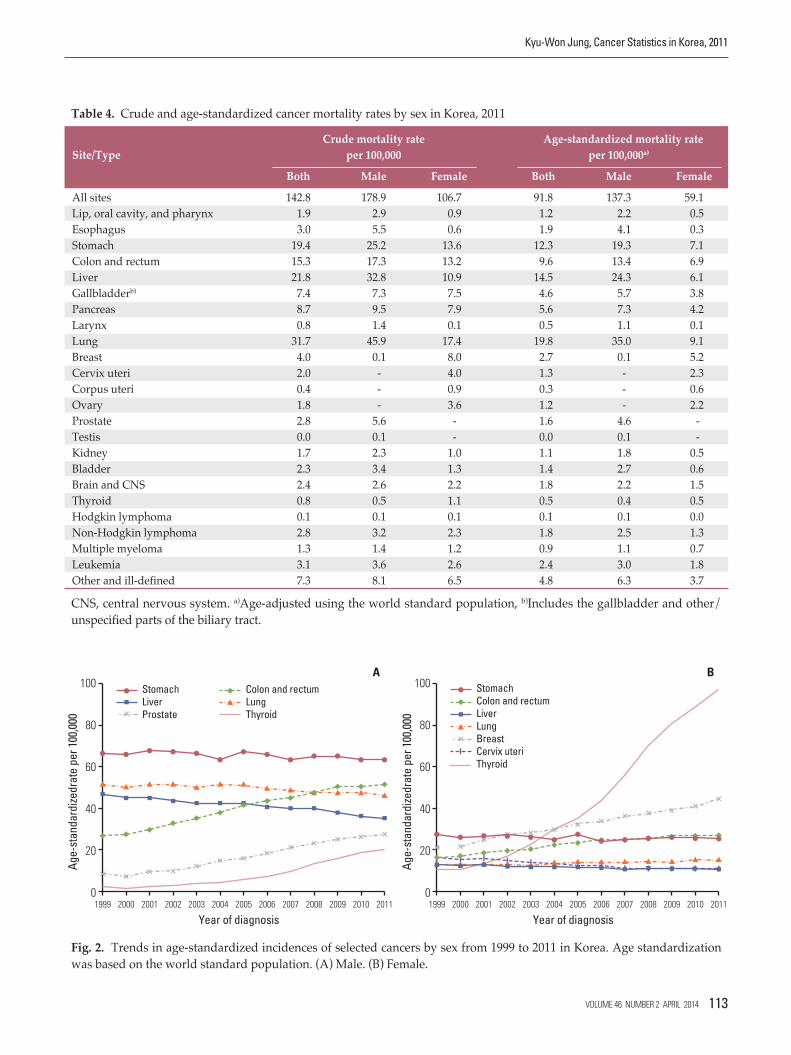
The incidence rates for colorectal and thyroid cancers havecontinued to increase in both sexes, as have those for prostatecancer in males and breast cancer in females (Fig. 2).
350
300
250
200
150
100
50
01983 19911987 19991995 2003 2007 2011
Rate
per
100
,000 Male mortality
Female mortality
Male incidence
Both sexes incidence
Female incidence
Year
Both sexes mortality
Fig. 1. Annual age-standardized cancer incidence anddeath rates by sex for all sites from 1983 to 2011 in Korea.Age standardization was based on the world standardpopulation.
학회지(46-2)_in 14. 4. 14. 오후 1:55 페이지 112
100
80
60
40
20
01999 2000 2001 2002 2003 2004 2005 2006 2007 2008 2009 2010 2011
Age-
stan
dard
izedr
ate
per 1
00,0
00
Year of diagnosis
AStomachLiverProstate
Colon and rectumLungThyroid
100
80
60
40
20
01999 2000 2001 2002 2003 2004 2005 2006 2007 2008 2009 2010 2011
Age-
stan
dard
izedr
ate
per 1
00,0
00
Year of diagnosis
BStomachColon and rectumLiverLungBreastCervix uteriThyroid
Fig. 2. Trends in age-standardized incidences of selected cancers by sex from 1999 to 2011 in Korea. Age standardizationwas based on the world standard population. (A) Male. (B) Female.
Crude mortality rate Age-standardized mortality rate
Site/Type per 100,000 per 100,000a)
Both Male Female Both Male Female
All sites 142.8 178.9 106.7 91.8 137.3 59.1
Lip, oral cavity, and pharynx 1.9 2.9 0.9 1.2 2.2 0.5
Esophagus 3.0 5.5 0.6 1.9 4.1 0.3
Stomach 19.4 25.2 13.6 12.3 19.3 7.1
Colon and rectum 15.3 17.3 13.2 9.6 13.4 6.9
Liver 21.8 32.8 10.9 14.5 24.3 6.1
Gallbladderb) 7.4 7.3 7.5 4.6 5.7 3.8
Pancreas 8.7 9.5 7.9 5.6 7.3 4.2
Larynx 0.8 1.4 0.1 0.5 1.1 0.1
Lung 31.7 45.9 17.4 19.8 35.0 9.1
Breast 4.0 0.1 8.0 2.7 0.1 5.2
Cervix uteri 2.0 - 4.0 1.3 - 2.3
Corpus uteri 0.4 - 0.9 0.3 - 0.6
Ovary 1.8 - 3.6 1.2 - 2.2
Prostate 2.8 5.6 - 1.6 4.6 --
Testis 0.0 0.1 - 0.0 0.1 --
Kidney 1.7 2.3 1.0 1.1 1.8 0.5
Bladder 2.3 3.4 1.3 1.4 2.7 0.6
Brain and CNS 2.4 2.6 2.2 1.8 2.2 1.5
Thyroid 0.8 0.5 1.1 0.5 0.4 0.5
Hodgkin lymphoma 0.1 0.1 0.1 0.1 0.1 0.0
Non-Hodgkin lymphoma 2.8 3.2 2.3 1.8 2.5 1.3
Multiple myeloma 1.3 1.4 1.2 0.9 1.1 0.7
Leukemia 3.1 3.6 2.6 2.4 3.0 1.8
Other and ill-defined 7.3 8.1 6.5 4.8 6.3 3.7
CNS, central nervous system. a)Age-adjusted using the world standard population, b)Includes the gallbladder and other/unspecified parts of the biliary tract.
Table 4. Crude and age-standardized cancer mortality rates by sex in Korea, 2011
Kyu-Won Jung, Cancer Statistics in Korea, 2011
VOLUME 46 NUMBER 2 APRIL 2014 113
학회지(46-2)_in 14. 4. 14. 오후 1:55 페이지 113
Cancer Res Treat. 2014;46(2):109-123
114 CANCER RESEARCH AND TREATMENT
Tab
le 5
.T
ren
ds
in c
ance
r in
cid
ence
rat
es f
or b
oth
sex
es f
rom
199
9 to
201
1 in
Kor
ea
AP
C w
as c
alcu
late
d u
sin
g ag
e-st
and
ard
ized
inci
den
ce d
ata
base
d o
n th
e w
orld
sta
nd
ard
pop
ula
tion
. AP
C, a
nn
ual
per
cen
tage
ch
ange
; CN
S, c
entr
al n
erv
ous
syst
em.
a)Si
gnif
ican
tly
dif
fere
nt
from
zer
o (p<
0.05
), b)
Incl
ud
es t
he
gall
blad
der
an
d o
ther
/u
nsp
ecif
ied
par
ts o
f th
e bi
liar
y tr
act.
Sit
e/T
yp
eY
ear
1999
2000
2001
2002
2003
2004
2005
2006
2007
2008
2009
2010
2011
A
PC
All
sit
es21
0.5
205.
121
6.7
220.
122
7.6
234.
824
7.7
251.
826
2.9
275.
228
5.9
291.
529
9.8
-3.4
a)
Lip
, ora
l cav
ity
, an
d p
har
yn
x3.
64.
43.
63.
73.
83.
83.
83.
83.
94.
03.
83.
94.
0-0
.4a)
Eso
ph
agu
s4.
13.
73.
93.
83.
63.
63.
53.
43.
33.
33.
13.
13.
0‒
2.2a)
Stom
ach
43.6
42.3
44.0
43.6
43.2
41.2
44.4
42.8
41.8
42.5
43.3
42.3
42.5
‒0.
2a)
Col
on a
nd
rec
tum
20.4
21.0
22.9
24.7
26.8
28.6
30.9
32.4
33.7
34.8
36.8
36.7
37.8
-5.6
a)
Liv
er27
.926
.727
.326
.525
.725
.625
.824
.624
.424
.023
.522
.722
.2‒
1.8a)
Gal
lbla
dd
erb)
6.5
6.4
6.7
6.7
6.7
6.9
7.1
6.6
6.6
6.4
6.8
6.6
6.4
‒0.
1a)
Pan
crea
s5.
65.
55.
55.
85.
96.
06.
36.
26.
36.
46.
36.
46.
6-1
.5a)
Lar
yn
x2.
32.
22.
42.
22.
11.
92.
01.
81.
81.
71.
71.
61.
5‒
3.6a)
Lu
ng
28.5
27.7
28.3
28.5
27.9
28.8
29.0
28.7
28.4
28.2
28.2
28.4
28.3
-0.0
a)
Bre
ast
10.7
10.8
12.7
13.9
14.2
15.0
16.3
16.9
18.1
18.9
19.6
20.5
22.2
-6.1
a)
Cer
vix
ute
ri8.
57.
98.
37.
77.
46.
86.
46.
35.
75.
95.
55.
65.
2‒
4.2a)
Cor
pu
s u
teri
1.4
1.3
1.5
1.7
1.9
1.9
2.0
2.1
2.1
2.4
2.6
2.6
2.7
-5.9
a)
Ov
ary
2.7
2.5
2.5
2.6
2.7
2.7
2.8
2.8
3.1
2.9
2.8
3.0
2.9
-1.3
a)
Pro
stat
e3.
12.
73.
63.
94.
86.
06.
37.
38.
69.
810
.611
.011
.8-
13.8
a)
Tes
tis
0.3
0.3
0.3
0.3
0.3
0.3
0.3
0.4
0.4
0.4
0.4
0.4
0.5
-4.3
a)
Kid
ney
3.0
2.9
3.3
3.4
3.5
3.7
4.1
4.4
4.8
5.0
5.2
5.3
5.6
-6.0
a)
Bla
dd
er4.
64.
64.
94.
75.
15.
15.
14.
95.
04.
84.
64.
64.
6‒
0.2a)
Bra
in a
nd
CN
S2.
92.
82.
82.
62.
92.
93.
02.
93.
13.
03.
03.
02.
7-0
.5a)
Th
yro
id6.
36.
17.
99.
512
.817
.220
.725
.432
.841
.348
.053
.558
.323
.3a)
Hod
gk
in ly
mp
hom
a0.
20.
30.
30.
30.
30.
40.
30.
30.
40.
40.
40.
40.
5-4
.9a)
Non
-Hod
gk
in ly
mp
hom
a4.
54.
24.
54.
64.
95.
35.
35.
55.
65.
66.
16.
16.
5-3
.5a)
Mu
ltip
le m
yel
oma
1.0
1.0
1.1
1.1
1.1
1.2
1.3
1.3
1.4
1.4
1.5
1.5
1.4
-3.6
a)
Leu
kem
ia4.
74.
34.
74.
84.
84.
84.
74.
94.
85.
05.
15.
05.
2-1
.1a)
Oth
er a
nd
ill-
def
ined
14.3
13.5
13.9
13.5
15.2
15.2
16.2
16.1
17.1
17.0
17.0
17.3
17.8
-2.4
a)
학회지(46-2)_in 14. 4. 14. 오후 1:55 페이지 114
Kyu-Won Jung, Cancer Statistics in Korea, 2011
VOLUME 46 NUMBER 2 APRIL 2014 115
Tab
le 6
.T
ren
ds
in c
ance
r in
cid
ence
rat
es in
mal
es f
rom
199
9 to
201
1 in
Kor
ea
AP
C w
as c
alcu
late
d u
sin
g ag
e-st
and
ard
ized
inci
den
ce d
ata
base
d o
n th
e w
orld
sta
nd
ard
pop
ula
tion
. AP
C, a
nn
ual
per
cen
tage
ch
ange
; CN
S, c
entr
al n
erv
ous
syst
em.
a)Si
gnif
ican
tly
dif
fere
nt
from
zer
o (p<
0.05
), b)
Incl
ud
es t
he
gall
blad
der
an
d o
ther
/u
nsp
ecif
ied
par
ts o
f th
e bi
liar
y tr
act.
Sit
e/T
yp
eY
ear
1999
2000
2001
2002
2003
2004
2005
2006
2007
2008
2009
2010
2011
A
PC
All
sit
es28
5.0
276.
728
8.3
290.
029
4.8
299.
431
1.3
310.
031
6.4
323.
332
9.8
329.
733
2.9
-1.6
a)
Lip
, ora
l cav
ity
, an
d p
har
yn
x6.
17.
16.
06.
26.
56.
26.
16.
16.
36.
56.
16.
16.
3-0
.3a)
Eso
ph
agu
s8.
88.
08.
38.
27.
77.
77.
67.
27.
07.
06.
66.
56.
2‒
2.6a)
Stom
ach
66.2
65.0
67.2
66.6
65.9
62.3
66.9
65.4
63.1
64.4
64.9
63.1
63.3
‒0.
4a)
Col
on a
nd
rec
tum
26.2
27.2
29.6
32.9
35.3
37.9
41.1
43.3
45.3
46.9
49.8
49.7
51.4
-6.1
a)
Liv
er46
.844
.745
.143
.942
.342
.142
.640
.239
.739
.438
.136
.735
.6‒
2.1a)
Gal
lbla
dd
erb)
8.1
7.8
8.2
8.1
7.8
8.4
8.7
8.1
7.9
7.6
8.1
8.2
7.6
‒0.
2a)
Pan
crea
s7.
87.
67.
67.
97.
78.
08.
38.
08.
28.
48.
18.
08.
5-0
.7a)
Lar
yn
x4.
94.
55.
14.
74.
54.
14.
33.
83.
83.
53.
63.
43.
1‒
3.7a)
Lu
ng
51.4
49.8
51.1
51.0
50.0
50.8
50.9
49.2
48.7
47.6
47.4
47.2
46.0
‒0.
8a)
Bre
ast
0.2
0.3
0.2
0.3
0.2
0.2
0.2
0.2
0.1
0.3
0.2
0.2
0.2
‒0.
9a)
Pro
stat
e8.
47.
29.
510
.112
.415
.115
.717
.920
.923
.425
.125
.927
.4-
12.3
a)
Tes
tis
0.6
0.5
0.6
0.6
0.6
0.6
0.6
0.7
0.7
0.7
0.8
0.8
0.9
-4.2
a)
Kid
ney
4.5
4.4
4.9
5.0
5.2
5.5
6.0
6.5
7.1
7.4
7.6
7.9
8.1
-5.7
a)
Bla
dd
er9.
09.
09.
49.
09.
79.
89.
89.
69.
49.
18.
78.
88.
7‒
0.4a)
Bra
in a
nd
CN
S3.
23.
13.
12.
93.
33.
33.
33.
13.
43.
43.
43.
43.
0-0
.6a)
Th
yro
id2.
11.
92.
42.
73.
74.
85.
97.
510
.013
.315
.618
.520
.2-2
4.2a)
Hod
gk
in ly
mp
hom
a0.
40.
40.
40.
30.
40.
50.
40.
40.
50.
50.
50.
60.
6-3
.9a)
Non
-Hod
gk
in ly
mp
hom
a5.
85.
55.
85.
86.
26.
66.
56.
97.
06.
87.
47.
37.
7-2
.7a)
Mu
ltip
le m
yel
oma
1.2
1.3
1.4
1.4
1.4
1.4
1.6
1.5
1.6
1.7
1.9
1.8
1.8
3.3a)
Leu
kem
ia5.
55.
05.
45.
85.
55.
75.
65.
65.
75.
85.
96.
06.
1-1
.1a)
Oth
er a
nd
ill-
def
ined
17.9
16.5
16.8
16.5
18.5
18.2
19.2
18.8
20.2
19.7
19.9
19.6
20.3
-1.7
a)
학회지(46-2)_in 14. 4. 14. 오후 1:55 페이지 115
Cancer Res Treat. 2014;46(2):109-123
116 CANCER RESEARCH AND TREATMENT
Tab
le 7
.T
ren
ds
in c
ance
r in
cid
ence
rat
es in
fem
ales
fro
m 1
999
to 2
011
in K
orea
AP
C w
as c
alcu
late
d u
sin
g ag
e-st
and
ard
ized
inci
den
ce d
ata
base
d o
n th
e w
orld
sta
nd
ard
pop
ula
tion
. AP
C, a
nn
ual
per
cen
tage
ch
ange
; CN
S, c
entr
al n
erv
ous
syst
em.
a)Si
gnif
ican
tly
dif
fere
nt
from
zer
o (p<
0.05
), b)
Incl
ud
es t
he
gall
blad
der
an
d o
ther
/u
nsp
ecif
ied
par
ts o
f th
e bi
liar
y tr
act.
Sit
e/T
yp
eY
ear
1999
2000
2001
2002
2003
2004
2005
2006
2007
2008
2009
2010
2011
A
PC
All
sit
es61
.115
7.4
169.
017
4.6
184.
319
3.4
207.
816
.423
2.0
249.
026
3.0
273.
628
6.2
5.4a)
Lip
, ora
l cav
ity
, an
d p
har
yn
x1.
62.
41.
71.
71.
71.
91.
91.
81.
91.
91.
82.
22.
11.
2a)
Eso
ph
agu
s0.
60.
60.
60.
50.
60.
50.
40.
50.
50.
50.
40.
40.
4‒
2.6a)
Stom
ach
26.7
25.2
26.2
26.3
25.9
24.7
26.8
25.1
24.8
25.1
25.7
25.2
25.1
‒0.
4a)
Col
on a
nd
rec
tum
16.4
16.4
17.9
18.8
20.5
21.5
23.0
24.1
24.5
25.1
26.3
26.0
26.4
4.5a)
Liv
er12
.311
.812
.211
.811
.511
.311
.411
.111
.110
.710
.610
.310
.3‒
1.5a)
Gal
lbla
dd
erb)
5.3
5.5
5.7
5.8
5.8
5.9
6.0
5.5
5.6
5.5
5.8
5.4
5.5
‒0.
1a)
Pan
crea
s4.
04.
04.
04.
24.
54.
54.
74.
74.
84.
94.
95.
05.
12.
2a)
Lar
yn
x0.
40.
30.
30.
30.
30.
30.
30.
20.
20.
20.
20.
20.
2‒
7.6a)
Lu
ng
12.4
12.5
12.3
12.6
12.4
13.0
13.5
14.0
13.9
14.2
14.1
14.6
15.1
1.7a)
Bre
ast
20.9
20.9
24.7
27.2
27.8
29.3
32.0
33.3
35.6
37.1
38.7
40.4
43.8
6.3a)
Cer
vix
ute
ri16
.315
.115
.814
.814
.213
.112
.412
.211
.111
.510
.610
.810
.1‒
4.0a)
Cor
pu
s u
teri
2.8
2.6
3.0
3.3
3.8
3.7
3.9
4.0
4.2
4.7
5.1
5.1
5.3
6.1a)
Ov
ary
5.0
4.8
4.8
5.0
5.1
5.2
5.4
5.4
5.9
5.6
5.4
5.8
5.7
1.6a)
Kid
ney
1.7
1.8
1.9
2.0
2.1
2.2
2.5
2.7
2.8
3.0
3.2
3.0
3.4
6.0a)
Bla
dd
er1.
61.
61.
71.
71.
81.
71.
71.
61.
71.
61.
61.
51.
5‒
0.8a)
Bra
in a
nd
CN
S2.
62.
52.
52.
42.
52.
62.
82.
72.
92.
72.
62.
72.
40.
3a)
Th
yro
id10
.410
.113
.216
.221
.829
.535
.343
.355
.669
.480
.688
.696
.8-
23.
3a)
Hod
gk
in ly
mp
hom
a0.
10.
20.
20.
20.
20.
20.
20.
30.
30.
30.
30.
30.
46.
3a)
Non
-Hod
gk
in ly
mp
hom
a3.
43.
23.
43.
53.
94.
14.
44.
44.
44.
75.
15.
15.
54.
5a)
Mu
ltip
le m
yel
oma
0.8
0.8
0.9
0.8
1.0
1.0
1.2
1.1
1.2
1.2
1.2
1.3
1.1
3.9a)
Leu
kem
ia3.
93.
84.
14.
04.
14.
14.
04.
44.
24.
34.
24.
14.
50.
9a)
Oth
er a
nd
ill-
def
ined
11.8
11.5
11.8
11.5
12.8
13.1
13.9
14.1
14.8
14.9
14.8
15.5
15.7
3.0a)
학회지(46-2)_in 14. 4. 14. 오후 1:55 페이지 116
Kyu-Won Jung, Cancer Statistics in Korea, 2011
VOLUME 46 NUMBER 2 APRIL 2014 117
In contrast, the incidences of liver cancer in both sexes, lungcancer in males, and cervical cancer in females have decreased. Notably, thyroid cancer increased by 23.3% peryear rapidly in both sexes, and became the most commoncancer since 2009. Improvements in the sensitivity of diag-nostic techniques for thyroid cancer, such as the advent ofultrasound and fine-needle aspiration, have enabled the detection of small-sized thyroid cancers. Furthermore,screening rates have increased. Therefore, the increased incidence of thyroid cancer might reflect the identification ofpreviously undetected diseases rather than a true increase inthe occurrence of thyroid cancer [13-16]. Furthermore, due to the construction of a 1999-2011 KNCI DB, the completeness of the Korean cancer registry data has improved gradually, and this may have contributed, in part,to the gradual overall increases in cancer incidence, particu-larly among elderly patients.
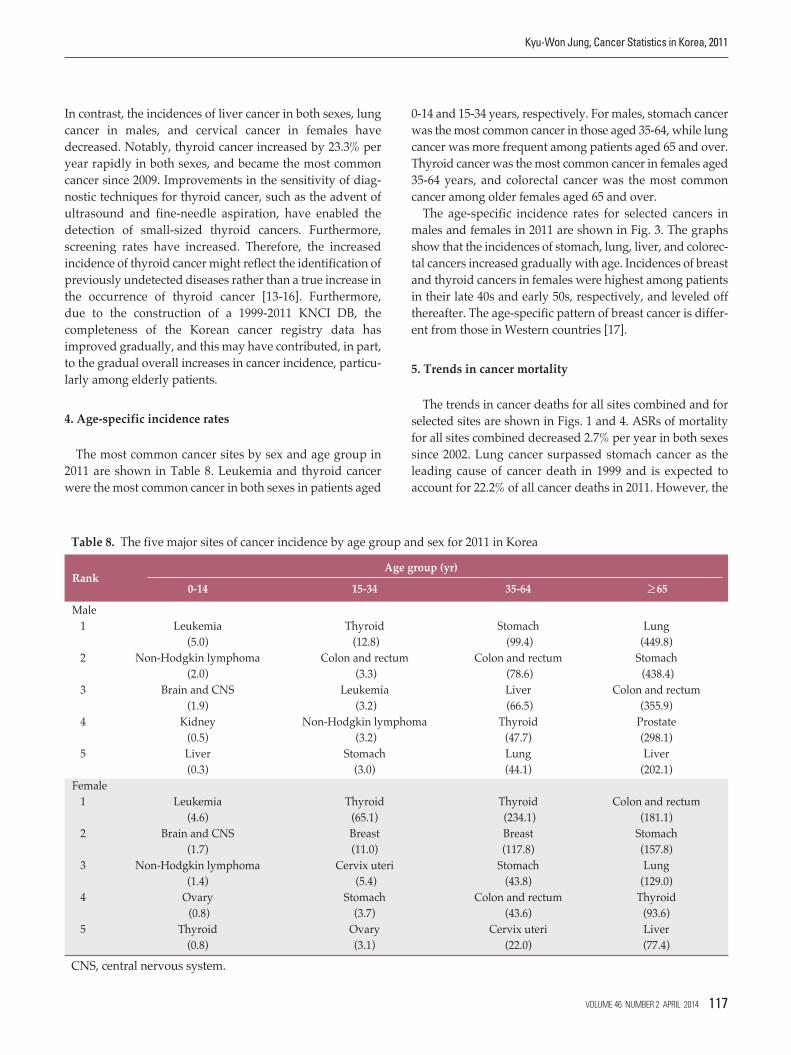
4. Age-specific incidence rates
The most common cancer sites by sex and age group in2011 are shown in Table 8. Leukemia and thyroid cancerwere the most common cancer in both sexes in patients aged
0-14 and 15-34 years, respectively. For males, stomach cancerwas the most common cancer in those aged 35-64, while lungcancer was more frequent among patients aged 65 and over.Thyroid cancer was the most common cancer in females aged35-64 years, and colorectal cancer was the most common cancer among older females aged 65 and over.
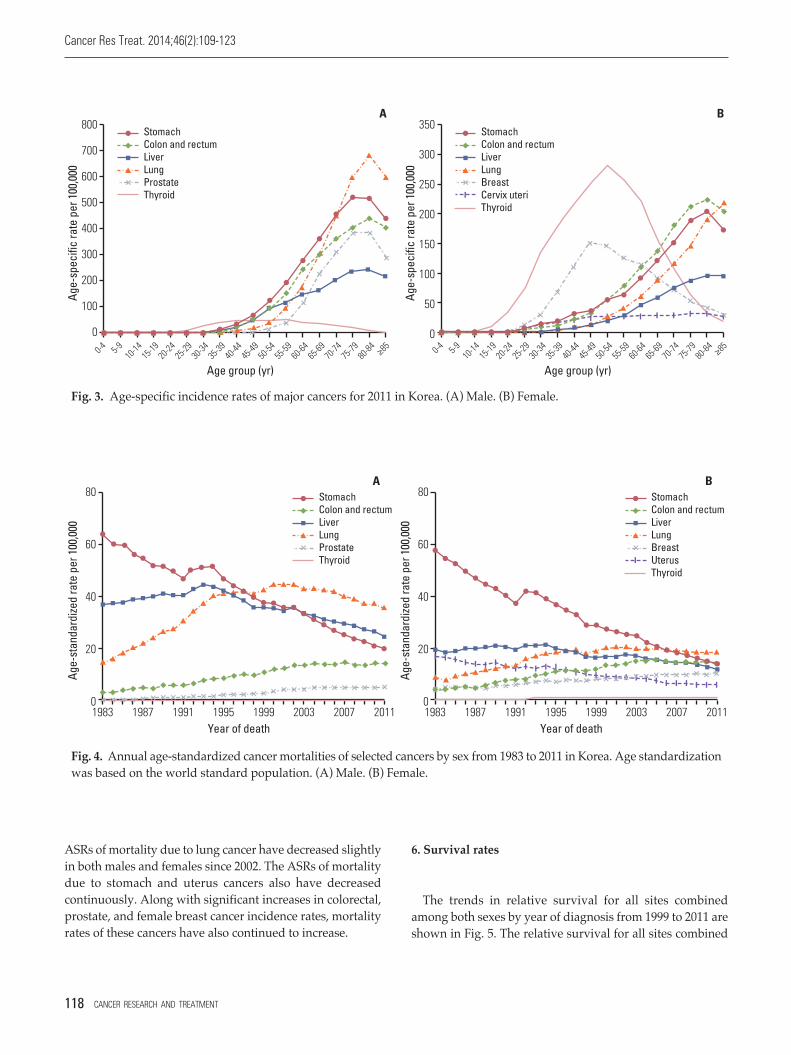
The age-specific incidence rates for selected cancers inmales and females in 2011 are shown in Fig. 3. The graphsshow that the incidences of stomach, lung, liver, and colorec-tal cancers increased gradually with age. Incidences of breastand thyroid cancers in females were highest among patientsin their late 40s and early 50s, respectively, and leveled offthereafter. The age-specific pattern of breast cancer is differ-ent from those in Western countries [17].
5. Trends in cancer mortality
The trends in cancer deaths for all sites combined and forselected sites are shown in Figs. 1 and 4. ASRs of mortalityfor all sites combined decreased 2.7% per year in both sexessince 2002. Lung cancer surpassed stomach cancer as theleading cause of cancer death in 1999 and is expected to account for 22.2% of all cancer deaths in 2011. However, the
RankAge group (yr)
0-14 15-34 35-64 ≥65
Male
1 Leukemia Thyroid Stomach Lung
(5.0) (12.8) (99.4) (449.8)
2 Non-Hodgkin lymphoma Colon and rectum Colon and rectum Stomach
(2.0) (3.3) (78.6) (438.4)
3 Brain and CNS Leukemia Liver Colon and rectum
(1.9) (3.2) (66.5) (355.9)
4 Kidney Non-Hodgkin lymphoma Thyroid Prostate
(0.5) (3.2) (47.7) (298.1)
5 Liver Stomach Lung Liver
(0.3) (3.0) (44.1) (202.1)
Female
1 Leukemia Thyroid Thyroid Colon and rectum
(4.6) (65.1) (234.1) (181.1)
2 Brain and CNS Breast Breast Stomach
(1.7) (11.0) (117.8) (157.8)
3 Non-Hodgkin lymphoma Cervix uteri Stomach Lung
(1.4) (5.4) (43.8) (129.0)
4 Ovary Stomach Colon and rectum Thyroid
(0.8) (3.7) (43.6) (93.6)
5 Thyroid Ovary Cervix uteri Liver
(0.8) (3.1) (22.0) (77.4)
CNS, central nervous system.
Table 8. The five major sites of cancer incidence by age group and sex for 2011 in Korea
학회지(46-2)_in 14. 4. 14. 오후 1:55 페이지 117
Cancer Res Treat. 2014;46(2):109-123
118 CANCER RESEARCH AND TREATMENT
ASRs of mortality due to lung cancer have decreased slightlyin both males and females since 2002. The ASRs of mortalitydue to stomach and uterus cancers also have decreased continuously. Along with significant increases in colorectal,prostate, and female breast cancer incidence rates, mortalityrates of these cancers have also continued to increase.
6. Survival rates
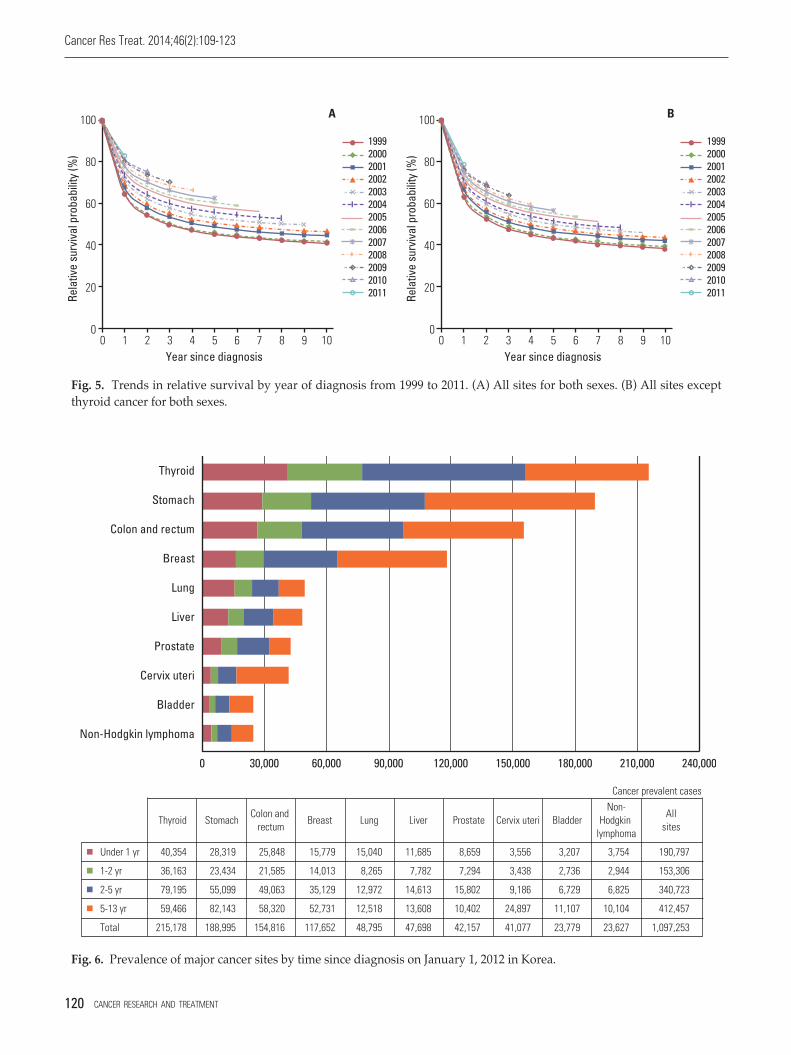
The trends in relative survival for all sites combinedamong both sexes by year of diagnosis from 1999 to 2011 areshown in Fig. 5. The relative survival for all sites combined
StomachColon and rectumLiverLungBreastUterusThyroid
80
60
40
20
01983 1999199519911987 2003 2007 2011
Age-
stan
dard
ized
rate
per
100
,000
Year of death
AStomachColon and rectumLiverLungProstateThyroid
80
60
40
20
01983 1999199519911987 2003 2007 2011
Age-
stan
dard
ized
rate
per
100
,000
Year of death
B
Fig. 4. Annual age-standardized cancer mortalities of selected cancers by sex from 1983 to 2011 in Korea. Age standardizationwas based on the world standard population. (A) Male. (B) Female.
800
700
600
500
400
300
200
100
0
0-4 5-910-14
15-19
20-24
25-29
30-34
35-39
40-44
45-49
50-54
55-59
60-64
65-69
70-74
75-79
80-84 ≥8
5
Age-
spec
ific
rate
per
100
,000
Age group (yr)
AStomachColon and rectumLiverLungProstateThyroid
350
300
250
200
150
100
50
00-4 5-9
10-14
15-19
20-24
25-29
30-34
35-39
40-44
45-49
50-54
55-59
60-64
65-69
70-74
75-79
80-84 ≥8
5
Age-
spec
ific
rate
per
100
,000
Age group (yr)
BStomachColon and rectumLiverLungBreastCervix uteriThyroid
Fig. 3. Age-specific incidence rates of major cancers for 2011 in Korea. (A) Male. (B) Female.
학회지(46-2)_in 14. 4. 14. 오후 1:55 페이지 118
Kyu-Won Jung, Cancer Statistics in Korea, 2011
VOLUME 46 NUMBER 2 APRIL 2014 119
Tab
le 9
.T
ren
ds
in t
he
5-y
ear
rela
tiv
e su
rviv
al r
ates
(%
) by
yea
r of
dia
gn
osis
fro
m 1
993
to 2
011
in K
orea
CN
S, c
entr
al n
erv
ous
syst
em. a)
Per
cen
tage
ch
ange
in
5-y
ear
rela
tiv
e su
rviv
al f
rom
199
3 to
199
5 an
d 2
007
to 2
011,
b)In
clu
des
th
e ga
llbl
add
er a
nd
oth
er/
un
spec
ifie
dp
arts
of
the
bili
ary
trac
t.
Bo
thM
ale
Fem
ale
Sit
e/T
yp
e19
93-
1996
-20
01-
2007
-C
han
gea)
1993
-19
96-
2001
-20
07-
Ch
ang
ea)19
93-
1996
-20
01-
2007
-C
han
gea)
1995
2000
2005
2011
1995
2000
2005
2011
1995
2000
2005
2011
All
sit
es41
.244
.053
.866
.325
.131
.735
.345
.257
.625
.953
.455
.364
.075
.221
.8
Lip
, ora
l cav
ity
, an
d p
har
yn
x41
.146
.754
.161
.620
.535
.841
.149
.357
.321
.558
.163
.867
.773
.215
.1
Eso
ph
agu
s 12
.715
.221
.230
.217
.511
.814
.320
.429
.717
.923
.724
.229
.535
.411
.7
Stom
ach
42.8
46.6
57.7
69.4
26.6
43.0
46.9
58.4
70.1
27.1
42.6
46.0
56.4
67.9
25.3
Col
on a
nd
rec
tum
54.8
58.0
66.6
73.8
19.0
55.3
59.0
68.5
75.8
20.5
54.2
56.8
64.1
70.7
16.5
Liv
er10
.713
.220
.228
.617
.99.
912
.920
.128
.518
.613
.614
.220
.328
.715
.1
Gal
lbla
dd
erb)
17.3
19.7
22.8
27.5
10.2
16.6
20.3
23.3
29.0
12.4
18.0
19.1
22.3
26.1
8.1
Pan
crea
s9.
47.
68.
08.
7-0
.78.
87.
38.
08.
1-0
.710
.18.
18.
19.
5-0
.6
Lar
yn
x59
.762
.366
.171
.712
.060
.262
.866
.772
.011
.855
.457
.858
.268
.112
.7
Lu
ng
11.3
12.7
16.2
20.7
9.4
10.4
11.6
15.0
18.3
7.9
14.2
16.2
19.7
26.8
12.6
Bre
ast
77.9
83.2
88.5
91.3
13.4
75.1
85.6
87.0
88.7
13.6
78.0
83.2
88.5
91.3
13.3
Cer
vix
ute
ri77
.580
.081
.380
.12.
6--
----
---
77.5
80.0
81.3
80.1
2.6
Cor
pu
s u
teri
81.5
81.8
84.6
86.5
5.0
----
---
--81
.581
.884
.686
.55.
0
Ov
ary
58.7
58.9
61.4
61.6
2.9
----
---
--58
.758
.961
.461
.62.
9
Pro
stat
e55
.967
.280
.192
.036
.155
.967
.280
.192
.036
.1--
----
----
Tes
tis
85.4
90.4
90.6
93.2
7.8
85.4
90.4
90.6
93.2
7.8
----
----
--
Kid
ney
62.0
66.1
73.3
78.8
16.8
60.8
64.4
72.8
78.4
17.6
64.5
69.7
74.5
79.5
15.0
Bla
dd
er69
.173
.175
.575
.46.
370
.074
.877
.377
.47.
465
.566
.368
.567
.01.
5
Bra
in a
nd
CN
S38
.539
.040
.641
.42.
937
.237
.540
.039
.32.
140
.240
.741
.443
.93.
7
Th
yro
id94
.294
.998
.310
0.0
5.8
87.2
89.5
95.8
100.
112
.995
.495
.998
.799
.94.
5
Hod
gk
in ly
mp
hom
a68
.071
.276
.781
.113
.167
.668
.174
.781
.113
.568
.677
.480
.681
.212
.6
Non
-Hod
gk
in ly
mp
hom
a46
.650
.859
.965
.819
.245
.348
.958
.063
.918
.648
.753
.562
.368
.219
.5
Mu
ltip
le m
yel
oma
22.1
19.8
29.3
34.6
12.5
21.1
17.8
29.6
34.6
13.5
23.3
22.1
28.9
34.7
11.4
Leu
kem
ia26
.533
.341
.848
.021
.526
.232
.341
.647
.321
.126
.834
.642
.048
.721
.9
Oth
er a
nd
ill-
def
ined
42.1
45.9
55.8
66.3
24.2
37.4
42.4
52.1
62.4
25.0
47.4
50.0
59.8
70.3
22.9
학회지(46-2)_in 14. 4. 14. 오후 1:55 페이지 119
Cancer Res Treat. 2014;46(2):109-123
120 CANCER RESEARCH AND TREATMENT
100
80
60
40
20
00 3 4 5 6 7 8 9 1021
Rela
tive
surv
ival
pro
babi
lity
(%)
Year since diagnosis
1999200020012002200320042005200620072008200920102011
100
80
60
40
20
00 3 4 5 6 7 8 9 1021
Rela
tive
surv
ival
pro
babi
lity
(%)
Year since diagnosis
1999200020012002200320042005200620072008200920102011
A B
Fig. 5. Trends in relative survival by year of diagnosis from 1999 to 2011. (A) All sites for both sexes. (B) All sites except thyroid cancer for both sexes.
Thyroid
Stomach
Colon and rectum
Breast
Lung
Liver
Prostate
Cervix uteri
Bladder
Non-Hodgkin lymphoma
0 30,000
Under 1 yr
1-2 yr
2-5 yr
5-13 yr
Total
40,354
36,163
79,195
59,466
215,178
28,319
23,434
55,099
82,143
188,995
25,848
21,585
49,063
58,320
154,816
15,779
14,013
35,129
52,731
117,652
15,040
8,265
12,972
12,518
48,795
11,685
7,782
14,613
13,608
47,698
8,659
7,294
15,802
10,402
42,157
3,556
3,438
9,186
24,897
41,077
3,207
2,736
6,729
11,107
23,779
3,754
2,944
6,825
10,104
23,627
190,797
153,306
340,723
412,457
1,097,253
60,000 90,000 120,000 150,000 180,000 210,000 240,000
Thyroid StomachColon and
rectumBreast
Cancer prevalent cases
Lung Liver Cervix uteriProstate BladderAll
sites
Non-Hodgkin
lymphoma
Fig. 6. Prevalence of major cancer sites by time since diagnosis on January 1, 2012 in Korea.
학회지(46-2)_in 14. 4. 14. 오후 1:55 페이지 120
Kyu-Won Jung, Cancer Statistics in Korea, 2011
VOLUME 46 NUMBER 2 APRIL 2014 121
increased with year of diagnosis, and also increased whenwe excluded thyroid cancer cases in our analysis.
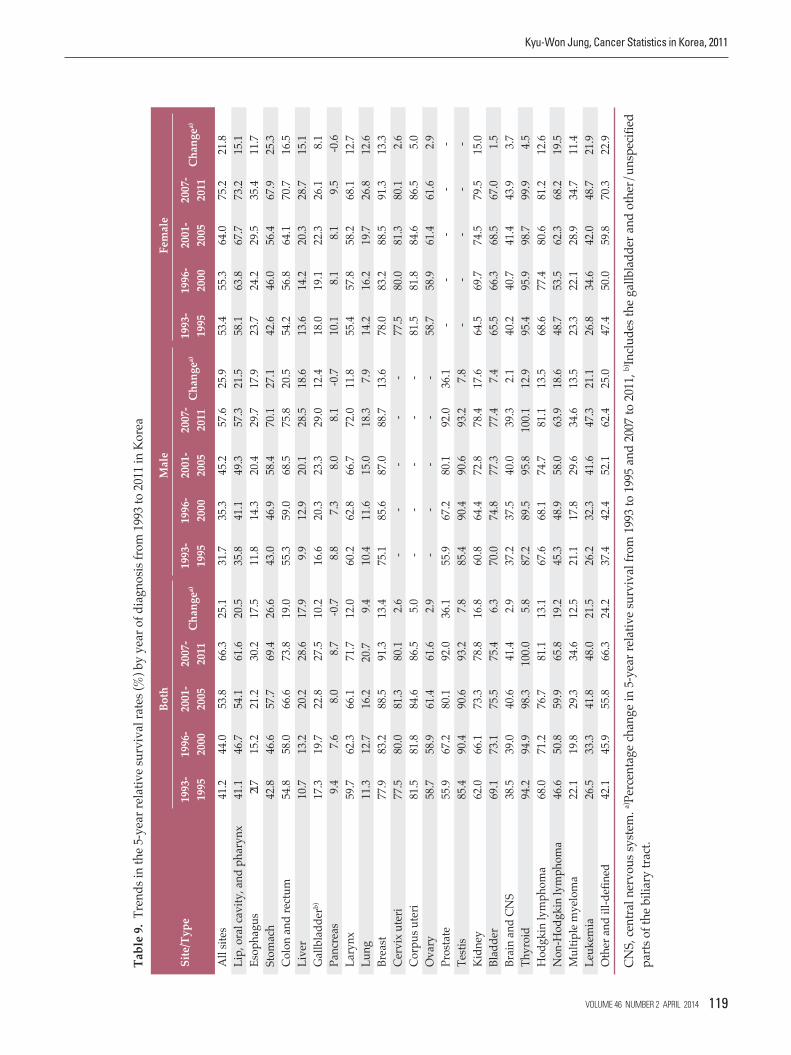
Table 9 shows the 5-year relative survival rates for four diagnosis periods: 1993-1995, 1996-2000, 2001-2005, and 2007-2011. Patients who were diagnosed with cancer in the mostrecent period (2007-2011) had a 5-year relative survival rateof 66.3% for all sites combined in both sexes (57.6% in malesand 75.2% in females). When compared with earlier periods,notable improvements in the 5-year relative survival rateswere observed for all sites combined. The higher cancer survival rate in females might be partly explained by cancerscommon in females (e.g., thyroid, breast, and cervix utericancers) having relatively good prognoses.
When examined by year of diagnosis and cancer site, the5-year relative survival rates appeared to be higher for mostmajor cancers in patients diagnosed from 2007 to 2011
compared with those diagnosed from 1993 to 1995, with theexception of pancreatic cancer. The greatest improvementswere seen in cancers of the prostate, stomach, leukemia,lip/oral cavity/pharynx, and non-Hodgkin lymphoma. The improving survival rates could be attributable to earlydetection and improved treatments [18,19], but this requiresfurther evaluation. Only pancreatic cancer showed no improvement in 5-year relative survival rate compared with1993-1995. A lack of progress in early detection and treat-ment could explain the observed absence of improvement inthe survival rate for pancreatic cancer [20].
7. Prevalence rates
The cancer prevalence rates by sex and cancer site on
Crude prevalence rate Age-standardized prevalence rate
Site/Type per 100,000a) per 100,000b)
Both Male Female Both Male Female
All sites 2,189.6 1,959.6 2,420.1 1,514.1 1,488.7 1,618.5
Lip, oral cavity, and pharynx 31.0 41.9 20.0 21.7 31.4 13.4
Esophagus 13.6 24.5 2.6 9.1 18.6 1.5
Stomach 377.1 500.5 253.6 252.7 372.7 154.9
Colon and rectum 308.9 367.7 250.0 206.3 276.4 150.7
Liver 95.2 142.3 48.0 66.2 105.6 31.0
Gallbladderc) 27.0 27.5 26.5 17.7 20.8 15.4
Pancreas 12.7 14.0 11.5 8.6 10.6 7.0
Larynx 16.2 30.5 2.0 10.9 23.2 1.2
Lung 97.4 127.0 67.7 65.1 96.2 41.3
Breast 234.8 2.1 468.0 161.1 1.6 316.3
Cervix uteri 82.0 - 164.1 55.8 - 108.4
Corpus uteri 27.1 - 54.2 18.9 - 37.1
Ovary 25.8 - 51.6 18.9 - 37.4
Prostate 84.1 168.1 - 53.0 129.0 -
Testis 3.9 7.9 - 3.6 7.1 -
Kidney 46.0 62.0 30.1 32.5 46.4 20.3
Bladder 47.5 77.2 17.7 30.6 58.7 9.6
Brain and CNS 16.0 16.6 15.4 14.2 15.1 13.3
Thyroid 429.4 132.0 727.4 304.2 94.7 512.0
Hodgkin lymphoma 3.6 4.6 2.6 3.1 3.9 2.3
Non-Hodgkin lymphoma 47.1 51.2 43.1 35.3 40.8 30.6
Multiple myeloma 6.8 7.3 6.3 4.7 5.5 4.0
Leukemia 27.3 30.0 24.6 26.5 29.4 23.6
Other and ill-defined 129.0 124.7 133.2 93.3 100.9 87.2
CNS, central nervous system. a)Crude prevalence rate: number of prevalent cases divided by the corresponding person-yearsof observation. Prevalent cases were defined as patients who were diagnosed between January 1, 1999 and December 31, 2011and who were alive on January 1, 2012. Multiple primary cancer cases were counted multiple times, b)Age-adjusted using theworld standard population, c)Includes the gallbladder and other/unspecified parts of the biliary tract.
Table 10. Crude and age-standardized rates of cancer prevalence by sex on January 1, 2012 in Korea
학회지(46-2)_in 14. 4. 14. 오후 1:55 페이지 121
Cancer Res Treat. 2014;46(2):109-123
122 CANCER RESEARCH AND TREATMENT
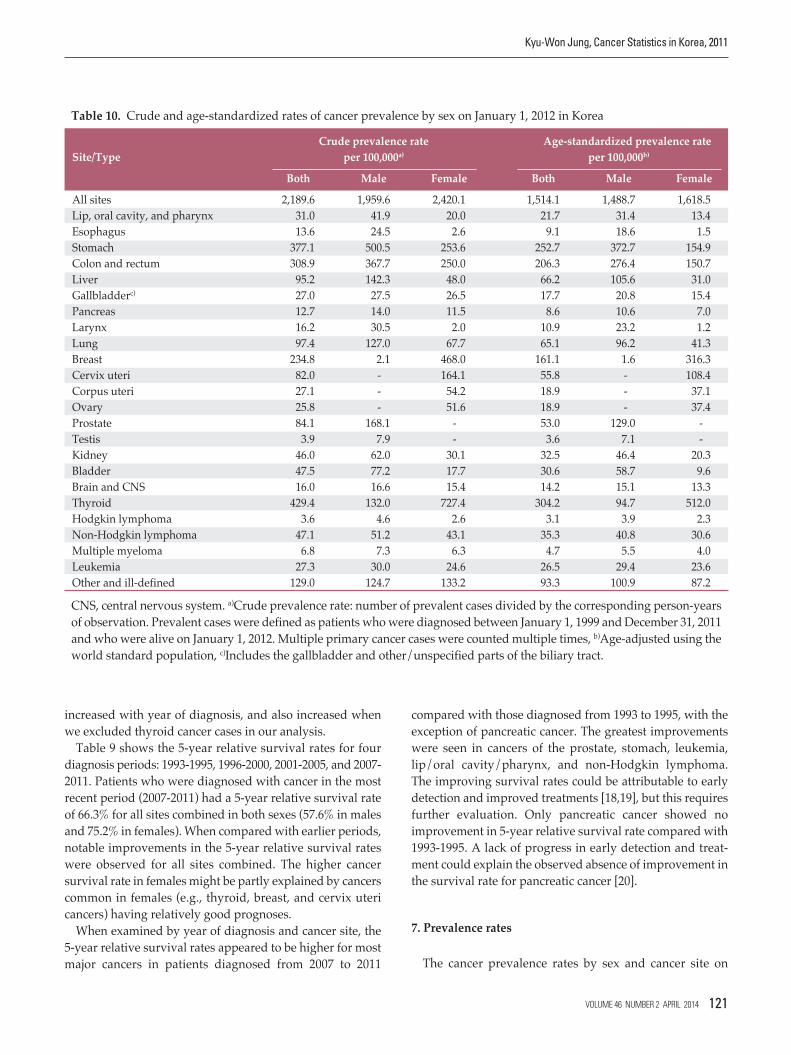
January 1, 2012 in Korea are shown in Table 10. The CRs per100,000 of cancer prevalence for all sites combined were1,959.6 and 2,420.1 in males and females, respectively, andthe ASRs per 100,000 of cancer prevalence for all sites combined were 1,488.7 and 1,618.5 in males and females, respectively. In males, the five leading primary sites of cancerfor prevalence were stomach (CR, 500.5; ASR, 372.7), colonand rectum (CR, 367.7; ASR, 276.4), prostate (CR, 168.1; ASR,129.0), liver (CR, 142.3; ASR, 105.6), and thyroid (CR, 132.0;ASR, 94.7), which together accounted for 66.9% of all preva-lent cancer cases. In females, the most common cancer sitewas thyroid (CR, 727.4; ASR, 512.0), followed by breast (CR,468.0; ASR, 316.3), stomach (CR, 253.6; ASR, 154.9), colon andrectum (CR, 250.0; ASR, 150.7), and cervix uteri (CR, 164.1;ASR, 108.4), which together accounted for 77.0% of all preva-lent cancer cases.
The prevalence by time since diagnosis is shown in Fig. 6.For all cancers combined, the 2-year prevalence constituted31.4% of all prevalent cases. The 2-year prevalence, as a percentage of the total prevalence, was highest for thyroid(22.2%), followed by stomach (15.0%) and colon and rectum(13.8%), which had high incidence rates and good prognoses.For all cancers combined in both sexes, the 2-5-year and >5-year prevalences accounted for 31.1% and 37.6% of the totalprevalence, respectively. The long-term prevalences for lung
and liver cancers were relatively low due to low survivalrates of lung cancer patients.
Conflicts of Interest
Conflict of interest relevant to this article was not reported.
Acknowledgments
This work was supported by a research grant from the National Cancer Center (No. 1310220), Republic of Korea.The authors are indebted to Korea Central Cancer Registry(KCCR)-affiliated hospitals, non-KCCR-affiliated hospitals,11 regional cancer registries (the Busan, Daegu & Gyeong-buk, Gwangju & Jeonnam, Incheon, Daejeon & Chungnam,Ulsan, Gangwon, Chungbuk, Jeonbuk, Gyeongnam andJejudo cancer registries), the National Health Insurance Service and Statistics Korea for data collection.
1. Statistics Korea [Internet]. Daejeon: Statistics Korea; 2014 [cited2014 Jan 4]. Available from: http://kosis.kr.
2. Yoon SJ, Bae SC, Lee SI, Chang H, Jo HS, Sung JH, et al. Meas-uring the burden of disease in Korea. J Korean Med Sci.2007;22:518-23.
3. Jung KW, Won YJ, Kong HJ, Oh CM, Seo HG, Lee JS. Cancerstatistics in Korea: incidence, mortality, survival and preva-lence in 2010. Cancer Res Treat. 2013;45:1-14.
4. Shin HR, Won YJ, Jung KW, Kong HJ, Yim SH, Lee JK, et al.Nationwide cancer incidence in Korea, 1999~2001: first resultusing the national cancer incidence database. Cancer ResTreat. 2005;37:325-31.
5. Ajiki W, Tsukuma H, Oshima A. Index for evaluating completeness of registration in population-based cancer registries and estimation of registration rate at the Osaka Cancer Registry between 1966 and 1992 using this index.Nihon Koshu Eisei Zasshi. 1998;45:1011-7.
6. Fritz A, Percy C, Jack A, Shanmugaratnam K, Sobin L, ParkinDM, et al. International classification of diseases for oncology.3rd ed. Geneva: World Health Organization; 2000.
7. World Health Organization. International statistical classifica-tion of diseases and related health problems. 10th rev. Geneva:World Health Organization; 1994.
8. Segi M. Cancer mortality for selected sites in 24 countries(1950-1957). Sendai: Tohoku University School of Medicine;1960.
9. Howlader N, Noone AM, Krapcho M, Garshell J, Neyman N,Altekruse SF, et al. SEER cancer statistics review, 1975-2010.Bethesda: National Cancer Institute; 2013.
10. National Cancer Institute. SEER*Stat Program, version 6.6.1[Internet]. Bethesda: National Cancer Institute; 2013 [cited2013 Jan 4]. Available from: http://seer.cancer.gov/seerstat/.
11. Ederer F, Heise H. Instructions to IBM 650 programmers inprocessing survival computations. Methodological note. No.10. Bethesda: National Cancer Institute; 1959.
12. Paul Dickman [Internet]. Stockholm: PaulDickman.com; 2014[cited 2014 Jan 14]. Available from: http://www.pauldick-man.com.
13. Davies L, Welch HG. Increasing incidence of thyroid cancerin the United States, 1973-2002. JAMA. 2006;295:2164-7.
14. Enewold L, Zhu K, Ron E, Marrogi AJ, Stojadinovic A, PeoplesGE, et al. Rising thyroid cancer incidence in the United Statesby demographic and tumor characteristics, 1980-2005. CancerEpidemiol Biomarkers Prev. 2009;18:784-91.
15. Han MA, Choi KS, Lee HY, Kim Y, Jun JK, Park EC. Currentstatus of thyroid cancer screening in Korea: results from
References
학회지(46-2)_in 14. 4. 14. 오후 1:55 페이지 122
VOLUME 46 NUMBER 2 APRIL 2014 123
a nationwide interview survey. Asian Pac J Cancer Prev. 2011;12:1657-63.
16. Kim SY. Study to provide evidence of health screening servicefor thyroid cancer. Seoul: National Evidence-based HealthcareCollaborating Agency; 2012.
17. Forman D, Bray F, Brewster DH, Gombe Mbalawa C, KohlerB, Pineros M, et al. Cancer incidence in five continents. Vol. 10(electronic version). Lyon: IARC Press; 2013.
18. Jung KW, Yim SH, Kong HJ, Hwang SY, Won YJ, Lee JK, et al.
Cancer survival in Korea 1993-2002: a population-based study.J Korean Med Sci. 2007;22 Suppl:S5-10.
19. Gondos A, Bray F, Hakulinen T, Brenner H; EUNICE SurvivalWorking Group. Trends in cancer survival in 11 Europeanpopulations from 1990 to 2009: a model-based analysis. AnnOncol. 2009;20:564-73.
20. Dickman PW, Adami HO. Interpreting trends in cancer patient survival. J Intern Med. 2006;260:103-17.
Kyu-Won Jung, Cancer Statistics in Korea, 2011
학회지(46-2)_in 14. 4. 14. 오후 1:55 페이지 123