Embed Size (px)
Citation preview

Accepted Manuscript
Cannabis for the Management of Pain: Assessment of Safety Study (COMPASS)
Mark A. Ware, MBBS MRCP MSc, Tongtong Wang, BMed PhD, Stan Shapiro, PhD,Jean-Paul Collet, MD PhD, for the COMPASS study team, Aline Boulanger, MD, JohnM. Esdaile, MD, Allan Gordon, MD, Mary Lynch, MD, Dwight E. Moulin, MD, ColleenO’Connell, MD
PII: S1526-5900(15)00837-8
DOI: 10.1016/j.jpain.2015.07.014
Reference: YJPAI 3129
To appear in: Journal of Pain
Received Date: 25 January 2015
Revised Date: 18 July 2015
Accepted Date: 28 July 2015
Please cite this article as: Ware MA, Wang T, Shapiro S, Collet J-P, for the COMPASS studyteam, Boulanger A, Esdaile JM, Gordon A, Lynch M, Moulin DE, O’Connell C, Cannabis for theManagement of Pain: Assessment of Safety Study (COMPASS), Journal of Pain (2015), doi: 10.1016/j.jpain.2015.07.014.
This is a PDF file of an unedited manuscript that has been accepted for publication. As a service toour customers we are providing this early version of the manuscript. The manuscript will undergocopyediting, typesetting, and review of the resulting proof before it is published in its final form. Pleasenote that during the production process errors may be discovered which could affect the content, and alllegal disclaimers that apply to the journal pertain.

MANUSCRIP
T
ACCEPTED
ACCEPTED MANUSCRIPT
Cannabis for the Management of Pain: Assessment of Safety Study (COMPASS)
Mark A. Ware MBBS MRCP MSc1, Tongtong Wang BMed PhD2, Stan Shapiro PhD2,3, Jean-Paul Collet MD PhD4 for the COMPASS study team*
*Aline Boulanger MD5, John M. Esdaile MD6, Allan Gordon MD7, Mary Lynch MD8, Dwight E. Moulin MD9, Colleen O’Connell MD10
Institutional affiliations: 1Departments of Anesthesia and Family Medicine, McGill University, Montreal, Quebec, Canada 2Department of Epidemiology, Biostatistics and Occupational Health, McGill University, Montreal, Quebec, Canada 3Centre for Clinical Epidemiology, Jewish General Hospital, Montreal, Quebec, Canada 4Department of Pediatrics, University of British Columbia; Child and Family Research Institute, Vancouver, British Columbia, Canada 5Department d’anesthesie, Université de Montreal, Montreal, Quebec, Canada 6Division of Rheumatology, University of British Columbia, Vancouver, British Columbia, Canada 7Department of Neurology, University of Toronto, Toronto, Ontario, Canada 8Departments of Anesthesia, Psychiatry and Pharmacology, Dalhousie University, Halifax, Nova Scotia, Canada 9Departments of Clinical Neurological Sciences and Oncology, Western University, London, Ontario, Canada 10Department of Physical Medicine and Rehabilitation, Stan Cassidy Centre for Rehabilitation, Fredericton, New Brunswick, Canada Address for reprints and correspondence: Dr. Mark A. Ware A5.140 Montreal General Hospital 1650 Cedar Avenue Montreal, Quebec H9S 4Y5 Canada Tel: (514) 934-8222 Fax: (514) 934-8096 Email: [email protected] Disclosures: The study was funded by the Canadian Institutes of Health Research (MOL-66262). MW receives salary support from the FRQS and the Louise and Alan Edwards Foundation and has a research grant to his institution from

MANUSCRIP
T
ACCEPTED
ACCEPTED MANUSCRIPTVersion 17 July 2015 Page 2 of 37
CanniMed. ML is a founding board member of Panag Pharm Inc, a start up company researching topical non-psychotropic cannabinoids for pain and inflammation, a medical advisor to Abide Therapeutics researching agents to modulate the endocannabinoid system for the treatment of pain, and is a co-investigator on a clinical trial sponsored by Prairie Plant Systems.DM has received speaker’s honoraria and/or consulting fees from Pfizer Canada, Eli Lilly Canada Inc., Janssen Pharmaceuticals and Purdue Pharma Canada. AB discloses consultancies or advisory boards to Bedrocan, CanniMed, Jansen, Johnson & Johnson, Lilly, Merck, Mettrum,Pfizer and Purdue pharma. TW, SS, JPC, AG, CO, JE report no conflicts

MANUSCRIP
T
ACCEPTED
ACCEPTED MANUSCRIPTVersion 17 July 2015 Page 3 of 37
Abstract
Cannabis is widely used as a self-management strategy by patients with a wide
range of symptoms and diseases including chronic noncancer pain. The safety of
cannabis use for medical purposes has not been systematically evaluated.
We conducted a prospective cohort study to describe safety issues among subjects
with chronic noncancer pain. A standardized herbal cannabis product (12.5%
THC) was dispensed to eligible subjects for a one-year period; controls were
subjects with chronic pain from the same clinics who were not cannabis users.
The primary outcome consisted of serious adverse events (SAEs) and non-serious
adverse events (AEs). Secondary safety outcomes included pulmonary and
neurocognitive function and standard hematology, biochemistry, renal, liver and
endocrine function. Secondary efficacy parameters included pain and other
symptoms, mood, and quality of life.
Two hundred and fifteen individuals with chronic pain were recruited to the
cannabis group (141 current users and 58 ex-users) and 216 controls (chronic pain
but no current cannabis use) from seven clinics across Canada. The median daily
cannabis dose was 2.5g/d. There was no difference in risk of SAEs (adjusted
IRR=1.08, 95% CI=0.57-2.04) between groups. Medical cannabis users were at
increased risk of non-serious AEs (adjusted IRR=1.73, 95% CI=1.41-2.13); most
were mild to moderate. There were no differences in secondary safety
assessments.
Quality-controlled herbal cannabis, when used by cannabis-experienced patients
as part of a monitored treatment program over one year, appears to have a

MANUSCRIP
T
ACCEPTED
ACCEPTED MANUSCRIPTVersion 17 July 2015 Page 4 of 37
reasonable safety profile. Longer term monitoring for functional outcomes is
needed.
Study registration
The study was registered with www.controlled-trials.com (ISRCTN19449752).
Perspective
This study evaluated the safety of cannabis use by patients with chronic pain over
one year. The study found that there was a higher rate of adverse events among
cannabis users compared to controls but not for serious adverse events at an
average dose of 2.5g herbal cannabis per day.
Key words
Cannabis, safety, chronic pain, adverse events, cohort study

MANUSCRIP
T
ACCEPTED
ACCEPTED MANUSCRIPTVersion 17 July 2015 Page 5 of 37
Introduction
The medical use of cannabis is an issue of major public health importance.
Several countries have policies to allow patients to possess and use cannabis for
medical purposes. Recently, Health Canada released the Marihuana for Medical
Purposes Regulations 8 which require a signed document from a health
professional for a patient to access cannabis for medical purposes. A lack of data
on the safety and efficacy of cannabis is a major barrier to physicians’
involvement.
Several randomized controlled trials of smoked cannabis have shown efficacy in
chronic pain and spasticity 1,4,17,18. These trials have been short (1-3 weeks of
exposure) with small sample sizes (n= 20-60 subjects). Several oral cannabinoid
prescription medications are available, and adverse events from clinical trials of
these compounds have been reviewed 16; some have been studied for periods of
up to one year 14,19. Given the potential health concerns of recreational cannabis
use 11, more safety data on the long-term medical use of herbal cannabis are
needed.
We conducted a multicenter cohort study to evaluate safety issues in patients with
chronic pain using cannabis as part of their pain management regimen.
Methods
Objectives
The primary objective was to assess the risk of adverse events associated with
cannabis when used in the treatment of chronic pain. Secondary objectives were
to examine the effects of cannabis on pulmonary and neurocognitive function and

MANUSCRIP
T
ACCEPTED
ACCEPTED MANUSCRIPTVersion 17 July 2015 Page 6 of 37
to explore effectiveness of cannabis on chronic pain, including pain intensity and
quality of life.
Study design
A prospective cohort study with a one-year follow-up was conducted in seven
clinical centers across Canada between January 2004 and April 2008.
Study population
Patients 18 years of age or older were eligible if they experienced chronic non-
cancer pain for at least six months, with moderate to severe pain for which
conventional treatments had been considered medically inappropriate or
inadequate. Subjects using cannabis as part of their treatment formed the cannabis
group, while subjects who were not using cannabis formed the control group,
matched by site. We excluded patients who were pregnant or breast-feeding, who
had a history of psychosis, who exhibited significant and unstable ischemic heart
disease or arrhythmia, or who suffered from significant and unstable
bronchopulmonary disease. Subjects were instructed not to drive a car or operate
a motored vehicle while under the effects of cannabis. Written informed consent
was obtained from all participants.
Study drug
Herbal cannabis was provided by Prairie Plant Systems Inc. (PPS) and contained
12.5 (±1.5) % tetrahydrocannabinol (THC)(see S2-1). Cannabis subjects were
able to use the delivery system with which they were most comfortable. Subjects
were advised to take the first dose in the evening, begin with low doses and titrate
upwards to maximum tolerated dose. An upper limit recommendation of 5 grams

MANUSCRIP
T
ACCEPTED
ACCEPTED MANUSCRIPTVersion 17 July 2015 Page 7 of 37
per day (g/d) was made to reduce risk of diversion; higher doses were allowed
when deemed appropriate by the prescribing physician. Cannabis was dispensed
by the site pharmacy at weekly intervals for the first month and then monthly for
the remainder of the study. Prior to dispensing, subjects returned unused cannabis
for weighing and destruction.
Outcome measures
Primary outcome
The primary outcome of this study was the incidence of adverse events (AEs) as
defined by the International Conference on Harmonization (ICH) 11. AEs were
reported as serious (SAEs) or non-serious using ICH guidelines, and coded using
the Medical Dictionary for Regulatory Activities (MedDRA version 11.0).
Causality and severity were assessed by the study physician using the WHO-
UMC causality assessment system 13 and Common Terminology Criteria for
Adverse Events v3.0 (CTCAE) 3. Serious and unexpected AEs were reported to
Health Canada and the institutional research ethics boards (REBs).
Secondary outcomes
Neurocognitive function
Neurocognitive testing comprised two subtests of the Wechsler Memory Scale—
Third Edition (WMS®-III) (Verbal Paired Associates I—recall and Verbal Paired
Associates II, including recall and recognition) and two subtests of the Wechsler
Adult Intelligence Scale—Third Edition (WAIS®-III) (Digit Symbol-coding,
Picture Arrangement).

MANUSCRIP
T
ACCEPTED
ACCEPTED MANUSCRIPTVersion 17 July 2015 Page 8 of 37
Pulmonary function
Pulmonary function testing consisted of Slow Vital Capacity (SVC), Functional
Residual Capacity (FRC), Residual Volume (RV), Total Lung Capacity (TLC),
Forced Expiratory Volume in one second (FEV1), Forced Vital Capacity (FVC),
and Forced Expired Flow over the middle half of the vital capacity (FEF25-75%).
Other safety parameters
Blood tests measured hematological, biochemical, liver, kidney, and endocrine
function (prolactin, testosterone, TSH).
Efficacy measures
Pain intensity was measured using visual analogue scales (VAS) (0: no pain – 10:
worst pain possible) as average, highest and lowest in the past 7 days, and current
pain intensity at the time of visit. Pain quality was assessed using the McGill Pain
Questionnaire (MPQ), which measures sensory, affective and evaluative
dimensions of pain. Other symptoms were measured using the modified
Edmonton Symptom Assessment Scale (ESAS). Mood was measured using the
Profile of Mood States (POMS). Quality of life was measured using the SF-36.
Study procedures
Baseline assessment
All subjects underwent baseline history and physical examinations, addiction
screening (Drug Abuse Screening Test (DAST-20)), neurocognitive testing, and
urine drug testing (ELISA). Blood tests and pulmonary function tests were
conducted in the cannabis group only.

MANUSCRIP
T
ACCEPTED
ACCEPTED MANUSCRIPTVersion 17 July 2015 Page 9 of 37
Follow-up
Intended follow-up was for one year. Six clinical visits (1, 2, 3, 6, 9 and 12
months after baseline) and three telephone interviews (1, 2, and 3 weeks after
baseline visit) were scheduled for subjects in the cannabis group; two clinical
visits (6 and 12 months after baseline) and five telephone interviews (1, 2, and 3
weeks, 3 and 9 months after baseline) were scheduled for control subjects.
Neurocognitive and efficacy assessments were conducted at 6 and 12 months in
all patients. Pulmonary function tests were repeated in the cannabis group at 12
months. Blood tests were conducted in the cannabis group at 1, 6, and 12 months.
Subjects were not specifically instructed to abstain from cannabis use prior to any
study visits.
Adverse event reporting
AEs were captured during interviews at clinic visits, during telephone contacts, or
spontaneously by calling the study nurse. At site visits, the study monitor
reviewed subjects’ hospital charts to ensure that serious events were not missed.
Sample size and power considerations
For the primary outcome, the incidence of adverse events among cannabis users
was compared with controls. It was assumed that SAEs followed Poisson
distributions in the two study groups. The intended sample size of this study (350
cannabis-using subjects and 350 controls (see S-3) meant that a rate ratio of 1.5
could be detected at powers above 60% for a control group incidence rate of
SAEs above 0.15 case/person-year, and at a power above 70% for the incidence

MANUSCRIP
T
ACCEPTED
ACCEPTED MANUSCRIPTVersion 17 July 2015 Page 10 of 37
rate of serious adverse event in the control group above 0.20 case/person-year.
These estimates were derived from interim safety analyses during a protocol
revision (see S-3) and are consistent with estimates from a meta-analysis of
adverse events from prescription cannabinoids 16.
Statistical analysis
Primary analysis
Demographic and clinical characteristics were compared between cannabis and
control groups using parametric and non-parametric statistics as appropriate.
Reasons for withdrawals were tabulated for both groups. AEs were coded and
tabulated using the MedDRA headings “system organ classes” (SOC) and
“preferred terms.” (PT). AEs were characterized by severity, causality and
outcome.
For incidence rate estimates, cumulative person-years were calculated from the
date of the baseline visit until the date of discontinuation, death, or completion of
the study, whichever came first. The 95% confidence intervals (CIs) for the rates
were calculated using the Poisson distribution assumption.
An overdispersed Poisson Regression model was used to assess the occurrence of
AEs among cannabis users or controls 2,5,10. The results of the regression analyses
were presented as Incidence Rate Ratios (IRRs) with corresponding 95% CIs.
Logistic regression analysis was also performed to explore the association
between the risk of having at least one AE and medical cannabis use. Odd ratios
(ORs) with a 95% CIs were calculated.

MANUSCRIP
T
ACCEPTED
ACCEPTED MANUSCRIPTVersion 17 July 2015 Page 11 of 37
Subgroup analysis
To further control for confounding by past cannabis use, we estimated the
stratified incidence rate of adverse events by past cannabis use in the cannabis and
control groups. We grouped past cannabis use into three categories. “Current
cannabis users” were those who reported using cannabis at the baseline interview;
“ex-cannabis users” were those who reported having previously used cannabis but
not at baseline interview; “naïve users” were those who reported never having
used cannabis prior to baseline interview. We carried out a Poisson regression
analysis to explore whether the incidence rate was consistent among participants
with different cannabis use histories.
Secondary analyses
A random effects model with a random intercept for patient was used to model
neurocognitive and pulmonary function, pain, mood, symptom severity and
quality of life. Age, gender, disability status, average pain intensity, concomitant
pain medication use, alcohol use (current vs. former or never users), tobacco use
(current vs. former or never users), past cannabis use (ever vs. never) and study
sites were incorporated as covariates.
Statistical analyses were undertaken with SAS software (version 9.1). No
adjustments for multiple comparisons were made.

MANUSCRIP
T
ACCEPTED
ACCEPTED MANUSCRIPTVersion 17 July 2015 Page 12 of 37
Protocol modifications
The original protocol was modified during the study implementation to reduce the
burden on study subjects and aid recruitment. Details of these modifications are
found in the supplementary materials (S-3).
Ethics and regulatory approvals
The study was approved by the REB of each participating hospital and Health
Canada. An independent Safety Monitoring Advisory Committee was formed to
ensure consistency for objectively and systematically categorizing adverse events’
seriousness, severity and causality (S-3).
Regulatory approval to use the supplied herbal cannabis was obtained from the
Therapeutic Products Directorate of Health Canada.
Results
From January 2004 to April 2008, 431 patients were recruited, 215 in the
cannabis group and 216 controls (Figure 1). Median duration of follow-up was
11.9 months (range, 7 to 551 days) in the cannabis group and 12.1 months (range,
28 to 567 days) in the control group (outliers in follow-up time were due to late
final visits; Table S-1). The cannabis group included 141 (66%) “current cannabis
users”, 58 (27%) “ex-cannabis users”, and 16 (7%) “cannabis naïve”. Controls
included 70 (32%) “ex-cannabis users” and 146 (68%) “cannabis naïve”.
Baseline characteristics are presented in Table 1. Patients in the cannabis group
were younger, with a larger percentage of male, disabled, and tobacco or alcohol
MANUSCRIP
T
ACCEPTED
ACCEPTED MANUSCRIPTVersion 17 July 2015 Page 13 of 37
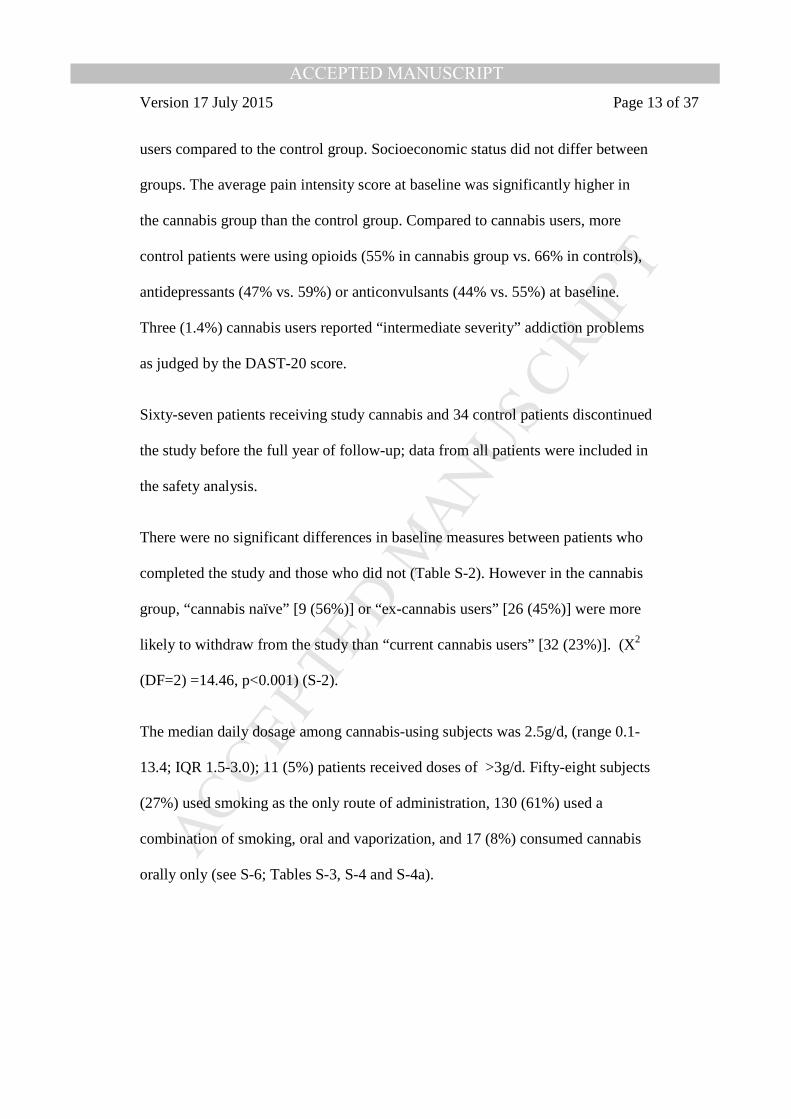
users compared to the control group. Socioeconomic status did not differ between
groups. The average pain intensity score at baseline was significantly higher in
the cannabis group than the control group. Compared to cannabis users, more
control patients were using opioids (55% in cannabis group vs. 66% in controls),
antidepressants (47% vs. 59%) or anticonvulsants (44% vs. 55%) at baseline.
Three (1.4%) cannabis users reported “intermediate severity” addiction problems
as judged by the DAST-20 score.
Sixty-seven patients receiving study cannabis and 34 control patients discontinued
the study before the full year of follow-up; data from all patients were included in
the safety analysis.
There were no significant differences in baseline measures between patients who
completed the study and those who did not (Table S-2). However in the cannabis
group, “cannabis naïve” [9 (56%)] or “ex-cannabis users” [26 (45%)] were more
likely to withdraw from the study than “current cannabis users” [32 (23%)]. (X2
(DF=2) =14.46, p<0.001) (S-2).
The median daily dosage among cannabis-using subjects was 2.5g/d, (range 0.1-
13.4; IQR 1.5-3.0); 11 (5%) patients received doses of >3g/d. Fifty-eight subjects
(27%) used smoking as the only route of administration, 130 (61%) used a
combination of smoking, oral and vaporization, and 17 (8%) consumed cannabis
orally only (see S-6; Tables S-3, S-4 and S-4a).
MANUSCRIP
T
ACCEPTED
ACCEPTED MANUSCRIPTVersion 17 July 2015 Page 14 of 37
Adverse events
Serious Adverse Events
Twenty-eight (13%) subjects in the cannabis group reported at least 1 SAE,
compared with 42 (19%) in the control group. The risk of having at least 1 SAE
was not significantly different between two groups (unadjusted OR=0.64, 95%
CI=0.38-1.04). The total number of SAEs was similar in the cannabis and control
groups (40 and 56, respectively). The incident rates of SAEs were 22.6 and 27.5
events per 100 person-years of follow-up in the cannabis and control groups,
respectively (unadjusted IRR=0.82, 95% CI=0.46-1.46).
SAEs are shown in Table 2. The most common categories were “Surgical and
medical procedures” and “Gastrointestinal disorders” in cannabis (n=10, 25% and
n=10, 25% respectively) and control groups (n=11, 20%, and n=7, 13%
respectively) (Table S-5). The most common SAEs in the cannabis group were
abdominal pain (n=3, 12%), intestinal obstruction (n=3, 12%) and nephrolithiasis
(n=3, 12%). None of the SAEs was considered to be “certainly/very likely”
related to study cannabis. One SAE (convulsion) was considered
“probably/likely” related to study cannabis. Two control subjects died over the
course of the trial, one by suicide and the other a death in the operating room
following emergency treatment for abdominal pain; there were no deaths in the
cannabis group.
Treatment was permanently stopped for 2 patients due to SAEs (1 convulsion and
1 alcohol problem). At the end of the study, 31 (77.5%) of the SAEs in the
cannabis group had been fully resolved.

MANUSCRIP
T
ACCEPTED
ACCEPTED MANUSCRIPTVersion 17 July 2015 Page 15 of 37
Non-serious adverse events
Most patients in the cannabis-treatment (190/215; 88.4%) and control (184/216;
85.2%) groups experienced at least 1 non-serious AE, with a median of 3 events
per subject (range 0-16; interquartile range 2-5) among cannabis users and a
median of 2 events per subject (range 0-14, interquartile range 1-4) among
controls. The risk of having at least 1 AE did not differ significantly between
cannabis users and controls (unadjusted OR=1.32, 95% CI=0.75-2.32).
A total of 818 non-serious AEs were reported in the cannabis group, resulting in
an incidence rate of 4.61 events/person-year. This rate was significantly higher
than in the control group in which there were 581 non-serious AEs and an
incidence rate of 2.85 events/person-year (unadjusted IRR=1.64, 95% CI=1.35-
1.99) (Table 3).
The number of subjects, the occurrence of events, and corresponding rates within
each MedDRA SOC category are shown in Table 3. The most common AE
categories in the cannabis group were nervous system (n=165, 20%),
gastrointestinal (n=109, 13.4%) and respiratory disorders (n=103, 12.6%).
Compared with controls, the rate of nervous system disorders (unadjusted
IRR=2.05, 95% CI=1.46, 2.86), respiratory disorders (unadjusted IRR=1.77, 95%
CI=1.16, 2.70), infections (unadjusted IRR=1.51, 95% CI=1.04, 2.20) and
psychiatric disorders (unadjusted IRR=2.74 95% CI=1.45, 5.18) were
significantly higher in the cannabis group (Figure 2). Mild (420, 51.3%) or
moderate (390, 47.7%) events were more common than severe ones (8, 1.0%) in
the cannabis group. Non-serious AEs occurring more than once among cannabis

MANUSCRIP
T
ACCEPTED
ACCEPTED MANUSCRIPTVersion 17 July 2015 Page 16 of 37
users and assessed as certainly/very likely related to cannabis were somnolence
(n=5, 0.6%), amnesia (n=4, 0.5%), cough (n=4, 0.5%), nausea (n=4, 0.5%),
dizziness (n=3, 0.4%), euphoric mood (n=3, 0.4%), hyperhidrosis (n=2, 0.2%)
and paranoia (n=2, 0.2%) (Table S-7).
In the control group, gastrointestinal disorders (n=101, 17.4%) and nervous
system disorders (n=93, 16.0%) were the most frequently reported (Table 3). The
majority of AEs among controls were mild (57.3%) or moderate (42.0%), while
four (0.7%) were categorized as “severe” (abdominal pain, breast cancer,
pulmonary embolism, and upper respiratory tract infection) (Tables S-6, S-7, S-8).
Multiple regression analyses
The association between cannabis use and the rate of AEs is summarized in Table
4. Medical cannabis users had an increased risk of non-serious AEs (adjusted
IRR=1.74, 95% CI=1.42-2.14) but not SAEs (adjusted IRR=1.08, 95% CI=0.57-
2.04). Increasing the daily dose of cannabis did not lead to higher risks of SAEs
or AEs. (Table S-10).
Neurocognitive tests
Significant improvements were observed in all neurocognitive subtests after 6 and
12 months in cannabis users and controls (Table 5). After adjusting for age,
gender, education, alcohol history, disability status, concurrent average pain
intensity, quality of life, and clinic sites, no difference in neurocognitive function
after one year was found between cannabis users and controls (Table S-12).

MANUSCRIP
T
ACCEPTED
ACCEPTED MANUSCRIPTVersion 17 July 2015 Page 17 of 37
Pulmonary function tests
After adjusting for tobacco smoking and other covariates, we did not find a
significant change of SVC, FRC, and TLC over one year in the cannabis users.
Residual volume was reduced (mean reduction 142ml), and a mean decline of
54mL in FEV1 and a mean of 0.78% decrease in the FEV1/FVC ratio was noted.
The FEF25-75% was lower with a mean decrease of 0.2; no change was observed in
FVC (Tables S-13, S-14).
Blood tests
Seventy-eight patients in the cannabis group had blood tests conducted at baseline
and at one year. There were no changes observed in liver, renal, and endocrine
function (Tables S-14, S-15, S-16).
Efficacy measures
Pain intensity
Compared to baseline, a significant reduction in average pain intensity over one
year was observed in the cannabis group (change 0.92; 95% CI=0.62, 1.23) but
not in controls (change 0.18; 95% CI=-0.13, 0.49). After adjusting for
confounders, a greater reduction of pain was observed among cannabis users than
controls (difference =1.10, 95% CI=0.72, 1.56) (Figure 3; Tables S-17, S-18).
Quality of life
With regard to the change in Physical Component Summary (PCS) score, a
significant improvement from baseline was observed in both groups at the 6- and
12-month clinic visits. The analysis of the change in the PCS indicated greater

MANUSCRIP
T
ACCEPTED
ACCEPTED MANUSCRIPTVersion 17 July 2015 Page 18 of 37
improvement of physical function in cannabis users than in controls (2.36 point
greater improvement at 6-month, 95% CI=0.84, 3.88; and 1.62 points at 1-year,
95% CI= 0.10, 3.14). No within-group nor between-group differences for the
Mental Component Summary (MCS) were observed. (Table S-24).
Pain and other symptoms
The sensory component of pain was reduced over one year in cannabis users
compared to controls (Tables S-19, S-20). The total symptom distress score of the
ESAS was also improved in cannabis users over one year (Tables S-21, S-22).
The total mood disturbance scale of the POMS showed significant improvement
for cannabis users compared to controls, with improvements found in the tension-
anxiety, depression-dejection, anger-hostility and fatigue-inertia subscales (Tables
S-23, S-24).
Discussion
To our knowledge, this is the first cohort study of the long term safety of medical
cannabis use ever conducted. Over one year, we identified 40 SAEs among 28
subjects, and 818 non-serious AEs among 190 subjects using medical cannabis.
Headache, nasopharyngitis, nausea, somnolence, and dizziness were the most
common AEs reported. Medical cannabis use did not increase the risk of SAEs
compared to controls, but was associated with an increased risk of non-serious
AEs, particularly with respect to nervous system and psychiatric disorders. This
adverse event profile is similar to pharmaceutical cannabinoids 16.

MANUSCRIP
T
ACCEPTED
ACCEPTED MANUSCRIPTVersion 17 July 2015 Page 19 of 37
We found 78 respiratory events in the cannabis group and 56 in the control group,
and most were considered mild or moderate. No increase in risk of serious
respiratory AE associated with medical cannabis use was detected (1 SAE in the
cannabis group, and 7 in the control group). Medical cannabis users had a higher
rate of developing non-serious respiratory AEs during one year of follow-up
compared to controls. This is consistent with reports that long-term cannabis
smoking is associated with an increased risk of chronic bronchitis 12. In our study,
cannabis users had a mean 50-mL decrease in FEV1 and a mean 1% decrease in
FEV1/FVC ratio over one year.
Neurocognitive function improved in both groups. This finding differs from that
found in recreational users of cannabis where a meta-analysis of 15 studies
investigating the effects of recreational cannabis use on neurocognitive
performance 6 suggested that long-term cannabis users performed significantly
poorer on tests of memory and attention than short-term users 11; in that study,
both groups consumed similar amounts of cannabis (median 7 g/week, range: 0.3-
57), and there was no difference on memory and attention between short-term
users and non-cannabis users. Longer term follow up of the neurocognitive effects
of medical cannabis use is needed.
We found no impact of medical cannabis use on measures of hematological,
biochemical, liver, renal and endocrine function among 78 patients followed over
one year.

MANUSCRIP
T
ACCEPTED
ACCEPTED MANUSCRIPTVersion 17 July 2015 Page 20 of 37
With respect to secondary efficacy measures, we noted significant improvements
in pain intensity and the physical dimension of quality of life over one year
among the cannabis users compared to controls; there was also significant
improvement among cannabis users in measures of the sensory component of
pain, symptom distress, and total mood disturbance compared to controls. These
findings, while not the primary outcomes of the study, are nevertheless important
in considering the overall risk-benefit ratio of medical use of cannabis.
There are several limitations of our study. First, the relatively small sample size
and short follow up time prevented our study from identifying rare SAEs.
Following 215 subjects (177 person-years) in the cannabis group and 216 controls
(204 person-years) enabled us to detect a rate ratio of 1.5 at powers above 50%
for an incidence rate of SAEs in the control group above 0.20 case/person-year.
Second, we observed a significant drop-out rate, which may be a source of
selection bias. Losses to follow-up were estimated at 30% over a median follow-
up of 12 months. Factors associated with drop-out included AEs, perceived lack
of efficacy, and/or a dislike of the study product. However, patients lost to follow-
up were comparable with patients who finished the entire study.
Third, most study participants in the cannabis group (66%) were experienced
cannabis users. Due to the small number of cannabis-naïve patients in the study,
the safety of medical cannabis use in cannabis-naïve subjects cannot be addressed.
Moreover, our results indicate that the rate of non-serious AEs among “current
cannabis users” was lower than that among “ex-cannabis users” or “naïve users”.

MANUSCRIP
T
ACCEPTED
ACCEPTED MANUSCRIPTVersion 17 July 2015 Page 21 of 37
We would likely have observed a higher rate of AEs for cannabis if only new
cannabis users had been included.
Fourth, observational bias could come from ascertainment of outcomes. Given the
difference in follow up (9 visits after baseline in the cannabis group vs. 7 in the
control group), subjects in the cannabis group may have reported AEs otherwise
neglected by controls. The effect of this limitation is likely to lead to more
exaggerated estimates of AEs among medical cannabis users with that of the
controls.
Finally, confounding by indication due to selective prescribing is another
potential source of bias 15. This bias may exist in our study due to the fact that
herbal cannabis was authorized for refractory patients who had more pain and
disability than controls. Information on determinants of prescription choices was
unmeasured, but pain intensity and disability were considered as the most
important factors influencing the decision to use medical cannabis. Adjusting for
these two variables in the final model of our study helped to control indication
bias.
With respect to the observed improvements in secondary efficacy measures, we
interpret these with caution as the study was not a randomized controlled trial and
allocation was not blinded. It is possible that improvements in these efficacy
measures resulted from regression to the mean, natural history of disease or the
effect of being in the study. However these biases would apply to both groups, yet
still we noted difference between groups.

MANUSCRIP
T
ACCEPTED
ACCEPTED MANUSCRIPTVersion 17 July 2015 Page 22 of 37
Despite these limitations, this study improves our knowledge about the safety of
medical cannabis. Caution should be exercised in interpreting these results to all
medical cannabis use as patients in this study used a standardized, quality
controlled herbal cannabis product with a reliable THC potency of 12.5%.
In conclusion, this study suggests that the adverse effects of medical cannabis are
modest and comparable quantitatively and qualitatively to prescription
cannabinoids. The results suggest that cannabis at average doses of 2.5g/d in
current cannabis users may be safe as part of carefully monitored pain
management program when conventional treatments have been considered
medically inappropriate or inadequate. However, safety concerns in naïve users
cannot be addressed. Moreover, long term effects on pulmonary functions and
neurocognitive functions beyond one year cannot be determined. Further studies
with systematic follow-up are required to characterize safety issues among new
cannabis users, and should be extended to allow estimation of longer term risks.
Acknowledgments
We gratefully acknowledge the support and contributions of Anna Passariello,
Nicole Poitras, and Linda Fergsuon (study coordinators); Ann Robinson (study
monitor); Randa Zamrini (data manager); Myrna Yazer, Sylvie Toupin, Ann
Rusnov, Charlene Bartha, Marilyn Galonski, Selena Roy, Susan Brophy, Joanne
Stewart (study nurses); Thierry Ducruet (statistical support); Peter Fried
(neuropsychiatry consultant); Don Boudreau (pulmonology consultant); Kam
Shojania (rheumatology) and all the patients who made the study possible.

MANUSCRIP
T
ACCEPTED
ACCEPTED MANUSCRIPTVersion 17 July 2015 Page 23 of 37
Safety Monitoring Advisory Committee
Robin O’Brien (chair), Lawrence Joseph, Jock Murray
Adverse Event Adjutication Committee
Mark Ware, Mary Lynch

MANUSCRIP
T
ACCEPTED
ACCEPTED MANUSCRIPTVersion 17 July 2015 Page 24 of 37
Figure legends
Figure 1. COMPASS CONSORT Flow Diagram
Figure 2. Unadjusted Incidence Rate Ratios of non-serious adverse events by
System Organ Class
Figure 3. Changes in pain intensity over one year (data only shown for subjects
with complete data at all time points; n=145 (cannabis), n= 157 (controls)

MANUSCRIP
T
ACCEPTED
ACCEPTED MANUSCRIPT
Version 17 July 2015 Page 25 of 37
Figure 1. COMPASS CONSORT Flow Diagram
Assessed for eligibility (n= 234)
Excluded (n= 18)
Not meeting inclusion criteria (n= 9)
Declined to participate (n= 2)
Other reasons (n= 7)
Entered in primary safety analysis (n= 216)
Entered study as cases (n= 216)
Discontinued study (n= 77)
o lack of efficacy (n=18)
o adverse events (n=10)
o non-compliance with protocol (n=6)
o lack of efficacy and adverse effects (n=5)
o dislike of the study product (n=4)
o not specified (n=8)
o other (n=26)
Entered study as controls (n= 215)
Lost to follow-up (give reasons) (n= 34)
o non-compliance with study protocol (n=7)
o becoming pregnant (n=2)
o other personal reasons (n=8)
o not specified (n=15)
o Other (n=12)
Entered in primary safety analysis (n= 215)
Analysis
Enrollment
Assessed for eligibility (n= 218)
Excluded (n= 3)
Not meeting inclusion criteria (n= 2)
Declined to participate (n= 1)

MANUSCRIP
T
ACCEPTED
ACCEPTED MANUSCRIPTVersion 17 July 2015 Page 26 of 37
Figure 2. Unadjusted Incidence Rate Ratios of non-serious adverse events by MedDRA System Organ Class

MANUSCRIP
T
ACCEPTED
ACCEPTED MANUSCRIPT
Figure 3. Changes in pain intensity over one year
0
2
4
6
8
10
0 3 6 9 12
VA
S P
ain
In
ten
sity
Time (months)
A. Average pain intensity
Cannabis
Control
0
2
4
6
8
10
0 3 6 9 12
VA
S P
ain
In
ten
sity
Time (months)
B. Lowest pain intensity
Cannabis
Control
0
2
4
6
8
10
0 3 6 9 12
VA
S p
ain
In
ten
sity
Time (months)
C. Highest pain intensity
Cannabis
Control
0
2
4
6
8
10
0 3 6 9 12
VA
S P
ain
In
ten
sity
Time (months)
D. Current pain intensity
Cannabis
Control

MANUSCRIP
T
ACCEPTED
ACCEPTED MANUSCRIPT
Table 1. Baseline characteristics of study subjects, by exposure status
Characteristics Cannabis group (N=215)
Control group (N=216)
P
Age at enrollment1 45.5 (19-82) 52.4 (21-83) <0.001
Gender (% male)2 110 (51.2%) 76 (35.2%) <0.001
Education (% University/College)2 111 (51.6%) 122 (56.5%) 0.14
Married; N (%)2 133 (61.9%) 140 (64.8%) 0.52
Disabled; N (%)2 129 (60.0%) 102 (47.2%) 0.01
Tobacco status2,4 0.01
Current tobacco users 91 (42.3%) 67 (31.0%)
Ex tobacco users 77 (35.8%) 73 (33.8%)
Never users 47 (21.9%) 76 (35.2%)
Alcohol status2 0.05
Currently drinking 166 (77.2%) 149 (69.0%)
Not currently drinking 49 (22.8%) 67 (31.0%)
Past cannabis use2,5 <0.001
Current cannabis users 141 (65.6%) 0
Ex-cannabis users 58 (27.0%) 70 (32.4%)
Naïve users 16 (7.4%) 146 (67.6%)
Drug Abuse Screening Test6 <0.0001
N/A (DAST=0) 59 (27.4%) 133 (62.1%)
Low (DAST=1-5) 153 (71.2%) 81 (37.9%)
Intermediate (DAST=6-10) 3 (1.4%) 0
Substantial (DAST=11-15) 0 0
Severe (DAST=16-20) 0 0
Type of pain2 0.40
Nociceptive 35 (16.3%) 39 (18.1%)
Neuropathic 83 (38.6%) 70 (32.4%)
Both 97 (45.1%) 107 (49.5%)
Average pain intensity1 6.6 (0-10) 6.1 (0-10) 0.002
Duration of pain (years)3 8.0 (0-54) 7.0 (0-82) 0.42
Medications
Opioids2 118 (54.9%) 143 (66.2%) 0.02
Antidepressants2 101 (47.0%) 128 (59.3%) 0.01
Anticonvulsants2 94 (43.7%) 118 (54.6%) 0.02 1Mean (range), Student T-test

MANUSCRIP
T
ACCEPTED
ACCEPTED MANUSCRIPTVersion 17 July 2015 Page 29 of 37
2Number of patients (proportion), Chi-square 3Median (range), the Wilcoxon Rank Sum Test 4“Current smokers” were those who reported smoking at baseline interview; “ex smokers” were those who reported abstinence from cigarettes at baseline; “never smokers” were those who reported never smoking at baseline interview. 5“Current cannabis users” were those who reported using cannabis and were still using at baseline interview; “Ex cannabis users” were those who reported using cannabis but were not using at baseline interview; “naïve user” were those who reported never using cannabis prior to baseline interview. 6 Fisher’s Exact Test

MANUSCRIP
T
ACCEPTED
ACCEPTED MANUSCRIPTVersion 17 July 2015 Page 30 of 37
Table 2. Serious adverse events (SAEs) categorized by System Organ Class (SOC)
Serious Adverse Events Cannabis group Control group
System Organ Class (MedDRA) Number of
events Rate1 Number of
events Rate1
Surgical and medical procedures 10 5.65 11 5.39
Gastrointestinal disorders 10 5.65 7 2 3.43
Musculoskeletal and connective tissue disorders 5 2.82 6 2.94
Injury, poisoning and procedural complications 4 2.26 1 0.49
Renal and urinary disorders 3 1.69 1 0.49
Nervous system disorders 2 1.13 4 1.96
Respiratory, thoracic and mediastinal disorders 1 0.56 7 3.43
Infections and infestations 1 0.56 5 2.45
Vascular disorders 1 0.56 3 1.47
Metabolism and nutrition disorders 1 0.56 2 0.98
Psychiatric disorders 1 0.56 23 0.98
Investigations 1 0.56 0 0.00
General disorders and administration site conditions 0 0.00 3 1.47
Blood and lymphatic system disorders 0 0.00 1 0.49
Eye disorders 0 0.00 1 0.49
Hepatobiliary disorders 0 0.00 1 0.49
Immune system disorders 0 0.00 1 0.49
Total 40 22.60 4 56 27.45 4
Total number of patients 28 13.02% 5 42 19.44% 5 1Unit: n/ 100 person-years 2One patient died in the operating room. 3One patient committed suicide. 4The rates of serious adverse events did not differ significantly between these two groups (Unadjusted incidence rate ratio=0.82, 95% CI=0.46-1.46). 5The risk of having reported at least 1 SAE was not significantly different between two groups (Unadjusted odds ratio=0.62, 95% CI=0.37-1.04).

MANUSCRIP
T
ACCEPTED
ACCEPTED MANUSCRIPT
Version 17 July 2015 Page 31 of 37
Table 3. Summary of non-serious adverse events (SAEs) categorized by System Organ Class (SOC)
Non-serious adverse events Cannabis group Control group
System Organ Class (MedDRA)
Number of persons
reporting symptoms
Number of events
reported
Rate (events/person-
year)
Number of persons
reporting symptoms
Number of events
reported
Rate (events/person-
year)
Nervous system disorders 101 165 0.93 71 93 0.46
Gastrointestinal disorders 66 109 0.62 70 101 0.50
Respiratory, thoracic and mediastinal disorders 77 103 0.58 49 67 0.33
Infections and infestations 63 89 0.50 49 68 0.33
Musculoskeletal and connective tissue disorders 49 77 0.44 50 67 0.33
Psychiatric disorders 47 57 0.32 21 24 0.12
General disorders and administration site conditions 29 35 0.20 20 23 0.11
Injury, poisoning and procedural complications 23 31 0.18 21 23 0.11
Renal and urinary disorders 23 29 0.16 18 22 0.11
Skin and subcutaneous tissue disorders 18 22 0.12 17 18 0.09

MANUSCRIP
T
ACCEPTED
ACCEPTED MANUSCRIPT
Version 17 July 2015 Page 32 of 37
Non-serious adverse events Cannabis group Control gr oup
System Organ Class (MedDRA)
Number of persons
reporting symptoms
Number of events
reported
Rate (events/person-
year)
Number of persons
reporting symptoms
Number of events
reported
Rate (events/person-
year)
Investigations 21 21 0.12 8 8 0.04
Eye disorders 16 20 0.11 13 14 0.07
Reproductive system and breast disorders 11 15 0.08 5 6 0.03
Metabolism and nutrition disorders 14 14 0.08 7 7 0.03
Vascular disorders 8 8 0.05 9 9 0.04
Surgical and medical procedures 6 7 0.04 10 12 0.06
Cardiac disorders 4 4 0.02 7 7 0.03
Blood and lymphatic system disorders 4 4 0.02 0 0 0.00
Ear and labyrinth disorders 3 3 0.02 5 5 0.02
Immune system disorders 1 2 0.01 3 3 0.01
Hepatobiliary disorders 2 2 0.01 1 1 0.00
Endocrine disorders 1 1 0.01 0 0 0.00
Neoplasms benign, malignant and unspecified (incl cysts and polyps) 0 0 0.00 3 3 0.01
Total 191 818 4.62 186 581 2.85
Unadjusted odds ratio (95% CI) 1.28 (0.72, 2.28) 1
Unadjusted incidence rate ratio (95% CI) 1.62 (1.34, 1.97) 1

MANUSCRIP
T
ACCEPTED
ACCEPTED MANUSCRIPTVersion 17 July 2015 Page 33 of 37
Table 4: Unadjusted and adjusted rate ratios of adverse events for medical cannabis
Cannabis Control Unadjusted IRR (95%
CI)
Adjusted IRR 1 (95%
CI)
All patients
Number of patients 215 216 -- --
Cumulative person-years
176.9 204.1 -- --
Number of SAEs 40 56 0.82
(0.46-1.46) 1.08
(0.57-2.04)
Number of AEs 816 574 1.64
(1.35-1.99) 1.74
(1.42-2.14)
Patients excluding “current cannabis users”2 at baseline
Number of patients 74 216 -- --
Cumulative person-years
52.2 204.1 -- --
Number of SAEs 20 56 1.40
(0.66-2.93) 1.77
(0.72-4.32)
Number of AEs 316 574 2.15
(1.69-2.74) 2.07
(1.59-2.70)
IRR=Incidence rate ratio; 95% CI=95% confidence interval; SAE=serious adverse event; AE=non-serious adverse event
1. Adjusted for age at enrollment, gender, baseline pain intensity, baseline concomitant pain medication (yes/no), disability status (yes/no), tobacco use (current vs. former or never smokers), alcohol use (current vs. former or never users), past cannabis use (ever/never), and study sites.
2. “Current cannabis users” were those who reported using cannabis and were still using at baseline interview.

MANUSCRIP
T
ACCEPTED
ACCEPTED MANUSCRIPTVersion 17 July 2015 Page 34 of 37
Table 5. Neurocognitive measures in cannabis-exposed and control subjects over one year1
Group Number of
subjects
Baseline 6 months 12 months
WMS®-III 2
Verbal paired associates I
Recall Cannabis 77 16.92 (7.69) 20.97 (8.01) 22.97 (7.56)
(Max: 32 points) Control 53 17.42 (7.85) 19.25 (8.70) 22.72 (8.53)
Verbal paired associates II
Recall Cannabis 76 5.67 (2.35) 6.29 (2.05) 6.54 (1.81)
(Max: 8 points) Control 53 5.45 (2.55) 6.02 (2.45) 6.64 (1.95)
Recognition Cannabis 76 23.80 (0.80) 23.92 (0.32) 23.78 (1.41)
(Max: 24 points) Control 53 23.94 (0.23) 23.98 (0.14) 23.98 (0.14)
WAIS®-III 3
Digit symbol-coding Cannabis 72 52.21 (21.60) 53.31 (23.64) 55.90 (23.11)
(Max: 133 points) Control 53 49.94 (18.82) 54.64 (20.26) 55.00 (17.65)
Picture arrangement Cannabis 76 11.64 (3.91) 13.67 (5.03) 14.18 (4.36)
(Max: 22 points) Control 53 11.42 (4.65) 13.32 (5.14) 14.24 (5.53) 1Data are presented as mean (SD). 2WMS®-III: Wechsler Memory Scale – Third Edition 3WAIS®-III: Wechsler Adult Intelligence Scale – Third Edition

MANUSCRIP
T
ACCEPTED
ACCEPTED MANUSCRIPT
References
1. Abrams DI, Jay CA, Shade SB, Vizoso H, Reda H, Press S, Kelly ME, Rowbotham
MC, Petersen KL. Cannabis in painful HIV-associated sensory neuropathy: a
randomized placebo-controlled trial. Neurology. 68:515-521, 2007
2. Agresti A: Categorical Data Analysis. 2nd edition, John Wiley & Sons, Inc.,
Hoboken, NJ, 2002.
3. Common Terminology Criteria for Adverse Events v3.0. Available at:
http://ctep.cancer.gov/protocolDevelopment/electronic_applications/docs/ctcaev3.pdf
Accessed July 25, 2013
4. Corey-Bloom J, Wolfson T, Gamst A, Jin S, Marcotte TD, Bentley H, Gouaux B.
Smoked cannabis for spasticity in multiple sclerosis: a randomized, placebo-
controlled trial. CMAJ. 184:1143-1150, 2012
5. Gardner WM, E. P.; Shaw, E. C. Regression analyses of counts and rates: Poisson,
overdispersed Poisson, and negative binomial models. Psychological Bulletin.
118:392-404, 1995
6. Grant I, Gonzalez R, Carey CL, Natarajan L, Wolfson T. Non-acute (residual)
neurocognitive effects of cannabis use: a meta-analytic study. J Int Neuropsychol Soc.
9:679-689, 2003
7. Hall W, Degenhardt L. Adverse health effects of non-medical cannabis use. Lancet.
374:1383-1391, 2009

MANUSCRIP
T
ACCEPTED
ACCEPTED MANUSCRIPT
8. Health Canada. Marihuana for Medical Purposes Regulations. Available at:
http://gazette.gc.ca/rp-pr/p2/2013/2013-06-19/html/sor-dors119-eng.php Accessed 14
May, 2014
9. ICH: Definitions and standards for expedited reporting. Available at:
http://www.ich.org/cache/compo/276-254-1.html Accessed Oct 1, 2005
10. SAS/STAT User's Guide, version 9.(Institute, S., Ed.), 2007.
11. Solowij N, Stephens RS, Roffman RA, Babor T, Kadden R, Miller M, Christiansen
K, McRee B, Vendetti J. Cognitive functioning of long-term heavy cannabis users
seeking treatment. JAMA. 287:1123-1131, 2002
12. Tashkin DP. Effects of marijuana smoking on the lung. Annals of the American
Thoracic Society. 10:239-247, 2013
13. The use of the WHO-UMC system for standardised case causality assessment.
Available at: http://who-umc.org/Graphics/24734.pdf
14. Wade DT, Makela PM, House H, Bateman C, Robson P. Long-term use of a
cannabis-based medicine in the treatment of spasticity and other symptoms in
multiple sclerosis. Mult Scler. 12:639-645, 2006
15. Walker AM, Stampfer MJ. Observational studies of drug safety. Lancet. 348:489,
1996
16. Wang T, Collet JP, Shapiro S, Ware MA. Adverse effects of medical cannabinoids: a
systematic review. CMAJ. 178:1669-1678, 2008
17. Ware MA, Wang T, Shapiro S, Robinson A, Ducruet T, Huynh T, Gamsa A, Bennett
GJ, Collet JP. Smoked cannabis for chronic neuropathic pain: a randomized
controlled trial. CMAJ. 182:E694-701, 2010

MANUSCRIP
T
ACCEPTED
ACCEPTED MANUSCRIPT
18. Wilsey B, Marcotte T, Tsodikov A, Millman J, Bentley H, Gouaux B, Fishman S. A
randomized, placebo-controlled, crossover trial of cannabis cigarettes in neuropathic
pain. J Pain. 9:506-521, 2008
19. Zajicek JP, Sanders HP, Wright DE, Vickery PJ, Ingram WM, Reilly SM, Nunn AJ,
Teare LJ, Fox PJ, Thompson AJ. Cannabinoids in multiple sclerosis (CAMS) study:
safety and efficacy data for 12 months follow up. J Neurol Neurosurg Psychiatry.
76:1664-1669, 2005

MANUSCRIP
T
ACCEPTED
ACCEPTED MANUSCRIPT
1
Cannabis for the Management of Pain: Assessment of
Safety Study (COMPASS)
Supplementary materials
Mark A. Ware MBBS MRCP MSc1, Tongtong Wang BMed PhD2, Stan Shapiro
PhD2,3, Jean-Paul Collet MD PhD4 for the COMPASS study team*
*Aline Boulanger MD5, John M. Esdaile MD6, Alan Gordon MD7, Mary Lynch
MD8, Dwight E. Moulin MD9, Colleen O’Connell MD10
Institutional affiliations:
1Departments of Anesthesia and Family Medicine, McGill University,
Montreal, Quebec, Canada 2Department of Epidemiology, Biostatistics and Occupational Health, McGill
University, Montreal, Quebec, Canada 3Centre for Clinical Epidemiology, Jewish General Hospital, Montreal, Quebec,
Canada 4Department of Pediatrics, University of British Columbia; Child and Family
Research Institute, Vancouver, British Columbia, Canada 5Department d’anesthesie, Université de Montreal, Montreal, Quebec, Canada 6Division of Rheumatology, University of British Columbia, Vancouver,
British Columbia, Canada 7Department of Neurology, University of Toronto, Toronto, Ontario, Canada 8Departments of Anesthesia, Psychiatry and Pharmacology, Dalhousie
University, Halifax, Nova Scotia, Canada 9Departments of Clinical Neurological Sciences and Oncology, Western
University, London, Ontario, Canada 10Department of Physical Medicine and Rehabilitation, Stan Cassidy Centre
for Rehabilitation, Fredericton, New Brunswick, Canada
Address for reprints and correspondence:
Dr. Mark A. Ware
E19.145 Montreal General Hospital
1650 Cedar Avenue
Montreal, Quebec H9S 4Y5
Canada
Tel: (514) 934-8222
Fax: (514) 934-8096
Email: [email protected]

MANUSCRIP
T
ACCEPTED
ACCEPTED MANUSCRIPT
2
Table of Contents
1 STUDY DRUG .................................................................................................................. 3
2 STATISTICAL PLANS ..................................................................................................... 3 2.1 ADVERSE EVENT ANALYSIS ............................................................................................................... 3 2.2 NEUROCOGNITIVE TEST ANALYSES ................................................................................................. 3 2.3 RESPIRATORY FUNCTION ................................................................................................................... 4
3 MODIFICATIONS TO PROTOCOL ............................................................................... 4
4 ADJUDICATION OF ADVERSE EVENTS ..................................................................... 5
5 STUDY WITHDRAWALS ............................................................................................... 6
6 ADDITIONAL DOSING DATA ....................................................................................... 6
7 ADVERSE EVENT REPORTS ......................................................................................... 6
8 ADDITIONAL TABLES ................................................................................................... 8 TABLE S-1: DURATION OF FOLLOW UP, ACCORDING TO STUDY GROUPS .......................................... 8 TABLE S-2. BASELINE CHARACTERISTICS OF SUBJECTS, BY DISCONTINUATION STATUS1 ............ 9 TABLE S-3. MODE OF CANNABIS ADMINISTRATION DURING THE STUDY ...................................... 10 TABLE S-4. DAILY DOSAGE OF CANNABIS DURING THE STUDY ......................................................... 11 TABLE S-5: DETAILED LISTING OF SERIOUS ADVERSE EVENTS BY CANNABIS EXPOSURE STATUS
........................................................................................................................................................................... 12 TABLE S-6: MOST FREQUENTLY REPORTED NON-SERIOUS ADVERSE EVENTS1 ........................... 18 TABLE S-7. CAUSALITY OF NON-SERIOUS ADVERSE EVENTS (CANNABIS GROUP ONLY) 1 ......... 19 TABLE S-8. DETAILED LISTING OF NON-SERIOUS AES ....................................................................... 20 TABLE S-9. INCIDENCE RATE OF ADVERSE EVENTS, BY PAST CANNABIS USE1 ............................. 33 TABLE S-10: UNADJUSTED AND ADJUSTED RATE RATIOS OF SAES FOR MEDICAL CANNABIS, BY
DAILY DOSE ..................................................................................................................................................... 34 TABLE S-11: INCIDENCE RATES OF ADVERSE EVENTS, BY PAST CANNABIS USE 1 ....................... 35 TABLE S-12: CHANGE IN NEUROCOGNITIVE FUNCTION BY CANNABIS EXPOSURE AND TIME ... 37 TABLE S-13: PULMONARY FUNCTION MEASURES IN CANNABIS-SMOKING SUBJECTS BY
TOBACCO SMOKING STATUS ....................................................................................................................... 38 TABLE S-14: CHANGE IN PULMONARY FUNCTION OVER TIME IN CANNABIS USERS ................... 39 TABLE S-15. BLOOD TEST RESULTS IN CANNABIS-EXPOSED SUBJECTS OVER 12 MONTHS
(SHOWN BY GENDER WHERE AVAILABLE).............................................................................................. 40 TABLE S-16. NUMBERS OF PATIENTS WITH ABNORMAL BLOOD TESTS, BY TIME ....................... 42 TABLE S-17. PAIN INTENSITY MEASURES1 IN CANNABIS-EXPOSED2 AND CONTROL PATIENTS,
BY MONTH OF FOLLOW-UP ......................................................................................................................... 44 TABLE S-18. EFFECTS1OF CANNABIS USE ON PAIN INTENSITY OVER TIME 2 ................................ 45 TABLE S-19. MCGILL PAIN QUESTIONNAIRE (MPQ) SCORES IN CANNABIS-EXPOSED AND
CONTROL PATIENTS, BY MONTH OF FOLLOW-UP 1 ............................................................................... 46 TABLE S-20. EFFECTS1 OF CANNABIS ON PAIN QUALITY MEASURED BY THE MCGILL PAIN
QUESTIONNAIRE (MPQ)2 .......................................................................................................................... 47 TABLE S-21. MODIFIED EDMONTON SYMPTOM ASSESSMENT SCALE (ESAS) SCORES IN
CANNABIS-EXPOSED AND CONTROL PATIENTS, BY MONTH OF FOLLOW-UP 1 ............................... 48 TABLE S-22. THE EFFECT1 OF CANNABIS ON SYMPTOM DISTRESS, MEASURED BY MODIFIED
EDMONTON SYMPTOM ASSESSMENT SCALE2 ....................................................................................... 50 TABLE S-23. PROFILE OF MOOD STATES (POMS) IN CANNABIS-EXPOSED AND CONTROL
PATIENTS, BY MONTH OF FOLLOW-UP 1 .................................................................................................. 51 TABLE S-24. THE EFFECTS1 OF CANNABIS ON PROFILE OF MOOD SCALE MEASURES 2 ............ 52 TABLE S-25. CHANGE IN QUALITY OF LIFE (SF-36V2®) SUMMARY SCORES OVER ONE YEAR 53

MANUSCRIP
T
ACCEPTED
ACCEPTED MANUSCRIPT
3
1 Study drug
Cannabis was provided to the site pharmacies as a milled herbal product
with 10mm grind size and 15% humidity in sealed 30g gold foil packages,
certified free of contaminants and impurities.
2 Statistical plans
2.1 Adverse event analysis
A Poisson Regression model was used to examine the association between
medical cannabis use and adverse events compared with controls. Specific
variables concerning cannabis use and AEs were examined to identify
potential confounders or effect modifiers. These variables included age,
gender, disability status, past cannabis use, tobacco use, alcohol use, baseline
pain intensity, concomitant medication use (opioids, antidepressants,
anticonvulsants) and study sites. Potential confounders and effect modifiers
were examined in the final regression model. Goodness of Fit was assessed to
evaluate overdispersion.
We calculated the proportion of patients who experienced at least one event,
serious, and non-serious adverse events in both groups.
2.2 Neurocognitive test analyses
Raw and scaled scores of each subtest of neurocognitive function were
considered as a continuous measure to compare their changes over time.
Only subjects with complete raw scores of each subtest at both time points
were included in each analysis. A random effects model with a random

MANUSCRIP
T
ACCEPTED
ACCEPTED MANUSCRIPT
4
intercept for patient was fitted to look at effects of exposure, follow-up time,
and interaction of exposure and follow-up time after adjusting for potential
confounders or covariates. Follow-up time was defined as a dummy variable
with baseline as a reference group (i.e. 6 months vs. baseline, and 12 months
vs. baseline). A separate multiple regression analysis was performed for each
of the neurocognitive subtests, except for Verbal Paired Associates II—
Recognition test since 95% of participants obtained a maximum score of 24
on this test. As analysis of both raw and scaled scores gave virtually identical
results, only the raw scores are presented in the tables.
2.3 Respiratory function
Paired t-tests were performed to examine the effects of cannabis on
pulmonary function.
3 Modifications to Protocol
Expected incidences in the control group required for a specified power (0.5,
0.6, 0.7, 0.8, and 0.9) were estimated at a 5% level of statistical significance. A
rate ratio of 1.5 can be detected with over 80% power for an incidence rate
of SAEs in the control group above 0.15 case/person-year. The initial sample
size target was 350 cannabis-using subjects and 1050 (3:1) subjects in the
control group matched by age, disease and site (see Protocol modifications,
below).
However, early in the implementation of the study, the feasibility of
recruiting 1050 controls (an average of 150 controls per clinic) was
questioned. In addition, clinic visit scheduling was perceived to be too much

MANUSCRIP
T
ACCEPTED
ACCEPTED MANUSCRIPT
5
of a burden for the patients. The protocol was therefore revised with respect
to the following points:
1. Remove the requirement for cannabis users recruited after
March 1st 2006 to undergo blood testing at baseline and
during follow-ups;
2. Remove the requirement for baseline and follow-up
neurocognitive testing in all subjects recruited after March
1st 2006 in both the cannabis users and the control group;
3. Decrease the number of control subjects from 1050 to 350;
4. Switch the 2-, 3- and 9-month clinic visits for subjects in the
cannabis group recruited after March 1st 2006 to telephone
interviews instead.
All protocol modifications were approved by all appropriate regulatory and
ethics committees.
4 Adjudication of adverse events
To identify and address any differences in the way study sites classified the
causality and severity of adverse events, an Adjudication Committee was
established to review the classification of adverse events reported during
this study. Two clinical reviewers independently assessed the seriousness,
severity and causality of each event. The committee then met to compare
assessments and to discuss the discrepancies and means to resolve them.
Suggestions for amendments to the database were passed on to the Steering
Committee for approval and any necessary database changes made.

MANUSCRIP
T
ACCEPTED
ACCEPTED MANUSCRIPT
6
5 Study withdrawals
The most common reasons for early discontinuation of study drug in
cannabis group were lack of efficacy (18 patients), adverse events (10), non-
compliance with the protocol (6), lack of efficacy and adverse effects (5),
dislike of the study product (4), and not specified (8). Seventeen patients
discontinued the study due to non-medical reasons, for example, moving to
other cities and family reasons. The most common reasons for early
discontinuation among control patients were non-compliance with the study
protocol (7), becoming pregnant (2), other personal reasons (8), and not
specified (15).
Adverse events led to treatment interruptions in 24 (60%) events, among
which 22 were temporary suspensions with a median of 3 days (range 1-37
days).
6 Additional dosing data
“Current cannabis users” (median 2.8 g/d; range: 0.2-13.4) consumed more
cannabis than “ex-cannabis users” (median: 1.8 g/d; range: 0.1-3.7) or
“cannabis-naïve” (2.0 g/d; range: 0.1-3.4) over the course of the study
(p<0.0001).
7 Adverse event reports
Severe AEs among cannabis users included diverticulitis, haematemesis, joint
arthroplasty, mania, motor dysfunction, multiple sclerosis, muscle spasms,
and vomiting. Of these, only mania was considered as “certainly/very likely”
related to the study cannabis.

MANUSCRIP
T
ACCEPTED
ACCEPTED MANUSCRIPT
7
The most common AEs in the cannabis group were headache (n=41, 5.01%),
nasopharyngitis (n=37, 4.52%), nausea (n=36, 4.40%), somnolence (n=29,
3.55%) and dizziness (n=27, 3.30%) (Table S-8).
Three hundred and eight non-serious AEs, considered as “certainly/very
likely”, “probably/likely” or “possibly” related to the study cannabis, were
reported by 126 patients. Those assessed as “certainly/very likely” related to
the study cannabis were somnolence (5), amnesia (4), cough (4), nausea (4),
dizziness (3), euphoric mood (3), hyperhidrosis (2), paranoia (2), anxiety (1),
cognitive disorder (1), confusional state (1), decreased appetite (1),
headache (1), increased appetite (1), lethargy (1), mania (1), oral discomfort
(1), rash (1), sedation (1), vision blurred (1), and vomiting (1) (Table S-7).

MANUSCRIP
T
ACCEPTED
ACCEPTED MANUSCRIPT
8
8 Additional tables
Table S-1: Duration of follow up, according to study groups
Duration Cannabis
(N=215)
Control
(N=216)
<30 days 3 (1.4%) 3 (1.4%)
30 days to <3 months 6 (2.8%) 0
3 months to <6 months 10 (4.6%) 3 (1.4%)
6 months to <9 months 28 (13.0%) 13 (6.0%)
9 months to <12 months 20 (9.3%) 15 (6.9%)
> 12 months 148 (68.8%) 182 (84.3%)
Range (days) 7-551 28-567
Total person-years
(years)
176.9 204.1

MANUSCRIP
T
ACCEPTED
ACCEPTED MANUSCRIPT
9
Table S-2. Baseline characteristics of subjects, by discontinuation status1
Characteristics Completed
subjects
(N=330)
Discontinued
subjects
(N=101)
P
Age at enrollment (years) 2 49.5 (10.5) 47.2 (11.5) 0.09
Gender (% of male) 138 (41.8%) 48 (47.5%) 0.31
Education (% of
University/College)3
171 (53.2%) 62 (63.2%) 0.08
N (%) of being married 211 (63.9%) 62 (61.4%) 0.64
N (%) of being disabled 178 (53.9%) 53 (52.5%) 0.80
Tobacco status at enrollment 0.50
Current smokers 116 (35.2%) 42 (41.6%)
Ex smokers 117 (35.4%) 33 (32.7%)
Never smokers 97 (29.4%) 26 (25.7%)
Alcohol status at enrollment 0.07
Current drinking 234 (70.9%) 81 (80.2%)
Ever/never drinking 96 (29.1%) 20 (19.8%)
Past cannabis use4
Control group N=182 N=34 0.05
Ex cannabis users 54 (29.7%) 16 (47.1%)
Naïve users 128 (70.3%) 18 (52.9%)
Cannabis group N=148 N=67 <0.001
Current cannabis users 109 (73.6%) 32 (47.8%)
Ex cannabis users 32 (21.6%) 26 (38.8%)
Naïve users 7 (4.7%) 9 (13.4%)
Average pain intensity 2 6.4 (1.9) 6.3 (1.9) 0.72
Duration of pain (years)5 8 (0.5-82) 7 (1-51) 0.53
Type of pain 0.76
Nociceptive 55 (16.7%) 19 (18.8%)
Neuropathic 120 (36.4%) 33 (32.7%)
Both 154 (46.8%) 49 (48.5%) 1Data are presented as number (percentage) unless otherwise indicated. 2Mean (SD) 3Completed subjects=321; discontinued subjects=98
4“Current cannabis users” were those who reported using cannabis and were still using at
baseline interview; “Ex cannabis users” were those who reported having used cannabis but
were not using at baseline interview; “naïve users” were those who reported never using
cannabis prior to baseline interview.
5Median (range), the Wilcoxon Rank Sum Test

MANUSCRIP
T
ACCEPTED
ACCEPTED MANUSCRIPT
10
Dosing patterns and characteristics
Table S-3. Mode of cannabis administration during the study
Mode of administration Number of patients Percentage
Smoking cannabis at least once
188 88.7%
Smoking only 58 27.4%
Smoking and oral 93 43.9%
Smoking, oral and vaporized
29 13.7%
Smoking and vaporized
8 3.8%
Never smoking 24 11.3%
Oral only 17 8.0%
Vaporized only 1 0.5%
Oral and vaporized 6 2.8%
Total 212 1 100.0%
1. Three patients did not provide information about mode of administration.

MANUSCRIP
T
ACCEPTED
ACCEPTED MANUSCRIPT
11
Table S-4. Daily dosage of cannabis during the study
By category Number of patients
Percentage
<1 gram/day 29 13.6%
>=1 and <2 grams/day 53 24.8%
>=2 and <3 grams/day 73 34.1%
>=3 grams/day 59 27.6%
Table S-4a Median daily dose of cannabis used, shown by participating clinic
Clinic centers Median (grams/day)
Range (grams/day)
Interquartile range (grams/day)
Halifax (n=42) 2.97 0.49-3.67 1.93-3.00
Toronto (n=33) 2.71 0.53-3.59 2.14-3.14
Hotel Dieu (n=17) 3.01 0.71-4.43 1.02-3.68
London (n=30) 2.50 0.56-3.51 1.97-2.89
Fredericton (n=31) 2.46 1.02-3.95 1.66-3.01
Vancouver (n=19) 1.55 0.51-3.25 0.98-2.23
Montreal General Hospital (n=42)
1.30 0.09-13.40 0.89-2.49
Entire study (N=214) 1 2.46 0.09-13.40 1.52-3.00
1. One patient did not have information on the consumption of study cannabis.

MANUSCRIP
T
ACCEPTED
ACCEPTED MANUSCRIPT
12
Table S-5: Detailed listing of serious adverse events by cannabis exposure status
Serious adverse event1
Cannabis Control
Number of
events Rate2
Number
of events Rate2
Surgical and medical procedures 10 5.65 11 5.39
Knee arthroplasty 2 1
Surgery 1 3
Hysterectomy 1 1
Amputation 1 0
Bilateral orchidectomy 1 0
Cholecystectomy 1 0
Elective procedure 1 0
Joint arthroplasty 1 0
Oophorectomy 1 0
Colostomy 0 1
Hip arthroplasty 0 1
Mastectomy 0 1
Medical device implantation 0 1
Oesophagogastric
fundoplasty 0 1
Vaginal operation 0 1
Gastrointestinal disorders 10 5.65 7 3.43
Abdominal pain 3 3 (1 died)
Intestinal obstruction 3 0
Rectal haemorrhage 1 1
Gastrointestinal
haemorrhage 1 0

MANUSCRIP
T
ACCEPTED
ACCEPTED MANUSCRIPT
13
Nausea 1 0
Vomiting 1 0
Diarrhoea 0 2
Pancreatitis 0 1
Musculoskeletal and connective
tissue disorders 5 2.82 6 2.94
Back pain 2 0
Arthralgia 1 2
Musculoskeletal pain 1 1
Musculoskeletal chest pain 1 0
Neck pain 0 2
Fistula 0 1
1. Ordered by the rate of serious adverse events in the cannabis group
2. Incidence rate=events/ 100 person-years

MANUSCRIP
T
ACCEPTED
ACCEPTED MANUSCRIPT
14
Table S-5 (cont’d)
Serious adverse event1
Cannabis Control
Number of
events Rate2
Number
of events Rate2
Injury, poisoning and procedural
complications 4 2.26 1 0.49
Rib fracture 2 0
Limb injury 1 0
Patella fracture 1 0
Pelvic fracture 0 1
Renal and urinary disorders 3 1.69 1 0.49
Nephrolithiasis 3 0
Urinary tract infection 0 1
Nervous system disorders 2 1.13 4 1.96
Convulsion 1 0
Multiple sclerosis 1 0
Dizziness 0 2
Headache 0 1
Hypoaesthesia 0 1
Respiratory, thoracic and
mediastinal disorders 1 0.56 7 3.43
Pulmonary embolism 1 1
Bronchospasm 0 3
Pneumonia 0 3

MANUSCRIP
T
ACCEPTED
ACCEPTED MANUSCRIPT
15
Infections and infestations 1 0.56 5 2.45
Post procedural infection 1 1
Abscess 0 1
Infection 0 1
Joint abscess 0 1
Sepsis 0 1
Vascular disorders 1 0.56 3 1.47
Aneurysm arteriovenous 1 0
Hypertension 0 1
Hypovolaemic shock 0 1
Syncope 0 1
1. Ordered by the rate of serious adverse events in the cannabis group
2. Incidence rate=events/ 100 person-years

MANUSCRIP
T
ACCEPTED
ACCEPTED MANUSCRIPT
16
Table S-5 (cont’d)
Serious adverse event1
Cannabis Control
Number of
events Rate2
Number
of events Rate2
Metabolism and nutrition disorders 1 0.56 2 0.98
Dehydration 1 1
Diabetic coma 0 1
Psychiatric disorders 1 0.56 2 0.98
Alcohol problem 1 0
Completed suicide 0 1 (died)
Suicide attempt 0 1
Investigations 1 0.56 0 0.00
Biopsy skin 1 0
General disorders and
administration site conditions 0 0.00 3 1.47
Pain 0 2
Chest pain 0 1
Blood and lymphatic system
disorders 0 0.00 1 0.49
Lymphadenopathy 0 1
Eye disorders 0 0.00 1 0.49
Vision blurred 0 1

MANUSCRIP
T
ACCEPTED
ACCEPTED MANUSCRIPT
17
Hepatobiliary disorders 0 0.00 1 0.49
Liver abscess 0 1
Immune system disorders 0 0.00 1 0.49
Hypersensitivity 0 1
Total 40 22.61 56 27.45
1. Ordered by the rate of serious adverse events in the cannabis group
2. Incidence rate=events/ 100 person-years

MANUSCRIP
T
ACCEPTED
ACCEPTED MANUSCRIPT
18
Table S-6: Most frequently reported non-serious adverse events1
1. Data are presented as occurrences of events (percentage).
Adverse Event (Preferred
term) Cannabis Control
Headache 40 (4.9%) 24 (4.2%)
Nasopharyngitis 37 (4.5%) 22 (3.8%)
Nausea 36 (4.4%) 21 (3.7%)
Somnolence 29 (3.6%) 10 (1.7%)
Dizziness 27 (3.3%) 21 (3.7%)
Upper respiratory tract infection 21 (2.6%) 21 (3.7%)
Influenza 19 (2.3%) 24 (4.2%)
Pharyngolaryngeal pain 19 (2.3%) 8 (1.4%)
Vomiting 17 (2.1%) 14 (2.4%)
Cough 16 (2.0%) 3 (0.5%)
Rash 14 (1.7%) 9 (1.6%)
Diarrhea 13 (1.6%) 10 (1.9%)
Urinary tract infection 13 (1.6%) 11 (1.9%)
Back pain 12 (1.5%) 9 (1.6%)
Muscle spasms 11 (1.3%) 4 (0.7%)
Depression 10 (1.2%) 10 (1.7%)
Anxiety 10 (1.2%) 2 (0.3%)

MANUSCRIP
T
ACCEPTED
ACCEPTED MANUSCRIPT
19
Table S-7. Causality of non-serious adverse events (cannabis group only) 1
System Organ Class
(MedDRA) Certain
Probable/
likely Possible Unlikely
Nervous system disorders 16 (40%) 51 (44%) 35 (23%) 60 (12%)
Gastrointestinal disorders 6 (15%) 13 (11%) 25 (17%) 61 (12%)
Respiratory, thoracic and
mediastinal disorders 4 (10%) 16 (14%) 32 (21%) 51 (10%)
Infections and infestations 0 0 1 (1%) 86 (17%)
Musculoskeletal and
connective tissue disorders 0 2 (2%) 3 (2%) 72 (14%)
Psychiatric disorders 8 (20%) 16 (14%) 18 (12%) 15 (3%)
General disorders and
administration site
conditions 2 (5%) 3 (3%) 6 (4%) 24 (5%)
Injury, poisoning and
procedural complications 0 0 2 (1%) 29 (6%)
Renal and urinary disorders 0 0 2 (1%) 27 (5%)
Skin and subcutaneous tissue
disorders 1 (3%) 0 2 (1%) 17 (3%)
Investigations 0 3 (3%) 7 (5%) 11 (2%)
Eye disorders 1 (3%) 4 (3%) 4 (3%) 11 (2%)
Reproductive system and
breast disorders 0 1 (<1%) 4 (3%) 10 (2%)
Metabolism and nutrition
disorders 2 (5%) 3 (3%) 4 (3%) 5 (1%)
Vascular disorders 0 1 (<1%) 1 (<1%) 6 (1%)
Surgical and medical
procedures 0 0 0 6 (1%)
Cardiac disorders 0 1 (<1%) 3 (2%) 0
Blood and lymphatic system
disorders 0 0 0 4 (<1%)
Ear and labyrinth disorders 0 2 (2%) 0 2 (<1%)
Immune system disorders 0 0 1 (<1%) 3 (<1%)
Hepatobiliary disorders 0 0 0 2 (<1%)
Endocrine disorders 0 0 0 1 (<1%)
Total2 40 116 150 503 1Data are presented as occurrences of events (percentage) 2Causality of 7 adverse events was “unclassifiable”.

MANUSCRIP
T
ACCEPTED
ACCEPTED MANUSCRIPT
20
Table S-8. Detailed listing of non-serious AEs
System organ class Cannabis group Control group
Preferred Terms
Nervous system disorders 164 20.0% 93 16.0%
Headache 41 24
Somnolence 29 10
Dizziness 27 21
Amnesia 9 1
Migraine 7 2
Paraesthesia 6 2
Cognitive disorder 6 0
Sedation 5 1
Hypoaesthesia 4 5
Lethargy 4 1
Memory impairment 4 0
Syncope 3 4
Tremor 3 4
Insomnia 2 4
Multiple sclerosis 2 3
Sensory disturbance 2 0
Balance disorder 1 2
Burning sensation 1 2
Vertigo 1 2
Convulsion 1 1
Facial palsy 1 1
Speech disorder 1 1
Gait disturbance 1 0

MANUSCRIP
T
ACCEPTED
ACCEPTED MANUSCRIPT
21
Motor dysfunction 1 0
Movement disorder 1 0
Sinus headache 1 0
Blindness 0 1
Neuropathy peripheral 0 1
Gastrointestinal disorders 109 13.3% 101 17.4%
Nausea 36 21
Vomiting 17 14
Diarrhoea 13 11
Dry mouth 7 2
Abdominal pain 5 12
Constipation 5 7
Stomach discomfort 3 5
Dyspepsia 3 3
Gastroenteritis viral 3 1
Dysphagia 2 2
Dental caries 2 1
Abdominal distension 2 0
Diverticulitis 2 0
Gastroenteritis 1 6
Toothache 1 3
Abdominal pain upper 1 2
Melaena 1 1
Oral discomfort 1 1
Gingival recession 1 0
Haematemesis 1 0
Hiatus hernia 1 0
Rectal haemorrhage 1 0

MANUSCRIP
T
ACCEPTED
ACCEPTED MANUSCRIPT
22
Gingivitis 0 2
Abdominal discomfort 0 1
Diverticulum 0 1
Faecal incontinence 0 1
Gastrooesophageal reflux disease 0 1
Gingival bleeding 0 1
Hiccups 0 1
Mouth ulceration 0 1
Respiratory, thoracic and mediastinal
disorders 103 12.6% 67 11.5%
Upper respiratory tract infection 21 22
Pharyngolaryngeal pain 19 8
Cough 16 3
Sinusitis 8 10
Bronchitis 6 5
Pneumonia 6 4
Throat irritation 6 1
Dyspnoea 4 3
Lower respiratory tract infection 3 3
Respiratory tract congestion 2 1
Respiratory tract infection 2 1
Sinus congestion 2 0
Wheezing 1 1
Dry throat 1 0
Haemoptysis 1 0
Nasal congestion 1 0
Pharyngeal oedema 1 0
Pulmonary bulla 1 0

MANUSCRIP
T
ACCEPTED
ACCEPTED MANUSCRIPT
23
Rhinitis 1 0
Rhinorrhoea 1 0
Laryngitis 0 1
Pharyngitis 0 1
Productive cough 0 1
Pulmonary embolism 0 1
Throat tightness 0 1
Infections and infestations 89 10.9% 68 11.7%
Nasopharyngitis 37 22
Influenza 19 24
Oral herpes 6 2
Tooth infection 4 0
Tooth abscess 3 6
Cellulitis 3 5
Fungal infection 3 0
Gingival infection 2 1
Abscess 1 0
Abscess jaw 1 0
Abscess oral 1 0
Body tinea 1 0
Herpes simplex 1 0
Herpes zoster 1 0
Infected cyst 1 0
Oral candidiasis 1 0
Prostate infection 1 0
Skin infection 1 0
Staphylococcal infection 1 0
Viral infection 1 0

MANUSCRIP
T
ACCEPTED
ACCEPTED MANUSCRIPT
24
Infection 0 2
Abscess limb 0 1
Genital herpes 0 1
Gingival abscess 0 1
Localised infection 0 1
Nail infection 0 1
Tinea pedis 0 1
Musculoskeletal and connective tissue
disorders 77 9.4% 67 11.5%
Back pain 12 10
Muscle spasms 11 4
Arthralgia 8 10
Pain in extremity 7 14
Joint sprain 6 6
Musculoskeletal chest pain 5 1
Musculoskeletal pain 5 0
Neck pain 3 4
Muscular weakness 3 1
Joint swelling 2 2
Gout 2 1
Arthritis 2 0
Bursitis 2 0
Sciatica 2 0
Musculoskeletal stiffness 1 3
Muscle strain 1 1
Bone pain 1 0
Muscle fatigue 1 0
Muscle twitching 1 0

MANUSCRIP
T
ACCEPTED
ACCEPTED MANUSCRIPT
25
Musculoskeletal disorder 1 0
Pain in jaw 1 0
Myalgia 0 2
Bone cyst 0 1
Bone development abnormal 0 1
Chest wall cyst 0 1
Coccydynia 0 1
Fasciitis 0 1
Joint stiffness 0 1
Muscle spasticity 0 1
Osteoarthritis 0 1
Psychiatric disorders 57 7.0% 24 4.1%
Depression 10 10
Anxiety 10 2
Euphoric mood 9 0
Disturbance in attention 5 2
Confusional state 3 4
Panic attack 2 1
Paranoia 2 0
Irritability 1 1
Mood altered 1 1
Abnormal behaviour 1 0
Agitation 1 0
Apathy 1 0
Dissociation 1 0
Exaggerated startle response 1 0
Flat affect 1 0
Flight of ideas 1 0

MANUSCRIP
T
ACCEPTED
ACCEPTED MANUSCRIPT
26
Hallucination 1 0
Mania 1 0
Nicotine dependence 1 0
Restlessness 1 0
Self esteem decreased 1 0
Suicidal behaviour 1 0
Withdrawal syndrome 1 0
Delusion 0 1
Mental disorder 0 1
Stress 0 1
General disorders and administration site
conditions 35 4.3% 23 4.0%
Fatigue 8 3
Asthenia 6 1
Oedema peripheral 4 6
Hyperhidrosis 4 1
Chest pain 3 5
Pain 2 0
Inflammation 1 1
Chest discomfort 1 0
Cyst 1 0
Feeling jittery 1 0
Local reaction 1 0
Local swelling 1 0
Nodule 1 0
Ulcer 1 0
Oedema 0 3
Chills 0 1

MANUSCRIP
T
ACCEPTED
ACCEPTED MANUSCRIPT
27
Malaise 0 1
Pyrexia 0 1
Injury, poisoning and procedural
complications 31 3.8% 23 4.0%
Contusion 7 6
Fall 5 5
Limb injury 2 1
Neck injury 2 1
Soft tissue injury 2 0
Wound 2 0
Concussion 1 1
Arthropod bite 1 0
Back injury 1 0
Blister 1 0
Head injury 1 0
Injection site haemorrhage 1 0
Muscle injury 1 0
Road traffic accident 1 0
Skeletal injury 1 0
Skin injury 1 0
Thermal burn 1 0
Skin laceration 0 2
Ankle fracture 0 1
Blood blister 0 1
Foot fracture 0 1
Infusion site haemorrhage 0 1
Joint dislocation 0 1
Rib fracture 0 1
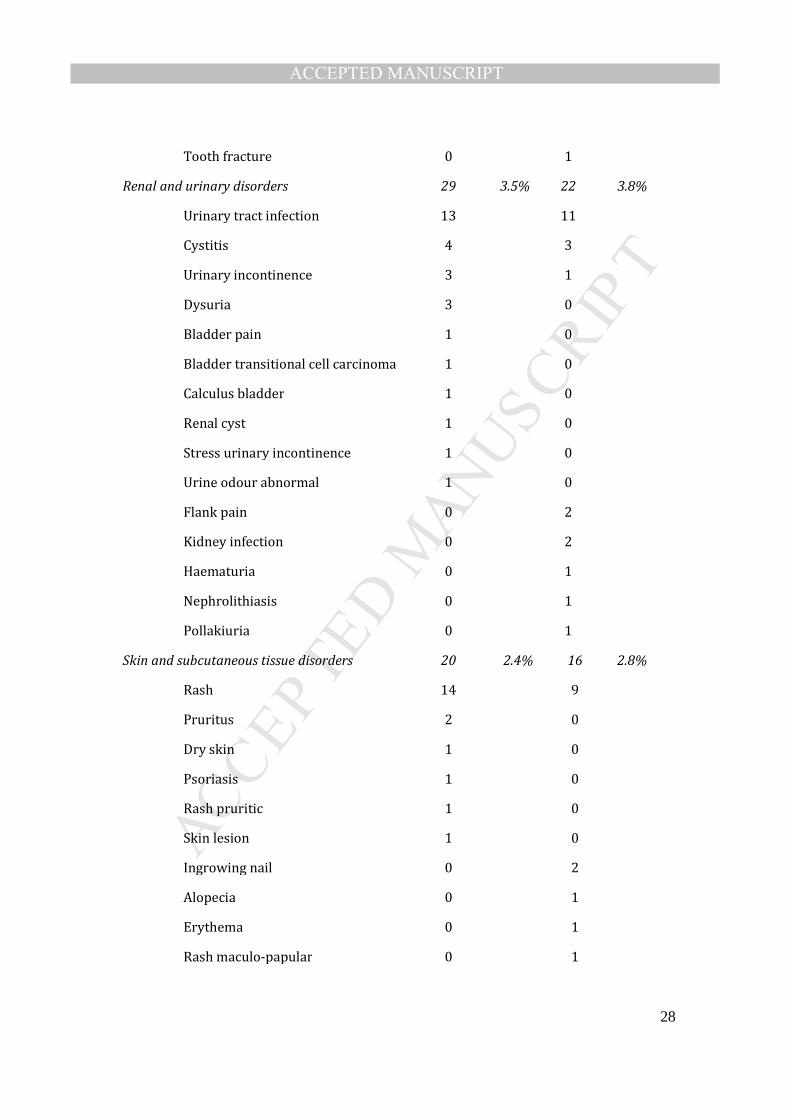
MANUSCRIP
T
ACCEPTED
ACCEPTED MANUSCRIPT
28
Tooth fracture 0 1
Renal and urinary disorders 29 3.5% 22 3.8%
Urinary tract infection 13 11
Cystitis 4 3
Urinary incontinence 3 1
Dysuria 3 0
Bladder pain 1 0
Bladder transitional cell carcinoma 1 0
Calculus bladder 1 0
Renal cyst 1 0
Stress urinary incontinence 1 0
Urine odour abnormal 1 0
Flank pain 0 2
Kidney infection 0 2
Haematuria 0 1
Nephrolithiasis 0 1
Pollakiuria 0 1
Skin and subcutaneous tissue disorders 20 2.4% 16 2.8%
Rash 14 9
Pruritus 2 0
Dry skin 1 0
Psoriasis 1 0
Rash pruritic 1 0
Skin lesion 1 0
Ingrowing nail 0 2
Alopecia 0 1
Erythema 0 1
Rash maculo-papular 0 1

MANUSCRIP
T
ACCEPTED
ACCEPTED MANUSCRIPT
29
Skin irritation 0 1
Skin reaction 0 1
Investigations 21 2.6% 8 1.4%
Weight increased 6 3
Weight decreased 5 2
Blood pressure increased 2 1
Biopsy liver 2 0
Blood urine present 2 0
Electrocardiogram abnormal 1 0
Electroencephalogram abnormal 1 0
Heart rate increased 1 0
X-ray abnormal 1 0
Hepatic enzyme increased 0 1
Urethroscopy 0 1
Eye disorders 20 2.4% 14 2.4%
Vision blurred 6 6
Dry eye 3 0
Conjunctivitis 2 1
Eye infection 1 2
Visual disturbance 1 1
Asthenopia 1 0
Conjunctival hyperaemia 1 0
Corneal erosion 1 0
Eye irritation 1 0
Eye pain 1 0
Eyes sunken 1 0
Photophobia 1 0
Cataract 0 1

MANUSCRIP
T
ACCEPTED
ACCEPTED MANUSCRIPT
30
Eye inflammation 0 1
Uveitis 0 1
Visual field defect 0 1
Reproductive system and breast disorders 15 1.8% 6 1.0%
Vaginal haemorrhage 3 1
Vaginal infection 3 0
Vulvovaginal mycotic infection 2 1
Menorrhagia 2 0
Breast mass 1 1
Breast cyst 1 0
Lactation disorder 1 0
Vaginal pain 1 0
Vulvovaginal discomfort 1 0
Ovarian cyst 0 1
Testicular swelling 0 1
Vaginal candidiasis 0 1
Metabolism and nutrition disorders 14 1.7% 7 1.2%
Increased appetite 7 0
Decreased appetite 3 1
Anorexia 2 2
Hypercholesterolaemia 1 2
Hypocalcaemia 1 0
Hyperglycaemia 0 1
Hypothyroidism 0 1
Vascular disorders 8 1.0% 9 1.5%
Hypertension 1 5
Haematoma 1 1
Accelerated hypertension 1 0

MANUSCRIP
T
ACCEPTED
ACCEPTED MANUSCRIPT
31
Aneurysm 1 0
Circulatory collapse 1 0
Haemangioma 1 0
Skin ulcer 1 0
Venous thrombosis 1 0
Epistaxis 0 2
Phlebitis 0 1
Surgical and medical procedures 7 0.9% 12 2.1%
Tooth extraction 2 2
Dental operation 2 0
Elective surgery 1 2
Arthroscopic surgery 1 0
Joint arthroplasty 1 0
Cyst removal 0 2
Gingival graft 0 2
Foot operation 0 1
Mole excision 0 1
Nail operation 0 1
Wisdom teeth removal 0 1
Cardiac disorders 4 0.5% 7 1.2%
Palpitations 3 2
Tachycardia 1 0
Atrial fibrillation 0 1
Bradycardia 0 1
Cardiovascular disorder 0 1
Sinus arrhythmia 0 1
Ventricular extrasystoles 0 1
Ear and labyrinth disorders 4 0.5% 5 0.9%

MANUSCRIP
T
ACCEPTED
ACCEPTED MANUSCRIPT
32
Cerumen impaction 1 0
Deafness 1 0
Tinnitus 2 1
Ear infection 0 3
Ear pain 0 1
Immune system disorders 4 0.5% 5 0.9%
Hypersensitivity 1 1
Urticaria 3 3
Systemic lupus erythematosus 0 1
Blood and lymphatic system disorders 4 0.5% 0 0
Anaemia 3 0
Neutrophilia 1 0
Hepatobiliary disorders 2 0.2% 1 0.2%
Cholecystitis 1 0
Cholelithiasis 1 0
Hepatic cyst 0 1
Endocrine disorders 1 0.1% 0 0
Adrenal adenoma 1 0
Neoplasms benign, malignant and unspecified
(incl cysts and polyps) 0 0 3 0.5%
Breast cancer 0 1
Gingival cyst 0 1
Uterine polyp 0 1
Total 818 581

MANUSCRIP
T
ACCEPTED
ACCEPTED MANUSCRIPT
33
Table S-9. Incidence rate of adverse events, by past cannabis use1
Group
Current cannabis users Ex cannabis users Naïve users
Number
Incidence
rate2 (95% CI) Number
Incidence rate2
(95% CI) Number
Incidence rate 2
(95% CI)
All SAE Cannabis 20 0.16(0.09-0.23) 13 0.31(0.14-0.48) 7 0.65 (0.17-1.13)
Controls 12 0.19(0.08-0.30) 44 0.31(0.22-0.41)
All Non-serious adverse
events
Cannabis 501 4.02(3.67-4.37) 256 6.18(5.43-6.94) 61 5.65(4.23-7.07)
Controls 186 2.93(2.50-3.35) 395 2.81(2.53-3.09)
System Organ Class (MedDRA)
Nervous system disorders Cannabis 83 0.67(0.52-0.81) 67 1.62(1.23-2.01) 14 1.30(0.62-1.98)
Controls 23 0.36(0.21-0.51) 70 0.50(0.38-0.62)
Gastrointestinal disorders Cannabis 62 0.50(0.37-0.62) 33 0.80(0.52-1.07) 14 1.30(0.62-1.98)
Controls 25 0.39(0.24-0.55) 76 0.54(0.42-0.66)
Respiratory, thoracic and
mediastinal disorders
Cannabis 67 0.54(0.41-0.66) 31 0.75(0.49-1.01) 5 0.46(0.06-0.87)
Controls 24 0.38(0.23-0.53) 43 0.31(0.21-0.40)
Infections and infestations Cannabis 55 0.44(0.32-0.56) 28 0.68(0.43-0.93) 6 0.56(0.11-1.00)
Controls 26 0.41(0.25-0.57) 42 0.30(0.21-0.39)
Musculoskeletal and
connective tissue
disorders
Cannabis 57 0.46(0.34-0.58) 15 0.36(0.18-0.55) 5 0.46(0.06-0.87)
Controls 23 0.36(0.21-0.51) 44 0.31(0.22-0.41)
Psychiatric disorders Cannabis 32 0.26(0.14-0.35) 21 0.51(0.29-0.72) 4 0.37 (0.01-0.74)]
Controls 8 0.13(0.04-0.21) 16 0.11(0.06-0.17)
General disorders and
administration site
conditions
Cannabis 16 0.13(0.07-0.19) 15 0.36(0.18-0.55) 4 0.37(0.01-0.74)
Controls 9 0.14(0.05-0.23) 14 0.10(0.05-0.15)
1“Current cannabis users” were those who reported using cannabis and were still using at baseline interview; “Ex cannabis users” were those who
reported having used cannabis but were not using at baseline interview; “naïve user” were those who reported never using cannabis prior to baseline
interview. 2Unit: events/person-year

MANUSCRIP
T
ACCEPTED
ACCEPTED MANUSCRIPT
34
Table S-10: Unadjusted and adjusted rate ratios of SAEs for medical cannabis, by daily dose
Average
daily dose
Number
of
patients1
Cumulative
person-
years
Number
of
Events
Incidence
rate 2
Unadjusted
IRR
(95% CI)
Adjusted
IRR 3
(95%CI)
Serious adverse event (SAE)
0 216 204.1 56 0.27 1.00 1.00
<1
grams/day 29 20.6 1 0.05
0.18
(0.01-2.81)
0.34
(0.03-4.16)
1-1.99
grams/day 53 40.6 7 0.17
0.63
(0.21-1.89)
1.31
(0.41-4.15)
2-2.99
grams/day 73 61.1 18 0.29
1.07
(0.51-2.26)
1.51
(0.62-3.73)
>= 3
grams/day 59 54.7 14 0.26
0.93
(0.41-2.11)
1.34
(0.50-3.63)
Non-serious adverse event (AE)
0 216 204.1 574 2.81 1.00 1.00
<1
grams/day 29 20.6 157 7.62
2.71
(1.99-3.70)
2.34
(1.69-3.25)
1-1.99
grams/day 53 40.6 182 4.48
1.59
(1.19-2.14)
1.72
(1.25-2.38)
2-2.99
grams/day 73 61.1 294 4.81
1.71
(1.34-2.19)
1.63
(1.21-2.19)
>= 3
grams/day 59 54.7 183 3.35
1.19
(0.89-1.59)
1.40
(0.67-1.95)
IRR=Incidence rate ratio; 95% CI=95% confidence interval
1. One patient in the cannabis group did no have information on daily dosage.
2. Incidence rate=events/person-year
3. Adjusted for age at enrollment, gender, baseline pain intensity, baseline concomitant
pain medication (yes/no), disability status (yes/no), tobacco use (current vs. former
or never smokers), alcohol use (current vs. former or never users), past cannabis
use (ever vs. never), and study sites.

MANUSCRIP
T
ACCEPTED
ACCEPTED MANUSCRIPT
35
Table S-11: Incidence rates of adverse events, by past cannabis use 1
Adverse events Group Current cannabis users Ex cannabis users Naïve users
N 2 Incidence rate (95% CI) 3 N 2 Incidence rate (95% CI) 3 N 2 Incidence rate (95% CI) 3
All SAE Cannabis 20 0.16 (0.09-0.23) 13 0.31 (0.14-0.48) 7 0.65 (0.17-1.13)
Control -- ---- 12 0.19 (0.08-0.30) 44 0.31 (0.22-0.41)
All Non-serious adverse
events
Cannabis 500 4.01 (3.66-4.36) 255 6.16 (5.40-6.92) 61 5.65 (4.25-7.09)
Control -- ---- 184 2.89 (2.48-3.31) 390 2.78 (2.50-3.05)
Nervous system disorders Cannabis 83 0.67 (0.52-0.81) 66 1.59 (1.21-1.98) 14 1.30 (0.62-1.98)
Control -- ---- 23 0.36 (0.21-0.51) 70 0.50 (0.38-0.62)
Gastro-intestinal disorders Cannabis 62 0.50 (0.37-0.62) 33 0.80 (0.52-1.07) 14 1.30 (0.62-1.98)
Control -- ---- 25 0.39 (0.24-0.55) 74 0.53 (0.41-0.65)
Respiratory, thoracic and
mediastinal disorders
Cannabis 67 0.54 (0.41-0.66) 31 0.75 (0.49-1.01) 5 0.46 (0.06-0.87)
Control -- ---- 24 0.38 (0.23-0.53) 42 0.30 (0.21-0.39)
Infections and infestations Cannabis 55 0.44 (0.32-0.56) 28 0.68 (0.43-0.93) 6 0.56 (0.11-1.00)
Control -- ---- 26 0.41 (0.25-0.57) 41 0.29 (0.20-0.38)
Musculoskeletal and
connective tissue disorders
Cannabis 57 0.46 (0.34-0.58) 15 0.36 (0.18-0.55) 5 0.46 (0.06-0.87)
Control -- ---- 22 0.35 (0.20-0.49) 43 0.31 (0.21-0.40)
Psychiatric disorders Cannabis 32 0.26 (0.14-0.35) 21 0.51 (0.29-0.72) 4 0.37 (0.01-0.74)
Control -- ---- 8 0.13 (0.04-0.21) 16 0.11 (0.06-0.17)
General disorders and
administration site
conditions
Cannabis 16 0.13 (0.07-0.19) 15 0.36 (0.18-0.55) 4 0.37 (0.01-0.74)
Control -- ---- 9 0.14 (0.05-0.23) 14 0.10 (0.05-0.15)

MANUSCRIP
T
ACCEPTED
ACCEPTED MANUSCRIPT
36
1. “Current cannabis users” were those who reported using cannabis and were still using at baseline interview; “Ex cannabis users” were
those who reported having used cannabis but were not using at baseline interview; “naïve users” were those who reported never using
cannabis prior to baseline interview.
2. N=Number of events reported.
3. Incidence rate=events/person-year; 95%CI=95% confidence interval

MANUSCRIP
T
ACCEPTED
ACCEPTED MANUSCRIPT
37
Table S-12: Change in neurocognitive function by cannabis exposure and time
Neurocognitive
function tests
Independent
variables ß2 SE3 P
Verbal paired
associates I -
Recall
Cannabis vs.
controls -1.458 1.515 0.337
6 month vs.
baseline 1.791 0.853 0.037
12 months vs.
baseline 5.367 0.848 <0.001
Verbal paired
associates II-
Recall
Cannabis vs.
controls 0.043 0.423 0.919
6 month vs.
baseline 0.600 0.241 0.013
12 months vs.
baseline 1.231 0.239 <0.001
Digit-symbol
coding
Cannabis vs.
controls -2.479 3.786 0.513
6 month vs.
baseline 4.468 2.198 0.043
12 months vs.
baseline 4.597 2.187 0.037
Picture
arrangement
Cannabis vs.
controls -1.120 0.928 0.228
6 month vs.
baseline 1.976 0.476 <0.001
12 months vs.
baseline 3.103 0.473 <0.001
1. A random effects model with a random intercept for patient is fitted,
adjusting for age at enrollment, gender, education (college/university vs.
high school/elementary), disability status (yes/no), alcohol use (current vs.
former or never users), past cannabis use (ever/never), average pain
intensity and quality of life (evaluated by Physical Component Summary and
Mental Component Summary) at each time point, and study sites
2. ß=fixed regression coefficient for cannabis use
3. SE=standard error

MANUSCRIP
T
ACCEPTED
ACCEPTED MANUSCRIPT
38
Table S-13: Pulmonary function measures in cannabis-smoking subjects by tobacco smoking status
Pulmonary
function
tests
Current tobacco users Former or never tobacco users
Number
of
patients
Before
cannabis
(baseline)
1-year
after
Cannabis
Number
of
patients
Before
cannabis
(baseline)
1-year
after
Cannabis
SVC, L 63 4.24
(1.05)
4.21
(1.06) 72
4.24
(1.01)
4.23
(1.01)
FRC, L 54 3.33
(1.09)
3.55
(1.28) 64
3.08
(0.77)
3.00
(0.72)
RV, L 62 2.19
(0.77)
1.99
(0.89) 72
1.82
(0.65)
1.73
(0.61)
TLC, L 60 6.38
(1.63)
6.34
(1.63) 68
6.11
(1.15)
6.05
(1.11)
DLCO 59 21.23
(5.21)
19.37
(6.53) 69
23.30
(7.82)
22.90
(7.61)
FEV1,L 63 3.15
(0.76)
3.08
(0.75) 72
3.28
(0.79)
3.24
(0.84)
FVC, L 63 4.25
(1.03)
4.21
(1.04) 72
4.25
(0.99)
4.19
(1.03)
FEV1/FVC
(%) 63
74.51
(8.15)
73.40
(8.69) 71
77.51
(7.46)
77.01
(7.50)
FEF25-75% 63 2.70
(1.17)
2.37
(1.08) 72
2.93
(1.52)
2.84
(1.32)

MANUSCRIP
T
ACCEPTED
ACCEPTED MANUSCRIPT
39
Table S-14: Change in pulmonary function over time in cannabis users
Pulmonary function
tests ß2 SE3 P
SVC, L -0.021 0.031 0.507
FRC, L 0.054 0.066 0.414
RV, L -0.142 0.061 0.021
TLC, L -0.040 0.071 0.575
DLCO -1.086 0.446 0.016
FEV1,L -0.054 0.021 0.010
FVC, L -0.053 0.028 0.061
FEV1/FVC (%) -0.780 0.386 0.045
FEF25-75% -0.200 0.078 0.011
1. A random effects model with a random intercept for patient is fitted,
adjusting for age at enrollment, gender, tobacco (current vs. former or
never users), past cannabis use (current cannabis users vs. ex or naïve
users), and study sites.
2. ß=fixed regression coefficient for cannabis use.
3. SE=standard error

MANUSCRIP
T
ACCEPTED
ACCEPTED MANUSCRIPT
40
Table S-15. Blood test results in cannabis-exposed subjects over 12 months (shown by gender where available)
Parameters
Number
of
patients
Normal
range
Unit Mean (SD) Δ=Before-After
Before
cannabis 1-year after cannabis Mean (SD) P-value
WBC 78 3.7-10.8 ×10⁹/L 7.29 (1.82) 7.34 (1.97) 0.05 (1.78) 0.80
RBC 34 3.5-5.1 (F) ×109/L 4.44 (0.35) 4.40 (0.40) -0.04 (0.27) 0.43
44 4.2-5.8 (M) ×109/L 4.83 (0.45) 4.71 (0.45) -0.12 (0.23) <0.001
Hb 34 112-155 (F) g/L 137.35 (9.28) 136.59 (11.21) -0.76 (7.99) 0.58
44 132-172 (M) g/L 150.30 (12.31) 146.98 (12.57) -3.32 (7.82) 0.01
HCT 34 0.32-0.46 (F) L/L 0.41 (0.03) 0.40 (0.03) -0.00 (0.02) 0.30
44 0.37-0.51 (M) L/L 0.44 (0.04) 0.43 (0.04) -0.01 (0.02) <0.001
MCV 78 80-101 fL 91.89 (4.43) 91.79 (4.44) -0.09 (1.85) 0.65
MCH 78 26.5-34.5 pg 31.12 (1.55) 31.22 (1.47) 0.10 (0.73) 0.24
MCHC 78 323-356 g/L 338.42 (6.25) 339.86 (6.03) 1.44 (6.17) 0.04
RDW 78 11.6-15.5 % 13.22 (0.78) 13.17 (0.69) -0.05 (0.55) 0.42
PLT 78 125-420 ×109/L 268.03 (61.98) 262.13 (56.35) -5.90 (37.77) 0.17
MPV 78 7.0-11.5 fL 9.02 (0.98) 8.92 (1.03) -0.10 (0.49) 0.08
Neutrophils 78 0.45-0.77 0.64 (0.09) 0.63 (0.08) -0.01 (0.10) 0.25
Lymphocytes 78 0.14-0.42 0.26 (0.07) 0.28 (0.07) 0.02 (0.08) 0.04
Monocytes 78 0.02-0.12 0.07 (0.02) 0.06 (0.02) -0.00 (0.02) 0.29
Eosinophils 78 0-0.07 0.03 (0.02) 0.02 (0.02) -0.00 (0.02) 0.48
Basophils 78 0-0.02 0.01 (0.01) 0.00 (0.00) -0.00 (0.01) 0.04
WBC diff manual-
Neutrophils
78 1.9-7.1
×109/L 4.70 (0.54) 4.64 (1.59) -0.06 (1.69) 0.74
WBC diff manual-
Lymphocytes
78 0.9-3
×109/L 1.88 (0.54) 2.04 (0.58) 0.16 (0.48) 0.01
WBC diff manual-
Monocytes
78 0.20-0.95
×109/L 0.47 (0.18) 0.46 (0.18) -0.02 (0.16) 0.36
WBC diff manual-
Eosinophils
78 0-0.45
×109/L 0.19 (0.19) 0.18 (0.13) -0.01 (0.13) 0.67
WBC diff manual-
Basophils
78 0-0.15
×109/L 0.03 (0.04) 0.01 (0.04) -0.01 (0.05) 0.09

MANUSCRIP
T
ACCEPTED
ACCEPTED MANUSCRIPT
41
Parameters
Number
of
patients
Normal range
Unit
Mean (SD) Δ=Before-After
Before cannabis 1-year after cannabis Mean (SD)
P-value
ALP 78 30-118 U/L 66.52 (22.68) 66.31 (19.14) -0.22 (12.28) 0.88
ALT 34 7-54 (F) U/L 20.03 (9.53) 18.85 (8.02) -1.18 (5.71) 0.24
44 10-63 (M) U/L 29.88 (33.52) 28.11 (24.78) -1.78 (12.71) 0.36
AST, SGOT 34 13-32 (F) U/L 20.94 (5.90) 20.97 (5.59) 0.03 (3.90) 0.97
44 14-42 (M) U/L 25.82 (14.52) 24.55 (10.92) -1.27 (8.11) 0.30
Bilirubin direct serum 78 1.7-8.6 umol/l 1.51 (0.69) 1.69 (0.96) 0.18 (1.14) 0.17
Bilirubin total serum 78 5-30 umol/l 9.99 (3.89) 10.18 (4.01) 0.13 (3.60) 0.75
Chloride serum 78 98-110 mmol/l 104.65 (2.78) 104.82 (2.77) 0.17 (3.02) 0.63
Creatinine serum 34 55-103 umol/l 75.03 (14.96) 74.44 (15.32) -0.59 (4.92) 0.49
44 70-124 umol/l 86.07 (13.55) 85.55 (14.55) -0.52 (8.21) 0.67
GGT 34 7-45 (F) U/L 22.82 (17.56) 23.53 (21.35) 0.71 (13.13) 0.76
44 7-60 (M) U/L 36.68 (37.46) 34.64 (35.65) -2.05 (17.57) 0.44
Potassium 78 3.5-5.2 mmol/L 4.28 (0.35) 4.31 (0.38) 0.04 (0.40) 0.43
Sodium 78 135-144 mmol/L 139.03 (1.87) 138.90 (2.28) -0.13 (2.34) 0.63
UREA 34 2.9-8.1 (F) mmol/L 5.02 (1.61) 5.00 (1.51) -0.02 (1.23) 0.93
44 3.0-9.3 (M) mmol/L 5.59 (1.74) 5.63 (1.45) 0.04 (1.21) 0.83
Prolactin 34 1.39-24.2 (F) ug/L 12.10 (8.13) 13.69 (16.80) 2.10 (12.73) 0.35
44 1.61-18.77 (M) ug/L 9.30 (5.78) 8.12 (3.16) -1.18 (5.34) 0.15
Testosterone 34 0.20-2.67 (F) nmol/L 0.65 (0.36) 0.66 (0.34) 0.01 (0.24) 0.83
44 2.46-21.6 (M) nmol/L 11.45 (5.77) 11.27 (6.52) -0.17 (5.62) 0.84
TSH 78 0.49-4.67 mIU/L 1.53 (0.82) 1.58 (1.00) 0.05 (0.77) 0.59

MANUSCRIP
T
ACCEPTED
ACCEPTED MANUSCRIPT
Table S-16. Numbers of patients with abnormal blood tests, by time
Parameters N (%) of patients with ABOVE normal results N (%) of patients with BELOW normal results
Baseline: above
normal
12 month: above
normal Baseline: above normal
12 month: normal
Baseline: normal
12 month: above
normal
Baseline: below normal
12 month: below
normal Baseline: below normal
12 month: normal
Baseline: normal
12 month: below
normal
WBC 3 1 3 0 0 0
RBC 0 0 1 4 0 1
Hb 1 0 2 2 0 1
HCT 1 0 2 2 0 0
MCV 0 0 0 0 0 0
MCH 1 1 1 0 0 0
MCHC 0 0 0 0 1 0
RDW 1 1 0 0 0 0
PLT 0 3 0 0 0 1
MPV 0 1 0 0 0 2
Neutrophils 0 3 2 0 0 1
Lymphocytes 1 0 1 0 3 0
Monocytes 0 1 0 0 1 0
Eosinophils 2 1 1 0 0 0
Basophils 0 0 0 0 0 0
WBC diff manual-
Neutrophils 3 2 4 0 0 1
WBC diff manual-
Lymphocytes 1 1 2 1 1 1
WBC diff manual-
Monocytes 0 1 0 0 2 0
WBC diff manual-
Eosinophils 3 2 0 0 0 0
WBC diff manual-
Basophils 0 1 1 0 0 0

MANUSCRIP
T
ACCEPTED
ACCEPTED MANUSCRIPT
43
Parameters
N (%) of patients with ABOVE normal results N (%) of patients with BELOW normal results
Baseline: above
normal
12 month: above
normal Baseline: above normal
12 month: normal
Baseline: normal
12 month: above
normal
Baseline: below normal
12 month: below
normal Baseline: below normal
12 month: normal
Baseline: normal
12 month: below
normal
ALP 0 3 0 0 0 0
ALT 1 1 0 0 0 0
AST, SGOT 2 1 1 0 0 0
Bilirubin direct
serum 0 0 0 0 32 0
Bilirubin total
serum 0 0 0 0 0 1
Chloride serum 0 3 1 0 1 1
Creatinine serum 1 1 0 4 7 0
GGT 8 1 2 0 0 0
Potassium 0 1 2 0 0 0
Sodium 0 0 0 0 1 1
UREA 2 4 0 1 1 2
Prolactin 3 7 1 0 0 1
Testosterone 0 0 1 3 4 2
TSH 0 0 1 1 5 3
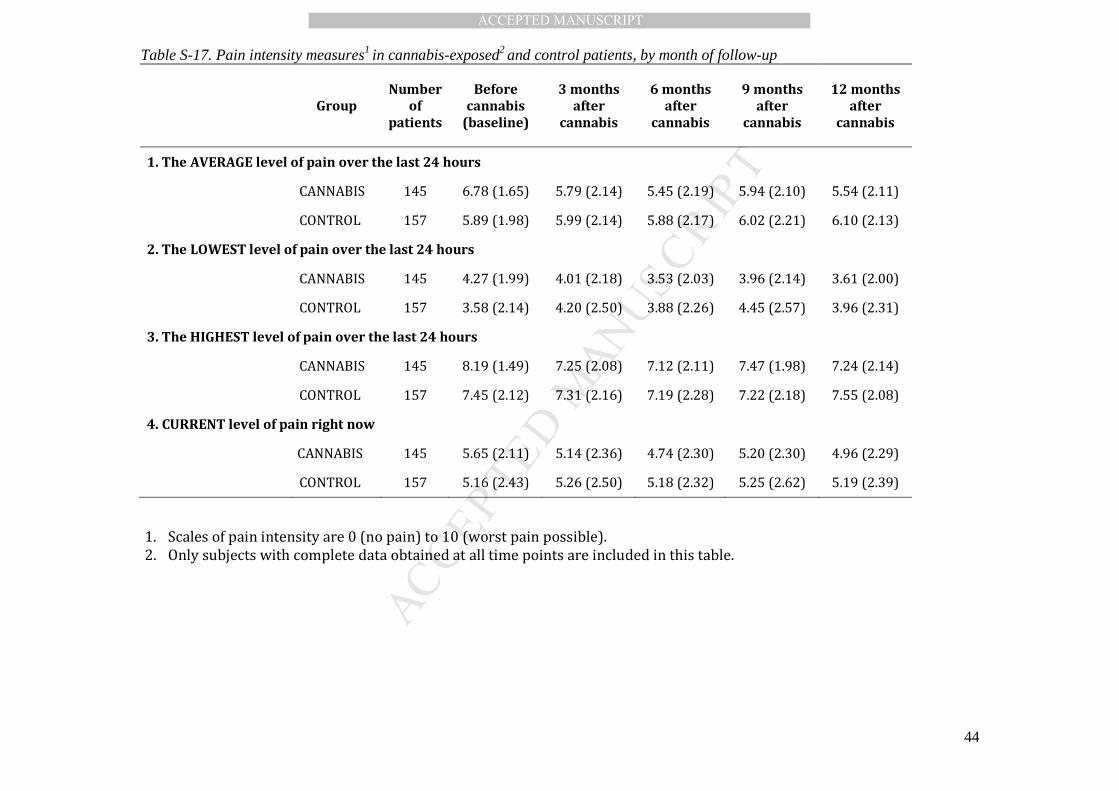
MANUSCRIP
T
ACCEPTED
ACCEPTED MANUSCRIPT
44
Table S-17. Pain intensity measures1 in cannabis-exposed2 and control patients, by month of follow-up
Group
Number
of
patients
Before
cannabis
(baseline)
3 months
after
cannabis
6 months
after
cannabis
9 months
after
cannabis
12 months
after
cannabis
1. The AVERAGE level of pain over the last 24 hours
CANNABIS 145 6.78 (1.65) 5.79 (2.14) 5.45 (2.19) 5.94 (2.10) 5.54 (2.11)
CONTROL 157 5.89 (1.98) 5.99 (2.14) 5.88 (2.17) 6.02 (2.21) 6.10 (2.13)
2. The LOWEST level of pain over the last 24 hours
CANNABIS 145 4.27 (1.99) 4.01 (2.18) 3.53 (2.03) 3.96 (2.14) 3.61 (2.00)
CONTROL 157 3.58 (2.14) 4.20 (2.50) 3.88 (2.26) 4.45 (2.57) 3.96 (2.31)
3. The HIGHEST level of pain over the last 24 hours
CANNABIS 145 8.19 (1.49) 7.25 (2.08) 7.12 (2.11) 7.47 (1.98) 7.24 (2.14)
CONTROL 157 7.45 (2.12) 7.31 (2.16) 7.19 (2.28) 7.22 (2.18) 7.55 (2.08)
4. CURRENT level of pain right now
CANNABIS 145 5.65 (2.11) 5.14 (2.36) 4.74 (2.30) 5.20 (2.30) 4.96 (2.29)
CONTROL 157 5.16 (2.43) 5.26 (2.50) 5.18 (2.32) 5.25 (2.62) 5.19 (2.39)
1. Scales of pain intensity are 0 (no pain) to 10 (worst pain possible).
2. Only subjects with complete data obtained at all time points are included in this table.
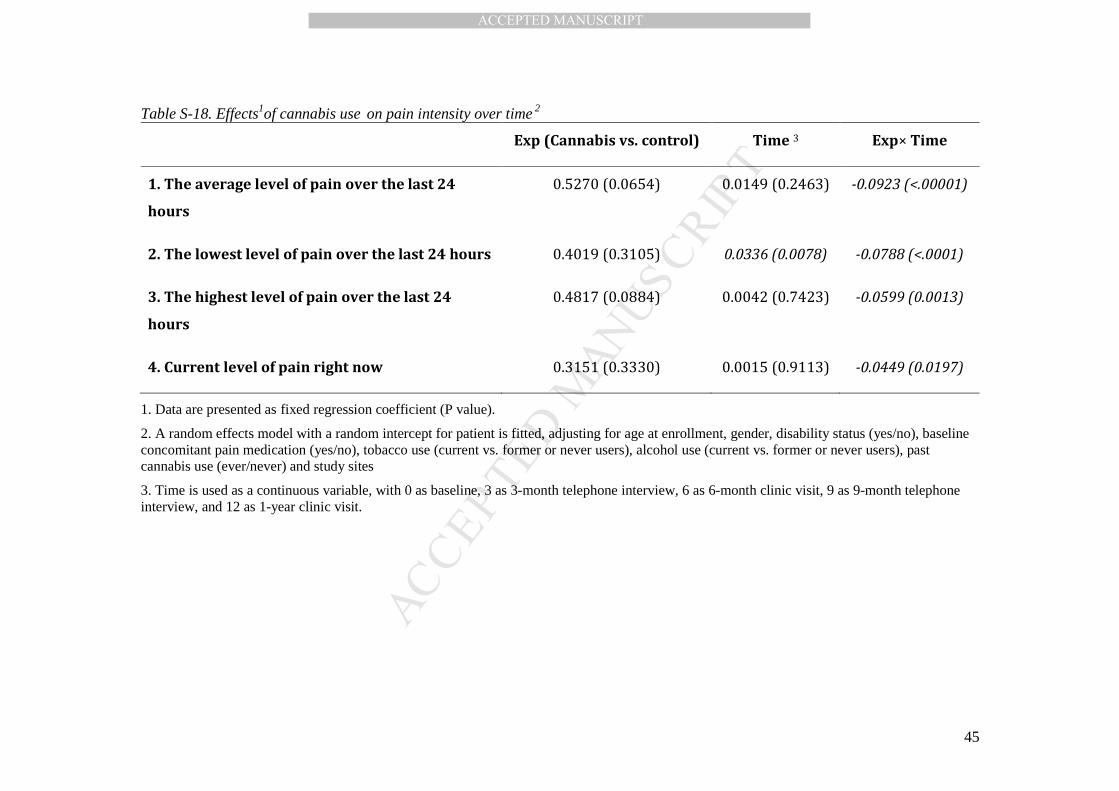
MANUSCRIP
T
ACCEPTED
ACCEPTED MANUSCRIPT
45
Table S-18. Effects1of cannabis use on pain intensity over time 2
Exp (Cannabis vs. control) Time 3 Exp× Time
1. The average level of pain over the last 24
hours
0.5270 (0.0654) 0.0149 (0.2463) -0.0923 (<.00001)
2. The lowest level of pain over the last 24 hours 0.4019 (0.3105) 0.0336 (0.0078) -0.0788 (<.0001)
3. The highest level of pain over the last 24
hours
0.4817 (0.0884) 0.0042 (0.7423) -0.0599 (0.0013)
4. Current level of pain right now 0.3151 (0.3330) 0.0015 (0.9113) -0.0449 (0.0197)
1. Data are presented as fixed regression coefficient (P value).
2. A random effects model with a random intercept for patient is fitted, adjusting for age at enrollment, gender, disability status (yes/no), baseline concomitant pain medication (yes/no), tobacco use (current vs. former or never users), alcohol use (current vs. former or never users), past cannabis use (ever/never) and study sites
3. Time is used as a continuous variable, with 0 as baseline, 3 as 3-month telephone interview, 6 as 6-month clinic visit, 9 as 9-month telephone interview, and 12 as 1-year clinic visit.

MANUSCRIP
T
ACCEPTED
ACCEPTED MANUSCRIPT
46
Table S-19. McGill Pain Questionnaire (MPQ) scores in cannabis-exposed and control patients, by month of follow-up 1
Group Number of
patients 2
Before
cannabis
(baseline)
6 months
after cannabis
12 months after
cannabis
1. Sensory CANNABIS 140 19.42 (7.60) 15.57 (8.11) 16.48 (8.60)
CONTROL 126 15.96 (7.96) 14.98 (7.47) 16.32 (8.47)
2. Affective CANNABIS 93 5.14 (3.37) 4.35 (3.05) 4.75 (3.40)
CONTROL 78 4.27 (3.24) 4.35 (3.09) 4.60 (3.21)
3. Evaluative CANNABIS 118 2.84 (1.23) 2.32 (1.22) 2.48 (1.31)
CONTROL 94 2.65 (1.28) 2.59 (1.16) 2.34 (1.27)
4. Miscellaneous CANNABIS 119 6.18 (3.47) 5.55 (3.42) 5.87 (3.70)
CONTROL 105 5.77 (3.43) 5.55 (3.54) 5.82 (3.63)
Total score CANNABIS 143 32.29 (13.66) 25.32 (14.34) 27.50 (15.75)
CONTROL 127 26.55 (14.15) 25.80 (13.16) 26.88 (14.73)
Present Pain Intensity (PPI) 3 CANNABIS 151 2.75 (0.99) 2.25 (1.00) 2.32 (1.07)
CONTROL 170 2.47 (1.09) 2.46 (1.09) 2.45 (1.09)
1. Data are presented as Mean (SD).
2. Only subjects with complete data obtained at all time points are included in this table.
3. Scales of PPI are 0 (no pain) to 5 (excruciating pain).

MANUSCRIP
T
ACCEPTED
ACCEPTED MANUSCRIPT
47
Table S-20. Effects1 of cannabis on pain quality measured by the McGill Pain Questionnaire (MPQ)2
Independent variables
Sensory Affective Evaluative Miscellaneous Total
score
Present
Pain
Intensity
Exp
(Cannabis vs. control)
2.7932
(0.0201)
1.1861
(0.0548)
0.2034
(0.33726)
0.5220
(0.3072)
4.8703
(0.0210)
0.2757
(0.0568)
T1 (6-month vs.
baseline)
-0.9762
(0.1678)
0.0769
(0.8385)
-0.0638
(0.6451)
-0.2190
(0.5463)
-0.7559
(0.5344)
-0.0059
(0.9490)
T2 (12-month vs.
baseline) 0.3571
(0.6136)
0.3333
(0.3774)
-0.3085
(0.0264)
0.0476
(0.8956)
0.3307
(0.7858)
-0.0177
(0.8479)
Exp×T1 -2.8738
(0.0033)
-0.8619
(0.0929)
-0.4531
(0.0150)
-0.4028
(0.4188)
-6.2091
(0.0002)
-0.4908
(0.0003)
Exp×T2 -3.2929
(0.0008)
-0.7204
(0.1599)
-0.0474
(0.7985)
-0.3501
(0.4821)
-5.1209
(0.0023)
-0.4062
(0.0026)
1. A random effects model with a random intercept for patient is fitted, adjusting for age at enrollment, gender, disability status
(yes/no), baseline concomitant pain medication (yes/no), tobacco use (current vs. former or never users), alcohol use (current vs.
former or never users), past cannabis use (ever/never) and study sites
2. Data are presented as fixed regression coefficient (P value).

MANUSCRIP
T
ACCEPTED
ACCEPTED MANUSCRIPT
48
Table S-21. Modified Edmonton Symptom Assessment Scale (ESAS) scores in cannabis-exposed and control patients, by month of follow-up 1
Group
Number
of
patients 2
Before
cannabis
(baseline)
6 months after
cannabis
12 months
after
cannabis
1. Sleep 3 CANNABIS 154 5.86 (2.88) 4.86 (3.08) 5.38 (2.95)
CONTROL 168 5.69 (2.82) 5.67 (2.79) 5.85 (2.69)
2. Wellbeing 3 CANNABIS 154 4.97 (2.49) 4.54 (2.16) 4.82 (2.33)
CONTROL 168 4.75 (2.53) 4.50 (2.52) 4.75 (2.40)
3. Pain 3 CANNABIS 154 7.07 (1.76) 5.96 (2.33) 5.99 (2.26)
CONTROL 168 6.25 (2.18) 6.36 (2.11) 6.32 (2.21)
4. Stength 3 CANNABIS 154 5.57 (2.52) 5.19 (2.46) 4.95 (2.64)
CONTROL 168 4.95 (2.52) 5.12 (2.52) 4.89 (2.53)
5. Appetite 3 CANNABIS 154 4.70 (2.99) 3.96 (2.98) 4.11 (2.87)
CONTROL 168 3.35 (2.82) 3.74 (2.76) 3.60 (3.05)
6. Nausea 3 CANNABIS 154 2.73 (2.92) 2.38 (2.75) 2.66 (2.90)
CONTROL 168 2.22 (2.80) 2.23 (2.65) 2.20 (2.64)
7. Vomiting 3 CANNABIS 154 1.04 (2.01) 1.00 (1.93) 1.11 (2.09)
CONTROL 168 0.78 (1.82) 0.66 (1.58) 0.61 (1.36)
8. Constipation 3 CANNABIS 154 3.17 (3.03) 2.74 (2.95) 2.97 (2.95)
CONTROL 168 3.19 (3.13) 3.35 (3.17) 3.27 (3.14)
9. Sleepiness 3 CANNABIS 154 5.24 (2.78) 4.97 (2.82) 5.18 (2.95)
CONTROL 168 4.92 (2.91) 5.32 (2.97) 5.11 (2.94)
10. Shortness of
breath 3 CANNABIS 154 1.70 (2.08)
2.34 (2.45) 2.39 (2.48)
CONTROL 168 2.18 (2.67) 2.45 (2.62) 2.81 (2.81)

MANUSCRIP
T
ACCEPTED
ACCEPTED MANUSCRIPT
49
Group
Number
of
patients
Before
cannabis
(baseline)
6 months after
cannabis
12 months
after
cannabis
11. Depression 3 CANNABIS 154 3.31 (2.82) 2.95 (2.66) 3.29 (2.79)
CONTROL 168 3.12 (2.78) 3.46 (2.98) 3.54 (2.94)
12. Nervouness 3 CANNABIS 154 2.51 (2.52) 2.64 (2.59) 2.72 (2.61)
CONTROL 168 2.78 (2.74) 3.21 (2.93) 3.17 (2.74)
Total symptom distress score 4
CANNABIS 154 47.87 (15.68) 43.54 (17.54) 45.59 (17.97)
CONTROL 168 44.20 (17.20) 46.06 (17.14) 46.11 (17.07)
Total number of symptoms 5
CANNABIS 154 10.47 (1.77) 10.54 (1.83) 10.56 (1.79)
CONTROL 168 10.40 (1.95) 10.63 (1.58) 10.51 (1.87)
Total number of moderate/severe symptoms 6
CANNABIS 154 6.00 (2.41) 5.47 (2.73) 5.74 (2.79)
CONTROL 168 5.46 (2.62) 5.83 (2.68) 5.77 (2.58)
1. Data are presented as Mean (SD).
2. Only subjects with complete data obtained at all time points are included in this table.
3. The scale for each symptom is 0 (no) to 10 (worst possible).
4. A total symptom distress score is calculated by summing of the scores of all 12 symptoms on
the ESAS (ranges from 0 to 120).
5. A total number of symptoms is calculated by summing of the number of symptoms whose scale
is not 0.
6. Moderate intensity of any symptom is defined as 4-6 and severe as 7-10 on the scale. A total
number of moderate/severe symptoms is summing all the moderate and severe symptoms for
each patient.

MANUSCRIP
T
ACCEPTED
ACCEPTED MANUSCRIPT
50
Table S-22. The effect1 of cannabis on symptom distress, measured by modified Edmonton
Symptom Assessment Scale2
Independent variables
Total symptom
distress score
Total number of
symptoms
Total number
of
moderate/seve
re symptoms
Exp (Cannabis vs.
control)
1.5575 (0.5116) 0.2530 (0.3164) 0.2632 (0.4708)
T1 (6-month vs. baseline) 1.8565 (0.1286) 0.2262 (0.1296) 0.3690 (0.0632)
T2 (12-month vs.
baseline)
1.9143 (0.1171) 0.1012 (0.4974) 0.3095 (0.1191)
Exp×T1 -6.1851 (0.0005) -0.1613 (0.4546) -0.8950 (0.0019)
Exp×T2 -4.1916 (0.0178) -0.0103 (0.9620) -0.5693 (0.0475)
1. Data are presented as fixed regression coefficient (P-value).
2. A random effects model with a random intercept for patient is fitted, adjusting for age at enrollment, gender, disability status (yes/no), baseline concomitant pain medication (yes/no), tobacco use (current vs. former or never users), alcohol use (current vs. former or never users), past cannabis use (ever/never), baseline pain intensity and study sites

MANUSCRIP
T
ACCEPTED
ACCEPTED MANUSCRIPT
51
Table S-23. Profile of Mood States (POMS) in cannabis-exposed and control patients, by month of follow-up 1
Group Number of
patients 2
Before
cannabis
(baseline)
6 months
after cannabis
12 months after
cannabis
1. Tension-Anxiety CANNABIS 152 6.43 (3.94) 5.81 (4.16) 5.65 (4.14)
CONTROL 167 6.04 (4.32) 6.04 (4.33) 6.27 (4.51)
2. Depression-Dejection CANNABIS 153 5.43 (4.20) 4.60 (4.22) 4.49 (4.25)
CONTROL 167 5.27 (4.61) 5.34 (5.04) 5.45 (4.76)
3. Anger-Hostility CANNABIS 154 5.61 (4.55) 5.19 (4.20) 4.54 (3.88)
CONTROL 167 5.22 (4.40) 5.50 (5.06) 5.27 (4.81)
4. Vigor-Activity CANNABIS 153 4.60 (3.72) 5.02 (3.95) 4.98 (4.17)
CONTROL 168 5.36 (4.23) 4.84 (3.54) 5.46 (4.25)
5. Fatigue-Inertia CANNABIS 153 11.33 (5.01) 9.45 (5.17) 9.58 (5.17)
CONTROL 167 10.31 (5.05) 10.18 (5.13) 10.35 (5.25)
6. Confusion-Bewilderment CANNABIS 152 4.94 (3.09) 4.66 (3.14) 4.44 (3.03)
CONTROL 168 5.36 (3.39) 5.20 (3.34) 5.35 (3.47)
Total Mood Disturbance Score CANNABIS 149 29.37 (18.28) 24.75 (19.04) 23.92 (19.04)
CONTROL 164 27.01 (19.18) 27.30 (20.52) 27.09 (21.29)
1. Data are presented as Mean (SD).
2. Only subjects with complete data obtained at all time points are included in this table.

MANUSCRIP
T
ACCEPTED
ACCEPTED MANUSCRIPT
52
Table S-24. The effects1 of cannabis on Profile of Mood Scale measures 2
Independent
variables
Tension-
Anxiety
Depression-
Dejection
Anger-
Hostility
Vigor-
Activity
Fatigue-
Inertia
Confusion-Bewilderme
nt
Total Mood
Disturbance
Score
Exposure status
(Cannabis vs. control)
-0.3027
(0.6277)
-0.1982
(0.7629)
-0.4098
(0.5254)
-0.4881
(0.3733)
0.1950
(0.7858)
-1.0375
(0.0325)
-1.4006
(0.6255)
T1
(6-month vs.
baseline)
-0.0060
(0.9839)
0.0629
(0.8465)
0.2829
(0.3962)
-0.5238
(0.0862)
-0.1272
(0.7478)
-0.1622
(0.4670)
0.2957
(0.8308)
T2
(12-month vs.
baseline)
0.2231
(0.4519)
0.1751
(0.5896)
0.0494
(0.8822)
0.0997
(0.7437)
0.0449
(0.9096)
-0.0164
(0.9415)
0.0793
(0.9543)
Exp×T1 -0.6108
(0.1553)
-0.8946
(0.0571)
-0.6936
(0.1499)
0.9437
(0.0330)
-1.7551
(0.0022)
-0.1190
(0.7129)
-4.9132
(0.0145)
Exp×T2 -0.9994
(0.0202)
-1.1131
(0.0180)
-1.1111
(0.0212)
0.2843
(0.5199)
-1.7916
(0.0018)
-0.4820
(0.1366)
-5.5239
(0.0060)
1. Data are presented as fixed regression coefficient (P-value).
2. A random effects model with a random intercept for patient is fitted, adjusting for age at enrollment, gender, disability status (yes/no), baseline concomitant pain medication (yes/no), tobacco use (current vs. former or never users), alcohol use (current vs. former or never users), past cannabis use (ever/never), baseline pain intensity and study sites

MANUSCRIP
T
ACCEPTED
ACCEPTED MANUSCRIPT
53
Table S-25. Change in quality of life (SF-36v2®) summary scores over one year
Physical Component Summary Mental Component Summary
Cannabis
(N=142)
Control
(N=146)
Cannabis
(N=142)
Control
(N=146)
Clinic visits Mean (SD) Mean (SD) Mean (SD) Mean (SD)
Baseline 27.15 (7.00) 30.89 (8.50) 41.94 (11.72) 42.34 (13.30)
6 months 30.05 (8.03) 31.43 (8.70) 42.55 (11.77) 43.16 (13.60)
12 months 30.25 (8.96) 32.38 (8.76) 42.88 (12.14) 41.70 (13.32)
Comparisons 1 ß (SE)2 P ß (SE) 2 P
Cannabis vs. control
-3.937 (1.187) 0.001 0.441 (1.853) 0.812
Time difference
6 months vs. baseline
0.536 (0.546) 0.326 0.821 (0.916) 0.370
12 months vs. baseline
1.484 (0.546) 0.007 -0.640 (0.916) 0.485
Group by time interaction
Group× (6 months)
2.360 (0.777) 0.003 -0.206 (1.304) 0.875
Group× (12 months)
1.619 (0.777) 0.038 1.584 (1.304) 0.225
1. A random effects model with a random intercept for patient is fitted, adjusting for age at
enrollment, gender, disability status (yes/no), baseline concomitant pain medication
(yes/no), tobacco use (current vs. former or never users), alcohol use (current vs. former
or never users), past cannabis use (ever/never) and study sites
2. ß=fixed regression coefficient for cannabis use; SE=standard error


![WELCOME! [plantacea.org] · Pain, Pain, Go Away…Could Cannabis Keep Pain at Bay? Falling somewhere between death and taxes, pain is one of the most inevitable states of being a](https://img.pdfslide.net/doc/110x75/5f39ee3bf7c169469a7361d4/welcome-pain-pain-go-awaycould-cannabis-keep-pain-at-bay-falling-somewhere.jpg)