Embed Size (px)
Citation preview
Abstract:
An issue involved in the incorporation of Canola into a wheat rotation is the fertilizer placement. Fertilizer banded below the seed has potential to hydrolyze ammonia inhibiting germination or damaging young plants. An exploratory series of high temporal and spatial resolution images of canola roots demonstrate the effects of below seed banded urea on canola root lateral development, root hair thinning, root girth shrinking, and root discoloration. A similar series of images taken of a wheat plant, but with a lower temporal resolution show stunting on one seminal axis while two other seminal roots continue growing past the urea band. The high temporal and spatial resolution of the canola images allows for the examination of root and root hair behavior in the presence of urea fertilizer.
Methods:
Canola and Wheat seeds were planted directly against the glass face of a Lide 700F Canon scanner in a Chard Silt Loam collected at the USDA-ARS farm at Central Ferry, WA. The soil was passed through a 2mm sieve and wetted up prior to planting. Nitrogen fertilizer in the form of Urea was banded 2 inches directly below the seed at a rate of 100 lb N/A. The urea was placed perpendicular to the scanner face as if the scanner face were cutting across a planter row. A canola seed was planted 6 cm above the fertilizer band. Wheat treatments were scanned daily at 2400 dpi. The Canola images were collected at 2400 dpi resolution and time intervals ranging from 2.25-6.25 hour intervals and averaging 4.31 hours. The variation in time sequence is due to software glitches and mechanical failures. A total of 50 images was captured before the experiment was terminated due a spatial shift in the soil. Measurements were made in Adobe Photoshop.
Results:
Canola: The root intercepted the scanner face at 63 hours into the experiment and 2.27 cm from the seed at 80.25 hours and 4.99 cm below the seed the root tip left the scanner face. Five time points from 60-80.25hrs were used to plot an estimated growth rate (Observed root distance and liner (observed + root distance))(Figure 1). Based on this linear regression R^2 0.99 the root would have intercepted the fertilizer band at T=89 hours.
Various symptoms exhibited on the visible root were lateral branching, root hair thinning, root discoloration, and root width shrinking. Lateral ranching is marked as horizontal lines (steady depth) starting at time points 106.00 hrs (lateral 1) and 114.75 hrs (lateral 2). At T=144.75 hrs root hair thinning began on the portion of the root exposed to the scanner. The root hair thinning progressed until hitting the lateral root at 157.50 hrs at which point it did not continue up the root until 196.00 hrs. Similarly root discoloration and shrinking of girth at 164.00 and 170.50 hours respectively temporarily halted when reaching the lateral branching at 170.50 and 187.50 hours respectively (Figure 2). The halting of symptoms at the point of lateral branching suggests that the lateral roots are absorbing some of the negative effects caused by the root intercepting the fertilizer band.
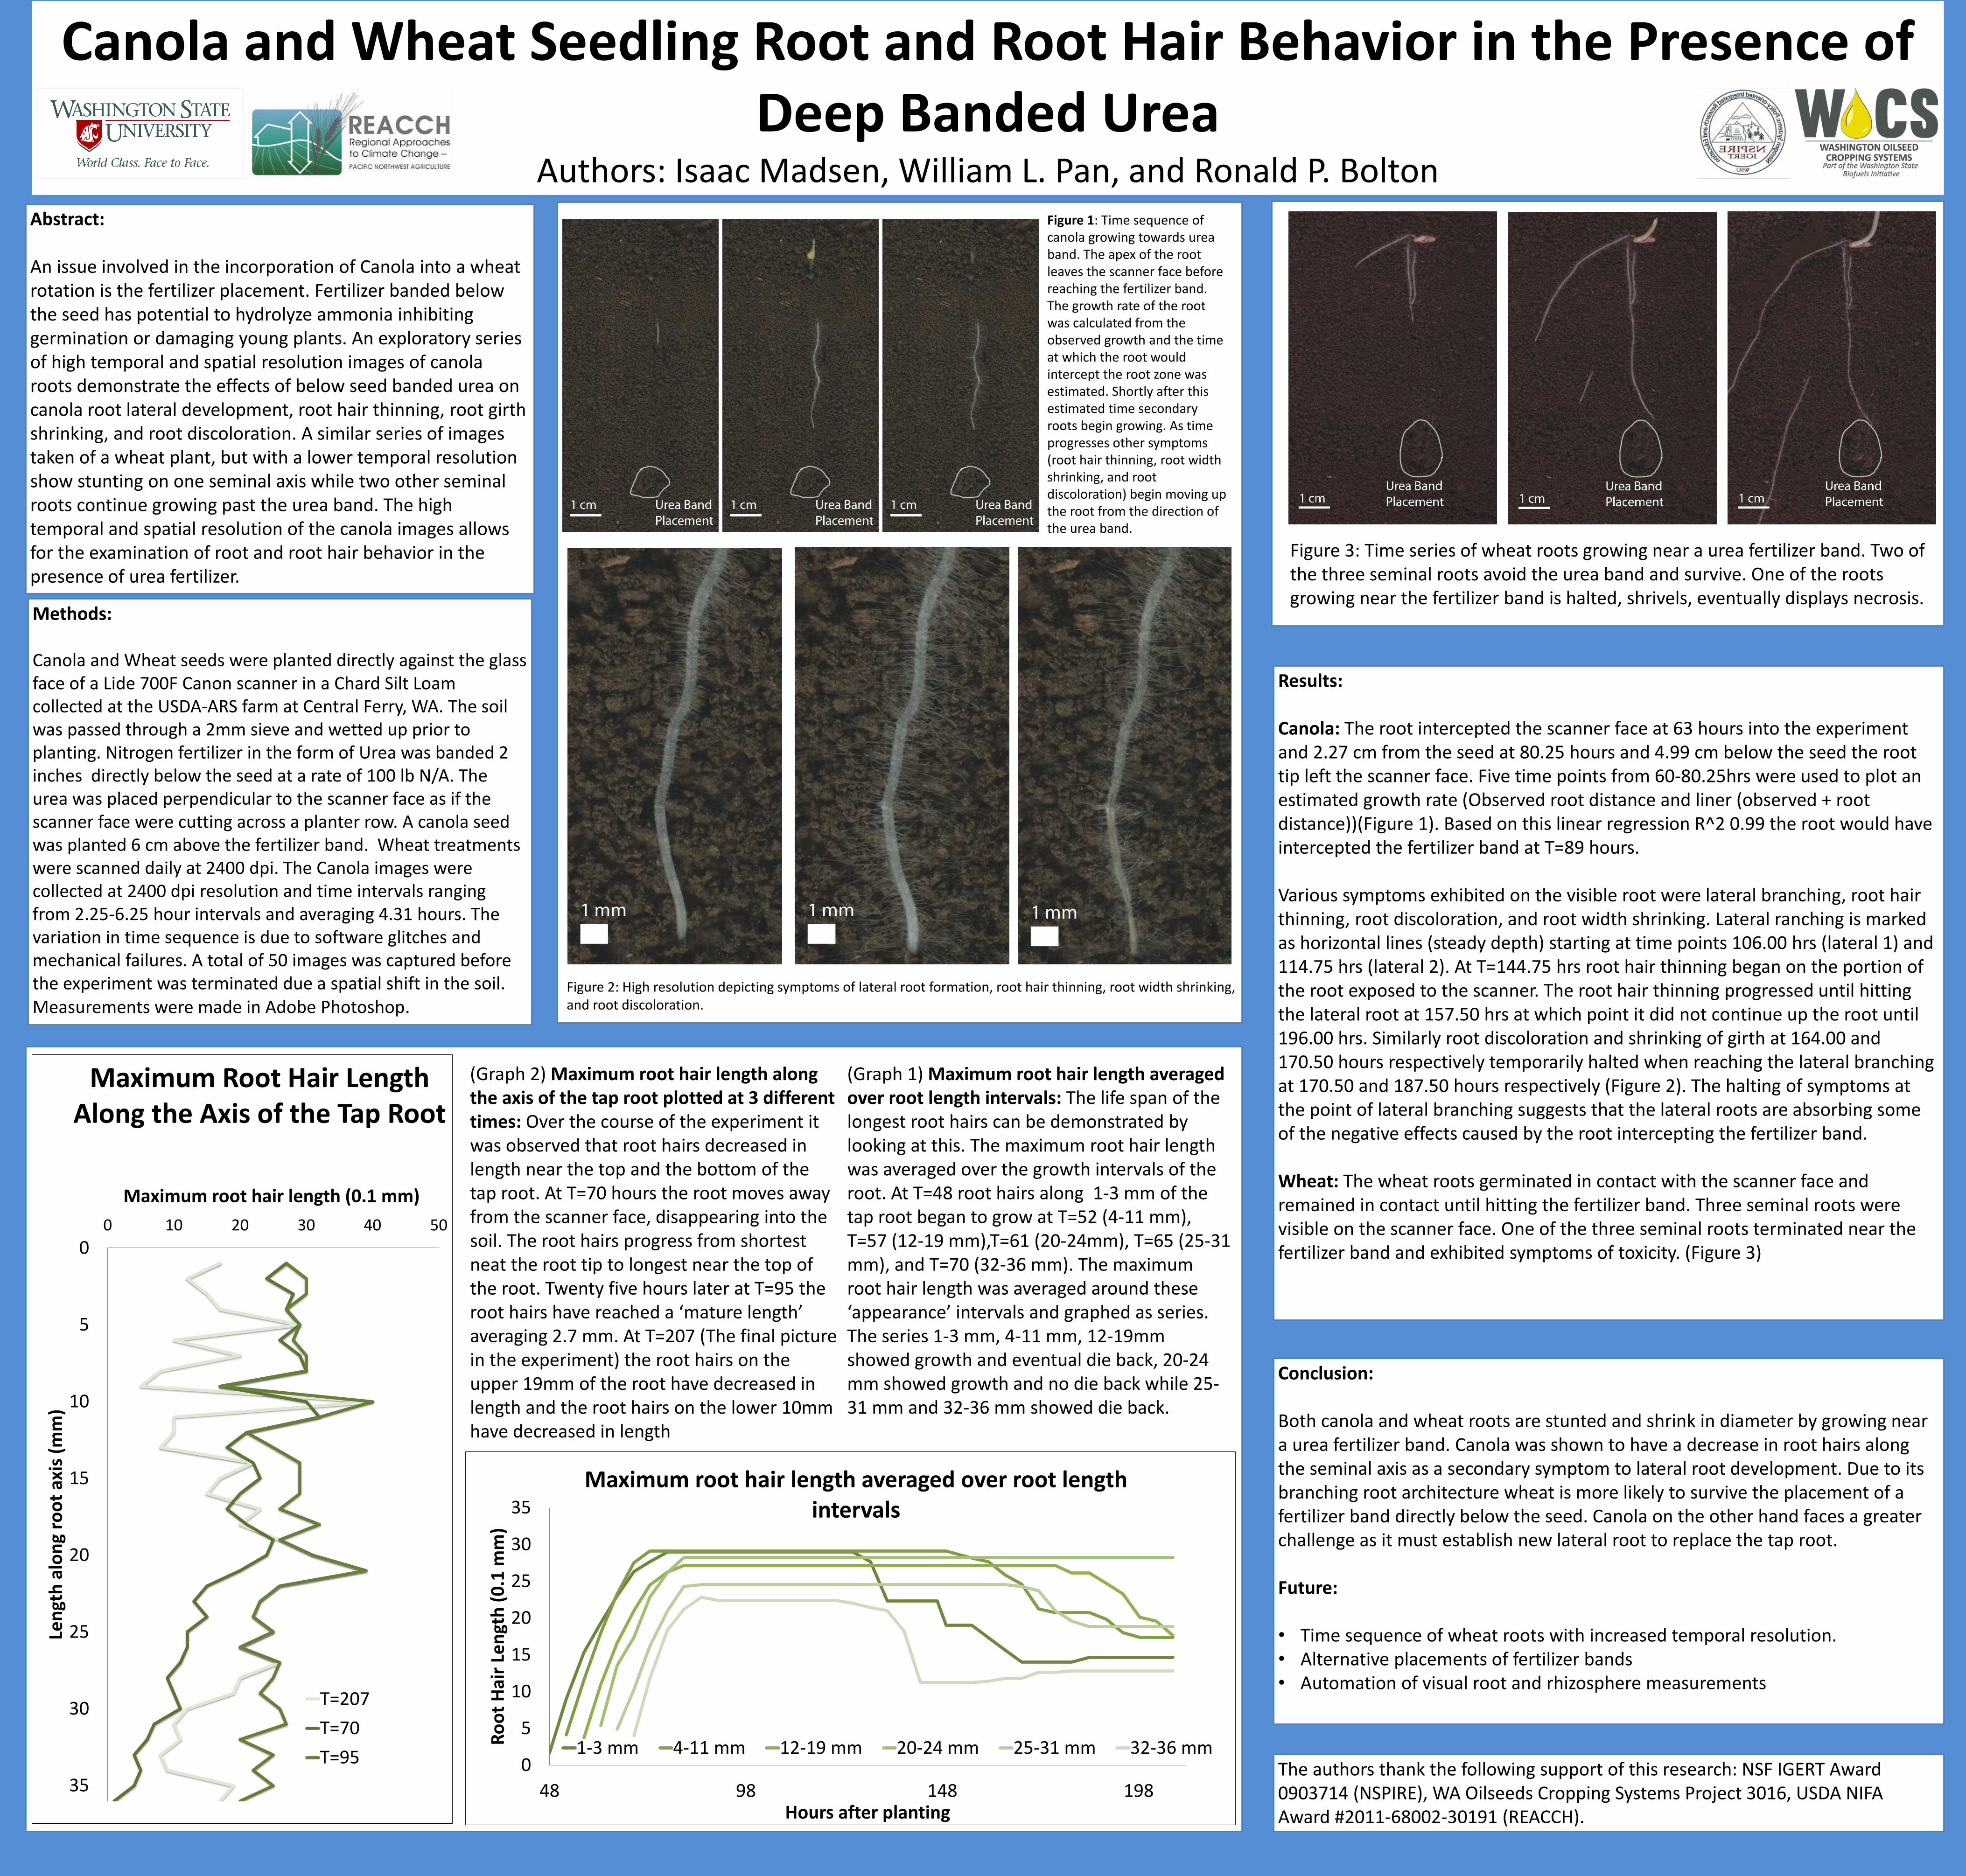
Wheat: The wheat roots germinated in contact with the scanner face and remained in contact until hitting the fertilizer band. Three seminal roots were visible on the scanner face. One of the three seminal roots terminated near the fertilizer band and exhibited symptoms of toxicity. (Figure 3)
Conclusion:
Both canola and wheat roots are stunted and shrink in diameter by growing near a urea fertilizer band. Canola was shown to have a decrease in root hairs along the seminal axis as a secondary symptom to lateral root development. Due to its branching root architecture wheat is more likely to survive the placement of a fertilizer band directly below the seed. Canola on the other hand faces a greater challenge as it must establish new lateral root to replace the tap root.
Future:
• Time sequence of wheat roots with increased temporal resolution. • Alternative placements of fertilizer bands • Automation of visual root and rhizosphere measurements
The authors thank the following support of this research: NSF IGERT Award 0903714 (NSPIRE), WA Oilseeds Cropping Systems Project 3016, USDA NIFA Award #2011-68002-30191 (REACCH).
Canola and Wheat Seedling Root and Root Hair Behavior in the Presence of Deep Banded Urea
Authors: Isaac Madsen, William L. Pan, and Ronald P. Bolton
Figure 3: Time series of wheat roots growing near a urea fertilizer band. Two of the three seminal roots avoid the urea band and survive. One of the roots growing near the fertilizer band is halted, shrivels, eventually displays necrosis.
Figure 1: Time sequence of canola growing towards urea band. The apex of the root leaves the scanner face before reaching the fertilizer band. The growth rate of the root was calculated from the observed growth and the time at which the root would intercept the root zone was estimated. Shortly after this estimated time secondary roots begin growing. As time progresses other symptoms (root hair thinning, root width shrinking, and root discoloration) begin moving up the root from the direction of the urea band.
Figure 2: High resolution depicting symptoms of lateral root formation, root hair thinning, root width shrinking, and root discoloration.
0
5
10
15
20
25
30
35
48 98 148 198
Ro
ot
Hai
r Le
ngt
h (
0.1
mm
)
Hours after planting
Maximum root hair length averaged over root length intervals
1-3 mm 4-11 mm 12-19 mm 20-24 mm 25-31 mm 32-36 mm
0
5
10
15
20
25
30
35
0 10 20 30 40 50
Len
gth
alo
ng
roo
t ax
is (
mm
)
Maximum root hair length (0.1 mm)
T=207
T=70
T=95
(Graph 1) Maximum root hair length averaged over root length intervals: The life span of the longest root hairs can be demonstrated by looking at this. The maximum root hair length was averaged over the growth intervals of the root. At T=48 root hairs along 1-3 mm of the tap root began to grow at T=52 (4-11 mm), T=57 (12-19 mm),T=61 (20-24mm), T=65 (25-31 mm), and T=70 (32-36 mm). The maximum root hair length was averaged around these ‘appearance’ intervals and graphed as series. The series 1-3 mm, 4-11 mm, 12-19mm showed growth and eventual die back, 20-24 mm showed growth and no die back while 25-31 mm and 32-36 mm showed die back.
(Graph 2) Maximum root hair length along the axis of the tap root plotted at 3 different times: Over the course of the experiment it was observed that root hairs decreased in length near the top and the bottom of the tap root. At T=70 hours the root moves away from the scanner face, disappearing into the soil. The root hairs progress from shortest neat the root tip to longest near the top of the root. Twenty five hours later at T=95 the root hairs have reached a ‘mature length’ averaging 2.7 mm. At T=207 (The final picture in the experiment) the root hairs on the upper 19mm of the root have decreased in length and the root hairs on the lower 10mm have decreased in length
Maximum Root Hair Length Along the Axis of the Tap Root