Embed Size (px)
Citation preview
2015-16 School Accountability Report Card for Canyon High School Page 1 of 12
Canyon High School
19300 West Nadal Street • Canyon Country, CA 91351 • (661) 252-6110 • Grades 9-12 Jason d'Autremont, Principal
[email protected] www.canyonhighcowboys.org
2015-16 School Accountability Report Card
Published During the 2016-17 School Year ---- --
--
William S. Hart Union High School District
21380 Centre Pointe Parkway Santa Clarita, CA 91350
(661) 259-0033 www.hartdistrict.org
District Governing Board
Robert P. Hall
Robert Jensen, Jr.
Linda Storli
Joseph Messina
Steven M. Sturgeon
Carson Bartholomew, Student Board member
District Administration
Vicki Engbrecht Superintendent
Michael Vierra Assistant Superintendent, Human
Resources
Mike Kuhlman Assistant Superintendent,
Educational Services
----
----
Principal's Message Welcome Canyon Families! As we begin a new year together, for some this will be the final year of a long journey that has brought challenges and fun times. For others, this is the start to something new and hopefully you can welcome it with open arms. We truly are a family here at Canyon High School and we want the four years we have together to be memorable and educational. I am proud to be your principal and will ensure your safety and a consistent learning environment during the time we spend together. Canyon High School continues in the right direction when it comes to academics, athletics, and performing arts. Academically, we had a 97.2% graduation rate for the class of 2015 and welcome our class of 2016 to top that. In our Advanced Placement tests from 2015, we boasted an average score of over 3 for all students who took tests. Furthermore, we have established the beginnings of an excellent career pathway in computer science when in just its second year here at Canyon High School, we have two Advanced Placement sections of the course. In athletics, our boys’ track and field team completed their sixth straight Foothill League championship last year and hopes to add another one this year. If you haven’t had the experience of making it out to an athletic event, be sure to bring your entire family and cheer on your students’ peers on the court or field of play. And if you have to wait to make it out to an event, please do not wait upon completion of our new Performing Arts Center, which we plan to have ready this year with the anticipated substantial completion date set for January 2016. In this state of the art venue, we will have theatre performances, choir productions, and band concerts to name a few. I don’t know about you, but I am excited! Canyon High School will continue to see changes in facilities and improve our instruction, but what we plan to stay committed to is a consistent learning environment for our students. We strive on our communication with our families and we want to know areas in which we can improve. One way to increase communication would be for voices to be heard at our Parent Advisory Committee meetings. We would like to allow families to understand how our staff is working on the professional development focus for the year and something we already began doing last year in lesson study. Further, getting more students involved in our Career Pathways will be paramount as we continue to strive to prepare them for life beyond high school. To conclude, Canyon High School is a great place to be. As your principal, I will commit to our students, staff and community to continue the great things we are doing here. If you have the opportunity to greet me while out on campus before or after school, or at a school event, I would encourage you to do so. I look forward to building even more relationships with the Canyon family and would not be where I was today if it wasn’t for my start at this great school. Go Cowboys! Jason d'Autremont Principal Canyon High School

2016-17 School Accountability Report Card for Canyon High School Page 2 of 12
– MISSION STATEMENT – Canyon High School “The Future Begins Here” Our mission is to develop responsible citizens who have the knowledge, skills, and experience necessary for either beginning post-secondary education or entering the workforce. – LEARNING OUTCOMES – CANYON GRADUATES WILL BE . . . I. Critical thinkers who ask essential questions, analyze multiple sources, and weigh critical evidence. II. Effective communicators who write using precise claims, cohesive structure, and clear points of view. III. Creative problem solvers who approach challenges with perseverance and collaborative mindsets. IV. Diligent workers who strategically plan and research in order to solve problems conceptually by using models, constructing explanations, and designing solutions. V. Academically competent individuals who—whether arguing claims from evidence or constructing solutions to problems—obtain, evaluate, and communicate information efficiently and effectively. VI. Technologically proficient students who ethically use resources to organize, analyze, and present data. VII. Life-long learners prepared for a variety of post-secondary learning and working environments.
About the SARC By February 1 of each year, every school in California is required by state law to publish a School Accountability Report Card (SARC). The SARC contains information about the condition and performance of each California public school. Under the Local Control Funding Formula (LCFF) all local educational agencies (LEAs) are required to prepare a Local Control and Accountability Plan (LCAP), which describes how they intend to meet annual school-specific goals for all pupils, with specific activities to address state and local priorities. Additionally, data reported in an LCAP is to be consistent with data reported in the SARC. • For more information about SARC requirements, see the California Department of Education (CDE) SARC Web page at
http://www.cde.ca.gov/ta/ac/sa/. • For more information about the LCFF or LCAP, see the CDE LCFF Web page at http://www.cde.ca.gov/fg/aa/lc/. • For additional information about the school, parents/guardians and community members should contact the school principal or the district office.
2015-16 Student Enrollment by Grade Level
Grade Level Number of Students
Grade 9 626
Grade 10 598
Grade 11 549
Grade 12 554
Total Enrollment 2,327

2015-16 School Accountability Report Card for Canyon High School Page 3 of 12
2015-16 Student Enrollment by Group
Group Percent of Total Enrollment
Black or African American 4.1
American Indian or Alaska Native 0.1
Asian 2.4
Filipino 3.7
Hispanic or Latino 48.6
Native Hawaiian or Pacific Islander 0.2
White 37.4
Two or More Races 3.4
Socioeconomically Disadvantaged 27.7
English Learners 13.1
Students with Disabilities 8
Foster Youth 0.4
A. Conditions of Learning State Priority: Basic The SARC provides the following information relevant to the Basic State Priority (Priority 1): • Degree to which teachers are appropriately assigned and fully credentialed in the subject area and for the pupils they are teaching; • Pupils have access to standards-aligned instructional materials; and • School facilities are maintained in good repair.
Teacher Credentials
Canyon High School 14-15 15-16 16-17
With Full Credential 90 91 89
Without Full Credential 0 1 3
Teaching Outside Subject Area of Competence 0 0 0
William S. Hart Union High School District 14-15 15-16 16-17
With Full Credential ♦ ♦
Without Full Credential ♦ ♦
Teaching Outside Subject Area of Competence ♦ ♦
Teacher Misassignments and Vacant Teacher Positions at this School
Canyon High School 14-15 15-16 16-17
Teachers of English Learners 3 2 0
Total Teacher Misassignments 0 0 0
Vacant Teacher Positions 0 0 0
* “Misassignments” refers to the number of positions filled by teachers who lack legal authorization to teach that grade level, subject area, student group, etc. Total Teacher Misassignments includes the number of Misassignments of Teachers of English Learners.
Core Academic Classes Taught by Highly Qualified Teachers
2015-16 Percent of Classes In Core Academic Subjects Core Academic Classes Taught by Highly Qualified Teachers
Location of Classes Taught by Highly Qualified Teachers Not Taught by Highly Qualified Teachers
This School 86.8 13.2
Districtwide
All Schools 68.2 31.9
High-Poverty Schools 50.2 49.8
Low-Poverty Schools 85.9 14.1
* High-poverty schools are defined as those schools with student eligibility of approximately 40 percent or more in the free and reduced price meals program. Low-poverty schools are those with student eligibility of approximately 39 percent or less in the free and reduced price meals program.
2015-16 School Accountability Report Card for Canyon High School Page 4 of 12
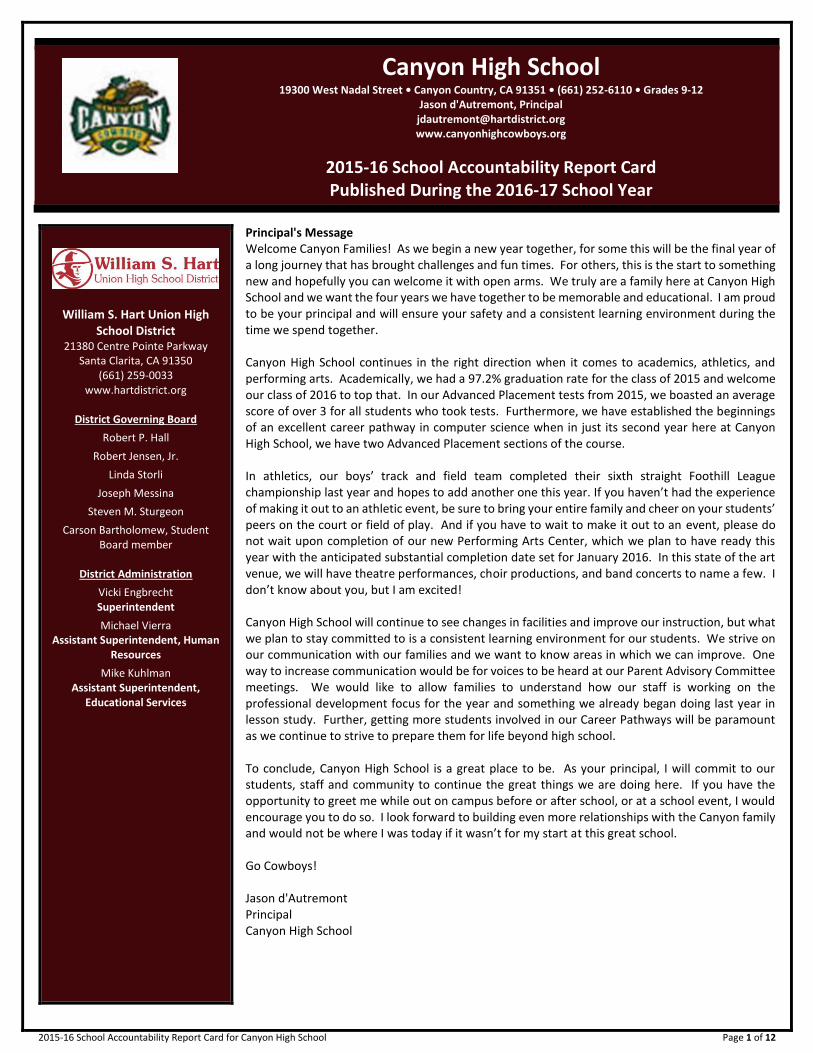
Quality, Currency, Availability of Textbooks and Instructional Materials (School Year 2016-17)
Textbooks and Instructional Materials
Year and month in which data were collected: December 2016
Core Curriculum Area Textbooks and Instructional Materials/Year of Adoption
Reading/Language Arts Grade 9 - Timeless Voices, Timeless Themes (Gold) – Prentice Hall Adopted 2002 Grade 10 - Timeless Voices, Timeless Themes (Platinum) – Prentice Hall Adopted 2002 Grade 11 - Timeless Voices, Timeless Themes (The American Experience) – Prentice Hall Adopted 2002
The textbooks listed are from most recent adoption: Yes
Percent of students lacking their own assigned textbook: 0%
Mathematics Algebra - Hart Interactive Adopted 2016 Geometry - Hart Interactive Adopted 2016 Algebra 2 - Hart Interactive Adopted 2016 Algebra 2/Trig - Hart Interactive Adopted 2016 Trigonometry - Houghton Mifflin Adopted 2004 Precalculus - Blitzer Precalculus - Prentice Hall Adopted 2006 AP Calculus – Rogawski’s Calculus for AP: Early Transcendentals, 2nd Edition - W.H. Freeman Adopted 2014 AP Statistics – The Practice of Statistics, 5th Edition – W.H. Freeman Adopted 2015 Foundations in Personal Finance - Mathematics for Personal Financial Literacy and Foundations in Person Finance – Ramsey Education Solutions Adopted 2016
The textbooks listed are from most recent adoption: Yes
Percent of students lacking their own assigned textbook: 0%
2015-16 School Accountability Report Card for Canyon High School Page 5 of 12
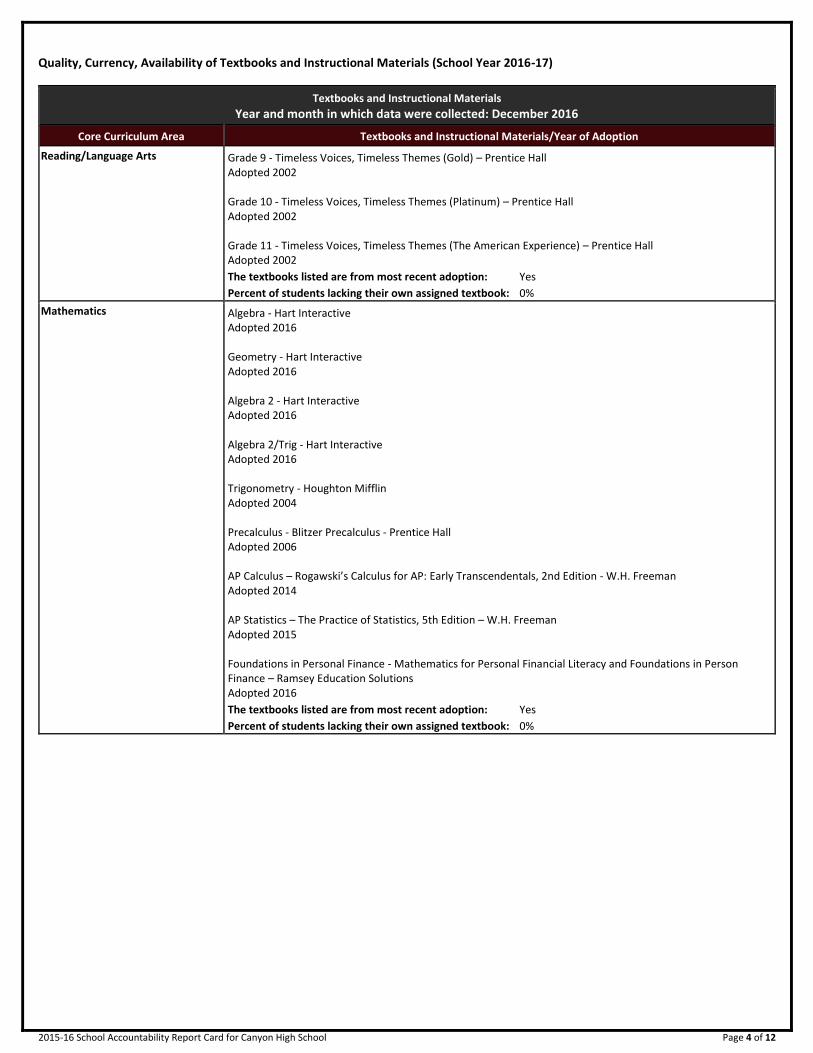
Textbooks and Instructional Materials
Year and month in which data were collected: December 2016
Core Curriculum Area Textbooks and Instructional Materials/Year of Adoption
Science Biology - Prentice Hall Adopted 2007 Chemistry - Prentice Hall Adopted 2008 AP Biology – Campbell Biology in Focus, 9th Edition – Pearson Adopted 2014 AP Chemistry – Chemistry, AP Edition, 11th Edition Update – McGraw-Hill Adopted 2014 Physics - Holt Adopted 2002 AP Environmental Science – Environment: The Science Behind the Stories, 5th Edition – Pearson Adopted 2015
The textbooks listed are from most recent adoption: Yes
Percent of students lacking their own assigned textbook: 0%
History-Social Science Grade 10 - World History: The Modern World - Prentice Hall Adopted 2006 Grade 11 - America: Pathways to the Present - Prentice Hall Adopted 2006 Grade 12 - Economics: New Ways of Thinking - EMC Paradigm Adopted 2007 AP Economics – Economics: Principles, Problems, and Policies – McGraw-Hill Adopted – 2008 Grade 12 - Magruder’s American Government - Prentice Hall Adopted 2006 AP U.S. History – Out of Many: A History of the American People, 6th Edition – Pearson Adopted 2014 AP Psychology – Myers’ Psychology, Second Edition for AP – Worth Adopted 2016 AP American Government – American Government: Continuity and Change – Pearson (CA) Adopted 2006 The textbooks listed are from most recent adoption: Yes
Percent of students lacking their own assigned textbook: 0%

2015-16 School Accountability Report Card for Canyon High School Page 6 of 12
Textbooks and Instructional Materials
Year and month in which data were collected: December 2016
Core Curriculum Area Textbooks and Instructional Materials/Year of Adoption
Foreign Language Spanish 1 – Descubre’ 1 – Vista Higher Learning Adopted 2015 Spanish 2 - Descubre’ 2 – Vista Higher Learning Adopted 2015 Spanish 3 - Descubre’ 3 – Vista Higher Learning Adopted 2015 French 1 – Te’s Branche’ 1 – EMC Publishing Adopted 2015 French 2 - Te’s Branche’ 2 – EMC Publishing Adopted 2015 French 3 - Te’s Branche’ 3 – EMC Publishing Adopted 2015
The textbooks listed are from most recent adoption: Yes
Percent of students lacking their own assigned textbook: 0%
Health Lifetime Health - Holt Adopted 2004
The textbooks listed are from most recent adoption: Yes
Percent of students lacking their own assigned textbook: 0%
School Facility Conditions and Planned Improvements (Most Recent Year) Canyon High School recently began construction on a new Performing Arts Center (PAC) with a scheduled completion date of 2016. Along with the PAC, we are modernizing the Band and Choir rooms as well. Further renovation on the football/soccer field and track were completed in the summer of 2014 with the addition of a new drainage system, new artificial turf and a new track surface. The softball field was repaired with new grass in the outfield, new fencing around the dugouts and backstop and a new outfield fence has been installed. Each and every campus within the Wm. S Hart High School District is inspected by an on-site facility person on a daily basis. All deficiencies are reported electronically directly to District Maintenance and are corrected in an expeditious manner. As of 12/19/16 there are 38 work orders in progress.
School Facility Good Repair Status (Most Recent Year) Year and month in which data were collected: 12/14/16
System Inspected Repair Status Repair Needed and
Action Taken or Planned Good Fair Poor
Systems: Gas Leaks, Mechanical/HVAC, Sewer
X
Interior: Interior Surfaces
X Sink in ceramics very dirty, some counter tops in G bldg dusty . School has been notified and corrections will be made.
Cleanliness: Overall Cleanliness, Pest/ Vermin Infestation
X
Electrical: Electrical
X
Restrooms/Fountains: Restrooms, Sinks/ Fountains
X Several exterior drinking fountains not cleaned. School has been notified and corrections will be made.
Safety: Fire Safety, Hazardous Materials
X
Structural: Structural Damage, Roofs
X
External: Playground/School Grounds, Windows/ Doors/Gates/Fences
X
Overall Rating Exemplary Good Fair Poor
---------- X

2015-16 School Accountability Report Card for Canyon High School Page 7 of 12
B. Pupil Outcomes
State Priority: Pupil Achievement The SARC provides the following information relevant to the State priority: Pupil Achievement (Priority 4): • Statewide assessments (i.e., California Assessment of Student
Performance and Progress [CAASPP] System, which includes the Smarter Balanced Summative Assessments for students in the general education population and the California Alternate Assessments [CAAs] for English language arts/literacy [ELA] and mathematics given in grades three through eight and grade eleven. The CAAs have replaced the California Alternate Performance Assessment [CAPA] for ELA and mathematics, which were eliminated in 2015. Only eligible students may participate in the administration of the CAAs. CAA items are aligned with alternate achievement standards, which are linked with the Common Core State Standards [CCSS] for students with significant cognitive disabilities); and
• The percentage of students who have successfully completed courses
that satisfy the requirements for entrance to the University of California and the California State University, or career technical education sequences or programs of study
2015-16 CAASPP Results for All Students
Subject
Percent of Students Meeting or Exceeding the State Standards (grades 3-8 and 11)
School District State
14-15 15-16 14-15 15-16 14-15 15-16
ELA 68 83 62 67 44 48
Math 31 46 43 47 34 36
* Percentages are not calculated when the number of students tested is ten or less, either because the number of students in this category is too small for statistical accuracy or to protect student privacy.
CAASPP Results for All Students - Three-Year Comparison
Subject
Percent of Students Scoring at Proficient or Advanced (meeting or exceeding the state standards)
School District State
13-14 14-15 15-16 13-14 14-15 15-16 13-14 14-15 15-16
Science 62 62 61 77 75 69 60 56 54
* Science test results include California Standards Tests (CSTs), California Modified Assessment (CMA), and California Alternate Performance Assessment (CAPA) in grades five, eight, and ten. Scores are not shown when the number of students tested is ten or less, either because the number of students in this category is too small for statistical accuracy or to protect student privacy.
Grade Level
2015-16 Percent of Students Meeting Fitness Standards
4 of 6 5 of 6 6 of 6
---9--- 17.7 16.6 36.3
* Percentages are not calculated when the number of students tested is ten or less, either because the number of students in this category is too small for statistical accuracy or to protect student privacy.
2015-16 CAASPP Results by Student Group
Science (grades 5, 8, and 10)
Group Number of Students Percent of Students
Enrolled with Valid Scores w/ Valid Scores Proficient or Advanced
All Students 598 562 94.0 60.7
Male 305 285 93.4 59.3
Female 293 277 94.5 62.1
Black or African American 24 21 87.5 52.4
Asian 11 10 90.9 80.0
Filipino 21 19 90.5 94.7
Hispanic or Latino 315 300 95.2 50.0
White 205 192 93.7 72.4
Two or More Races 20 19 95.0 73.7
Socioeconomically Disadvantaged 239 231 96.7 43.7
English Learners 89 85 95.5 28.2
Students with Disabilities 69 64 92.8 28.1
* Science test results include CSTs, CMA, and CAPA in grades five, eight, and ten. The “Proficient or Advanced” is calculated by taking the total number of students who scored at Proficient or Advanced on the science assessment divided by the total number of students with valid scores. Scores are not shown when the number of students tested is ten or less, either because the number of students in this category is too small for statistical accuracy or to protect student privacy.

2015-16 School Accountability Report Card for Canyon High School Page 8 of 12
School Year 2015-16 CAASPP Assessment Results - English Language Arts (ELA) Disaggregated by Student Groups, Grades Three through Eight and Eleven
Student Group Grade
Number of Students Percent of Students
Enrolled Tested Tested Standard Met or
Exceeded
All Students 11 531 511 96.2 82.6
Male 11 280 269 96.1 78.8
Female 11 251 242 96.4 86.8
Black or African American 11 18 17 94.4 64.7
American Indian or Alaska Native 11 -- -- -- --
Asian 11 12 11 91.7 100.0
Filipino 11 18 18 100.0 94.4
Hispanic or Latino 11 259 246 95.0 76.0
Native Hawaiian or Pacific Islander 11 -- -- -- --
White 11 198 194 98.0 89.7
Two or More Races 11 23 22 95.7 90.9
Socioeconomically Disadvantaged 11 199 189 95.0 74.6
English Learners 11 76 68 89.5 51.5
Students with Disabilities 11 62 56 90.3 48.2
Foster Youth 11 -- -- -- --
ELA test results include the Smarter Balanced Summative Assessment and the CAA. The “Percent Met or Exceeded” is calculated by taking the total number of students who met or exceeded the standard on the Smarter Balanced Summative Assessment plus the total number of students who met the standard on the CAAs divided by the total number of students who participated in both assessments. Double dashes (--) appear in the table when the number of students is ten or less, either because the number of students in this category is too small for statistical accuracy or to protect student privacy. The number of students tested includes all students who participated in the test whether they received a score or not; however, the number of students tested is not the number that was used to calculate the achievement level percentages. The achievement level percentages are calculated using only students who received scores.
School Year 2015-16 CAASPP Assessment Results - Mathematics Disaggregated by Student Groups, Grades Three through Eight and Eleven
Student Group Grade
Number of Students Percent of Students
Enrolled Tested Tested Standard Met or
Exceeded
All Students 11 528 507 96.0 46.1
Male 11 279 265 95.0 45.0
Female 11 249 242 97.2 47.3
Black or African American 11 17 14 82.3 21.4
American Indian or Alaska Native 11 -- -- -- --
Asian 11 12 12 100.0 75.0
Filipino 11 18 18 100.0 72.2
Hispanic or Latino 11 257 244 94.9 33.8
Native Hawaiian or Pacific Islander 11 -- -- -- --

2015-16 School Accountability Report Card for Canyon High School Page 9 of 12
School Year 2015-16 CAASPP Assessment Results - Mathematics Disaggregated by Student Groups, Grades Three through Eight and Eleven
Student Group Grade
Number of Students Percent of Students
Enrolled Tested Tested Standard Met or
Exceeded
White 11 198 193 97.5 58.9
Two or More Races 11 23 23 100.0 54.5
Socioeconomically Disadvantaged 11 197 189 95.9 34.2
English Learners 11 76 66 86.8 9.5
Students with Disabilities 11 61 51 83.6 12.5
Foster Youth 11 -- -- -- --
Mathematics test results include the Smarter Balanced Summative Assessment and the CAA. The “Percent Met or Exceeded” is calculated by taking the total number of students who met or exceeded the standard on the Smarter Balanced Summative Assessment plus the total number of students who met the standard on the CAAs divided by the total number of students who participated in both assessments. Double dashes (--) appear in the table when the number of students is ten or less, either because the number of students in this category is too small for statistical accuracy or to protect student privacy. The number of students tested includes all students who participated in the test whether they received a score or not; however, the number of students tested is not the number that was used to calculate the achievement level percentages. The achievement level percentages are calculated using only students who received scores.
C. Engagement
State Priority: Parental Involvement The SARC provides the following information relevant to the Parental Involvement State Priority (Priority 3): • Efforts the school district makes to seek parent input in making decisions for the school district and each schoolsite. Opportunities for Parental Involvement (School Year 2016-17) Our Parent Advisory Committee (PAC) meets regularly throughout the school year. Our PAC has teamed up with our Counseling Department to offer informational meetings for students and parents on topics such as financial options for college and NCAA requirements. We have also begun joint meetings with Sierra Vista Junior High School to allow parents to speak directly with the principals in an informal environment. A group for parents of English learners also meets once a quarter for updates and information relating to programs in the community. Parents are actively involved in numerous booster clubs that support all of our co-curricular activities. Many volunteers join us at ASB events and dances as chaperones. State Priority: School Climate The SARC provides the following information relevant to the School Climate State Priority (Priority 6): • Pupil suspension rates; • Pupil expulsion rates; and • Other local measures on the sense of safety. School Safety Plan The school safety plan is reviewed annually to secure a safe and healthy learning environment. The plan includes child abuse reporting procedures, dangerous student notification, bullying and cyberbullying, dress code, school site discipline, evacuation procedures, risk management assessment, and crisis management and intervention. The plan is shared with staff before and after scheduled drills to ensure its efficiency. The plan was reviewed and revised in 2014, and modified to enhance procedures for the release of students in the event of a disaster. Campus supervisors and school personnel monitor the closed campus before, during, and after school. Visitors must register in the Attendance Office areas before entering the campus. Our Safe School Ambassador program has proven to be a huge asset in keeping the campus a safe environment.

2016-17 School Accountability Report Card for Canyon High School Page 10 of 12
Suspensions and Expulsions
School 2013-14 2014-15 2015-16
Suspensions Rate 2.9 3.1 1.0
Expulsions Rate 0.2 0.0 0.0
District 2013-14 2014-15 2015-16
Suspensions Rate 2.2 1.5 1.2
Expulsions Rate 0.1 0.1 0.1
State 2013-14 2014-15 2015-16
Suspensions Rate 4.4 3.8 3.7
Expulsions Rate 0.1 0.1 0.1
D. Other SARC Information
The information in this section is required to be in the SARC but is not included in the state priorities for LCFF.
2016-17 Federal Intervention Program
Indicator School District
Program Improvement Status
First Year of Program Improvement
Year in Program Improvement
Number of Schools Currently in Program Improvement 0
Percent of Schools Currently in Program Improvement .0
Academic Counselors and Other Support Staff at this School
Number of Full-Time Equivalent (FTE)
Academic Counselor------- 6.0
Counselor (Social/Behavioral or Career Development)
Library Media Teacher (Librarian) 1
Library Media Services Staff (Paraprofessional)
Psychologist------- 2
Social Worker-------
Nurse------- 1.0
Speech/Language/Hearing Specialist 2
Resource Specialist------- 2
Other-------
Average Number of Students per Staff Member
Academic Counselor------- 430 * One Full Time Equivalent (FTE) equals one staff member working full time;
one FTE could also represent two staff members who each work 50 percent of full time.
Average Class Size and Class Size Distribution (Secondary)
Average Class Size Number of Classrooms*
1-22 23-32 33+
Subject 2013-14 2014-15 2015-16 2013-14 2014-15 2015-16 2013-14 2014-15 2015-16 2013-14 2014-15 2015-16
English------- ----------
29 29 29 25 20 20 11 19 19 50 46 46
Mathematics ----------
31 29 29 17 4 4 12 6 6 47 9 9
Science------- ----------
30 30 30 14 12 12 8 16 16 46 39 39
Social Science ----------
29 27 27 18 22 22 12 16 16 36 27 27
* Number of classes indicates how many classrooms fall into each size category (a range of total students per classroom). At the secondary school level, this information is reported by subject area rather than grade level.
Professional Development provided for Teachers Professional Development for the 13-14 and 14-15 school years focuses on the implementation of the Common Core State Standards. To support teachers in the transition to the core, the concentration is on building foundational understanding of the standards, developing resources, and expanding collaborations between all stakeholders. ELA and math content teams are developing pacing guides and designing rigorous curricular units for the 2014-2015 school year and beyond. Professional Development Coaches are engaged in a deep examination of the Common Core Anchor Standards for Literacy in preparation for supporting all teachers as they teach literacy across the curriculum. These Common Core Anchor standards delineate reading, writing, listening and speaking skills students utilize across curriculum at all grade levels. All teachers participate in site and district level professional development around these key literacy standards as well as strengthen and support core instruction of literacy practices. Teachers are also provided with the mobile technology and support they need to enhance instruction and increase the use of technology in the classroom.

2015-16 School Accountability Report Card for Canyon High School Page 11 of 12
FY 2014-15 Teacher and Administrative Salaries
Category District Amount
State Average for Districts In Same
Category
Beginning Teacher Salary $45,577 $46,184
Mid-Range Teacher Salary $70,840 $75,179
Highest Teacher Salary $92,178 $96,169
Average Principal Salary (ES)
Average Principal Salary (MS) $129,725 $124,243
Average Principal Salary (HS) $143,879 $137,939
Superintendent Salary $234,700 $217,637
Percent of District Budget
Teacher Salaries 37% 35%
Administrative Salaries 5% 5% * For detailed information on salaries, see the CDE Certificated Salaries &
Benefits webpage at www.cde.ca.gov/ds/fd/cs/.
FY 2014-15 Expenditures Per Pupil and School Site Teacher Salaries
Level Expenditures Per Pupil Average
Teacher Salary Total Restricted Unrestricted
School Site-------
$9,013 $2,149 $6,864 $77,057
District-------
♦ ♦ $6,839 $75,163
State------- ♦ ♦ $5,677 $77,824
Percent Difference: School Site/District 0.4 2.5
Percent Difference: School Site/ State 20.9 -1.0
* Cells with ♦ do not require data.
Types of Services Funded
Staffing Costs, Textbooks, Materials, Supplies, and Facility/Operating Expenses.
Dropout Rate and Graduation Rate (Four-Year Cohort Rate)
Canyon High School 2011-12 2013-14 2014-15
Dropout Rate 1.40 0.50 2.20
Graduation Rate 98.10 98.66 96.84
William S. Hart Union High School District
2011-12 2013-14 2014-15
Dropout Rate 1.70 1.10 1.20
Graduation Rate 93.03 95.30 95.00
California 2011-12 2013-14 2014-15
Dropout Rate 11.40 11.50 10.70
Graduation Rate 80.44 80.95 82.27
Career Technical Education Participation
Measure CTE Program Participation
Number of pupils participating in CTE 1085
% of pupils completing a CTE program and earning a high school diploma
8
% of CTE courses sequenced or articulated between the school and institutions of postsecondary education
25
Courses for University of California (UC) and/or California State University (CSU) Admission
UC/CSU Course Measure Percent
2015-16 Students Enrolled in Courses Required for UC/CSU Admission
97.93
2014-15 Graduates Who Completed All Courses Required for UC/CSU Admission
62.6
* Where there are student course enrollments.
2015-16 Advanced Placement Courses
Subject Number of AP Courses
Offered*
Percent of Students In AP Courses
Computer Science ♦
English------- 5 ♦
Fine and Performing Arts ♦
Foreign Language 4 ♦
Mathematics 6 ♦
Science------- 6 ♦
Social Science 11 ♦
All courses 32 .7
Completion of High School Graduation Requirements
Group Graduating Class of 2015
School District State
All Students 92 83 86
Black or African American 91 67 78
American Indian or Alaska Native 0 72 78
Asian 88 94 93
Filipino 95 96 93
Hispanic or Latino 91 70 83
Native Hawaiian/Pacific Islander 100 93 85
White 94 94 91
Two or More Races 100 99 89
Socioeconomically Disadvantaged 90 76 66
English Learners 89 56 54
Students with Disabilities 100 69 78
2015-16 School Accountability Report Card for Canyon High School Page 12 of 12
Career Technical Education Programs
The Wm. S. Hart Union High School District, in collaboration with the Santa Clarita Community College District, has introducing a comprehensive college and career readiness initiative titled “Pathway to My Future.” The initiative will allow students to be more aware of what they need to do in preparation for life after high school. Dedicating more attention earlier on than ever before, students will be identifying their interests and careers that match. Students will also be able to explore a wide array of post-secondary educational options that align with work done while involved in a Career Pathway. The need for this initiative came about from an outcry of students who finished their post-secondary options and then say, "Now what?" The Pathway to My Future Initiative will enable students to have a clear, focused direction on what they want to do for a career by either attaining a job directly after high school in the field by completing a pathway leading to a certificate, or furthering their education with a subject major or institution of higher learning that will continue to the work they began in the Hart District.
DataQuest DataQuest is an online data tool located on the CDE DataQuest Web page at http://dq.cde.ca.gov/dataquest/ that contains additional information about this school and comparisons of the school to the district and the county. Specifically, DataQuest is a dynamic system that provides reports for accountability (e.g., test data, enrollment, high school graduates, dropouts, course enrollments, staffing, and data regarding English learners).
Internet Access Internet access is available at public libraries and other locations that are publicly accessible (e.g., the California State Library). Access to the Internet at libraries and public locations is generally provided on a first-come, first-served basis. Other use restrictions may include the hours of operation, the length of time that a workstation may be used (depending on availability), the types of software programs available on a workstation, and the ability to print documents.