Embed Size (px)
Citation preview
CAP 5415: Computer VisionLecture 3
Periodicity, Sampling, Practicalities
Fall 2009

Announcements
PS 1 has been released
Foreword
We will be doing some derivations
The goal is to use the derivations to help you build intuition and understanding about why things behave the way they do.
If you aren't understanding something, please ask questions
Don't get too stressed out if something is still a bit fuzzy, you are welcome to come to office hours
What are we doing?
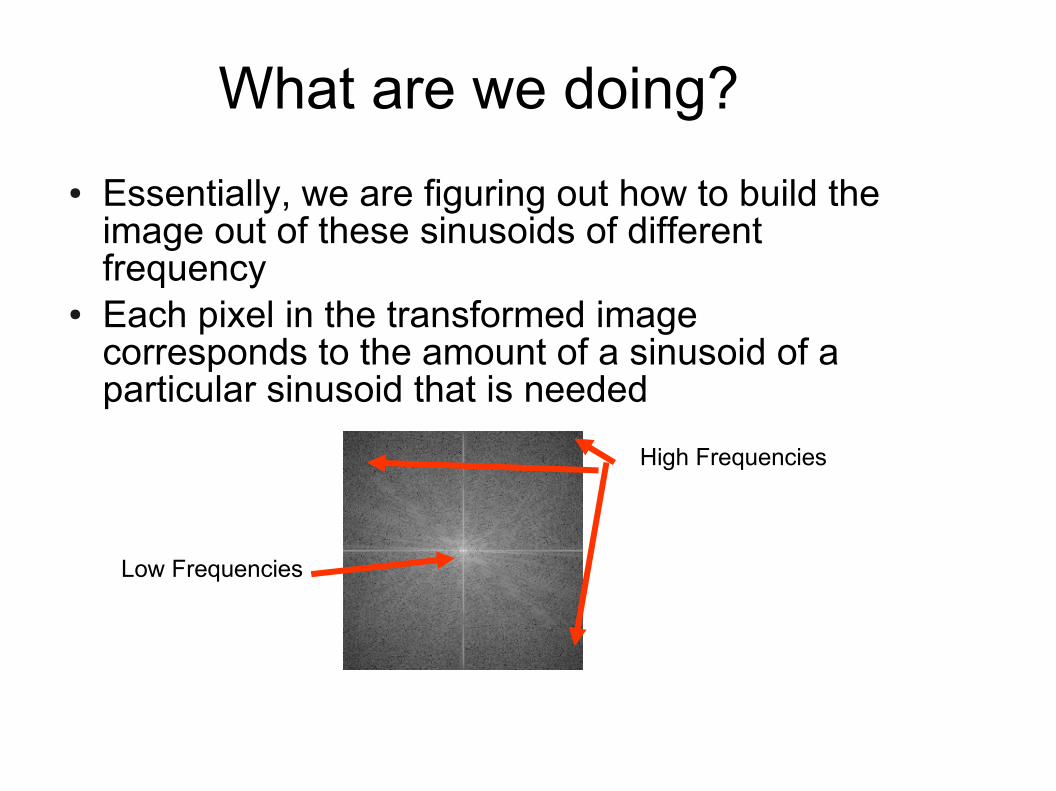
● Essentially, we are figuring out how to build the image out of these sinusoids of different frequency
● Each pixel in the transformed image corresponds to the amount of a sinusoid of a particular sinusoid that is needed
Low Frequencies
High Frequencies
What are High Frequencies?
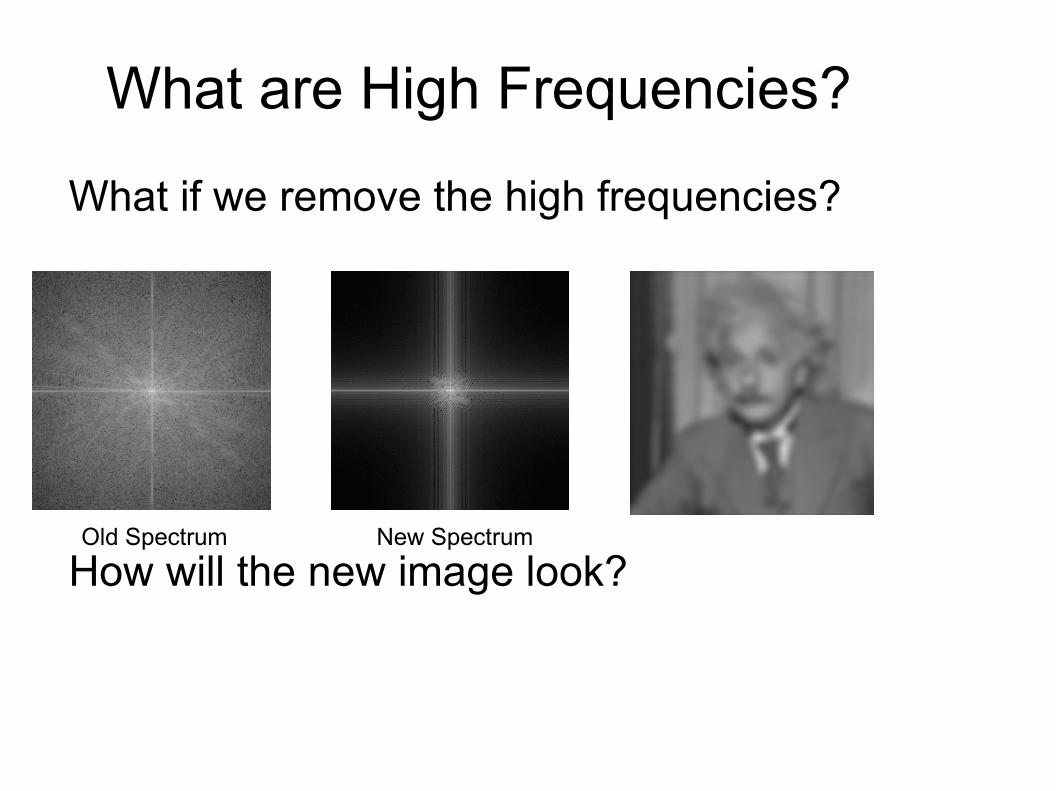
What if we remove the high frequencies?
How will the new image look?Old Spectrum New Spectrum
What are High Frequencies?
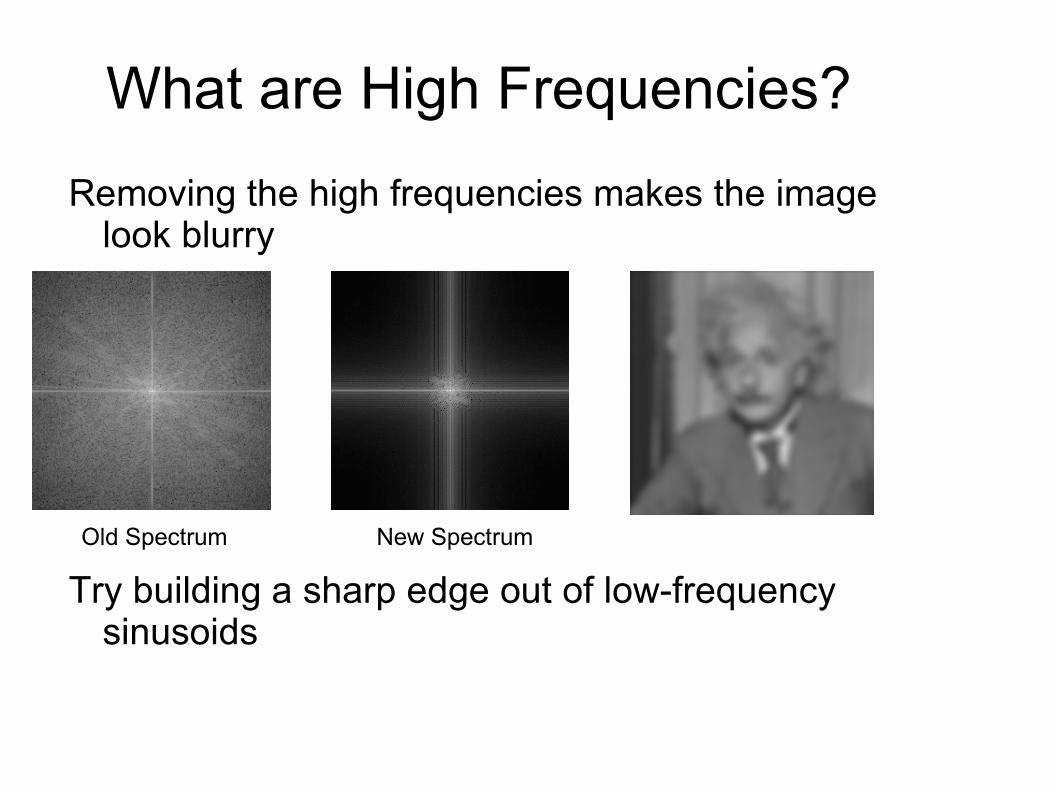
Removing the high frequencies makes the image look blurry
Try building a sharp edge out of low-frequency sinusoids
Old Spectrum New Spectrum
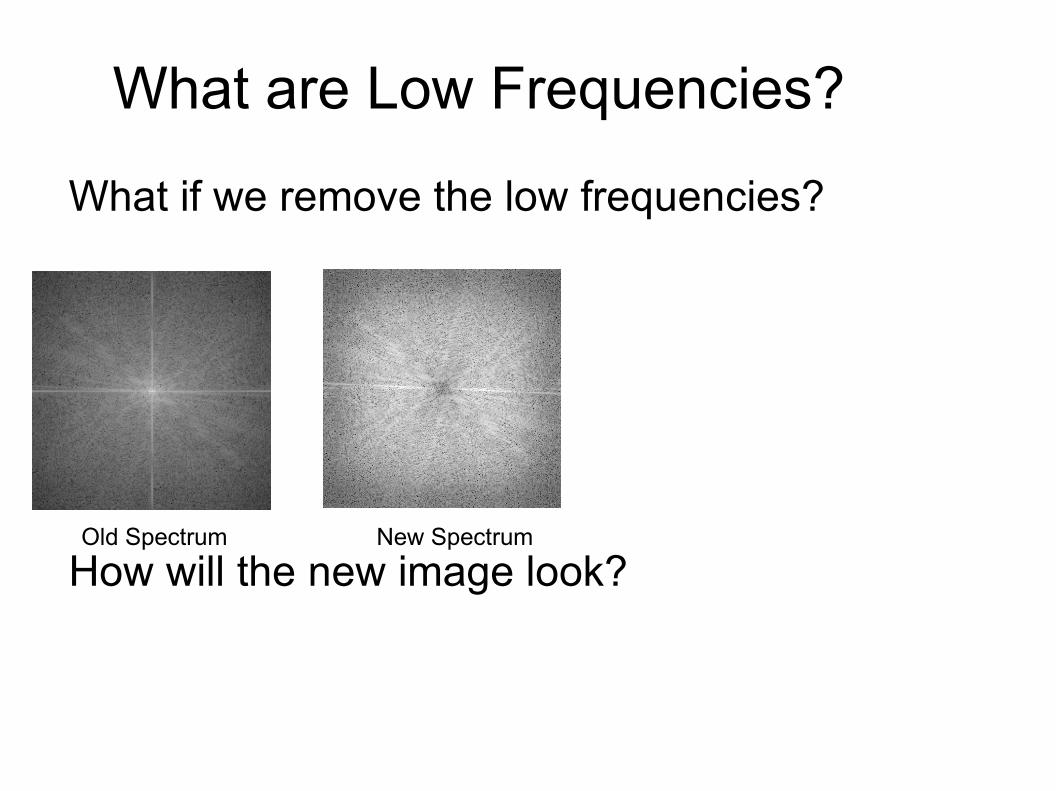
What are Low Frequencies?
What if we remove the low frequencies?
How will the new image look?Old Spectrum New Spectrum
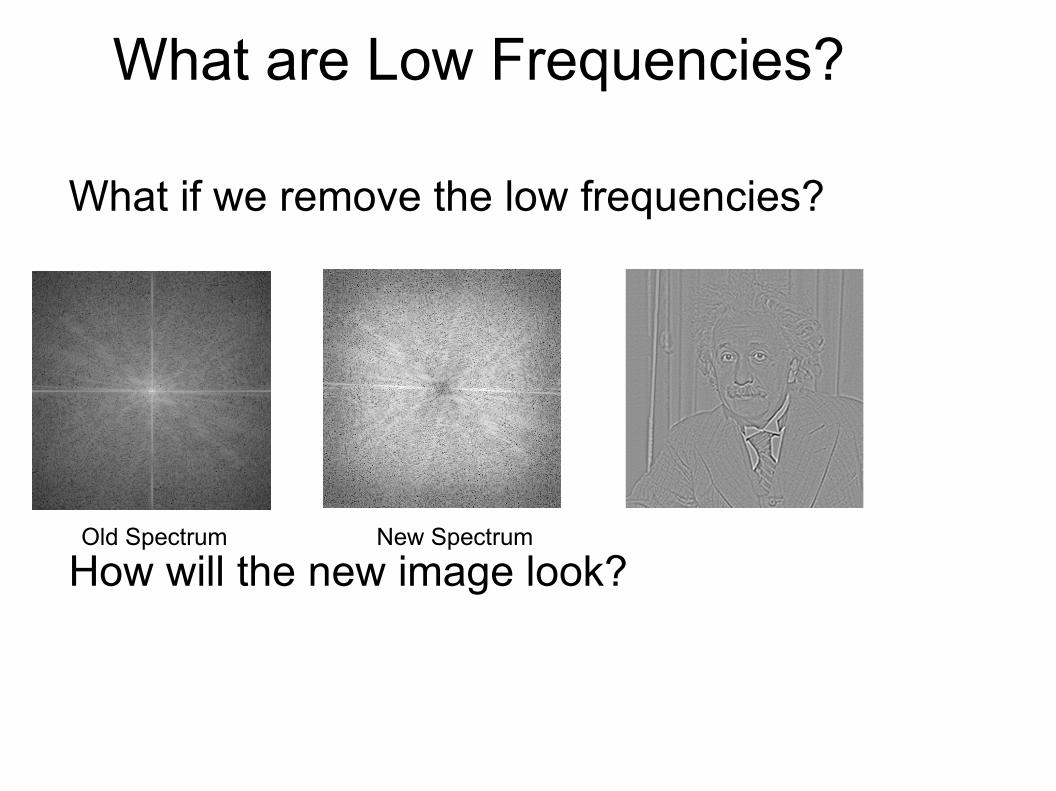
What are Low Frequencies?
What if we remove the low frequencies?
How will the new image look?Old Spectrum New Spectrum
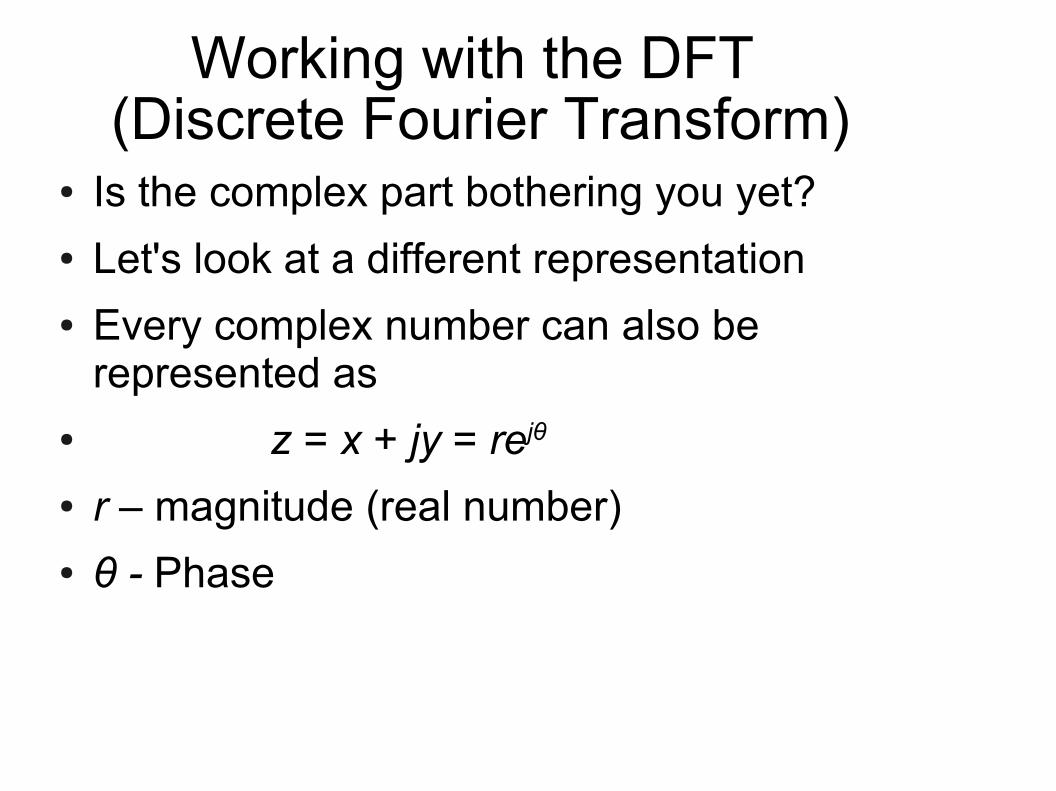
Working with the DFT (Discrete Fourier Transform)
● Is the complex part bothering you yet?● Let's look at a different representation● Every complex number can also be
represented as● z = x + jy = rejθ
● r – magnitude (real number)● θ - Phase
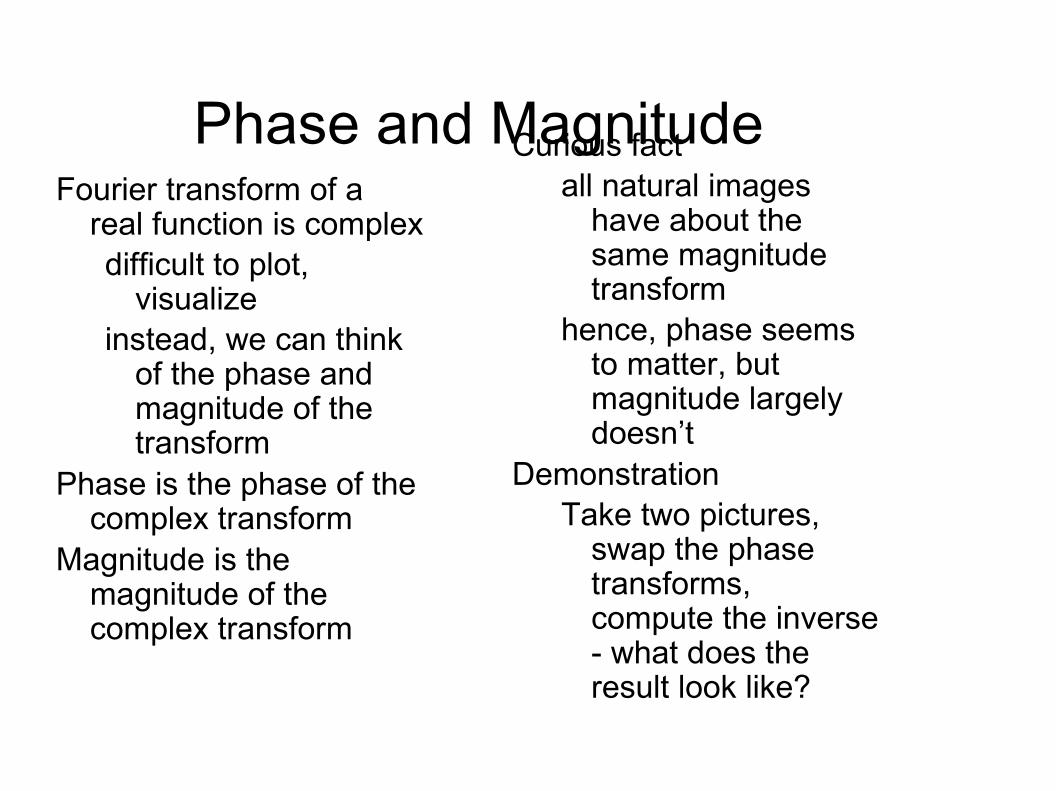
Phase and MagnitudeFourier transform of a
real function is complexdifficult to plot,
visualizeinstead, we can think
of the phase and magnitude of the transform
Phase is the phase of the complex transform
Magnitude is the magnitude of the complex transform
Curious factall natural images
have about the same magnitude transform
hence, phase seems to matter, but magnitude largely doesn’t
DemonstrationTake two pictures,
swap the phase transforms, compute the inverse - what does the result look like?
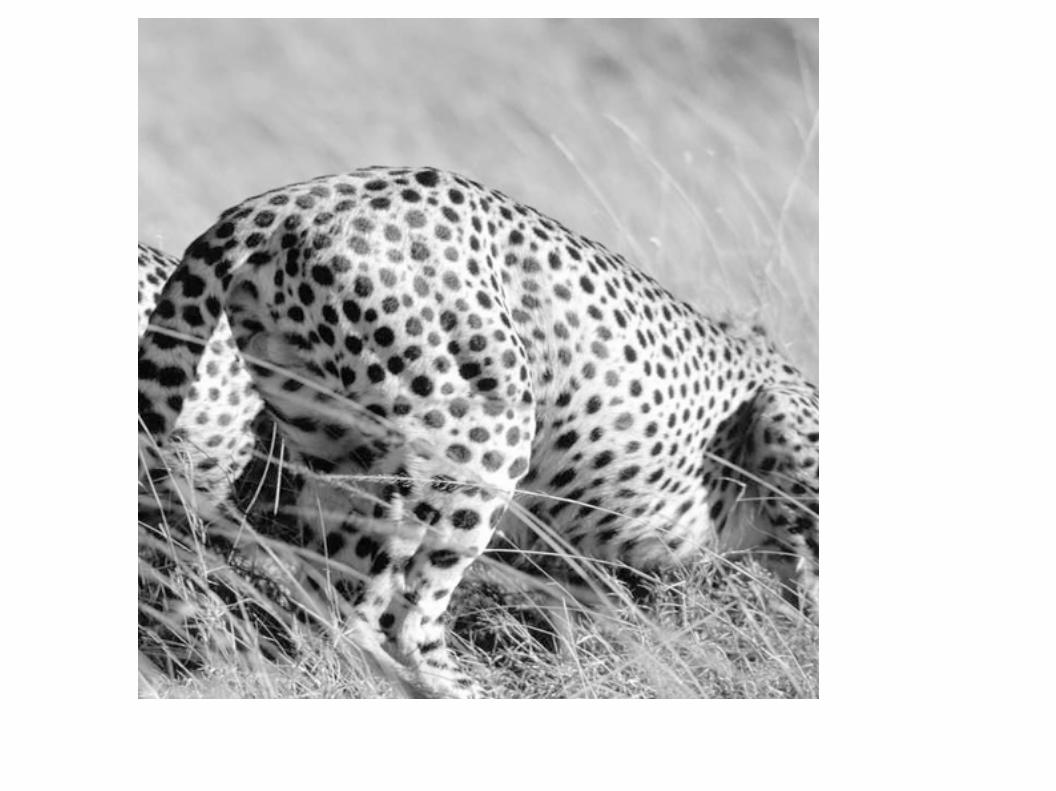
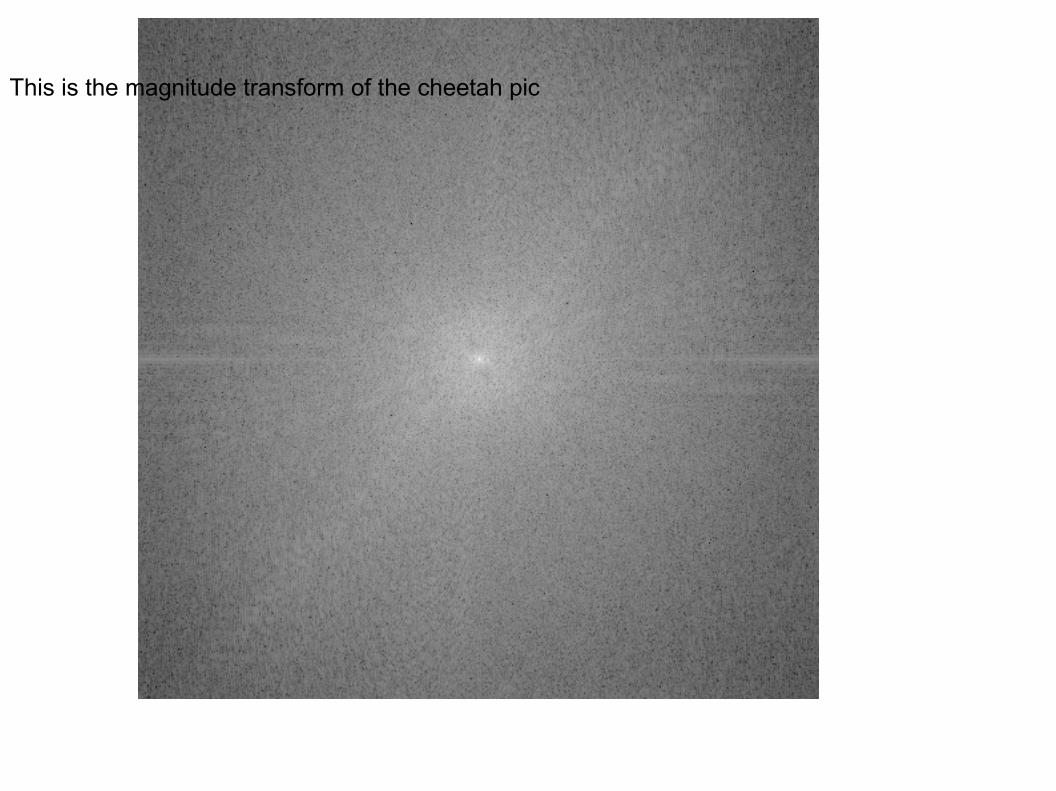
This is the magnitude transform of the cheetah pic
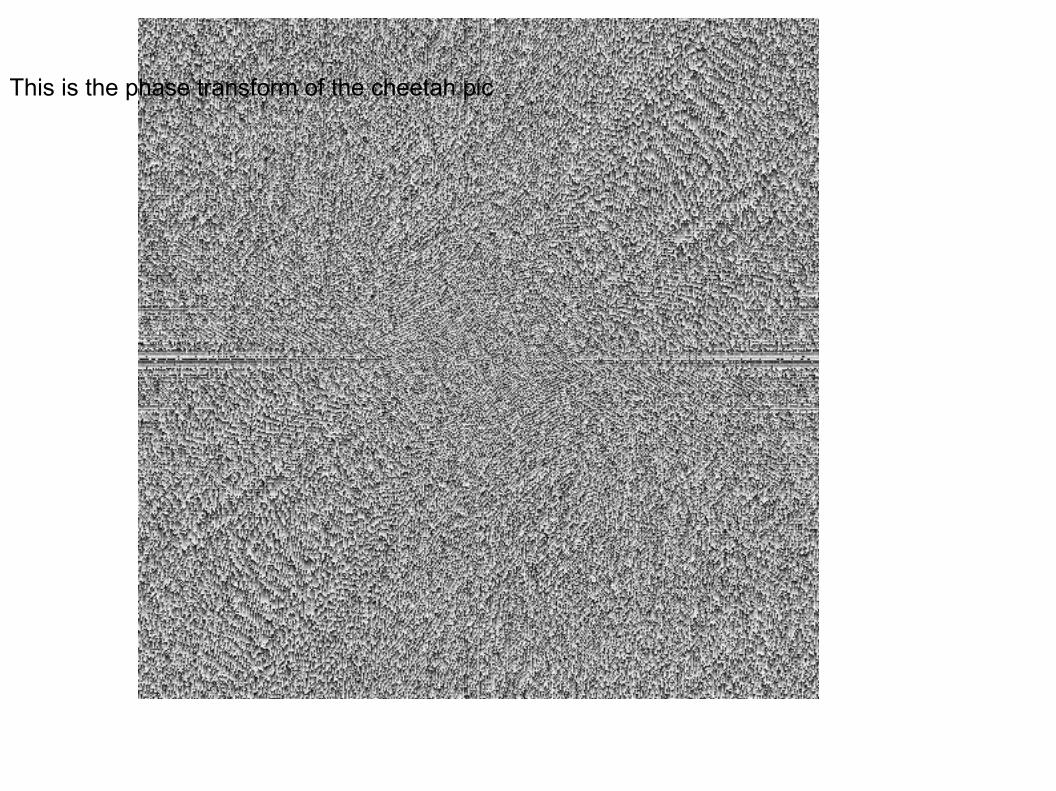
This is the phase transform of the cheetah pic
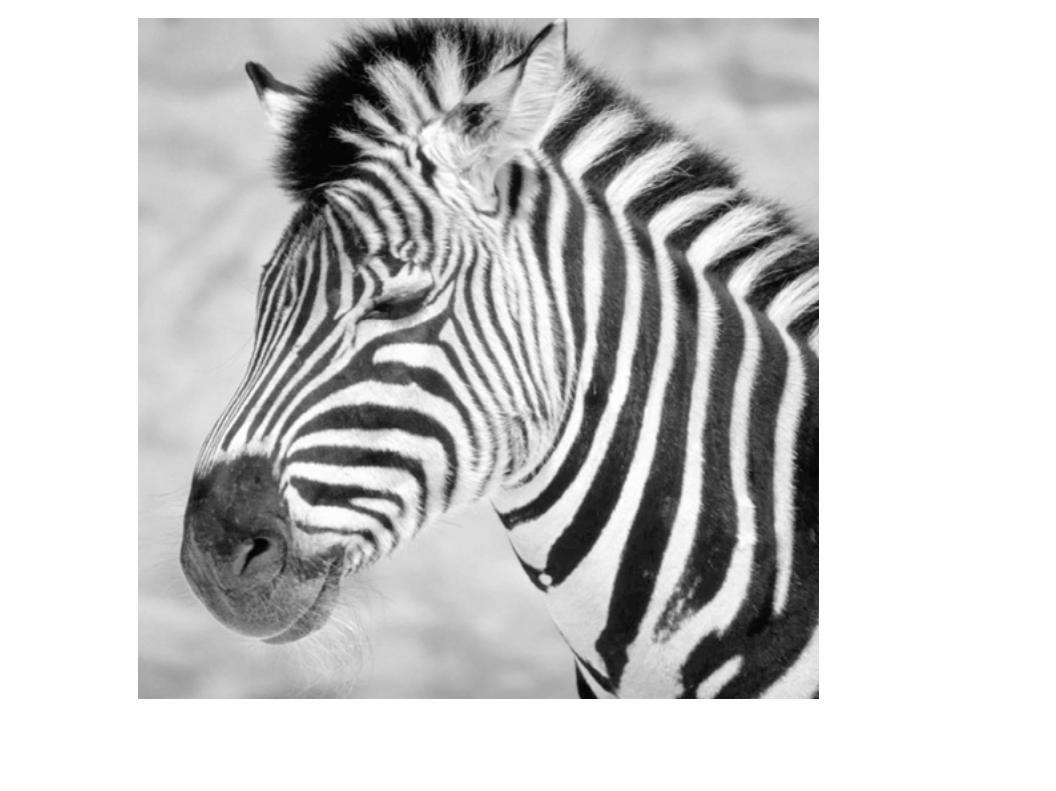
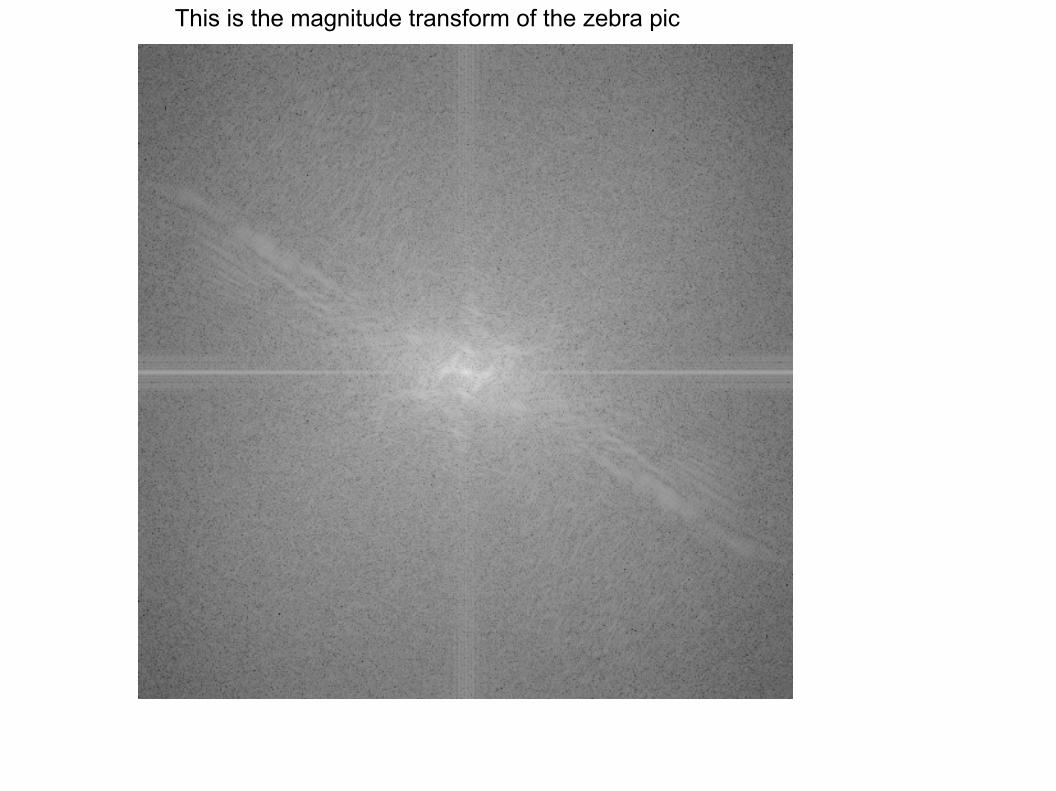
This is the magnitude transform of the zebra pic
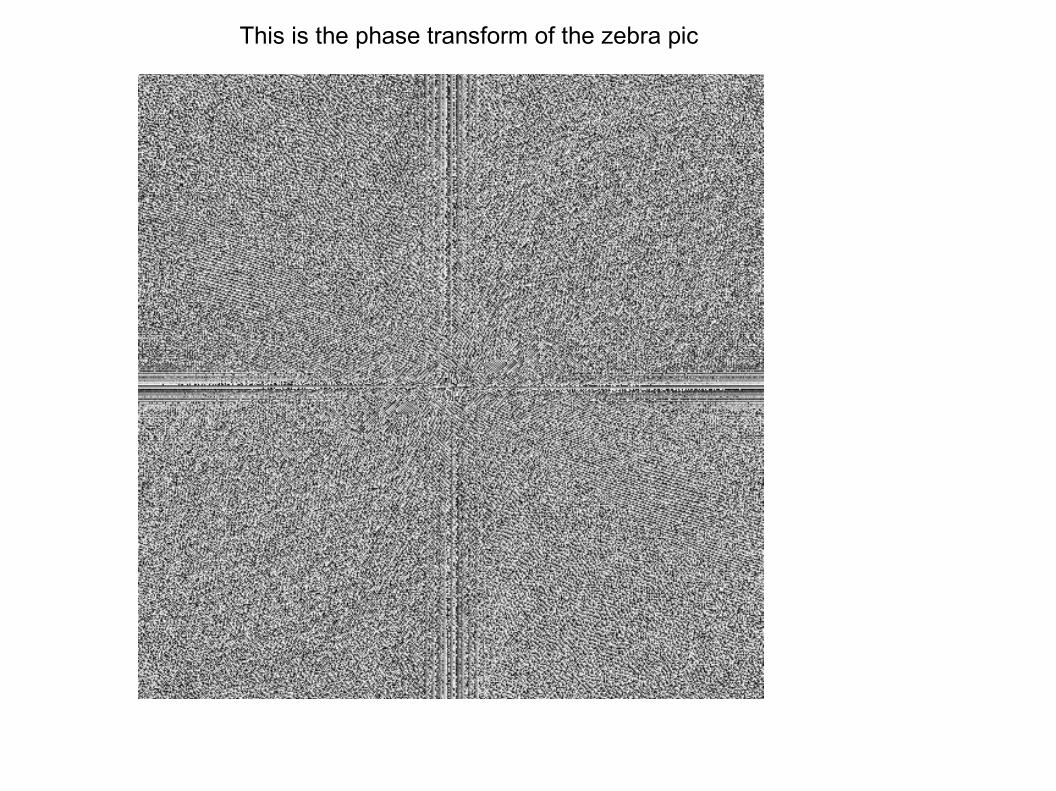
This is the phase transform of the zebra pic
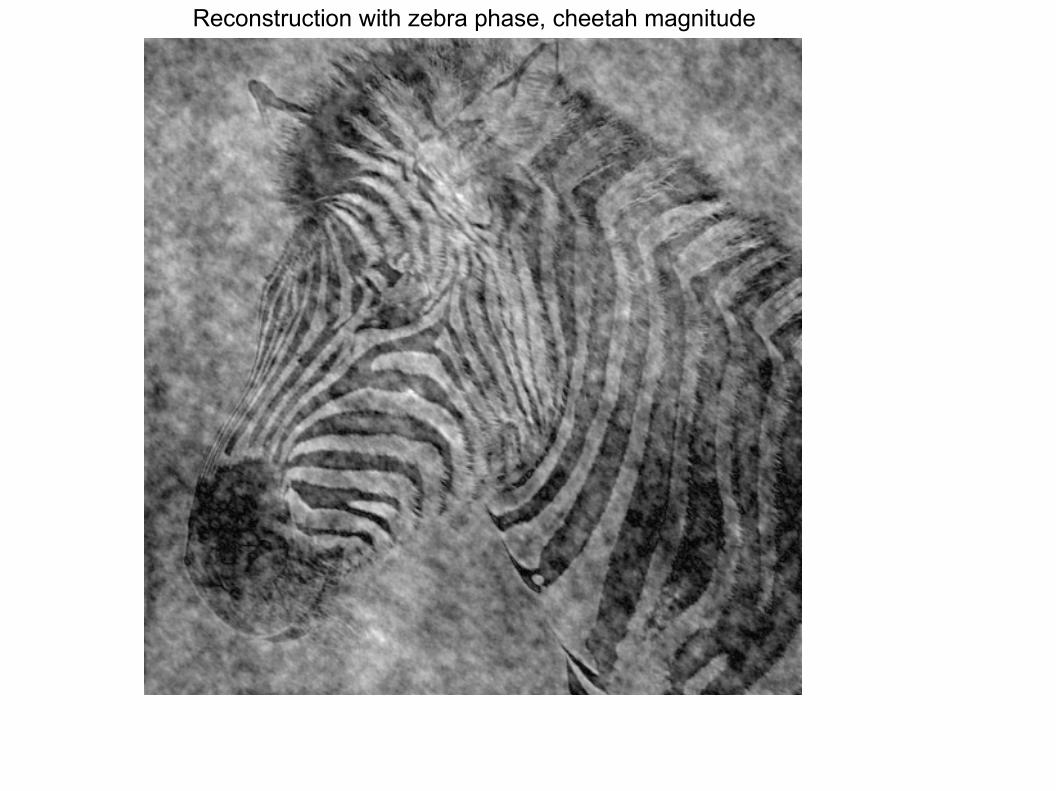
Reconstruction with zebra phase, cheetah magnitude
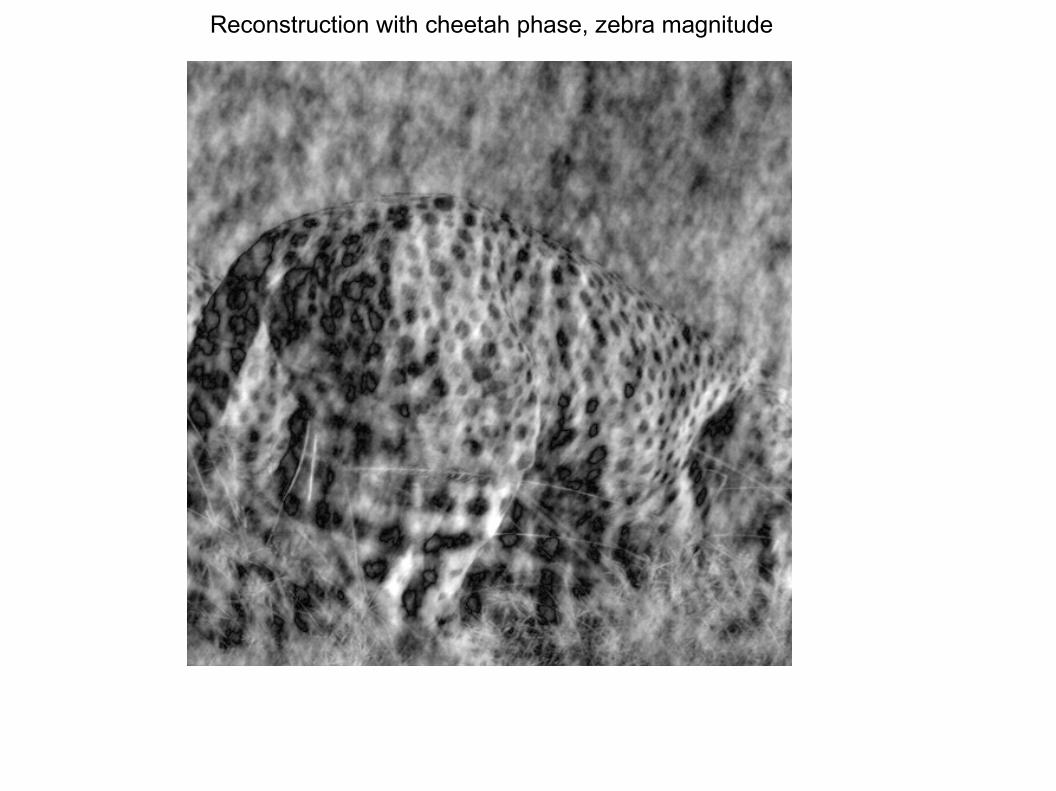
Reconstruction with cheetah phase, zebra magnitude
The Fourier Transform Helps Us Analyze Convolutions
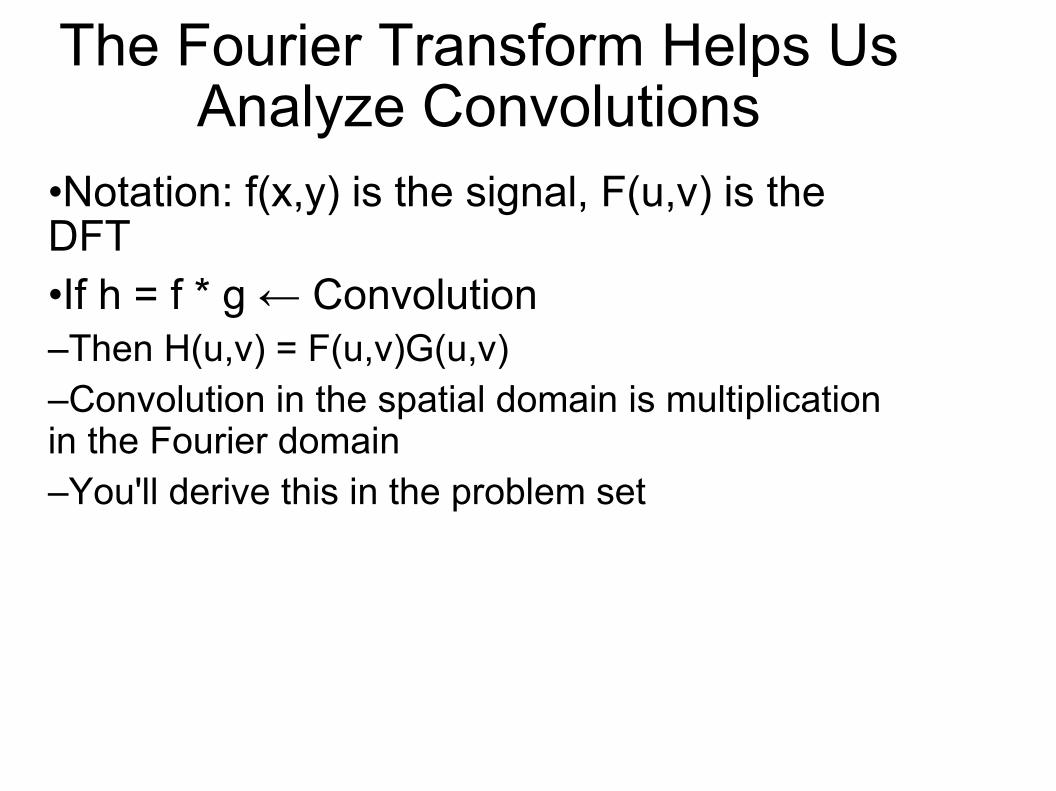
•Notation: f(x,y) is the signal, F(u,v) is the DFT•If h = f * g ← Convolution–Then H(u,v) = F(u,v)G(u,v)–Convolution in the spatial domain is multiplication in the Fourier domain–You'll derive this in the problem set
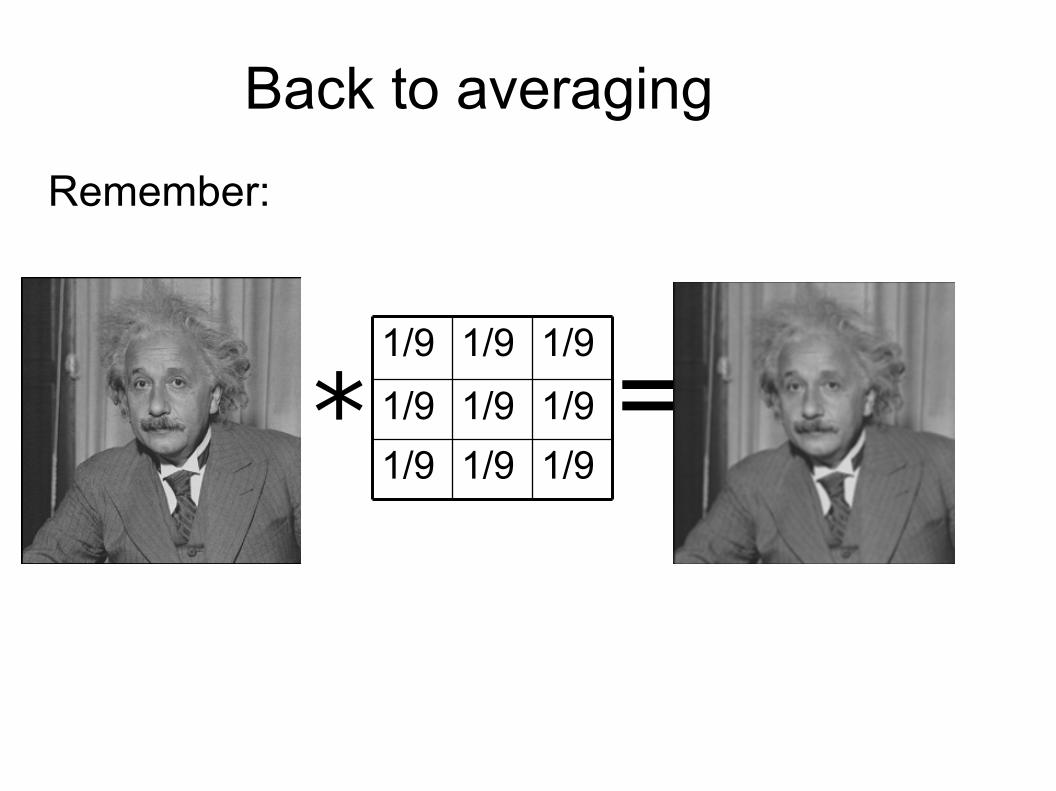
Back to averaging
Remember:
*1/91/91/9
1/91/91/9
1/91/91/9
=
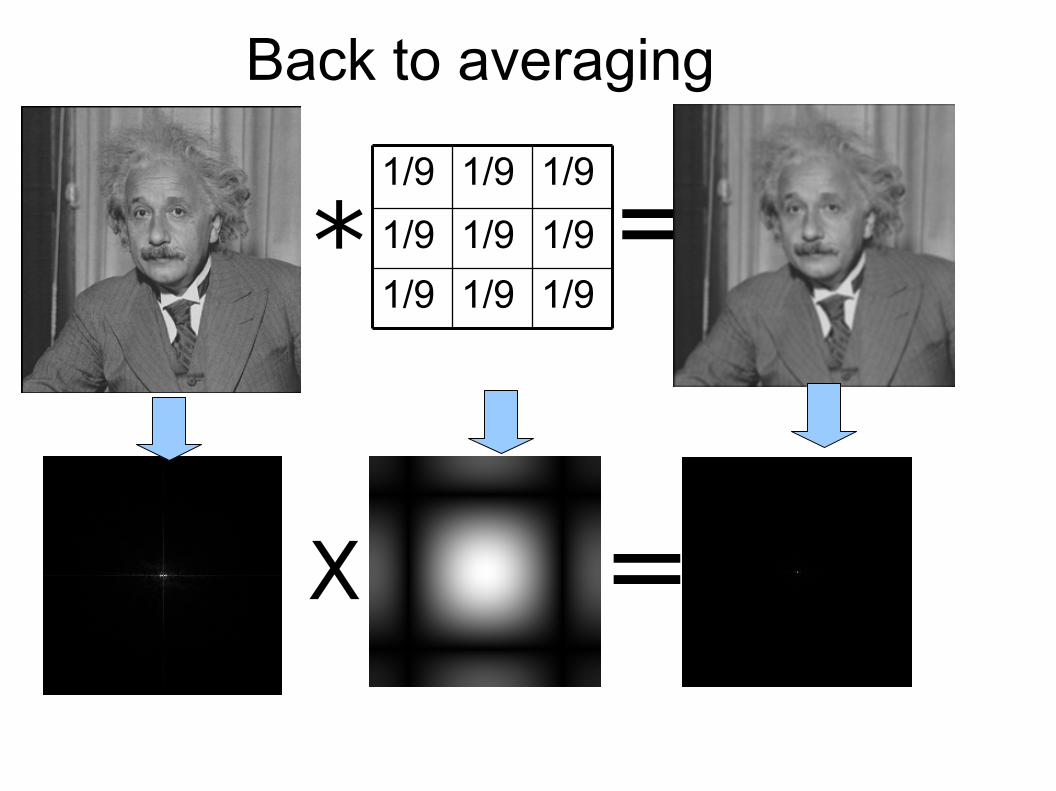
Back to averaging
*1/91/91/9
1/91/91/9
1/91/91/9
=
X =
Filtering
● We pixel-wise multiply the DFT of the input image by the DFT of the filter
● Frequencies where the magnitude of the response of the filter are near zero (black in the images) will be eliminated
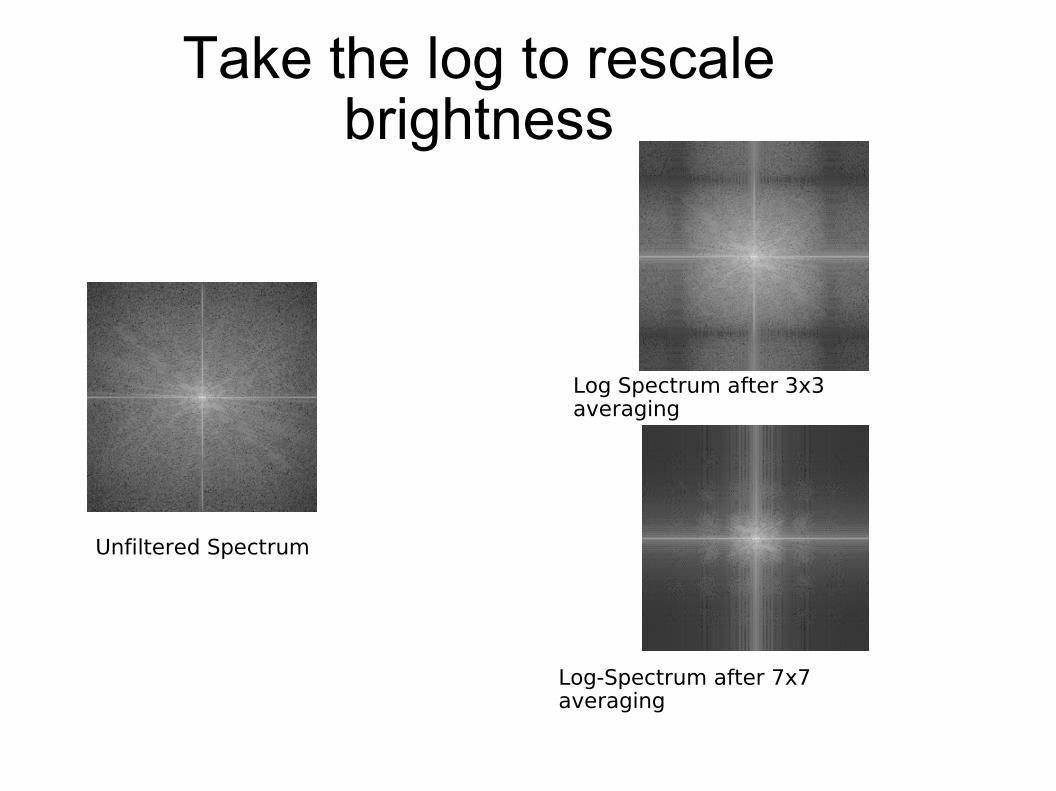
Take the log to rescale brightness
Unfiltered Spectrum
Log Spectrum after 3x3 averaging
Log-Spectrum after 7x7 averaging
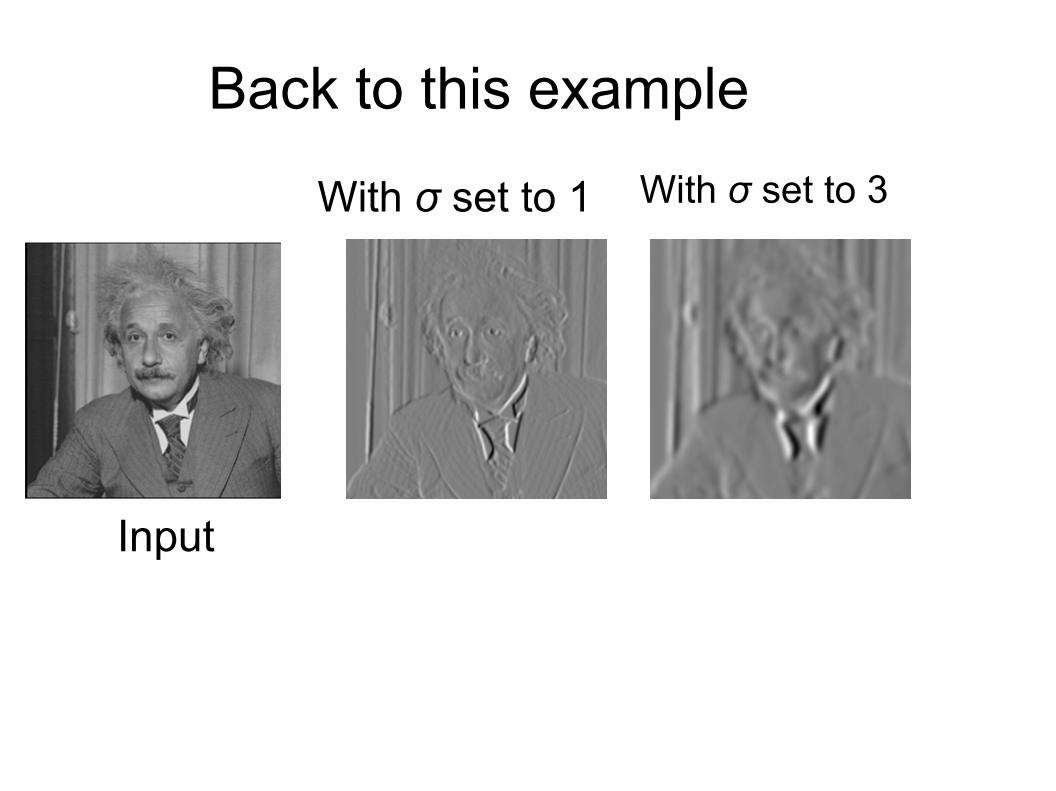
Back to this example
With σ set to 1 With σ set to 3
Input
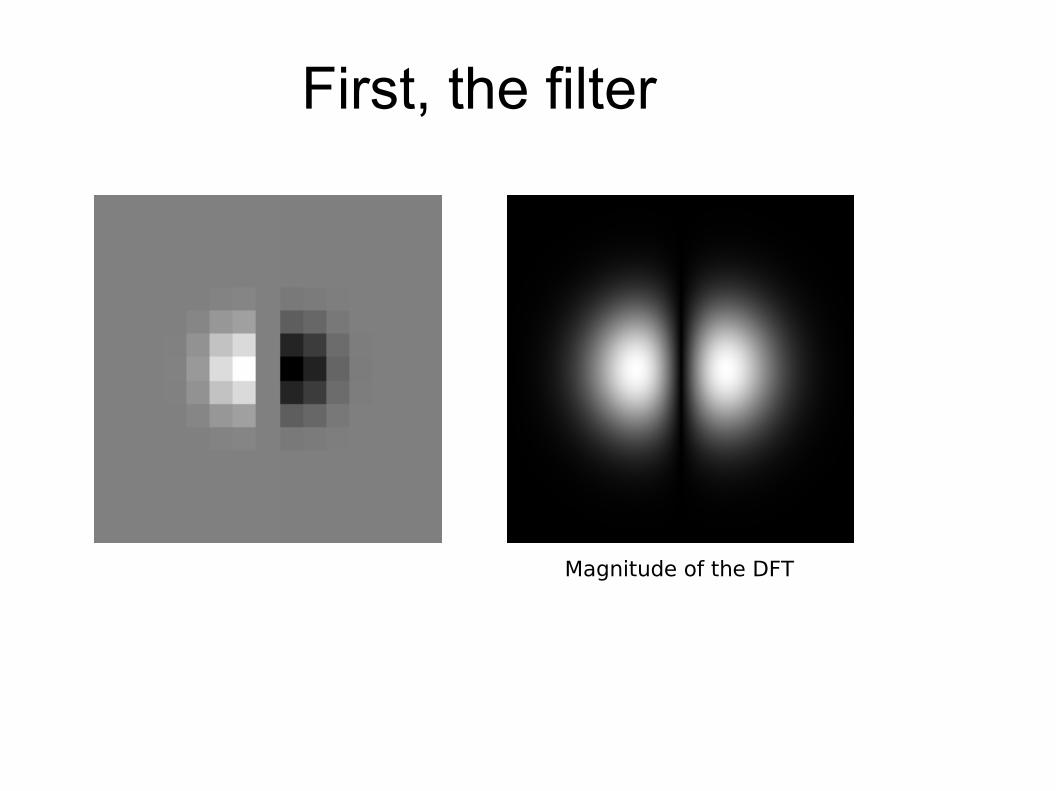
First, the filter
Magnitude of the DFT
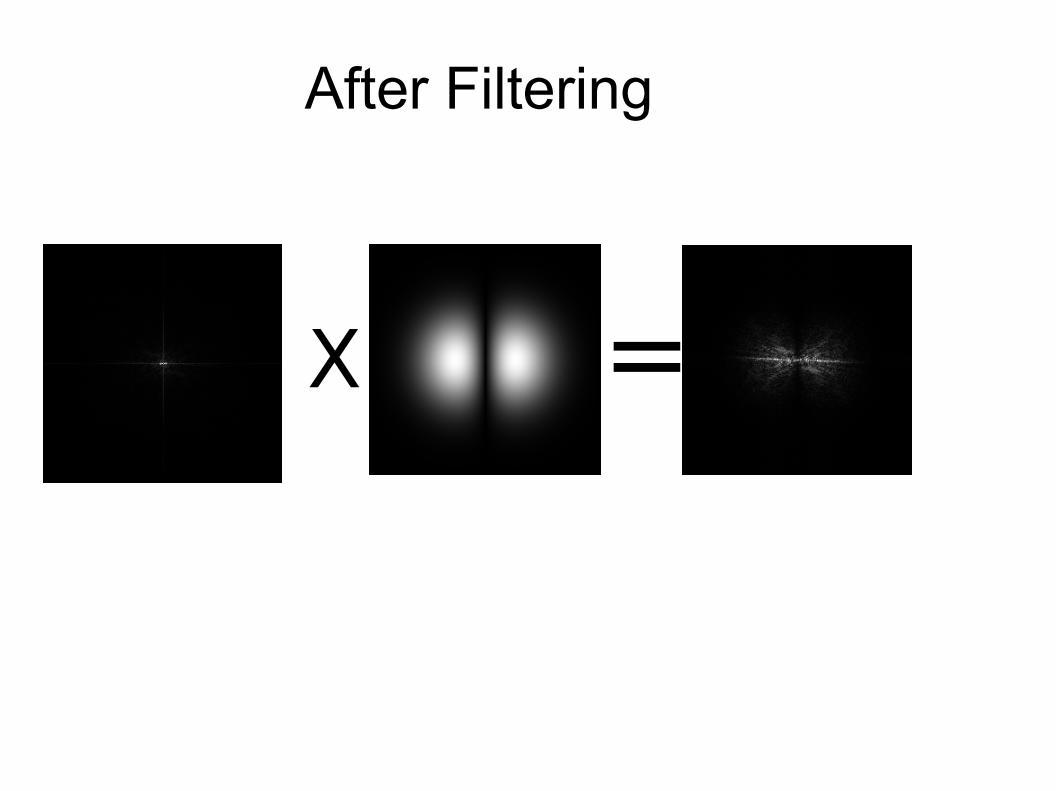
After Filtering
X =
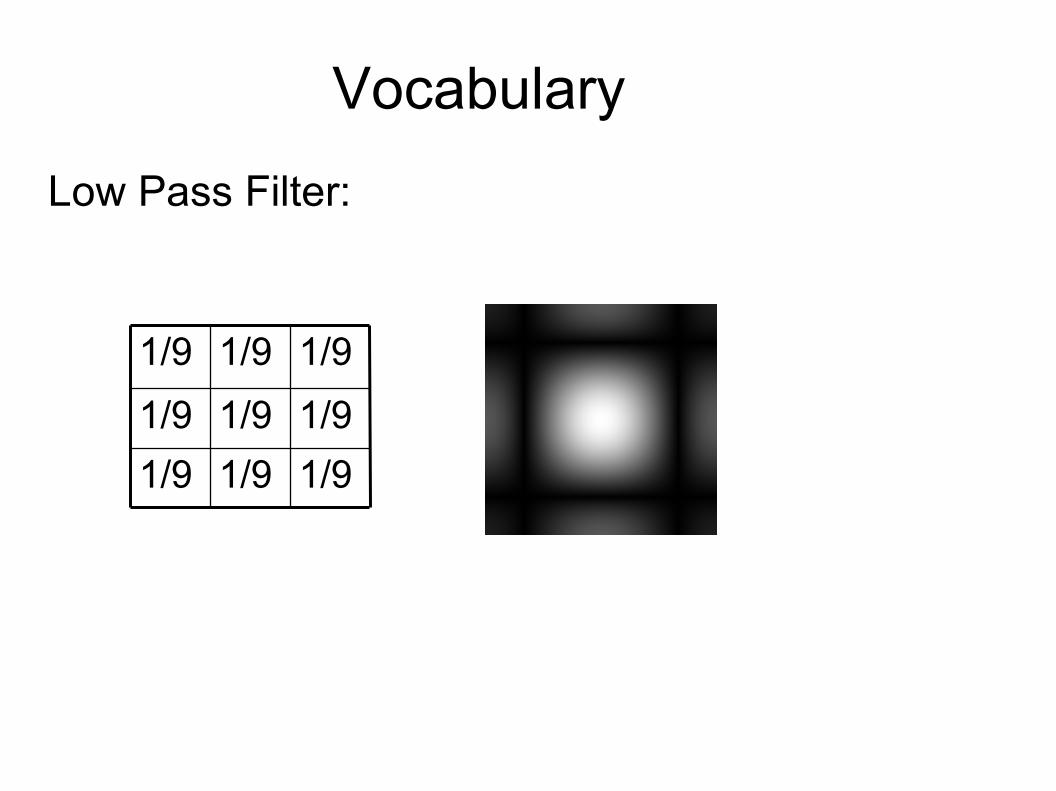
Vocabulary
Low Pass Filter:
1/91/91/9
1/91/91/9
1/91/91/9
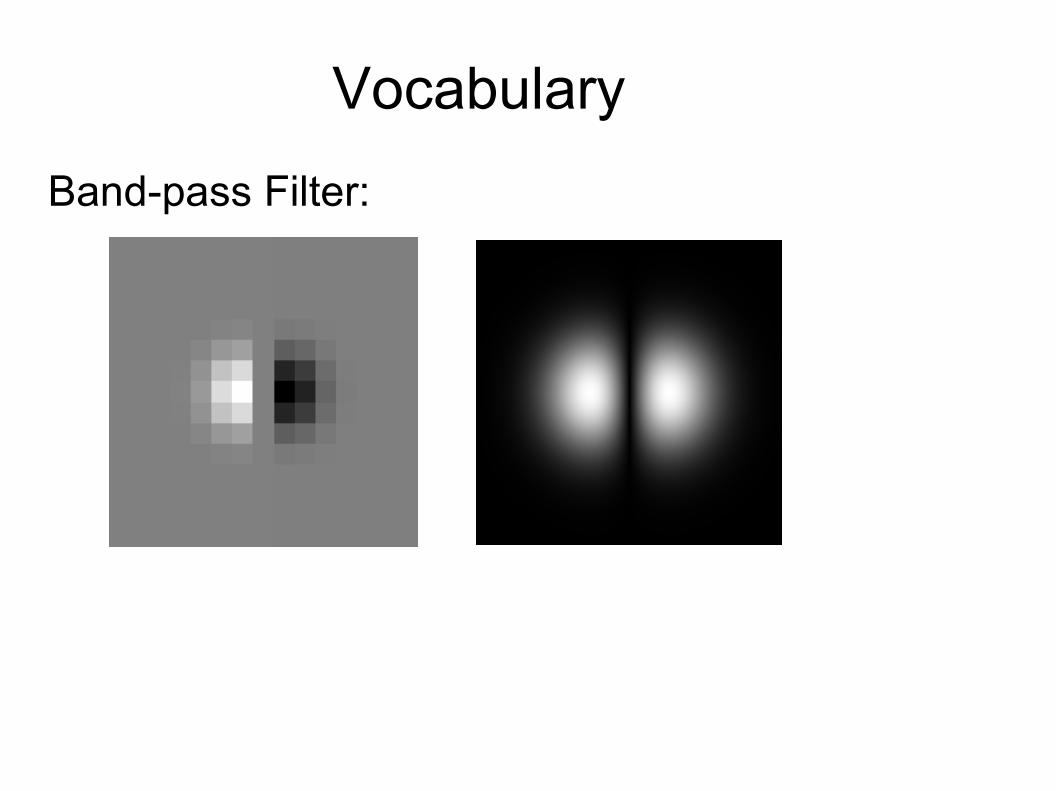
Vocabulary
Band-pass Filter:
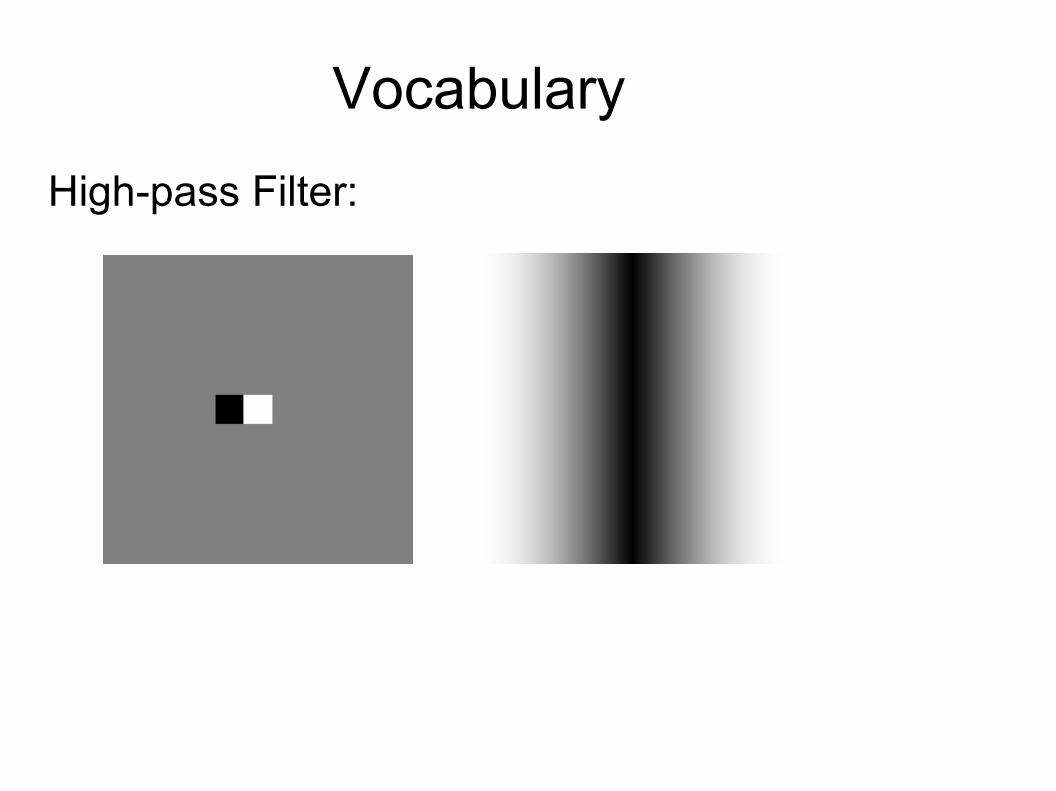
Vocabulary
High-pass Filter:
Now, let's compute some DFT's
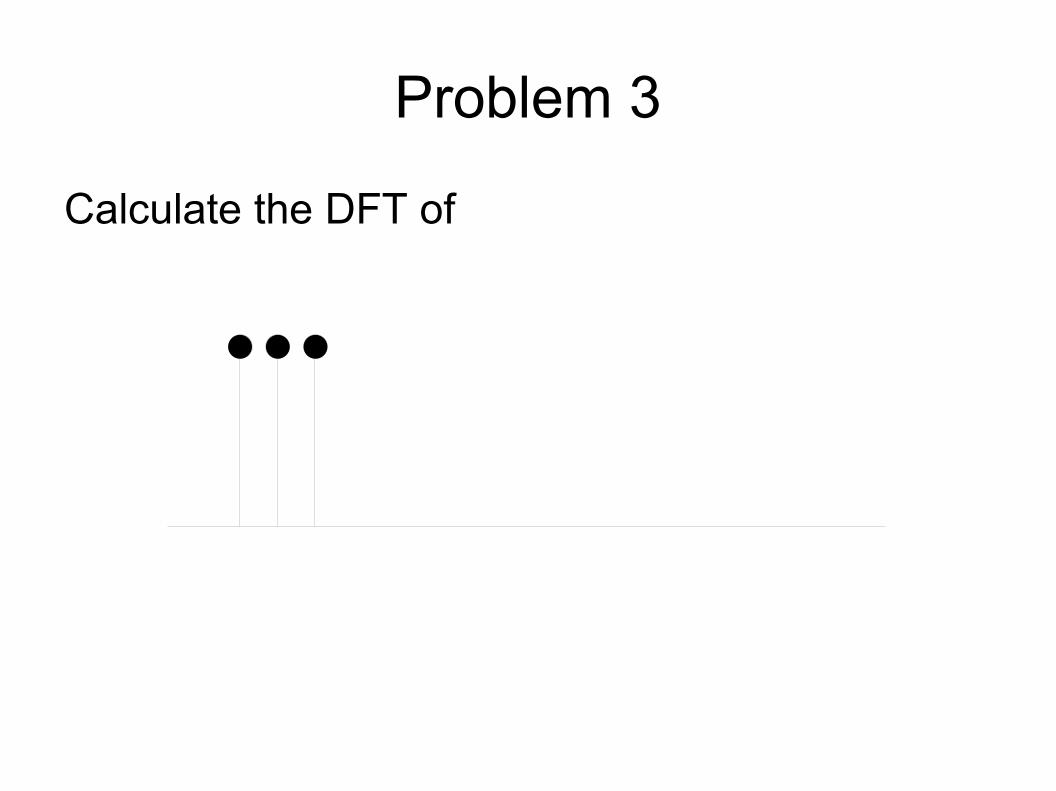
Problem 3
Calculate the DFT of
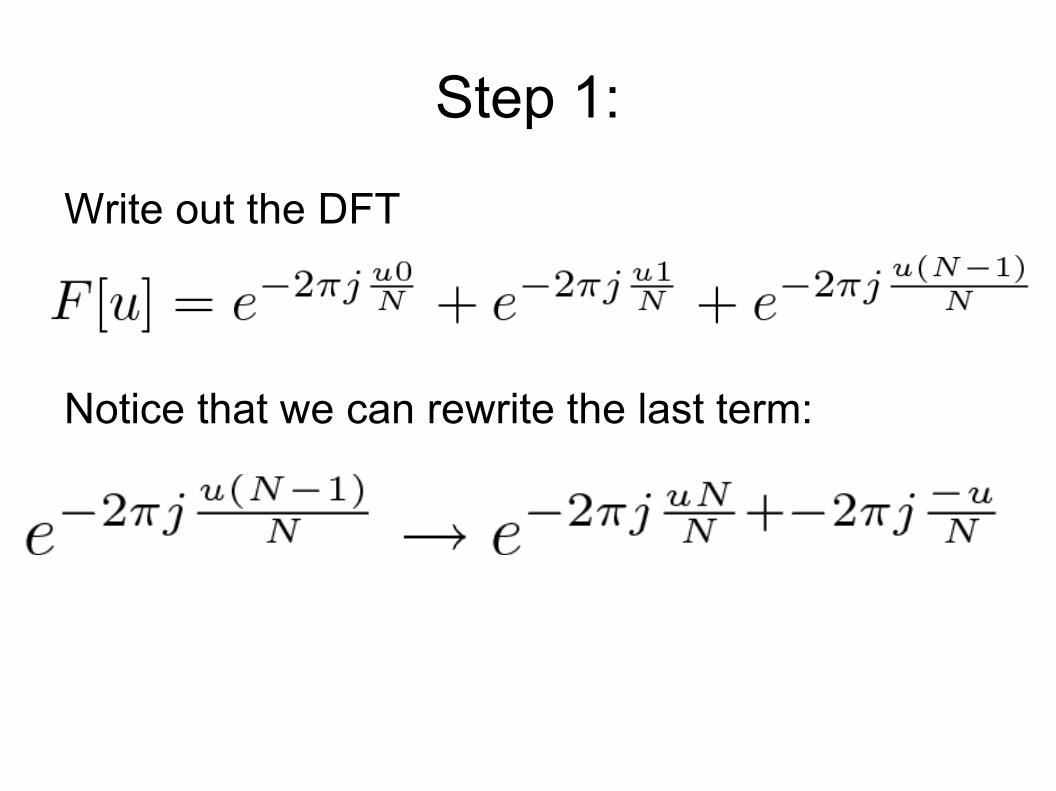
Step 1:
Write out the DFT
Notice that we can rewrite the last term:
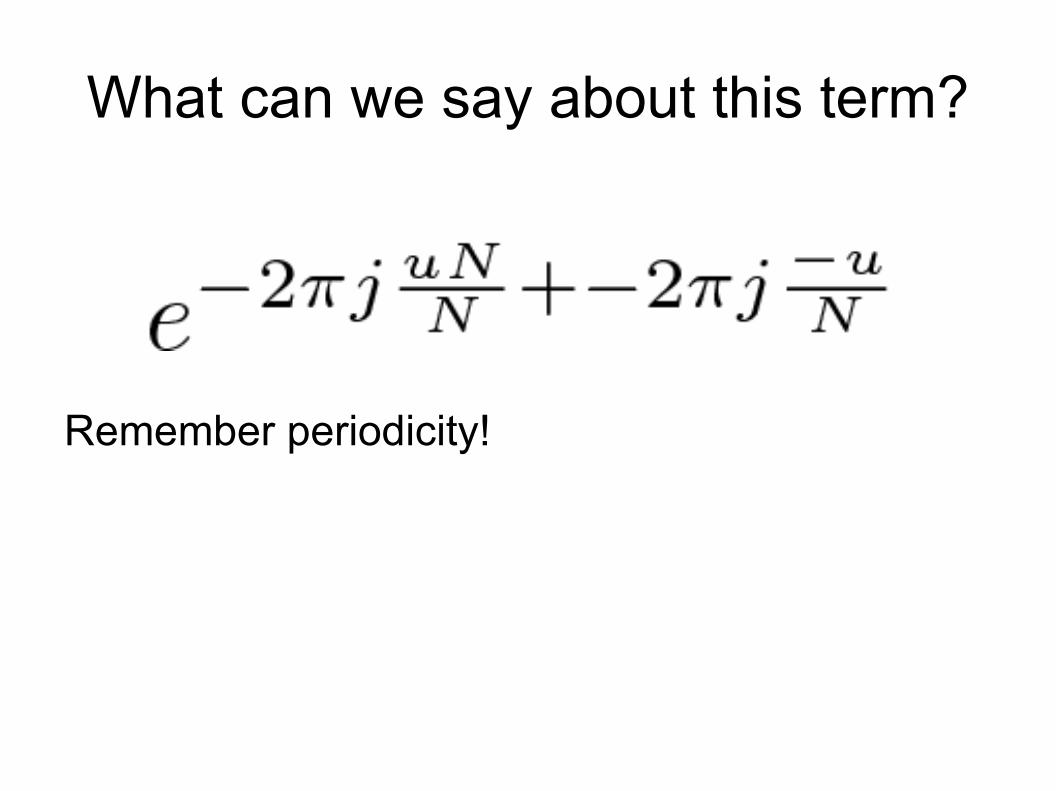
What can we say about this term?
Remember periodicity!
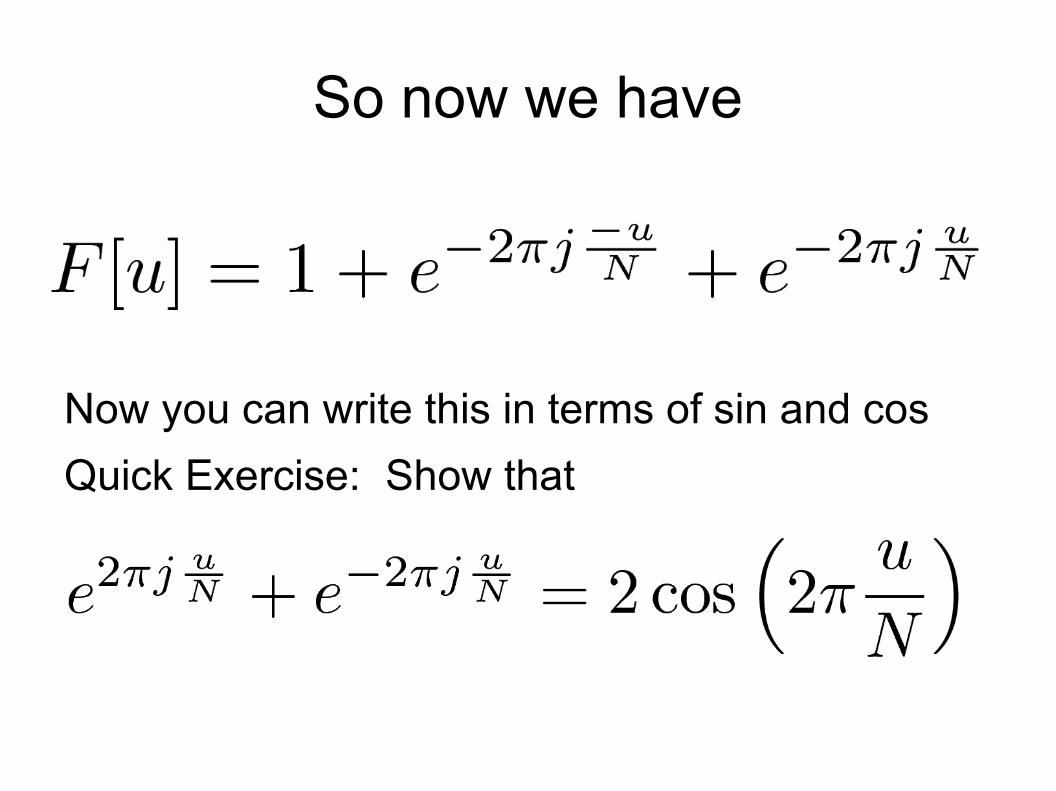
So now we have
Now you can write this in terms of sin and cos
Quick Exercise: Show that
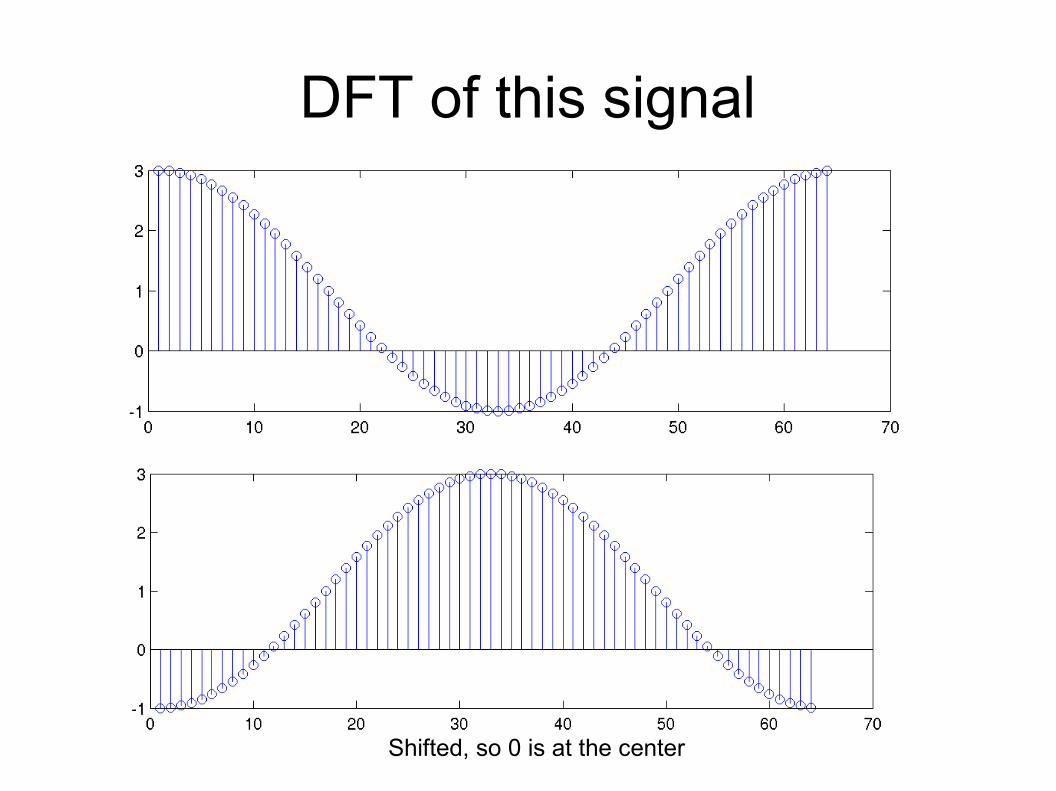
DFT of this signal
Shifted, so 0 is at the center
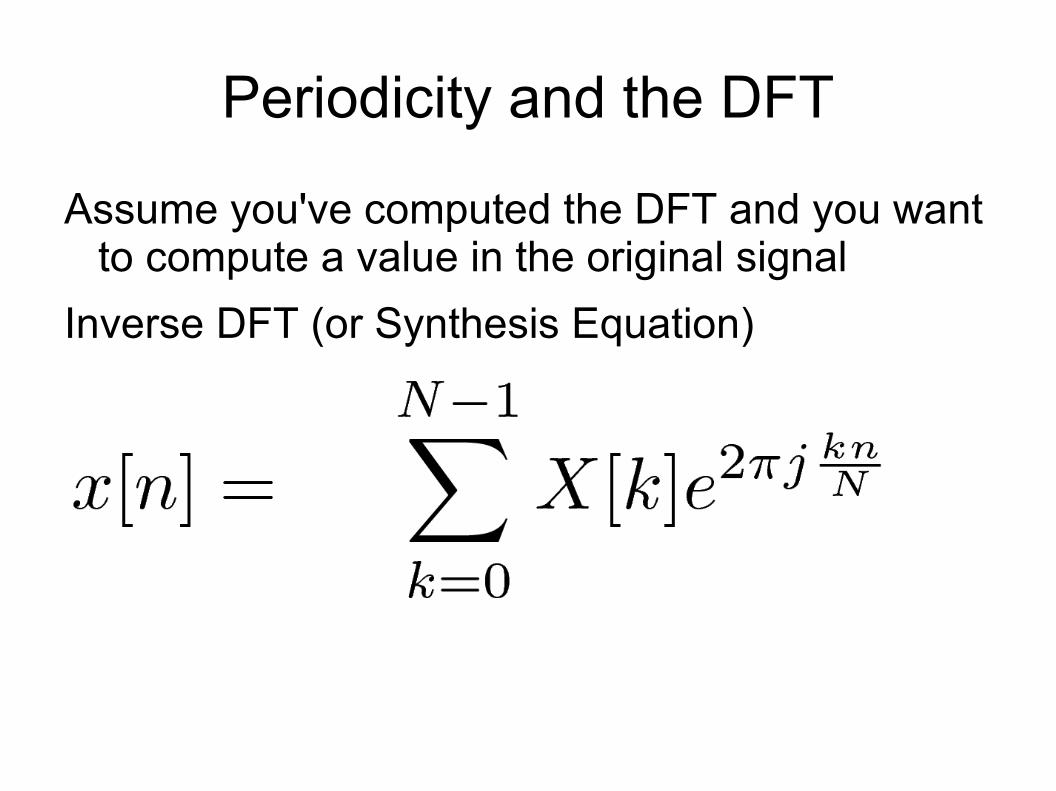
Periodicity and the DFT
Assume you've computed the DFT and you want to compute a value in the original signal
Inverse DFT (or Synthesis Equation)
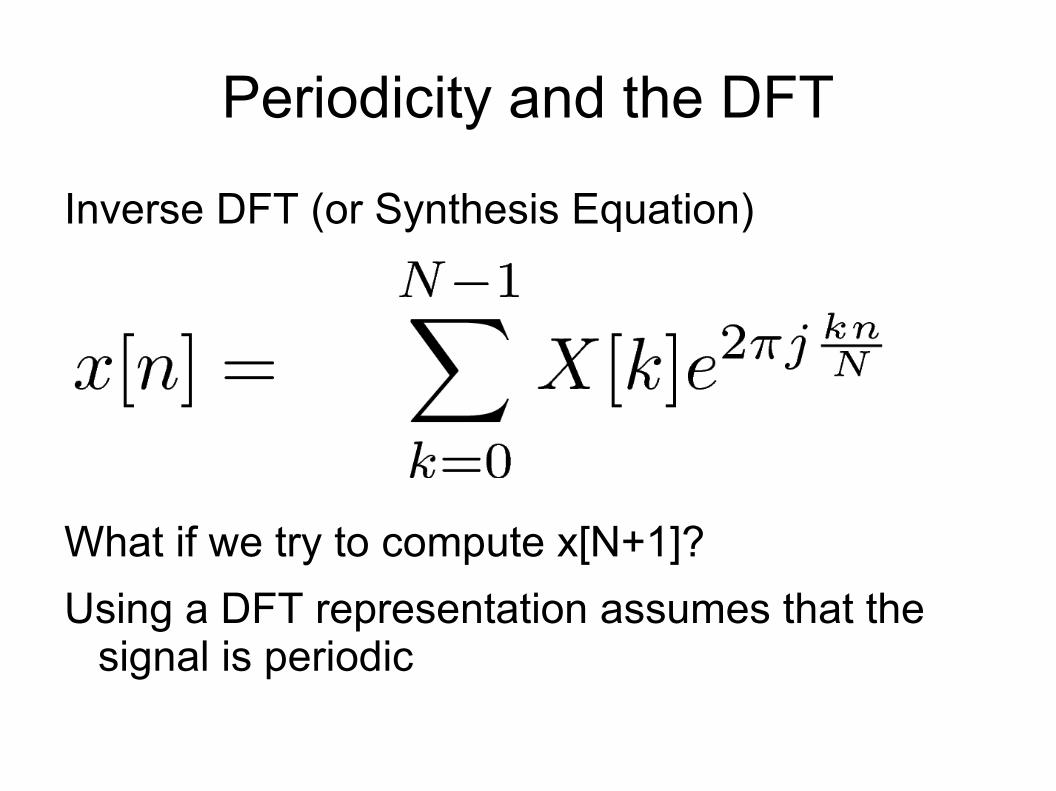
Periodicity and the DFT
Inverse DFT (or Synthesis Equation)
What if we try to compute x[N+1]?
Using a DFT representation assumes that the signal is periodic
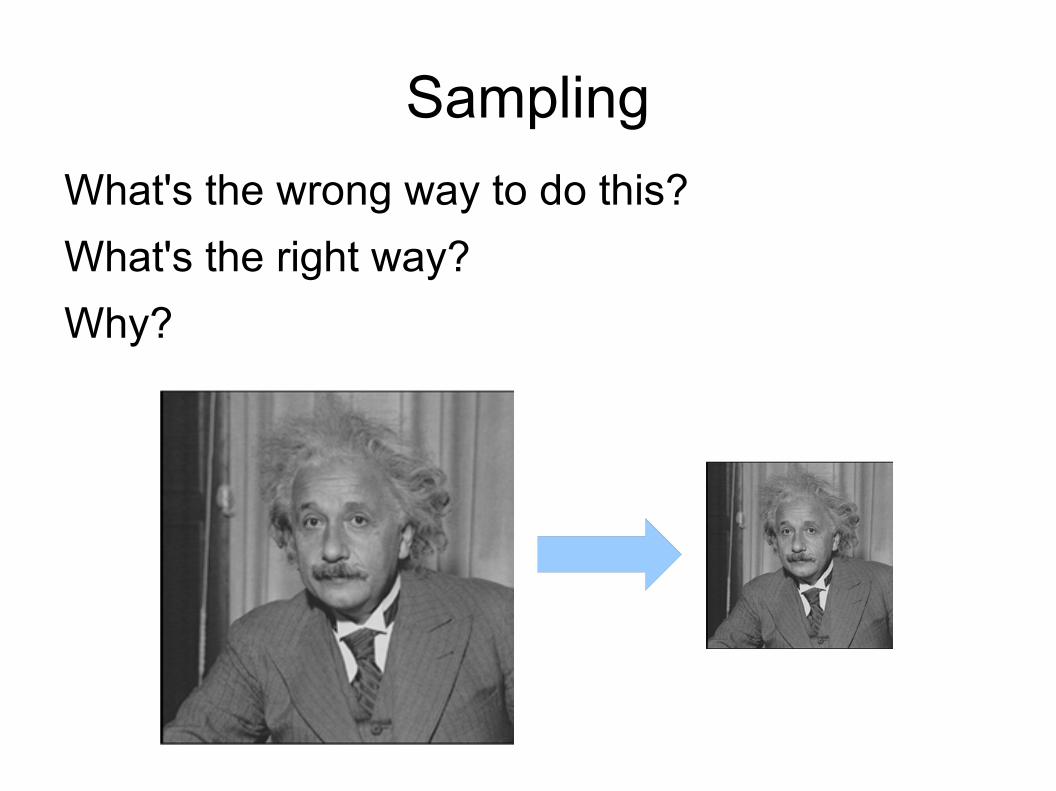
Sampling
What's the wrong way to do this?
What's the right way?
Why?
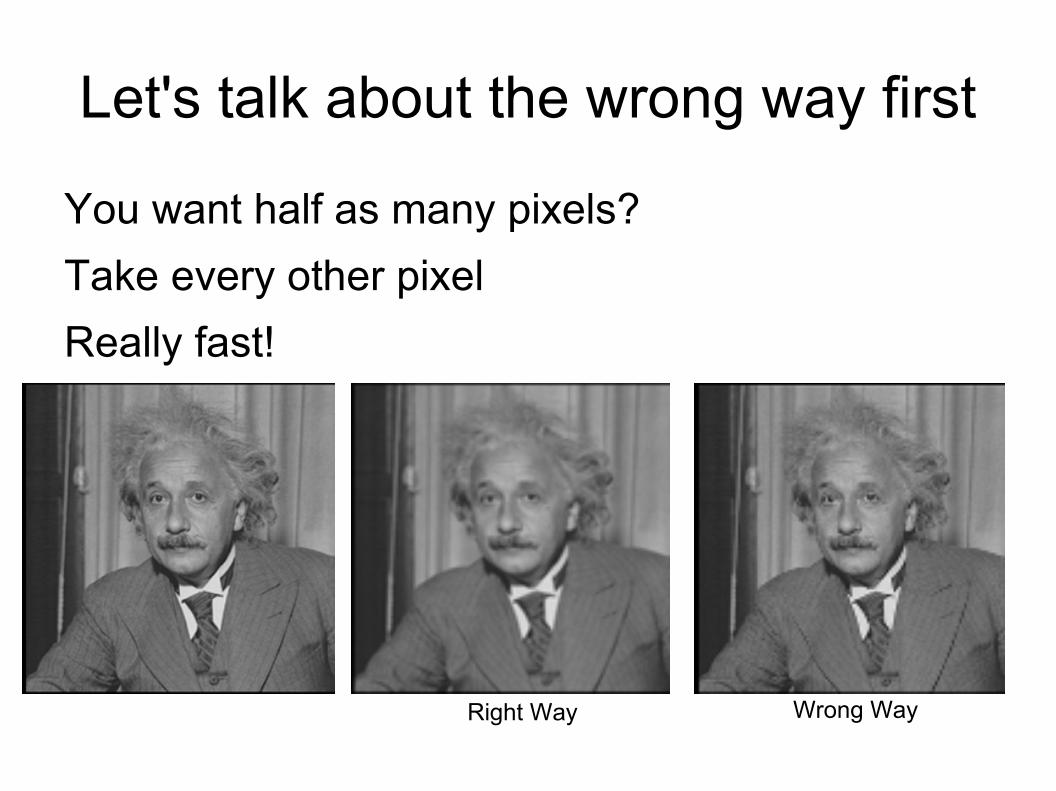
Let's talk about the wrong way first
You want half as many pixels?
Take every other pixel
Really fast!
Right Way Wrong Way
Analyzing what's going on
Fortunately, we have almost all of the pieces that we need to analyze this problem.
First, worksheet time
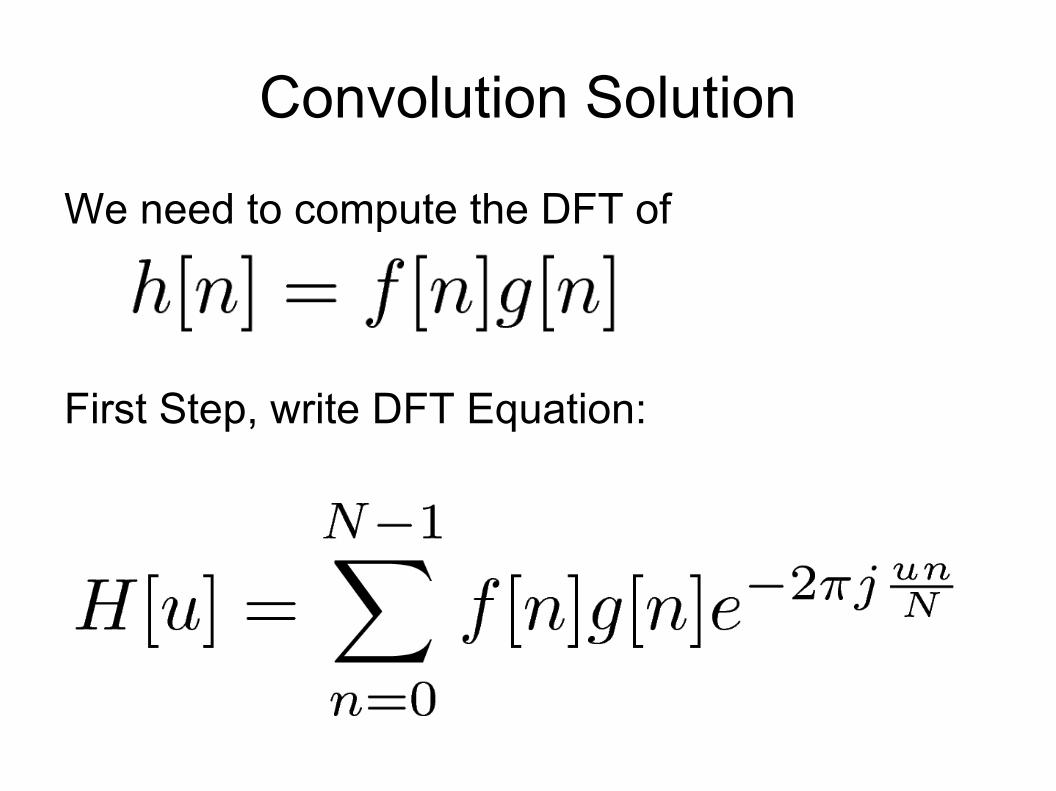
Convolution Solution
We need to compute the DFT of
First Step, write DFT Equation:
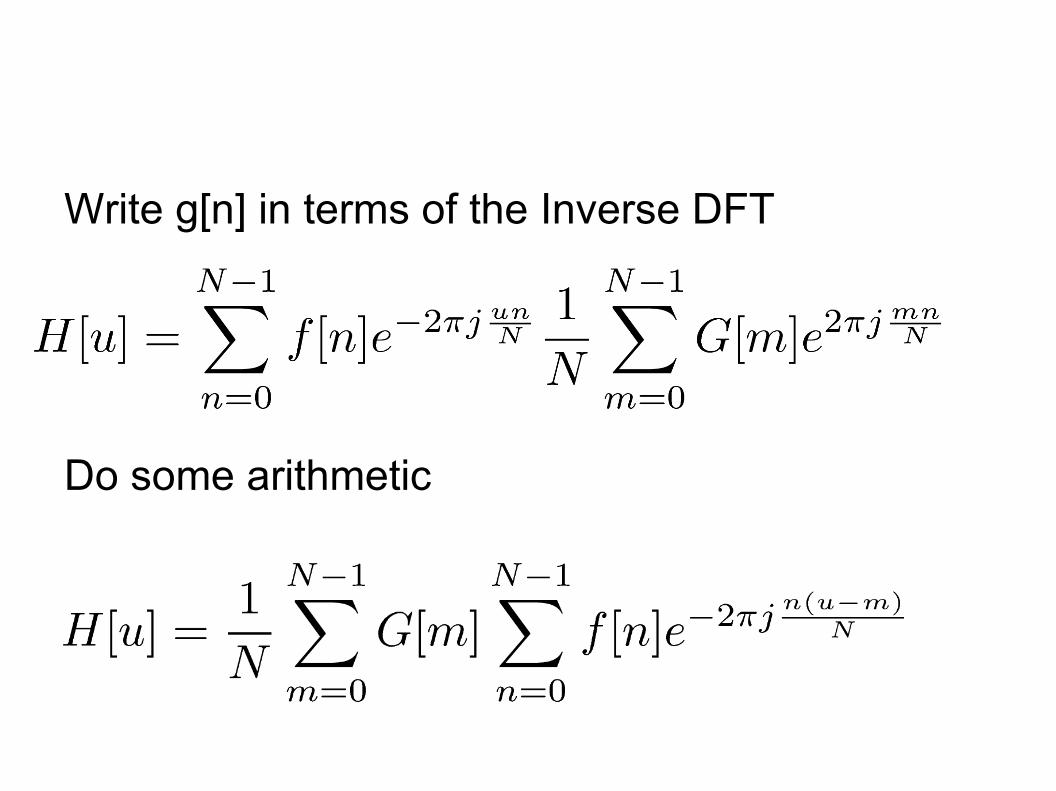
Write g[n] in terms of the Inverse DFT
Do some arithmetic
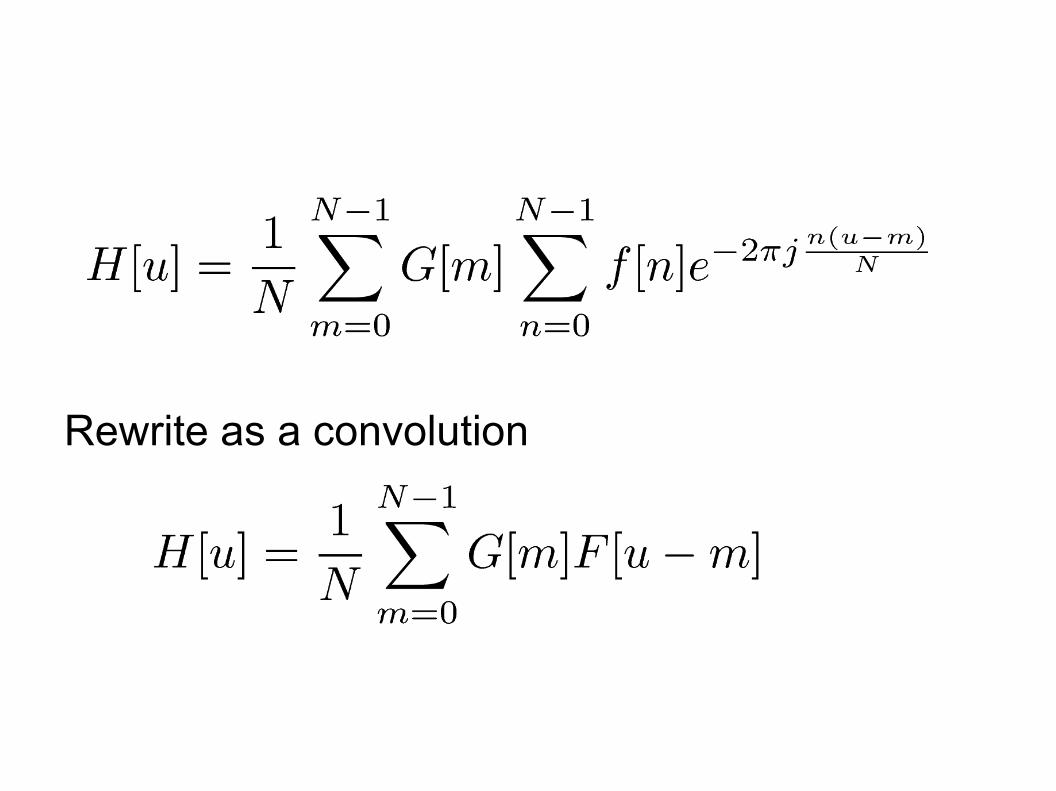
Rewrite as a convolution
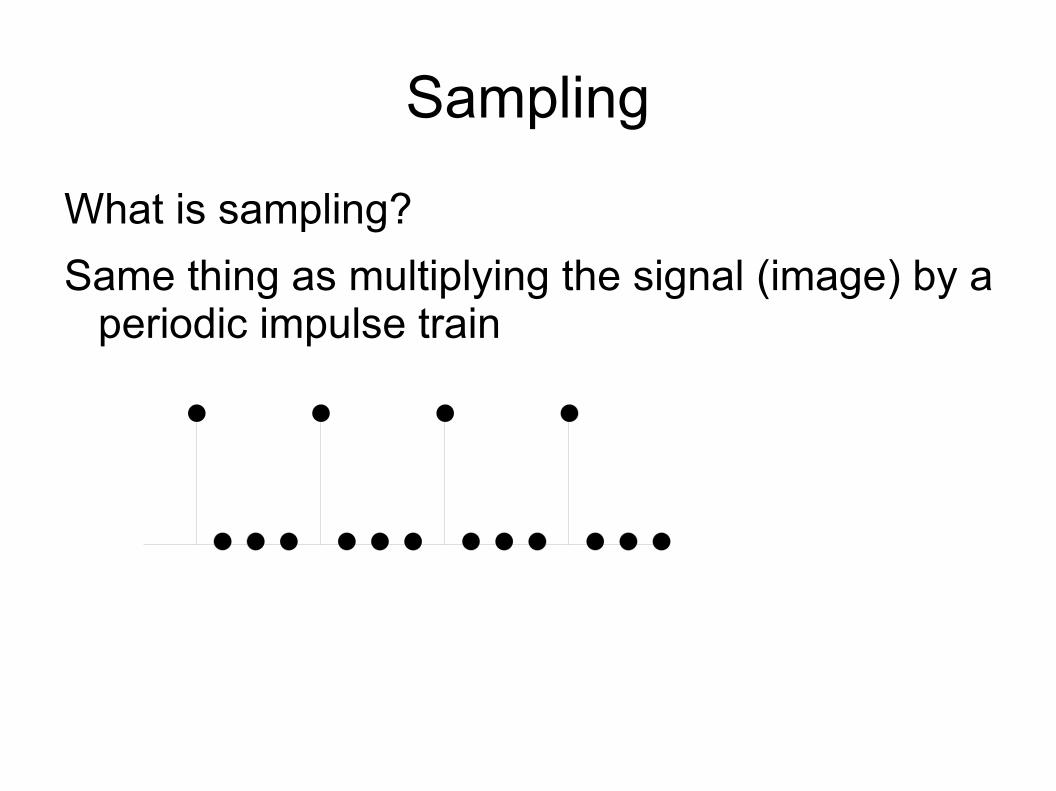
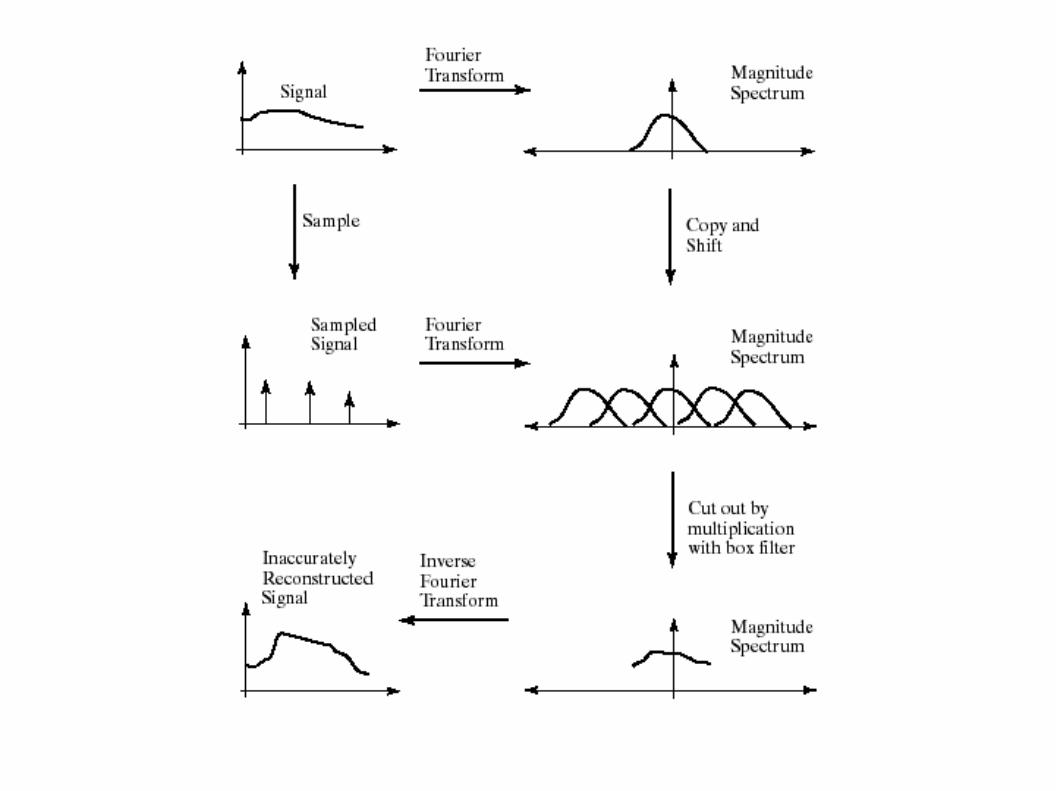
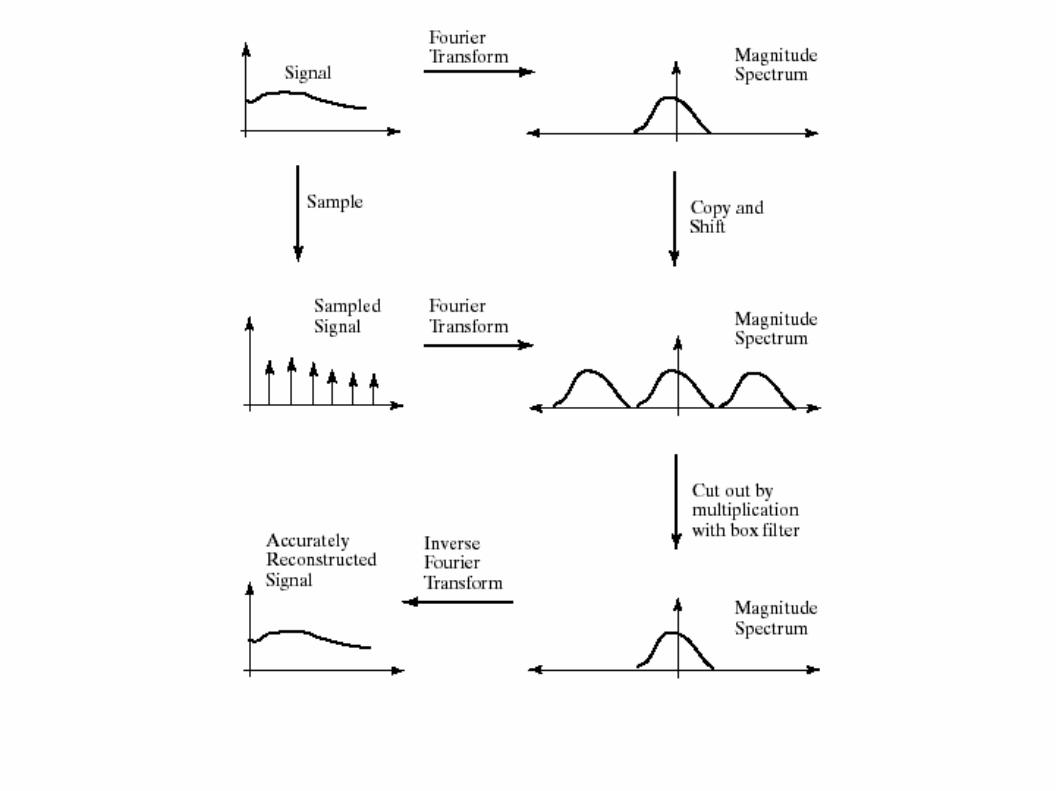
Sampling
What is sampling?
Same thing as multiplying the signal (image) by a periodic impulse train
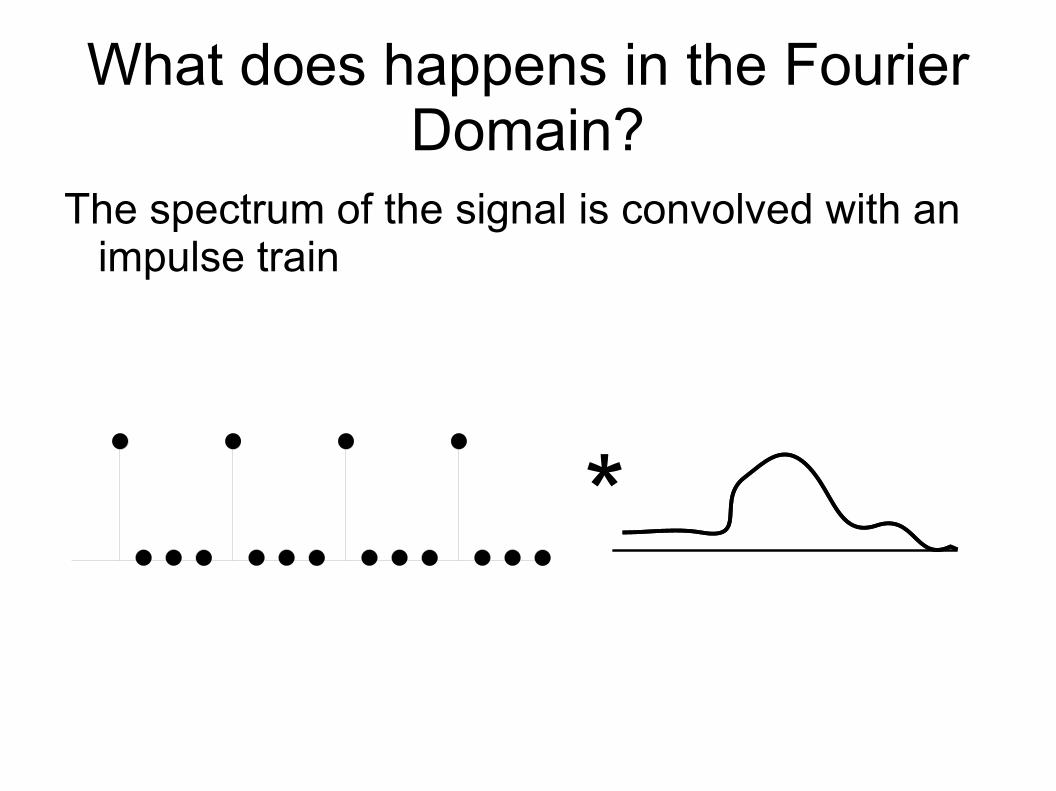
What does happens in the Fourier Domain?
The spectrum of the signal is convolved with an impulse train
*
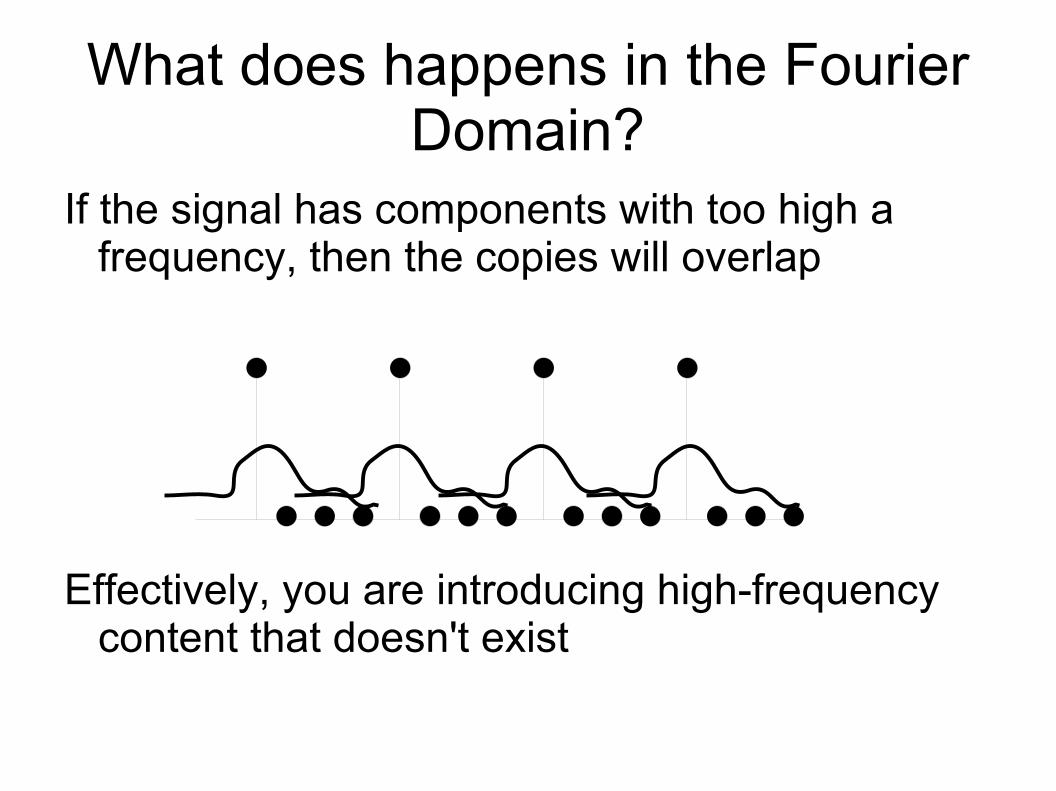
What does happens in the Fourier Domain?
If the signal has components with too high a frequency, then the copies will overlap
Effectively, you are introducing high-frequency content that doesn't exist
Aliasing
This is called aliasing
Bad high frequencies accidentally introduced by sampling
Two ways to solve
Take more samplesSpreads out the impulse train in the Fourier Domain
Make sure spectra don't overlapEliminate high-frequencies by blurring

Practical Example of Aliasing
http://www.michaelbach.de/ot/mot_strob/index.html
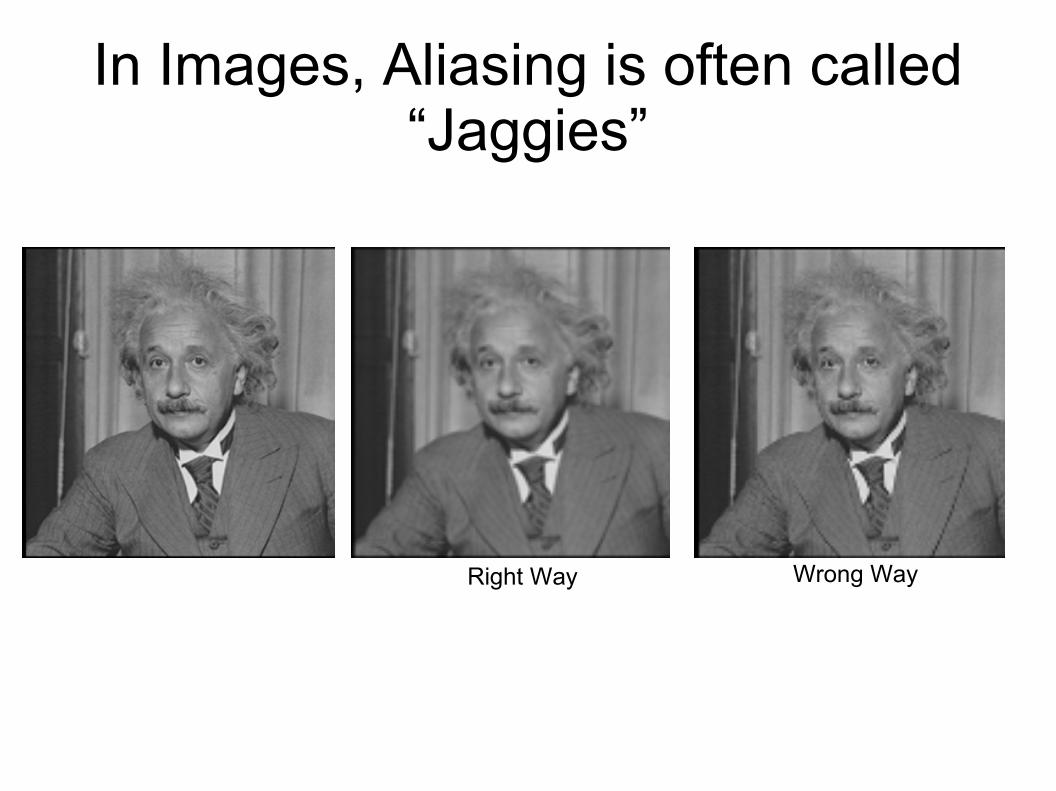
In Images, Aliasing is often called “Jaggies”
Right Way Wrong Way
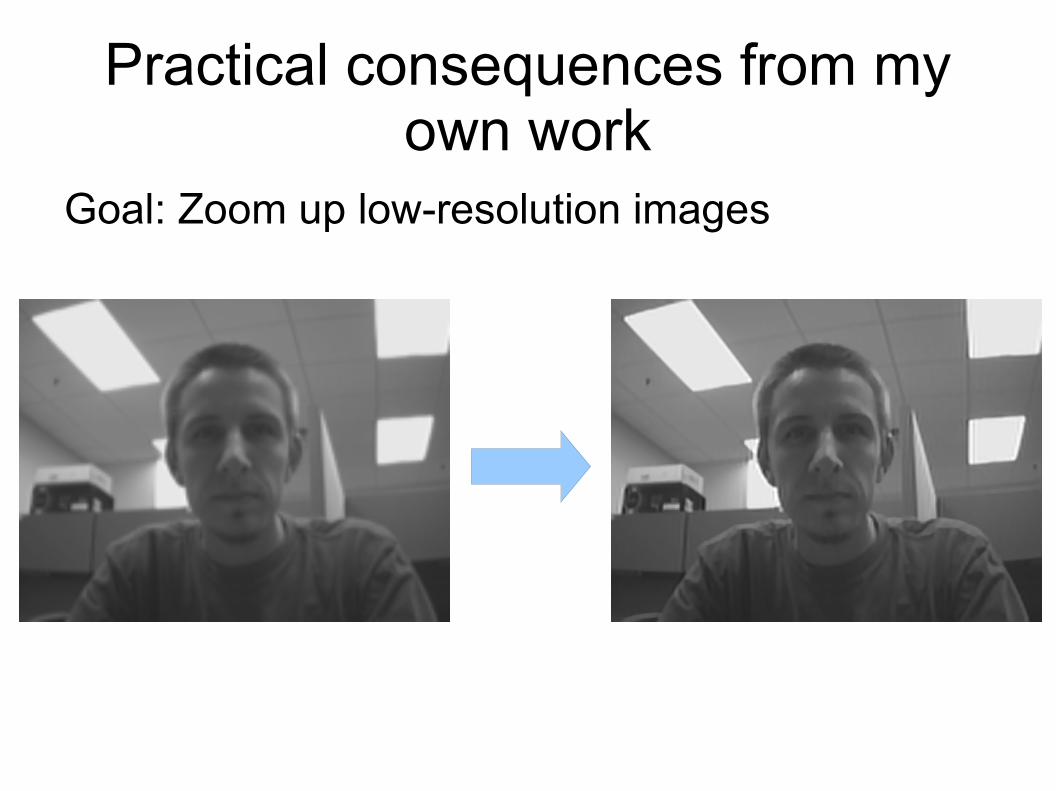
Practical consequences from my own work
Goal: Zoom up low-resolution images

Getting the blurry imageTo verify the method is working, we generate the
low-resolution image from the full resolution image
Makes a big difference in the result
Result from properly-antialiased image Result from improperly-antialiased image
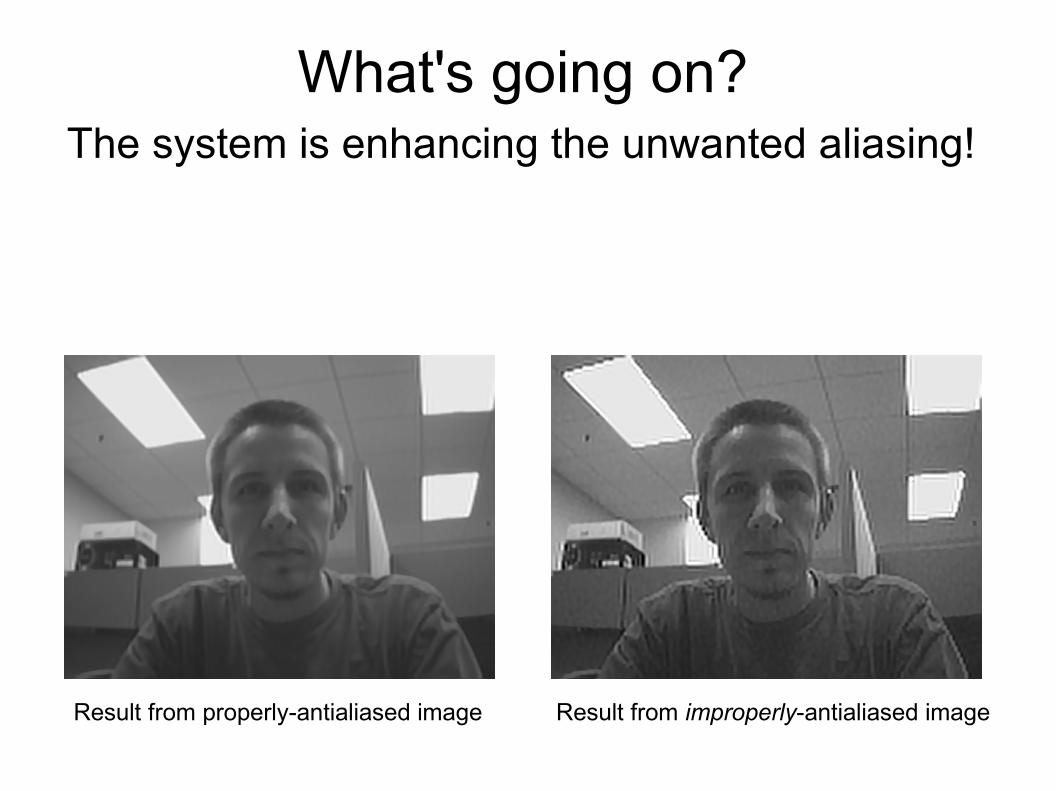
What's going on?The system is enhancing the unwanted aliasing!
Result from properly-antialiased image Result from improperly-antialiased image
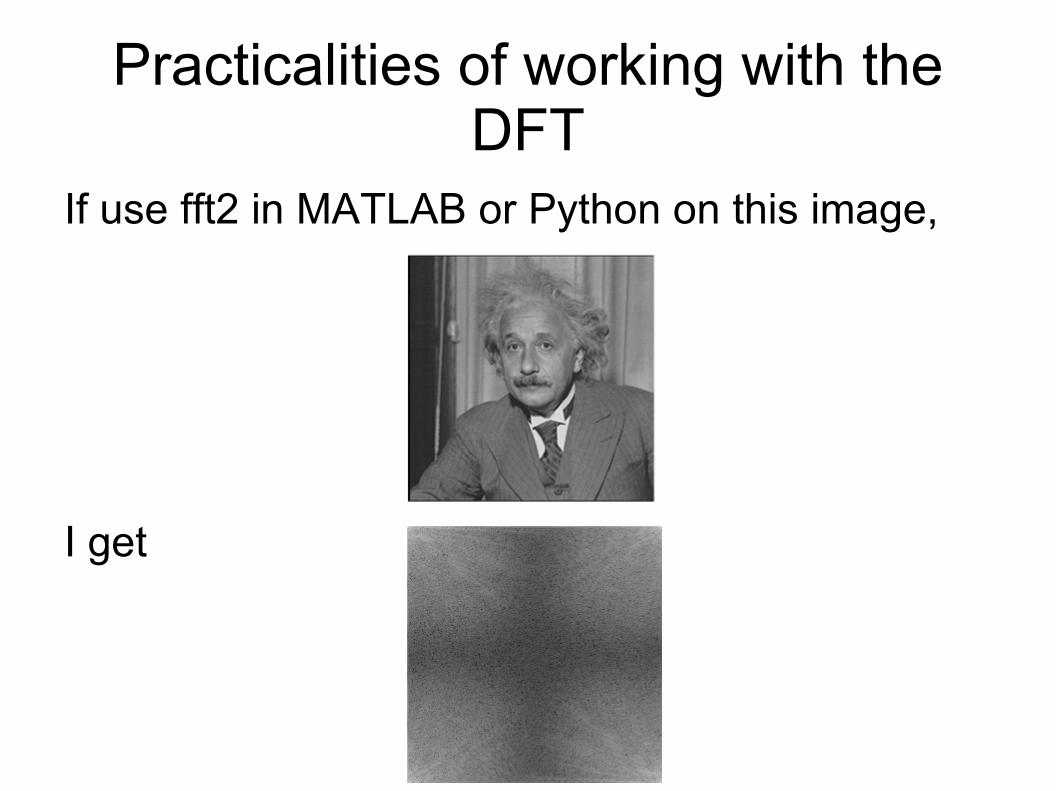
Practicalities of working with the DFT
If use fft2 in MATLAB or Python on this image,
I get
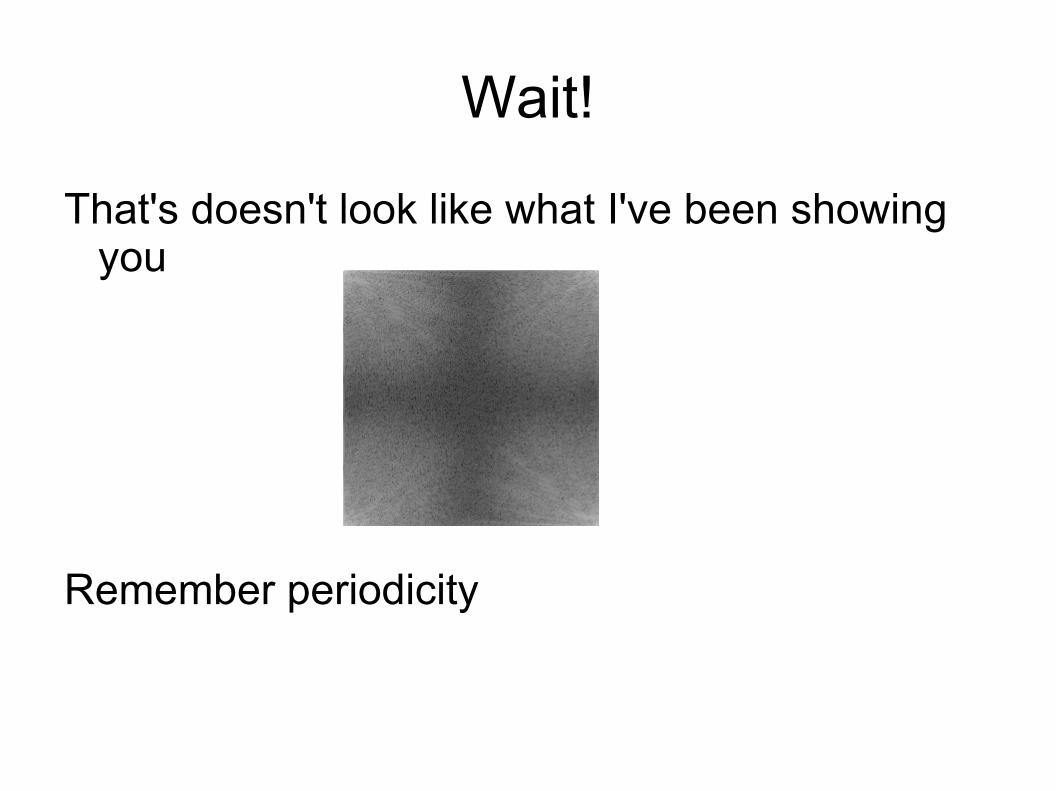
Wait!
That's doesn't look like what I've been showing you
Remember periodicity
What if you like low-frequencies in the center?
Both MATLAB and Numerical Python provide functions called fftshift and ifftshift
These shift the image so that the low frequencies are at the center.
Back to the image sharpening example
Task: Design a filter to make things look sharper
How?
Remember, high-frequencies correspond to the “sharp stuff” in images
If we boost the high frequencies, the image should look sharper
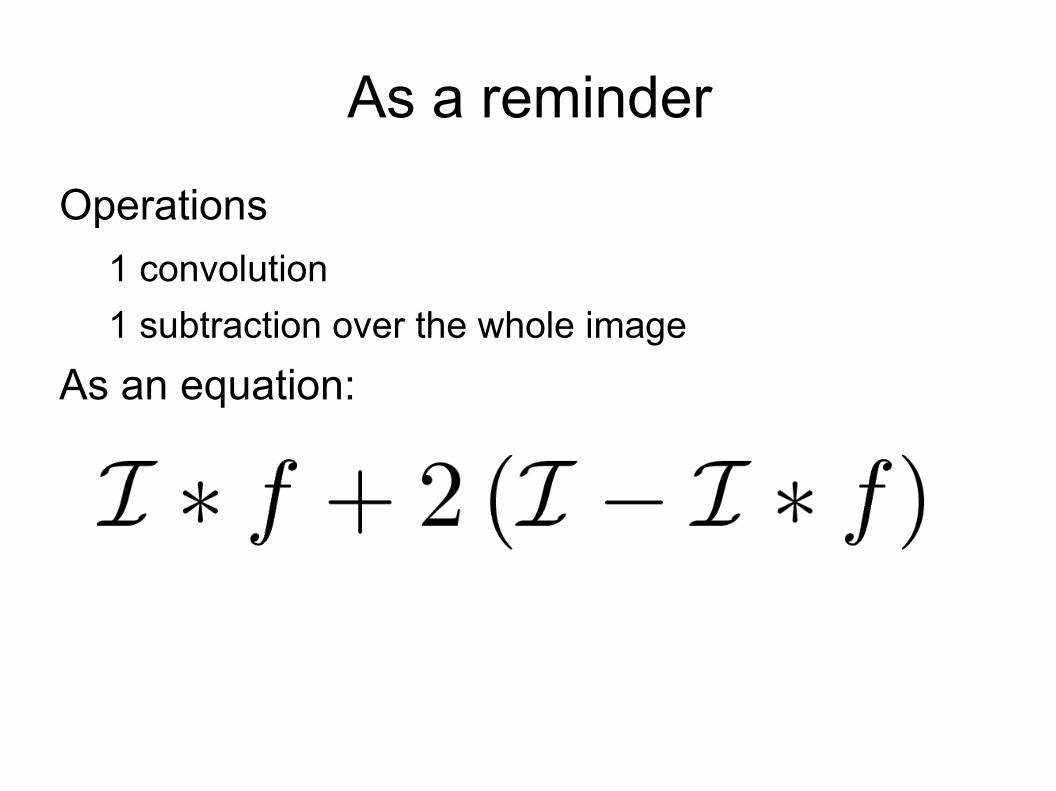
As a reminder
Operations
1 convolution
1 subtraction over the whole image
As an equation:
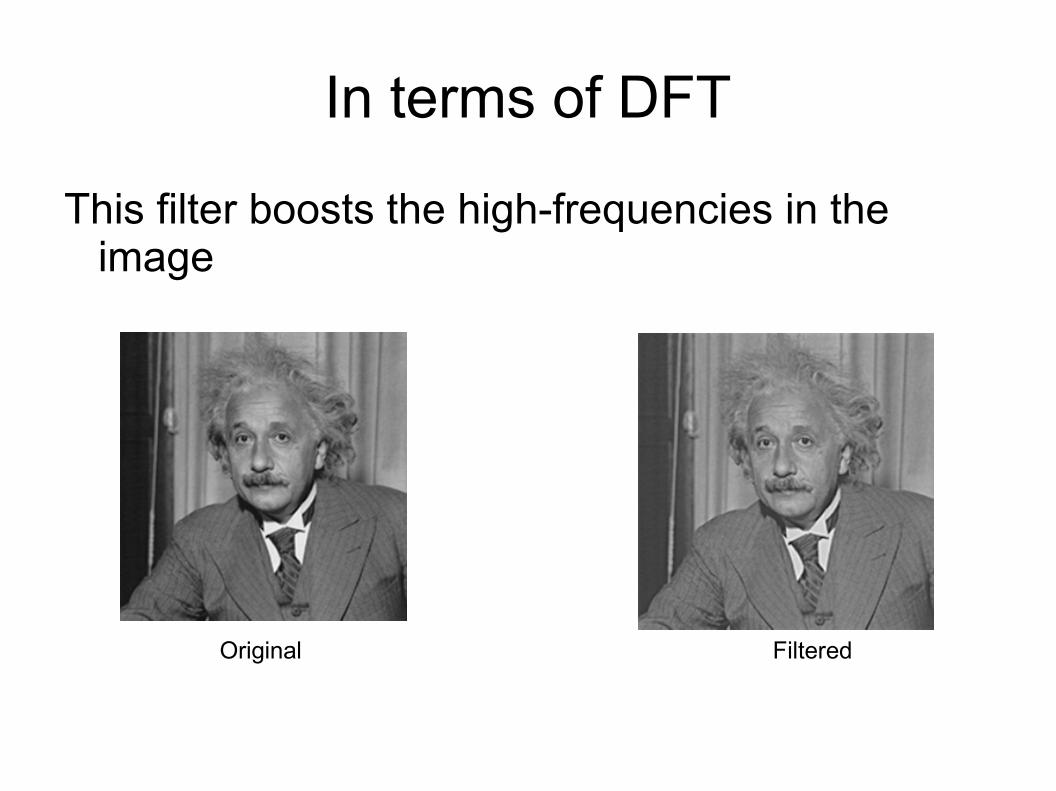
In terms of DFT
This filter boosts the high-frequencies in the image
Original Filtered