Embed Size (px)
Citation preview
Capacity analysis of complex materials handling
systems

Capacity calculation of a single conveyor sectionCapacity
The capacity of a material handling machine can be calculated from the
follow distance of two incoming unit loads (L) and the speed of the
moving unit load (v).
v
LQ = v / L
[piece/sec]

Relevant features
Reducing effect by mechanical interlockingTurntable
ADriven roller conveyors
vunit load
time
ω turntable
time
A
B C
B C
tcycle
tcycle = tmoving in + tturning right +tmoving out + tturning left
Capacity = 3600/tcycle [piece/hour]

Relevant features
Reducing effect by presence of multiple unit loads
Empty roller conveyor sections due to traffic control
vi+2th unit load
i+1th unit load
ith unit load
Sfollow
Capacity = 3600*v/Sfollow [piece/hour]
Traffic control’s principle:
If the unit load reaches end of the ith section, close down the i-1th section and free the i-2th section

Relevant features
Reducing effect by presence of branches
A
B1
Definition: Partial capacity limits for
different relations:
μAB1 = 3600 / tAB1
μAB2 = 3600 / tAB2
B2
If the actual material flows for
different relations are: AB1 and AB2
then the following equation is valid:
AB1 / μAB1 + AB2 / μAB2 1
AB1 , μAB1
AB2 , μAB2
μAB1
μAB2

Relevant features
Partial capacity limit example – opening branch
A
B1Transfer table for roller conveyor
μAB2 = 3600 / tAB2
B2
3
m
2
m
3
m
2,5
m
vunit load
time
v transfer table
time
A
tcycle
tcycle = tmoving in + ttransfer t. down +tmoving out + ttransfer t. up
Speed and acceleration data:
vunit load : 0,3 m/s aunit load : 0,2 m/s2
vtransfer t. : 0,2 m/s atransfer t.: 0,1 m/s2
4,6/0,3+0,3/0,2
2,5/0,2+0,2/0,1
3,4/0,3+0,3/(2*0,2)
2,5/0,2+0,2/0,1

Fundamentals of Production Logistic systems

Relation of materials handling and production logistics
Materials handling
Provision of materials’ transport services
Production logistic
Requirements on timing and relations
Operational characteristics of a production company
Operation in increasing market competition
Decreasing product life cycles
Continuous adaptive behavior required
Increasing product diversity
Flexible manufacturing systems
Necessity of continuously improving products and servicesRequirements on price
delivery time and reliability
Flexible materials handling and logistic services
Low stock amount and WIP ratesEconomical operation
required

Objectives of production logistic

Objectives of production logistic

Throughput time’s effect on the final value of a product
Production
coststotal
raw
material
workforce
amortizatio
n
techn.
time
techn.
time
throughput
time
wait time
wait time
value
production
cost
logistic
cost
profit
value function
production cost function
modified throughput
time
loss
value
total production
cost
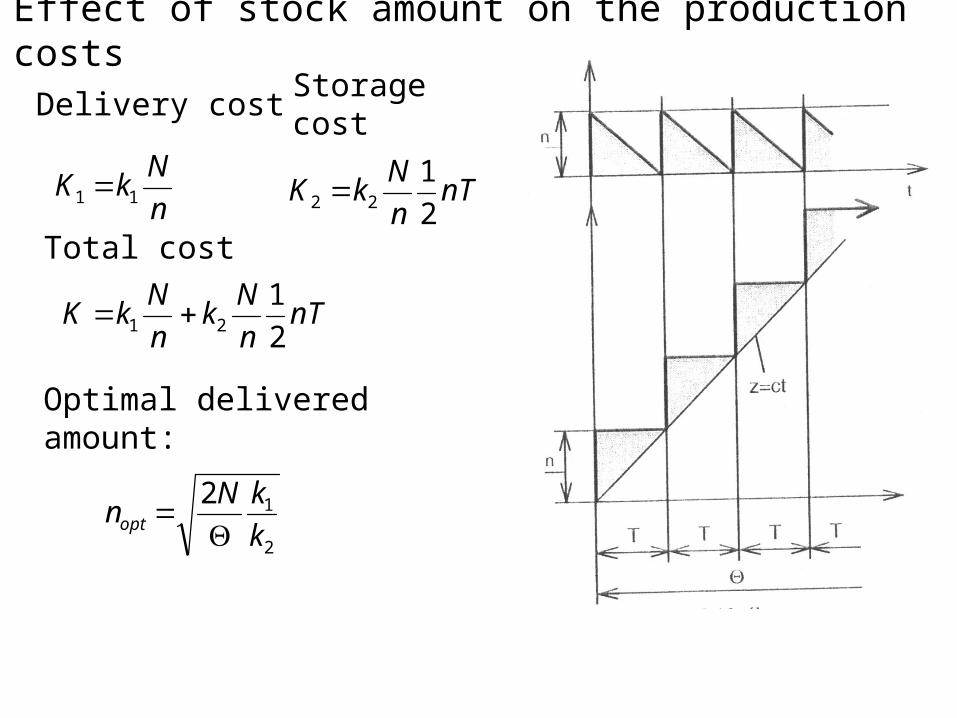
Effect of stock amount on the production costs
Delivery cost Storage cost
n
NkK 11 nT
n
NkK
2
122
Total cost
nTn
Nk
n
NkK
2
121
Optimal delivered amount:
2
12
k
kNnopt
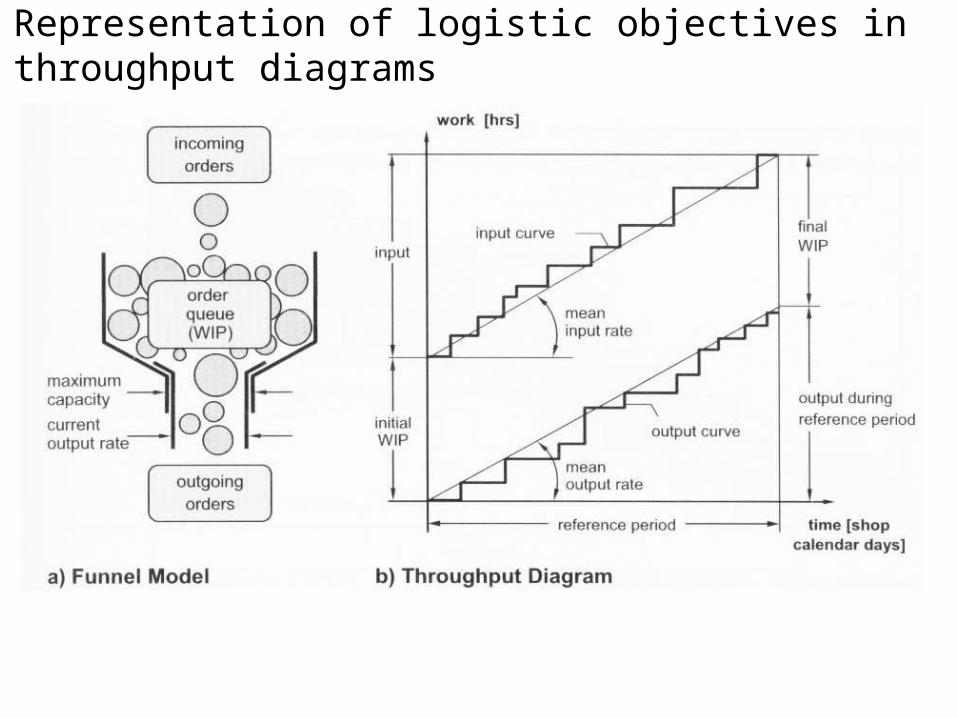
Representation of logistic objectives in throughput diagrams

Modelling possibilities of complex materials handling
systems
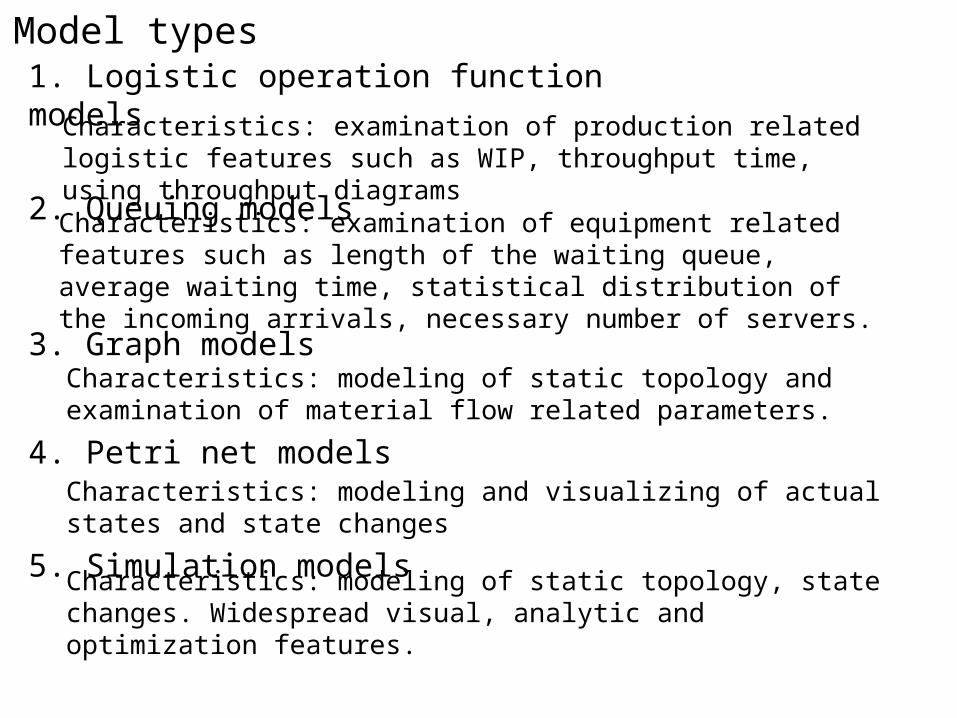
Model types
1. Logistic operation function models
2. Queuing models
3. Graph models
4. Petri net models
5. Simulation models
Characteristics: examination of production related logistic features such as WIP, throughput time, using throughput diagrams
Characteristics: examination of equipment related features such as length of the waiting queue, average waiting time, statistical distribution of the incoming arrivals, necessary number of servers.
Characteristics: modeling of static topology and examination of material flow related parameters.
Characteristics: modeling and visualizing of actual states and state changes
Characteristics: modeling of static topology, state changes. Widespread visual, analytic and optimization features.
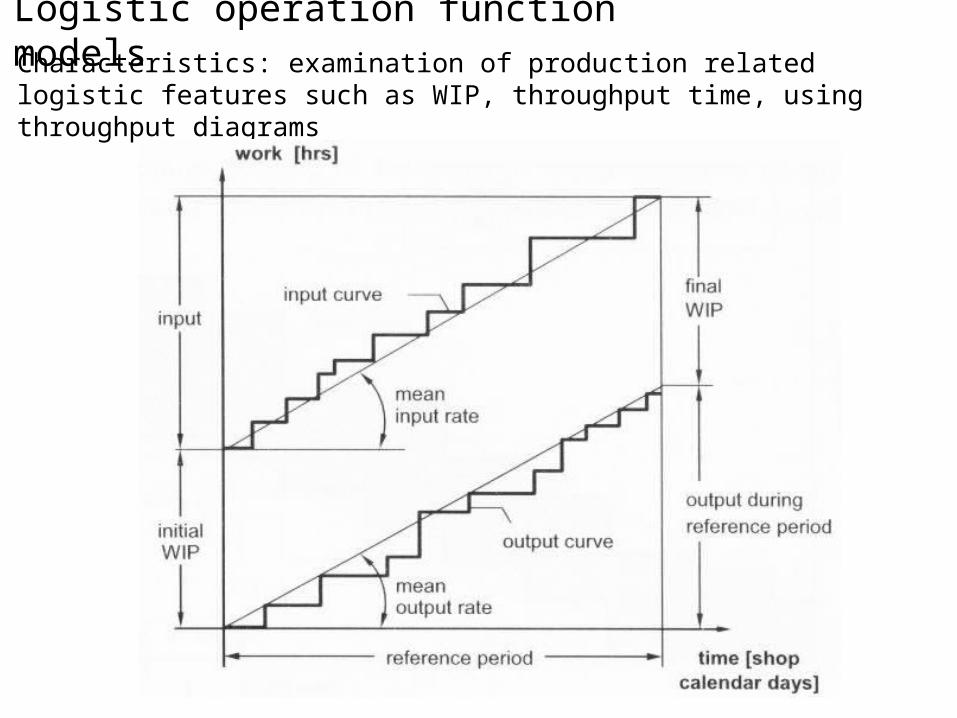
Logistic operation function modelsCharacteristics: examination of production related logistic features such as WIP, throughput time, using throughput diagrams
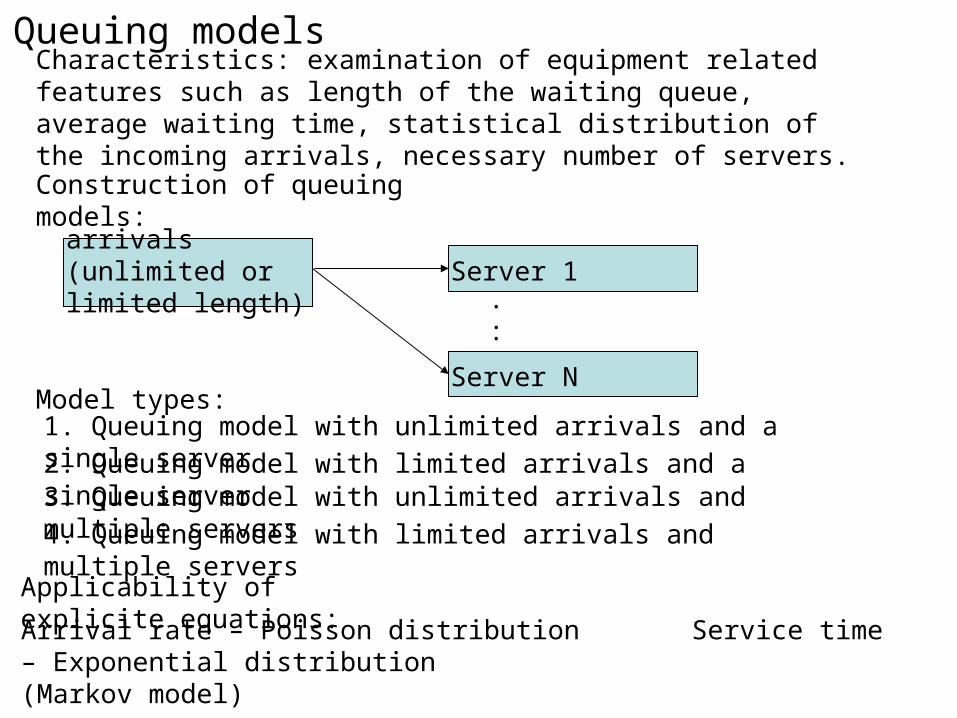
Queuing models
Construction of queuing models:
Characteristics: examination of equipment related features such as length of the waiting queue, average waiting time, statistical distribution of the incoming arrivals, necessary number of servers.
arrivals (unlimited or limited length)
Server 1
Server N
.:
Model types:
1. Queuing model with unlimited arrivals and a single server
2. Queuing model with limited arrivals and a single server3. Queuing model with unlimited arrivals and multiple servers
4. Queuing model with limited arrivals and multiple servers
Applicability of explicite equations:
Arrival rate – Poisson distribution Service time – Exponential distribution(Markov model)

Queuing modelsM/M/1 queuing model: arrivals (unlimited length) Server
Calculation of optimal service rate:
Cost components

Queuing modelsM/M/S queuing model:
arrivals (unlimited length)
Calculation of the number of optimal servers:
Server 1
Server N
.:
Graph models
Directed graphs – for modelling continuously operating materials handling machines
Undirected graphs – for modelling non-continuously operating materials handling machines
Graphs: set of objects, where some pairs are connected by links.
Characteristics: modeling of static topology and examination of material flow related parameters.

Graph models
Mathematical representation of graphs using adjacency matrix.
5
2
3
4
6
1A =
12
5
3
4
1 2 3 4 5 6
1 -1 12 1 -1 13 -1 -1 -14 1 -15 1 1
Material flow related parameters:Material flow intensity vector: µ [piece/time unit] Nodal material flow intensity vector: µn [piece/time unit]
Relationship between µ and µn: µn = A µ
Example: roller conveyor system for unit loads having different traveling order.


![FXTQ-PA Air Handling Unit - daikinac.com · Capacity Tables EDUS391000-F12 10 FXTQ-PA 6. Capacity Tables 6.1 Cooling Capacity FXTQ-PA [Cooling capacity] Unit size Outdoor air temp](https://img.pdfslide.net/doc/110x75/5cab3caa88c993135e8d1589/fxtq-pa-air-handling-unit-capacity-tables-edus391000-f12-10-fxtq-pa-6-capacity.jpg)