Embed Size (px)
Citation preview

Capacity building and institutional development in higher education in Kenya

This monograph is part of the Institute's research on 'Improving the managerial effectiveness of higher educational institutions',
directed by Bikas C. Sanyal, HEP
Capacity building and institutional development in higher education
in Kenya
A case study of Public Universities Investment Project
(1991-1994)
by
S h e m Oyoo Wandiga
Paris 1997
U N E S C O : International Institute for Educational Planning

The views and opinions expressed in this booklet are those of the author and do not necessarily represent the views of U N E S C O or of the H E P . T h e designations employed and the presentation of material throughout this review do not imply the expression of any opinion whatsoever on the part of U N E S C O or H E P concerning the legal status of any country, territory, city or area or its authorities, or concerning its frontiers or boundaries.
The publication costs of this booklet have been covered through a grant-in-aid offered by U N E S C O and by voluntary contributions m a d e by several M e m b e r States of U N E S C O , the list of which will be found at the end of this report.
This volume has been typeset using IIEP's computer facilities and has been printed in IIEP's printshop
International Institute for Educational Planning 7 - 9 rue Eugène-Delacroix, 75116 Paris
© UNESCO November 1997 IIEP/sh

Preface
This report is a desk study undertaken by Professor S h e m O y o o Wandiga during his stay at the H E P as a Visiting Fellow. It forms part of the H E P research programme on 'Improving effectiveness of higher education institutions: studies of the management of change'.
This research programme, which began in 1990, arose out of the need for universities, especially those in developing countries, to cope with their rapidly changing socio-economic situations. A s a result of financial stringency, combined with demands for expansion of enrolments and improved efficiency, higher education institutions have been forced to reduce expenditure, seek new sources of funding and improve the utilization of existing resources.
This has necessitated changes in the mechanisms, techniques and styles of institutional management. At the same time, higher education has had to cope with increased diversification and n e w types of students, including adult learners, so as to meet the changing needs of the labour market and foster closer links with industry as well as widen participation through the introduction of distance learning.
Several types of innovation and change were pinpointed for particular study, i.e.
(i) Change in the organization of institutions • N e w forms of decision-making structures and information flows. • The merger of separate institutions, departments or units.
v
Preface
(ii) Changes in financial management and resource allocation • Devolved budgeting. • Resource generation.
(iii) Changes in educational delivery systems • F r o m semester to trimester, from block to credit system,
rationalization of curricula, double intakes.
(iv) Changes in staff management, including staff development and appraisal.
Professor Wandiga's study falls under category (ii), financial m a n a g e ment at the system level, covering the public universities of Kenya, designed to complement the experiences at institutional level described in other H E P monographs on the topic. This study also provides answers to some of the questions raised in the case study 'The management of double intakes: a case study of Kenyatta University, Kenya' .
The present study is the result of the work done by the Policy Planning Task Group set up in the Republic of K e n y a in 1991. It focuses on:
(i) the present situation of the universities with special emphasis on financial management;
(ii) the preparation of an investment programme of the public universities including prioritization and selection of projects submitted by universities, project costing and assessment and project negotiation. It also includes a list of difficulties faced in each stage;
(iii) the reforms in the student loan scheme, including a very detailed analysis of the methods of recovering student loans exploring alternative scenarios through simulation models;
VI

Preface
(iv) the financial management process of the public universities with special emphasis on income generation; and, finally,
(v) the lessons learned from the study for use in the management of higher education in general and of finance in particular.
Written by an authoritative person in African higher education involved in high-level policy-making bodies in this area within the country and abroad, this study, I a m sure, will contribute substantially to the knowledge base in higher education management in developing countries. I a m indeed grateful to the author for contributing this study to the H E P .
Jacques Hallak Assistant Director-General, U N E S C O
Director, H E P
vu

Contents
Preface v
Acknowledgement 11
Chapter I. Introduction 13
1. The public universities 13 2. University reform 15 3. Higher education system 19 4. Planning, programming, budgeting
and funding of public universities 20
Chapter II. Project preparation 23
1. Introduction 23 2. Universities Investment Project 23 3. Harmonization of legal framework 32 4. The Students' Loan Scheme 39 5. Promotion of private universities 41 6. Promotion of post-secondary training institutions 42 7. Development of centres of excellence 42 8. Universities Central Services Programme 43
Chapter HI. Reforms in the Students' Loan Scheme 45
1. Resistance to reform 45 2. Evidence for reforms 46
IX

Contents
Chapter IV. The planning process for public universities 68
1. Planning guidelines 69 2. Operating budget guidelines and
special requirements for public universities 71 3. Status quo of university education 74 4. Mobilizing finance 80 5. Financial management 92
Chapter V . Implications for university education reforms in Kenya 99
1. Lessons from experience 99 2. Implications for the future 108
Appendix 1. Summary of report on the review for the establishment of an institution to manage the university students loan scheme. 110
Appendix 2. Planning and budgeting: some key concepts 116
Appendix 3. List of items looked at by institutions in planning 127
Appendix 4. Brief on Kenya Public Universities Investment Project 161
x

Acknowledgement
This booklet describes the work done by the Policy Planning Task Group (PPTG) during the period 1991 to 1994. The P P T G Secretariat is thanked for the work and organisation of the tasks. Several Committee members from the public universities whose participation made the task passable and their contributions are sincerely thanked.
The assistance of Professor Antony J. Rodrigues, Messrs. A Laloui and Rajinder P.S. Chana in the refinement and development of the Financial Simulation Models and the Quality Assessment Model is highly recognized and appreciated.
Lastly, the author is grateful to M r . Benjamin K . Kipkulei for the confidence he showed in the Task Group as Permanent Secretary, Ministry of Education. His advice and guidance was invaluable.
Above all, I a m grateful to m y wife Regina and children and to all the young people in Kenya for their inspiration.
S. O . Wandiga Paris, October 1997
XI

About the Author
Shem Oyoo Wandiga was born in 1939 at Kendu Bay, South Nyanza, Kenya. H e received his early education in Kenya before proceeding to the United States of America, where he obtained Bachelor of Science (Howard University), Master of Science (University of Maryland), and Doctor of Philosophy, P h . D . (Case Western Reserve University). H e then returned to Kenya in 1972 and joined the University of Nairobi as Lecturer in chemistry, the Institution he still serves as professor of chemistry.
H e has served as Chairman of the Department of Chemistry, Principal of the College of Biological and Physical Sciences and Deputy Vice-Chancellor (Administration and Finance) of the University of Nairobi. In 1991 he was appointed Co-ordinator of the Policy Planning Task Group of the Ministry of Education. This book is a case study of this World Bank Credit project to strengthen public universities in Kenya.
In 1995 Professor Wandiga was elected Kenya's Representative to the United Nations Educational, Scientific and Cultural Organization ( U N E S C O ) . In 1996 he was elected member of the General Committee of the International Council of Scientific Unions. H e is the current Chairman of the Kenya National Academy of Sciences. H e is also the Chairman of the Kenya National Committee of the International Geosphere Biosphere Programme. In addition he has been awarded the E B S by the Kenya Government.
Professor Wandiga's research interest lies in environmental chemistry and co-ordination chemistry. H e has published over 80 papers in these areas. H e has chaired several national committees on university education and has been a consultant to a Kenya Government/World Bank project on financing tertiary education; to the United Nations Environment Programme in a project on Methodology for development of environmental standards.

Chapter I
Introduction
1. T h e public universities
The high prestige and esteem that the public universities in Kenya enjoyed in the 1970s and early 1980s no longer exists, caused by a plethora of problems. Today, public universities are seen as institutions that are nearly on the brink of collapse and almost beyond help.
S o m e of the problems facing public universities include:
(a) Overcrowding and strain on available facilities as a result of double intakes in the 1987/88 and 1990/91 academic years in order to eliminate the backlog and accommodate both the 7:4:2:3 and 8:4:4 secondary education level candidates.
(b) Deterioration in the quality of education as a result of resource scarcity, overworked academic staff, lack of physical facilities for teaching, etc.
(c) Restriction of admission numbers to 10,000 students or less has resulted in the closing of university doors to m a n y qualified students w h o could benefit from university education.
(d) Frequent closures of universities have lengthened the academic programmes beyond the normal time of three to four years.
(e) Improvement of private universities by obtaining charters, course offerings and shorter course periods.
13

Capacity building and institutional development in higher education in Kenya
The government and the university institutions have m a d e efforts to overcome these problems by reviewing policies on university financing, governance, administration, etc.1,2,3 although some of these changes have met stiff resistance from the public and the student community. O n e of the salient aspects of revised policy includes the introduction of increased cost-sharing; as the government's budget on education becomes stretched beyond its ability to fully pay all the costs for higher education, it is hoped that the beneficiaries - that is, the students - will contribute to the cost of their education.
The inability of the government to provide adequate financial resources has resulted in the payment of low salaries to teaching staff, shortage of library materials, teaching and research equipment, etc. However, the requirement of cash payment by poor people, w h o are struggling to survive under stiff structural adjustment programmes, denies equal university access to a great number of potential students. In practice, the poor m a y not be receiving bursaries for m a n y reasons, including weak administrative structures, the number of people involved and individual and family choices not to forgo income at a time of great need.
For its part, the government is forced to m a k e choices and prioritize spending. Recommendations include increased cost-sharing, establishment of private educational institutions and reallocation of funds from higher education to primary and secondary levels. These changes in government spending m a y not be sufficient, given the magnitude of the problem; it m a y be necessary to mobilize funding from other sources - such as reducing military expenditure, eliminating corruption, debt-write-offs, etc.
Proposed changes in education, along with those already taking place, will influence the future of higher education for a long time. O n e such change relates to the relation between the fee-paying university student and the academic staff. It is easy to imagine that the student will demand a bigger role in the administration of the university and the choice of course programme offers. Issues of staff tenure will become m u c h more contentious and the quality of education will become the centre stage for all future
1. Republic of Kenya, Ministry of Education. University Education in Kenya. Request for World Bank Credit, June 1991.
2. Staff Appraisal Report. Kenya Universities Investment Credit. World Bank Report N o . 9 8 2 4 - K E , 7 October 1991.
3. Universities Investment Project (UIP). Credit Agreement N o . 2 3 0 9 - K E , 1991.
14

Introduction
university operations. Only those university institutions offering quality education at affordable cost will survive.
Other issues, such as gender disparity (especially for female students), disadvantaged groups, relevance of academic programmes and research output will become more and more important as changes in university education are implemented. For these reasons, reforms in university education require special attention - not only by the educators but by everyone concerned. Understanding the issues is essential if w e are to m a k e meaningful suggestions for change.
2. University reform
In 1987, the Kenyan government m a d e a policy decision to enrol a double first year class into the public universities in order to clear the entrance backlog created from a long period of closure of the universities, which was a result of the participation of some students and academic staff in the attempted coup of 1982. A second reason for admitting a double class was that the education system had changed from 7:4:2:3 to 8:4:4. In other words, instead of a student taking seven years at primary, four years at secondary, two years at higher secondary, and three years at university, the system changed so that primary education took eight years, secondary four and university four. The first cohort of 8:4:4 students was expected to enter the university cycle in 1990, together with the last cohort of ' A ' level (higher secondary) students.
The decision of the Kenyan government to have a double intake in 1987 m a d e both political and academic sense. It relieved the government of political pressure from parents w h o were tired of having their university-qualified students stay at h o m e for one year. Academically, the transition from the old education system to the n e w one would not have worked if this had not been done. It would have meant running two parallel systems at the university cycle for a number of years.
In some ways, however, the decision to admit a double intake of students into the public universities was the beginning of the end of quality university education in Kenya. The policy decision was sound, but it was not always implemented effectively. In order to understand this view, let us review the prevailing university operations at the time.
15

Capacity building and institutional development in higher education in Kenya
Public university education was enjoying a steady expansion in both institution numbers and student growth. There were three university institutions in the 1985/86 academic year, with a total student enrollment of 7,624 - the University of Nairobi, M o i University and Kenyatta University - with student enrollment figures of 5,174, 111 and 2,339 respectively4. In the 1986/87 academic year, a fourth university institution, Egerton University, w a s established by Parliament. Total student enrollment increased to 8,804, a 15.5 per cent increase, with student populations of 5567, 287, 2813 and 137 respectively at Nairobi, M o i , Kenyatta and Egerton Universities.
It is of great interest to educational planners that the student numbers were not stabilized, but continued to rise rapidly. In 1987/88, the double intake year, student enrollment almost doubled, increasing to 15,337 (a 74.2 per cent increase). In the following academic year, 1988/89, the student population increased further to 19,900 (a 27.8 per cent increase). During this academic year, the four university institutions plus the absorbed tertiary institutions, such as the Secretarial College at Parklands, were absorbed into the University of Nairobi, which could not cope with the student numbers. A fifth university institution, the J o m o Kenyatta University College of Agriculture and Technology, was then established, with a student enrolment of 120. The student population at the University of Nairobi had grown to 9,581, and Kenyatta University was a close second, with 6,124 students. M o i University saw a phenomenal increase in student numbers, from 971 to 2,119 students, after its first Chief Executive was replaced. Egerton saw its student population jump from 691 to 1,956 in the same year. The sacking of the M o i University Vice-Chancellor seemed to exasperate all the other vice-chancellors, w h o concluded that one dare not try to understand - or even question - the phenomenal increase in the number of students.
The rapid student population growth did not stop there, and in the 1989/90 academic year the increase was 15.8 per cent, making a total of 23,048 students in all public university institutions. The critical double intake year of 1990/91 saw another phenomenal growth in student population to 38,848, an increase of 15,800 students or 68.6 per cent. During this year a sixth university institution, the Maseno University College, w a s created. T h e Laikipia Teachers Training College was absorbed as a campus college of Egerton University, while Nairobi University acquired most of Kenya
4. Republic of K e n y a , Ministry of Education, 1991. op. cit.
16

Introduction
Institute of Administration to absorb its C o m m e r c e Faculty as a campus. Diversification in higher education was sacrificed at the expense of
university expansion. Not only was this sacrifice m a d e , but the public universities were bursting with students, and could no longer cope with normal academic functions. There was a general shortage of academic staff, lecture theatres and laboratories, as well as the financing to keep them operating properly.
Public universities had last prepared development plans in 1975, the year that the last Universities Grants Committee5 submitted its report; there were no universities development plans between 1975 and 1987. In cases where individual plans existed, as in M o i University, they were discarded and could no longer be followed. The Commission for Higher Education ( C H E ) w a s established in 1 9 8 5 6 , concentrating its work on private universities, although it had been given powers to supervise public universities activities.
W h e n the government announced its double intake policy there was no plan to guide it. In essence, a lack of dialogue, reasoning and planning on major aspects of university expansion policy stifled implementation and brought about a sense of dissatisfaction with the policy.
T h e chief executives of the universities formed a very powerful committee - the Vice-Chancellors Committee - which planned, accepted government policies, and implemented them without discussion. In m a n y cases it usurped the statutory powers of Senate and Council, although it had no legal powers itself whatsoever. Its acceptance of the double intake policy was final for it negotiated and approved on behalf of the universities the proposal that the government would give a one-third increase in physical facilities, personnel, and financial resources.
In fact, there m a y have been no basis for this proposal, since in 1987 the universities were using only about 60 per cent of the available physical facilities. There were no Full-Time Student Equivalent (FTSE) calculations undertaken to base the increase of staff posts on a figure of one-third. Worse still, none of the universities had financial plans. The one-third funding increase policy has greatly contributed to the worsening of the financial position of public universities and deterioration of quality of academic standards in the same institutions.
5. The Second Report of the Universities Grant Committee, 1983. Unpublished. 6. The Universities Act, 1985. (Cap210B).
17

Capacity building and institutional development in higher education in Kenya
In m a n y countries, a Vice-Chancellors Committee is treated as a powerful lobby group and is registered as such, but is not given free hand. In Kenya, however, this committee wields considerable power on matters such as admissions, for which the committee has no legal authority (the Joint Admissions Board, chaired by the Chairman of Vice-Chancellors Committee has no legal status). This situation has occurred because of the protection given to the Chairman of Vice-Chancellors Committee by the Chancellor. If this were not so, m y personal belief is that m a n y Kenyans would have challenged the decisions of this body in a court of law.
The increased student population in public universities and lack of academic staff forced the universities' administrators, with the support of the government, to send a team of six professors and administrators to visit the United Kingdom, Germany, the United States of America, Canada and India to recruit staff7. S o m e 491 qualified potential academic staff were identified for recruitment into our public universities, of which only about 20 were finally recruited. W h e n the mission returned, it was surprising to find that a decision had been taken to lower the entry requirements into the academic profession by recruiting local Master's holders into lectureship or assistant lectureship posts. M a n y of this same staff would stage a strike against the universities during the 1993/94 academic year demanding improved terms of service and the registration of a union.
It is important to note that there is a lack of an evaluation process in the public universities that would apportion blame on the contribution of staff to the poor academic standards prevailing in Kenya's public universities. However, it was cheaper to hire academic staff to teach the increased student numbers than to purchase equipment, complete construction of buildings, etc. This has cheapened the value of academic staff.
The working conditions and financial position of public universities deteriorated so m u c h that by 1990 the government agreed to approach the W o r l d B a n k for a Structural Adjustment Credit for the public universities8,9,10. After several months of negotiations between the government and the World Bank, a World Bank mission arrived in Kenya in June 1990. The universities presented to the mission their estimated request
7. Universities Staff Recruitment. Mission Report. 1989. 8. Republic of Kenya, Ministry of Education, 1991. op. cit. 9. Staff Appraisal Report, 1991. op. cit. 10. Universities Investment Project, 1991. op. cit.
18

Introduction
of U S $ 600 million, which was rejected outright. Before it left, the mission agreed to consider a modest credit request of about U S $ 60 million, provided policies on a body to centrally administer c o m m o n university functions -such as student enrollment, academic programme, students loan scheme and project investment programmes - were worked out. The mission insisted that a committee, to be chaired by a university official, be formed to work out the above details with Ministry of Education officials. T h e Vice-Chancellors Committee accepted the mission's recommendation and appointed the Principal of J o m o Kenyatta University College of Agriculture and Technology as the Chairman.
The government and the mission accepted the date of the next mission visit as September of the same year. W h e n the mission returned in September it found no document as promised. It was at this meeting in September that I was appointed by a ministry official to chair the ad hoc committee. The rest of this case study deals with the work and experience of this working group, which was named Policy and Planning Task Group ( P P T G ) in June 1991.
3. Higher education system
Despite the neglect of non-university education during the last decade and conversion of s o m e colleges to university campuses , K e n y a still has one of the m o r e diversified higher education systems in Africa. Higher education institutions consist of 17 university-level and about 160 other institutions, namely:
(a) four public universities and two university constituent colleges (with 4 1 , 0 0 0 students, including 3 9 , 0 0 0 undergraduates and 2 , 0 0 0 postgraduates);
(b) eleven private universities (with 4,000 students); (c) eighteen public teacher training colleges (15 primary, with seven m o r e
under construction, and three secondary, with 19,000 students); (d) three private primary teacher training colleges (with 300 students); (e) three public national polytechnics (with 5 ,000 students); (f) other public training institutions, run by various government ministries
(52 with 13,000 students); (g) private training institutions (84 with 16,000 students).
19

Capacity building and institutional development in higher education in Kenya
There are approximately 10,000 students studying in university institutions in the United Kingdom, Canada, India, the United States and other countries.
4. Planning, programming, budgeting and funding of public universities
The rivalry between the Commission for Higher Education ( C H E ) , established by Parliament in 1985 through the Universities Act of 1985 (Cap 210B 1 1 ) and the non-legal body, the Vice-Chancellors Committee, whose m e m b e r s sat in Commission, was so intense that although the Act established C H E as an advisory body in regard to the long-term physical and staff development, current and non-recurrent needs of the university education, etc, (see the Universities Act, 1985), C H E was only able to concentrate its activities in non-controversial areas such as:
• accreditation of private universities; • equation of qualifications; • documentation and information services for universities; • co-ordination of education and training courses offered in
post-secondary school institutions for the purposes of higher education and university admission; and
• popularization of science.
During this same period, the Vice-Chancellors' Committee ( V C C ) also formed the Joint Admissions Board (JAB), a function of C H E under its Act. Together, the Committee and the Board handled (with varying success) tasks ranging from harmonization of terms of service, budgeting and funding of public universities, to setting of standards for public universities. T h e vice-chancellors were very successful to the extent that most resources in the 1990/91 financial year were diverted to the university institutions, and student admissions into public universities increased enormously. This was considered a major success of J A B .
While the rivalry between the V C C and C H E continued (due in large
11. T h e Universities Act, 1985. op. cit.
20

Introduction
measure to personal factors), the government restated its policy through the Permanent Secretary for the Ministry of Education that long-term centralized planning, programming, budgeting and financing of universities be reinstated. It w a s also the intention of the government that the loan be established as a revolving fund.
T h e ad hoc Task G r o u p w a s convinced that the initial and existing government policy had to be supported. A policy w a s readily agreed upon which stated that: H o w e v e r , it has been accepted that under the Universities Act of 1985, the Commiss ion for Higher Education ( C H E ) is the A p e x B o d y for accreditation, planning, programming, budgeting and financing, and that the various laws governing universities be reviewed and harmonized to enable C H E perform the following functions:12,13,14
(a) co-ordination and harmonization of public universities academic programmes;
(b) central admission services; (c) long-term planning, programming, budgeting and funding of the pu
blic universities based on ten-year projections, six-year development plan and three-year financial plan in accordance to the government's forward budget;
(d) setting up a data base; (e) raising funds from external sources: donations, endowments and trusts,
etc.; (f) accreditation of private universities, diploma colleges and post-
secondary training institutions; (g) co-ordination of education and training courses in post-secondary insti
tutions for the purposes of higher education; (h) planning higher education in conformity with national skills patterns
between graduates, technicians, and craftsmen and the m a n p o w e r needs in both the public and private sectors of the e c o n o m y ;
(i) h u m a n resources development; (j) equation of qualifications;
12. Republic of Kenya, Ministry of Education, 1991. op. cit. 13. Staff Appraisal Report, 1991. op. cit. 14. Republic of Kenya. Report of the review committee for the establishment of an institution
to manage the university students' loan scheme. Chairman, S . O . Wandiga, November 1991.
21
Capacity building and institutional development in higher education in Kenya
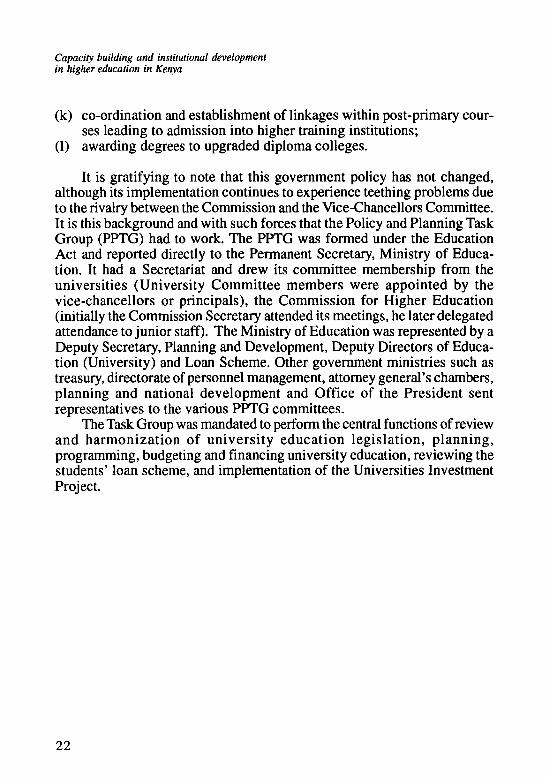
(k) co-ordination and establishment of linkages within post-primary courses leading to admission into higher training institutions;
(1) awarding degrees to upgraded diploma colleges.
It is gratifying to note that this government policy has not changed, although its implementation continues to experience teething problems due to the rivalry between the Commission and the Vice-Chancellors Committee. It is this background and with such forces that the Policy and Planning Task Group ( P P T G ) had to work. The P P T G was formed under the Education Act and reported directly to the Permanent Secretary, Ministry of Education. It had a Secretariat and drew its committee membership from the universities (University Committee m e m b e r s were appointed by the vice-chancellors or principals), the Commission for Higher Education (initially the Commission Secretary attended its meetings, he later delegated attendance to junior staff). The Ministry of Education was represented by a Deputy Secretary, Planning and Development, Deputy Directors of Education (University) and Loan Scheme. Other government ministries such as treasury, directorate of personnel management, attorney general's chambers, planning and national development and Office of the President sent representatives to the various P P T G committees.
The Task Group was mandated to perform the central functions of review and harmonization of university education legislation, planning, programming, budgeting and financing university education, reviewing the students' loan scheme, and implementation of the Universities Investment Project.
22

Chapter II
Project preparation
1. Introduction
Preparations for the Universities Investment Programme Credit took approximately nine months, during which the universities policy framework, the Universities Central Services Programme, University Education and Universities Investment Project were enlisted, evaluated and priority areas assigned.
O u r experience indicates that before one embarks on such a project, a clear knowledge of the institution is essential. If possible, all input and output data on the institution should be available in retrievable form. Difficulties were experienced in obtaining reliable data on student enrolment, staff (both academic and non-academic), available building space, unit costs of each academic programme and administrative head, etc. Such data were not readily available. The existing data on staff positions were those printed under 'recurrent estimates' of the year, and the reliability of such data was highly questionable. The problem of universities' statistics persists even today.
T h e areas involved in the project preparation included prioritization and selection of projects submitted by universities, project costing and assessment by World B a n k officials and, finally, project negotiation.
2. Universities Investment Project
2.1 Project submissions
A university system starved of resources - as the K e n y a n public universities are - presents a challenge to any administrator in distinguishing the wants of an institution from its needs. In the initial submission of projects by university departments, m a n y fanciful lists of equipment - which are in
23

Capacity building and institutional development in higher education in Kenya
the realm of university wants - were presented. Together, they amounted to about U S $ 600 million. Separating needs from wants presented a problem. O n e solution was found by first agreeing on fields or disciplines to be supported by the project. Second, selection criteria for each sub-project were agreed upon. These included the following requirements:
2.2 Project selection
All public universities accepted that they needed most assistance in scientific and technological fields. It was also accepted that strengthening of library facilities ranked high on the priority list. Capacity building in terms of training academic and administrative staff was also accepted as a priority, as was the purchase of equipment, computers and vehicles for administration.
2.3 Project selection criteria
All projects that met the following criteria were accepted: (a) The project cannot be funded from other sources. (b) T h e project conforms with the institutional goals and priorities,
principally the objective of enhancing the disciplines for which each public university is the designated national centre of excellence.
(c) T h e need for the sub-project is urgent; and (d) The sub-project does not require civil works, building services and
facilities.
Using these broad criteria, each sub-project was appraised and selected on the basis of the following five criteria and operational indicators:
Criterion 1: Capacity to absorb and implement the proposed sub-project. This involved satisfying that the institution had available: (a) space for teaching, laboratories and workshops, etc; (b) supplies and services like water, gas, electricity, drainage and specific
equipment; (c) personnel - academic and technical; (d) recurrent costs, funds to finance external maintenance contracts and
consumables.
24

Project preparation
Criterion 2: Contribution to improved links with the socio-economic environment. This emphasized the sub-project's relevance to the labour market and indicated whether a labour market survey, job vacancies, graduate tracer studies, and institutional advisory bodies existed and were available. It further requires that the sub-project be able to enhance collaborative links. The requirement was placed on assessing mechanisms for developing links, and type of link-contracts, training and graduate placements, curriculum design and delivery.
Criterion 3: Contribution to improvement in the quality of teaching and learning. A sub-project was selected if it contributed to either undergraduate courses, postgraduate courses, central facilities, or collaboration with the world of work. Sub-projects that ranked higher contributed to more than one area. All selected sub-projects had to be directly related to science and technology areas and to improve curriculum redesign, staff development, practical work or research, relate to market demand or enhance libraries, teaching technology and computer facilities.
Criterion 4: Contribution to improvement in institutional development. Sub-projects that contributed to financial management or administrative management were selected. In this respect, the proposal had to be evaluated on its potential to improve planned skills, enhance proposed equipment, improve planning and policy, increase capacity to attract outside resources, improvesystems for personnel, facilities, and students and improve skills for procurement and personnel management.
Criterion 5: Contribution to improvement in maintenance and repair. Each sub-project was evaluated on the basis of schedule availability for maintenance programmes, repair programmes, and spare parts requirement list. It was also determined whether skills training were provided in equipment management and equipment maintenance and repair. Assessment was done on whether the sub-project contributed to equipment usage with reduction in d o w n time, non-functioning equipment, and repair of nonfunctioning equipment.
Each listed equipment/project was considered as a sub-project and was evaluated using the above criteria. It was therefore possible to reduce the list of wants to a list of needs amounting to about U S $ 40 million. U S $ 10 million was reserved for central services and about U S $ 2 million was earmarked for applied research projects. The balance was in the form of government contribution, which paid for minor works, etc.
25

Capacity building and institutional development in higher education in Kenya
O n e lesson learnt from this exercise indicates that considerable time would be saved if a clear appraisal, selection and monitoring process is agreed upon before departments are requested to submit their lists of needs for a project. Strained nerves and interpersonal conflicts can be avoided if everybody knows the rules of the game.
2 .4 Ad mi s s ions
A s implied in Chapter I, major differences existed between the public universities and the C H E . B y nature of their independent Acts, the Ministry of Education was caught in between the two. The first task of the ad hoc Task Group was to build consensus on the least-contested areas and policies. Stabilization of enrolment numbers was one such issue. Detailed calculations of admission rates and student populations up to the year 2004 were presented to the universities, the government and the C H E . From these data and available relevant facts on financial resources and physical and h u m a n resources, a first policy on student admissions into the public universities was agreed. The policy simply stated: "Therefore, taking all the above into consideration, and taking into account the present students enrolment in Forms IV, III, II and I, it is agreed that the university admission in 1991 not be more than 10,000 candidates. It is further agreed that subsequent admissions be pegged at 3 per cent of the previous year's admitted candidates ' and that the science to arts students ratio be gradually increased to 50 percent. " This policy has been honoured and respected since its acceptance. In m a n y instances, the number of students admitted has been below the three per cent increase. However, due to non-completion of m a n y projects started in 1991 and the worsening financial positions of public universities, admissions in 1994 and 1995 have been below the 10,000 base.
While rapid growth was experienced at the undergraduate level, the number of postgraduate students marginally grew despite the multiplicity of university institutions. T h e ad hoc Task Group was concerned about this uneven development in research and postgraduate training. It recognized that without growth in postgraduate student numbers, the development, processing and acquisition of n e w knowledge would be diminished. Above all, a university without a strong postgraduate and research programme is not m u c h different from a high school.
26

Project preparation
This concern for postgraduate training was m a d e stronger by the numbers of postgraduate students enrolled in various programmes at the various university institutions. In the 1990/91 academic year, the University of Nairobi had 1,502 postgraduate students, Kenyatta University 336, M o i University 70, and Egerton University had five. The majority of these students were either in arts-based sciences or applied sciences. The enrolment pattern followed the imbalance between arts and science/technology subjects in the Kenyan education system. This was because arts subjects were more popular than science subjects; they were cheaper to develop; they required no laboratories or scientific equipment facilities; and they cover a shorter period span because they do not have practical requirements. O n the other hand, it was argued that science subjects are essential for technological development which includes industrialization. Furthermore, the imbalance affected girls more than boys due to the lack of science facilities in girls' schools, along with attitude and cultural bias against girls reading sciences.
A policy on the development of postgraduate studies was readily agreed upon and accepted. The policy states: "Postgraduate studies should be rationalized in the same way undergraduate programmes have been supported and the Loan Scheme should include higher education, including postgraduate programmes. In future the scheme should be called Higher Education Fund " It is hoped that the universities will revisit this policy, because at present it has not yet been implemented.
2.5 Upgrading the Commission for Higher Education
It was accepted that for the public universities to have a smooth and efficient administration, while at the same time maintaining high educational quality, they needed to strengthen those services that could be done centrally. Such an administrative process would bring harmonization of policy and procedures as well as save costs involved in repetition. After exhaustive discussions by the ad hoc Committee, it was agreed that the project would strengthen the C H E 1 , 2 in order to enable it carry out relevant studies, coordinate planning, programming, budgeting and financing of public universities, support applied research, and implement projects whose elements included:
1. Republic of Kenya. Ministry of Education, 1991. op. cit. 2. Staff Appraisal Report, 1991. op. cit.
27

Capacity building and institutional development in higher education in Kenya
(a) office furniture and equipment, including computers; (b) training of central institutional staff; (c) technical assistance; (d) studies; (e) initial operating costs of the Policy Planning Task Group ( P P T G ) ; (f) applied research funding; and (g) project implementation. Reforming the loan scheme was a priority task
given to P P T G , and reform costs were calculated and agreed upon under project preparatory funds and, once ratified, under the project.
2.6 Project costing
Detailed cost estimates were worked out for each component of the project. T h e final details of these costs were w o r k e d out together with the W o r l d B a n k team. It w a s finally agreed that the central components would cost U S $ 10 million. Price contingencies were estimated at U S $ 6 million and included in the total cost of U S $ 61.1 million. Detailed action plans had to be w o r k e d out for each sub-project to arrive at these costs. Furthermore, knowledge of prevailing prices or estimates w a s found to be essential. In addition, knowledge of procurement procedures w a s very useful in arriving at meaningful decisions.
2 . 7 Project assessment
The project was assessed by the World Bank officials3 w h o concluded that it would support the government's programme to consolidate and develop the universities by: (a) rationalizing and strengthening the institutional framework for higher education, in both the public and private sectors; (b) limit the growth of government budgetary resource devoted to the public universities by promoting cost sharing and improved investment planning; and (c) improving the quality of the teaching and research delivered at the public universities.
The three benefits of the project were identified as follows: (a) To set in place an institutional framework for the co-ordination, plan
ning, programming, budgeting and financing of Kenya's public
3. Staff Appraisal Report, 1991. op. cit.
28

Project preparation
universities; to support institution-building through the progressive adoption of n e w functions by the Commission for Higher Education, specifically through preparing a universities development plan for 1993-99, and through taking responsibility for project appraisal and selection under phases II and III of the university components.
(b) To help control the government's education budget, stabilizing the rapidly escalating university share of the recurrent budget for education at around 20 per cent. This will be achieved through adoption of an institutional framework for financing universities, limits on students admissions, and the reform of the student Loan Scheme.
(c) The bulk of the project funds will be used to provide equipment and materials to improve the quality of the teaching and research that the universities deliver. In time, the concentration of both teaching and research quality improvements in those science and engineering disciplines most critical for Kenya's development will also benefit the economy as a whole.
The assessment concluded by identifying two risks to the project. The first was the hesitancy on the part of the government to support the policy framework on which the project was built. Restricting student numbers, and increasing cost sharing, both direct and deferred, were two examples of potentially unpopular measures with students and their parents. O n the other hand, giving C H E far-reaching financial controls was potentially unpopular with the university vice-chancellors, even though they sit, and will continue to sit, on the C H E Commission.
A second risk to the project was identified as the time lapse needed for C H E to be fully developed to undertake the university development coordination in general, and to appraise sub-projects in particular. Lack of capacity to undertake the tasks was seen to impede implementation.
2.8 Project negotiation
Extensive ground for consensus was built during the project development and appraisal periods. At the time of negotiation, assurance was sought on the following issues:4
4. Staff Appraisal Report, 1991. op. cit.
29

Capacity building and institutional development in higher education in Kenya
(a) Undergraduate admission should not exceed 10,300 in 1992; 10,610 in 1993; 10,930 in 1994; 11 ,260 in 1995; and 11,600 in 1996.
(b) A condition of effectiveness was the collection in the academic year 1991/92 of the direct change of Kshs. 6,000, the operation of the bursary scheme for needy students (not to exceed 20 per cent of student enrolment), and the limiting of the loan to Kshs. 21,500, with no more than Ksh. 5,000 available for personal expenses.
(c) T h e condition for effectiveness was the implementation of programm e s satisfactory to the International Development Association ( I D A ) concerning the staffing, accommodation, w o r k p r o g r a m m e and budget of Task G r o u p and its associated subgroups and secretariat for 1991/92.
(d) A submission be obtained by 30 June 1992: (i) containing a proposal satisfactory to I D A for restructuring C H E with effect from January 1993, and also for continued interim arrangements from July-December 1992. (ii) ensuring the implementation by 1 January 1993 of this proposal following IDA's review and comment.
(e) A submission be obtained for IDA's review and c o m m e n t for: (i) the draft public university; (ii) C H E ' s draft recommendations on university admissions and budgets for the financial year starting July by M a r c h of each year starting in 1993.
(f) F r o m July 1994 the government will fully fund the operating budget of C H E at a level satisfactory to I D A such that C H E can carry out its university co-ordination, planning and financing functions.
(g) T h e annual submission be obtained for I D A ' s review and c o m m e n t : (i) by 1 M a r c h , C H E ' s proposed work p r o g r a m m e and budget for the financial year starting on July 1, and (ii) by 1 August, a detailed report on C H E ' s activities during the previous year, paying particular attention to the functions discussed in para. 2.6-2.8 (paras. 6 .8 (h) and (i)). paras. 2 .6-2 .8 described the planning, programming and budgeting for university development by C H E , while para. 6.3(b) relates to point (a) above and para. 6.3(c) emphasizes points relating to reports and submission dates in (e) and (g).
(h) A condition for disbursement for the student Loan S c h e m e was the execution of L o a n S c h e m e Rev iew Committees acceptable to I D A .
(i) T h e annual submission for I D A ' s review and c o m m e n t be obtained:
30

Project preparation
(i) by 1 March, the staffing, work programme and budget of the body responsible for the student loan scheme for the financial year beginning in July; and (ii) by 1 August, the activities undertaken during the year ending 30 June.
(j) The three studies to be undertaken by C H E , namely on the graduate labour market, the development of private universities and a socioeconomic study of access to the universities, will be submitted to I D A for review and comment within three months of their completion in accordance with a timetable accepted to I D A .
(k) For the support for applied research to be effective: (i) the initial three proposals accepted by the Task G r o u p / C H E , together with the expert's evaluations and the Task Group's assessment, will be submitted to I D A for review and confirmation; (ii) the subsequent proposals will be approved in accordance with agreed criteria; and (iii) an annual report for the year ending on 30 June on the use of applied research funds will be submitted to I D A by 1 August of each year.
(1) A condition of project effectiveness was the establishment of the Project Appraisal and Implementation subgroup for university component sub-project selection and phasing, the appointment of the Deputy C o ordinator on the Task Group's Secretariat and the appointment of Liaison Officers at each of the six university institutions.
(m) A condition of disbursement for the Phase II and Phase III packages was the submission of evidence to I D A that the packages consist of sub-projects appraised according to the agreed criteria and assessed in the light of Phase I and Phase II implementation where appropriate.
(n) The condition of effectiveness concerning the Task Group and its associated subgroup and secretariat thus also applied to project implementation; in addition, the proposal to be submitted to I D A by 30 June 1992 for restructuring C H E will cover the continued management and implementation of the project. Under the Agreement the overall authority for organization and management of the project was vested in the Permanent Secretary to the Ministry of Education, project implementation was delegated to C H E (initially the Task Group and subsequently the restructured C H E itself).
(o) A submission by C H E to I D A by 1 March of each year of proposed project implementation work programmes, action plans and detailed implementation schedules by project element to execute the work pro-
31
Capacity building and institutional development in higher education in Kenya
g r a m m e for the fiscal year to start in July must be obtained and found satisfactory by I D A . The submission of such a programme, action plan and implementation schedule for 1992/92 was a condition of project effectiveness.
(p) C H E (initially the co-ordinator) will submit to I D A half-yearly progress reports by 1 February and 1 August, highlighting issues that need resolution.
(q) T h e second review, the August 1994 half-yearly report, will be replaced with a complete report on progress since implementation, and will include the government proposals for reshaping the projects.
T h e assurances sought by I D A at negotiations on all the above issues were obtained. T h e project was approved by the World Bank Board and signed on 11 December 1991.
3. Harmonization of legal framework
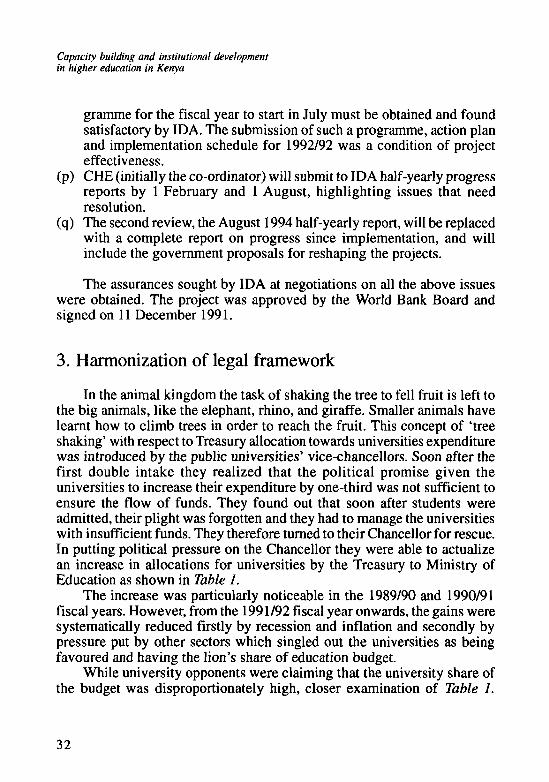
In the animal kingdom the task of shaking the tree to fell fruit is left to the big animals, like the elephant, rhino, and giraffe. Smaller animals have learnt h o w to climb trees in order to reach the fruit. This concept of 'tree shaking' with respect to Treasury allocation towards universities expenditure was introduced by the public universities' vice-chancellors. Soon after the first double intake they realized that the political promise given the universities to increase their expenditure by one-third was not sufficient to ensure the flow of funds. They found out that soon after students were admitted, their plight was forgotten and they had to manage the universities with insufficient funds. They therefore turned to their Chancellor for rescue. In putting political pressure on the Chancellor they were able to actualize an increase in allocations for universities by the Treasury to Ministry of Education as shown in Table 1.
The increase was particularly noticeable in the 1989/90 and 1990/91 fiscal years. However, from the 1991/92 fiscal year onwards, the gains were systematically reduced firstly by recession and inflation and secondly by pressure put by other sectors which singled out the universities as being favoured and having the lion's share of education budget.
While university opponents were claiming that the university share of the budget was disproportionately high, closer examination of Table 1.
32

Project preparation
Table 1. Gross expenditure on education: Percent distribution of Ministry of Education
Recurrent (net)
Primary
Secondary
Teacher's Education
University
Other
Devlp (Gross)
Primary
Secondary
Teacher's Education
University
Other
Total Expenditure
Primary
Secondary
Teacher's Education
University
Other
1989X90 Budget
100.00
60.3
14.5
2.8
17.2
5.2
100.00
7.3
6.6
11.4
66.4
8.3
100.00
54.5
13.6
3.8
22.6
5.5
Actual
100.0
57.2
16.4
3.4
17.6
5.4
100.0
2.7
5.5
24.2
63.5
4.1
100.0
53.4
15.6
4.8
20.9
5.3
1990V91 Budget
100.0
58.2
15.1
2.3
19.4
5.0
100.0
8.7
6.0
5.6
74.6
4.7
100.0
50.6
13.7
2.8
28.0
5.0
Actual
100.0
55.4
15.4
2.0
21.9
5.6
100.0
5.4
8.5
15.5
67.0
3.7
100.0
50.4
14.7
3.3
26.1
5.4
1991V92 Budget
100.0
56.3
15.4
1.9
20.1
6.3
100.0
7.5
2.7
22.8
62.4
4.7
100.0
49.4
13.6
4.9
26.1
6.1
Actual
100.0
59.7
16.2
2.1
16.1
5.9
100.0
6.6
9.5
36.8
43.0
4.0
100.0
55.3
15.6
5.0
18.3
5.7
1992\93 Budget
100.0
59.2
15.8
1.8
17.2
5.9
100.0
14.0
3.0
9.7
59.1
14.1
100.0
53.1
14.1
2.9
22.9
7.0
Actual
100.0
57.5
17.0
2.0
17.4
6.1
100.0
19.2
5.5
27.3
40.1
7.9
100.0
54.8
16.2
3.8
18.9
6.3
1993V94 Budget Actual
100.0
62.3
17.7
1.5
13.7
4.7
100.0
13.8
3.9
12.8
54.9
14.7
100.0
58.2
16.5
2.5
17.2
5.6
33

Capacity building and institutional development in higher education in Kenya
reveals that the government's share of university expenditure fell very sharply after 1990/91. B y 1992/93 the government's expenditure was only 78 per cent of the 1990/91 level and was budgeted at 14 per cent for 1993/ 94. During the past five years it has been calculated that the real government expenditure per student in real terms fell by 30 per cent. A s stated in the World Bank Public Expenditure Review - Education Sector Paper5: "Falling expenditure per student is not, by itself, proof of deteriorating quality; in theory it could represent increased cost-effectiveness." However, on the basis of anecdotal evidence, observers generally agree that there has been a deterioration in the quality of university teaching and research in Kenya.
The financial constraints mentioned above are good reason for the establishment of a strong intermediary co-ordinating body. However, for the record, some other reasons should be mentioned. O n e arises from the duplication of academic programmes in public universities. At present, c o m m o n academic programmes have been started in more than one public university for instance, at a time when there is an overproduction of Bachelor of Education (Arts) teachers, one finds that such programmes operate in five out of six university institutions. Five out of six such institutions have Faculties of Arts whose graduates have seen their employment opportunities dwindle to almost zero. There are several other duplications of courses both within a university and between universities. Certainly, resources used in such duplicated courses could be put to good use by strengthening a few of them to give quality education. Left on their o w n , it is doubtful that the universities will ever eliminate course programme duplications. It is argued that a body external to the university, with both financial and political clout, is the only mechanism that can force the universities to be efficient. The case of chartered private universities whose programmes have been streamlined by both economic competitiveness and the Commission for Higher Education ( C H E ) is proof.
The case of British universities which have undergone considerable restructuring under an intermediary body is a second reason which also lends support to this argument. In administration there are central services that are best done by one co-ordinating body. These services include admissions, loan schemes, quality assessment and assurance. These central services are already enshrined by law into the Universities Act (Cap. 2 1 0 B ,
5. Kenya: public expenditure review. Education Sector, World B a n k Paper, 1993.
34

Project preparation
1985). However, their implementation has not been in place due to conflicts of various clauses in the various acts governing university institutions. In the meantime, considerable financial resources are spent on implementation of these programmes by each institution and the C H E .
Streamlining of central services to be under one co-ordinating body is another reason for legal harmonization of the various acts. There are several other equally important reasons that could be given but for argument's sake, these three could be cited as significant.
The government, through the implementation of the Universities Investment Project (UIP) Credit Agreement (No. 2 3 0 9 K E of 1991) established a Review and Harmonization of Legal Framework Committee6
under the chairmanship of the author. The Committee's membership was drawn from each university institution, the Ministry of Education, Directorate of Personnel Management, Office of the Attorney General, and Commission for Higher Education. Its terms of reference included: to review of the Universities Act of 1985, the individual university institutions' Act and Statutes, with a view to identifying conflicting provisions and recommending revisions necessary to harmonize the Act and Statutes; to identify and help draft amendments to the Acts and regulations required to enable C H E fulfil its responsibility; to review the C H E ' s structure, membership, organization and staffing in relation to its responsibilities and recommend appropriate changes as necessary; to recommend the management training programmes for C H E and UIP staff; and to consider any other matter relevant to C H E ' s function. The report of this Committee is with the Ministry of Education and details of its recommendations could be obtained from the Permanent Secretary. In this chapter, I restrict m y comments to the prevailing attitudes and positions taken by involved institutions prior to, during and following the Committee's work.
A three-day workshop was organized by the Committee to build consensus on issues and areas of conflict. This workshop turned out to be a significant pathfinder, as it was the first venue where the university vice-chancellors, the Commission for Higher Education and the Ministry of Education stated their positions openly and frankly. The workshop was opened by the Minister for Education w h o outlined government policy on the functions of C H E . These functions were not new, as they had been on
6. Republic of Kenya, Ministry of Education. Report of the review and harmonization of the legal framework committee. Chairman, S . O . Wandiga. March 1993.
35

Capacity building and institutional development in higher education in Kenya
the law books since 1985. W h a t was new, however, was the government's resolve that they be implemented.
During the workshop, through debates and exchanges at the plenary, it became apparent that the distrust between C H E and the universities was based on personalities and not principles. This distrust hampered consensus-building. It was agreed at the end of the first day that a consultation with the "ancestors" - as one of the participants put it - was necessary. This consultation worked wonders. O n the second day of the workshop, m u c h progress was m a d e with regard to the role of C H E in planning, programming, budgeting and funding of the higher education. The very thorny issue of C H E ' s role in students' admission was also finalized. C H E was accepted as a secretariat for Joint Admissions Board, performing central services and financing the same. Indeed this workshop formed an important step in the journey of public higher education management in this country, a destiny shared by both the public universities and C H E .
The workshop consensus enabled the committee to undertake its tasks diligently. After six months of painstaking work, the Committee had a clear picture of the issues and conflicts within the legal framework. The major issues and legal framework conflicts included the following: • C H E was given the mandate for co-ordination of long-term planning,
programming and financing of universities, regulation of admissions into public universities, quality control over academic programmes, standardization and equation of degrees, diplomas and certificates, coordination of education and training courses in post-secondary institutions. S o m e of these functions conflicted with the stated functions of public universities under the various Acts or there were no clear implementation procedures.
• The Universities Act failed to give explicit powers to C H E to m a k e regulations to enable it to carry out functions stipulated in the Act and instead vested these powers in the Minister for Education. C H E was also given powers to admit students into public universities and m a k e regulations for such admissions despite the fact that such powers rested with the individual university's senate and their respective Acts.
• The chief executive officers of public universities are appointed by the Chancellor, w h o is also the President, while the Chief Executive for C H E is appointed by the Minister. The appointment system gave political advantage to universities' chief executive officers.
• In planning to provide for financial needs of public universities, the
36

Project preparation
Commission Act does not spell out in detail the modalities of performing this task nor does it require C H E to consult the universities in this matter. The Act m a d e no provision for C H E to source funds from outside government resources nor to invest its funds.
Furthermore, the Universities Grants Committee was created as an afterthought in the Act without spelling out its composition, functions and powers. • C H E was given powers of accreditation and visitation of public
universities. These powers conflict with the normal practice of establishing public universities through Acts of Parliament and the powers of visitation given to the Chancellor by individual universities acts.
• Since its establishment, C H E has operated without adequate and qualified staff, sufficient office accommodation, equipment and finance. In addition, it has not had clear reporting relationship, decision making levels, complementarity and interdependence.
In view of the above, the Committee m a d e the following 20 recommendations to the government: 1. The Chief Executive of C H E to be a presidential appointee. 2. All commissioners and m e m b e r s of each university council to be
appointed by the same authority. 3. Provision be m a d e in the Act governing C H E to articulate the manner
in which C H E should plan and provide for the financial needs of university education and research including the recurrent and nonrecurrent needs of universities.
4. The Commission and universities be empowered to source for funds outside the exchequer.
5. A Committee on Planning, Programming, Budgeting and Financing be provided for in the legislation and its membership and functions be similarly specified.
6. The Secretary to the Commission be a m e m b e r of the council of each public university.
7. The Commission be empowered to visit and inspect all universities; the President as Head of State retains the discretionary powers to visit and order inspection of any university.
8. The function of admitting students into universities be left to the Senates
37

Capacity building and institutional development in higher education in Kenya
while the Commission retains the function of providing central services for admission.
9. The functions of making rules for the boarding and lodging for students in public universities be left to the universities.
10. The strengthened C H E to have the following organs: (i) Universities Policies Committee (ii) Planning, Programming, Budgeting and Finance Committee (iii) Other Commission Committee (iv) Secretariat.
11. The strengthened C H E would have the following divisions and units: (i) accreditation, visitation and inspection division; (ii) planning, programming, budgeting and funding division; (iii) administration and finance division; (iv) information and documentation divisions; (v) internal audit unit; and (vi) public relations unit.
12. Each division be headed by a Deputy Commission Secretary, except the information and documentation division which would be headed by an information manager.
13. The government authorizes the appointment of Commission Secretary as an accounting officer.
14. The Act be revised to give C H E powers to accredit only private universities and post-secondary institutions.
15. The Commission be empowered to visit and inspect all universities in order to ensure the maintenance of standards.
16. Provision be incorporated in the Universities Act to enable C H E to make regulations that will guide it in planning, programming, budgeting and funding of public universities.
17. A new Commission be appointed to take over the expanded function of C H E .
18. The staff already in the employment of C H E should be evaluated and assessed on performance, qualification, interest, and a mechanism be found to replace those found wanting through appropriate procedures including recall, redeployment, retraining and retirement in accordance with their terms of employment.
19. In future, recruitment should be equitable, similar or better than that prevailing in universities to enable C H E recruit its initial staff from the free market.
38

Project preparation
20. C H E should enter into contractual arrangement with legal firm(s) as and when legal services are required. The Commission should be able to review the need for engaging a full-time legal officer depending on the legal demands that m a y be placed on it in future.
In addition, specific recommendations on human resources development, C H E ' s budget and financing, equipment and staffing were made. Draft amendment legislation for C H E , the individual public universities were also prepared by the Committee.
4. The Students' Loan Scheme
The government revised the Students' Loan Scheme in 1974. B y June 1994 the government had disbursed Kshs. 5.8 billion to students through the Loan Scheme, out of which only Kshs. 204 million had been recovered. Given the rapid increase in students' enrolment, the loan budget represented one of the fastest growing items. This increase was not balanced by expenditure per student for academic programmes but was at the expense of academic programmes. Indeed, it was estimated that by the 1990/91 academic year expenditure per student had declined by 30 per cent7.
Reform in the management of the Students' Loan Scheme became an urgent and critical item for overall structural adjustment of university education8,9. The sensitivity of the students to any change in the scheme m a d e policy choices even more difficult. Realizing that students were not buying textbooks with the loan funds provided, purchase of textbooks was a first area of policy reform. The Task Group proposed, and the proposal was accepted by all parties: • that the book allowance be deposited with each university bookshop as
part of the student's loan; • that each student be allowed to buy books/academic materials up to the
amount of the book allowance; • that there be no cash refund to students on unused allowances;
7. Kenya: public expenditure review. 1993. op. cit. 8. Republic of Kenya. Ministry of Education, 1991. op. cit. 9. Republic of Kenya. Report of the review committee ... , 1991. op. cit.
39

Capacity building and institutional development in higher education in Kenya
• that students' loan accounts be credited each year with exact amount used; and
• that any unused funds be recycled.
This policy operated between 1991 and 1995. It was resisted by students and as a result has been revised to allow students to purchase textbooks from the market.
The universities were not receiving enough funds for feeding and accommodating students. Each institution used funds from academic programmes for catering and hostel services. To alleviate this, it was agreed that direct cost-sharing be introduced, whereby a student paid Kshs. 6,000 towards his/her tuition. Furthermore, it was agreed that the student pays from the loan amount Kshs. 5,000 for tuition and Kshs. 8,000 for food and accommodation. The balance of the loan amount of Kshs. 21,500 would go to the student for book allowance (Kshs. 3,500), payable to the bookshop and other educational allowance (Kshs. 5,000) to be phased out over three years.
In order to ensure that those w h o could not pay the Kshs. 6,000 as direct cost-charge of tuition fees were not expelled from the university, a policy was formulated which stated that: • a grant fund for needy students be established; • loans continue to be optional to all students up to a m a x i m u m of
Kshs. 21,500 per year; • students w h o receive loans for fourth term and teaching practice conti
nue to do so above the loan ceiling; • the total loan capital per course per student remains approximately the
same as at present; • an inter-ministerial meeting be held to decide on h o w to treat the
unfunded balance of Kshs. 15,000 in loans as a matter of urgency.
The establishment of a bursary fund for 20 per cent of the total university student population was implemented. The bursary was awarded to needy students and administered by the universities themselves. The universities designed the forms and procedures for means testing and forwarded to the Ministry of Education names of students to be awarded bursaries and the amount awarded. The bursary amount was capped at 20 per cent of student population multiplied by Kshs. 6,000. The universities were allowed to award lesser amounts of bursary, but the total could not exceed the agreed
40

Project preparation
sum. In general, the bursary scheme has worked well except for complaints of abuse by awarding bursaries to non-needy students; delays in payment of the bursary fund to the universities by the Ministry; and delays in the communication of awards. These are administrative problems which it is hoped the universities will be able to resolve.
The loan amount remained pegged to a m a x i m u m of Kshs. 21,500. B y introducing direct cost-sharing, a saving of Kshs. 6,000 was realized by Treasury from about 80 per cent of the student population.
The rest of the policy recommendations have not been followed up. The poor loan recovery performance required an urgent and critical look at the programme. Indeed, it was agreed that an overhaul of the system was required. To this end, the Task Group recommended the following policy:
"A Students' Loan Board be established to run the Students' Loan Scheme. The Loan fund should be segregated from the Ministry of Education and universities recurrent budget. An interest rate, to be decided from time to time be charged to borrowers to enable the fund to revolve. That legislation be enacted to set up the Loan Board and restructure the Loan Scheme as a matter of urgency. "
S o m e progress has been made on the policy and, at the time of writing, Parliament has passed into law the new Higher Education Loan Board Act. W e will examine this in greater detail in the next chapter that reviews the loan scheme.
5. Promotion of private universities
Kenya is one of the few countries in Africa which has an open policy that encourages the development of private higher educational institutions. The number of students enrolled in private universities is about the same as in Zimbabwe. Before the establishment of the Commission for Higher Education in 1985 there were 11 private universities in the country. At the time of the project proposal preparation C H E had received 30 enquiries about n e w university registration, five of which were being pursued seriously. The first private university, University of East Africa, Baratón ( U E A B ) was chartered by C H E in March 1991. Since that time the Catholic Higher
41

Capacity building and institutional development in higher education in Kenya
Institute of Eastern African has been chartered and a third university, Daystar University, has received its charter.
Expansion of private universities is consistent with the government policy. In some countries the government has given land grants to such institutions. The issue in 1990/91, and even today, is h o w the government can assist such institutions to expand and offer quality education. T h e Task Group recommended the following policy, which was accepted10:
"It is agreed that studies on different models of funding private universities should continue to be undertaken by the Commission for Higher Education. Such a study should include enrolment patterns, staff and other needs and requirements of private universities. "
This study is being conducted and its results are eagerly awaited.
6. Promotion of post-secondary training institutions
A s indicated earlier, Kenya has a reasonably diverse range of post-secondary higher institutions. Standardization of quality in these institutions has not been undertaken. In order to improve quality of training in these institutions, it was agreed that "CHE accredit all post-secondary training institutions...and the national manpower needs of diploma and certificate holders be worked out. " C H E has started recruitment and training of its staff in preparation for the implementation of the policy. W o r k in this area will greatly improve the educational standards and quality of graduates.
7. Development of centres of excellence
The enabling Act of each university institution specifies areas of concentration for each university. In addition, the universities had agreed on areas of intended excellence amongst themselves. Development of such areas was deemed a priority, although there continues to be a debate amongst academics on the choice. O n e weakness of the public university system in
10. Republic of K e n y a . Ministry of Education, 1991. op . cit.
42

Project preparation
K e n y a is the duplication of similar or identical courses between the universities, and in some cases within the same university. Such duplications drain the scarce available resources. Therefore, a policy to "review courses at each university with effect from 1991 with a view to strengthening the existing centres of excellence and reducing duplication of courses except foressential academic purposes" was agreed upon11. The universities have started this review through the preparation of development plans.
The policy framework emphasized a shift from arts to basic sciences and technology. This shift was expected to involve additional expenses at all levels of education. It was expected that the structural adjustments recommended would result in savings that would be invested in the development of physical structures and purchase of equipment at the primary, secondary and university levels.
8. Universities Central Services Programme
A detailed request was m a d e to the World B a n k to enable the public universities, the Commission for Higher Education and the Students' Loan Scheme strengthen the following areas:12,13,14
• development of policy and administrative structures for universities planning, programming, budgeting, funding and financing;
• loan recovery and loan fund development; • individual universities planning programmes; and • entrepreneurship development.
The expected achievements of the project included maintenance of quality education at university level, enhanced, co-ordinated and effective higher education planning, improvement of financing and management of funds at university level, efficiency in loan recovery, m o r e stable capitalization of the loan fund, reduction of pressure on universities for admission, and continued assistance to economic and technological
11.Ibid. 12. Ibid. 13. Staff Appraisal Report, 1991. op. cit. 14. Universities Investment Project, 1991. op. cit.
43

Capacity building and institutional development in higher education in Kenya
development of Kenya. Development of trained h u m a n resources in administration, technical staff and middle level training at masters level in scientific fields were priority rated. A limited number of P h D scholarships (22) was planned due to the limited implementation period.
Improvement of infrastructure such as transport, computers (not main frame), telephone and furniture were allowed as projects. Finally, universities lacked funds to develop projects at the pilot plant stages. A rare allocation of funds for applied research was negotiated to enable institutions with completed research to develop them to the market stage. In m y view, this was one of the strong points of the credit negotiated.
Finally, the proposal reviewed university education in Kenya - its mission, its objectives and its strengths and weaknesses. The development of a project proposal by Kenyans was a major achievement for the Universities Investment Project. First, the government utilized its h u m a n resources to prepare a project that was both acceptable to itself and to the World Bank. Second, this was a Kenyan product, not a World Bank or consultant-imposed idea. At the outset, the project achieved capacity building within the universities and the Ministry of Education.
The government, in its letter on education policy to the World Bank, confirmed the policies agreed upon in the project document. To date, the government has not wavered from these policies, although implementation of some of them have been slow due to their complex nature.
44

Chapter III
Reforms in the Students' Loan Scheme
1. Resistance to reform
The students' loan scheme in Kenya has been a good example of elitist resistance to higher education reforms. The scheme had been in operation for about 16 years before any serious efforts to reform its management and administration were contemplated by the government. During those years some of the beneficiaries had become powerful decision-makers in the government service and in the general public. Because of the weak system of loan recovery, the notion that the government was giving free grants to university students as loans had become entrenched. S o m e graduates w h o were willing to repay their loans did not k n o w where to pay. S o m e had never been asked for repayment. L a w graduates argued that the limitation of action period to repay the loan had lapsed and therefore they had no legal debt to the government.
It is against this background that the government, through the Head of Public Service's letter dated 16 June 1991, decided to set up a review committee for the establishment of an institution to manage the university students' loan scheme under the chairmanship of the author1. The Committee's membership was drawn from the Office of the President, the Treasury, the Ministry of Education, the Federation of Kenyan Employers, the Attorney General's Chambers, the Directorate of Personnel Management, the Kenya Commercial Bank, the National Bank of Kenya and a consultant. The Secretariat was from the Ministry of Education and the University of Nairobi. The committee was given five terms of reference, namely:
1. Republic of Kenya. Report of the review committee... . 1991. (op cit)
45

Capacity building and institutional development in higher education in Kenya
(a) to review the current functions and performance by the Ministry of Education, the provincial administration, the banks and the universities in the management of the University Students' Loan Scheme;
(b) to examine the existing constraints and problems in the disbursement and recovery of loans;
(c) to review the existing rules and regulations governing the administration of various university students' loans;
(d) to m a k e recommendations on the establishment of effective institutional mechanisms for the efficient management and recovery of university students' loans;
(e) to m a k e recommendations concerning the personnel establishment, the facilities and the equipment required.
2. Evidence for reforms
Apart from some Committee members from the Ministry of Education, the majority of the members knew very little about student loan schemes operated by various governments around the world, or even the Kenyan system. The first task of the Committee was to gather as m u c h literature on the subject as possible. Reports on the K e n y a n system were also commissioned. Lastly, the public was invited to present views on the student loan scheme.
Student loan schemes are operated by various governments in Europe, North America, Latin America, Asia and Africa. There are about 50 industrialized and developing countries with various forms of loan schemes. M o r e than half of these countries are in Latin America and the Caribbean2. T h e c o m m o n feature of all existing loan schemes is that their performances have been disappointing. Almost all loan schemes, except for those in Colombia and in the Canadian province of Quebec3 , have heavily subsidized interest rates, high default rates, and high administrative costs. Improving the performance of the existing loan schemes so that they are efficient and cover broadly more students poses a major challenge for governments of developing countries.
2. Development in practice. Higher education, the lessons of experience. World Bank, Washington D . C . , 1994
3. Ibid.
46

Reforms in the Students' Loan Scheme
The two exceptions mentioned have succeeded in designing loan schemes that are self-sustaining. Self-sustenance is the policy goal of the Kenyan loan scheme. In order for a scheme to be financially sustainable, it should have an effective collection agency, with incentives to minimize evasion and default, and interest rates must be raised to levels that are positive in real terms. Until the Kenyan government accepts these financial principles, the taxpayer must agree to subsidize the loan scheme at rates close to 100 per cent of the outstanding amount. W e shall discuss this in greater detail later in this Chapter.
Kenya established the Students Loan Scheme in 1952 through the Higher Education Loans Fund Act (Cap. 213)4 . U p to independence in 1963, 917 students had benefited through the scheme. Under the Act, the Minister of Education was given the power to m a k e regulations for the loan scheme; however, such regulations were never m a d e . W h e n the independent government introduced a new loan scheme in 1974, it operated outside any existing legislation. The only administrative regulations were m a d e by the Ministry of Education5. W h e n the loan scheme was reviewed in the 1989/ 90 academic year in order to bring in the two commercial banks - the Kenya Commercial Bank and the National Bank of Kenya - no regulations for recovery were m a d e . The complete lack of legislation with specified regulations for the loan scheme has been the weakest point of the Kenyan system.
The Ministry of Education has been the major player in the management of the loan scheme, with both the universities and the banks playing some role in student identification, loan request, disbursement and loan recovery. Between 1974andJune 1991 the government, through the Ministry, had distributed about Kshs. 2.7 billion to students through the loan scheme. Out of this, Kshs. 530 million should have been recovered, but in fact only Kshs. 75 million were. Kshs. 415 million was time barred for recovery under the provisions of the Limitation of Actions Act (Cap 22).
The National Bank of Kenya disbursed the loan fund to students between 1974 and 1989. The only charge on the loan was an interest of 2 per cent per annum. In 1989, the two banks demanded and received a 2 per cent service charge, payable at one time only. The students were expected to pay no
4. Republic of Kenya. Ministry of Education, 1991. (op cit). 5. Republic of Kenya. Report of the review committee ... . 1991. (op cit).
47

Capacity building and institutional development in higher education in Kenya
interest on the loan but were obligated to pay a service charge of 2 per cent. The second weakest point of the loan scheme has been the inability of the Ministry to work out detailed regulations on recovery, disbursement rates payable to banks and loan interests payable on maturity. In general, the roles of the universities and provincial administration in identifying the borrower have not been a problem.
The Ministry of Education established a Loan Recovery Unit and staffed it with educationists. It was headed by a Deputy Director of Education. The other staff in the unit consisted of one education officer assisted by two other education officers, one accountant, one accounts assistant and twelve clerks. The unit lacked materials, equipment and physical facilities. Its budget was meagre and dependent on the general ministry cash flow. The low levels of appointments in the unit, the lack of experienced senior accountants, and constraints in resources did not allow the unit to operate at m a x i m u m efficiency. A s a result, financial statements were not kept. Reconciliation of notes between ministry, banks and the universities was not done. The banks also experienced constraints in respect of receipt of incorrect student lists, late transfer of funds to them by the Ministry for disbursement, overcrowding of banks by unruly students on payment days and lack of business - that is, no n e w accounts opened by students. There were no regulations formulated to cover deceased borrowers, university dropouts, genuinely unemployed and self-employed borrowers, and emigrants.
The Committee was therefore able to present a detailed report to the Ministry of Education outlining various aspects of the Students Loan Scheme. Appendix I gives a summary of that report with the recommendations contained therein. It is gratifying to note that a Higher Education Loan Board Act has been established by Parliament.
2.1 Creation of Loan Board
S o m e of the successful loan schemes are either managed by independent loan boards, private commercial banks or income-collecting government institutions such as the income tax or social security systems. Such institutions are commercially managed and bring discipline into the loan system. In Kenya, student borrowers treated the loans as grants from the government. The attitude of the borrowers and the laxity of government officials charged with loan recovery created a negative impression with the taxpayers, especially the business community. The operation of a state welfare for a
48

Reforms in the Students' Loan Scheme
very few select students at a time w h e n resources were scarce hampered development of wide university support by the few industries that were willing.
In fact, w h e n pressure was applied, as for civil servants and employees of parastatals, graduate employees did pay back their loans. A loan system which was legally supported and applied uniform pressure to all loan beneficiaries had a chance of success. If the commercial banks were to administer the loan scheme, they needed financial reasons for doing so. The fact that they were only paid a service charge for disbursement was not a sufficient financial reason for taking the risk. Lastly, the operations of a student loan scheme require staff trained in financial management. T h e Ministry of Education personnel could not meet all of the above prerequisites. Therefore, it was recommended that a n e w loan institution with a corporate status be formed. The institution was to decide on the policies of the loan scheme, but relies more on commercial institutions for administration and management. Such a system will bring market competition and would relieve the institution of burdensome administrative duties.
In order to attract high calibre appointees, be eligible for tax exemption and enjoy the advantages of attracting private contributors, it was recommended that the n e w Loan Board should have Trustee status. In keeping with its status, the membership of the Board would be small and the requisite establishment streamed d o w n to a m i n i m u m in keeping with its stated functions.
N o n e of the existing banking institutions rank the students loan scheme highly as a business. If things had been left to the financial institutions, there would not have been a loan scheme. O n the other hand, a loan scheme operated on a strictly commercial basis would either be too costly for most parents or students to repay or would have a very high rate of default compared to the existing system. The Kenyan government will therefore continue to provide resources for the loan scheme if it is to continue.
The students are expected to bear part of the cost of their education. Part of this cost could be paid from the students' future earnings. Subsidies to the loan scheme could be eliminated by charging a positive interest rate consistent with the future earnings of the loanee. A catch-net for the socially and economically disadvantaged group should be created through establishment of bursaries and scholarships. Lastly, a flexible repayment schedule should be incorporated into the system. Ideally, a flexible and portable loan package for all eligible and deserving university students (in both public
49

Capacity building and institutional development in higher education in Kenya
and private university institutions) would create competition between students and universities. Such a package would also eliminate discrimination between the children of taxpayers, inherent in the present system.
The laxity in the Loan Recovery unit to recall matured loans and the belief by most beneficiaries of the loan that the Limitation of Actions Act (Cap 22) protects them from any litigation by suppressing stale demands is one area which required greater scrutiny. At one point, it was recommended to the Committee that an exemption to the Act be sought from Parliament. This recommendation was passed by Parliament in the Higher Education Loan Board Act, 1995, N o . 3 of 19956. Under paragraph 26(2) of the Act, "All sums due to the Board shall be recoverable as debts due to the Board and without prejudice to any other remedy may be recovered by the Board summarily as a civil debt". Similarly, the Limitation of Actions Act is amended under paragraph 28 by adding a n e w paragraph (i) to section 42 as follows: "(i) civil proceedings brought under the Higher Education Loans Board Act, for the recovery of any loans owed to the Board including any penalty or interest thereon".
It is possible that a future loan scheme would rely less on government funding as long as it is able to recover the disbursed loans, charge positive interest rates, have an efficient and effective administration and be allowed to invest its funds and raise additional m o n e y through grants, donations etc. A clearly worked out loan management procedures need to be instituted as a matter of urgency. Such procedures shall include regulations on lending and recovery, default, employer check-off system and insurance cover.
2.2 Loan cost recovery
The weakest point of most loan schemes throughout the world is the interest rate charged on mature loans in order to recover the full cost of the scheme. It has been argued by critics of the Kenya loan scheme that it charges a negative interest rate which does not allow the full cost of recovery. The decision on the interest rate is both political and economic. A high interest rate will be unpopular with both the students and their parents. A low interest rate drains the taxpayers' resources to support a few beneficiaries. A decision between these two opposing extremes requires a
6. Republic of Kenya. Education Loans Board Act, 1995 (No. 3 of 1995).
50

Reforms in the Students' Loan Scheme
political decision based on financially collected data. The financial simulations summarized below using Kenya data have been worked out. The calculations used the model developed by Albrecht and Ziderman in World Bank Paper N o . 1377 .
Simulation of student loans costs
Assume that the present value of loan (PVL) is known. This loan is to be repaid after the student completes his/her education. At the time of repayment, the present value of repayment (PVR) must equal the present value of loan. Loans are disbursed in equal instalments in each year of study. This cost can be represented as C t cost of study at year t. Each C t will earn a market interest r. Therefore for n years of study:
n C . (1) PLV=Z
This is the compound interest formula used in everyday banking.
In order to repay the loan, one would wish to do so over an agreed repayment period. The shorter the repayment period the better for cash flow but the harder to the borrower w h o pays more. A reasonable loan repayment duration should be calculated up front and given to the borrower. The ability to repay the loan will depend on the loanee's earnings E ( at year t,. S o m e schemes have graduated repayments where a borrower is allowed to pay less when he begins to work and more as his earnings increase. In Kenya, by law an employer cannot deduct more than one-third of an employee's salary. It is therefore useful to let a borrower know the proportion of the future earnings he will use to repay the loan. Let's call this proportion of salary a. In a number of cases, a borrower m a y be unemployed immediately after he finishes studying; he/she m a y be given a grace period to settle into a job before starting loan repayment. Let's call this grace period g. Then
7. Albrecht, D . and Ziderman, A . Deferred cost recovery for higher education: student loan programmes in developing countries. Discussion Paper N o . 137. The World Bank, Washington, D . C . , 1991.
51

Capacity building and institutional development in higher education in Kenya
n+d+g E ,
(2) PVR= X a. <=n+l+g ( 1 + r ) ,
O n e would wish to ask the following:
(i) given the amount borrowed (Ct) in year, the borrowers earnings (Et) at year t, n the number of years in the course of study and the rate of interest (r), what are the different sets of (a, d) - proportion of earnings allocated to repayment and duration of payment - for which there is full cost recovery (that is P V L = P V R ) ;
(ii) for any set of (a,d), what is the proportion of P V L that will be recouped? Further, what would this proportion be if 'reasonable' values of a and d are assumed? and
(iii) given the amount borrowed, (Ct), ones earnings (E(), reasonable values of (a, d and g) what would be the interest rate charged to recoup the total cost ( P V L = P V R ) ?
To answer these questions w e used the cost per student per year in Kenya of K£l ,075. The data on earnings were either averaged at K£2350 or taken directly from the salary scale of each graduate job scale.
Lower cost estimates
O n e m a y obtain an answer as to what proportion of income is allocated to repay the loan, a, over various durations, d, and for varying interest rates is given in Graph. 1. The figure indicates that full cost recovery for a K e nyan student w h o borrowed, C t = K£l,075/yr, for four years and earns an average salary of K£2,350 in 1991 could best be met by apportioning 10 per cent of his earnings towards loan repayment within 10-24 years of repayment even at a low interest rate of 2 per cent. It would take 25 years to repay the loan. At an interest rate higher than two per cent, one needs to apportion a higher percentage of income towards loan repayment to realize full recovery. O n e needs about 45 per cent of income to repay a loan at 15 per cent interest rate over about 17 years. Inclusion of a grace period of up to three years exerts a relatively little impact on the results. This is because
52
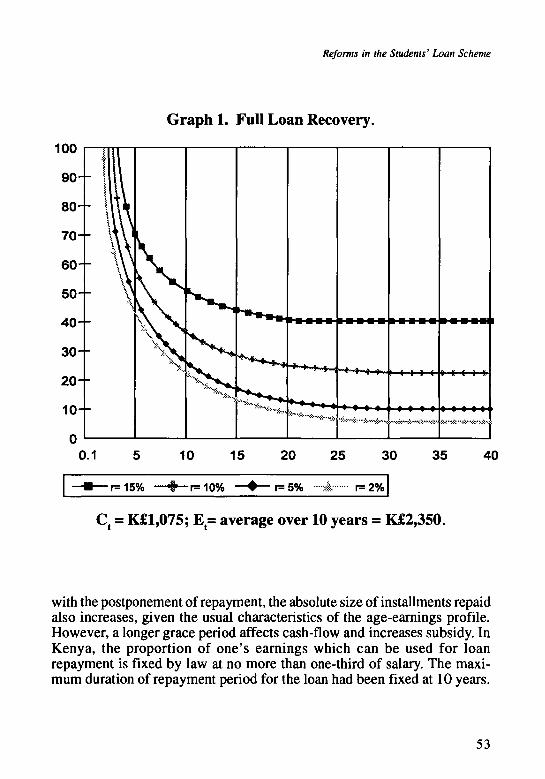
Reforms in the Students' Loan Scheme
G r a p h 1. Full L o a n Recovery.
100
: 15% 10% r=5% •2%
C , = K£l ,075; E t = average over 10 years = K£2 ,350 .
with the postponement of repayment, the absolute size of installments repaid also increases, given the usual characteristics of the age-earnings profile. However, a longer grace period affects cash-flow and increases subsidy. In Kenya, the proportion of one's earnings which can be used for loan repayment is fixed by law at no more than one-third of salary. The maxim u m duration of repayment period for the loan had been fixed at 10 years.
53

Capacity building and institutional development in higher education in Kenya
Obviously, it is difficult to ascertain from these calculations whether a and d might be politically or socially acceptable in a given situation. Such an assessment requires more than a technical analysis. However, with proper political explanation, the social acceptability of a chosen a and d. is possible, as long as the choice does not cause the scheme to lose m o n e y or subsidize the student.
Graph 2 summarizes the range of outcomes regarding the proportion of the initial loan amount that would be recovered corresponding to a variety of repayment schedules; a five per cent interest rate has been used in plotting the points in the graph.
The graph shows clearly that in Kenya, the proportion of loan funds recovered would be 40 per cent in a 10-year repayment period, if the proportion of income allocated to loan repayment (a) is 10 per cent or less. If the repayment is 15 per cent of current income, the rate of loan fund recovery would be 60 per cent. This rate would rise to 80 per cent if 20 per cent of the current income is allocated to loan repayment; and 100 per cent if 25 per cent of current income is allocated. Obviously, the outcome would improve if the duration of repayment is extended; for example, if it is 15 years, 52 per cent of the initial loan amount can be recouped when 10 per cent of income is allocated to loan repayment. The proportion recouped would increase to 80 per cent when the repayment amount is 15 per cent of income. Here again, it is open to question whether a 15 year repayment period would in fact be acceptable. The calculations indicate, however, that in Kenya, a repayment period shorter than ten years would not lead to a high rate of loan fund recovery, unless, of course, the repayment amount is a very high proportion of current income.
The n e w loan Act has set the proportion of ones salary at 25 per cent. T h e repayment period is not set by law but is expected to be around ten years.
O n the other hand, as the interest rate is increased towards the market rate, it becomes clear that only a very small portion of disbursed loan can be recovered if the proportion of earnings allocated to repayment is restricted to 30 per cent. The next section presents graphs which illustrate this point. Actual job group salary scales have been used for various degree courses. T h e low loan recovery achieved when lower-than-market interest rates are charged makes decision on chargeable loan interest rates an economic, political and/or social problem.
54

Reforms in the Students' Loan Scheme
G r a p h 2. Rate of Cost Recovery vs. L o a n duration: r = 5 %
100
90
80
70
60
50
40
30
20
10
Il h uff* luí'V Wx
J I lu 1/ If / If
j
.•s
• /
/
~>
r
ft**
r*"^
0.1 10 15 20 25 30 35 40
•a=30%- a= 25% • a= 20% • :1s: a= 15% ~~^~a= 10%
Real cost estimates
Critical financial analysis of the above calculations show that the following three cost contributions have not been included: (a) Interest rate subsidy: Most loan schemes charge interest rates that are
below market rates. In such instances, there is a 'hidden grant' paid by the tax payer for every student given a loan. The size of the subsidy depends on the real interest rate charged and duration of repayment. In
55

Capacity building and institutional development in higher education in Kenya
a heated economy, where inflation rate is fluctuating and high, the subsidy or hidden grant can be very substantial. Secondly, the longer the repayment period the greater the subsidy. Even if the interest rates charged equals the market rates, loan schemes would still have inherent risks such as lack of control, by borrowers, inability to get gainful employment by graduates, death, etc. D u e to these inherent risks in investment in education, one would like to see a clear separation of the costs in a more transparent and accountable way. Acceptance of the taxpayer and the students of these issues is most welcome in this area.
(b) Loss due to default and evasion: Funds disbursed through the loan scheme would not equal funds recovered even if market interest rates are charged. This is because not all students meet their repayment obligations, and the administration of the programme costs money. Default can be measured as a per cent of the number of loans that are not paid or the value of outstanding debt that is not being repaid (as used in this calculation) in relation to the total outstanding debt. As is true for income tax system, there are also loan losses due to evasion when repayment is done through an income tax programme.
(c) Administrative costs: A true cost of a deferred cost recovery programme must include administrative costs. Administrative costs include initial processing costs, overall maintenance costs and collection costs. Mobility of graduates in a developing country is very high. Tracing such graduates could be very difficult and costly. Considering the small size of loans makes administrative costs proportionately more costly.
Therefore, in order to show the real cost of the Kenyan loan scheme, w e developed a computer financial simulation model programme using the principles outlined in the World B a n k Discussion Paper N o . 137. 'Deferred Cost Recovery for Higher Education, Students Loan Programmes in Developing Countries' (Douglas Albrecht and Adrian Ziderman)8 . Our developed programme can simulate any loan scheme data and gives both graphical and numerical percentage calculations9 on each subsidy. Figures 3, 4, 5, and 6 respectively show the three subsidies due to interest rates
8. Albrecht, D . ; Liderman, A . , 1991. op. cit. 9. For detailed programme contact the author
56

Reforms in the Students' Loan Scheme
being less than market rates; the three subsidies due to repayment length; and the three subsidies due to default. The numerical percentage calculations are given in Table 2, page 65.
Sample calculation of real cost
Assume the normal amortization rate holds, then
(3) a =d X (l+0*+(tl)
The principal sum is given as
aj (4) P=
l-(l+/)n
and the present value of disbursement is given by / dk
(5) P V disb = 2 , K~l (/+/-)*"'
and the present value of repayment is calculated as
V l
(6) P V repay = P Z, *=1 (l+r)«+,1+*
Therefore, subsidy to interest rate being less than market rate is given as Interest rate subsidy «S(i)>> = PVdisb - PVrepay
PVdisb-PVrepay (7) % "50'/' = "
PVdisb
and subsidy due to interest rate and default is given by PVdisb-(i-b)PVrepay
(8) S(i,b) = PVdisb
Lastly, subsidy due to interest rate, default and administrative cost is given by od ac
(9) S(i,b,ac) = S(i,b) + PVdisb
57

Capacity building and institutional development in higher education in Kenya
Fy91
423.8 332.7
Fy92 17 487.1 392.0
Fy93 18 575.3 460.3
Fy94 19 677.2 552.2
W h e r e
Values Used Student Loan Scheme Subsidy Simulation terms
0.02 i = initial interest rate (during lending period) 0.23 j = interest rate (during repayment period) 2 .00 g = grace period in years 10.00 n = repayment length 0.95 b = probability of default j-i r = opportunity cost of capital i.e. r = j-i
0.10 ac = administrative cost of servicing loan as per cent of outstanding debt each year
/ = disbursement length 17 18 19 2 0 d = disbursement value K . S h s od = outstanding debt on loan K.Shs .
Si = 0.875443 S(i,b) = 0 .993772 S(i,b,ac) = 0.996569
In these calculations w e have used a lending interest rate of 2 per cent and a repayment interest rate of 23 per cent (the higher this is the more the subsidy). W e have retained a grace period of 2 years and a repayment length of 10 years. The present data indicate that loan is recovered at a rate of 5 per cent. There is a 95 per cent probability of default. The difference between repayment interest rate and lending interest rate is the opportunity cost of capital. Lastly, w e have used 10 per cent as administrative cost for servicing outstanding debt each year.
Therefore, using the 1991 disbursement value of K . S h . 423 .80m, outstanding debt on loan as K.Shs. 332 .70m, w e have arrived at the following subsidies:
S(i) Subsidy due to interest rate = 87.54 per cent S(i, b) Subsidy due to interest rate and default = 99.38 per cent S(i,b,ac) Subsidy due to interest rate, default and administration cost = 99.66 per cent
Furthermore, plots of simulation graphs show (i) variation of subsidy vs opportunity cost (Graph 3); (ii) repayment length (n) (Graph 4); (iii) probability of default (Graph 5); and (iv) administrative cost (Graph 6).
58

Reforms in the Students' Loan Scheme
Graph 3. Subsidy due to interest rate
0.21 0,18 0,15 0 ,12 0,09 Opportunity cost of capital
0,06
-S(i) •—<#*- S(i, b) S(i, b, ac)
Graph 3 clearly shows that interest subsidy is drastically reduced as one increases the repayment interest to match the market value. Theoretically, it is possible to eliminate the government's subsidy due to interest rate by charging market interest rate. Practically, the government would still lose m o n e y by charging interest rates above 15 per cent as none of the Kenyan borrowers would allocate 30 per cent salary that would be sufficient to fully repay the loan. Only about 60 per cent of the loan would be recovered in the borrowers' life time at a 15 per cent interest rate. Therefore, given the wages of graduates, the m a x i m u m interest rate the Ministry of Education can charge on the loan cannot exceed 15 per cent, but could be between 12 and 15 per cent. If this is accepted, and assuming the market interest rate remains at 23 per cent then from graph 3, the government's subsidy would reduce from 87.54 per cent to about 20 per cent and the amount repaid would be about 60 per cent of the loan disbursed.
59

Capacity building and institutional development in higher education in Kenya
Graph 4. Subsidy due to length of repayment
10
-S(i)
1.00
0.99-
n QA—;
n Q7
u.yo
u.y¿
u.y
U.OO
0.87 '
*" ~_v,....— ~~ t_ -*
— " * :..... - —¡
, i i ~ ~ ~ ~ ~ ~ j
• " " • •
12 14 16 Repayment length
18 20
4--S(l,b) - • — S(i, b, ac)
Graph 4 shows that subsidy due to length of repayment has a linear relation with repayment period. The longer it takes to pay the loan, the higher the subsidy. A minimum repayment period greater than 15 years will be more costly to the Government.
60

Reforms in the Students' Loan Scheme
G r a p h 5 . Subsidy due to default
0.89
0.88 ii ii ii ii ii ii
0.87 I ' 1 1 1 0.95 0.80 0.65 0.50 0.35 0.2
Probability of default
• S(i) 4s-S(i, b) — • — S(i, b, ac)
O n the other hand, as w e reduce the probability of default from its present 95 per cent to about 35 and then to 20 per cent, Graph 5 shows these subsidies due to default, and administrative cost are reduced from almost 100 per cent to about 9 0 per cent. In other words, as w e b e c o m e more efficient in loan recovery, w e lower the cost to the Government . If w e are 100 per cent efficient, which is practically impossible, the subsidy will only be from interest rate. Nevertheless, working for an efficient loan recovery system is essential and desired.
61
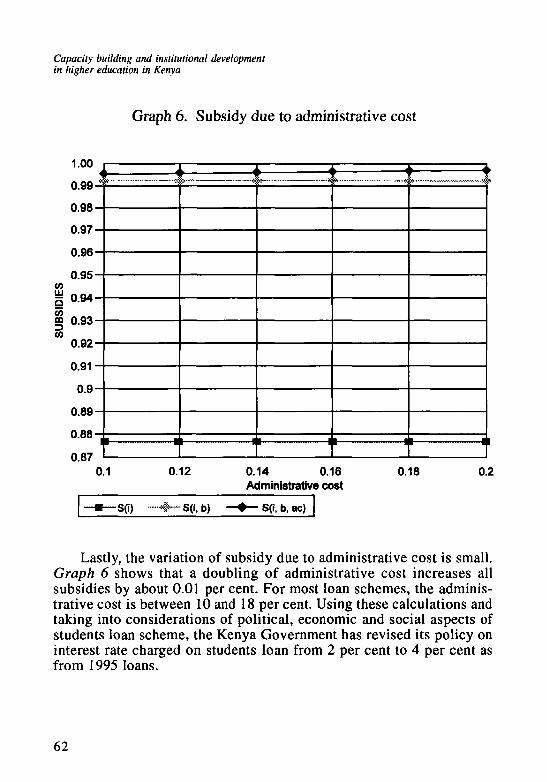
Capacity building and institutional development in higher education in Kenya
Graph 6. Subsidy due to administrative cost
0.98
0.97
0.96
0.95
g 0.93 CO
0.92
0.91
0.9
0.89
0.88 I l 1 | 1 | 1 | 1 | 1 |
0.87 ' 1 ' 1 1 0.1 0.12 0.14 0.16 0.18 0.2
Administrative cost
-*—S(i) —-*™S(i. b) • S(l, b, ac)
Lastly, the variation of subsidy due to administrative cost is small. Graph 6 shows that a doubling of administrative cost increases all subsidies by about 0.01 per cent. For most loan schemes, the administrative cost is between 10 and 18 per cent. Using these calculations and taking into considerations of political, economic and social aspects of students loan scheme, the Kenya Government has revised its policy on interest rate charged on students loan from 2 per cent to 4 per cent as from 1995 loans.
62

Reforms in the Students' Loan Scheme
Graph 7 . Loan scheme subsidies with improved recovery
0.03 0 .08 0 .13 0 .18 Opportunity cost
0 .23 0.28
-S(i) —#>~~S(i, b) S(i, b, ac)
In the second simulation w e used the following parameters; a) Initial lending interest rate: / = 2 per cent; b) Length of disbursement period (/) is 4 year for most undergraduate
courses at an annual loan amount of Kenya shillings 42,000; c) Repayment length (n) of 10 years; d) 30 per cent of loanees will default10 i.e. b = 30 per cent;
63

Capacity building and institutional development in higher education in Kenya
e) Administrative cost i.e (a c) will be 10 per cent of outstanding debt; and
f) T h e disbursement value (d) and outstanding debt (od) are as given in Note on simulation and simulated for repayment market interest rates./ varying from 5 per cent to 30 per cent.
Graph 7 shows a plot of per cent subsidies against opportunity cost r=j-i. W e note that the subsidy due to interest rate S(i) reaches zero at about 4 per cent interest rate. Thereafter it rapidly b e c o m e s negative and reaches a m i n i m u m at a market interest rate of about 16 per cent. Further increase in market interest rate reverses the trend and the subsidy increases. Charging very high, (i.e. > 16 percent) interest rates b e c o m e counter-productive with respect to reducing subsidy, due to amortization. T h e trend is the s a m e if one considers S(i,b), the subsidy due to interest rate and default, andS(i,b,ac) the subsidy due to interest rate, default and administrative cost. It is to be noted that negative subsidy S(i,b,ac) would be nil at 12 per cent interest rate and thereafter yielding a profit, in theory, between interest rates greater than 12 per cent and equal to 21 per cent. H o w e v e r , as stated before the amortization process itself renders very low recovery rates at such high interest rate.
Using the financial m o d e l described in the note above it has been possible to calculate the subsidies paid to the loan s c h e m e by the government. There are three subsidies inherent in any loan scheme. T h e first is subsidy due to interest rate, S(i). This subsidy c o m e s from charging low interest rate at lending time, while the market interest rate at repayment time m a y be higher than at lending. In this case the a m o u n t recovered is not the true value of the amount lent due to inflation and other market forces that go into fixing a lending interest rate. T h e second subsidy is due to interest rate and default, S(i,b). In m a n y student loan schemes the repayment is not done
10. The assumption of 70 per cent efficiency is based on data obtained from the Loans Board which indicates that its establishment has improved recovery rate from 4 per cent to 2 0 per cent. The Board is yet to establish the check-off system as required by law with concomitant inspection of employers records. In addition, the Board intends to mount loan recovery campaigns through a bank. It is estimated these measures will improve the recovery rate to 70 per cent or better.
64

Reforms in the Students' Loan Scheme
by all the loanees. S o m e are unemployed, under-employed and cannot do so. There are a few unfortunate cases, for example, when the borrowers die and the loan has to be written off. Default has cost due to its administration. These administrative costs include those related to personnel employed to trace the defaulters. This is the third subsidy which is due to interest rate, default and administrative cost S(i,b,ac). Table 2 gives the various subsidies paid by the Kenya Government when default rate is as shown and the interest charged varies from 2 to 15 per cent. A negative subsidy means that the amount recovered is greater than the amount paid at lending or the scheme makes a profit.
Table 2 . Students loan s c h e m e subsidies simulation.
Default Rates (%)
95 30 30 30 30 15 15 15 15
S(i)
87.5 -46.2
5.5 14.2 -0.6
-46.3 5.6
14.2 -0.6
S(i,b)
99.4 -2.4 33.9 39.9 29.6
-24.3-19.7 27.1 14.5
S(i,b,ac)
99.6 -0.9 35.3 41.3 30.7 22.9 21.1 28.4 15.6
Interest Rates (%)
2 2 4 5
15 2 4 5
15
Note: Negative subsidy means the loan value at repayment is greater than loan value at disbursement.
Source: This study.
Subsidy is sensitive to default rate. In Kenya the default rate has been at 95 per cent. In this case the taxpayers' interest subsidy to the loan scheme is 87.5 per cent at a lending interest rate of 2 per cent. However, as default
65

Capacity building and institutional development in higher education in Kenya
rate is reduced to 30 and 15 per cent, respectively, the scheme goes from a subsidy to a profit which plateaus at around 46 per cent. Increase in interest rate charged from 2 per cent to 4 and 5 per cent increase, the subsidy up to a m a x i m u m and then decrease it to a non-subsidy situation at 15 per cent interest rate. The trend is almost invariant at 30 and 15 per cent default rates. However further increase in interest rates beyond 15 per cent reduces the profit margin. Figure 7 shows the trends described above. In essence, there is a limit to which an interest rate charged on a loan scheme is productive. Charges of interest rate above 15 per cent, for example, becomes counterproductive because the amortization rate accumulates must faster than the annual payments.
The same trend holds for subsidy due to interest rate and default, S(i,b), and subsidy due to interest rate, default and administrative costs, S(i,b,ac). It is important to note that even at a 2 per cent interest rate the scheme makes a profit as long as the default rate is between 30 and 15 per cent. In fact, the World Bank interst rate argument which has forced many Latin American countries to charge market interest rates is not wholly valid. The simulation shows that these countries tend to lose more money by charging inflated market interest rates. What is needed is to improve the recovery efficiency of a loan scheme to between 70 and 85 per cent. Our simulations have persuaded the Kenya government to charge an interest rate of 4 per cent in 1995 on loans.
The Higher Education Loan Board Act, 1995
The recommendations of the Task Group were passed into law by Parliament, as the Higher Education Loans Board ( H E L B ) Act, 1995". The H E L B Act was passed in August 1995, and gives the Board the powers to: • manage the funds given to it; • disburse means-tested loans and bursaries and award scholarships; • recover loans through a check-off system; • inspect employers' records for loanees;
11. Republic of Kenya. Education Loans Board Act, 1995. (op cit).
66

Reforms in the Students' Loan Scheme
• prosecute defaulters including employers ; • deduct one quarter of a loanees' basic monthly salary for repayment of
a loan; and • grant one year grace period to loanees after graduation.
The new loan scheme has eliminated by law as m u c h as is practically possible most of the weakness of the old system. In terms of the student loan amount the changes introduced are summarized in Table 6 (page 83).
The main aim of reform was to effect savings that could be applied to academic programmes in order to improve quality. In addition, it has been calculated that by introducing measures described in the H E L B Act, 1995, the government will save about Kshs. 323 million in the first three years of operation and about Kshs. 200 million in the fourth year of operation in savings accrued from elimination of subsidies. Over a four-year period it is estimated that about Kshs. 1,169 million will be saved. In summary, the reforms will help the loan scheme become self-sustaining and will allow improvement of education quality.
67

Chapter IV
The planning process for public universities
N o institutions in the world can operate successfully in a competitive field without long-term planning. The last Universities Grants Committee1
which considered the long-term plans of public universities presented its report- which was never implemented - in 1983. The university institutions have operated on the basis of annual estimates. Funds have been allocated on a historical basis w h e n available. N e w programmes have been started on an ad hoc basis with little or no forward planning for the future. In some cases, old programmes have lumbered on w h e n some of them should have been phased out.
In a situation where institutional plans are non-existent, propulsion to action relies very m u c h on the personalities of the chief executive officers and influential personalities within the institution and the government. To date, no single university institution has a clear, well-articulated mission. Programmes are duplicated both within the individual institutions and between them. There is rampant over-employment in all categories of staff. Financial resources are depleted and student demand for more free services continue every day, worsening the already bad financial position of the universities.
In such a difficult situation, one might expect the chief executives (CEOs) of the universities to be agitators for change. O n e might expect them to be ardent proponents for planning. Unfortunately, however, the C E O s have not supported institutional planning with all the strength available to them. This behaviour has also affected the Commission for Higher Education ( C H E ) . These institutions expect outsiders - perhaps the government or some invisible persons - to plan for them. This expectation goes against all management rules of institutional governance. A n institu-
1. The Second Report. 1983. (op cit).
68

The planning process for public universities
tion that cannot plan for itself cannot be expected to play a significant leading role in education. Until C E O s of public university institutions take planning seriously, one can expect the quality of university education in Kenya to deteriorate, regardless of h o w m a n y resources are m a d e available to the institutions by the government or private sector.
This chapter describes the efforts undertaken by the Policy and Planning Task Group ( P P T G ) to organize a systematic planning process in the public university institutions and thereby assist the same institutions in their planning by providing resources through the Universities Investment Credit (CR 2309 K).
1. Planning guidelines
In 1991, w h e n the government signed the Credit Agreement, it agreed to assist with design and implementation of improved planning, programming and budgeting of public universities, including: • systems analysis and design for establishment of management infor
mation system; • preparation of guidelines and format for planning; • establishment of norms for unit costs and utilization of resources; • analysis of units and other inputs; • identification of relevant output indicators; • review of individual university plans and preparation of National Uni
versity Development Plan; and • recommend training programme for staff in planning.
1.1 Budgeting guidelines
The strategy designed by the Policy Planning Task Group ( P P T G ) was to bring together competent persons w h o implement such plans from each university institution, the Commission for Higher Education, Ministry of Education, Ministry for Planning and National Development and Ministry for Finance. T h e Committee prepared budgeting guidelines which took into consideration the inputs and outputs in a university department. T h e basis of the budgeting guideline was the full-time student intake and costs. The guidelines also took into account outputs such as numbers of students
69

Capacity building and institutional development in higher education in Kenya
graduating in a department in a year in all the degree programmes, the academic staff publications, research grants, etc. T h e format was designed to enable easy entry into a university, national information grid. Appendices 2 and 3 give the full details of the budgetary guidelines, the computer data entry sheets attachment, and definitions of key words/concepts.
1.2 Planning and programming guidelines
The Committee further prepared detailed planning and programming guidelines for six-year and ten-year projections. Six years was chosen to coincide with the longest course programme at a university. A ten-year projection on the development plan was chosen to enable a student to complete a P h D degree course, or any other longer post-graduate degree. Appendix 3 presents the Planning and Programming Guidelines. Concepts, definition of key words, and quality assessment model forms are presented.
1.3 Guidelines seminars
O n completion of the preparations of all three guidelines, a two-day seminar of Deans of Faculties, Directors of Institutes, Chairs of Departments, Principals of Colleges, and Deputy Vice-Chancellors was convened to study, amend, delete or rewrite the guidelines. This was essentially a presentation of the guidelines to each university institution Senate. It was the first such gathering where m e m b e r s looked at their institution not individually but collectively, in a national setting. The result of the seminar - where members of the Committee presented the guidelines and the Senate members asked questions - was a great success. A brief on the seminar given to the participants is reproduced in Appendix 4. T h e seminar w a s followed by the distribution of the guidelines to each university institution for implementation.
It was assumed that each university Chief Executive Officer's work in planning would be m a d e easier, in view of the ground covered by the seminars. In addition, planning in all public university institution was to be co-ordinated with comparable inputs and outputs. However, with hindsight, it appears that this approach was perceived as a confrontation by the C E O s . They felt alienated and out of control of the process. A s a result, some became hostile, and others ignored the exercise completely. A simple task
70
The planning process for public universities
which was planned to take one year dragged on for more than three. A s this chapter is being written, it is doubtful that a meaningful planning document would ever be written by the public universities.
In future, it would be preferable to completely give over the task of planning to the institutions without any guidelines. T h e outcome of the planning exercise could be used as a tool for management and funding by the government. A n institution that has a meaningful and coherent development plan would be given more resources. This could create competition between institutions and would result in more imaginative plans than the above described exercise would yield.
2. Operating budget guidelines and special requirements for public universities
2.1 Background
The policy of the Kenyan government is that, starting from July 1993, the Commission for Higher Education ( C H E ) shall be responsible for the financing of public universities. In order to enable C H E to undertake this task, the following guidelines and special requirements for preparation of universities operating budget has been prepared by the Policy and Planning Task Group. It is expected that these guidelines shall be reviewed from time to time by the C H E . The guidelines are to enable the public universities to determine their needs and present operating budget requests that can be justified. In this way, not only the amounts requested, but also the equity with which funds are distributed a m o n g institutions, shall be defended.
Guidelines and cost analyses go hand in hand. Cost analysis measures the current cost of various units existing activities; guidelines extrapolate these cost relationships, with necessary quality and price adjustments so that, given projected levels of operation, the cost of future programmes can be estimated. Budget guidelines provide a systematic means for calculating the resources required by a given programme or sub-programme. They can be used to:
71

Capacity building and institutional development in higher education in Kenya
(a) project budgetary needs; (b) justify budgetary requests; (c) clarify the presentation of budgetary information; (d) allocate resources; and (e) standardize budgetary data for comparative analysis.
These guidelines do not take over the prerogative of setting specific tuition and fees by the Councils of public universities. However , the consideration of funding goals is n o w an important element in developing revenue estimates.
Appendices 2 and 3 provide planning cycle activities, key concepts and definitions, procedures and tables for the calculation and display of information to be included in budget and programme proposals and for the development of revenue estimates for educational and general activities.
These guidelines are to be used by university institutions in the preparation of their programme proposals. Publication of these guidelines does not preclude an institution from using different methods in the preparation of its programme proposal. T h e guidelines provided are, however, a positive step in the continued development of guidelines for use in justifying requests and fairly and equitably distributing funds. If guidelines other than those provided are used, the institution must present an explanation and justification in its programme proposal. The Commission will continue its efforts to refine and develop sound budget guidelines as well as other appropriate approaches to budget preparations.
Submission of budget estimates as per these guidelines does not m e a n a commitment by C H E to finance the whole (or any section) of the institution's budget. The prepared budget as per these guidelines gives information concerning the aggregate budget request and revenue estimation for all purposes. The Commission recognizes that the submitted budget requests m a y exceed estimated revenues and that the requests m a y have to be adjusted to equal available resources. Such reductions will be made by the Commission after consultations with the Treasury in accordance with national priorities necessary to reduce requests in the development of institutional targets.
72

The planning process for public universities
2.2 Calendar of budget cycle
The following dates in the budget process for the public university institutions are provided as reference for those involved in the process:
November 1992
December 1992
January 1993
August 1993
August 1993
August 1993
September 1993
November 1993
December 1993
January 1994
April 1994
Treasury issues circular on budget estimates. Ministry/ C o m m i s s i o n Secretary issues guidelines for the development of Commiss ion P r o g r a m m e proposals. Ministry/Commission conducts training for budget proposals preparation. Ministry/Commission receives budget requests for each university institution. Combines budget requests and prepares public university budget estimates. Ministry/Commission presents public university budget estimates to Ministry of Finance. Ministry/Commission approves six year academic programmes plan. Ministry/Commission transmits the following information to the institutions for application in developing their programme proposals: (a) List of approved academic programmes. (b) Approved institutional planning statement. (c) Approved space inventory. (d) F o r m , student enrolment by staffing category for
1992/93,1993/94,1994/95,1995/96,1996/97 and 1997/98.
Treasury issues circular on forward budget. University institutions update their 1993/94 expenditure plans which will be the basis for 1994/95 simulations and programme proposals analysis. Commission conducts training on the development on 1994/95 programme proposals. Treasury issues circular on revised budget estimates. Institutions update their programme proposals. Institutions submit seven copies of programme proposals to Commission. Commission submits public universities estimates to Treasury. Commission approves enrolment revisions as necessary.
73
Capacity building and institutional development in higher education in Kenya
3. Status quo of university education
Higher education offers the best path to the solution of global problems, both at the individual and national level. A high-quality, vibrant higher education system enables a nation to train its professional personnel, including the managers, scientists, engineers, and technicians w h o participate in the development, adaptation, and diffusion of innovation in the economy. Marked economic growth in real terms has been experienced by nations that have invested heavily in education at all levels. Therefore, limiting education to one level - primary, for example - at the expense of the other levels, especially higher, does not result in economic growth in the present world economic order. Higher education's role as a national unifying focal point of diverse social groups within a country, as well as its offer of a forum for pluralistic debate, has been very well demonstrated in m a n y countries. It is for these reasons that the development of higher education correlates m u c h more closely with economic development: higher education enrolment ratios for developed countries w h o are members of O E C D is 51 per cent, compared with 21 per cent for middle-income countries and only 6 per cent for low-income countries. During the last three decades developing countries, with the assistance of donors and lending agencies, have invested heavily in their higher education.
3.1 Public expenditure
Public expenditure per student in most regions of the world is greatest in higher education. T h e cost ratio between higher education unit cost and primary education unit cost is highest for all developing countries, except for Latin America. Table 3 gives enrolment ratios in regions of the world.
The high enrolment ratios have today become the most challenging policy issue towards development and reform of higher education, in order to institute an educational system that gives equal access in an equitable manner while maintaining high quality.
In Africa, and indeed in most of the developing world, higher education has seen phenomenal student population growth patterns. The growth pattern in some African countries between 1980s and early 1990s is given in Table 4.
74

The planning process for public universities
Table 3. Enrolment ratios for regions of the world ( 1986) (Percent of school Age population)
Region
Anglophone Africa Kenya* Francophone Africa South Asia East Asia & Pacific Latin America Mid. East & N . Africa Developing Countries Developed Countries
Primary
77.00 82.00 46.00 71.00 87.00 90.00 82.00 75.00 100.00
Secondary
17.00 27.75 14.00 19.00 43.00 44.00 30.00 23.00 80.00
Tertiary
1.20 7.00 2.40 4.40 9.10 12.00 9.40 6.90 21.00
Source: Donald R . Winkler (1990): Higher Education in Latin America: Issues of Efficiency and Equity. World Bank Discussion Paper No.77.
* Data for Kenya has been derived from: Kenya: Public Expenditure Review-Education Sector, World Bank Report 1993. The data is for 1993 school year only.
75

Capacity building and institutional development in higher education in Kenya
Table 4. University enrolment in some african countries
Country
Chadl Malil Burundi 2 Central Africa Rep 2 Gabon 2 Benin 3 Bukina Faso 3 Niger 3 Congo 4 Senegal 4 Zaire 4 Cameroon 5 Kenya 5 Cote d'Ivoire 5 Madagascar 5
1980
2,000 5,100 1,900 1,700 2,000 4,000 1,600 1,400 7,300
13,600 28,500 11,500 7,945
19,600 22,600
1987-906
2,048 4,715 2,715 2,600 2,741 8,883 4,760 3,317
11,310 18,550 16,239 34,000 38,848 22,000 37,181
Growth in %
+ 2 -8
+ 45 + 53 + 37
+ 122 + 198 + 137
+ 55 + 36 -43
+ 196 + 389
+ 12 + 65
Source: William S. Saint, Universities in Africa: Strategies for stabilization and Revitalization, Washington, D C , World Bank, M a y 1992, pg.60; Ministry of Education. Report of the Review Committee..., 1991. op.cit.
Notes: 1. Small no-growth systems 2. Small but expanding systems 3. Small rapid growth systems 4. Medium-size systems 5. Large multi-institutions systems 6. The figures are for the years 1987-90. For the year 1991/92 academic year
Cameroon had 42,000, Cote d'Ivoire 28,000, Senegal 21,745 and Kenya 41,675 students.
76

The planning process for public universities
3 . 2 Enro lment growth
The fast growth of student population has not been matched with similar growth in resources. In fact the decline in public support per student declined in the 1980s from Kshs. 346,500 to 82,500 in real terms for sub-Saharan Africa. Not only has there been a decrease in financial support for the universities, but the bulk of financial resources has gone to personnel expenses, as the data for Kenya shows (Table 5). A s a result, the quality of academic programmes has deteriorated.
The salaries paid to academic staff have been inadequate. A s a result, m a n y qualified staff have left the profession or taken other jobs to supplement their salaries, at the students' expense. Infrastructure that was meant for a few students n o w caters for m a n y more. Such infrastructure has deteriorated due to over-use, age or lack of maintenance. Replacement of equipment which is essential due to changes in technology have not kept pace with demand.
3 .3 Institutional inefficiency
Lastly, the decline in the resource base has been exacerbated by inefficient use. Most institution facilities are overburdened by students when in session, and often they are under-used. For example, most libraries follow the 8 a . m . to 5 p . m . schedule of opening hours - few extend their hours to 10 p . m . , and they remain closed over the weekends and holidays. The unit costs in most institutions are very high. L o w student-staff ratios, high dropout and repetition rates and low graduation rates (though not fully applicable in Kenya) all drive up the cost per graduate. High subsidies to students' welfare from funds meant for academic programmes have turned these institutions into welfare homes instead of quality academic institutions.
The worsening graduate unemployment in most countries caused by stagnant economic growth or bad government policies or both is compounded by the mismatch of students' degree courses to labour market needs. The effect of unemployment in academic quality is often manifested by over-enrolment into service courses where employment opportunities exist, at the expense of fields that create new technology and hence economic growth. Above all, unemployment démotivâtes disadvantaged but bright students w h o have no family connections for job placement.
77

Capacity building an
d institu
tional developm
ent in higher education in
Kenya
Table 5
. U
niversity p
ersonn
el and non
-person
nel exp
end
iture
(in m
illions of K
enya S
hillin
gs)
1993/94
«N 199
S i-i 199
16/
1990
I 9\ 90
1-N
Budget
I 7l Budge
•a Actu
7l Budge
'rt a
o Budget/
1
1
7i (1) udg
oa
ice
£ urrent
S
2244 1682 1612 1468 1568 1446 1414 1062 1352
SU ditui
0>
CL
.
X Univ. Total
2002 1378 1300 1066 1244 1150 1132
o
es 0
0
s —' ture ndi xpe nnel e Perso
242 304 312
es O
324
VO
OV
es
383 es •
«*
es
oo
•«
*
es iture send
X
UJ nel Person Non
2 t Prie onstari
U B
618 546 524
o
es vo
399 VO
O
v vo
680
S lO
o
r-r-dituí
SL
X Univ. Total
552 0
0 422
o
IO
TI-526
•sl-
lO
IO 544
VO
en
"
•*
vo
00
IO ture ndi X
nnel e Perso
VO
VO
00
ov
es o
o
r-VO
en
es •sf 136
8 en
i pend
X nel Person Non 1
is tribu Percent D
100
8 100 o
o
100
o
o 100
8 *"•
8 ~ dituí
8. ti Univ. Total
89.2 81.9 80.6
vo
es r-
79.3
IO
OV
r-
80.1
es_
t— 1.7
00 ture ndi xpe nnel e Perse
10.8 18.1 19.4
•si
res 20.7
IO
o
es 19.9
00
es 8.3
'" H iture pend
X
W nel Person Non
363.1 308.2 308.2
OV
en
es 236.9 O
V 207 207.9 8.4
J ,
ä 1 E orandu Mem
100)
i a tor
i GDP
40,000
ç v—í 40
§
O)
Of
40,0 ment Enro
56,100
o
IO
O
es •t
o
o
r-VO
en
o IO 36,1 nt (Kshs.)
0>
•O
c75 nditure Expe
78

The planning process for public universities
Above all, the decline in resources has also affected the research output of these institutions. The source for research funds has been almost zero, and in addition, staff w h o should conduct such research are not motivated and have no time for research. They spend their time in personal economic survival activities.
The increased enrolment has opened up the door for m a n y students from disadvantaged background to higher education. Rural students in particular have found chances to attend higher education. Teacher Training Colleges have been instrumental in increasing the number of w o m e n in higher education.
However, higher education in general and scientific programmes in particular are still male- dominated and elitist. Household surveys indicate that the majority of higher education students c o m e from wealthier families. F e w if any institutions gather socio-economic data to disprove this fact2. Above all, the majority of university students c o m e from the middle to upper classes.
Higher education in all developing countries is financed by the entire population, with the low-income groups bearing the heaviest burden of commodity taxes, while opportunities for higher education exist for a relatively small minority. Therefore, expenditure in higher education has regressive fiscal impact. For example, in Brazil3, 23 per cent of the public education budget goes to higher education, even though higher education represents only 2 per cent of the student population. In K e n y a 4 , the ratio is 20 per cent of the public expenditure going to higher education for a 6 percent student population. In R w a n d a , before the system broke d o w n , 15 per cent of the budget went to 0.2 per cent of the student population.
Although there has been a marked increase in w o m e n students in higher education, the number is still very low. In Kenya, for example, in 1994 only 26 per cent of university students in public universities were w o m e n 5 . In 1989, w o m e n accounted for only 25 per cent of enrolment in Africa6, 35 per cent in Asia, 36 per cent in the Middle East and North Africa, and 47 per
2. Republic of Kenya. Ministry of Education, 1991. (op cit). 3. Development in practice, 1994. (op cit). 4. Kenya. Public expenditure review. 1993. (op cit). 5. Albrecht, D . and Ziderman, A . Financing universities in developing countries. P H R E E
Background Paper. Series N o . P H R E E / 9 2 / 6 1 . The World Bank. 1992. 6. Republic of Kenya. Ministry of Education. 1991. (op cit).
79

Capacity building and institutional development in higher education in Kenya
cent in Latin America and the Caribbean. In addition to their low numbers, w o m e n also tend to be concentrated in arts-based subjects.
Although more students of rural origin are attending higher education than before, their geographic distribution is not equitable, but rather favours the well-to-do districts or regions or regions of political power. Several disadvantaged districts have few student representatives - or none at all - in higher education institutions. This low representation worsens the " w o m e n factor" discussed above. Similarly, poor urban students are disproportionately represented in higher education.
T h e above-mentioned issues m a k e reform in higher education a high-ranking policy priority in most developing countries. A s the economies of most of these countries are stagnant, the possibility of increased public expenditure on higher education to match the increased enrolment and d e m a n d is very unlikely in this or the coming decade. Therefore, reform in the w a y higher education is financed, taking into consideration the available resources, equity, quality standards, labour market demands and direct cost to the beneficiary, the students, is a policy priority.
4 . Mobilizing finance
Financial scarcity has been the main source of strained relations between public higher education institutions and the government. The government budgets (both recurrent and development) have been stretched to the limit. It has become increasingly difficult for the government to meet the demands of both students and staff in providing adequate resources for the evolved 'aristocratic' education system. (I say 'aristocratic' because before the 19th century, all university education was paid for by the students. During the 19th century, with the intention of developing m a n p o w e r for the industrial revolution and for the civil service, the governments introduced the policy of paying for university education as a social good. This system was extended to the colonies and was inherited by the independent African governments). M a n y government officials cannot understand w h y the university community is unable to understand and appreciate the government constraints.
O n the other hand, the university student community expects to receive from the government the same rights and privileges as those accorded their predecessors. The negation of these privileges constitutes a breach of contract. Academic staff have seen the erosion of academic quality with
80

The planning process for public universities
each increase in student population. In all cases the increased enrolment has been the result of government policy. Since it is the government that has decided to increase enrolment, the government should provide adequate resources to enable the universities perform their teaching and research duties. The fact that increased enrolment policy has not been matched by adequate provision of resources has been a source of misunderstanding.
4.1 Financial flows to universities
Today and in the future, the state will remain the main source of higher education financing. However, as already stated, the financial resources of the state have dwindled due to adverse economic conditions and increased demand for university places.
Therefore, it is necessary to look for alternative sources of financing to supplement those provided by the state. In this chapter, I use the higher education reform process in Kenya as an illustration of an attempt to solve the problem. In this example, I shall review the old system where all financial resources for public university education were provided by the state. In the 1995/96 academic year a n e w system involving increased cost-sharing was implemented. I shall first describe the major components of this system and then the ideal system, where the university revenue sources are diversified.
4.2 The state-dominated financial system.
Between 1963 and 1991 the state provided all the resources needed by public universities in Kenya . Chart 4.1 illustrates the old financing relationship between the state and the university system. In this system all public universities received all their funding from the government, which also paid students full living expenses. A s the students' living expenses became less affordable a student loan scheme was introduced in 1974. The students borrowed m o n e y against their future earnings. The loan scheme was to be revolving and self-financing. However, due to weak administrative mechanisms and high rates of default this aim was never achieved.
A s student enrolments grew the government's provision for students upkeep also grew very rapidly. Between 1974 and June 1994 the government had disbursed loans close to Kshs. 6 billion through two commercial bank
81

Capacity building and institutional development in higher education in Kenya
Chart 4.1 - T h e old financial relationship between the state and the university system
GOVERNMENT
w
UNIVERSITIES
1 1 1
STUDENTS
DONORS
^
agents, of which only Kshs. 204 million had been recovered. At the same time as loans were being disbursed, the provision to the universities did not increase in real terms (see Table 5). High inflation rates compounded this. In addition, as the student welfare state was established and gave the organized students power, the institutions were forced to divert some of the financial provisions to pay for food and accommodation of the students. T h e net result of the combined actions resulted in academic quality deterioration.
82

The planning process for public universities
Table 6. Changes in university student loan components since 1974
L o a n component changes in loan amount in the academic year implemented (in K . S h . )
Food
Accommodation
Personal Allowance
Tuition
Books
Other Education Material
Total Loan Component
Direct cost-sharing*
Total H H Contribution
1974/75
5 777**
8 085
~
-
—
3 860
-
13 860
1987/88
5 775
2 310
10 395
-
—
~
18 480
~
18 480
1989/90
5 775
2 310
10 395
9 000
--
—
27 480
~
27 480
1991/9
5 700
2 300
—
5000
3 500
5000
21500
6000
27 500
1995/96
18000
7000
—
8000
9000
—
42 000
8 000
5000
* A bursary scheme for the needy was started in 1991/92 year. The scheme amount was equivalent to Kshs. 6,000 multiplied by 20 per cent of student population. A student could be awarded a bursary ranging from Kshs. 1,000 to 6,000. The Bursary Scheme has been retained in 1995/96 changes.
** This 1974/75 figure includes both food and accommodation.
Source: Ministry of Education: various sources.
83

Capacity building and institutional development in higher education in Kenya
The donor support to the university system has been very commendable, especially in the 1960s and 1970s. However, the bulk of these sources started to dry up in the 1980s, and today they constitute a very small fraction of income. The decline in donor support has been associated with general global economic glut and partly due to political differences.
In the 1987/88 academic year the universities, at the prodding of the government, admitted a double class in order to eliminate student backlog which resulted from a one-year closure of the universities in 1982. In addition, the education system was changed from seven years in primary, four years in secondary, two years in higher secondary and three years in university (7:4:2:3) to a 8:4:4 system. The first cohort of the group was to enter the university cycle in the 1990/91 academic year. The increased enrolment brought with it a phenomenal student population growth in public universities (see Table 4). During this period the student population expanded about fourfold, while financial resources increased by about 30 per cent at current prices.
A s a result, a new system was implemented in 1991 in which direct cost recovery from the beneficiary was introduced for the first time. In this system not only was the direct payment of fees introduced, but part of the loan fund was designated for tuition payment.
Despite these measures, the universities continued to be financially strapped. Funding students' welfare needs became a major burden. In fact the dotted line in Chart 4.1 from universities to students became permanent. Over 80 per cent of the financial resources went into payment of personnel. Staff numbers increased while their salaries declined in real terms, and a general malaise set into the system.
4 .3 T h e cost-sharing system
The experience gained in Kenya has led to the slight modification of policy from where the universities were regarded as 'service' institutions, serving the wider interests of society and the economy, to that of ' c o m m e r cial enterprises' that provide services for the benefit of individuals. The change has not been perceived or accepted by m a n y Kenyans, yet the new government policy leaves no doubt to the change.
In the newly-introduced system, the universities operate in the context of a producer/consumer relationship, with the students being charged realistic
84

The planning process for public universities
market fees and those unable to pay such fees being targeted for government assistance through loans and bursaries. This is indeed a cost-sharing system.
Chart 4.2 illustrates the cost-sharing system. Under this system, the government continues to provide the bulk of its financial resources (58.3 per cent of unit cost of Kshs. 120,000 per student per year) to the public university system either directly (1991-1994) or through the grants c o m mission such as Commission for Higher Education ( C H E ) .
At the same time the government provides Kshs. 42,000 to needy students, as a means-tested loan. In turn, the student pays Kshs. 16,000 to the university as tuition. This constitutes 13.3 per cent of the unit cost. O f this, Kshs. 8,000 comes from the loan and the balance is paid directly by the student (those w h o cannot pay are assisted with a means-tested bursary of the same amount or less). Food, accommodation and books are paid for at market rates with funds m a d e available to the needy through the loan scheme. Those w h o are able to pay the full cost of Kshs. 120,000 are encouraged to do so. Table 6 shows changes introduced in the loan scheme since its inception. The Higher Education Loans Board administers the loans disbursement as well as carrying out recovery functions.
At the same time the system allows donors to give funds to the universities through the government (bilateral assistance); or any donor or industry m a y support a university student directly. Students in private universities as well as those in other tertiary institutions are also eligible for loans. Kshs. 18,000 of the loan amount is given for payment of food and Kshs. 7,000 go towards accommodation. Kshs. 9,000 go for books and other educational materials. Therefore, students' major tuition costs and non-tuition expenses are catered for. The university system in turn is allowed to separate these costs and charge at the competitive market rates.
The long term benefits for the new system are that: (1) resources are generated for the system as students pay for their college education (and therefore m a y value it more highly); (2) the university system can respond more effectively to student demand (reflecting relative earnings and shortages in the labour market); and (3) universities are forced to compete for students (in terms of price, quality of education and subsequent marketability of skills provided). In essence, the government's policy inaugurates a demand-driven university system which should translate into better internal efficiency and societal relevance over the previous system.
85

Capacity building and institutional development in higher education in Kenya
Chart 4 . 2 - Cost-sharing
PU
BL
IC S
EC
TO
R
I
SE
CT
OR
IV
ATE
tr Q.
1 r LOAN
AGENCY
i i
GOVERNMENT
mmm
_ !
GRANTS COMMISSION
(CHE)
f W
UNIVERSITY SYSTEM
STUDENTS
4
-
DONOR RESEARCH
GRANTS
DONOR
86

The planning process for public universities
4.4 Revenues diversification system
In a country like K e n y a , w h e r e real earning salaries are l ow and there is high u n e m p l o y m e n t , high population growth and stagnant e c o n o m i c performance , the chances of repaying high e c o n o m i c fees charged up-front or delayed through market loans are lower than elsewhere. Therefore, there is a limit to w h i c h such fees could be raised. In such circumstances, it is prudent that the university system diversifies its sources of revenue b e y o n d the confines of traditional teaching activities.
Indeed, K e n y a n government policy favours such diversification. All funds given to the universities are n o w treated as grants. T h e universities are free to use these funds as they feel necessary as long as financial accountability is maintained. Similarly, funds generated b y the universities b e c o m e the property of the institution to use as it pleases. Therefore, public universities are e n c o u r a g e d to d e v e l o p additional f o r m s of i n c o m e generation. Following is a lists of s o m e of the income-generating activities that a university could easily develop.
(a) sponsored (or contract) research; (b) consultancy; (c) research funded by Research Councils or donors; (d) teaching companies; (e) pick-up courses; (f) conferences; (g) full-cost award bearing courses; (h) letting of university facilities; (i) exploitation of inventions, royalties; (j) service sale; (k) overseas student; (1) sponsorships (industry donations and e n d o w m e n t s ) ; (m) farming; (n) alumni donations.
A university has several reasons for actively involving itself in income generation, including:
(a) as a performance indicator; (b) to develop staff; (c) to strengthen links with employers; (d) for publicity; (e) to increase institutions income;
87

Capacity building and institutional development in higher education in Kenya
Chart 4.3 - Cost-sharing revenue generating system
DC
e o LU CO O - I m
d t a M M ^
GOVERNMENT
DC O I-Ü LU CO
LU
% Œ.
o.
LOAN AGENCY
GRANTS COMMISSION
(CHE)
it n UNIVERSITY
SYSTEM
STUDENTS
Ï ALUMNI
DONOR RESEARCH
GRANTS
T
SERVICES SALES INDUSTRY
88

Vie planning process for public universities
(f) to act as a source of income. Several incentives are available for staff to involve themselves in income
generation activities, including: (a) money ; (b) promotion prospects; (c) staff development; (d) travel abroad; (e) recognition.
T h e revenue diversification system is illustrated in Chart 4.3. In this model the government gives its contribution for tuition through the intermediary grants body.However, other arms of the government are also able to give specific funds to the university system for specific programm e s . At the same time donors (bilateral) can approach the government for specific assistance to a university. Other donors and research supporting agencies are free to approach a university directly for an agreed project.
Similarly, the government gives grants to the loan agency for student loans and bursaries. The means-tested loans and bursaries are given by the agency to the needy students for payment of living expenses and tuition. In return, graduates repay the loan agency, which enables it to lend more m o n e y to deserving students.
The university in turn receives additional revenue from alumni donations, services sales and industry. It is hoped that in future, Kenyan industry will be developed and encouraged through incentives to give funds for research either directly to the university system or through the Research Council. In the past, some industries used to sponsor students directly to the university - it is hoped that this practice will return and more industries will sponsor students for courses which are useful to them. At present, they can utilize the Industrial Training Levy as a start.
The development of a diversified revenue system is a high policy priority in Kenya. It is hoped that a university, w h e n fully developed, could generate between 25 to 40 per cent of its operating revenue. Using these sources of income, it is estimated that public universities would receive in the 1995/ 96 financial year funds ranging from Kshs. 100,721 to Kshs. 177,224 per student. The ability of each institution to generate additional revenue is clearly demonstrated in Table 8. A s competition settles in, it is anticipated that the income of each institution will far exceed the estimates given in the table.
89

Capacity building and institutional development in higher education in Kenya
Table 8. Budgeted recurrent income of public universities (in millions KShs.)
SOURCE OF INCOME
Univ
93/94
(GENERAL INCOME)
(i) Exchequer Grants
(ii) l\ition Direct Loan Scheme
(iii) Others Registration Examination fees Caution fees Postgraduate fees •Catering (Services) I.D Medical Other Services * P . A . Y Eat
784.4
76.6 66.6
0.8 1.6 0.8 62.6
29.8 — — —
33.6
UNIVERSITY/INSTITUTION
. of Nairobi
94/95
943.1
79.9 66.6
0.8 1.6 0.8 62.6
29.8 — — —
33.6
(iv) Special Recurrent Unit Research Grants 86.3 86.3 Contracts Income-generating unit Donation
TOTAL
F . T . S . E
U N I T C O S T
—
~ —
1143.1
13317
—
— ~
95/96
1049.0
103.3 103.3
0.8 1.6 0.8 62.6
90.4 — — —
33.6
86.3 ~
— —
1305.1 1532.7
12918 12918
Kenyatt
93/94
426.8
56.9 47.4
0.9 4.3 —
0.2
21.3 — 1.3
15.7
—
— —
574.8
9490
85837 101030118648 66569
94/95
558.2
56.9 47.4
1.0 4.3 -
0.2
21.2 — 1.8
15.7
0.5 0.02
— 0.05
707.3
8525
i
95/96
622.5
66.6 66.6
1.0 4.3 —
0.2
58.2 —
2.2 15.7
0.7 0.03
— 0.06
838.1
8321
93/94
306.4
39.4 32.9
0.8 3.9 6.6
14.7 — —
6.7
0.03
— —
411.5
6571
Moi
94/95
542.4
24.4 20.4
0.5 2.4 4.1
9.1 — —
4.1
~
— —
607.4
5175
95/96
645.0
39.4 39.4
0.6 2.8 4.7
34.5 — —
4.8
—
— —
771.2
4927
82968 100721 62630 117372156525
90

The planning process for public universities
Table 8 (continued)
EGERTON
Source of income 93/94
(GENERAL INCOME) i) Exchequer Grants 315.4 ii) Tuition Direct Cost-sharing 42.2 Loan Scheme 40.0 iii) Others Registration 0.8 Examination fees 3.2 Caution fees 8.0 Postgraduate fees •Catering Services --•Residence (students) 26.9 I.D. Cards 0.5 Medical 0.8 Other Services • P A Y Eat 67.2 iv) Special Recurrent Income Research Grants 1.1 Contract 0.02 Income-Generating Unit 1.0 Donations
T O T A L 514.3
F.T.S.E 6636
UNIT COST 77508
Average Unit Cost
94/95
516.7
46.4 44.0
0.9 3.5 8.8 ~ -
28.4 —
8.8 —
73.9
1.2 0.02
1.1 -
733.7
7956
95/96
667.1
65.6 65.6
1.0 3.9 9.7 --
57.4 -
9.7 —
81.3
1.4 —
1.2 -
963.9
8198
93/94
157.4
12.9 10.7
0.2 1.3 2.1 --
4.8 — —
0.2 -
— -
— -
149.7
2143
92222 117577 69849
1993/94 69,429.7
JOMO
94/95
184.0
14.5 12.1
0.2 1.4 2.4 --
5.4 —
0.2 —
13.5
— —
— -
233.7
2143
95/96
369.9
20.1 20.1
0.2 1.5 2.5 --
17.6 —
0.2 —
14.1
— —
~ -
446.2
2517
1
93/94
73.0
21.2 19.2
0.05 0.8 0.2 --
0.1 — —
0.05 3.2
0.8 -
0.3 -
109.7
2025
v lASENO
94/95
159.3
13.0 14.0
0.1 0.8 0.3 0.2 -
0.1 — —
0.0 3.5
0.8 —
0.4 0.0
192.5
1501
95/96
257.7
16.8 16.8
0.1 0.9 0.3 0.3 -
14.7 -—
0.0 3.9
0.9 —
0.4 -
312.5
2101
96850 177275 54184 128248 148739
1994/1995 103,115.0
1995/96 136,5809
Notes: * These items are under estimated in all the academic year when one considers
charges approved by government in 1995/96 to be Ksh 18,000 for food, per year respectively. Assumption is m a d e that all students reside in hostel. This is supported by the fact that at university of Nairobi only about 200 students reside outside the hostels in the previous years.
Source: i) Government Printed Recurrent Estimates ii) Universities Financial Plans 1994/95 - 96/97.
91

Capacity building and institutional development in higher education in Kenya
At present, the percentage of university revenue derived from these sources are as follows:
Institution
University of Nairobi Egerton University Kenyatta University M a s e n o University J o m o Kenyatta University of Agriculture and Technology M o i University
per cent
31.6 30.8 25.7 17.5 17.1 16.4
Three institutions already derive more than 25 per cent of their operation revenues from diversified sources. It would be desirable for all of them to aim at reaching 40 per cent.
5. Financial management
T h e dwindling resource base of all higher education institutions in the country should have, as a matter of good management , resulted in the following actions: (a) institutions could have increased revenues from non-government sour
ces such as students or contract income to m a k e up for declining government income;
(b) institutions could have tried to cut back in their activities (i.e. teach fewer students or close inefficient programmes) since they had fewer resources;
(c) institutions could have improved their efficiency by increasing student/ teacher ratios and student administrative staff ratios, improving facility utilization and reducing expenditures on areas such as student welfare.
5.1 The policy environment
T h e fact that our institutions were unable to reconcile enrolment (and other activities) with their resources, nor m a k e efficiency improvements, is a reflection of the policy environment that does not permit (much less encourage) the taking of necessary management decisions.
92

The planning process for public universities
Lately the situation seems to be improving. For instance, the policy on enrolment requires the public universities to admit 10,000 students from 1991 and to increase enrolment by 3 per cent each year. In 1994 and 1995 the public universities admitted less than 10,000 students in each year. T h e universities were able to present their case to the government on the scarcity of resources, physical and fiscal, and were allowed to consolidate their admissions at a figure below the accepted number.
In other areas, the universities have waited for leadership to c o m e from the government, despite stated government policy encouraging them to be efficient and to implement income-generating activities. These are legacies of the past and will require n e w concerted efforts and new ways of thinking for them to change. It is the view of the author that the government would not be opposed to the implementation of efficiency measures undertaken by the institutions.
However, in exercising the autonomy given to the institutions by the government in deciding admissions, hiring policies, deployment of resources on types of activities to undertake and freedom of expression, it is important to remember that these are privileges and a responsibility given to the academic community. A n y institution using public funds has an obligation to show h o w those funds are used. There is a need for a clear enunciation of academic, research and other goals, and an accounting of h o w and under what conditions and costs such goals have been met.
In the recent past, public universities have found themselves trapped between student politics and government policy. The student demand for more welfare support drained the scarce resources available for quality teaching. At the same time, government policy did not allow the institutions to break away from the trap. In a desperate effort to maintain academic standards, the institutions attempted to improve student/staff ratios by employing more staff. The substitution of teaching staff for other university inputs have not only m a d e staff salaries decline but have progressively m a d e teachers cheaper in relation to other university inputs. T h e often quoted low student/staff ratios m a y have masked falls in quality of education provisions, as m u c h of the expansion in academic staff numbers has been in the form of additional junior, inexperienced staff. The experienced staff have complicated the situation by having to hold multiple jobs in response to low, and falling, real salaries.
Therefore, any future reforms in university financial management should begin with the tasks of re-evaluation of student enrolment, academic
93

Capacity building and institutional development in higher education in Kenya
programmes and efficiency performance and improvement. In the proposed diversified revenue system, care should be taken that the drive for raising finance does not overtake and overshadow the mission of the institutions to teach and carry out research. It is evident that in order to achieve the new challenges of reform and maintain the institutions' missions, a priority should be to change the structure of these institutions.
5 .2 Institution reforms
The Acts of various public universities set out organs that are necessary for financial planning and management. For example, there is the University Council and Senate. The two organs have committees like the Deans Committee which handles academic programmes, the Development Planning Committee, which handles planning matters while Council has committees for finance and general purposes. These committees have never worked together in the planning and management of university resources. For example, the Deans Committee would recommend that the Senate approve academic programmes without reference to the resource needs of such programmes. The Development and Planning Committee would allocate resources for departments without adequate academic plans of the course offered in the department. The most important Council committee rarely meets.
It is proposed that this system should be changed as shown in Chart 4.4.
The proposal assumes that an institution has established its mission and objectives through planning.
In the proposed new management system the Vice-Chancellor chairs the most important Central Management Committee. The committee would in turn plan the generation and utilization of institution resources. It would devolve the power and responsibility on income generation and expenditure to the lower organs and thereafter monitors the planning and budgeting cycle as shown Chart 4.5.
The activities involved in each step are summarized in Appendix 1.
94

Wie planning process for public universities
Chart 4.4 - New management system
SENATE VICE-CHANCELLOR <4 • * • * « COUNCIL
EDUCATIONAL POLICY COMMITTEE
V •
I I
FINANCE & GENERAL PURPOSE COMMITTEE
CENTRAL MANAGEMENT
GROUP*
yjt T i D.V-CHANCELLOR
ACADEMIC D.V-CHANCELLOR ADMIN & FINANCE
D.V-CHANCELLOR STUDENT AFFAIRS
T* • t HEADS OF ACADEMIC
SUPPORT SERVICES
HEADS OF PLANNING UNITS
HEADS OF DEPARTMENTS
HEADS OF ADMIN. & OTHER SUPPORT
SERVICES
Members of Central Management Group The Deputy Vice-Chancellor Academic The Deputy Vice-Chancellor Ad ministration and Finance The Deputy Vice-Chancellor Student Affairs
Key
Other Deputy Vice-Chancellors, Dean of Faculties Registrars, Senate and Council Representatives. In Attendance Deputy Registrars Finance Officer Other Senior Officers as necessary.
Advisory and reporting links Lines of allocation of recourse and expenditure Lines of financial responsibility (expenditure and income where appropriate) Council has authority over Vice-Chancellor but nominates him as financially responsible to the funding Commission
95
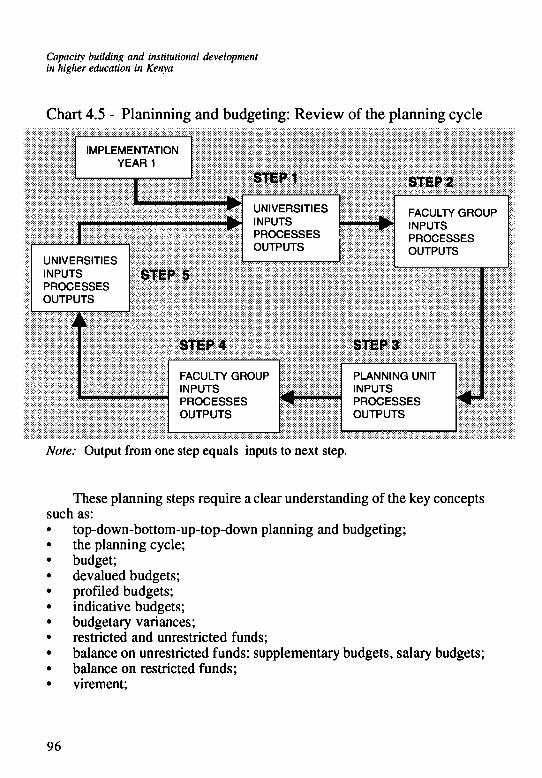
Capacity building and institutional development in higher education in Kenya
Chart 4.5 - Planinning and budgeting: R e v i e w of the planning cycle
IMPLEMENTATION YEAR1
STEP1
UNIVERSITIES INPUTS PROCESSES OUTPUTS
UNIVERSITIES INPUTS PROCESSES OUTPUTS
STEP 5
STEP 4
FACULTY GROUP INPUTS PROCESSES OUTPUTS
STEP 2
FACULTY GROUP INPUTS PROCESSES OUTPUTS
STEP 3
PLANNING UNIT INPUTS PROCESSES OUTPUTS
Note: Output from one step equals inputs to next step.
These planning steps require a clear understanding of the key concepts such as: • top-down-bottom-up-top-down planning and budgeting; • the planning cycle; • budget; • devalued budgets; • profiled budgets; • indicative budgets; • budgetary variances; • restricted and unrestricted funds; • balance on unrestricted funds: supplementary budgets, salary budgets; • balance on restricted funds; • virement;
96

Wie planning process for public universities
• contingency fund; and • assistance funds.
The definition of these key concepts is given in Appendix 2.
For the new system to succeed, the role and office of the Dean of Faculty needs to be reviewed, and one aim should be to strengthen it. The holder of this office should be able to be in office for at least three years with a possibility of one renewal. That person should be responsible for the academic appointments and expenditures. T h e devolution of staff appointment to the faculty would relieve the Vice-Chancellor and his deputies from these duties and allow the opportunity to plan and manage the institution. Checks and balances should be established to ensure that c o m m o n standards for appointment are applicable across the various faculties.
The planning process requires that a system of evaluating performance be put in place. Performance indicators can be such that a mix of both objective and subjective indicators are used for evaluation. The design of performance evaluation requires the assistance and involvement of the Commission for Higher Education. Once developed it should be used across all higher education institutions. The following is a list of widely used performance indicators for universities. (a) N u m b e r of applicants per undergraduate place. (b) Entry score of undergraduate intake. (c) Classification or number of honours degrees awarded. (d) Student wastage rates (drop-out-rates). (e) Staff workload (as measured by typical contact hours, course taught,
class size and administrative responsibilities). (f) Employability of graduates. (g) Postgraduate completion rates. (h) Research grants and contract (external). (i) Research scholarships a w a r d e d by particular bodies. (j) Records of publications. (k) Student load and analysis of student numbers. (1) Staff-student ratios. (m) Unit costs. (n) Staff numbers according to category. (o) Institutions income and expenditure.
97
Capacity building and institutional development in higlier education in Kenya
(p) Departmental equipment and recurrent grant and expenditure.
The data on these indicators and any other decided for inclusion should be m a d e easily available and compiled by C H E for easy comparison.
Lastly, the benefits accruing from the proposed planning and budgeting process are as follows: (a) It will help to ensure that plans developed in different parts of the
university are clearly related to the broad strategy for the whole university.
(b) It will help ensure that the plans of different parts of the university are related so each other.
(c) T h e development of plans for different activities will be the responsibility of those best placed to do so.
(d) T h e allocation of resources will be consistent with agreed plans. (e) The Chief Executive Officer will be involved in planning and budgeting
for the institution. This should improve the implementation of the budget plan.
98

Chapter V
Implications for university education
reforms in Kenya
1. Lessons from experience
In July 1991, the Kenyan government implemented the Education Sector Adjustment Policy. The policy became the foundation framework upon which Education Sector Adjustment Credit ( E D S A C ) was negotiated with the International Development Association, World Bank. In the policy paper, the government outlined the reforms to be implemented during the E D S A C period (1991-1996) to include, among other things, access improvement; quality improvements; education budget rationalization; and strengthening sector management planning, budgeting and information systems.
A summary of the government policy on the above areas is given below:
Access and equity: The government intends to continue expanding enrolments as a way of serving equity objectives by opening up the system to students from a wider range of socio-economic backgrounds from different parts of the country.
Admission and enrolment: After the large enrolment increase in 1990/
99
Capacity building and institutional development in higher education in Kenya
91, the government started regulating the admissions to the universities in order to allow a period of consolidation. Admission for 1991/92 was pegged at 10,000 students and thereafter the annual admission growth was capped at 3 per cent per annum - that is, admission not to exceed 10,300 in 1992; 10,600 in 1993, etc.In 1991/92 and 1992/93 there were 9,454 and 10,189 admissions respectively. In 1993/94 and 1994/95 there were about 8,390 and 8,900 students admitted respectively. Future admission policies will be governed by the number of secondary school leavers, capacity of universities, availability of national financial resources and needs of the economy for manpower. At present, the universities have been allowed to stabilize their admissions until physical facilities and resources are improved.
'Last resort' employment : At the same time, the government will continue to implement its policy whereby the public sector has ceased to be a 'last-resort' employer for university graduates w h o are unable to find alternative employment. Unemployed graduates is currently one of the serious issues facing higher education - and the country as a whole. The policy is to stimulate private enterprises to create more employment opportunities. This has not been very successful given the slow or stagnant economic growth of the past years. Economic growth has been predicted and it is hoped that employment opportunities will increase.
Expansion of tertiary institutions: In order to help diffuse pressure a w a y from public universities, and to address national m a n p o w e r imbalances, the expansion of other public tertiary institutions will be planned. Private sector tertiary institutions will be encouraged to increase enrolments during the structural adjustment period. Three private universities have already been chartered, and several others are being considered for charter. Table 11 gives enrolment in university institutions.
Quality of education: In addition to restricting university enrolment, course offerings across the five universities will be rationalized, including the amalgamation of programmes with small enrolments, so that programm e s of excellent quality in relation to stated areas of national importance can develop. This m o v e will protect and ultimately enhance the quality of university education and permit teaching staff to develop their skills and professional standing through research, further study and interaction with the critical mass of colleagues in their o w n area of concentration. Universities have been requested to review their programmes with a view to improving course content. It is still too early to predict the outcome of proposed changes.
100

Implications for university education reforms in Kenya
Table 11. Total enrolment in university institutions 1994/95
Institution
Kenyatta Univers.
Moi Uuniversity
Maseno Uunivers.
Nairobi University
(1) Jomo Kenyaita university of Agriculture & Techology
St.Paul United Theological College
(2) E . A School of Theology College
Nairobi International School of Theology
Daystar University
U S I U (Africa)
(3) Nairobi Evangelical Graduate School of Theology
University of Eastern Africa, Baratón
(4) Kenya Highlands Bible College
(5) Catholic University of Eastern Africa
(6) Egerton Univ.
Scott Theological College
Pan Africa Christian College
Africa Nazarene University
Total
Under-Graduates M
5798
3876
901
9697
1394
102
40
37
386
473
4
468
27
854
5938
47
76
46
29310
F
2677
1369
490
2866
159
15
6
1
514
550
-
388
8
-1934
9
4
19
11009
T
8475
5245
1391
12563
1553
115
46
38
900
1023
-
856
35
-7873
56
80
65
41168
%F
31.6
26.1
35.2
22.8
10.2
13.0
13.0
2.6
57.1
53.8
-
45.3
22.0
-24.5
16.1
5.0
29.2
26.7
Post-Graduates M
77
164
4
824
24
-
-
33
30
73
53
-
-
128
----
1282
F
36
47
-224
6
-
-
3
19
47
14
-
-
-
----
396
T
113
211
4
1052
30
-
-
36
49
117
67
-
-
-
----
1087
%F
31.9
22.3
0
21.3
20.0
-
-
8.3
38.8
40.2
20.9
-
-
-
----
Grand Total % F M
5875
4040
905
1052
1418
102
40
70
416
546
53
468
27
982
5938
47
76
46
21.9 3058
F
2713
1416
490
3090
165
15
6
4
533
574
14
388
8
-1938
9
4
19
11382
T
8588
5456
1395
13615
1583
115
46
74
949
1160
67
856
35
7873
56
80
65
42995
%F
31.6
26.0
35.2
22.7
10.4
13.0
13.0
5.4
56.2
49.5
20.9
45.3
22.0
24.56
16.1
5.0
29.2
26.5
1. There are also 474 male, 76 female, 550 total Dip loma students with 13.8 per cent female ratio, enrolled at the university.
2. There are 84 male, 15 female, 99 total Diploma students with 15.2 per cent female ratio enrolled at the college.
3. There are also 12 female Diploma and 8 female certificate students enrolled at the college. 4. There are 44 male, 28 female, 72 total Advanced Diploma students enrolled with 38.9 per cent
female ratio at the college. 5. Includes 66 postgraduate diploma students. Female enrolment is estimated at 50 per cent. 6. Enrolment breakdown is for 1992/93 academic year only.
101

Capacity building and institutional development in higher education in Kenya
Education recurrent budget: Kenya has a high level of expenditure on education which constitutes about 25 per cent of total expenditure (37 per cent of recurrent expenditure). At 6.7 per cent of G N P , public expenditure on education has probably reached its limit. In order to reduce the rate of growth of the education recurrent budget, the government has introduced measures that will restrain the growth of the teaching force and will control the expansion of higher education. A m o n g the specific policy measures to be effected in the university education sub-sector are the following:
(a) setting a ceiling of 20 per cent in the universities' share of the recurrent ministry of the education budget;
(b) introduction of direct tuition fee of Kshs. 6,000 per student per year starting from 1991/92 academic year;
(c) changes in the student loan scheme.
All the proposed changes have been implemented, as described in Chapters II and III.
Strengthening sector management, planning, budgeting and information systems: M a n a g e m e n t practices and planning capacity have not generally kept pace with the rapid and complex expansion of the education system. During the adjustment programme period, the government will take action on three fronts. First, educational managers, administrators, supervisors and planners will be trained in a variety of areas for more effective management and service delivery. Second, appropriate and accurate information data collection systems will be established in order to facilitate more policy analysis, planning and informed decision-making. Third, in order to co-ordinate and maximize the benefits derived from the nation's higher education institutions (both public and private) and to plan centrally for the future expansion of this sub-sector, the Commission for Higher Education ( C H E ) will be strengthened and expanded before 1994.
T h e expanded C H E will carry out the function of overseeing the development and expansion of higher education, with special reference to co-ordinating the planning, programming, financing and budgeting of the public universities. Between 1992 and 1994, critical functions of policy formulation and planning, budgeting and financing were undertaken by the Policy and Planning Task Group formed within the Ministry of Education in July 1991.
102

Implications for university education reforms in Kenya
Several training sessions have been held for sector managers. Under the Credit, several administrative staff have had been trained or are in training at Master's level. It is still uncertain h o w the trained personnel will be utilized w h e n they return to their posts.
In the area of budgeting, public universities produced a three-year financial plan. Analysis of the performance of the financial plan is given below.
1.1 Recurrent expenditures
F r o m the consolidated public universities' financial plan, the government grants are expected to continue providing the bulk of these institutions' recurrent income. As shown in the Table 12, in 1994/95 the government will provide about 67 per cent of the total expected recurrent income to all the public universities. In the subsequent two years, the government grants will fall slightly to 61 per cent in 1995/96 and 62 per cent in 1996/97, the total expected recurrent income of all public universities. Although the foregoing dependence on government grants m a y seem high, these levels are m u c h lower compared to past financial relations. Table 13 below gives a clear indication of the past dependence by public universities on their sponsors.
Table 12. Public universities' consolidated recurrent income and expenditure plan and planned exchequer grants 1994/95-1996/97 (in millions of K e n y a Shillings)
Year Income
1994/95
1995/96
1996/97
Total Exp
4320
4960
5580
Total Grants Income
4600
5140
5700
Exchequer Grants
2880
3020
3420
% Exchequer Grants
67%
61%
62%
% Exchequer Grants:Exp
63%
59%
60%
Source: Commission for Higher Education September 1994. The consolidated Financial Plan for Public Universities (1994/1995-1996/97).
103

Capacity building and institutional development in higher education in Kenya
Table 10. Extent of dependence by selected universities on their sponsors in their total recurrent income.
Percentage of sponsors grants: total income
N a m e of Institution University of Nairobi
Kenyatta University
Moi University
University of Eastern Africa-Baraton
Main Sponsor
Govt
Govt
Govt
SDA Church
1994
—
—
-
5%
1993
..
--
—
1992
68%
-
~
1991
88%
92%
77%
~
1990
76%
79%
-
—
1989
93%
96%
80%
-
Source: Various annual reports and accounts of institutions
A m o n g the public universities, the dependence on government finances has been relatively high (the University of Nairobi derived 93 per cent of its income in 1988/9 from grants), the contribution of government grants to total income declined steadily over the years, and stood at 68 per cent in 1992/93. The level of dependency on government grants was even higher for Kenyatta University. Kenyatta University derived 96 per cent of its income in 1988/89 from government grants, and although there was a decline in dependence on government grants, this still stood at 92 per cent in 1990/ 91. M o i University's dependence on government financing stood at between 80 and 77 per cent between the years 1988/89 and 1991/92.
In order for the public universities to reduce their present high dependency levels on government grants to levels just above 60 per cent as indicated in their financial plans, they must put m u c h more emphasis on their fund-raising activities. The public universities' staff believe that diversification of their sources of income depends on government policy. The public universities could generate m u c h more of their income from fees by raising the fees they charge the students, a decision that still lies largely with the government.
104

Implications for university education reforms in Kenya
Given the fact that any future government expenditure levels depend heavily on the performance of the economy, the actual exchequer allocations to public universities will be greatly influenced by the performance of the Kenyan economy and its future relations with donors. Thus the heavy reliance on government financing places serious uncertainties as regards programming of the Kenyan public universities in the foreseeable future.
1.2 Planned recurrent budget deficits
It is interesting to note that the recurrent financial plans of Jomo K e -nyatta University of Agriculture and Technology, Maseno University College, M o i University and the University of Nairobi individually post surpluses in each of the years during the financial planning period. The deficits posted by Kenyatta and Egerton universities in 1994/95 and by Kenyatta University in 1995/96 and 1996/97, however, lead to an overall deficit of K P 29,734,727 for the public universities taken together throughout the financial planning period. The table below indicates the net recurrent budget surplus and deficits of each public university.
Table 11. S u m m a r y of total recurrent b"dget net surpluses/deficits of public universities (1994/95-1996/97)
N a m e of University
Egerton Univ. JKUCAT Kenyatta Univ. Maseno Univ. College Moi University University of Nairobi
Total
1994/95
(6,616,053) 4,297
122,40,680 1,459,684 239,613
2,901,757
(14,251,382)
1995/96
nil 314,905
(15,415,881) 75,0821 451,000
4,990,000
(8,909,155)
1996/97
nil 32,145
(15,668,245) 43,098
2,662,748 6,356,064
(6,574,190)
Source: Commission for Higher Education (1994) Consolidated Financial Plan for Public Universities (1994/95-1996/97).
105

Capacity building and institutional development in higher education in Kenya
It is not clear w h y Kenyatta University posts such huge recurrent deficits in each of the years of the financial planning period w h e n other universities plan to post budget surpluses. Kenyatta University's recurrent deficits are even more puzzling in the sense that the essence of financial forecasting should aid an institution's management to foresee any future financial bottlenecks in advance, in order to provide for appropriate solutions in the financial planning process. In view of anticipated recurrent budget deficits of Egerton University throughout the planning period, it is only appropriate that either the institution sources funds from non-traditional source or plans to cut d o w n on certain of its expenditure to ensure that it realigns its operation to its resource base.
It is important to note that all public universities post deficits in their recurrent budgets on student accommodation and catering in 1994/95. It should also be noted that the deficit in this area is more than 98 per cent of the overall deficit for the year 1994/95 budget in respect of Kenyatta University. T h e foregoing is als^ reflected in the past public universities' huge deficits from catering and accommodation of students. In the past such deficits in catering and accommodation have led to either huge pending bills and or diversion of funds from other departments (mostly teaching) - a fact that must have had quality implications for university teaching.
Finally, the planned recurrent budget deficits for Egerton in 1994/95 and Kenyatta University throughout the planning period further complicate these institutions' pending bills settlement arrangements. It should be noted that the planned deficits will likely result in m o r e accumulations of pending bills by institutions concerned over the entire financial planning period. Thus, debt repayment schedules that are envisaged in these plans m a y be difficult to defend.
1.3 Development plan
The university institutions are yet to complete their development plans. So far, the format outlined in Chapter Three was accepted and used by five out of six institutions. T h e sixth institution has also planned using the modified format. It is not clear h o w the final consolidated plans will c o m e out. However , the C H E is to finalize the plan which will be incorporated into the national Education Plan.
106

Implications for university education reforms in Kenya
C H E has been strengthened, and the government has announced its intention to introduce the proposed harmonized higher education bill in the next Parliament. However, these reforms are yet to take root and reverse the downward trend that prevails in higher education.
As the reform period draws to a close, the experience gained so far indicates that the policy as formulated in 1991 will not be fully met. The lesson learnt is that before a policy is formulated there should be widespread discussion of the policy and its general acceptance by the stakeholders, including those w h o will implement it. In this case, government policy was basically written by Treasury officials. Although by law, Treasury is empowered to commit the government in financial matters, and assuming the principle of c o m m o n and joint responsibility of the government as binding to all ministries, in the case of the university subsector, where the implementors and the stakeholders do not necessarily adhere to normal government procedures, it is important that the full commitment of the university community and other stakeholders is assured on any future policy that aims at reform of the system.
It was often evident to the author during the implementation of the project that the commitment of the university institutions to the reform was far from total. Indeed, the university community viewed the project as government's and not theirs. The general academic and financial state of the public universities has deteriorated during the reform period instead of improving. T h e morale of the academic and non-academic staff in these institutions is low. The prolonged union agitation and consequent stalemate has not improved the delivery system of academic programmes, the efficiency of administration, nor the heavy financial burden on the institutions and students. As these issues drag on without any solution in sight, the quality of university education declines. Today w e have a high proportion of staff w h o must concentrate on personal economic survival activities (PESA) . Matters of academic pursuit and research have been abandoned. W e are therefore sacrificing a generation of students whose only fault is to join these institutions at a wrong time. Unless what ails the public universities is corrected urgently, w e are at the crossroad of spending fifteen to twenty years of inferior university education in Kenya. It will take 15 to 20 years to retire the present lot of staff whose average age is about 35 years. The above period is the m i n i m u m , assuming things do not get worse.
107

Capacity building and institutional development in higher education in Kenya
O n the other hand, the trend could be reversed in a shorter time if meaningful restructuring is done now. This could include laying off excess staff and offering competitive terms of service to those remaining; completing facilities for teaching; taking care of students' welfare; and purchasing teaching and research equipment.
A n acceptance by the government and the university community of the existence of a crisis in university education is a first step. Commitment by the government and the university community to seeking permanent solution is a second bitter pill. A b o v e all, putting into place a legal and financial framework that would enable employment of disciplined and dedicated administrators and academic staff to restore excellence would greatly enhance the faith in the once-respected public universities. A delay in taking action will sacrifice all that the people of Kenya have built at great cost for their children and grandchildren.
2. Implications for the future
O n e hopes that public universities can be saved from decay, apathy and academic ruin. Because of this hope, people are willing to put themselves on the line by writing about the system. First, it should be appreciated that public universities are respected institutions, by most, if not all Kenyans. Every family aspires to have a university graduate. Second, the cost of educating a child at private or overseas universities is out of the reach of most families. Third, K e n y a has built very respected universities which have served the country well. These institutions deserve to be saved — and should be saved from ruin by public demand. The contribution of public universities to the social and economic development of the country is incontestable. The question being raised n o w is whether these institutions will play any meaningful role in the future.
Universities as institutions are recognized for their conservatism. A b o v e all, they resist any change, perceived or real. Universities have perfected their governance over the years and they follow the often-accepted governance policies of Oxford and Cambridge universities. The irony of Kenyan public universities is that they follow the governance of older universities which have recently discarded their old traditions of governance and are n o w operating as corporations. Nevertheless, traditions take time to fade away. If w e are to change the traditions of our public universities, then
108

Implications for university education reforms in Kenya
the E D S A C project teaches us that a government cannot dictate change to a university. For change to occur, it must arise from within the university institution. The role of the government is to formulate policy. In doing so, the policy should be explained and understood by the university.
It is unrealistic to think that a university can generate sufficient resources from within and without its boundary for a first class academic programme. Support of universities either through taxes or through systems of donation, endowment or grants by the public is necessary. It is important to emphasize that it is the social responsibility of the government to help university institutions, public or private, if high-quality trained m a n p o w e r needed for development is to be achieved.
However, in supporting universities, the role of a government should be restricted to benign guidance through fiscal and education policies and control. Direct involvement by governments in the running of universities accelerate their demise. A corporate partnership between the government and the university is needed. In this partnership no one partner has a monopolistic share. O n the other hand, the university cannot m o v e without the consent of the government. At the same time, government policy cannot be implemented without acceptance by the university. Kenya needs to learn h o w to m a k e this partnership work. W h e n perfected, it will achieve lasting results.
Political decisions which impact on the masses are difficult to m a k e . They require skilled statesmanship. In some cases, such decisions would involve rejection at the polls - the nemesis of every politician. N o politician would like to be associated with a decision that increases cost to the public. While this political dilemma is appreciated, it is also true that no politician would like to be judged by history as the destroyer of institutions.
People in Kenya have tended to put off decisions that are bitter to swallow. B y dithering, w e have leased untold suffering to our children's education. Full government support in education reform is urgently needed if w e are to restore faith in the system. I a m convinced that Kenyans would support their government if a fuller explanation is given for the policy. A b o v e all, if all stakeholders are involved in policy formulation and implementation, a lasting consensus would be built. In matters of education that affect every household there are few shortcuts to fuller public involvement in policy decisions.
109

Appendix 1
S u m m a r y of report on the review for the establishment of an institution to
manage the university students loan scheme.
1. Introduction
(i) The Ministry of Education, having been charged with the responsibility of managing the University Loan Scheme, has m ade efforts to disburse and to recover the loans over the years since 1974. In the process of executing this task, the Ministry of Education continues to liaise with various Government Departments and has also responded to the Government Policy guidelines on issues pertaining to the University Students Loan Scheme.
(ii) The report of the Review Committee has covered a wide cross-section of issues pertaining to the Students Loan Scheme and m a d e various recommendations. S o m e of the recommendations are in the process of Implementation but would require enhancement through provisions of material and financial resources. However, other recommendations require new directions in the managerial process.
2. Cost-sharing
(i) The University Students Loan Scheme was introduced in 1974 as a basis for cost-sharing and cost recovery in higher education. The mechanism for implementing the cost-sharing strategy has been modified over the years to respond to the inflationary trends and other social and economic factors. The recent structural adjustment on the student loans enhanced the financial contribution by the beneficiaries not only through the loans as a deferred cost recovery but through di-
110

Appendix I
rect cost sharing in payment of statutory fees. University students are required to pay a direct charge of K S h s . 6 , 0 0 0 effective from academic year 1991/92.
(ii) T h e recommendations of the Rev iew Committee Report pertaining to the cost-sharing are in conformity with the Government Policy that:
(a) the G o v e r n m e n t should continue to bear the major cost of financing university education.
(b)the students should bear part of the cost of their education. (c)the G o v e r n m e n t should eliminate subsidies and institute
bursaries and scholarships based on merit and give additional loans to needy students.
(d)the students should be protected from the risks involved in higher education.
(e) loan should be related to the future earnings of the borrower and should not be treated as commercial loans.
(f) to maintain the value of the loan, the public should pay differential costs.
(g)the G o v e r n m e n t should explore the possibility of using Industrial Training L e v y for higher education.
(h)universities should solicit funds for academic a w a r d s , scholarships, research and development.
(i) loanees should have the option to repay the loan in a l u m p s u m or by equal instalments in accordance with their income.
3. Loan recovery
T h e Review Commit tee has deliberated on the effective mechan i sm for the recovery of loans which could be adopted by the m a n a g e m e n t and m a d e recommendations accordingly:
(a) that specific periods of recovery be given to the loanees in accordance with the stipulated grace periods agreed upon.
(b)that detailed recovery records for loans advanced from 1974 to 1990 should be m a d e available to the Board of Trustees for smooth recovery process,
(c) that repeaters w h o took m o r e than six years should be given six months grace period.
(d)that all loans which had not been paid or were being paid but defaulted should be recalled immediately in full.
Ill

Capacity building and institutional development in higher education in Kenya
(e) required that the old loans should be recovered o n the basis of 2 per cent c o m p o u n d interest.
(f) m a k e all loans repayable in equal instalments. (g)require that loanees w h o s e grace period had not expired and
had not started repaying form 1974/75 to 1991/92 should be given a reminder o n the dates w h e n their loans w e r e due to mature for repayment.
(h) require that all loans not repaid between 1977/78 and 1989/90 and still not being repaid should be recalled in full.
(i) ensure that all loanees w h o started repaying their loans should be allowed to continue repaying.
4. Proposed changes
(i) The Review Committee has proposed n e w strategies for the management of Students Loan Scheme in the disbursement, recovery and the general approach to the management mechanism. The recommendations which require Government decisions are:
(a) that all Kenyan citizens should be eligible for loans. (b)that loans should be given to all needy students w h o met the
m i n i m u m entry requirements for admission to public universities,
(c) that students joining other universities and polytechnics for Higher National Diploma be given loans subject to the inclusion of the admitting institution into the schedule by the minister responsible for education.
(d)that university admission continues to be based on merit, performance at university entrance examination, availability of space in public universities, and consideration for national manpower needs.
(e)that universities be provided with funds for bursaries and shcolarships for academically gifted students.
(f) require that a higher interest of 11.5 per cent based on the past inflation rates be charged to the defaulters of loans given between 1974 and 1988 to cover the value of the m o n e y loaned.
(ii) The Review Committee has recommended changes in the legislation in the establishment of a n e w body to manage the Students Loan Scheme and in the general management of the fund. T h e following recommen-
112

Appendix I
dations reflect on the proposed changes in the legislation, including the proposed Higher Education Loans P r o g r a m m e Bill, 1991:
(a) require the graduates to declare that they were loanees. (b) require loanees to give authority for deduction and remittance
of premiums from their earnings. (c) require employers to recover and remit loan deductions from
loanees' salaries to the Trustees. (d) inspect employers records. (e) to make follow-ups through their parents/guardians in cases
of emigrants as well as loanees w h o leave the country. (f) give a waiver to permanently incapacitated loanees. (g) in case of death the loan should be written off if the Treasury is
satisfied that the loanee has not left behind an estate of his o w n which could be brought to pay the loan.
(h)to arrange insurance cover for death or permanent disability and to charge these expenses on the loans,
(i) require that every loanee should have information on h o w his loan was being recovered including balances,
(j) that a student will be ultimately responsible for the repayment of the full amount of loans with interest advanced to him by HELP.
(k)that the interest of 2.5 per cent would be charged to all loans advanced to students b y H E L P .
(1) that all loans should have a grace period of one year, ( m ) that all loans shall be repaid in a period of 10 to 15 years. (n)that loanees should not use m o r e that 3 0 per cent of their gross
salaries in loan repayment. (o)that the Limitation of Actions Act (Cap.22) be a m e n d e d to
facilitate the recovery of loans. (p)that the proposed a m e n d m e n t s be applied retroactively. (q)that funds for the proposed H E L P be raised inter alia from the
following sources: Treasury allocation Recoveries from past loans Local borrowing Credit arrangements from external sources Donations I n c o m e generated from investments.
113

Capacity building and institutional development in higher education in Kenya
(r) that the new loan institution should have corporate status, (s) that the name of the proposed institution shall be Higher Edu
cation Loan Programme Trustee, (t) that the following establishment be provided for the proposed
institution: a) Managing Trustees
1 Personal Secretary 1 Shorthand Typist
Legal Unit 1 Senior Legal Officer 1 Legal Officer 1 Shorthand Typist
Planning Unit 1 Senior Planning Officer 1 Economist 1 Shorthand Typist 1 Clerical Officer
Audit Unit 1 Internal Auditor 1 Assistant Auditor 1 Copy Typist
N . B . - 1 messenger will serve the legal, planning and audit units.
(b) Operations Department 1 General Manager (Operations) Accounting Manager Accountant (Disbursement) 1 Accountant (Recovery) 1 Senior Systems Analyst 1 Senior Loans Inspector 4 Loans Inspectors 2 Personal Secretaries 3 Messengers 13 Clerical Officers 2 Shorthand Typists 5 Computer Operators
114

Appendix I
(c) Administration and Finance Department General Manager (Administration and Finance) 1 Chief Accountant 1 Senior Personnel Officer 1 Senior Administrative Officer 1 Investment Officer 1 Accountant (Internal Services) 1 Public Relations Officer 3 Executive Officers 1 Supplies Officer 1 Security Officer 1 Personnel Assistant 1 Personal Secretary 1 Shorthand Typist 5 Messengers 1 Storeman 8 Security Wardens 1 Gardener/Cleaner 1 Cook 2 Telephone Operators 1 Accounts Assistant 6 Clerical Officers 6 Drivers 3 Receptionists 5 Cleaners
5. Prepared documents
The Review Committee appended the following documents to the Report:
(i) Limitation of Actions (Amendment) Bill, 1991. (ii) Higher Education Loans Programme Bill, 1991. (iii) Job Descriptions of the Higher Education Loans Programme. (iv) Functional Office Space for Higher Education Programme. (v) Establishment of Higher Education Loans programme and salary scales. (vi) Furniture Requirements for Higher Education Loans Programme. (vii) Proposed structural chart for Higher Education Loans Programme. (viii)Loan Application Forms. (ix) Loan Agreement Form. (x) Rules Governing the Granting of Loans.
115

Appendix 2
Planning and budgeting: some key concepts
Introduction
1. A number of concepts which underpin the new planning and budgeting process are either new to the university, or are intended to convey n e w meanings. However, it is important to note that the system themselves are not new. They are already operated very successfully by m a n y different organisations, in both the public and private sectors.
2. This Appendix seeks to clarify the meaning of some of the key concepts underpinning these planning and budgeting systems in order to minimise the possibility of misunderstanding or confusion.
K e y concepts
X.'Top-down-bottom-up-top-dowri planning and budgeting
The "top-down - bottom-up - top-down1 method of planning and budgeting is a means ensuring that the process of planning is participative and that the resulting budgetary agreements reflect both corporate expectations and departmental priorities. It involves three steps. T h e first two are planning, the third budgeting.
Firstly, 'top-down' guidance is given from senior management on the strategic and budgetary parameters likely to apply to the planning period. This guidance will have taken into account various factors (economic, social and political) likely to influence universities in general, and the University institution in particular. The intention here is to provide sufficient guidance d o w n the management hierarchy so that stage two (the 'bottom-up' process) results in a realistic set of alternative proposals
116

Appendix 2
Secondly, in the light of this 'top-down' guidance, the university begins its detailed planning, first at Department level, then at Planning Unit level, and finally at Faculty Group and University level. At each stage in this process, alternative plans - duly costed and summarised - are explored and prioritised until finally the University is in a position to m a k e informed choices between alternative (costed) courses of action.
Thirdly, having selected the most attractive options, the University sets its budgets accordingly, passing these d o w n the management hierarchy in steps through Faculty Groups, Planning Units, and Departments.
2. The planning cycle
A s depicted in Chart 3.2, the n e w planning and budgeting process should be thought of as a rolling cycle and not as a series of isolated annual events. T h e indicative budgets for years 2 and 3 will normally be the starting point for the next iteration of the process. Hence, forward planning is built into the system and, over time, the determination of the actual year 1 budget should c o m e to be seen as a progressive refinement of previous plans. Nevertheless, establishing this cycle in the first instance will be difficult, and first few years of operation will no doubt reveal or highlight problems that w e shall need to address. These problems must be expected, and should be seen as opportunities to learn from experience and to improve the process over time. Only in this w a y are w e likely to realise the full benefits of devolution, e.g. budget holders with more power (and commensurate responsibility) pursuing plans and controlling budgets that are locally 'owned' as well as globally coherent.
3. Budgets
A s noted above, the University selects plans from a range of alternatives under consideration. This selection is then reflected in the budgets set. A budget therefore represents a plan expressed in monetary terms, and is useful both as a c o m m o n denominator applicable to all activities, and as a device for monitoring financial progress and outcomes.
A budget is the numerical expression of a plan. It is an allocation of authority to commit the University to limit expenditure in pursuit of an agreed plan - not merely an allocation of resources. Indeed, the central purpose of the n e w planning and budgeting system is to ensure that decisions
117

Capacity building and institutional development in higher education in Kenya
about the allocation of resources will in future reflect judgements about the relative value of alternative plans.
A budget should not be thought of as an allocation of 'cash' which irrevocably passes to the budget holder, but a conditional allocation of authority and responsibility. It does not imply a freedom to exceed the agreed expenditure limit, or to ignore the agreed plan. N o r does it preclude the University from amending the budget if this becomes necessary for fiscal reason, or imply that the budget holder owns or controls any part of the University's income stream.
4. Devolved budget
Devolved budgeting assumes that those w h o are closest to the point of delivery of the services provided by and within the University will normally be best placed to choose between alternative courses of action. However, the devolution of budgets is only truly effective where the budget holder has control of the relevant costs and is held accountable for his\her performance against budget.
This form of budgeting is not new to the University. Class grants, demonstrator grant and research equipment grants are all example of devolved budgets which have been in operation for m a n y years. In addition, there are already a number of trading or quasi-trading units (e.g. Residences and Catering) where fully-devolved budgets need to operate.
All budgets will be re-examined over the next couple of years to see what further scope there is for devolution. Initially, staff costs will be controlled at Faculty Group level, and non-staff costs at Planning Unit (and department) level, but the University might expect to m o v e the detailed control of pay costs into line with those of non-pay costs, as and when circumstance permit.
5. Profile budget
The intention of financial monitoring is to focus on problems, or potential problems, as soon as possible. This allows the m a x i m u m amount of time to implement a revised plan of action if necessary. Financial monitoring is therefore in everybody's interests. However, comparing actual expenditure at a particular point in the year with the budget for the whole
118

Appendix 2
year will rarely be sufficient to alert the budget holder to a potential problem. Since the incidence of income and expenditure is frequently 'lumpy' through the year, h o w can one be sure that one is on course or not? The answer is to profile the budget. This requires the budget holder to estimate in advance h o w the budget is likely to be spent during the year. This information allows comparisons to be m a d e between actual and anticipated expenditure at any given point in time. Whilst small variations m a y be insignificant, large variations should prompt the budget holder to examine the reasons and consider his\her response.
6. Indicative budget
This term m a y be used in one of two ways, depending upon the context.
In the context of forward-planning, it refers to the notional budgets indicated for years 2 and 3 of the planning period.
In the context of monitoring expenditure, an indicative budget is one that appears on a budget holder's monthly statements as a guideline for more senior levels of management, but is not managed by the budget holder hiirAherself. The most obvious example is staff costs. Control over staff costs will be retained at Faculty Group level. Nevertheless, indicative staff budgets will appear on departmental reports as an indicator of the likely incidence of such costs in each area.
7. Budgetary variances
A budgetary variance arises where there is a difference (positive or negative) between planned and actual expenditure. However, variances m a y reflect one or both of the following: (i) volume effects e.g. staff costs exceed budget because staff numbers
are higher than planned: and\or (ii) price effects e.g. staff costs exceed budget because of a salary increase
higher than forecast.
Periodic variances will also arise on monitoring reports where budgets have not been adequately profiled by the budget holder.
The distinction between volume and price effects will be important,
119

Capacity building and institutional development in higher education in Kenya
both at the operational level where it will enable budget holders to m a k e sense of variance reports, and in helping to determine whether and in what ways systemic variances (e.g. actual versus forcast salary settlements) require budgets to be adjusted.
8. Restricted and unrestricted funds
All funds received by the University fall into one or other of these two categories. It is very important to be able to distinguish between them.
(i) Restricted funds These are provided by donors or sponsors external to the University for
specified purpose only. Funds not used for the specified purposes normally have to be returned. All things being equal, spending from restricted funds should not have an impact on the surplus\deficit position of the University, although on some occasions (e.g. overspends on research grants) they will.
The main example of restricted funds are: • Research Grants and Contracts • Endowments • Donations • Equipment Grant • Certain other expenditure recoverable from third parties (e.g. where
a m e m b e r of staff has his salary sponsored by an external organisation.)
(ii) Unrestricted funds These are received by the University for its general purposes. They are
therefore entirely at the disposal of the University corporately, although by convention some of the funds generated locally (e.g. from other services rendered) are retained by the departments concerned. Spending from unrestricted funds will have a direct impact upon the surplus\deficit position of the University.
Finally, it should be noted that overspends on research grants or losses on trading operations represent a drain on unrestricted funds, and must therefore be monitored particularly closely. Conversely, it is possible in some circumstance for restricted funds to m a k e a contribution to unrestricted funds e.g. via research contract overheads.
120

Appendix 2
9. Balances on unrestricted funds: supplementary budgets
Where the University carries forward unspent budgets from one year to the next, these will become k n o w n as supplementary budgets, because, they are being granted in addition to budgets already set for the new financial year. They will therefore be reflected in the overall budget of the University. This will be the normal practice for non-salary budgets. This ensures that plans which, will be executable in the following year. In effect, these plans and budgets become an addition to the core plans and budgets for the second year.
It therefore follows that supplementary budgets are linked closely to plans. The University must guard against the situation where a department (or planning Unit, or Faculty Group) builds up a balance unrelated to its plans. Supplementary budgets m a y be negative as well as positive (e.g. if an overspend has occurred in the previous year). Central Management Group ( C M G ) will review the overall budget position of the University w h e n the accounts for the previous year have been prepared and supplementary budgets are carried forward. C M G will need to ensure that the total University budget, including supplementary budgets carried forward, remains viable and if this is not the case, corrective action will need to be taken.
10. Balances on unrestricted funds: salary budgets
The carry forward of unspent balances on salaries budgets will not be allowed at the present stage of development as this could lead to significant financial controls problems. There will, however, be certain exceptions in those cases where C M G has agreed that a combined salaries and operating expenses budget should be set (e.g. Computing Services and Library). C M G m a y decide where there is an overspending on a salaries budget that it should be carried forward to the next year. This will depend on the circumstances under which the overspending arises. This area will be kept under review.
11. Balances on restricted funds
At the end of each financial year, when the accounts have been prepared, any unspent balances on restricted funds will be carried forward automatically. These balances have no impact on the University's budget
121

Capacity building and institutional development in higher education in Kenya
for the following year and are not therefore subject to control by C M G . If, however, at the end of the year, or during the course of the year, it becomes clear that an overspend has been incurred on a restricted funds and it is not recoverable by other means, then the overspend will be transferred as a charge against the budget of the department concerned. In the case of an endowed post, any overspending would be charged against the Faculty Group salary budget.
12. Virement
Virement means the diversion, or spending authority from one budget to another. While this is perfectly acceptable between some budget heads, particular care must be exercised to ensure that a proposed virement does not result in a forward commitment that was not implicit in the original budget. For example, it m a y be accepted in due course to vire from a staff budget to a non-staff budget, but it is not normally acceptable to vire in the opposite direction since this is likely to involve a commitment stretching beyond the period for which the budget was originally set. Likewise a proposal to vire from a departmental budget to a building project (e.g. to increase the size of a laboratory) m a y meet with objection, as this must form a consistent part of the University's plan for usage of accommodation.
The power to vire depends on the level to which budgets are devolved within the management reporting hierarchy. Since staff allowances grants, office expenses funds, travel grant, etc. have n o w been merged into one departmental budget, there is effectively complete virement between these heads. However, it will not be possible to vire between Departmental or Planning Unit budgets and salary budgets, since salary budgets will initially be held at Faculty Group or support Group level.
There are a number of exceptions to the general position - e.g. in respect of Computing Services, the Library and Physical Education, where by agreement of C M G , salary budgets have already been devolved to departmental level and there is complete virement between budget heads. Similarly, there are a number of trading or quasi-trading units (e.g. Resident and Catering operations) where fully-devolved budgeting already operates. In a small number of cases operating budgets are already used to cover the cost of staff on short-term contracts.
122

Appendix 2
With these exceptions, in an initial fiscal year Faculty and Support Group budgets for salaries are indicative only and control will continue to be exercised by means of Agreed Expenditure Plan ( A E P ) targets. This means that there will be no power for Faculty and Support Groups to Vire between the salary budget head and the overall allocation for Planning Unit\Departmental budgets. It is not appropriate to vire between an operating budget and the core salaries budget in view on the implied future commitment involved, but this will not prevent budget-holders from seeking permission to use the operation budget to employ temporary staff. This would, however, have to be very carefully controlled, and would require the approval not only of the Dean of Faculty, Head of Support Group but of the Deputy Vice Chancellor (Planning and Budgeting).
In respect of the subsequent fiscal year the position regarding virement will need to be reviewed since salary budgets will no longer be indicative and it m a y be possible to m o v e forward a step by allowing one-way virement from the salaries budget to the Planning Unit\Departmental budget. It m a y then also be appropriate to consider the extent to which any overspending actually incurred on a salary budget at the end of the year should be offset against unspent balances on departmental budgets. This is more likely to be achieved when salary budgets have been devolved to a lower level than Faculty Groups.
13. Contingency fund
In the strictly financial sense, a contingency is an amount set aside in the budget to cover unforseen future events - events which, of course, m a y not take place. A contingency represents a cushion, or a form of self-insurance, in respect of possible events (e.g. unanticipated legal or moral obligations), and the level of contingency set should bear some relation to the likelihood of such an event occurring.
Every budget holder should establish a contingency fund at the beginning of the financial year by holding back some of the total budget, at least until the actual pattern of student load becomes clear. It would also be expected that some contingency should be retained until at least March each year to enable budget holders to respond flexibly to unforseen in-year events. This reflects a fundamental principle of devolved management: that problems should always be resolved at the lowest possible level in the m a nagement hierarchy.
123

Capacity building and institutional development in higher education in Kenya
14 . D e v e l o p m e n t funds
A development fund is an amount set aside in the budget for special development projects (e.g to assist in reorienting a particular subject or group of subjects). Such funds would normally be allocated only if bids of sufficient merit are submitted, and approved. Currently, the only development funds available to the University at large are administered by the University Development Committee.
15. Assistance funds
These are similar to development funds, but m a y be allocated on a basis other than via bids. O n e current example is the Vice-Chancellor A s sistance Fund. A n Academic Assistance Fund m a y be established to provide temporary help to Faculty Groups and Departments.
S u m m a r y of activities involved in each step of planning cycle
Step 1: University
Inputs • Existing strategy and plans • Financial forecast/plans • Actual/Forecasts Statistics and Performance indication
Processes • Review of strategy/tactics • External environment • Special markets/competitors • Initial strengths/weaknesses
Output • Strategic priorities/criteria for university • Planning/budgeting constraints for faculty groups • Statistics and performance indicators
124

Appendix 2
Step 2: Faculty Group
Inputs • Strategic priorities/criteria • Planning/budgetary constraints • Statistics and performance indicators
Processes • Review of strategy/tactics of faculty group • External environment • Specific markets/competitors • Internal strengths/weaknesses
Outputs • Strategic priorities/criteria for faculty group • Planning/budgetary constraints for planning units • S u m m a r y statistics and performance indicators for planning units
Step 3: Planning Unit
Inputs • Faculty group strategic priorities/criteria • Faculty group planning/budgetary constraints • External environment • Specific markets/competitors • Internal strengths/weakness
Outputs • Academic priorities of planning unit • Proposed plans and budgets for planning unit • Forecast/target data for planning unit
Step 4: Planning Group
Inputs • Academic priorities of planning unit • Proposed plans/budgets for planning unit • Statistics and performance indicators for planning units.
125

Capacity building and institutional development in higher education in Kenya
Processes • Review plans/budgets in light of: • Faculty group priorities/criteria • Planning budgetary constraints • Internal consistency of planning unit plans/budgets
Outputs • Academic priorities of faculty group • Proposed plans/budgets for faculty group • Forecast/target data for faculty group.
Step 5: University
Inputs • Academic priorities of faculty groups • Proposed plans/budgets for faculty groups • Statistics and performance indicators for faculty groups.
Processes • Review plans/budgets in light of: • University priorities/criteria • Planning/budgetary constraints • Internal consistency of faculty group plans/budgets
Outputs • Agreed plans and priorities • Agreed budgets and financial forecasts • Forecast/target data for university.
126

Appendix 3 List of items looked at
by institutions in planning
1. Allocation of resources based on unit cost analysis
Unit cost analysis enables a university to identify annual recurrent costs on a per student and per graduate basis in respect of each course/department/ faculty/school etc. and arrive at justifiable criteria for fund allocation. Unit cost is defined as:
Total Departmental Expenditure
Full Time Equivalent Student (FTES) In order to determine the course/departments costs, the following data
need to be gathered.
(i) Staff in post in a department at the end of the current financial year by positions worked, as follows:
(a) Academic Grade Position Numbers XV Professors - full time X I V Associate Professors - full time XIII Senior Lecturers - full time XII Lecturers - full time XI Assistant Lecturers- full time X Tutorial Fellows - full time IX Part Time
(b) Non-Academic Grade Position Numbers XVIII Vice-Chancellor XVII Deputy Vice-Chancellor
Constituent College Principals X V I College Principals
127

Capacity building and institutional development in higlwr education in Kenya
X V Registrars X I V Deputy Registrars XIII Senior Asst. Registrars XII Assistant Registrars X I Senior Administrative Assistants
(c) Non-Teaching Staff Grade Position Numbers V - I X Middle Grades I-IV Unionisable Staff
Part-Time Staff Temporary Staff
(ii) Recurrent Departmental Expenditure (1) Total Staffing Cost K.Shs.
(a) Established teaching post (b) Non-established teaching posts (c) Demonstrators (d) Other support staff
(except secretaries) (2) Total non-staffing costs
(a) Consumable (b) Field work (c) Fourth term (d) Teaching practice (e) Travel (f) Special purpose grant etc.
(3) Total Administrative Cost (a) Consumables (b) Travel and Transport (c) Equipment and Furniture
GRAND TOTAL
Unit recurrent cost per student is defined as:
(Total non-staffing costs) Recurrent departmental expenditure =
Total n u m b e r of students (based on F T E S )
128

Appendix 3
2. Staff Loading
There are two alternatives to determining staff loading: Full T i m e Equivalent Faculty (staff) ( F T E F ) Contact Hours
Determination of Staff Loading Based on Full Time Equivalent Faculty (FTEF)
(a) FTES for Undergraduate Programme A full time student is a student w h o is taking all his/her courses within
one department. In order to determine full time student equivalent where a student takes his/her courses in more than one department, it is necessary for a department to establish the m a x i m u m units allowable for students of a given discipline from the student's faculty, which w e will call Y units.
Then, the department must also k n o w the units it is offering to the students with m a x i m u m allowable Y units in a year w h o are taking X units in the department in that year is given by:
= X multiply by the total number of students Y with Y allowable units.
Therefore, the departments not having full time students would have to calculate the s u m total of the Full T ime Equivalent Students depending on the units the department was teaching to students of various undergraduate disciplines (programmes).
(b) FTES for Postgraduate Programme For postgraduate p r o g r a m m e , the F T E S is worked out as per
undergraduate programmes and then divided by 0.70 for masters and 0.50 for doctoral.
The grand total F T E S for the department is the F T E S for undergraduate plus F T E S for postgraduate.
(c) Staff/Student Ratio Staff/Student Ratio is an important factor in determining unit cost and
staff loading. However, the current staff/student ratio are not based on any standard ratio and vary from country to country, and from one institution to
129

Capacity building and institutional development in higher education in Kenya
another. Depending on the level of technology ratios can be increased or raised. The following table gives an over-view of the standard ratios for Nigeria, U K and U S A . The ratios listed under Kenya are recommended for use in Kenyan universities mainly on basis of library materials, technology staff equivalent and computers etc.
Discipline Kenya Nigeria U . K . U S A
Science based 1:12 Arts based 1:15 Engineering based 1:10 Education based 1:15 Clinical medicine 1:7
1:10 1:20 1:9 1:20 1:7
1 1 1 1 1
15 15 12 15 7
1 1 1 1 1
14 14 14 14 7
Full-Time Equivalent Faculty (FTEF) is defined as:-
Total Full-Time Equivalent Student for the department
Staff/students ratio for the departments
3. Determination of staff loading based on contact hours
To determine the staff loading on the basis of staff-student contact the following steps should be followed:
(i) Calculate the contact hours for a given course A in department as follows:
(a) Lecture hrs/week x number of students x number of weeks = P hrs. (b) Practical hrs/week x number of students x number of weeks = R hours. (c) Tutorial hrs/weeks x number of students x number of weeks = T hours, (ii) O n the basis that there are 40 possible working hours per week, you
should arrive at 40 x 52 = 2,080 total possible working hours per year. (iii) Then subtracting the possible non-teaching/non-contract public holidays
and 36 days of leave in a year which should amount to 280 hrs, you should arrive at a possible m a x i m u m of 1,800 working hours in a year.
130

Appendix 3
(iv) Out of the m a x i m u m 1,800 working hours, assume that 800 hours are left for research, lecture preparation etc, the m a x i m u m possible time that a m e m b e r of staff would be fully engaged in actual teaching in a year would be 1,000 hours.
(v) Then the Full Time Equivalent Faculty (FTEF) loading is given by:
The Summation of contact hours for all courses
1000 x staff/student ratio for the department
In preparing planning and budgetary estimates universities are advised to use contact hour based on F T E F .
(b) Rationalize the ratio of academic staff grade distribution to ensure high quality of teaching and research. The following distribution has been recommended: Professors and Associate Professors 20% Senior Lecturers 35% Lecturers and below 45%
(c) Review and rationalize the non-academic staffNstudent ratios.
4. Academic computing guidelines
Academic computing should be defined as "... expenditures for computer services that have been established to support the instruction, research, and public service mission of the institutions". The availability of relatively inexpensive micro and personal computers has created a d e m a n d for additional access and greater integration of computers into the curriculum. A n d due to the increased use of computers in university institutions, guidelines for academic computing resources is not only necessary but should also reflect the relatively cheaper costs of micro and personal computers. The need for use of computing resources should be derived from the course offerings and enrolments at each institution.
The computing guidelines should be expressed in terms of 'work-stations' and connect hours or use hours per week. A 'workstation' is a terminal, a mini-computer, or a word-processor that provides access to a
131

Capacity building and institutional development in higher education in Kenya
computing network or has self-contained computing power. Individual workstation or clusters or workstations supporting students or faculty in the conduct of instruction, research, or public service are to be included in the guideline. But workstations for work related to administrative data systems should not be included in the academic computing guideline.
Workstation use hours be converted to an equivalent number of workstations with the requirement that workstations be used a m i n i m u m of seven hours per day; five days per week. Connect or use hours per week by discipline should be worked out by each institution. Institutions should document their current levels of academic computing resources for instruction, research and public service including additional stations planned during the biennium. The cost of additional instructional workstations should be calculated at an agreed fee (cost) per workstation included in the institutions computing network. Institutions are encouraged to request sufficient resources to provide for the operation and maintenance of the n e w workstations.
5. Guidelines for students financial assistance
The Commission for Higher Education ( C H E ) will not handle students financial assistance (loan scheme) as this is the responsibility of another institution - Students Loan Board. However, already some recommendations have been m a d e by the Higher Education Students Loan Board Act about students financial assistance. In view of this, there is no need for the time being to develop guidelines in respect to students financial assistance.
6. Guidelines for sponsored programmes
Sponsors of specific programmes have prescribed guidelines governing utilisation of the scholarship. It m a y not therefore be necessary to formulate guidelines for such programmes. However it is important to ensure that these guidelines are in conformity with national guidelines developed by Government departments.
132

Appendix 3
7. Guidelines for auxiliary enterprises
Guidelines for auxiliary enterprises such as farms, bakeries, slaughterhouses will not be developed centrally because these enterprises are regarded as self-sustaining entities.
Nevertheless, in spite of the assumption that auxiliary enterprises are self-sustaining, m a n y of such enterprises undertaken by Kenyan public university institutions are usually a financial drain. University institutions should therefore re-examine the services they operate for example kitchens, bookshops, farms, bakeries, etc and explore ways and means of making these services self-sustaining. A m o n g the measures to be considered should include privatisation of some non-profit making activities undertaken by universities.
8. Guidelines on income generating activities
Universities can operate enterprises that generate income but these enterprises should be within areas of competence for example, contract research, consultancy, teaching companies, conferences, full-cost awarding courses, pick-up courses, research funded by research councils, overseas students, etc. A s a starting point public (local) universities should re-examine their goals and objectives and on the basis of this re-evaluate those enterprises or services that they provide outside their goals and objectives. This re-evaluation should eventually lead to the preparation of guidelines on possible and viable enterprises. O n c e guidelines have been worked out on viable and non-viable enterprises, an Action Plan and Implementation Schedule for disinventure should be worked out.
9. Guidelines on students enrolments
T h e Government policy on university students enrolment is contained in the policy document on university education which was prepared for purposes of implementation of the Universities Investment Project. The
133

Capacity building and institutional development in higher education in Kenya
policy is to maintain admissions to public universities at the level of 10,000 students per year starting in 1992 with a subsequent annual growth of 3 per cent. The admission policy further stipulates that science based courses will be gradually stepped up so that eventually 50 per cent of students will be enrolled in science based courses.
10. Students enrolment as a budget tool
There is need to introduce a n e w approach to determining resource requirements associated with students enrolment changes, both increases and decreases. This approach should provide guideline treatment of current enrolments and the identification of variable resources required for the enrolment increase or decrease.
The exact number of students (after head count which allows attrition) should be used instead of projection for purposes of budget. ( 1992/93 should be the base year which university institutions will start the use of exact students enrolments as a tool for budget).
11. Computing for library guidelines
There are already s o m e staffing guidelines, though not explicitly, in practice in Kenyan university institutions. T h e formula was complicated and not familiar to Kenyan universities. The available formula for computing staff for libraries elsewhere (Voigt Formula) is not practical for Kenyan university libraries.
It is therefore necessary that the basis of information and data on the present practice staffing be assessed and guidelines for libraries be developed. A library data sheet to collect this information is attached to this Appendix.
12. Library books and periodicals
Guidelines for stocking library books and periodicals need updating to reflect current industry standard prices for bound volumes, periodicals and
134

Appendix 3
microfilm. T h e ordering of periodicals under Universities Investment Project (UIP) however will be different because of the existing procurement procedures. It is further recommended that universities establish and institutionalise inter-university books lending and net-working.
13. Research and public service
There are no standard guidelines for staffing or other resources provided for research and public services. However, it is noted that in Europe and North America research is highly emphasized and universities are rated and graded regularly on basis of research output a m o n g other indicators.
In order to encourage research, adequate budget must be provided to university institutions. Emphasis should be on the quality of research than the quantity. In the meantime, information and data on research should be obtained from university institutions in order to establish the present situation of research activities in the universities. This information should be gathered using the Research Data Sheet.
14. Non-guideline resources
There are some aspects of institutional resources that do not require specific guidelines. These Non-Guideline Resources include all costs that have no direct bearing with the academic programmes but are necessary for effective function of the university institution. Although specific guidelines for these services cannot be provided, costs/charges of the same should be rationalised and streamlined. T h e Non-Guideline Resources comprise of: Health Service.Housing, Pension, Allowances, Insurance, Legal Services, B a n k Charges, Computer Charges (administrative), Administrative Transport, Central Services, Obligated Charges, Inflation, Electricity, Water, Conservancy, Rates, Training, Recruitment, Publications, and Advertisement.
135

Capacity building and institutional development in higher education in Kenya
15. Replacement and maintenance of equipment & plant
Movable equipment include plant, machinery and vehicles. There is not an agreed system or method of providing for depreciation of plant, machinery and equipment including vehicles.
In the case of vehicles it is generally accepted that the annual depreciation is at the rate of 25 per cent per year. However, guidelines on h o w to determine maintenance and replacement of equipment and plant should be worked out.
16. Museums and galleries
Most of the university libraries have not as yet established fully fledged m u s e u m s and galleries. In view of this there are no guidelines developed for this area for the time being. Those institutions planning to establish M u s e u m s and Galleries should consider developing draft guidelines.
17. Audio-visual services
Audio-visual equipment and services are not used extensively by university institutions and where they are in use, they are usually spread out in different faculties and departments. In most cases the equipment is duplicated as well. This is not cost-effective. University staff should be m a d e aware of the presence and importance of audio-visual services as an effective tool of instruction.
The audio-visual services should be centralised in order to maximise utility through centralised budgeting, maintenance and repair.
18. Operation and maintenance of plant
At present there are no guidelines on the type and the number of staff to be used in the operation and maintenance of plant and equipment. There is need to develop a systematic method of calculating and determining
136

Appendix 3
depreciation of equipment and plant. With proper maintenance of plant and equipment practices, replacement of equipment would be less frequent and especially with respect to vehicles. A n y n e w equipment received should be examined to ensure that it is serviceable and that it matches the current market technology.
A s a long-term measure to solve the problem of equipment replacement, universities should establish an equipment replacement fund and invest it (as fixed account deposit for example) for purposes of generating revenue. Universities should further coordinate and rationalise procedures of receiving equipment and train personnel to handle it.
19. Moveable equipment: maintenance and service
There are no guidelines on h o w to handle depreciation of equipment that has become obsolete either because of age or new technology. It is therefore recommended that the following guideline for obsolete equipment should be considered by universities:
A s s u m e that every 10 years equipment needs replacement. Each year take 1/9 of the current cost of equipment as expenditure, multiply by inflation factor i.e.
n=10
X E,Xt
This calculation should start with the equipment procured during the 1992/93 (base year) fiscal year with the exception of special and expensive equipment.
In the case of the specialised equipment which is very expensive there should be special grant and universities should prepare justification for such allocation. The idle time for the specialised equipment should be minimised through encouraging universities to use one central specialised equipment.
137

Capacity building and institutional development in higher education in Kenya
20. University bookshops
All universities have established bookshops to serve students. The cost of books does not include staff overhead costs otherwise the prices of books would be higher. There is need to review book pricing and establish appropriate criteria for staffing of university bookshops. After data and information of staffing of bookshop services has been obtained, guidelines should be prepared. There is also need to train staff.
21. Institutional support staff guideline
(i) Administrative Staff The calculation of administrative staffing for a university institution
regardless of its size is done using the following formula: • 6 F T E F basic staff
plus • 1 F T E F position for each campus
plus • 22.5 for every 100 F T E F generated by F T E S
(ii) Teaching and Research Administrative Services The guideline for basic administrative staff in the teaching and research
provides for: • 3FTEbasic • A d d 1 for every campus college • A d d 2.75 F T E A d m i n , staff for every 1000 F T E S
For the time being this staffing guideline m a y not be applicable to the K e nyan university institutions. However the formula should be noted and taken into consideration when rationalisation of the staffing practice in our institutions is undertaken after appropriate and personnel data and information has been obtained.
(Hi) Ancillary Staff There are currently no staffing guidelines developed for this category of
staff. Employment of ancillary staff is left to the individual institu-
138
Appendix 3
tions a situation that has led to great disparity in the numbers engaged by different institutions. There is need to develop specific staffing guidelines for this category of staff once practice has been documented on the basis of returns from university institutions.
22. Academic computing guidelines
It has been noted that in most disciplines in the public university, students are not exposed to computer use. In order to involve students in the application of the modern technology embodied in the use of computers it is important for universities to introduce computers application and computer courses to students. In the event of introducing this programme the guideline on computer hours per week per full time equivalent student, should be worked out by Faculty Boards and harmonized.
The Institute of Computer Science would be requested to compute the staff needed on behalf of university institutions. This calculation should be on basis of hours given in the Academic Computing Guidelines in order to establish staff needed using Full T i m e Equivalent Student. T h e list of computer courses should also be compiled from university calendars and recommended hours be drawn.
23. Student services
University institutions provided services to students. These comprise of the following services: Faculty Dean's Office, Dean of Students Office, Counselling Services, Chaplaincy Services, Medical Services, G a m e s , Halls/ Kitchen, Entertainment, Registration Services, Loan Scheme, Bursary, Bookshop, Exchange Programmes, Foreign Programmes, Student Organisations, Security, Transport, and Student Services.
Currently there are no clear guidelines on the staffing provided for each of these services. There is also no budgetary provision voted for services. At present student services are provided free to the recipients but the issue is w h o pays for them and whether they are appropriately costed by universities.
The costing of these services should be done and university institutions should introduce realistic cost-sharing, starting with the following:
139

Capacity building and institutional development in higher education in Kenya
Medical, G a m e s , Transport, Organisation, Entertainment, Registration, and Halls/Kitchens
O n c e the actual cost of providing specific services have been established universities should establish the apportionment of the cost between students and the university.
24. Procedures for preparing budget guidelines
Having developed guidelines for budget preparations by university institutions and special requirements it is necessary to work out procedures to be followed by universities in compiling and providing this information and data. A s the procedure for information and data collection available from other sources are not suitable for Kenyan situation, Forms developed by the University for information and data collection entitled: Profile of department and student profile for deparment are recommended for use by universities. Samples of these forms are appended to the Guidelines.
140

Appendix 3
Staffing guidelines information: Academic and administrative staff data sheet
N a m e of university/institution
(The data in A - C was requested in order to set norms)
A . (i) Total N o . of academic staff in post (ii) Total N o . of established academic
posts in university (iii) Total N o . of other academic staff i.e.
Tutorial Fellows, Part-time staff, etc. (iv) Total No.of students enrolment (v) N u m b e r of academic departments (vi) N u m b e r of faculties
- Institutes - Schools - Total
(vii) Special Departments (e.g. Health, Finance, Estates)
NameofDept No. of Staff Staff in the Staff in Post (Excluding Establishment
Grades I-IV)
Total staff for A (vii)
141

Capacity building and institutional development in higher education in Kenya
B . (i) N u m b e r of administrative staff (e.g. Registrar, Deputy Registrar, Senior Asst. Registrar)
Position Number of staff or equivalent
Registrar Deputy Registrar Senior Asst. Registrar Assistant Registrar Middle Grades A - F (5-10) Others
Total for B(i)
(ii) Support staff I-IV including all departments
Grand Total (A, B(i) & (ii)
C . Staff Ratios
1) A(i)/B(ii)
(2) A(ii)/B(i)
(3) A(i)/A(iv) (4) A(v)/B(i)
(5) A(vi)/B(i) (6) A(i)/B(ii) (7) A(iv)/B(ii) (8) A(i)+B(i)/B(ii)
Academic staff (in post) / Administrative staff Academic staff (established) / Administrative staff Academic staff / Students Academic Depts / Administrative staff Faculties etc. / A d m i n , staff Academic staff / Support staff Students / Support staff Academic & A d m i n staff/ Support staff
142

Appendix
Staffing guidelines information
Technical staff data sheet
N a m e of university/institution
1. N u m b e r of student contact hours per technical staff 2 . N u m b e r of research hours per technical staff 3 . N u m b e r of administrative hours per technical staf f 4 . N u m b e r of laboratory preparatory hours per technical staff 5 . A n y other specified duty hours per technical staff
Duty Hours (i) H o u r s per technical staff (ii) H o u r s per technical staff (iii) H o u r s per technical staff
Research data sheet
N a m e of university/institution ( T h e data in A - E w a s requested to set n o r m s )
A. Government Grant Amount in KP
Amount spent on Research - Personnel - Travel - Accommodation - Equipment - Others - Total

Capacity building and institutional development in higher education in Kenya
B. Grants from other donor agencies
Amount spent on Research - Personnel - Travel - Accommodation - Equipment - Honoraria - Others - Total
C. List of research projects
Donor Name of Principal Department Amount project Researcher (KP)
D. Contractual services
N a m e of Principal Department A m o u n t in K P Project Consultant
144

Appendix 3
E. University Policy on Overhead Charges
State University Policy on Overhead Charges (i) Does the university/institution charge it? (ii) H o w m u c h or at what rate? (iii) If not, what is the reason?
145

Capacity building and institutional development in higher education in Kenya
Staffing guidelines information
Library readership data sheet
N a m e of university/institution T h e data in A - C w a s requested in order to set n o r m s )
(i) (ii) (iii) (iv) (i) (ii) (iii) (iv) (v)
N u m b e r of book volumes in library N u m b e r of periodical volumes N u m b e r of readership per week N u m b e r of library hours N u m b e r of senior librarians N u m b e r of librarians N u m b e r of assistant librarians N u m b e r of administrative staff N u m b e r of support staff
C . Readership/Staff Ratios
W o r k out following ratios :-(i) A(i)+(ii)
- = volumes per librarian B(i)+(ii)+(iii)
(ii) A(iii) - — = Readers per librarian
B(i)+(ii)+(iii)
(iii) A(iii) = Readers per admin, staff.
B(iv)
(iv) A(iii) = Readers per support staff.
B(v) (v) Librarian comments with regard to:-
146

Appendix 3
1) Library situation in respect to volumes and readership
2) Present situation compared to the ideal. W h a t is the ideal?

Capacity building and institutional development in higher education in Kenya
Quality assesment model: unit cost University education: profile of department
N a m e of university/institution
N a m e of department
A: STAFF IN POST AT 30/6 C O U N C I L F U N D E D
Al. Academic Teaching Professors (Full Time) Asst. Prof. Snr. Lecturer Lecturer " Asst. Lecturer Tutorial Fellow Part Time
T O T A L F.T.E.
A 2 . Academic Related Support Technical Laboratory (Asst., Trainee, etc.) Others (Demonstrator, etc.) Part-time Secetarial
T O T A L S U P P O R T
B: R E C U R R E N T EXPENDITURE FROM G E N E R A L F U N D
Bl. Staffing Established Teaching Non-Established Teaching Teaching Support
T O T A L S T A F F
B2. Non-Staffing Consumables Field/4th Term courses Travel Pump-priming Special Purpose Grant
T O T A L N O N - S T A F F I N G
Fiscal Year
Numbers
KShs
Fiscal Year
Numbers
KShs
Fiscal Year
Numbers
KShs
Fiscal Year
Numbers
KShs
148

Appendix 3
3. TOTAL D E P A R T M E N T (B1+B2)
4. SERVICES (See R)
5. ACCOMMODATION (See Q)
6. TOTAL R E C U R R E N T
(B3+B4+B5)
Less special Grant (F2A)
7. NATIONAL TEACHING COST (60% of 5)
8. NATIONAL R E S E A R C H COST (40% of 5)
Add conference Subtotal
T O T A L R E C U R R E N T C O S T
C . CAPITAL C O S T
1.EQUIPMENT F U N D Normal Allocation Special Allocation Research Grant Allocation
T O T A L ALLOCATION
2. FURNITURE A L L O C A T I O N
3. MINOR W O R K S
4. TOTAL CAPITAL C O S T
D . EXPENDITURE PER S T U D E N T 1. Load at 30/6 (J4) 2. SS Ratio (K) 3. Unit Cost (B3/D1)K£ 4. National Teaching
cost(B7/Dl)
K£ K£ K£ K£
149

Capacity building and institutional development in higher education in Kenya
E. E X P E N D I T U R E P E R F.T.E. A C A D E M I C S T A F F
1. Total Dept. (B3/A1) 2. Support Staff (Bld/Al) 3. Equipments (Cl/Al) 4. National Research
cost (B8/A1) N O T E S 1. Expenditure figures shall be obtained from College Bursars. 2. Staff numbers in A & F are shown as F T E (Actual numbers in brackets). Numbers in Al
should be those approved. 3. (F7b) shows numbers of students in the Department. 4. Library books and computer costs shall be obtained from respective departmental heads. R. N A T I O N A L SERVICES
C O S T
Library. Computer. Audio Visual Aids. Basic Management Unit ( B M U ) . (These are costs for Health. Services, Housing, Maintenance, telephone, electricity, water etc and are paid for centrally. TOTAL
K£ K£ K£ K£
150
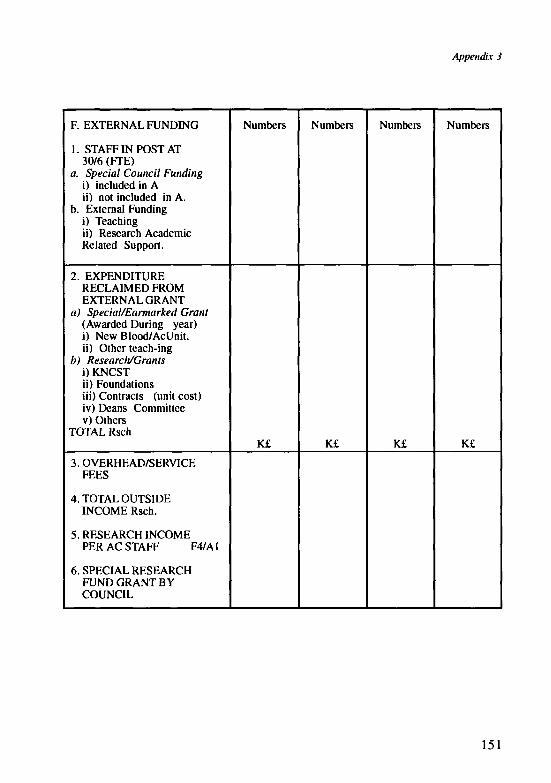
Appendix 3
F. EXTERNAL FUNDING
1. STAFF IN POST AT 30/6 (FTE)
a. Special Council Funding i) included in A ii) not included in A .
b. External Funding i) Teaching ii) Research Academic Related Support.
2. E X P E N D I T U R E RECLAIMED FROM EXTERNAL GRANT
a) Special/Earmarked Grant (Awarded During year) i) N e w Blood/AcUnit. ii) Other teach-ing
b) Researcli/Grants i) K N C S T ii) Foundations iii) Contracts (unit cost) iv) Deans Committee v) Others
T O T A L Rsch
3. OVERHEAD/SERVICE FEES
4. TOTAL OUTSIDE INCOME Rsch.
5. RESEARCH INCOME PER AC STAFF F4/A1
6. SPECIAL RESEARCH FUND GRANT BY COUNCIL
Numbers
K£
Numbers
K£
Numbers
K£
Numbers
K£
151

Capacity building and institutional development in higher education in Kenya
7. RESEARCH TRAINING a) Research Training Specific grants (included in B 2 ) b) Funded students (FTE) i) University Council ii) K N C S T iii) Other funding iv) Self Funded
G . P U B L I C A T I O N S (Listed in Research Profile) 1. Books 2. Chapters 3. Papers in ref. journal 4. Other papers
Q. A C C O M M O D A T I O N (Costed in B5) Space Occupied - Lab Office Courts, Temp, store - Other
TOTAL OCCUPIED
K£
Numbers
Square Metre
K£
Numbers
Square Metre
K£
Numbers
Square Metre
K£
Numbers
Square Metre
152

Appendix 3
Quality assessment model: unit cost university education
Student profile for department
N a m e of university/institution
N a m e of department
ADMISSION OF STUDENTS U N D E R G R A D U A T E (KENYA)
Departmental capacity Applications Offers Acceptance (firm) Acceptance (prov.) Admitted from above Admitted at Registration Transferred out Transferred in
TOTAL (KENYAN) INTAKE Intake as % of capacity Exchange Students Foreign Students
TOTAL INTAKE
POSTGRADUATE T A U G H T C O U R S E S
Applications Offers Acceptance Kenyan intake Foreign Students
T O T A L INTAKE
R E S E A R C H C O U R S E S (MSc/MA/PhD) Application Offers Acceptance Kenyan Intake Foreign Students Intake
T O T A L INTAKE
153

Capacity building and institutional development in higher education in Kenya
K E N Y A N S T A N D A R D S (IN POINT) K C S E S C O R E (>- 110 <- 120) K C S E S C O R E (>- 100 <- 109) K C S E S C O R E (>- 90 <- 99) K C S E S C O R E (>- 80 <- 89) K C S E S C O R E (>- 70 <- 79) K C S E S C O R E (>- 60 <- 69) No. with other qualifications No. of mature age students
J: STUDENTS NUMBERS AT 30TH JUNE (FTES)
J. FULL-TIME (KENYAN) U G 1st Year
2nd Year 3rd Year 4th Year 5th Year 6th Year
U/G Total P / G Taught P / G Research
P/G TOTAL TOTAL FULL-TIME KENYAN OVERSEAS
U G 1st Year 2nd Year 3rd Year 4th Year 5th Year 6th Year
U/G Total P / G Taught P / G Research
P/G TOTAL TOTAL O/S
2. PART-TIME (Masters Research students with over 2 years registration and Ph.D. research students with over 3 yrs egistration) U / G P / G Taught P / G Research P / G Research (writing up)
TOTAL PART-TIME
154

Appendix 3
3. OVERALL FTES U / G P / G Taught P / G Research P / G Total TOTAL FTES
4. FTEF TEACHING LOAD Undergraduate Masters PhD TOTAL LOAD
K. S T U D E N T : STAFF RATIO
L. QUALIFICATION ATTAINED
1. FIRST DEGREES First Class Upper Second Lower Second Pass (Inc. Aegrorat) Fail
2. DIPLOMA Distinction Credit Ordinary
3. HIGHER DEGREE Ph.D. M.Phil. M . M e d M A / M S c . etc. Diploma (Postgraduate)
M . P O S T G R A D U A T E C O M P L E T I O N RATES
Yrs of Completion 1 yr for those awarded 2 yrs degrees (see L2) 3 yrs
4 yrs 5 yrs
155

Capacity building and institutional development in higher education in Kenya
N.FIRST DESTINATION R E G U R N S
U / G formal employment Self employment Further education Inservice Unemployed Not Known/Others
P/G Into Employment Further Education Unemployed Not Known/Others
O . E X T R A M U R A L C O U R S E L O A D E X T E R N A L D E G R E E C O U R S E L O A D
P. S T U D E N T LOSS
U / G 1st yr suspended 2nd yr suspended 3rd yr suspended Failed to complete Withdrawn Transferred
TOTAL U/G LOSS
Dip. 1st yr. suspended Failed to complete Withdrawn Transfeaed
TOTAL DIPLOMA LOSS
P / G T A U G H T Failed Withdrawn
P / G R E S E A R C H Failed Withdrawn
TOTAL P/G LOSS
() = % O F T O T A L F.T.E.
156

Appendix 3
Quality assesment model: unit cost university education
Profile of administration department
N a m e of university/institution
N a m e of department (e.g. finance)
A.STAFF IN POST AT 30/6 COUNCIL FUNDING
1. ACADEMIC EQUIVALENT POSTS Prof. Equiv. ) Asst. Prof. Equiv.) Full Snr. Lect. Equiv. ) Time Lect. Equiv. ) Part-Time
TOTAL 2. MIDDLE GRADE POSTS
Grade E/F ) Full Grade C / D ) Time Grade A / B ) Part-time
TOTAL 3. SECRETARIAL STAFF
Grade F ) Grade E ) Full Grade D ) Time Grade C ) Grade B ) Grade A ) Part-Time
TOTAL 4. UNIONISABLE STAFF
Grade IV ) Full Grade III ) Time Grade II ) Grade I ) Part Time
TOTAL
Numbers Numbers Numbers
157

Capacity building and institutional development in higher education in Kenya
B. RECURRENT EXPENDITURE FROM GENERAL FUNDS
1. STAFFING
a) Established Aca. Equiv. b) Established M . Grades c) Established Unionisable
TOTAL STAFF 2. NON-STAFFING
Consumables Training Travel Special Grants for special purposes
TOTAL NON-STAFF
3. TOTAL DEPARTMENT (Bl+2)
4. SERVICES (SEER)
5. ACCOMMODATION (SEE Q)
6. TOTAL RECRUITMENT (B3+4+5) Less Special Grant (F2)
TOTAL
7. ADD CONFERENCE/SABBATICAL
TOTAL
C. CAPITAL EXPENDITURE
1. EQUIPMENT FUND
Normal Allocation Special Allocation Grant Allocation
TOTAL ALLOCATION
2. FURNITURE ALLOCATION
3. MINOR WORKS
4. TOTAL CAPITAL COST
158

Appendix 3
D . EXPENDITURE PER S T U D E N T
1. SS Ratio (total students served by unit (Al+2+3+4)
2.UnitCost(B3/Dl) 3. National A d m Cost (B5/D1)
E. EXPENDITURE PER A D M I N . STAFF
Total Dept (B3/A1 Support Staff (Bib+ c/Al) Equipment (Cl/Al) National Adm. Cost (B5/A1)
R. NATIONAL A D M . C O S T
Library Computer Basic Management Unit (BMU) Audio Visual Aids Others (Specify)
TOTAL
Q . A C C O M M O D A T I O N ( C O S T E D IN B5)
Space Occupied -Equipment Office Courts, Temp, Store - Others
TOTAL OCCUPIED
Square Metre Square Metre Square Metre
159

Capacity building and institutional development in higher education in Kenya
F. EXTERNAL FUNDING
I. STAFF IN POST AT 30/6
a. i) Included in A ii) Not included in A
b. E X T E R N A L F U N D I N G
i) Administration ii) Research Administration
Related support
2. EXPENDITURE RECLAIMED FROM EXTERNAL GRANTS
a. Special/Earmarked Grants (awarded during year) i) N e w blood/Adm Init. ii) Other A d m .
b. Research Grants i) K N C S T ii) Foundation iii) Constructs (incl Govt) iv) Other
TOTAL Rsch
3. OVERHEAD (SERVICE FEES)
4. TOTAL OVERSIDE INCOME
Numbers Numbers Numbers
NOTES
1. Basic Management Unit ( B M U are costs covered by University Health Services, Housing for Staff, maintenance of staff houses, telephone services, electricity services, water services etc. These items are paid for centrally.
2. Expenditure figures are obtained from Finance Officer or College Bursar.
3. Staff members in A & F are actual numbers.
4. Total student enrolment numbers are obtainable from Academic Registrar.
5. Total student enrolment numbers for University Health Services is equivalent to total number of patients treated in a year.
160

Appenix 4
Brief on Kenya Public Universities Investment Project
1. Seminar on planning and programming guidelines
1. During the period July 30-31 and August 6-7, 1993 the Policy and Planning Task Group of the Ministry of Education has organised a briefing seminar on planning and academic programming guidelines for the key university personnel w h o will be responsible for the preparation of the development plans for public universities for the period 1994-2000 A . D . A m o n g the university personnel participating in the seminar are Deputy Vice-Chancellors, Principals of C a m p u s Colleges, Directors of Schools/ Institutes, Deans of Faculties, Chairmen of Academic Departments and Heads of Administrative Departments from University of Nairobi, M o i University, Kenyatta University, Egerton University, Jomo Kenyatta College of Agriculture and Technology and Maseno University College. The total number of participants for both sessions is approximately three hundred.
2.The objectives of the seminar are: i) To brief the participants about the new approach/philosophy to plan
ning for university education. ii) T o present and explain the Guidelines for planning and academic
programming. iii) T o enable participants to internalise the planning and programming
Guidelines through participation in the plenary discussions. iv) T o develop a conceptual framework for development plan preparation/
writing.
3.The purpose of this brief is to give you background to this exercise on the preparation of the first ever public universities development plan as well as the background to Kenya Universities Investment Project (UIP) of
161

Capacity building and institutional development in higher education in Kenya
Government of Kenya under whose auspices this activity falls. The Project is financed by a Credit from the International Development Association (IDA) World Bank. This brief will also highlight other major activities in the university education sub-sector which are under the portfolio of the UIP.
2. K e n y a universities investment project
1. Introduction
The Universities Investment Project (UIP) is complementary to the Education Sector Adjustment Programme(EdSAC) which is also supported by a Credit from I D A . Both programmes have their policy origin from Government Sessional Paper N o . 6 of 1988 on Education and M a n p o w e r Training for the Next Decade and Beyond. The policy framework for the university education sub-sector is stipulated in this Sessional Paper and provides that there should be a rational, harmonised and co-ordinated development and growth of university education which is matched with commensurate provision of appropriate resources in order to maintain standards, quality and relevance. The investment provided by the UIP will go a long w a y in meeting the policy requirements with regard to planning, programming, financing and budgeting within the university sub-sector.
2. Objectives of Universities Investment Project
A s indicated above the broad objectives of the project are to support the Government's Education Sector Adjustment Programme ( E d S A C ) and in the university education sub-sector to specifically provide resources and policy framework with a view to: i) rationalizing and strengthening the institutional framework for high
education in both the public and the private sectors; ii) limiting the growth of Governmental budgetary resources devoted to
the public universities by promoting cost sharing and improved investment planning;
iii) improving the quality of the teaching and research at the public university institutions.
162

Appendix 4
iv) Co-ordination and harmonisation of academic programmes at public universities.
v) Planned programming budgeting and financing of the public universities based on 10 year projections, 6 year development plans and 3 year funding plans in accordance with the Government forward budget.
3. Policy and Planning Task Group (PPTG)
The responsibility and the task of implementing policies and programm e s of the Universities Investment Project was initially vested with the Policy and Planning Task Group, set up in 1991 by the Ministry of Education, and comprising of representatives from universities, Commission for Higher Education ( C H E ) and the Ministry of Education. The P P T G is headed by a Coordinator w h o reports directly to the Permanent Secretary for E d u cation. The Coordinator w h o is also the Chairman of the Policy and Planning Task Group is supported by a full-time secretariat. H e is responsible directly to the Permanent Secretary for: i) Review of legal and organisational arrangements relating to C o m m i s
sion for Higher Education and the universities prior to strengthening CHE;
ii) Planning, programming and budgeting of universities; iii) Review of the long-term development of the Student Loan Scheme;
and iv) Implementation of the Project.
In accordance with the terms and conditions of the project, the P P T G will hand-over these responsibilities to the strengthened Commission for Higher Education which is the legal intermediary body responsible for higher education.
4. Committees of the Policy and Planning Task Group
The Policy and Planning Task Group works through Committees whose membership is drawn from public university institutions, Commission for Higher Education and the Ministry of Education and other relevant sectors.
163

Capacity building and institutional development in higher education in Kenya
T h e following are the Committees of P P T G and their terms of reference:
A . Review and Harmonisation of Legal Framework for University Education Committee
i) Terms of Reference T h e Committee was constituted on June 1992 with the following terms
of reference: a) to review and harmonise the Universities Act of 1985 and the individual
universities' Acts and submit a report thereon in three months; b) to review universities statutes in relation to the Universities Act 1985
and identify any conflicting provisions and recommend revisions as necessary to harmonise the Act and statutes;
c) to identify and help draft a m m e n d m e n t s to the Acts and regulations required to enable the Commiss ion for Higher Education fulfil its responsibilities;
d) to review C H E structure, membership, organisation and staffing in relation to its responsibilities and r e c o m m e n d appropriate changes as necessary;
e) to r e c o m m e n d the m a n a g e m e n t training programmes for staff and Universities Investment Project (UIP) management structures under C H E from January 1993;
f) to consider any other matter pertinent to C H E ' s functions and m a k e appropriate recommendations.
ii) Membership of the Committee This committee's m e m b e r s h i p , besides the representation from
universities and constituent colleges, the Commiss ion for Higher Education and the Ministry of Education had also representatives from Office of the Attorney General and the Directorate of Personnel M a n a g e m e n t .
iii) Report of the Committee T h e Committee met regularly during the period June 1992 and March
1993, held a seminar for top university administrators and sought views from universities administration and senates and on the basis of this prepared a Report which was submitted to the Permanent Secretary for Education on M a r c h 1993 with recommendations on harmonisation and strengthening of the legal framework for higher education and on the organisational structure of the Commission for Higher Education.
164

Appendix 4
B . Planning, Programming, Budgeting and Financing (PPBF) Committee
i) T e r m s of Refernce T h e P P B F Commit tee w a s constituted in June 1992 with the following
T e r m s of Reference: a) Assist with design and implementation of i m p r o v e d planning,
programming and budgeting of public universities, b) Assess relationship between supply and d e m a n d for graduates and
identify mismatch in various fields of study. c) Collect information about characteristics of employment of graduates
in modern sector and in self-employment; d) Collect information to guide planning of university development,
including introduction of n e w courses and elimination of course duplications;
e) Improve regular collection, analysis and dissemination of graduate labour market information;
f) E x a m i n e the role of private university sector in K e n y a ; g) Explore various G O K interventions to increase private university
enrollment and reduce burden on public expenditure; h) Examine models of funding, establishing and operating private
universities; i) Compare characteristics of students in private universities with those
studying abroad and in public universities.
ii) Budgeting Guidelines T h e P P B F Committee through deliberations at various meetings,
through the use of resource materials from other university institutions and by w a y of a seminar on Cost Reduction and Recovery and Alternative W a y s of Funding Universities has developed Budget Guidelines and Special Requirements for Public Universities.
The main purpose of this document which was circulated to universities in January 1993, is to provide university managers with the standard guidelines on planning and administration of services and specifically on budgeting for university resources. Public university institutions have also been requested for detailed data on students enrollments, staffing, library readership, research, financial resources, physical facilities, etc. Analysis of this data will establish and lead to adaptation of unit costs and norms for utilisation of staff and resources and incorporate the use of output indicators.
165

Capacity building and institutional development in higher education in Kenya
iii) Planning Guidelines O n e of the terms of reference for the P P B F is to assist in the design and
implementation of improved planning through preparation of guidelines for planning. For the past six months the P P B F Committee has therefore prepared Planning Guidelines to be used by public universities in preparing a Ten Year Projection, Six Year Development Plan and a Three Year Investment/Finance Plan. These plans should be submitted to Government by April 1994.
Plans preparation timetable has been drawn and starts with the Briefing (Set Off) Seminars as indicated below:
Plan preparation timetable
Activity Time
1. Set-Off Seminars for key university personnel
2. Mission setting/information gathering
3. Monitoring and options/ scenarios development
4. Writing of Development Plan (includes writing workshop)
5. Consolidation of Plans into National Universities Development Plan by P P T G
6. Printing of the Plans
7. Presentation to I D A by G O K
July 29 - August 1, 1993 August 5 - 9 , 1993
July-August 1993
Sept.-Oct. 1993
Nov. - Dec. 15, 1993
Jan. - Feb. 1994
March 1994
April 1994
166

Appendix 4
iv) Academic Programming Guidelines In accordance with its terms of reference the P P B F Committee has
also prepared Guidelines for Academic Programming. These guidelines will assist universities in the planning of the academic programmes and particularly with regard to intra and inter university harmonisation and rationalisation of programmes and courses in accordance with individual university mission and objectives and market demands.
v) Studies A m o n g the P P B F ' s terms of reference is to facilitate three major policy
studies as follows: • A graduate labour market study to assess the relationship between supply
and demand for graduates in the economy in order to determine current and future graduate labour balances.
• A study of the future development of the private university sector. The study will explore h o w government could assist in increasing enrollment and examine alternative models of funding the establishment and operation of private universities.
• A socio-economic study of access to universities and of subsequent performance, particularly in respect of equity and gender issues. Tenders for these studies were floated early in 1993 and will be
processed by August 1993.
C. Projects Appraisal and Implementation Committee
i) Projects Appraisal and Implementation (PAI) Committee is one of the Policy and Planning Task Group Organs. Its main responsibility is to steer and guide implementation of the various subprojects of the Universities Investment Project (UIP).
ii) The main sub-projects can be classified in terms of three activities: a) Institutional Development: This includes staff training in areas of
institutional planning, management , administration, finance and procurement together with office equipment (mainly computers) necessary to facilitate these tasks.
b) Staff Development: These subprojects cover academic, technician and administrative and service staff and include in-country and overseas training.
167

Capacity building and institutional development in higher education in Kenya
c) Teaching and related equipment: Equipment for laboratories and workshops, for library development (books and journals), computers, printing and publishing facilities and telephone and transport systems.
iii) Membership of the PAI Committee is drawn from all the public universities, Ministry of Education, Commission for Higher Education and the Project Implementation Unit of the Ministry of Education. The Chairman of the PAI Committee is the Deputy Co-ordinator of the Policy and Planning Task Group.
iv) Terms of Reference for the PAI Committee include:-a) Co-ordination of preparation of technical specifications for
goods and services and evaluation of bids. b) Harmonisation of unit cost of equipment and training
programmes. c) Co-ordination of staff development programmes. d) Appraisal of projects implementation processes.
v) Todate appreciable progress has been made in the provision of library books for university libraries and staff training at P h . D and masters degree level. Teaching equipment, computers and vehicles are among the additional equipment that will be supplied to universities in the very near future.
D . Students Loan Scheme
i) Policy decisions about reforming the student loan scheme were taken in July 1991 and adopted with effect from 1991/92 academic year. This reform capped the student loan at Kshs.21,500 of which 3,500 was earmarked for books and no more than Kshs.2500 for personal expenses. The latter item of expenses would be phased out in three years time. A s a further measure of cost-sharing students were called upon to pay an annual tuition fee of Kshs.6000/=
ii) A Loan Scheme Review Committee was established in 1991 as an organ of the Policy and Planning Task Group with the mandate to examine the organisation of loan scheme administration, the application of realistic interest rate and mechanisms for improved loan recovery. In addition an information systems review was to be carried out to support the loan scheme.
168
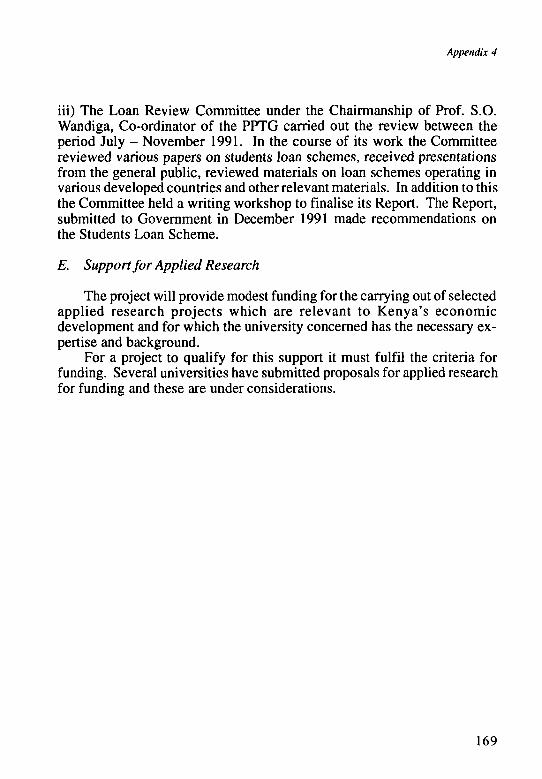
Appendix 4
iii) The Loan Review Committee under the Chairmanship of Prof. S . O . Wandiga, Co-ordinator of the P P T G carried out the review between the period July - November 1991. In the course of its work the Committee reviewed various papers on students loan schemes, received presentations from the general public, reviewed materials on loan schemes operating in various developed countries and other relevant materials. In addition to this the Committee held a writing workshop to finalise its Report. The Report, submitted to Government in December 1991 m a d e recommendations on the Students Loan Scheme.
E. Support for Applied Research
The project will provide modest funding for the carrying out of selected applied research projects which are relevant to Kenya's economic development and for which the university concerned has the necessary expertise and background.
For a project to qualify for this support it must fulfil the criteria for funding. Several universities have submitted proposals for applied research for funding and these are under considerations.
169

H E P publications and documents
M o r e than 1,120 titles on all aspects of educational planning have been published by the International Institute for Educational Planning. A c o m prehensive catalogue, giving details of their availability, includes research reports, case studies, seminar documents, training materials, occasional papers and reference books in the following subject categories:
Economics of education, costs and financing.
Manpower and employment.
Demographic studies.
The location of schools (school map) and sub-national planning.
Administration and management.
Curriculum development and evaluation.
Educational technology.
Primary, secondary and higher education.
Vocational and technical education.
Non-formal, out-of-school, adult and rural education.
Disadvantaged groups.
Copies of the catalogue may be obtained from the H E P Publications Unit on request.

T h e International Institute for Educational Planning
The International Institute for Educational Planning (HEP) is an international centre for advanced training and research in the field of educational planning. It was established by U N E S C O in 1963 and is financed by U N E S C O and by voluntary contributions from M e m b e r States. In recent years the following M e m b e r States have provided voluntary contributions to the Institute: Denmark, Germany, Iceland, India, Ireland, Norway, Sweden, Switzerland and Venezuela.
The Institute's aim is to contribute to the development of education throughout the world, by expanding both knowledge and the supply of competent professionals in the field of educational planning. In this endeavour the Institute co-operates with interested training and research organizations in M e m b e r States. The Governing Board of the H E P , which approves the Institute's programme and budget, consists of a m a x i m u m of eight elected members and four members designated by the United Nations Organization and certain of its specialized agencies and institutes.
Chairman: Lennart Wohlgemuth (Sweden), Director, The Nordic Africa Institute, Uppsala,
Sweden.
Designated Members: David de Ferranti, Director, H u m a n Development Department ( H D D ) , The World
Bank. Washington, U S A . Carlos Fortin, Deputy to the Secretary-General, United Nations Conference on Trade
and Development (UNCTAD) ,Geneva , Switzerland. Miriam J. Hirschfeld, Chief Scientist for Nursing, Division of Analysis, Research
and Assessment, World Health Organization ( W H O ) , Geneva, Switzerland. Jeggan C. Senghor, Director, United Nations African Institute for Economic
Development and Planning (IDEP), Dakar, Senegal.
Elected Members: Dato'Asiah bt. Abu Samah (Malaysia), Corporate Advisor, Lang Education, Land
and General Berhad, Kuala Lumpur, Malaysia. Klaus Hiifher (Germany), Professor, Freie Universität Berlin, Berlin, Germany. Faim Kefi (Tunisia), President, National Union of Tunisian W o m e n , Tunis, Tunisia. Tamas Kozma (Hungary), Director-General, Hungarian Institute for Educational
Research, Budapest, Hungary. Teboho Moja (South Africa), Special Adviser to the Minister of Education, Pretoria,
South Africa. Yolanda M. Rojas (Costa Rica), Professor, University of Costa Rica, San José, Costa
Rica. Michel Vernières (France), Professor, University of Paris I, Panthéon-Sorbonne,
Paris, France.
Inquiries about the Institute should be addressed to: The Office of the Director, International Institute for Educational Planning, 7-9 rue Eugène-Delacroix, 75116 Paris, France.
T h e book
W h a t are the main problems confronting the Kenyan public higher education system particularly in respect of its financial management? What kind of reforms have been tried in the past? With what results? Wha t role did the Policy and Planning Task Group play in these reforms in general and in the preparation of the Universities Investment Programme in particular? What were the implications of the Task Force findings for financial management of higher education in general and in the formulation of managerial reforms in the Student Loan Scheme in particular? H o w could financing of higher education in Kenya be diversified? Wha t would be the implications of all these changes for the overall management of the university system in the country? Professor S h e m Oyoo Wandiga, a distinguished educationist of Kenya attempts to answer these questions in the present study based on a World Bank Credit project. This forms part of the H E P series of studies Improving the managerial effectiveness of higher education institutions.
T h e author
Professor Shem Oyoo Wandiga has a P h D in Chemistry from the Case Western Reserve University, U S A . A Professor of Chemistry in the University of Nairobi, Kenya, Professor Wandiga was also Deputy Vice-Chancellor (Administration and Finance) of the University. H e was subsequently appointed as the Co-ordinator of the Policy and Planning Task Group of the Ministry of Education (1991), elected as Kenya's representative to the Executive Board of U N E S C O (1995), and as a member of the General Committee of the International Council of Scientific Unions. Currently Chairman of the Kenya National Academy of Sciences, Professor Wandiga is the author of a large number of publications in scientific and educational fields. H e has also chaired several national committees on university education and been a consultant on World Bank and United Nations Environment Programme projects undertaken in Kenya.
International Institute for Educational Planning (HEP) 7-9 rue Eugène-Delacroix, 75116 Paris, France