Embed Size (px)
Citation preview

Capacity Dimensioning and Routing for Hybrid
Satellite and Terrestrial Networks
by
Lillian Lei Dai
B.Sc., Electrical Engineering and Computer ScienceUniversity of Calgary, Canada (2000)
Submitted to the Department of Electrical Engineering and ComputerScience in partial fulfillment of the requirements for the degree of
Master of Science in Electrical Engineering and Computer Scienceat the iAKE
MASSACHUSETTS INSTITUTE
MASSACHUSETTS INSTITUTE OF TECHNOLOGY OF TECHNOLOGY
May 2002 JUL 3 1 2002
LIBRARIES
© 2002 Massachusetts Institute of Technology. All rights reserved.
Author
Department of Electrical Engineering and Computer ScienceMay 10, 2002
Certified by_Vincent W. S. Chan
Joan and Irwin Jacobs Professor of Electrical Engineering& Computer Science and Aeronautics & Astronautics
Director, Laboratory for Information and Decision SystemsThesis Suppiwisor
Accepted byArthur C. Smith
Chairman, Department Committee on Graduate Students

Capacity Dimensioning and Routing for Hybrid Satellite and
Terrestrial Networks
by
Lillian Lei Dai
Submitted to the Department of Electrical Engineering and Computer Scienceon May 10, 2002, in partial fulfillment of the requirements for the degree of
Master of Science in Electrical Engineering and Computer Science
Abstract
For future commercial broad-band data satellite networks, satellite network topology, linkcapacity, and routing have major impacts on the cost of the network and the amount ofrevenue the network can generate. In this thesis, we establish a mathematical framework,using two-stage stochastic programming, to assist network designers in selecting the mostcost-effective network topology for data applications. The solution to the stochasticprogramming formulation gives optimal link capacities and an optimal routing strategyfor different network topologies, taking into account uncertainties in long-term aggregatetraffic statistic estimation. For several classes of satellite topologies of interest, analyticalsolutions have been derived. In particular, we give the optimal topology selection criteriafor a general GEO satellite network and identify regions where a hybrid satellite-terrestrial topology is the most cost effective. For LEO and MEO satellite networks,comparisons between different routing strategies for polar constellations with and withoutseam are presented. The analytical solutions we have derived capture the salient networkdesign parameters and their relationships. These analyses offer much insight into thedesign tradeoffs for a hybrid satellite-terrestrial network.
Thesis Supervisor: Vincent W. S. ChanJoan and Irwin Jacobs Professor of Electrical Engineering& Computer Science and Aeronautics & AstronauticsDirector, Laboratory for Information and Decision System
2

Acknowledgements
I would like to express my sincere gratitude towards my advisor, Professor Vincent W.S.
Chan, for giving me guidance and encouragements over the past two years. His insights
nurtured my approach to research and helped to refine my thesis. Professor Chan's
vision and commitment for excellence in all aspects of engineering continue to be a
tremendous source of inspiration for me. I am also grateful to DARPA and MIT for
providing me with financial support, without which, this work would not be possible.
I would like to thank all my friends' for their companionship and support; in particular, I
thank my friends at LIDS for the many insightful discussions and for making my life
enjoyable at MIT. My gratitude also goes towards my professors at MIT and at the
University of Calgary. I am forever indebted to their guidance, support, and
encouragements.
Lastly, I would like to thank my family - mom, dad, and Linda - for believing in me and
always being there for me. No words can express my gratitude for the unconditional love
they have given me throughout my life. I would also like to thank my grandparents,
uncles, aunts, and cousins for their love and support.
Special thanks to: Robert Chiew for love and encouragements; Lalitha Sankaranarayanan for mentorship;Jason Bau, Serena Chan, Li-Wei Chen, Patrick Choi, Todd Coleman, Bishwaroop Ganguly, Anand Ganti,Kyle Guan, Danielle Hinton, Ari Libarikian, Chunmei Liu, Desmond Lun, Irina Medvedev, Etty Shin, JunSun, Richard Thommes, Frank Wang, Hungjen Wang, Guy Weichenberg, Yong-Gang Wen, Edmund Yeh,Won Yoon; SEBC committee members; Bin Hu, Janice Lee, Vinson Lee, Brenda Ng, Steve Wang, Yi Yu,Noreen Zaman, Johnny Zhang.
3
L.

EU_
Contents
ACKNOWLEDGEMENTS ........................................................................................ 3
LIST OF FIGURES...................................................................................................... 6
LIST OF TABLES...................................................................................................... 6
1. INTRODUCTION..................................................................................................... 7
2. BACKGROUND ...................................................................................................... 10
2.1 SATELLITE TOPOLOGIES......................................................................................... 102.2 C OST A NALYSIS .................................................................................................... 122.3 LINK CAPACITY DIMENSIONING............................................................................ 14
2.4 OPTIMAL ROUTING OVER HYBRID NETWORKS ..................................................... 15
3. PARAMETRIC COST FUNCTIONS .................................................................. 16
3.1 INTER-SATELLITE LINK COST ESTIMATE .............................................................. 19
3.2 GATEWAY LINK COST ESTIMATE .......................................................................... 233.3 TERRESTRIAL LINK COST ..................................................................................... 263.4 SU M M ARY .............................................................................................................. 27
4. TWO-STAGE STOCHASTIC PROGRAMMING ............................................. 28
5. GEO SATELLITE-TERRESTRIAL NETWORK.............................................. 33
5.1 TOPOLOGY SELECTION FOR SATELLITE TERMINAL TO SATELLITE TERMINAL (ST-ST)
T R A FFIC ......................................................................................................................... 355.1.1 ST-ST Traffic Carried by ISL Only ............................................................. 365.1.2 ST-ST Traffic Carried by Terrestrial Network Only..................................... 425.1.3 Hybrid Satellite-Terrestrial Link Dimensioning for ST-ST Traffic............... 455.1.4 Topology Comparison for ST-ST Traffic .................................................... 50
5.2 TOPOLOGY SELECTION FOR SATELLITE TERMINAL TO GROUND TERMINAL (ST-GT)
AND G T-ST TRAFFIC .................................................................................................. 535.2.1 ST-GT and GT-ST Traffic Carried by ISL Only ........................................... 535.2.2 ST-GT and GT-ST Traffic Carried by Terrestrial Network Only ................. 545.2.3 Hybrid Satellite-Terrestrial Link Dimensioning for ST-GT and GT-ST Traffic................................................................................................................................... 5 45.2.4 Topology Comparison for ST-GT and GT-ST Traffic.................................. 55
5.3 GEO SATELLITE LINK CAPACITY DIMENSIONING AND ROUTING ......................... 565.4 CONSTELLATION SIZE OPTIMIZATION .................................................................. 755.5 SU M M A R Y ................................................................................................................ 78
4
I

6. LEO AND MEO SATELLITE-TERRESTRIAL NETWORKS.........................80
6.1 POLAR CONSTELLATION WITHOUT SEAM.............................................................. 826.1.1 Routing Using ISLs Only ............................................................................. 836.1.2 Routing Using Terrestrial Network Only..................................................... 84
6.2 POLAR CONSTELLATION WITH SEAM ....................................................................... 856.2.1 Routing Using ISLs Only ............................................................................. 856.2.2 Routing Using Terrestrial Network Only..................................................... 87
6.3 SUMMARY ....................................................................................... ........... 88
7. CONCLUSIONS AND DISCUSSIONS................................................................89
REFERENCES............................................................................................................ 95
APPENDIX A. DERIVATION FOR ST-GT AND GT-ST TRAFFIC................... 97
APPENDIX B. DERIVATION FOR LEO/MEO SYSTEMS...................................105
5

List of Figures
Figure 3-1 Communication Links in a Hybrid Satellite-Terrestrial Network................ 17Figure 3-2 Laser ISL Components [14]......................................................................... 19Figure 3-3 RF ISL Components [14]............................................................................. 20Figure 3-4 Satellite Downlink Subsystem [14]............................................................. 24Figure 5-1 ISL Only Topology for ST-ST Traffic......................................................... 36Figure 5-2 Optimal Link Capacity vs. Link Cost Ratio................................................ 41Figure 5-3 Ground Only Topology for ST-ST Traffic.................................................. 42Figure 5-4 Hybrid Topology for ST-ST Traffic .......................................................... 46Figure 5-5 Feasible Regions for Different Topologies Using ST-ST Traffic................ 52Figure 5-6 ISL Only Topology for ST-GT and GT-ST Traffic .................................... 53Figure 5-7 Ground Only Topology for ST-GT and GT-ST Traffic............................... 54Figure 5-8 Hybrid Topology for ST-GT and GT-ST Traffic......................................... 54Figure 5-9 Feasible Regions for Different Topologies Using ST-GT and GT-ST Traffic55Figure 5-10 General GEO Satellite Network................................................................ 56Figure 5-11 Cut Set for a N node Satellite Network.................................................... 59Figure 5-12 Illustration of M-hop Traffic on a Link..................................................... 64Figure 5-13 M-hop Traffic in a Ring Network ............................................................. 65Figure 5-14 Optimal Effective System Cost for Three GEO Satellites......................... 72Figure 5-15 Optimal Effective System Cost for Four GEO Satellites.......................... 73Figure 5-16 Feasible Regions for GEO Satellite Topologies ........................................ 74Figure 5-17 GEO Satellite ISL Link Distance............................................................. 75Figure 5-18 Cost Parameters vs. Number of Satellites.................................................. 77Figure 6-1 Iridium Satellite Constellation....................................................81Figure 6-2 Worst Case Link Utilization for LEO/MEO Systems..........................86Figure B -I 2-D Torus G raph......................................................................105
List of Tables
Table 2-1 Commercial Satellite Systems (In service and proposed)................................ 11Table 5-1 Optimal Capacity and Effective System Cost for Uniform Distributed ST-ST
T raffic.................................................................................... . ... 5 1Table 5-2 Optimal Effective System Cost for Three and Four GEO Satellite Systems... 71Table 6-1 Capacity Required on each ISL Link..............................................83
6

Chapter 1
Introduction
Satellites systems have been used to provide various telecommunication services for
more than half of a century. The first generation systems are geosynchronous earth orbit
(GEO) satellites providing TV broadcasting and telephony trunking services between
large, fixed Earth stations. Second generation systems have added the element of
mobility, employing large mobile terminals for communication between ships, aircrafts
and land vehicles. In the 1990s, there has been a surge of interest in developing third
generation personal mobile satellite systems. These systems are intended to provide
personal communications services to users with small, hand-held terminals. Many third
generation satellite systems have been proposed in the USA to provide global telephony
and data services [1]. The Iridium and Globalstar systems, designed to provide global,
personal mobile telephony services, came into service in the late 1990s. Unfortunately,
both businesses have declared bankruptcy within one or two years of service. Since the
failure of the two businesses, many other proposed systems have either been cancelled or
have been put on hold.
Despite commercial failure of the two satellite businesses, it is foreseeable that satellite
communication systems can play an important role as a part of the Next Generation
Internet (NGI), particularly in providing ubiquitous communication for multimedia and
high data rate networking applications. The large coverage areas, rapid deployability,
and inherent support for mobile services, make satellite systems a likely candidate to be
7

integrated into the future telecommunication infrastructure. It has also become clear,
however, that in order to realize future commercial broad-band data satellite networks, it
is critical for satellite network designers to consider both technical and economical design
factors to ensure that the satellite network is technically robust and economically
competitive in the commercial market.
Several satellite network design factors have major impacts on its commercial success:
physical topology, link capacities, and routing strategy. These design factors greatly
influence the cost of the system as well as the amount of revenue the network can
generate. Recent research activities have placed much emphasis on the design of the
satellite segment, with a noticeable gap on a complete hybrid satellite-terrestrial network
design methodology [2], [3], [4]. There is a need to study how satellite and terrestrial
networks can complement each other to improve the efficiency of both networks.
In general, given a particular market the satellite network serves, there exist many
different satellite network topologies capable of providing the same type of services, but
at very different costs. A satellite network topology specifies satellite altitude,
constellation, the number of satellites and gateways, and how communication nodes are
interconnected. For example, the Iridium and Globalstar satellite systems both serve the
satellite mobile telephony market, but Iridium uses inter-satellite links (ISLs) whereas
Globalstar does not. One of the most important goals for satellite network design is to
identify the most economical satellite network topology for the intended application.
Clearly, the cost of gateways and ISLs play an important role in determining the optimal
network topology. There are three scenarios: 1. if the cost of providing ISLs is very low,
then these links should be dimensioned to carry the worst-case traffic demand. 2. if the
ISLs are very expensive, then it would be more economical to not use ISLs at all. In this
case, all of the traffic must be routed by the terrestrial fiber network at an extra cost. 3. if
neither of the previous two extreme scenarios holds, then a hybrid satellite-terrestrial
network utilizing ISLs and the terrestrial fiber network is more economical. The ISLs
may be dimensioned to support average traffic demand in order to achieve high
8

utilization of the ISLs, while the excess traffic may be routed by the terrestrial fiber
network at a cost. The problem of optimal satellite topology selection, taking into
account system cost, capacity dimensioning and routing, has not been studied previously.
In this thesis, we establish a mathematical framework to analyze and compare different
satellite network topologies from an economic perspective. We assume that the network
designer has a reasonable prediction of future traffic demand, albeit with some
uncertainty. For a particular satellite network topology, two-stage stochastic
programming is used to find optimal link capacities and an appropriate routing strategy to
minimize an effective system cost [5]. The effective system cost is defined to be the sum
of satellite network investment cost, cost of routing using terrestrial links, and an
opportunity cost for rejecting excess input traffic, subject to quality of service (QoS)
constraints. Once effective system costs are obtained for different topologies, the most
cost-effective topology may be selected for deployment. We derive analytical solutions
for several GEO, medium earth orbit (MEO), and low earth orbit (LEO) topologies and
obtain criteria for optimal topology selection.
The contents of this thesis are organized as follows: In Chapter 2, we present some
background on the current research in the field. Chapter 3 presents simple parametric
link cost models used for system cost optimization. In Chapter 4, the stochastic
optimization problem is formulated for general satellite networks. This formulation is
useful for obtaining optimal link capacities and an optimal routing strategy for different
satellite topologies. In Chapter 5 and 6 we analyze GEO, MIEO and LEO system design
in detail. In particular, we show optimal topology selection criteria based on link cost
parameters. Chapter 7 summarizes the major results and presents a discussion for
possible future research directions.
9

Chapter 2
Background
The primary satellite design issues we wish to study are: optimal satellite network
topology selection based on system cost, link capacity dimensioning for the various links
in a satellite network, and routing for different classes of traffic under uncertain input
traffic conditions. In this chapter, we first give a summary of some of the existing and
proposed satellite network topologies. Next, we discuss some of the current system cost
modeling techniques. Finally, we discuss some of the link capacity dimensioning and
routing techniques in literature. These discussions will set the stage for the analysis we
present in subsequent chapters.
2.1 Satellite Topologies
As mentioned before, satellite network topology is a critical design factor that influences
the cost of the satellite network. By satellite network topology, we mean satellite altitude,
constellation, the number of satellites and gateways, and how communication nodes are
interconnected. A summary of some of the commercial mobile satellite systems (in
service and proposed) is given in Table 2-1.
10

Table 2-1 Commercial Satellite Systems (In service and proposed)
Primary Satellite Coverage Altitude Trajectory Satellite ISL # # Cost
Service Systems Sats GWs ($B)
Voice Iridium2 Global LEO Circular RF 4-way 66 12 4.7
780 km Polar ISL
Globalstar Global LEO Circular None 48 60* 2.5
1414 km Walker
ACeS4 Regional GEO Stationary None 1
Thuraya3 Regional GEO Stationary None 2
Data TeledesiC Global LEO Circular Optical 8- 288
Polar way ISL
Spaceway' Regional GEO Stationary None 2
Astrolink" Global GEO Stationary Optical 9 4
From Table 2-1, it is clear that there exist many different satellite topologies capable of
providing similar types of services. Given the numerous possibilities for satellite system
topology, a system designer must identify the components that are most costly and
optimize the system to provide desired quality of service at low costs. Aside from cost,
there are also numerous other factors that may influence topology selection. Some of the
non-technical factors include: data security (may favor the use of ISLs since signals can
bypass some countries), gateway placement constraints due to political reasons, inability
to service some countries due to governments protecting its own local providers, lawful
intercept requirement imposed by some countries, etc [6]. Although these factors are
extremely important, and must be considered when designing a satellite system, we
ignore their effects in our analysis in order to focus on the technical problem at hand.
2 Iridium LLC began service in May 1998 and declared bankruptcy in Aug. 1999. Iridium Satellite LLC
acquired all operating assets of Iridium LLC in March 2001 and resumed commercial service.
3 Globalstar began service in Oct. 1999 and filed for bankruptcy protection in Feb. 2002. *approximately
60 gateways proposed; 25 gateways in service as of April 2002.4 Asia Cellular Satellite System began service in Sept. 2000. It services 24 countries in Southeastern Asia.
5 Thuraya began service in April 2001. It intends to serve 99 countries in Europe, North and Central Africa,
the Middle East, Central Asia and the Indian Subcontinent.6 Teledesic is targeted to begin service in 2005. The numbers provided in Table 2-1 are for its original plan.
Teledesic has recently changed the design of its constellation to 30 MEO satellites, after acquiring the ICO
system. No other details are publicly available.7 Spaceway system is targeted to begin service in 2002.8 Astrolink system is targeted to begin service in 2003.
11
Several authors have studied specific satellite network topologies and some have
proposed new topologies; however there lacks a concrete guideline on selecting the
optimal topology. In [7], the author gives a concise summary of the basic constellation
types: Geosynchronous, Walker, Streets-of-Coverage, and Elliptical. Although orbital
mechanics impose constraints on satellite constellations, there remain a large number of
satellite constellations to select from. In theory, there is a continuum of possibilities for
satellite network topology with satellites in different constellations either interconnected
with one another or not. Service requirements such as delay, path loss, coverage area,
availability, minimum number of satellites for global coverage and satellite life time in
different orbits serve to reduce the space of topologies. The remaining satellite
topologies can be used to satisfy all of the service requirements. The problem is then to
select the optimal topology from this feasible topology set. We address the optimal
topology selection problem in this thesis from both technical and economical
perspectives.
2.2 Cost Analysis
System cost analysis is critical for any commercial system design. Typically, there are
three ways to estimate system cost:
1. Analyze Component Costs - this method is applicable after a preliminary design
has been done and the actual critical components have been identified.
2. Comparing Similar Systems and Extrapolate - this method is valid only if similar
systems exist and can be use as design guidelines. For broad-band data satellite
networks, this method is not applicable since there are no available systems to
extrapolate costs from.
3. Parametric Analysis - this method formulates mathematical relationships between
salient technical parameters and cost. It can be used effectively to study system
tradeoffs. Since the design of a broad-band data satellite network is still in the
research stage, this is the most logical cost analysis method for this study.
12

Cost studies have been performed extensively in industry. NASA has developed an
Aerospace Small Satellite Cost Model (SSCM) to evaluate the cost of designing, building,
and testing of a modem small satellite. There are also handbooks providing detailed
guidelines on parametric cost estimation [8]. The cost models used typically involve a
large number of parameters and produce numerical results that depend heavily on input
parameters. Since broad-band satellite system will utilize new technological building
blocks, the cost models developed in previous studies will not be suitable for our study.
Several cost and system optimization studies have been done for satellite planning. In [9],
the authors formulated cost models based on actual costs from several commercial,
military and special purpose satellites. Optimal technical parameters such as satellite
power, mass, and number of transponders have been used in the cost model. With the
objective of profit maximization subject to technical parameter and cost constraints, a
geometric programming algorithm was used to generate numerical results for specific
input parameters. This study was performed for a single satellite system and does not
generalize to a network of satellites. Furthermore, the cost models used may not be
applicable to future broad-band satellite systems since ISL cost was not considered in
their model.
In [4], ISL cost was formulated as a function of link distance and capacity. This model
was used to optimize interconnections between satellites and to study the effect of
different traffic distributions on the space segment. For the purpose of the current study,
we would like to take a similar approach as used in [4] whereby critical cost components
are identified and characterized based on simple models with a few salient parameters.
This is considered to be a desirable approach since the goal of the study focuses on
network aspects which depend on the cost of interconnections between satellites and the
gateways. By formulating cost as a function of link distance and capacity, much insight
may be gained on optimal system topology.
13

2.3 Link Capacity Dimensioning
There have not been many studies on link capacity dimensioning for a data satellite
network. In [2], some techniques for spot beam and ISL capacity dimensioning are
presented. Relative link capacity and optimal capacity dimensioning for the entire
network are not considered. Moreover, none of the dimensioning techniques examine
relative monetary costs between links which we consider to be a critical factor to network
capacity design.
For general network dimensioning problems, there are two main formulations. For
circuit-switched telephony networks, designers traditionally use Poisson input model and
Erlang formulas to compute the number of circuits required on a link subject to
probability of blocking constraints [10]. In a network setting, fixed routing strategy and
link independence are often assumed to keep the problem tractable. For packet-switched
networks, flow models are often used for link dimensioning. For a known input flow
demand, the goal is to optimally route the flow in order to minimize system cost subject
to delay constraints. As described in [11], optimizing network with respect to both link
capacity and routing is difficult. Hence, heuristic methods are often used to iteratively
design link capacity and routing in order to find the optimal system topology.
Both formulations above are used to obtain a single-point optimal solution for a known
traffic pattern. In reality, traffic pattern is usually not known accurately in advance. For
terrestrial networks, this does not present a significant problem since there is flexibility to
modify the existing systems, upgrade components, and to expand the capacity of a
network when traffic pattern changes or if the network is not utilized efficiently. For a
satellite network, however, it is very difficult to modify the satellite components once
satellites are launched into orbit. Hence, when designing a satellite system, it is critical to
consider the uncertainties in traffic pattern. This problem may be addressed by two-stage
stochastic programming [12] as we will explore in this thesis.
14

2.4 Optimal Routing Over Hybrid Networks
Recent research in routing over satellite networks have focused on routing algorithms for
LEO satellite networks utilizing ISLs. Most of the works consider static or topology
adaptive routing over the space segment assuming that the link capacities are given [2].
As we have described in Section 2.3, routing and capacity dimensioning are two tightly
coupled problems that strongly influence each other. Hence to study routing over
satellite networks, one should consider the impact of routing schemes on link capacities
and the cost of the entire satellite network.
For a satellite network interconnected with the terrestrial network, the terrestrial facilities
may be used to carry some of the satellite traffic. This allows the ISLs to be dimensioned
with lower capacity which reduces the cost of the space segment while improving the
utilization on these links. Aside from interface protocol issues at the satellite-terrestrial
network boundary, there are fundamental routing issues that need to be addressed for a
hybrid satellite-terrestrial network including routing strategies for different types of
traffic and the impact of different routing strategies on satellite network cost. There
appears to be a research void on the topic of routing over hybrid satellite and terrestrial
networks. This thesis study is intended to fill that void.
15

Chapter 3
Parametric Cost Functions
Satellite system cost plays a major role in determining the success or failure of a satellite
business. In this chapter, we formulate simple parametric link cost models based on
fundamental relationships among link data rate, antenna aperture, link distance, and cost.
These cost models will be useful for satellite network topology comparison and for
dimensioning link capacities.
There are several elements contributing to the overall satellite system cost. We assume
that the user terminal cost and the cost of user terminal connection to the gateway are
born by the user and the terrestrial carrier respectively. In any case, these costs are
common to all satellite network topologies and are thus inconsequential to the outcome of
our study. The satellite system cost consists of the following factors:
Initial investment
" Space segment: satellites, spectrum cost, launch cost (plus insurance).
* Ground segment: gateways, extension from the gateways to the terrestrial
backbone, control centers.
" Additional interconnection: fibers that interconnect gateways and control
centers
Monthly fixed cost
* Space segment: satellite control.
16

* Ground segment: operation of gateways and control centers.
* Interconnection: maintenance.
Monthly variable cost
* Amount paid for routing traffic on the terrestrial fiber network. We assume
that the service is provided by a commercial terrestrial network service
provider and a per-flow cost is incurred whenever a unit flow of traffic is
routed on a fiber link.
The parametric cost models we will formulate are derived in a similar fashion as those in
[4]. The cost elements listed above are grouped into individual link costs as functions of
link capacity and link distance. These cost functions will serve as bases for comparison
between different network topologies.
For a satellite network interconnected with the terrestrial network, the possible
communication links are: up and down links to user terminals (access links), ISLs, up and
down links to the gateways (gateway links), and terrestrial links. The communication
nodes and different links are shown in Figure 3-1. Depending on the satellite network
topology, some of these links may not be used.
Figure 3-1 Communication Links in a Hybrid Satellite-Terrestrial Network
17
Inter-satellite links
Gateway
Access Links
Links
rminalUser te
Terrestrial Links

For ease of analysis, we make the assumption that all satellites in the network are
identical. This is a reasonable assumption for satellite networks since mass-producing
identical satellites can greatly reduce the cost and risk of the system. The advantage is
especially apparent for low earth orbit (LEO) systems where tens, if not hundreds, of
satellites are needed for global coverage. For geosynchronous satellite (GEO) systems,
the identical satellites assumption may not always hold but is amenable for analysis.
The ISLs are likely to use free-space optical systems as these systems have been
identified to be more cost-effective over the traditional radio frequency (RF) links for
data rates above 10 Mbps [13]. The gateway links and access links will likely be RF
based. For ease of analysis, all gateway links for a particular topology are assumed to be
identical in capacity and cost. In reality, depending on the traffic distribution, some
gateways may be dimensioned to carry more traffic than others. The access links are
assumed to be identical in terms of cost and capacity for all satellite topologies with equal
number of satellites and with satellites at the same altitude. In our analysis, we restrict
ourselves to compare only those topologies with equal number of satellites and with
satellites at the same altitude. Essentially, we compare three satellite topologies:
satellites interconnected by ISLs, satellites interconnected by gateways, and satellites
interconnected by both ISLs and gateways. Since the access links are assumed to be
identical in all three cases, they do not contribute to the cost difference between
topologies and will not be included as a part of the formulation. The terrestrial links are
assumed to have much higher capacity compared to ISLs and gateway links. A single
strand of terrestrial fiber link can carry approximately 100 Tbps (x10" bits per second)
of traffic for long distance transmission while the satellite gateway link capacity is
largely constraint by RF spectrum allocations to a few hundred Mbps. Due to capacity
limitation, satellites will not satisfy all or a significant fraction of current or future traffic
demands; however, it can be used to complement the terrestrial fiber network. Link cost
functions for ISLs, gateway links, and terrestrial links will be developed in the following
sections.
18

3.1 Inter-Satellite Link Cost Estimate
Inter-satellite links (ISLs) can employ either laser or radio frequency (RF) equipments.
For completeness, both laser and RF ISLs will be analyzed. Block diagrams for the ISL
subsystem are shown in Figures 3-2 and 3-3 for laser and RF ISL respectively. The
difference in cost between laser and RF ISLs stems from the difference in the operating
frequency. RF ISLs are most likely to operate in the 23GHz and 60GHz range. These
frequencies correspond to atmospheric absorption peaks and are best suited for ISL use.
Laser ISLs operate on the order of 10 4 Hz. This difference in operating frequency
impacts beam divergence angles and antenna size (weight). Operating at higher
frequencies requires smaller antennas but more complex pointing and tracking systems
due to smaller beam divergence angle. In this section, the word antenna will be used for
both RF antenna and laser communication telescope.
DaaN Signal Transmitter Modulator Imaging ...Processing (Laser) Optics
SpacecraftPower Power Pointing &
Regulator Tracking Element channelAssembly
Acquisition,
Thermal Structure Pointing &Control Tracking Elements
Data Signal Receiver ImagingProcesssg (Detector) Optics
Figure 3-2 Laser ISL Components [14]
19

Dat Signal Modulator Power 10Antenna_____Processing Amplifier
SpacecraftPower Power Pointing &
Regulator Tracking Element channelAssembly EA b Acquisition,
Thermal Structure Pointing &
Control Tracking Elements
Data Signal Demodulator Low noise AntennaProcessing Amplifier
Figure 3-3 RF ISL Components [14]
In the ISL link cost model, we are interested in expressing cost as a function of distance
and link capacity. The cost of an ISL depends strongly on the weight of the ISL
subsystem and the amount of power it requires. Increase in satellite payload weight leads
to higher satellite bus cost and launch cost. Since majority of the weight of the ISL
subsystem comes from antenna, tracking system, and the supporting structures, these
elements directly influence the cost of an ISL. The amount of power an ISL needs to
establish a communication link influences the size of the solar panel and on-board
batteries which, in-turn, influences the weight of the power subsystem.
Assume that the onboard power allocated for each ISL is limited and is held constant.
Then the cost of each ISL, $ISL, depends mainly on the weight of the ISL subsystem,
WrsL. Typically, launch cost for satellites is expressed in terms of dollars per pound.
This is a linear relationship relating cost and weight of a satellite. The ISL cost (for
transmitter and receiver pair) may be approximated as $ -sL = k W"a + k2 where 1 a 2;
k, and k2 are constants for a particular ISL technology and a particular launch vehicle.
The cost of building an ISL subsystem as well as the increased complexity in the satellite
bus contribute to both k and k2 .
20

As mentioned before, WsL is directly related to the antenna aperture diameter, DIsL. For
laser ISLs, the primary telescope mirror constitutes a large portion of the weight.
Telescope mirror weight is approximately proportional to the area of the mirror.
Together with the telescope enclosure and the supporting structures, the weight of an ISL
subsystem is proportional to DISL , where 2 / # 3 . For RF ISLs, the antenna
constitutes a large portion of the weight and the weight of the ISL subsystem is also
roughly proportional to DISL6. Overall, the weight of an ISL can be approximated as
WISL = aDISL + b, where a and b are constants that depends on technology.
The ISL cost can be written as
$ISL = kWaL+k 2 =k,(aDSL6+b)+k 2 (3.1)
~ kI /DISL afi+k f
The approximation in Equation 3.1 is made assuming the parameter b is relatively small.
We would like to relate this cost function to the capacity and distance of the link. This
can be done by examining the link equation. Let the power available to establish one ISL
link to be P .
At the receiving satellite, the received power is
47gd Lothers
where
d = physical distance of the ISL
GT = transmission antenna gain
GR = receiving antenna gain
A = operating wavelength
Lothers = Losses due to antenna pointing, transmission line, and coupling.
21

Typically, the transmit and receive antennas for an ISL are of the same size. The antenna
gains may be expressed as G 4A -2 D2 where t7 represents antenna efficiency,
A represents antenna aperture area, and D represents antenna aperture diameter.
)T2 )7(D)' r2)7( D )2 A )2A
Equation 3.2 can be rewritten as PR T 2 2 . At
S4)rd Lthr
the decoder, the carrier power to noise power ratio C/N is:
C _ PR- D - (3.3)N skTB kTB 4Ad Lothers NOB
where k = Boltzmann's constant, T = receiver noise temperature in Kelvin, B =
bandwidth in hertz, and R = data rate in bits per second.
Given a specific Eb/NO required for decoding, and assuming all other variables are held
constant, the antenna aperture diameter must change in order to obtain different data rates.
The relationship between D and R can be expressed as:
Rd 2D =d (3.4)
4 A )Lohr kTs ( Eb/ N)
Defining a constant:
14= 2(3.5)
7M ) 1 P
4A) Lers IkT (Eb/NO)
we can rewrite Equation 3.4 as
D= R 4d 2(3.6)
Given this relationship, we can rewrite Equation 3.1 in terms of R and d.
22

$IsL = kIDISLa"i + k2 = k '4 R4d2J +k 2 (3.7)
Equation 3.7 is applicable to both laser and RF ISLs. We expect kl,RF > kiaser due to the
much higher carrier frequency used for laser systems, which results in smaller telescope
aperture required. The constant term, k 2', includes all pointing and tracking hardware.
We expect k 2,RF ,k2 .aser since higher precision is required to perform laser beam
tracking due to the narrower beam divergence angle for laser beams.
If link distance is kept constant, we can express Equation 3.7 by:
a,6
$1SL = nlR 4 +m2 , where 0.5 < -1.5 (3.8)4
in and m2 are constants for a given technology.
3.2 Gateway Link Cost Estimate
In this section, parametric cost model for a gateway link is established. Figure 3-4 shows
the downlink subsystem on the satellite as well as the ground station components. We
assume that the cost of the uplink is the same as that of the downlink. Hence, in the
subsequent development, only downlink is considered.
The cost of the downlink consists of both satellite and ground component costs. For the
satellite downlink subsystem, majority of the cost comes from the RF antenna and the
supporting structures. The derivation for this cost is similar to the derivation of cost for
RF ISLs. For the ground station, majority of the cost comes from the antenna and
supporting structures. There is also a fixed cost component that includes base band and
control equipment, physical facility, electrical power, temperature and humidity control,
and connection to the terrestrial network.
23

Daa Signal Modulator Power AntennaProcessing Amplifier
Spacecraft ThermaPower Power
Regulator.......Assembly .S.el.t.... .......... Structure
channel
.......G atew ay............................................................................................................................
Terrestrial Monitor Power Acquisition,interface and and and Pointing &connection control Utilities Tracking Elements
Signal Demodulator Low noise AntennaProcessing Amplifier
Figure 3-4 Satellite Downlink Subsystem [14]
The cost of the satellite component has the form $,, = k3DTafi + k4 where 15 a 2 and
2 ,6! 3; k3 is a proportionality multiplier, and k4 is a constant cost. The cost of the
ground component has the form $ground = k5DR k6 , where 2 y 5 3. Note that the
antenna on-board the satellite and the antenna at the gateway are generally not the same
size. Together, the total cost of the downlink has the form
$down = k3Drap +k 5 DRY +k 7 (3.9)
As before, we would like to express the cost function in terms of link capacity and link
distance. For the downlink, assume that the on-board transmitted power is held constant
A 2 1at P . At the gateway, the received power is: PR= PTGTGR - , where
4dTd Lpilia o wn
d = physical distance of the downlink
24

Lothers (f) = path loss due to precipitation, scintillation, atmospheric absorption, antenna
pointing loss, multipath/shadowing, etc. This loss factor is a function of signal carrier
frequency since atmospheric absorption and attenuation are frequency dependent.
At the decoder, the carrier power to noise power ratio is
C kTB )DT2 DR
2 2
411d )(
Rearranging Equation 3.10 yields
PT7TR N
kT (Eb/NO))
Defining a constant:
2
P ( P R
4)A Lothe ) ( ) kT (Eb/N,)
We can write the above cost function as
afi
k doRd 2 2
$down=k3 ';2-)DR
a#+ kDRY +7 3X 2
R 2d +k5DR+k 7
DR )D 7
We can find the optimal DR to minimize the cost function.
d ($gw=0
dDR
d ($down
dDR
RfidR2da
DR a,6+1
25
C PN - RN Us B
L _
Lthr f )
EbR
NOB(3.10)
DT2Rd2
(3.11)
(3.12)
(3.13)
+ ksyDRhl =0
DR2 )2
4A Lohrf
3,X 2

a/i afi r\+afi
DR aJk3 X 2 R 2 daik5 y
Substituting this expression into the original cost equation 3.13 and obtain
afi r+a r a6 r+a, r
afk X 2 akX 2 afi a +afl
$down= k3X 2 3 +k5 L k3 R 2 d"' +k7 (3.15),k5y k5Y
Finally, the cost of the downlink, with optimized ground station antenna size, is
rS a/I 'y+a/I
$down = k8 R2dafJ + k7 (3.16)
If link distance is kept constant, we can express Equation 3.16 by:
$dow = M3R " + M4, Where 0.5R+ 2(+a) 1 (3.17)
m3 and m4 are constants for a given technology.
3.3 Terrestrial Link Cost
For a satellite system manufacturer, aside from the cost of constructing gateway
interconnection to the terrestrial network, no other cost is generated for the ground links.
However, for a satellite network operator, in order to ensure connectivity, terrestrial
networks belonging to other operators must be used. Usually the satellite network
operator is charged a fee for leasing some fiber capacity or is charged based on the
volume of traffic traversing the terrestrial links. In the design of a satellite network then,
it is not sufficient to only account for the capital cost of building a system, but also costs
that are generated after the system is in service. In our study, we assume that a cost is
26

incurred for routing on each terrestrial link based on the amount of satellite traffic
traversing that link. The terrestrial link cost is
$,fiber = y (3.18)
where 4 is the per-unit flow cost on a link of fixed distance, and y is the amount of flow
on a link. From a first order analysis, we assume that 4 varies linearly with the distance
of a link. The longer the distance of the link, the higher the per-unit cost.
3.4 Summary
In this chapter, we have developed parametric link cost functions for ISL, gateway links,
and terrestrial links. The ISL and gateway link cost functions are expressed in terms of
link capacity for fixed link distance and power. We assume a per-unit flow cost is
incurred whenever satellite traffic is routed on each terrestrial link. These parametric cost
functions will be used for capacity dimensioning and optimal topology selection in the
subsequent chapters.
27

F-
Chapter 4
Two-Stage Stochastic Programming
We are interested in the solution to the problem: given parametric cost models for the
various building blocks of a satellite network, what are the optimal topology, link
capacity, and the associated routing strategy? In this chapter, we formulate the satellite
link dimensioning and routing problem (subsequently termed optimization problem)
using two-stage stochastic programming. This is an important variant to the basic link
capacity dimensioning problem that faces terrestrial network designers. Unlike terrestrial
networks where the planning horizon is fairly short and terrestrial facilities may be
incrementally upgraded and changed to reflect changes in traffic demand pattern and
emergence of new technologies, satellite network designers are faced with the unique
challenge of a long-term planning horizon on the order of 5 to 10 years, during which, the
physical components on the satellites are unalterable. Moreover, because of the high
investment cost and the relatively short duration of system life time, the satellite system
must be designed to be as cost-effective as possible in order to generate the desired profit.
The basic intuition that forms the basis of the mathematical formulation for the
optimization problem is as follows: Given a particular physical network topology and
input traffic matrix, traffic must be routed on the various links from source to destination
according to a routing algorithm. The total traffic carried by each link must be less than
the link capacity. As shown in Chapter 3, the cost of each link can be expressed as a
function of link capacity. Hence, in the network design stage, link capacities should be
28

optimally dimensioned to carry the input traffic at the lowest system cost. The optimal
routing strategy is one which allows the input traffic to be carried by the network such
that the links are optimally dimensioned.
One of the inputs to the optimization problem is satellite network topology. Some of the
possible topologies are shown in Chapter 2. The formulation developed in this chapter
may be used for any satellite topology. In Chapter 5 and 6, we analyze and compare
several representative topologies in detail.
The second input to the optimization problem is the input traffic matrix. Conventional
optimization techniques (non-linear programming) rely heavily on the accuracy of the
traffic matrix prediction for link dimensioning and give results that could be far from
optimal when the actual input parameters differ slightly from the predicted. A more
useful solution should explicitly express the tradeoffs between link capacities and system
cost under uncertain traffic demands. The optimization problem with uncertain traffic
demand may be addressed using two-stage stochastic programming.
A two-stage stochastic programming formulation naturally incorporates into the
optimization link capacity dimensioning, routing, and uncertainty in input traffic demand.
In the first stage, the formulation aims to find optimal link capacities in order to minimize
an effective system cost. The effective system cost is defined to be the sum of satellite
network investment cost, cost of routing using terrestrial links, and an opportunity cost
for rejecting excess input traffic, subject to quality of service (QoS) constraints. The cost
for rejecting excess input traffic may be viewed as a loss in revenue. In the second stage,
link capacities are assumed to be given and the formulation aims to maximize the
utilization of satellite links through optimal routing given a realization of the input traffic
demand.
Mathematically, a satellite network can be represented as a graph G (V, E), where V is
the set of vertices representing satellites and ground stations and E is the set of directed
edges representing the communication links between vertices. In the satellite network we
29

consider, there are two types of vertices (satellite and ground station) and three types of
edges (ISL, gateway links, and terrestrial links).
The first-stage link dimensioning problem is formulated as follows:
J(N)= c(N)+ E[G(N, )+D(N, P)] (4.1)
n= NJ(N) (4.2)N
where
J (N): Effective system cost function.
3: Optimal effective system cost.
NISL: Capacity of an ISL (design variable).
Nup/dn : Capacity of a gateway link (design variable).
N = NIs] : Link capacity vector.[NUPIdf
c (N): Total investment cost function of satellite ISL and gateway links.
P: Traffic demand matrix for OD pairs. Each element in the matrix is a random variable
with known probability density.
E[G (N, i)]: Expected cost of routing traffic on the terrestrial links.
E[D(N, F)]: Expected cost of rejecting traffic.
The major difficulty in solving this problem lies in the evaluation of the expectation
function. Here, the argument inside the expectation function is the effective routing cost
incurred after the network is built. This is considered to be the second stage problem. As
mentioned before, all link capacities are assumed to be known for this stage. For a
specific realization of the input demand matrix, the goal is to optimally route the input
demand to minimize the amount of traffic on the terrestrial links (since routing on
terrestrial links incurs incremental costs while routing on other links generate no
additional cost) and the amount of demand rejected while satisfying some QoS
requirement, typically in the form of delay for data traffic.
30

Denote
W = Set of all OD pairs.
P, = Set of all directed paths for each OD pair w.
The second stage problem is formulated as follows:
G(N,r)+D(N,r)=min x, + Kgo Sa (4.3)
station pairs (ij) containing (ij)
s.t.
Z X, , (maximum flow constraint) (4.4)all paths pcontaining link (m,n)
x + Sw = r5, (conservation of flow constraint) (4.5)
F('n*n) + T < T , (delay constraint) (4.6)al links (m,n) IkNmn) -EFon a path
x, 0, Vpe P,VwE W , (non-negative flow) (4.7)
sW 0, Vw e W , (non-negative rejected flow) (4.8)
In words, the second stage formulation finds an optimal routing strategy for a specific
realization of the input demand r in order to minimize the effective routing cost. For
each OD pair we W , the total input traffic rate is r,. This traffic may either be routed or
rejected. If the input traffic is routed, there are many paths this traffic can traverse. The
total flow on a particular path pe P is x,. The total amount of rejected traffic for an
OD pair w is s,. A per unit cost of ; is incurred when routing on the terrestrial links.
We assume fully connectedness between all gateways. Thus, flow between two gateways
(i, i) is Fjjj = x,. Similarly, a per unit cost of K is incurred when traffic isall paths pcontaining (ij)
rejected.
31
A

Equation 4.4 constrains the maximum flow on links. The sum of routed and rejected
traffic for each OD pair must equal to the input traffic demand as shown in Equation 4.5.
Let the total flow on a link (m,n) be F = x, . Using the MIMI] delayall paths pcontaining link (m,n)
formula, Equation 4.6 imposes a QoS constraint in terms of delay, where T is the link
propagation delay and T. is the maximum path delay tolerable.
The second stage problem may be solved using well known multi-commodity flow
algorithms [15]. This problem needs to be solved for all possible realizations of the input
demand matrix to find the expected routing cost. Moreover, in order to solve the first
stage problem, the second stage problem needs to be solved for all possible link capacity
values.
In general, it is difficult to solve this problem computationally for large networks without
further simplifications to the problem setup. However, for certain classes of interesting
network topologies and traffic demand matrix, this problem may be solved analytically.
These analytical solutions offer much insight into the topology selection problem, as well
as give optimal link capacity and routing strategies. The analysis for GEO and LEO
networks are given in Chapter 5 and 6 respectively.
32

Chapter 5
GEO Satellite-Terrestrial Network
Traditionally, GEO satellites have been used for TV broadcast, marine communications,
and long distance telephony services. In the 1970s, commercial use of satellites for
mobile communications first began with the launch of the COMSAT/Marisat system.
Recently, GEO satellites such as the Asian Cellular Satellite (ACeS) system and the
proposed Thuraya system found new applications in serving regional mobile telephony
markets. It has been recognized that GEO satellites will play an important role for future
broad-band data oriented applications. Due to its inherent star architecture and long
propagation delay, a GEO system is most suitable for broadcast, multicast, delay-
insensitive, and non-real time data applications. It also has the distinct advantage of
requiring only a few satellites for large coverage areas, making the cost of
communication essentially independent of distance. Another significant advantage of
GEO satellites is that services can begin with only one satellite in orbit; therefore it is not
necessary to launch the entire constellation of satellites to begin generating revenue for
the satellite business.
With hybrid satellite-terrestrial networks, there is increased flexibility for a satellite
system to efficiently utilize terrestrial network links to alleviate congestion and to achieve
high utilization of the satellite links. In current literature, much work has been done to
study the interoperability of satellite and terrestrial networks in terms of network
protocols. We assume that interoperability will not be an issue in the future and the
33

interface between the satellite system and terrestrial networks will essentially be
transparent. Hence we can focus on the satellite link dimensioning and routing aspect of
network design and treat the satellite and terrestrial networks as one entity. By using the
terrestrial network, the satellite links may not have to be designed to carry the worst-case
traffic, resulting in significant satellite system cost reductions. However, as mentioned in
Chapter 3, the terrestrial network typically charges a fee for using the fiber links to carry
satellite traffic. During the satellite network design process, one needs to balance the cost
of providing capacity on the various links with the costs that may incur during the
operation of the satellite system.
The stochastic programming formulation outlined in Chapter 4 can be applied to
designing a GEO satellite system interconnected with the terrestrial fiber network. Given
a prediction of the future aggregate traffic demand statistic, the stochastic programming
formulation gives optimal link dimensions and an optimal routing strategy for each
satellite topology under consideration. The most cost-effective satellite topology can
then be chosen for implementation.
In general, three different types of user terminals can be used to access the satellite
network: 1. terminals that have direct access to the satellite network but no access to the
ground network (Satellite Terminals), 2. terminals that can access the satellite network
only via terrestrial networks interconnected with gateways (Ground Terminals), and 3.
terminals that can access both the satellite network and the terrestrial network directly
(Dual Terminals). Satellite Terminals are especially useful in remote regions where no
ground infrastructures exist. These terminals can range from mobile handheld devices to
fixed units. Ground Terminals can be mobile devices with access to the terrestrial
wireless infrastructure or fixed units with access to the ground network. Dual Terminals
have the maximum flexibility in terms of access but are more complex to build.
For these terminals, we consider three different traffic classes: Satellite Terminal to
Satellite Terminal traffic (ST-ST), Satellite Terminal to Ground Terminal traffic (ST-GT),
and Ground Terminal to Satellite Terminal (GT-ST) traffic. A Dual Terminal may be
34

I
considered as a combination of Satellite Terminal and Ground Terminal. Traffic
generated by and destined for a Dual Terminal can then be categorized into the above
three classes of traffic.
We will use the formulation in Chapter 4 to analyze optimal topology selection, optimal
link capacity dimensioning and routing for GEO satellite networks. In Section 5.1 and
5.2, we derive analytical solutions for a single class of traffic under uncertain input traffic.
In Section 5.3, we analyze a general GEO satellite network using worst-case, uniform,
all-to-all traffic for multiple classes of traffic. Finally, in Section 5.4, we derive the
optimal number of satellites for a general satellite network.
5.1 Topology Selection for Satellite Terminal to Satellite
Terminal (ST-ST) Traffic
We study the topology selection problem for ST-ST traffic between terminals under the
coverage of two different satellites. The results we obtain here are independent of the
actual traffic distribution in the network and allow easy comparison between different
topologies. For ST-ST traffic, there are three different ways the traffic can be routed: 1.
Route all traffic on ISLs, 2. Route all traffic on the terrestrial links via gateway links, or 3.
Route some traffic on ISLs and some on the terrestrial links. Clearly, these routing
strategies influence optimal link dimensions on the various links. In this section, we
analyze the routing and capacity dimensioning problem for two satellites incorporating
uncertain input demand. In particular, we solve the effective system cost minimization
problem for special input density functions. The solutions obtained in this section apply
to the case where the satellite network is intended to serve only ST-ST traffic.
35

5.1.1 ST-ST Traffic Carried by ISL Only
For ST-ST traffic, there is no need to use gateways as all traffic can be routed using only
the ISLs. Using this topology, the input traffic is either carried by the ISLs or rejected as
depicted in Figure 5-1. We formulate and solve the optimization problem for this
topology below.
4YCISL
S
Figure 5-1 ISL Only Topology for ST-ST Traffic
Parameters
CJst: Capacity on an ISL link (design variable)
F: Random demand (with known probability density function (pdf), p,)
r: A realization of the random demand
E[D(CISL, F)]: Expected cost for rejecting traffic
mCISL + M 2 : Cost function of a link. We use linear cost function here to make analytical
solutions possible. As shown in Chapter 3, linear cost functions are within the range of
estimated parameter values.
s: Amount of rejected flow
y: Flow on the link
ic: Per-unit cost of rejected flow
TIsL: Propagation delay on the ISL
T.: Maximum delay tolerable
Formulation
S = min~mCs +M2 +ED(iS Jmin CIS L m2 7 [D(CsLF)]}
36

D(CS,, r) = min (Ks)
s.t.
y CISL capacity constraint
y + s = r flow constraint
S+ T SL Tmax delay constraintCISL - Y
y 0S 0
Analytical Solution
Solving the second stage problem, the largest flow that can be carried by the link is:
Y=CISL1
I1+1/(Tmax -TISL) )= ZCISL
(5.1)
(5.2)where r = <11+1/(Tmax -TrSL )
Thus, the amount of overflow on the link given a realization of input traffic demand, r, is:
r -rCISL
0
if r rC1ISL
otherwise
Then the second stage cost is:
D(CSL, r) = (r -rCISL)0
if r ! TCISL
otherwise
Having obtained an expression for the second stage problem as a function of CISL, the
first stage problem may be solved.
S=min m CISL + m2 + f (r -rCISL )CISL
TCISL
P, (r)dr
J (CISL) = mlCISL
dJ (CsL) =
dCISL
+ M2+ f v(r-ZCISL)P (r)drrCISL
m -KTJ p, (r)drrCISL
37
(5.3)

d 2 J(C) _d L = KTp (CISL ) 0dCISL2 F(CS 0
(5.4)
As shown in Equation 5.4, for any input demand pdf, the second derivative of J (CSL) is
always non-negative, hence the effective system cost is a convex function with respect to
CISL for any input pdf. If a local minimum exists, it is also the global minimum. A
(5.5)
minimum exists for this function since the function is convex on the closed interval
0 CISL <
The optimal link dimension can be found by setting Equation 5.3 to zero. In particular,
the following condition must be satisfied:
p, (r)dr = 1rm
fc*t
with strict inequality when C*SL > 0. Hence, this topology is feasible only if ml < K .
Analytical Solutions for Families of Input Demand pdfs
To further study properties of the effective system cost, we examine some families of
input demand pdfs. In particular, we study uniform and shifted Gaussian pdfs.
1. Uniform Distribution
In this case, r is uniformly distributed over [0, r. . This traffic statistic represents high
uncertainty in aggregate traffic statistic prediction.
formulated as:
S=min m! CISL + 2
CIS_ 1 CSL
.J (CISL) = M ICISL + m2- 11C ISL
The effective system cost is
1 r.x- f K (r - CsL) dr}
____ L rI,
rmax + Kr 2C 2
2) 2r.ax
dJ(CISL) _
W(CISL rm -- (rax -CISLdCISL ra
38

The optimal link capacity and optimal effective system cost are:
C*SL = m". mijT K cl
(5.6)
(5.7)2
rmirx +m_ m rmax22
T* ZKT
It is clear from Equations 5.6 and 5.7 that the optimal link capacity depends on the
relative values of mi and K. If the cost of rejecting traffic is high, then the link must be
dimensioned to accommodate the worst-case traffic, r., .
rn- rmiax +M2.T.
r.As Kc -> oo , C,*s - amx , and
If the cost of rejecting traffic is low, a lower dimension on the link
will reduce the effective system cost.
If the link is dimensioned for the worst-case traffic, r.,, under a static dimensioning
method, we obtain J r mrx +M2- This is strictly greater than the effective
system cost shown in Equation 5.7. Hence, stochastic dimensioning results in a lower
effective system cost compared to worst-case dimensioning.
2. Shifted Gaussian-distributed Demand Function
In this case, F has a shifted Gaussian density function with parameters: N (r, ). We
restrict the realization of T within the interval [0, r..]. For distributions that have large
mean and small variance, the tails of the distribution are negligible. This traffic statistic
represents little uncertainty in traffic prediction if the variance is small.
Fr .1 (S=min mlCISL+m 2 +K ,-(r-C) expi
C ,SL L ClSL \
F2 dr
2U2/ IJ (CISL) = mICSL +2 -KTCISLQ C
[Q ISL _Q ( rmax
-(rCISL -r)2
2U2exp 2r2
39
-~
Kca+7 exp
dJ (C SL) ((Z C'SL__r ) _ (r ma- F)dCISL oa
To achieve minimum, Q zCIsL - r - r.x =- . Hence, the optimal link
capacity and the optimal effective system cost are:
CSL = Q-1 I +Q rm -- + (5.8)T K
2 r
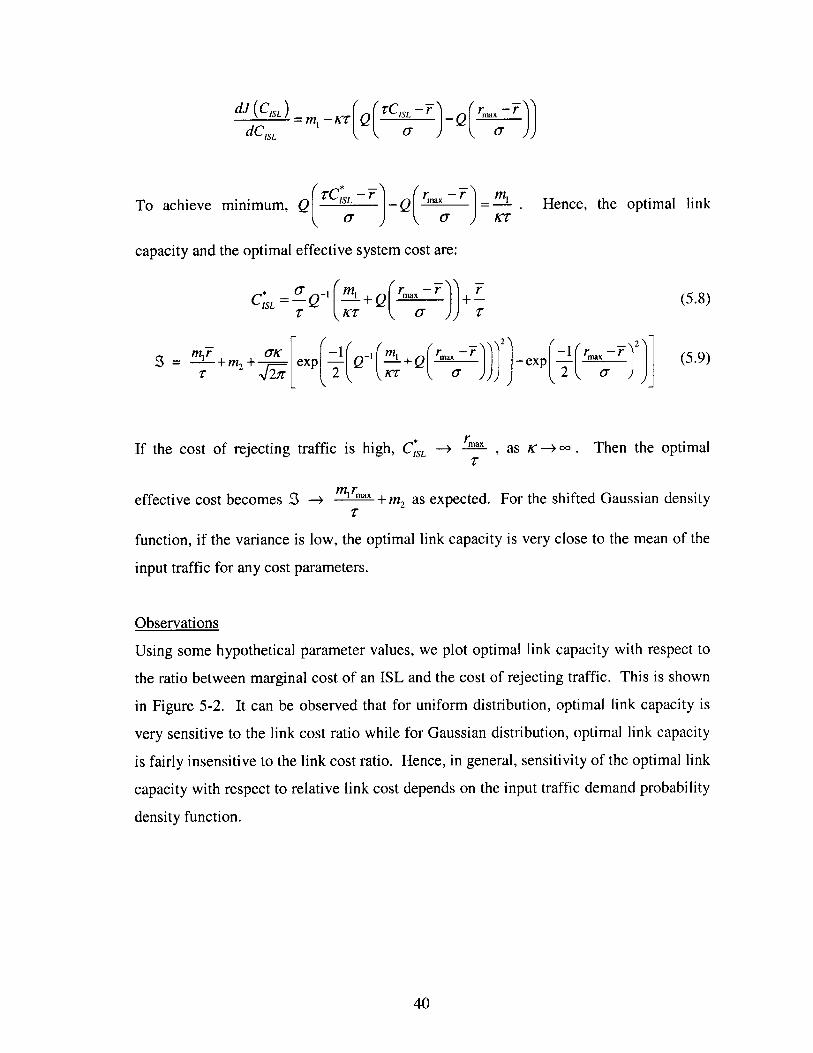
3 _ m f + m 2-e I Q -1 i + + Q rm a - - r a x - 2 ( 5 .9 )Mir +M2 ex )) 2 xp
If the cost of rejecting traffic is high, C,*s max , as K - oo . Then the optimal
effective cost becomes S - mirmax + m2 as expected. For the shifted Gaussian density
function, if the variance is low, the optimal link capacity is very close to the mean of the
input traffic for any cost parameters.
Observations
Using some hypothetical parameter values, we plot optimal link capacity with respect to
the ratio between marginal cost of an ISL and the cost of rejecting traffic. This is shown
in Figure 5-2. It can be observed that for uniform distribution, optimal link capacity is
very sensitive to the link cost ratio while for Gaussian distribution, optimal link capacity
is fairly insensitive to the link cost ratio. Hence, in general, sensitivity of the optimal link
capacity with respect to relative link cost depends on the input traffic demand probability
density function.
40

Capacity and Cost tradeof
180 .-----. ----------------------------....------ ------ ------- - -. - -aussian
--- + Unifqrm140 -. . .. I---- ------ I --- ----- ------ ------ ------ --------------- -----
2
0 02 0k3 04 0.5 0.6 .7 -.- 0.9m1/k cost rttio
Figure 5-2 Optimal Link Capacity vs. Link Cost Ratio
Define an expected link utilization factor, p ,that measures the expect link flow over the
total capacity of the link:
E[Y] 1 rCSL "1Jrp,(rd rC*Sp, (r) drI
CISL CISL TC*SL
(5.10)
Equation 5.11 below shows that P is a strictly decreasing function of C*L as the first
derivative dp is strictly less than zero. This implies that higher link utilization maydCISL
be achieved for lower C,S*L. We will show in Section 5.1.3 that by using a hybrid
topology with integrated satellite and terrestrial network, ISL link utilization is higher
than the ISL only topology.
dPi -- * dp _ _*1 rp, (r)dr <0
dCISL CISL 0
(5.11)
41

5.1.2 ST-ST Traffic Carried by Terrestrial Network Only
For ST-ST traffic, all of the traffic may be routed using the terrestrial network via
satellite relay. In this case, at least one gateway must be visible for each satellite at all
times. We analyze one-hop traffic for the topology depicted in Figure 5-3.
s
Figure 5-3 Ground Only Topology for ST-ST Traffic
Parameters
Cupdn : Capacity on either the up or down link (design variable)
F: Random demand (with known probability density function, p,)
r: A realization of the random demand
D (C,,,d, '): Cost function for not satisfying demand
G (Cup,d, F): Cost function for routing on the terrestrial links
m 3 Cpdf + M4 : Cost function of a link (Assuming linear cost function)
s: Unsatisfied flow demand
y: Flow on the link
K : Per-unit cost of rejected flow
: Per-unit cost of flow on a terrestrial link
TpIdn,, Tgnd : Propagation delay on the links
T.: Maximum delay tolerable
42

Formulation
3 =min{2C(mC,,,, + m,) + E [D(Cu,,dn, F) + G(Cu,1n,L/p/dn
D(Cupdn,r) +G (Cp,,,r) = min (y+ Ks)
s.t.
y CupId,, capacity constraint
y + s = r flow constraint
+22T + T T delay constraintup/n -A gnd max
ykoS >- 0
Analytical Solution
In this problem, there are two scenarios:
1. If ;> K , then traffic should always be rejected and optimal gateway link capacity is
just zero. This case is not very interesting as the satellite system should not be built.
2. If <Ki, then traffic should always be routed if possible. In this case, the maximum
flow is
1Y= CUP ; A, =)2 CupIA (5.12)
1 + 2/( T= - 2T,,dn -Tgd
1where r2 = 1 (5.13)
1 + 2/( Tma -2Tldn - T,,n
Thus, S = r - r2Cp/,s if r > s2Cupd
0 otherwise
The second stage cost is:
D (Cd=, r) + G f ;r if r < r2Cl,
=CUr2CPd- C+ K ( r -r2C otherwise
43

T2Cup / dn
+ m4) + fS = min 2(M CuptinCup / d.
J (C,,d )= 2(m3Cp,,d + m 4 )+
;rp, ( r)dr +rn.x
fr~ ( ;- 2Cup /A +r-Cup1/dn
2lCup / n
04rp, (r) dr +
rJm
( T 2Cup / A
K ( r-V2CPdn)) pF (r) dr
+ K (r- 2 Cp,,dn)) pp (r) drr2C p' A
dJ( CupIdn ) 2dC2
'-up / dn
d 2J (CUPdn)
dCuP 2 K-)2 PF (12Cupldn ) > 0
The optimal link dimension can be found by setting Equation 5.14 to zero. In particular,
the following condition must be satisfied:
"dn
f2 ,.p, (r)dr = 2m3
(IK - <1 12
(5.16)
with strict inequality when CU*, >0 . Hence, this topology is feasible only if
-3 K and < K .z 2 2
Analytical Solutions for Uniform Input Density Function
Here we provide analytical solution to the case where F is uniformly distributed over
[0,r.].
) + rrdr+max 0 max
rmax
f'r.- up/ tin
( 12Cup /,A+ (
dCup , , . m - ( C rax ( rmax - Z2Cpln )
The optimal link capacity and optimal effective system cost are:
C* = rnax I _up/in = m2
(5.17)2m3j
( 2 )
44
p, (r) drT12Cp /dA
(5.14)
(5.15)
S=minCupi tI, L2(m3Cupn +m 4
r 72Cup/n))dr
__a

S=2 M~max M3 + M + rMax5.
T2 12 ( 'C- ;)) _ 2
If the cost of rejecting traffic is high, then the link must be dimensioned to accommodate
worst-case traffic. C;*,Idn > "ax , as K -+ oo.Z 2
S-+ 2 ~m3rx + 31_-4 1 2 a + 4
Then the optimal effective cost becomes
+ r2x2
The expected link utilization on the gateway link is:
E[Y] 1
CP*/df CP*/ d 0rp, (r) dr +
Equation 5.20 shows that P is a strictly decreasing function of C*
d p 1 rC ,sdj"Cup /Id.
dC P = - 2 f
d / din Culdn 0rp,(r)dr<0
5.1.3 Hybrid Satellite-Terrestrial Link Dimensioning for ST-ST Traffic
For a hybrid network, ST-ST traffic can be carried by either ISL or terrestrial links, or
rejected. The topology we analyze is shown in Figure 5-4. The amount of traffic carried
by different links determines the capacity of the links which, in turn, determines the cost
of the network.
45
f r2C*,,, p (r) drr, C , dn
(5.19)
(5.20)
(5.18)

CISL
CupanCupldn-
Figure 5-4 Hybrid Topology for ST-ST Traffic
Parameters
CISL: Capacity on ISL (design variable)
CUP,,d : Capacity on gateway link (design variable)
F: Random demand (with known probability density function, p,)
r: A realization of the random demand
D (CsL, CUP,df, F): Cost function for overflow traffic
G(CsL, Cu,,n, F) : Cost function for routing on the ground link
mlCISL + M2 : Cost function of an ISL link (Assuming linear cost function)
m3Cpdf + m : Cost function of a gateway link (Assuming linear cost function)
y,: Flow on ISL
y2 : Flow on ground path
s: Rejected flow
K : Per-unit cost of rejected flow
{: Per-unit cost of flow on a terrestrial link
T'SL , TpI, Tnd : Propagation delay on the links
T.: Maximum delay tolerable
Formulation
3 = min{mCISL + M2 +2(f3 Cup/dn + m)+E [D( CISL, Cupdn, F+G (CsL, Cupdn
46

U
D(CISLI Cup/dn, r)+G(CSL, upIdn, r)=rmin(;Y2 +CS)
s.t.
Y1 CISL
Y2 UP/dn
Y1 +Y2 +s= r
Y1 +±TISL TmaxCISL - Y1
+2Tld +T <TCUP~dfl - uYd2gd- a
Y1 Y2 0
s0
Analytical Solution
In the second stage problem, there are two scenarios:
1. If ;> K , then traffic should not be routed to the terrestrial links and the optimal
gateway link capacity is just zero. This case is identical to the ISL only case analyzed
in Section 5.1.1.
2. If ;< K , then traffic should always be routed if possible. In this case, ISL links will
always be used first to avoid the routing charge on the ground links. If the ISL links
are full, some traffic will be routed on the ground. Excess input demand will be
rejected if the gateway links are full.
The maximum flow on the ISL link is:
Y1 = CISL T =riSL (5.21)1 +1/( Tm -ISL
The maximum flow on the ground path is:
( 1Y2= Cup I dn T' 2CupIdn (5.22)
1+ 2/(Trnx-2T d - T,,n
Thus,
s r -rCISL - T2 Cupdn ifr> CISL + T2CupIdn
0 otherwise
47

D( CISL, CUPdn, r )+G (CL, CUPSdnr ) =
0
S{( r -rCSL)
4r 2Cp / A + K(
if r5rCISL
if SL < <r< TCISL + V2Cupldn
r -rCISL - 2 Cup/d ) otherwise
This gives the first stage function:
J (C) = mICISL + m2 + 2 ( 3 uCpdn + Mn4 ) +
rmax
+ f 2 +upi(r- CISL -v 2CTCISL + f2 up / dn
CISL +r2 Cp I dn
TCSL
u4pldn))PF (r)dr
aJ (C) r rc up I dn
aCISL rCis
aJ(C)
aupi dn
a2J(C)
aCISL2
a32 J(C)
u/dn
P (r) dr+K
TCISL +T2CuP/dn
Imax
T CJsL +T, C-/A
P (r)dr]
P,(r)dr
-2 ( (r (K + )(-CISL 2CupIdn)+
2, ISL) 0
=V22 (K-") P,(CISL +V2Cupldn ) 0
In order for C,,,f > 0 and C*S > 0, from Equation 5.24,
rma
0 < f
TCSL 2P pIdn
P, (r)dr = 2m3 <1
From Equations 5.23 and 5.24,
P, (r)dr = - 12m 3K _ 2m 3
(K-2 ' -
Hence, for positive link capacities, the following conditions must be satisfied:
, << -,and <KT2 2
If these conditions are not satisfied, then this topology should not be used.
48
(5.23)
(5.24)
(5.25)
(5.26)
(5.27)
0 < ,
rC;SL
2Km3 <mL< 2m3 +
(K - )-2 i V2
(5.28)
Sr-rIL) F ()

Analytical Solutions for Uniform Input Density Function
We provide analytical solution to the case where r is uniformly distributed over [0, r.-].
m CISL + M 2 +2(
ma C=min
rmax rCsL +r, C-, / d
rCISL+r2Cupd
m 3Cupldn +M 4 ) + f (r-CISLrmax rC
(;2CUPpfl + K ( r - TCISL - r 2 upldn)) dr
)dr
aJ (C) m-K+ +2 CISL ( )2 Cupldn
aCISL rmax rmax
aJ (C) = 2m-(K-;)z-(K -) 2 1CISL (K - 122Cupld
aCUdIf r.x rmax
The optimal link capacity and optimal effective system cost are:
+ijj
I+2m 3 m,
,2 ( rKm3 +m 2 +2m 4
12 (K- ;),_
If the cost of rejecting traffic is high, then the link must be dimensioned to accommodate
worst case traffic. It is interesting that for this distribution, the ISL link capacity is
independent of K. C*SL = frn _
IS2
nilCupldn
2mjas
Then the optimal effective cost becomes:
2m3 +M2+2m4
T2
The combined capacities on ISL and gateway link can support worst case traffic
C*SL + Cupdn =rmaxunJhi
49
C*SL = 2x
C. r mu1p /dn 2 Ma
(2 T
(5.29)
(5.30)
(5.31)
T) 2
21cn3
T2 (I ))
rr= rax^ m
(r (2,r

The expected link utilizations on the links are:
E[Y]ISL =-*
CISLC* f
ISL 0
E[Y2 1C , CA PIAn =pld
d SL __ 1 CL
dC*sL cL 21'-SL ISL 0
rp,(r)dr+ fi-C'sL CSL +r-2'C., dn
*SL
rpr(r)dr <0
T 2 CISL SL
CUp / ,+ 2CupIdn /2
TrC*s+T' ClJPdnICSL -Cu
rC*SL
rp, (r) dr
PF (CISL))
PSL is a decreasing function of C*S Compared with the ISL only topology, C*S for the
hybrid case is smaller. Hence the expected ISL link utilization for the hybrid topology is
higher.
5.1.4 Topology Comparison for ST-ST Traffic
The optimal effective system costs for the three topologies with uniform input demand
density are summarized in Table 5-1. Note that the amount of traffic carried by the three
topologies under optimal link capacities is not the same.
50
rp, (r) dr+f (r2C p (r)dr
ISLr -Cup
apup/dn
upi dn
apupl dn
ac*;SLPF (r*SL + + 2Cupldn )-
I-C*SL, (r) dr
'r-ISL
Cup /dn

- I
Table 5-2 Optimal Capacity and Effective System Cost for Uniform Distributed ST-STTraffic
Topology Optimal Link Capacity and Effective System Cost
ISL Only C* - r; SLISLKT)
2S=lrmax mirmax
2 2Kv2
Ground = rma 2 3C.,g = ma1-___
Only pdn T2 (- 2
- Mm3 + r2r2 T2 (K-1J 2
m3 (K-()-< ,and <K.
T2 2
Hybrid C" r __ + n
* =r m 2Km3Cu*pdn = tn 2(C
S= r.m x nji' +2M3 m1 Km 3 + m 2 + 2m 4" T 2 2;r) ;z-2 r z-2 (ic-5
2Km 3 _n< 2m3 + <K, 0 M3 < -; , and < K(c -)r2 1-2 T2 2
Depending on the actual values of cost function parameters and link delay values, one
may compare the three effective costs and select the one with the lowest cost for
implementation. Since the optimal link cost and effective system cost depend heavily on
the input traffic statistic, one must take some care in estimating the long term aggregate
traffic statistic.
51

We may gain some perspective on the topology selection problem by examining the
feasible region for each topology which is independent of the input traffic statistic. The
feasible regions for the three topologies are shown in Figure 5-5. These feasible regions
are defined by marginal link costs. Note that in some regions, only one topology is
feasible. There also exists a region such that a satellite system should not be built.
Within the overlapping regions, an optimal topology should be selected based on the
effective system costs.
No satellitem3ISL only sse
system
....... ..
I .............
2
0 Hybrid Ground only
Figure 5-5 Feasible Regions for Different Topologies Using ST-ST Traffic
It can be observed from Figure 5-6 that there exist more possible marginal cost pairs
(in,in 3 ) that make the ISL only topology feasible. There are relatively fewer marginal
cost pairs (in, m3 ) that make the hybrid topology feasible. Furthermore, within the
region where a hybrid topology is feasible, there may exist cost parameters that make the
ISL only or the ground only topology more cost-effective.
This result is quite intuitive. For ST-ST traffic, traffic traverse fewer links if only ISLs
are used for routing. Hence, one would expect the ISL only topology to have cost
advantages over the other topologies. However, if the ISLs are very expensive, a ground
only topology may be more cost-effective. If the marginal cost of a gateway link is
approximately (K - {)/(2r) times that of an ISL, then a hybrid topology may be more
cost-effective.
52
... .... ........

5.2 Topology Selection for Satellite Terminal to Ground
Terminal (ST-GT) and GT-ST Traffic
For ST-GT and GT-ST traffic between two satellite coverage areas, traffic must be routed
on at least one gateway link to access the Ground Terminal. In this section, we analyze
the routing and capacity dimensioning problem incorporating uncertain input demand.
We assume that there is equal amount of ST-GT and GT-ST traffic to be routed. The
detailed derivations are shown in Appendix A. Here we present the main results of that
analysis.
5.2.1 ST-GT and GT-ST Traffic Carried by ISL Only
If only ISLs are used for routing, the input demand traffic is either carried by the ISL or
rejected. This scenario is depicted in Figure 5-6.
CISL
n Cup/dn
Figure 5-6 ISL Only Topology for ST-GT and GT-ST Traffic
For positive link capacity, the following condition must be satisfied:
<K (5.32)
where 3 1(5.33)1+ 2/(T -TISL ~ lupIdn)
53

5.2.2 ST-GT and GT-ST Traffic Carried by Terrestrial Network Only
If all input demand traffic is routed on the terrestrial network, at least one gateway must
be visible for each satellite at all times. This scenario is depicted in Figure 5-7.
y yCpdCupdn
upldn ~...... ..........................................
Figure 5-7 Ground Only Topology for ST-GT and GT-ST Traffic
For positive link capacity, the following condition must be satisfied:
M 3 <T, {< (5.34)
1where r4 = (5.35)
1 + 1| T. - TU,,dn -Tgn
5.2.3 Hybrid Satellite-Terrestrial Link Dimensioning for ST-GT and GT-ST Traffic
For a hybrid network, traffic can by carried on one of two paths as shown in Figure 5-8.
......................... I...............--.............................................
CJSL
Y2 - cupdn .................................. ................
Figure 5-8 Hybrid Topology for ST-GT and GT-ST Traffic
54

The main results from the stochastic programming formulation are summarized below.
For positive link capacities, the following conditions must be satisfied:
13(5.36)
(5.37)
5.2.4 Topology Comparison for ST-GT and GT-ST Traffic
The feasible regions for the three topologies are shown in the diagram below. Within the
overlapping regions, an optimal topology should be selected based on the effective
system costs.
j
Hybrid
' ISL only
No satellite
-. --------------------------
. ... . - Ground only
1. > iI.1............ - - - -
Figure 5-9 Feasible Regions for Different Topologies Using ST-GT and GT-ST Traffic
The feasible regions in Figure 5-9 are very different from the feasible regions for ST-ST
traffic in Figure 5-5. It can be observed from Figure 5-9 that there exist more possible
marginal cost pairs (ni, m3 ) that make the Ground only topology feasible.
55
0 <-MI<(/C-;), ;<Ic
<-- < M3 +

5.3 GEO Satellite Link Capacity Dimensioning and Routing
In Sections 5.1 and 5.2 we analyzed the topology selection problem for a single class of
traffic and for traffic between one origin and destination satellite pair. We now consider
a general GEO hybrid satellite-terrestrial network with multiple classes of traffic and
multiple origin and destination satellite pairs.
A GEO satellite-terrestrial network can be modeled, to a first order approximation, as two
interconnected rings. The network we analyze has N equally spaced satellites
interconnected in a ring and N gateways, each connected to one satellite. This topology
is shown in Figure 5-10. We choose this model for analysis in order to yield analytical
solutions to give some insights into the network design problem.
F . . .. ........................................................................
C/i Cu dn \ Cudn
CISL
cup/\ Cudn
. ................ ..................................... *.............
Figure 5-10 General GEO Satellite Network
Obtaining analytical solutions for a general GEO network with multiple traffic classes
using stochastic programming is difficult. For each (CISL, CuI,,d) pair, the second stage
problem needs to be solved for all realizations of the random traffic demand r distributed
between 0 and r. . With the solution from the second stage problem, an effective
system cost must be obtained for each (CISL, CUPdf) pair. The optimal effective system
cost can then be found by optimizing over all (CISL, C.,,,d) pairs. This problem may be
solved computationally for large networks. To keep the problem tractable,
56

a
simplifications must be made by limiting the number of possible (CsL, CUP ,d) pairs and
by discretizing input demand distributions. [12] details computational issues for general
stochastic programming problems. Since numerical solutions require known cost
parameters and input traffic statistic, the results obtained can only represent special cases
but will not offer much insight on the design problem. Instead of running simulation on
large combinations of inputs, we analyze a special case where analytical solution may be
obtained.
We assume that the network is dimensioned to carry the worst-case traffic demand. This
represents the case where rejection cost is extremely high and it is never optimal to reject
any traffic. Instead of finding the expected routing cost over all possible realizations of
input traffic, we find the routing cost for the worst-case traffic, r.. Based on these
assumptions, the ISLs will be dimensioned to carry higher capacity than otherwise,
representing worst-case dimensioning for ISLs.
Our main goal in this section is to establish optimal off-line routing rules for multiple
traffic classes. With off-line routing, the input traffic is assumed to be known and
optimal routing can be achieved through a centralized routing decision. This is done for
satellite capacity dimensioning during the network design stage. Off-line routing is
contrasted with on-line routing where routing decisions are typically distributed among
network nodes and future traffic demands are unknown. As the name suggests, on-line
routing is performed after the system is put into service. On-line routing decisions
depend on network link capacities and the current state of the network. Since optimal
off-line routing rules result in optimal link capacities, on-line routing decisions are
directly influenced by optimal off-line routing rules.
Throughout our analysis, we assume that each class of traffic contributes to a fraction of
the total input traffic demand. Define three fractions RsT-sT, RST-GT and RGT-ST to
represent the fraction of total traffic for each traffic type such
that RST-sT +RST -GT+ RGT-ST =1. For ease of analysis, we assume that RsT-GT = RGT-ST'
57
I1
Let the total amount of traffic demand in the network be r. . There are r.RsT-sT ,
rmaxRST-GT and rmaxRGT-ST total amount of ST-ST, ST-GT, and GT-ST traffic respectively.
The traffic demand matrix in the network is assumed to be uniform, all-to-all. Under this
rassumption, equal amount of traffic, m , originates from each satellite footprint and
N
requal amount of traffic, wx, flows from one satellite footprint to every satellite footprint
N 2
in the network (including the footprint in which the traffic originates).
Since we assume that all traffic demand must be satisfied for this analysis, given CSL and
rn, C.Pd,, is known. This simplifies computation significantly as the problem is now
reduced to static traffic, worst-case dimensioning. In the following sections, we will
compute effective system costs for all possible values of CSL. The optimal effective
system cost is obtained by optimizing over CISL - We relax the delay constraint to simply
the analysis. This has the effect of assuming all paths can satisfy delay constraints.
1. All Traffic Carried by ISLs
For the worst-case traffic realization, rm, let all traffic be routed using only the ISLs and
gateway links. Since all ISLs must have the same link dimension (identical link
assumption), the optimal routing strategy needs to minimize the load on the worst link.
We will show that minimum hop (min-hop) routing is optimal in Theorem 5.3.1. Min-
hop routing is a strategy that routes traffic along the path that has the least number of
links between the source and destination. If there exist more than one such paths, traffic
is split equally and carried on all min-hop paths.
Theorem 5.3.1 (Optimality of min-hop routing):
For the GEO satellite network shown in Figure 5-10, and under the uniform all-to-all
traffic assumption, if all of the traffic can be accommodated by ISLs, min-hop routing
58
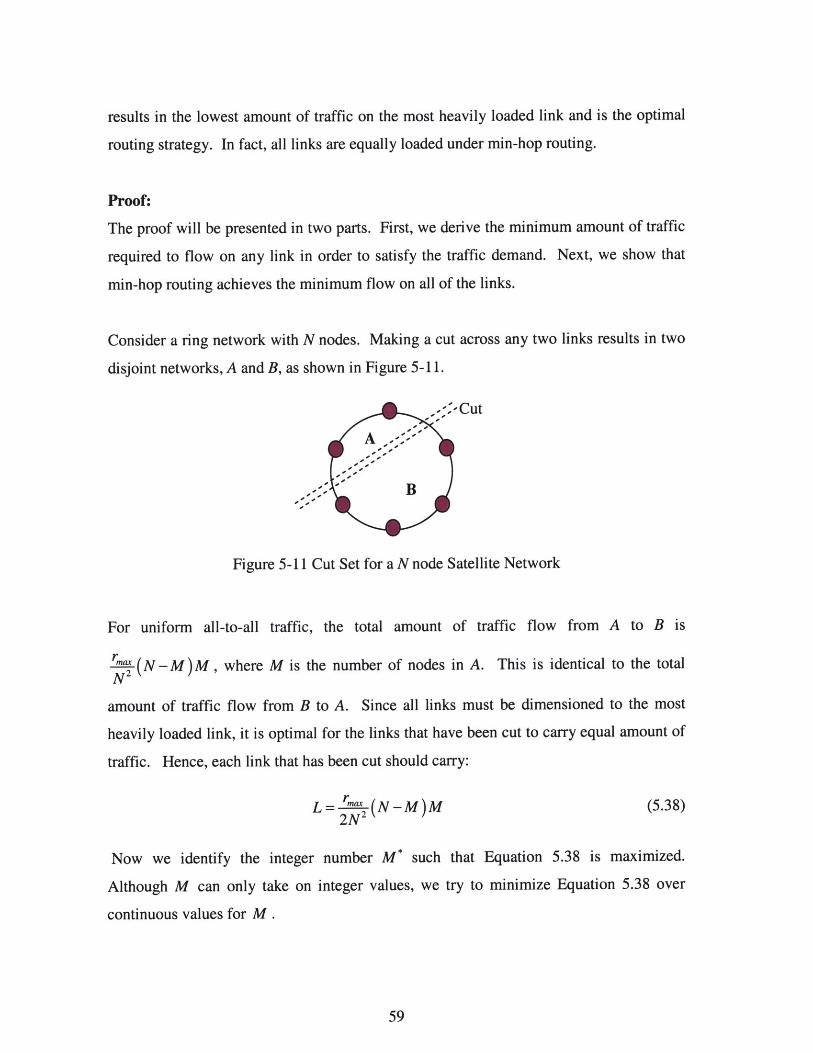
results in the lowest amount of traffic on the most heavily loaded link and is the optimal
routing strategy. In fact, all links are equally loaded under min-hop routing.
Proof:
The proof will be presented in two parts. First, we derive the minimum amount of traffic
required to flow on any link in order to satisfy the traffic demand. Next, we show that
min-hop routing achieves the minimum flow on all of the links.
Consider a ring network with N nodes. Making a cut across any two links results in two
disjoint networks, A and B, as shown in Figure 5-11.
-;Cut
A
B
Figure 5-11 Cut Set for a N node Satellite Network
For uniform all-to-all traffic, the total amount of traffic flow from A to B is
r (N -M)M , where M is the number of nodes in A. This is identical to the totalN2
amount of traffic flow from B to A. Since all links must be dimensioned to the most
heavily loaded link, it is optimal for the links that have been cut to carry equal amount of
traffic. Hence, each link that has been cut should carry:
L= r (N-M)M (5.38)2N 2
Now we identify the integer number M* such that Equation 5.38 is maximized.
Although M can only take on integer values, we try to minimize Equation 5.38 over
continuous values for M .
59
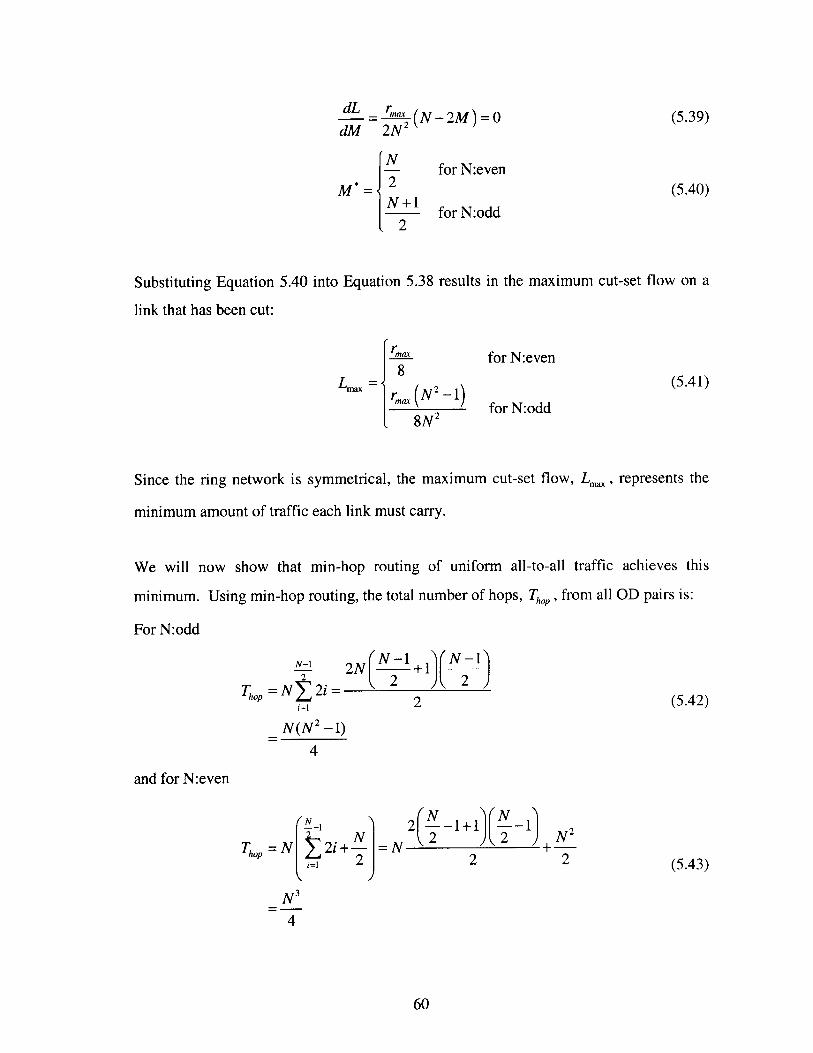
dL
dM_"a (N-2M)=o
2N 2
N
2N+1
L 2
(5.39)
(5.40)for N:even
for N:odd
Substituting Equation 5.40 into Equation 5.38 results in the maximum cut-set flow on a
link that has been cut:
ma4 max~ i8Lma = mr 2 _
8N 2
for N:even
for N:odd
(5.41)
Since the ring network is symmetrical, the maximum cut-set flow, Lmax, represents the
minimum amount of traffic each link must carry.
We will now show that min-hop routing of uniform all-to-all traffic achieves this
minimum. Using min-hop routing, the total number of hops, Th>,,, from all OD pairs is:
For N:odd
N-I2
Tho = N I=i=1
2 N N 1 +1J(N 1)
2
N(N 2 _1)4
and for N:even
(N_
T =N 2i+-hop i1 2
N3
4
2N _ N+ 1=N (2 ) 2 + 2=N
2 2
60
I
(5.42)
(5.43)

The amount of traffic carried on each link can then be calculated as:
rL in-hop = T X x t b f
hpN' total number of links
N3 rax 1 rx
4 2 8N
It can be seen that Ln-hop = Lmax. Hence min-hop routing is the optimal routing strategy.
0
Using Theorem 5.3.1, under min-hop routing, the optimal unidirectional ISL link
capacity is:
rmax (N2 _)
I if N:oddCISL = 8N2
rmax if N:even, 8
(5.45)
The unidirectional gateway link capacity required to accommodate all traffic is:
CupIdn= rmaxRST-GT
N(5.46)
This is obtained by observing that only ST-GT and GT-ST traffic require routing over the
gateway links.
In this case, since all traffic is routed using the ISLs, there is no routing cost.
resulting effective system cost is:
if N:odd
if N:even
The
(5.47)rmax N +2n3rma RST-GT +2N(m2 +M4)
4N
61
for N:even
for N:oddrm(N 1)
8N 2
(5.44)
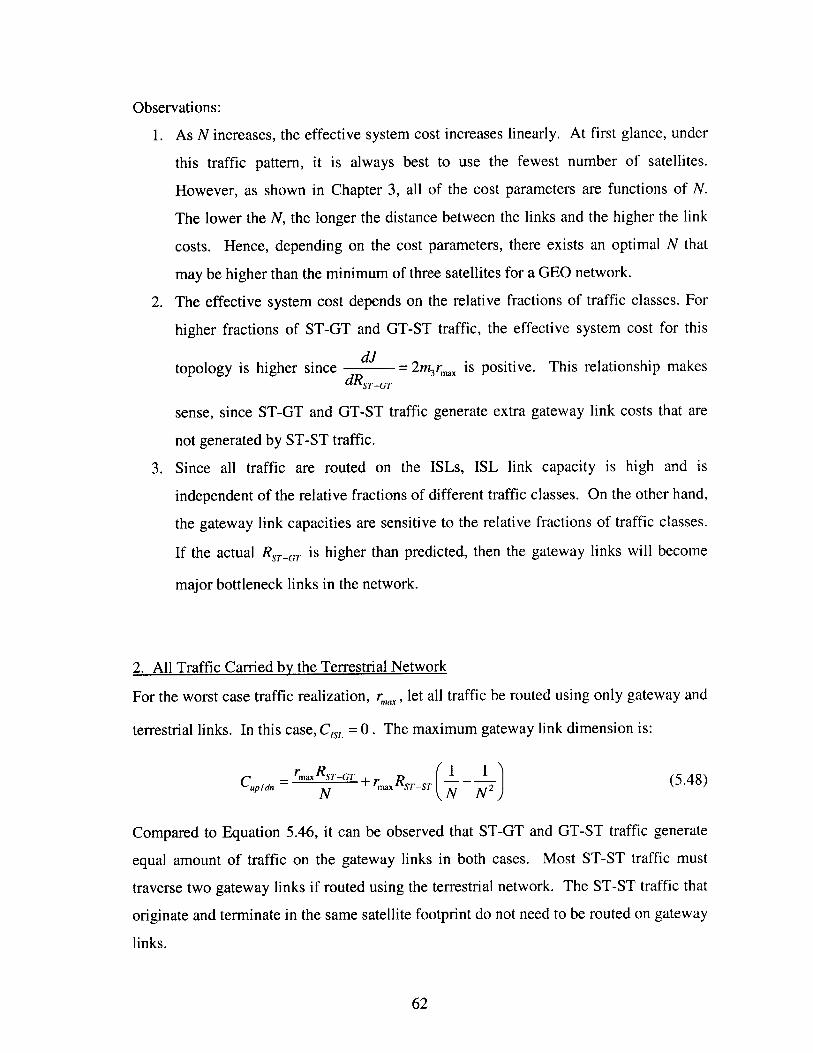
Observations:
1. As N increases, the effective system cost increases linearly. At first glance, under
this traffic pattern, it is always best to use the fewest number of satellites.
However, as shown in Chapter 3, all of the cost parameters are functions of N.
The lower the N, the longer the distance between the links and the higher the link
costs. Hence, depending on the cost parameters, there exists an optimal N that
may be higher than the minimum of three satellites for a GEO network.
2. The effective system cost depends on the relative fractions of traffic classes. For
higher fractions of ST-GT and GT-ST traffic, the effective system cost for this
dJtopology is higher since _: 2m r is positive. This relationship makes
dRST-GT 3 i ep
sense, since ST-GT and GT-ST traffic generate extra gateway link costs that are
not generated by ST-ST traffic.
3. Since all traffic are routed on the ISLs, ISL link capacity is high and is
independent of the relative fractions of different traffic classes. On the other hand,
the gateway link capacities are sensitive to the relative fractions of traffic classes.
If the actual RST-GT is higher than predicted, then the gateway links will become
major bottleneck links in the network.
2. All Traffic Carried by the Terrestrial Network
For the worst case traffic realization, rm, let all traffic be routed using only gateway and
terrestrial links. In this case, CISL = 0. The maximum gateway link dimension is:
CUPdn = max ST-GTmxRsT-sT (5.48)N N N2
Compared to Equation 5.46, it can be observed that ST-GT and GT-ST traffic generate
equal amount of traffic on the gateway links in both cases. Most ST-ST traffic must
traverse two gateway links if routed using the terrestrial network. The ST-ST traffic that
originate and terminate in the same satellite footprint do not need to be routed on gateway
links.
62

Routing cost is generated by using the terrestrial links. The amount of traffic flow on
each terrestrial link interconnecting the gateways is:
r.(N2 _1r 8N 2 if N:odd
maxN if N:even1.8
The effective system cost is:
m ST
G+RST-GT +2NM4 +{ N 1) if N:oddN N . 4 (5.49)r____ 1 1 max2mNr~i~
2Nmgrm RSTGT + +S2NMT+ N if N:even3mx N +TG(N N 24
Observations:
i. The effective system cost depends on the relative fractions of traffic classes. The
higher the fractions of ST-GT and GT-ST traffic, the lower the effective system
cost for this topology. This is intuitive since ST-ST traffic must traverse two
gateway links whereas ST-GT and GT-ST traffic only traverse one gateway link.
Substituting in RST-ST =1- 2 RST-GT, Equation 5.49 can be rewritten as:
((N -1)-(N -2)R r___N2____
2Nm3r ( 1 N 2 sT-GT +2Nm4 + {max (4N if N:odd
2Nmrmax ()(N 2 ) ST-GT + 2N 4 +N[r if N:even
dJ 4
d/ -2m 3r.x N 2 ) (5.50)dRST-GT (N
From Equation 5.50, it can be observed that compared to routing on ISLs only,
the dependence of effective system cost on RST-GT is not as high for small N .
ii. For this routing method, the ISLs are not required. The gateway links must be
dimensioned to have high capacity.
63

3. Hybrid Routing
If CsL < r., then some traffic must be routed on the terrestrial links. We will show that
ST-GT and GT-ST traffic should be routed to the terrestrial links first before ST-ST
traffic. If ST-ST traffic must be routed to the ground, it is optimal to route higher hop
traffic to ground first. First we show that, in a ring network, each ISL carry M-hop traffic
from M different OD pairs.
Lemma 5.3.1 (M-hop Traffic on Each ISL):
In a N-node ring network, under min-hop routing, each ISL carry M-hop traffic from M
different OD pairs, where:
r N-11 M 2
N
s2
N:odd
N:even(5.51)
Two examples are shown in Figure 5-12.
2-hop traffic from twodifferent OD pairs oneach link
3-hop traffic fromthree different ODpairs on each link
Figure 5-12 Illustration of M-hop Traffic on a Link
Proof:
Take an arbitrary node and label it node 0. Label all other nodes as shown in Figure 5-13.
64

01 1
M M
K
Figure 5-13 M-hop Traffic in a Ring Network
NFor N:even, K = - and there is only one node labeled with K as illustrated in Figure 5-
2
13. For N:odd, K = N-1 and there are two nodes labeled with K. Hence 15 M K.2
Consider the link (0,1). For every node labeled 1 to M, one M-hop traffic terminates at
the node. All of these traffic must traverse the link (0,1). Hence on link (0,1), there are
M-hop traffic from M different OD pairs. Since a ring network is symmetrical, any node
can be considered to be node 0. Therefore, each ISL carries M-hop traffic from M
different OD pairs.
0
Now we present the optimal routing scheme for a hybrid network.
Theorem 5.3.2 (Optimal Routing for Hybrid Network):
For the GEO satellite network shown in Figure 5-10, and under the uniform all-to-all
traffic assumption, if the ISL links cannot accommodate all traffic by min-hop routing,
then ST-GT and GT-ST traffic must be routed to the terrestrial links first before ST-ST
traffic to minimize the effective system cost. If ST-ST traffic must be routed to ground,
routing longer hop traffic to the ground first minimizes the effective system cost.
Proof:
Assume CIsL is dimensioned to accommodate all traffic by min-hop routing. The
gateway links must be dimensioned to accommodate all ST-GT and GT-ST traffic, since
65

these traffic must traverse downlink or uplink at least once. Now consider decreasing the
capacity on each ISL by one unit. The excess traffic that cannot be carried by ISLs must
be carried by the terrestrial network. Hence, each terrestrial link flow will increase by
one unit regardless of the class of traffic routed to the ground. If the excess traffic routed
to the ground is ST-GT or GT-ST traffic, the gateway link flows remain the same;
however, if the excess traffic routed to the ground is ST-ST traffic, gateway link flow
must increase. Hence, if ST-ST traffic is routed to the ground, it will incur higher cost on
the gateway links compared to routing ST-GT and GT-ST traffic to the ground.
Therefore, the optimal routing strategy when ISLs are congested is to route ST-GT and
GT-ST traffic to the ground before ST-ST traffic.
Now we show that if ST-ST traffic must be routed to the ground, it is optimal to route
higher hop traffic to ground first. Assume the ISLs can support all ST-ST traffic using
min-hop routing. Decreasing the capacity of each ISL by one unit results in one unit of
flow on each terrestrial link. From Lemma 5.3.1, each ISL carry M-hop traffic from M
different OD pairs. By decreasing each ISL capacity by one unit, the amount of M-hop
1traffic that needs to be routed to the ground is - from each M-hop OD pair. Hence,
M
routing higher hop traffic to the ground first results in less traffic being routed to the
ground per M-hop OD pair. This implies lower cost on the gateway links. Therefore, if
ST-ST traffic must be routed to the ground, it is optimal to route the higher hop traffic to
ground first.
0
From Theorem 5.3.2, if CISL cannot accommodate all of r., but can accommodate all
ST-ST traffic, some GT-ST and ST-GT traffic must be routed to the ground. This occurs
when:
rmax ( N 2 1) rmaxRsT-sT ( N 2 _1)
8N 2 >CISL 8N 2 if N:odd (5.52)r"_" > CISL > rmRST-ST if N:even
8 8
66

In the subsequent analysis, we assume N:odd. On each ISL, we try to route all ST-ST
traffic first. After routing all ST-ST traffic by min-hop routing, each ISL must carry
rmax RSTST (N/2 amount of traffic. The amount of capacity left over on each ISL after8N 2
r.RsT-sT ( N2 _i)routing ST-ST traffic is CIsL - N2 > 0.
8N2Therefore, on each ISL link,
rx (sN-s 2 - amount of ST-GT and GT-ST traffic may be carried, giving a8N 2
total of CIsL amount of traffic on each ISL link (full utilization of ISL links). The un-
rrSN 2 CNLI )routed ST-GT and GT-ST traffic on each link, - N2 .- CJst' ,Must
ground. The gateway links still have
traffic needs to be routed on the
rx(N2 _I)
8N 2 - CISL amount of traffic.
The effective system cost is:
rmRST-GT
N
ground.
be routed on the
traffic since only ST-GT and GT-ST
The ground links will each have
2NmCISL
j 2=. L
2NmCISL
+ 2 m 3 r RST-GT +2N(m 2 +m4 )+2N
+ 2m3 ra RST-GT
K+ 2N (Mm2 + )+2N(
r (N 2 i)
8N 2
rma.- CISLj
CISL
Observations:
1.The effective system cost is a linear function of CISL in this region.
W= 2N(m,-dCISL
67
CISL
if N:odd
if N:even
(5.53)
(5.54)

if mi - >0 , then J is an increasing function of CISL ; otherwise, J is a
decreasing function CISL -
2.In this scenario, CsL is lower compared to using only ISL, while CU,,dn is
unchanged in this region. Because some of the GT-ST and ST-GT traffic must be
carried by terrestrial links, routing costs are generated.
rmaxRSTST (N 2 _I)For CISL < 8N 2 , the ISL links can no longer support any ST-GT and GT-
ST traffic. Furthermore, some ST-ST traffic also has to be routed using ground links. On
rmxRsT-sT ( N 2 _ I)each ISL link, the amount of overflow ST-ST traffic is: 8N 2 - CSs (N2 0 )
The optimal routing strategy is to route the longer hop traffic to ground first to reduce the
amount of flow on the gateway links as shown in Theorem 5.3.2. Next, we will show
that the optimal routing strategy results in a piecewise-linear, convex function of J with
respect to CISL -
Theorem 5.3.3 (Piecewise-Linear Convex Effective System Cost):
For the GEO satellite network shown in Figure 5-10, and under the uniform all-to-all
traffic assumption, if traffic are routed according to the optimal routing strategy shown in
Theorem 5.3.2, the effective system cost is a piecewise linear, convex function with
respect to CsL.
Proof:
Observe that by routing ST-GT and GT-ST traffic to ground first, the effective system
cost, obtained by rearranging Equation 5.52, is:
{r (N2 _1)
2NCISL ( m RST-GT +2N(m 2 +m,)+ 4N if N:odd
N24N (5.55)axIL mRST-GT + 2N (m2 +m4 )+ 4" if N:even
68

rma (N 2 -i) > rm.RST-ST (N 2 _i)
8N 2 ISL 8N 2
nax > CISL rm.RST-ST
6 8
if N:odd
if N:even
According to Theorem 5.3.2, if ST-ST traffic must be routed to the ground, the longer
hop traffic must be routed to the ground before shorter hop traffic. For subsequent
analysis, we analyze for the case of N:odd only.
N -iFor each node in a ring, there are two nodes that are hops away. This is the
2
longest distance between any two nodes on a ring.N-i
Each ISL carries 2 longest2
distance traffic under min-hop routing as shown in Lemma 5.3.1. Consider decreasing
the capacity on each ISL by one unit, each node must drop 2 2 1 amount of traffic.
4Hence, each gateway link must increase capacity by since all of the traffic dropped
N-1
by ISLs must be routed to the ground network. The effective system cost can then be
expressed as:
J = 2NmCISL + 2Nm3 rmxRST-GT N41 rmRST-T(N 2 _1)N N-1 8N'
Nr(N 2 _)+2N(m2 + M4) +2N{ 2 -8N
CISL
CISL
(5.56)
n-3 -CISL + 2 N,rm.RST-GT +N
rm. (N2 _1)+2N (m 2 + M+2N 8 2
This is a linear function with respect to CISL, valid for:
69
4N-I N-1 8N 2
A
This is a linear function of CIsL, valid over the range:
= 2N m( nh_

r Rsrs N 2 -_ r Rr-rN 2 -i) 'nax STST8N 2 N2
N-1 rMaxRST-ST ( N 21)
2 ) IsL< 8N 2
N- -. N -1-2iIn general, for each node in a ring, there are two nodes that are - i= hops
2 2
away, where i is an integer, ie
system cost can be written as:
0, .2 ] When these traffic are dropped, the effective
J=2NmClsL+2N(m 2+m4)+2N K r 2( CIs8N 2 (5.57)
r.RsT- + 2 r.RST-s
N = N2
4 r Rsr-s( N2 -1) _1 r RSTS
N-1-2i 8N N2
Rearranging Equation 5.57, we obtain:
J=2N m _(- 4 S -) CsLN-1-2i
+2Nm 2
+2N(m2 +m4)+2N{ (8N
valid for
N-1-2i r -N2_ 8SR-s N-I-2k) (5.58)
r. Rs- ( N 2 _1) _ r (N -1-2kb
8N 2 k=O N2 2 )CISL rRs-s ( N -1 Z r.R __-s _ N-1-2k
8N 2 k N 2 2
Equation 5.58 is a linear function with respect to CsL, in the form of:
J = aiCsL +bi
where a decreases and bi increases with increase in i.
lower CsL regions.
Increasing in i corresponds to
Hence, as CsL increases from one region to the next, ai increases
and b decreases for discrete regions of CsL. Within each region, the effective system
70
+2Nm3N -1- 2 k -C~j'
2
(5.59)
(5.60)

cost is a linear function. Since bi decreases monotonically from one region to another as
CsL increases, the effective system cost is a piece-wise linear convex function. Hence,
an optimal effective system cost exists over the closed interval of CjsL and the optimal is
unique.
0
To clearly illustrate the results in Theorem 5.3.3, we derive analytical expressions for
optimal link capacities and optimal effective system cost for three and four satellites.
The results are shown in Table 5-2.
Table 5-2 Optimal Effective System Cost for Three and Four GEO Satellite Systems
N Link Capacities Effective System Cost Breakpoints
3 CISL =02 -RST-GT +6 2r One
C _ - 9-s- )r 3 ) ) 4 3 Cs-
9
3 3
C,sL " -()Rs"r = 2 - s n ( s + +
C, = " + 2 ( " -" -C.L
r - CL J =6(n -)CISL + 2tr3 r.,Rsr-GT +6(mn2 + m) +9 9 3
C1 , = r Rsr-or
CUsL = r.J = 2m.1( r..RsT-Gr )+6(M2 + M4 )+ 2m, 39 (
4 C', = + 3r R Two4 = -r RsT+T + 3 M)+ +8(n4))++ r16
CisL :5 r. -s -sr J=(;-s -),L 2n 3 .RsT-GT 3 Rsrs +8( +t4) . 1
8rC'"L " s=--
16 82
r.RST-ST CISL r J=8(n-)CSL+2mrRrT+8(n+m)+r.x8 8
CJ = =ir.+ 2nr.RST-GT +8(n +m4
From these expressions, we can plot effective system cost with respect to ISL link
capacity for different cost parameter values. For N = 3, there are three scenarios:
71

ISL only
:O5m <4'
r.xRST-ST
9
CISL
r99
Hybrid
J
Ground only
4' i<2m 3 +4 2
I II |
ST-ST r._
9 9
!SLr RST-ST
9
m3+ '
CISLr9
Figure 5-14 Optimal Effective System Cost for Three GEO Satellites
Note that depending on the value of fixed cost for ISL, m2, there exists a possible
optimal effective system cost when CsL =0 for all three scenarios. When M2 is high, the
cost value at CIsL =0 decreases, and may fall below the predicted optimal points in
Figures a and b. Thus if M2 is very high, the ground only topology is optimal regardless
of the value of the other cost parameters. Comparing the optimal effective system cost of
the ground only and ISL only topologies for 0 in <4', observe that the ISL only
topology should be chosen if:
2m3 rm (2-RST-GT))J6( n + > 2m3 max RST-GT 2 (4 (
rmax (2MRs-s +4 - m) > m 29
Comparing the optimal effective system cost of the hybrid and ground only topologies for
0 m1 <2m3 +4, observe that the hybrid topology should be chosen if:
2m3 r2 (2-RsT-)GT + ( 4 r 6( - m - 3 m Rs -GT+ 6 ( +)+2 m4 + r3 34 9 3
(2m3 +4 -M ) rmaxRsT-sT >
9
72

If the above conditions are not satisfied, then it is always optimal to use the ground only
topology for a three GEO satellite network. Note that for both conditions the fixed cost
of an ISL has an upper bound that depends on RST-ST -If ST-ST traffic is a small
percentage of the total traffic, it is more likely that a ground only topology is more
economical. In general, if the fixed cost of an ISL is too high, it is never optimal to use
ISLs.
For N= 4, there are four scenarios:
ISL Only
n <{
4/
rxRST-ST
16
I i
rm RST-ST rnm
8 8
Hybrid
n m < m3 +
CISLRSTST
16rx RST-ST
8
CISL
8
Hybrid
m3+{ m! n < 2z3 +{
Ground only
J > 2m3+
CISLrMRsT-ST rax RST-ST rmx rCxRST-ST rmRST-ST. rff
16 8 8 16 8 8
Figure 5-15 Optimal Effective System Cost for Four GEO Satellites
CISL
As with the three satellite case, there exist cost parameters such that one of the three
topologies is more cost effective. For the hybrid topology, there are two different optimal
effective system cost values depending on the relative link marginal costs. Again, if the
fixed cost of an ISL is too high, it is always optimal to use the ground only topology.
73
I I

We plot the feasible regions for a general GEO satellite network in Figure 5-16. Note
that the feasible region for routing on the ground is the entire positive quadrant. If M2 is
high, then routing all of the traffic on the terrestrial network results in the most
economical network. If m2 is sufficiently low, then three regions may be identified for
optimal network topology selection based on marginal link costs. If in <4", it is most
economical to route all the traffic using ISLs. Hence, the ISLs should be dimensioned to
support as much traffic as possible. If in > 2m3 + ', it is most economical to route all
the traffic using the terrestrial network. In this case, ISLs should not be used. Otherwise,
a hybrid satellite-terrestrial network is the most economical. It can be observed that there
exist more cost pairs (ni, m3 ) that make the hybrid topology optimal.
For the hybrid topology, the optimal routing strategy uses both ISLs and the terrestrial
network. In particular, when ISL links are congested, it is most favorable to route ST-GT
and GT-ST traffic to the terrestrial links before ST-ST traffic. This routing strategy
ensures high utilization of the satellite segment and low satellite system cost.
mn3Route on Hybrid m _
ISL only' Routing "3 2 2
- Route onGround only
Figure 5-16 Feasible Regions for GEO Satellite Topologies
74
i

5.4 Constellation Size Optimization
For each satellite topology, we would like to find the optimal number of satellites that
minimizes the effective system cost. From the link cost models developed in Chapter 3,
is can be observed that link cost models are also functions of link distance. Since we
assume that GEO satellites are positioned equidistant on a ring, increasing the number of
satellites in the constellation decreases individual ISL and terrestrial link distances, which
results in lower link costs. Hence there is a tradeoff between the incremental cost of
adding more satellites and the decrease in cost due to shorter link distance. Ignoring
access links in our analysis, we find that the optimal number of satellites using the ground
only topology is three. For the ISL only and Hybrid topologies, there exist cost
parameters such that a three satellite topology is not optimal. The effective system cost
equations we use here are those obtained in Section 5.3.
From Chapter 3, as the number of satellites increase, the ISL and terrestrial routing cost
decrease due to shorter link distance. ISL link distance is defined to be the line-of-sight
distance between two adjacent satellites as shown in Figure 5-17 for a three satellite
network.
d
h
d d
Figure 5-17 GEO Satellite ISL Link Distance
75
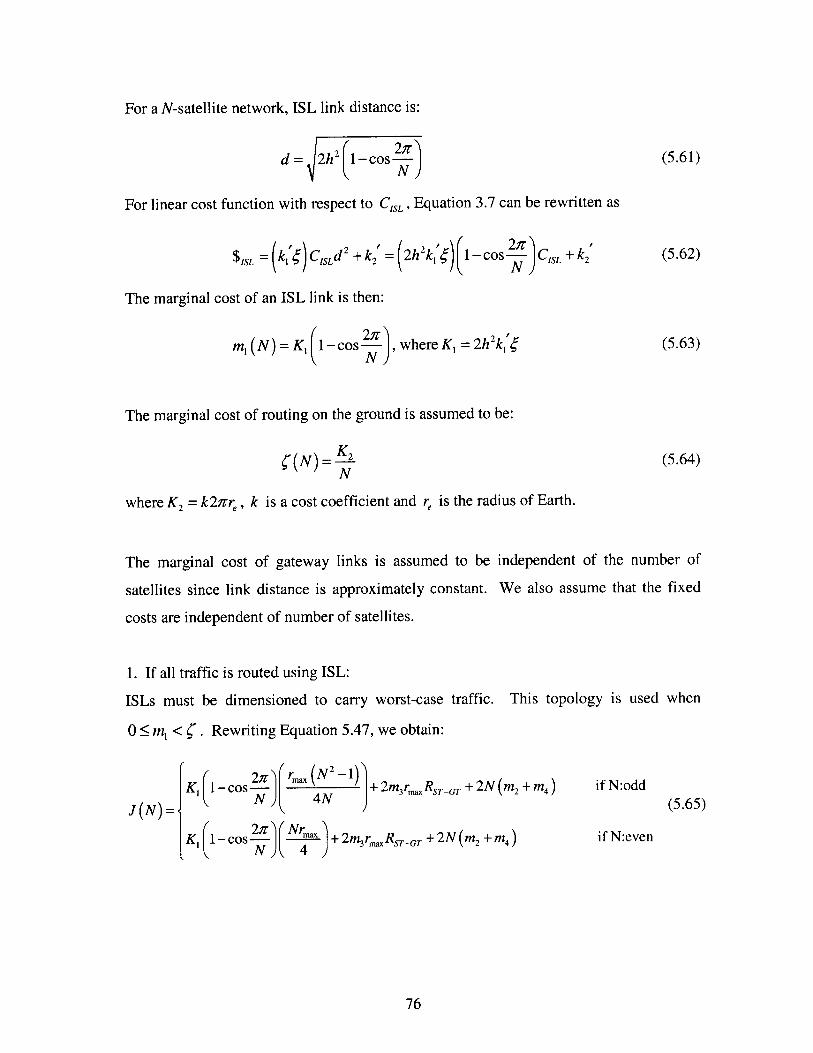
For a N-satellite network, ISL link distance is:
d= 2h2 1-cos-- E
For linear cost function with respect to CISL , Equation 3.7 can be rewritten as
2 I-Cos 2gCISL + k2$ISL = ki) CISLd 2 + k2 =
(5.61)
(5.62)
The marginal cost of an ISL link is then:
1-cos ) , where K, = 2h2ki' (5.63)
The marginal cost of routing on the ground is assumed to be:
(N) = 2(5.64)N
where K2 = k21r,, k is a cost coefficient and r, is the radius of Earth.
The marginal cost of gateway links is assumed to be independent of the number of
satellites since link distance is approximately constant.
costs are independent of number of satellites.
1. If all traffic is routed using ISL:
ISLs must be dimensioned to carry worst-case traffic.
0 in1 < . Rewriting Equation 5.47, we obtain:
We also assume that the fixed
This topology is used when
2 coK, (I- Cos
K, (- cos-2 Nr"
rm ( + 2m3r.RsT-GT +2N(m2 +m 4 )
4N ,
+ 2 m3 rma RST-GT + 2N (m 2 +m4 )
76
if N:odd
if N:even
(5.65)
M, (N) = K,
J (N) =<

Let A(N)= 1-cos---N
for N:odd, and B(N)= 1-cos--- NN N
for N:even.
These are both decreasing functions of N.
Figure 5-18.
A plot of these two functions is shown in
3 4 5 6 7 8 9 10 11 12
Figure 5-18 Cost Parameters vs. Number of Satellites
To find the number of satellites that minimizes the effective system cost, we approximate
the effective system cost function by a continuous function:
dJ (N)dN
"i J(-os - -2(sin-- +2(m2 +m4)4 N N N
we2r 21where 2 ; 1-cos- --
2 N N
if N:even
.n2Nsin-- < 0, VN:even !4
The left hand equality is obtained when N = 4 for even number of satellites.
Although variable cost decreases with increase in N, fixed cost increases linearly with
increase in N. In general, if (N >0, VN 3, then J (N) is a strictly increasingdN
function of N. In this case the optimal number of satellites is 3. This is the minimum
number of GEO satellites needed to provide global coverage (excluding the polar
dJ (N )regions). If - (N) <0, VN 3, then every increment in the number of satellites resultsdN
77
---- ------- -- --- - ---------- ---- - --
I - I - MEMM
M

in a lower cost. This case is not very likely in reality. Another scenario is dN=0,dN
for an optimal N. Hence, if all routing is done using ISLs, there exist some cost
parameters such that a three satellite system is not optimal.
2. If all traffic is routed on the ground:
+ rmaxK 2 (N2 _1)fJ(N 2mrxRST-GT rmaxRsT-sT 1i +2N(m 4 )+ / if N:odd
2m rmaxRST-GT 31max s - ' 1 +2N(m )+ rK if N:even
(5.66)
2m3r(Rs-sC + 2(m4) r K2 >0 VN:oddJ(N) N2 4 N )(.7
dN 2m 3rmaxsR-ST +2 (M4 )>0 VN:evenN 2
In this case, J (N) is a strictly increasing function of N. Hence, the lowest number of
satellites, N = 3, minimizes the effective system cost function.
3. Hybrid Routing
In this case, the effective system cost function contains cost from ISL, gateway and
ground. As in the ISL only case, there exist some cost parameters such that a three
satellite network is not optimal. The optimal number of satellites depends on the actual
cost parameters.
5.5 Summary
In this chapter, we have applied the formulation presented in Chapter 4 on GEO satellite
network design problems. For a single OD pair and single traffic class applications, we
have derived feasible regions of three different satellite topologies: ISL only, Ground
78

only, and Hybrid. These feasible regions are described by marginal link costs. An
optimal topology may be selected based on marginal and fixed link costs.
For a general N-node GEO satellite network with multiple classes of traffic, we assumed
that rejection cost of traffic is extremely high such that all traffic demands must be
satisfied by the satellite network. This reduces the problem to a static, worst-case
dimensioning problem. For this problem, analytical solutions are obtained for three
different routing strategies: ISL only, Ground only and Hybrid. Feasible regions for the
three different routing strategies are shown. We observe that the effective system cost
function is a piece-wise linear, convex function with respect to CISL-
Based on the link cost functions derived in Chapter 3, we attempt to optimize the size of a
GEO satellite network to minimize the effective system cost. For the Ground only
topology, a three satellite network is optimal. For the ISL only and Hybrid topologies,
there exist cost parameters such that a three satellite network is not optimal.
The feasible regions derived in this chapter may be used as a first order decision making
tool for optimal satellite network topology selection. Note that throughout the analysis,
linear cost functions are used. For general cost functions, if the resulting effective system
cost is convex, the problem can be solved computationally; however, if the resulting
effective system is non-convex, the problem becomes extremely difficult to solve as there
may exist many minima in the cost function. Another issue with the analytical solutions
is that they are specific to the topologies we analyzed. If the satellite network topology
does not exhibit symmetry or if the traffic pattern is not uniform, then the problem must
be solved by computation.
79

Chapter 6
LEO and MEO Satellite-TerrestrialNetworks
LEO and MEO satellite systems have gained much attention over the past ten years.
Both Iridium and Globalstar systems use low earth orbits for their satellite constellations.
A proposed ICO satellite system for data communications is to be placed in medium earth
orbit. In general, altitudes of 500 to 1500km are considered to be low earth orbit while
altitudes of 5000 to 10000km are considered to be medium earth orbit. Compared to a
GEO system at altitude of about 35786km, the propagation delay between an earth
terminal and a satellite is much lower for LEO and MEO systems. Although LEO and
MEO satellite systems may offer advantages in terms of lower propagation delay, lower
satellite bus complexity, and possible diversity gain, there are several disadvantages
associated with LEO and MEO systems:
1. Due to lower altitude, many satellites are required to provide global service.
Furthermore, many ISLs or gateways are needed to provide connectivity between
regions on Earth.
2. Unlike the GEO system where only a single satellite is needed to start generating
revenue, the entire constellation of LEO and MEO satellites must be in orbit prior
to revenue generation. Launching an entire constellation of satellites may take a
long time as many different launches must be scheduled.
80

3. Since satellites move relative to earth, to ensure connectivity for a communication
pair, traffic must be handed over between antenna beams and between satellites.
To add to the complexity, it may not be feasible to maintain ISL connectivity at
all times. Changes in the network topology make routing and traffic monitoring
difficult.
4. Satellite systems in lower orbits experience more degradation effects from the
Earth's atmosphere. This reduces satellite system lifetime and hence the amount
of time the system can be used to generate revenue.
5. It is more difficult to direct satellite resources to regions of high demand using
LEO and MEO satellite systems. The satellites in the constellation are all
identical and cover the Earth approximately uniformly. Hence most of the
satellite resources are under-utilized most of the times.
Due to these disadvantages, it is not apparent that LEO and MEO systems are favorable
architectures for future commercial broad-band data satellite networks. Nevertheless, we
will analyze optimal capacity and routing issues for LEO and MEO systems that have
regular topology.
The polar constellation is a regular graph that is amenable to analysis. This constellation
is used by the Iridium satellite system as depicted in Figure 6-1. In this constellation,
satellites are equally positioned in one plane (intra-plane). Several such planes are
needed to provide complete coverage of the Earth.
Seam
Figure 6-1 Iridium Satellite Constellation
Adapted from: www.geom.umn.edu/-worfolk/ SaVi/constellations.html
81

The intra-plane satellites are each interconnected by ISLs to their two nearest neighbors.
These ISLs may be maintained at all times since the distance between any two intra-plane
satellites is fixed regardless of the relative motion between the satellites and the Earth.
Each satellite can also be interconnected to satellites in the two neighboring planes (inter-
plane). As satellites orbit Earth, inter-plane satellites move closer to each other at the
polar regions and move apart near the equator. For this reason, each satellite must track
its two inter-plane neighbors. At the polar regions, inter-plane ISLs may need to be shut
off due to difficulty in tracking satellites. As shown in Figure 6-1, this constellation also
results in a seam where satellites are moving in counter-rotating planes, making satellite
tracking across the seam a difficult task. We compare the polar constellation shown in
Figure 6-1 with and without the seam.
6.1 Polar Constellation without Seam
We assume that all ISLs can be maintained at all times in this section. This results in a
regular 2-D torus graph for the satellite segment with M rows and N columns. For the
ground segment, the number and location of gateways influence routing of ST-GT and
GT-ST traffic, which in turn influence the cost of the system. In order to derive
analytical solutions for effective system cost and optimal link capacity, we assume that
each satellite has access to one gateway at any time instant. Clearly, if ISLs are used, the
number of gateways can be greatly reduced while maintaining connectivity between users.
However, if ISLs are not used, this assumption is a necessary condition to maintain
connectivity between all users. We provide analysis for routing using only ISLs and
routing using only the ground network for uniform, all-to-all traffic. Hybrid routing is
considerably more difficult to analyze for LEO and MEO constellations and the results
would not offer much more insight than what we have shown in Chapter 5. Hence this
routing scheme is not analyzed here.
82

6.1.1 Routing Using ISLs Only
In [4], the author has computed the capacities required on each link for a LEO satellite
network with uniform all-to-all traffic. Detailed derivations can be found in Appendix B.
We summarize the results in Table 6-1.
Table 6-1 Capacity Required on each ISL Link
CX Cy
M and N are odd integers >= 3 rmx I rNmx 28M N8N 2")
Mand N are even integers >= 2 rma rmax8M 8N
M is odd integer >=3 and N is even integer >= 2 rx rmax 18M 8N M2
M is even integer >=2 and N is odd integer >= 3 r rmax
8M N8N
To satisfy all the input traffic demand, each gateway link must carry
(6.1)CUP/df =r fxRST-GTMN
For the subsequent analysis, we only show the case where M and N are both even integers.
Since all traffic is carried by the ISLs, there is no traffic on the ground.
effective system cost is:
Hence the
J=2MN mI r" + rmaxj 1Y8N 8M )+ 2m2 ) + 2MN (m3 C rxRSTGTmaMN -GT
=M + N(2 r. m + 2RsT-GTmax 3 )+2MN (2m 2 +m4 )4
If M = N, then all ISLs have the same capacity. In this case, the effective system cost
becomes:
J = Nrmi +(2R- )+2N 2 (2m2 + M4) (6.3)2 ST-GTmaxM3
83
+ m4(6.2)
A

6.1.2 Routing Using Terrestrial Network Only
We assume that the gateways are also interconnected in a Torus network. On the
gateway links, each gateway link must carry
r R ____Cupdfl= max ST-GT +r RsT-sT 2 (6.4)
MN
For the subsequent analysis, we only show the case where M and N are both even integers.
The effective system cost is:
J=2MN n rRrmax-T +rnRsTsj 2 +m +2MN rn +rmMN _TMN (MN)2 )8N 8M) (65(6.5)
= 2rm RsT-GT + RsT-rs 1 - I )) + 2ppNm4 +rmax(M+N)MN 4
For M = N,
J3RSTGT + Rss 1- 1 + 2N 2± mx N (6.6)
For a polar constellation without seam and under uniform all-to-all traffic, we can see
that the input traffic can be distributed evenly across network links through min-hop
routing. This will be contrasted with the case where a seam exists in the constellation.
From an architectural standpoint, if ISLs are used, then a hybrid routing scheme is more
sensible since the terrestrial network can be used to alleviate congestion on the satellite
links and allow the ISLs to achieve high utilization. The routing strategy for hybrid
routing is identical to the routing rules we have obtained in Theorem 5.3.2. ST-GT and
GT-ST with longer hops between source and destination should be routed to the ground
first.
84

6.2 Polar Constellation with Seam
Now we analyze a general LEO or MEEO system in polar constellation with seam. We
still assume that each satellite has one gateway in its footprint.
6.2.1 Routing Using ISLs Only
We show the detailed derivation in Appendix B. Here we summarize the main results.
In the y direction, all ISLs have equal capacity:
If M =odd, C = rax I 1 (6.7)I 8N M )
If M = even, C = r. (6.8)8N
In the x direction, the center links are required to carry more capacity. The highest
capacity required on a link is:
If N = odd, Cxmax = ram ' 2 (6.9)4M N
If N = even, C,,ax = (6.10)4M
Since all ISLs must be identical in the x-direction, the links must be dimensioned to the
capacity above. This leads to underutilization of the links on the edge of the constellation.
We may derive the amount of flow on the least loaded link:
Cxm . (I 1 (6.11)M (N N 2
We define a link utilization factor, p,, to be the ratio between the flow on the least
loaded link to the maximum link capacity in the x-direction:
85

r 'M 1 - 12 4If N = oddV - N+1 (6.12)
4M N2
M YNN2)4(N-1)If N = even, - N N 2 (6.13)
rna N4M
px is plotted in Figure 6-2. As the number of satellites increase, the worst-case link
utilization decreases tremendously. This illustrates one of the inefficiencies of the polar
constellation with seam.
Worst Case Link Utilization in LEO/MEO SystemsI - - - i - -
----- -- --
0.313 4 5 6 7 8 9 10 11 12
Number of Satellites
Figure 6-2 Worst Case Link Utilization for LEO/MEO Systems
On the gateway links, each gateway link must carry
C = xRST-GT (6.14)udn MN
For the subsequent analysis, we only show the case where M and N are both even integers.
Since all traffic is carried by the ISLs, there is no traffic on the ground. Hence the
effective system cost is:
Jm, r +2 m2 + 2 MNm rmaxRST-GT +m (6.15)8N 4M ( MN
86

Here we used the assumption that all satellites are identical, even for the ones on the
seam. In order for all ISLs to have the same capacity, we need to choose M = 2N.
For this topology, it can be observed that the links closer to the seam will be
underutilized. In this case, hybrid routing can balance out the loads on the links and
greatly improve the utilization of the inter-satellite links. Hence for a polar constellation
with seam, if ISLs are used, it is best to dimension the links using a hybrid routing
scheme.
6.2.2 Routing Using Terrestrial Network Only
We show the detailed derivation in Appendix B.
In the y direction, all ground links carry equal flow:
If M = odd, f = rax m2 (6.16)8 N M)2
If M= even, f= _ a (6.17)8N
In the x direction, the center links are required to carry more flow. The sum of all the
flows in the x direction is:
r rm N (N --1)"otal = 4 x + 2 li 1- (6.18)" 4 2 ~2 )3Nj
On the gateway links, each gateway link must carry
= r1aR T T-12 (6.19)CU~n MN +raRTS( MN -( MN)
The effective system cost for even M and N is:
J = 2MN r.N RST-GT +r1 1Rss K 2I+m4MN + MN MN ) 4, ,(6.20)
+ (N-2) 2+4 3 N 8
87

6.3 Summary
In this section, we have analyzed two routing schemes using ISLs only and Ground only
for LEO and MEO satellites in polar constellation. It has been shown that for a polar
constellation without seam and for uniform, all-to-all traffic, traffic can be uniformly
loaded on all satellite links through min-hop routing. For a polar constellation with seam,
ISLs closer to the seam will be highly underutilized. Therefore, if ISLs are used, it is best
to dimension the network using a hybrid routing scheme.
For LEO/MEO satellite systems, the analytical solutions provided do not capture the
tradeoffs between different satellite topologies. The position and number of gateways
play a more important role for LEO/MEO systems than for a GEO system. Furthermore,
using ISLs tend to constrain the satellite network topology to a polar constellation.
Without ISLs, the satellite segment has much more freedom in constellation design, at the
expense of more gateways. We have not addressed these issues in this thesis.
88

Chapter 7
Conclusions and Discussions
In this thesis, we studied the problem of identifying the most cost effective satellite
network topology for future broad-band data applications. In particular, we have
presented the following analyses and results:
1. From fundamental relationships among power, antenna aperture, distance of the
link, and link capacity, we have developed simple link cost equations for inter-
satellite links (ISLs) and gateway links as a function of link capacity and distance.
Constructing link cost equations this way allows us to study the tradeoffs between
providing capacity on different links and the resulting effective system cost.
2. We have formulated the satellite network design problem using two-stage
stochastic programming. This formulation can be used to obtain optimal link
capacity and routing strategy, given a satellite network topology, link cost
functions and input traffic demand under uncertainty. Incorporating uncertainty
in input traffic demand prediction in the optimization is critical for satellite
network design as it is nearly impossible to upgrade satellites in response to
changes in traffic. The network obtained by solving the stochastic programming
problem has the lowest effective system cost for a given set of inputs. Instead of
giving a single-point solution to the optimization problem, the stochastic
programming formulation allows design tradeoffs to be easily captured, which
can give network designers some guidelines on the relationships between design
parameters.
89
3. Analytical solutions to the optimization problem have been derived for a few
classes of satellite topologies of interest. For GEO satellite networks
interconnected with the ground network, we have shown that different traffic
classes favor different network topologies. By favor, we mean that there exist
more cost parameters leading to a particular network topology. Satellite Terminal
to Satellite Terminal (ST-ST) traffic tends to favor a topology with only ISLs
whereas Satellite Terminal to Ground Terminal (ST-GT) and Ground Terminal to
Satellite Terminal (GT-ST) traffic tend to favor a topology that uses only the
ground network. A mixture of the three traffic classes tends to favor a hybrid
topology if the fixed costs of the ISL and gateway links do not dominate the link
costs. The optimal topology for different traffic classes can be obtained if link
cost parameters are known.
If ISLs are used, a hybrid routing scheme improves utilization of the ISLs
compared to routing all of the traffic on the ISLs. This is because the ISLs must
be dimensioned to carry worst case traffic for the latter case, whereas ISL
capacity can be much lower for the former case. For LEO and MIEO satellite
networks using a polar constellation with a seam, routing some traffic to the
ground can help to balance the load on the satellite links and reduce the capacity
requirement on those links.
With hybrid routing, we have shown that it is optimal to route ST-GT and GT-ST
traffic with higher number of hops between the source and destination satellite to
the ground first. ST-GT and GT-ST traffic should always be routed to the ground
before ST-ST traffic. This routing strategy minimizes the cost of routing traffic
after the network is deployed.
For a GEO satellite network, we have shown that if ISLs are not used, then a
three-GEO satellite network is optimal. When ISLs are used, there exist link cost
parameters such that a three-GEO satellite network is not optimal.
90

The mathematical formulation we have presented is useful for satellite network design
and the analytical solutions we have obtained offer some insights into the design problem.
In our analysis, we have made some stringent assumptions on the inputs to the
optimization problem in order to obtain analytical solutions shown in Chapter 5 and 6.
We will highlight the implications of our results and present some discussions on
possible areas for improvement and directions for future research.
Link Cost Functions
In Chapter 3, we have shown simple cost models for ISL and gateway links. These cost
functions are continuous functions with respect to capacity on the links. In real systems,
however, link costs may take on discrete values due to physical component constraints.
We would still expect the link cost to increase with increase in link capacity; however,
the exact relationship between link cost and capacity needs a more in-depth study.
An ideal link cost function needs to fully capture the incremental cost in building and
deploying the satellite network to incremental cost in link capacities. This entails a
detailed system level study on the interactions among design parameters of different
subsystems in the network. In reality, perhaps only a few link capacities and their
associated system designs are feasible. This simplifies the optimization problem down to
identifying the optimal link capacities that minimizes the effective system cost from the
small set of feasible link capacities.
For ground links, we made the assumption that a per-flow cost is incurred whenever
satellite traffic must be carried by the ground network. This cost structure may not be
valid if the satellite system operator also operates the ground network, or if fiber is leased.
In any case, since the satellite links costs are sunk once the system is deployed, these
links should be maximally utilized. If routing traffic on the ground links incurs extra
charges, then these links should be avoided, whenever possible. In general, it is more
advantage to route ST-ST traffic on ISLs. When the ISLs are congested, ST-GT and GT-
91

ST traffic should be routed to ground before ST-ST traffic. Although we did not analyze
the case where traffic is between two Ground Terminals, it is clear that if this class of
traffic needs to be supported, then it should be routed to the ground first when ISLs are
congested.
We did not consider the cost of providing different quality of service to different types of
users in our analysis. Hence we assumed that the per-flow cost of rejecting traffic is a
constant. Future satellite networks may need to support real-time and non-real-time
traffic with a wide range of service requirements. The satellite system operator is likely
to charge a different fee for different types of traffic in order to maximize the utilization
of the satellite resources and to maximize the profit. In this case then, rejecting different
types of traffic when the network becomes congested incurs different rejection costs.
All though our derivation in Chapter 5 and 6, we have assumed linear cost functions for
ease of analysis. Although these solutions give us some insight into the design problem,
for general link cost functions, analytical solutions cannot be obtained easily and
computational analysis must be performed.
As a final observation on link costs, we note that power loss in an optical fiber is an
exponential function of distance while power loss in free space is a quadratic function of
distance. This difference between power loss in fiber links and ISL links may mean that
ISLs are more cost effective for long distance communication compared to ground
infrastructure. Detailed analysis on the cost of the various links in a hybrid satellite-
terrestrial network is needed to give more indication on the optimal network topology.
Input Traffic Demand Matrix
We adopted a standard flow model for data traffic in our problem formulation which does
not capture the dynamics of real traffic patterns. Real traffic varies on many time scales.
Over the course of the satellite life time, business cycle will dictate aggregate traffic
92

statistic. On a smaller time-scale, for a network of satellites serving the entire globe,
time-of-day effects will be prominent. Traffic statistic may also change on minute,
second, or even smaller time scale. Detailed traffic modeling taking into consideration
temporal and distance effects can be useful in identifying locations of high traffic demand;
thus providing indication on where the satellite network resources should be concentrated.
Network Topologies
In our analysis, we have considered several specific classes of satellite network
topologies for comparison. For the GEO satellite network, the ring topology is a valid
assumption; however, the number and locations of gateways as well as how gateways are
interconnected with satellites have much more flexibility. In particular, we note that
although the satellite segment cannot be upgraded once the system is launched into orbit,
the ground facilities can be upgraded to reflect changes in traffic pattern. The ground
segment can also be deployed in phases - more gateways may be added when traffic
reach critical thresholds. Some flexibility should be build into the satellites to support
potential gateway upgrades and modifications.
For LEO and MIEO satellite networks, satellites can be positioned in many different
constellations. Some constellations such as the polar constellation make ISL tracking
easier to implement. Due to antenna tracking limitations, some constellations in which
the relative position between satellites changes rapidly may not be feasible for ISL use.
If the ISLs are not used, the set of possible constellations we can use is larger, but the
number of gateways and the location of gateways are very much restricted. These design
tradeoffs have significant impacts on the satellite system cost and require further study.
In our formulation, we did not include user terminal access links. To compare GEO,
LEO, and MEO satellite systems, these links must be included. In order to compare these
systems fairly, detailed cost studies must be performed on the various systems. As
mentioned in Chapter 6, LEO and MEO have many disadvantages over the GEO satellite
93

network. It seems that a GEO satellite network is more suitable for delay-insensitive,
non-real-time data applications. A detailed comparison between the different systems in
terms of overall system cost will be useful.
Conclusion
As terrestrial network infrastructures become more developed and widely spread, it will
be increasingly more challenging for satellite networks to be competitive with the ground
networks. Satellite network providers must find niche applications inherently suitable for
satellite networks and design the satellite network which best meet those demands.
Network optimization is a critical procedure for satellite network design that can help
designers to identify the different tradeoffs in the design process in order to identify the
most cost-effective system for future applications. The stochastic programming
formulation and the results we have shown in this thesis are first steps toward designing
an efficient hybrid satellite-terrestrial network.
94

References
[1] J. V. Evans, "Satellite Systems for Personal Communications," Proceedings of the
IEEE, Vol. 86, No. 7, July 1998.
[2] E. Lutz, M. Werner, & A. Jahn, Satellite Systems for Personal and Broadband
Communications, Springer-Verlag, Berlin, 2000.
[3] Eylem Ekici, Ian Akyildiz, & Michael Bender, "A Distributed Routing Algorithm for
Datagram Traffic in LEO Satellite Networks," IEEE/ACM Transactions on Networking,
Vol. 9, No. 2, April 2001.
[4] Kenneth Kwok, Cost Optimization and Routing for Satellite Network Constellations,
M.S. dissertation, MIT, LIDS, Feb. 2001.
[5] A. Lisser, et al, "Capacity Planning Under Uncertain Demand in TelecommunicationsNetworks," Hautes Etudes Commerciales - Geneve, October 1999.
[6] Joel Schindall, MIT Satellite System and Architecture Class guest lecture notes, 2000.
[7] Martin Lo, "Satellite-Constellation Design," Computing in Science and Engineering,
Volume: 1 Issue: 1, Jan.-Feb. 1999.
[8] Parametric Estimating Handbook, 2 "d ed. International Society of Parametric Analysts.
Spring 1999. http://www.ispa-cost.org/PEIWeb/cover.htm.
[9] Amitava Dutta & Dasaratha Rama. "An Optimization Model of Communications
Satellite Planning," IEEE Transactions on Communications. Vol. 40. No. 9, Sept. 1992.
[10] Frank Kelly, "Loss Networks," The Annals of Applied Probability, Vol. 1, Issue 3,
Aug. 1991.
[11] Dimitri Bertsekas & Robert Gallager, Data Networks, 2"d ed. Prentice Hall, 1992.
[12] Peter Kall, & Stein Wallace, Stochastic Programming, John Wiley & Sons Inc., 1994.
95

[13] Vincent Chan, "Optical Space Communications," IEEE Journal on Selected Topicsin Quantum Electronics, Vol. 6, No. 6, Nov/Dec. 2000.
[14] Morris Katzman, et al. Laser satellite communications, Prentice-Hall Inc., 1987.
[15] R. Ahuja, T. Magnanti, & J. Orlin, Network Flows, Prentice-Hall Inc., 1993.
96

Appendix A
Derivation for ST-GT and GT-ST Traffic
A.1 ST-GT and GT-ST Terminal Traffic Carried by ISL Only
The network analyzed here is depicted in Figure 5-6.
Lemma:
For the topology shown in Figure 5-6 and for equal amount of ST-GT and GT-ST traffic,
the optimal ISL link capacity equal to twice the optimal gateway link capacity, ie.
C*SL = 2CuPdnA
Proof:
Suppose CI*SL > 2CU*, /Id, then the maximum flow on the paths are limited by C,*,,,.
Hence, even if C*sL is large, the excess capacity on the ISL is simply wasted. Since a
lower Cs < C*sL decreases network investment cost while keeping routing cost the same,
we can always get a lower effective system cost by using Cs . This contradicts with the
optimality assumption of CsL. On the other hand, if C*sL < 2Cu,*,d , the ISL link becomes
the bottleneck and a lower effective system cost can be obtained by using Cu',,df <Cpdn,
this also contradicts with the optimality assumption of C,*,,. Thus, to achieve optimal
effect system cost, C*sL = 2C,*pldn
97

Formulation
S =min{mCISL + m 2 + 3 updn 4 +ID(CISL upl)]
D (CSL, CUP,d r)= min (KS)S
S.
2y CISL capacity constraint
2y +s = r
2y + + TISLCISL - 2y Cupldn- y
+ Tpd 5 Tx
flow constraint
delay constraint
s O
Solution
Solving the second stage problem, the largest flow that can be carried by the link is:
Y = CUP,/ r 13 - ,updn
I+ 2/( T=, - TISL Tp ldn
I
-1+ 2(Tax TSL TUP1df)
Thus, the amount of overflow on the link given a realization of input traffic demand, r, is:
if r r3 CISL
otherwise
Then the second stage cost is:
D (C, r) -c ( r - T3CISL)
0
if r T 3 CISL
otherwise
Having obtained an expression for the second stage problem as a function of C, the first
stage problem may be solved.
98
(A.1)
(A.2)
s = r rs
0(A.3)
(A.4)

S=min (mI+m 3 )CISL +m 2 +2m 4 + f K(r-r 3 CISL)p,(r) dr
J(C.S) = (m +M3 ) CISL + M2 + 2m4 + f Kc( r -T 3Cs) p7 (r) drCT3CISL
(CISL) - m+ M 4-icz3 L pP(r)ddr
dCSL riCIsl.
d 2J ( CSL)
dCSL
(A.5)
(A.6)
(A.7)
(A.8)Kr3 2 P (T3CISL) 0
The optimal link dimension can be found by setting Equation A.7 to zero and solving for
CISL . In particular, the following condition must be satisfied: fr3CISL
p,(r)dr =m+m3 1,'C3
with strict inequality when CISL >0. Hence, this topology is feasible only if
m,+ m3 <K
T.3
A.2 ST-GT and GT-ST Terminal Traffic Carried by Ground Only
The network analyzed here is depicted in Figure 5-7.
Formulation:
=min {2(m 3C,,df + M,) + E [D(CP,,ldf, F) + G (Cup dn, F)])
D(CId, r)+G(CUP,d,r) =min (2(y+Ks)
s.t.
99
(A.9)

-4
y C,,d,, capacity constraint
2y + s = r flow constraint
+Tp, +Td 5T delay constraintCUP,d - Y =x
s Oy > 0
In this problem, there are two scenarios.
3. If > K, then traffic should always be rejected and optimal capacity is just zero.
This case is not very interesting as the satellite system should not be built.
4. If < K, then traffic should always be routed if possible. In this case, the maximum
flow is
r 1y = CUP,, =( I 4CpIfA (A.10)
I + /( Tma - T,,dn -Tgnd
1where r,= / (A.11)
I+1|'AT. - T,,dn -Tgd
{ r - 2 rt4Cupdn i f r 2; CUP/dfl
Thus, s = (A.12)0 otherwise
Then the second stage cost is:
D(CpIdn, r)+G (Cdn, r) r (A.13)= 2{r4CuP,,g + (r- 2z4CuP.,,) otherwi se
4CUP/dn
S =C , m rp (r)dr+ J +2Y 4C , + v ( r - 2 4Cup n )) p ( r)druprrii 4(3 u ln M ) fup7 r d f 2dn 4C u
up I dn 2r4CPd
2 r 4 C.P/ , n,,
J (Cp,,d)=2(mC,,df + m4 )+ f (rpj(r)dr+ f (24;4C,,,df+K(r-2-4Cupdn))pF(r)dr0 2 r4CupId,
dCup/dn 2m- 2(K- z4 f pF(r)dr (A.14)dCUPisfr4C
100

d2J (CPdf)
dCupdn2 4(K- T4
2P(2r4C,i,,)> 0 (A.15)
The optimal gateway link dimension can be found by solving Equation A.18.
particular, the following condition must be satisfied: f2r 4 .*/d
strict inequality when C*,ld,> 0. Hence, this topology is feasible only if
Mn3(K-<)4,
A.3 Hybrid Satellite-Terrestrial Link Dimensioning for ST-GT and GT-ST Traffic
(A.16)
The network analyzed here is depicted in Figure 5-8. As in the ISL only case, the
optimal ISL link capacity equal to twice the optimal gateway link capacity, ie.
C*sL = 2C*,,, . To facilitate computation of the feasible regions, we consider labeling the
links as shown in Figure. Note that CISL = 2C and C.Pid,, = C.
Af
2C
Cupldn C CupdnCA)
.......................... ..............
Parameters:
CsL: Capacity of ISL and gateway link (design variable)
CUP,d : Capacity of gateway link (design variable)
101
In
P, (r) dr = < I, with
s

r: Random demand (with known probability density function, p,)
r: A realization of the random demand,
D(Cs, CId,n F): Cost function for routing on the ground link
G(CISL, CUP,,d, F): Cost function for overflow traffic
inM2, i 3 ,i 4 : Cost coefficients (assuming linear cost functions)
{: Cost per traffic unit routed on the ground link
Kc: Cost per overflow traffic unit
y,: Flow on ISL
y2 : Flow on second path
s: overflow traffic
Formulation:
Z = min{mIn2C+iM2 + 2(nC+m 4 )+2(m3 C,,d+m 4) +E[D(C,Cp,dnf F) +G(CCUP/dAl1F)0}
D(C,Cpd,,,r)+G(C,Cu,d,r)=min(2{y2 +Ks)
s.t.
2y, 2C
Y2 C Cp/dn
2,+ 22+ s r
2-y 1 C- 1 + ISL up/dn max2C - 2 y, +C - yj IL+Tu m
Y2 _ + up/dn gnd - max
CU,,dn -. Y2 p
Yi' Y2 0
S > 0
Solution:
As with ST-ST traffic analysis, there are two scenarios for the second stage cost:
102
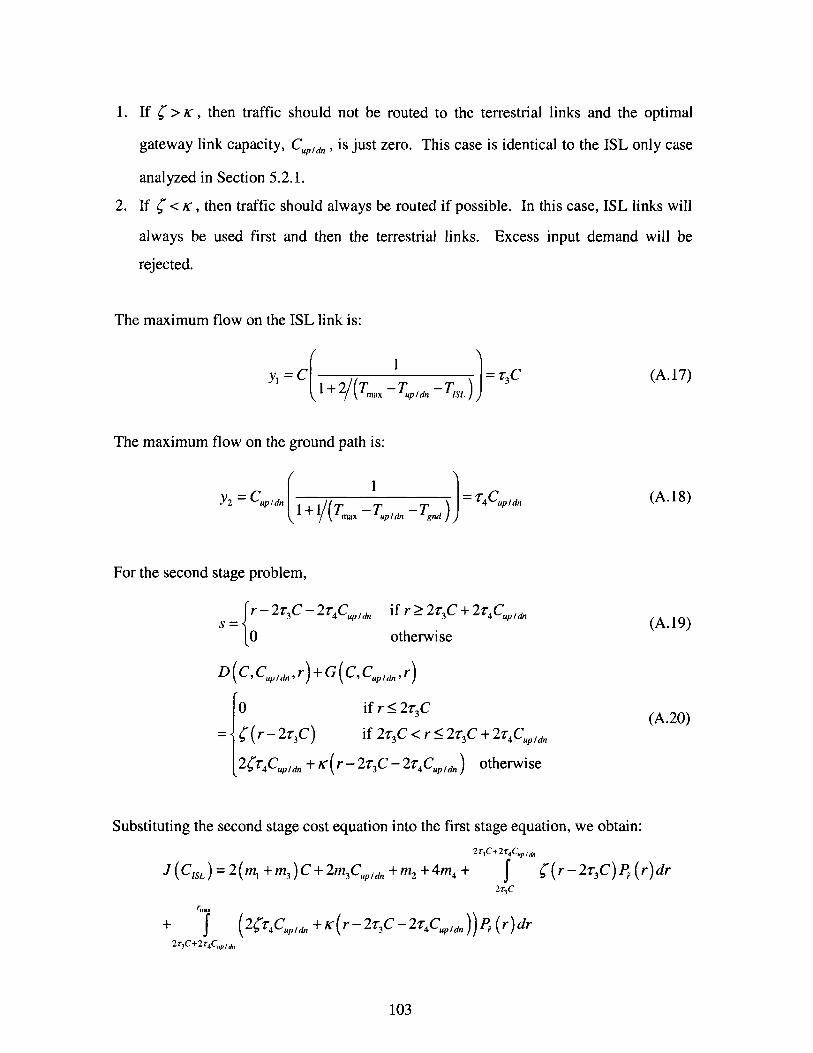
1. If > K , then traffic should not be routed to the terrestrial links and the optimal
gateway link capacity, CUP,,dn is just zero. This case is identical to the ISL only case
analyzed in Section 5.2.1.
2. If ; < K , then traffic should always be routed if possible. In this case, ISL links will
always be used first and then the terrestrial links.
rejected.
The maximum flow on the ISL link is:
yI =C1
1+ 2/(Tm -TU,,dn SL)= 3C
Excess input demand will be
(A.17)
The maximum flow on the ground path is:
Y2 = Cup,,d
1
~TUPIdn Tgnd- r= CUP IdA (A.18)
For the second stage problem,
S r - 2r3C-2r4Cudd,0
if r > 2r3C + 2r4CPdfl
otherwise
D (C, C.PI,, r) + G (C, Cup,d,. r)
0 if r 5 2r 3C
={(r - 2z3 C) if 2T3C < r 5 2r3
2Tr 4Cupdf + K ( r - 2T3C - 2T4 Cpd)
C + 2r4CUPd,
otherwise
Substituting the second stage cost equation into the first stage equation, we obtain:
J(CsL) = 2(m1 + m3 )C+2 3Cpdf +m 2 +4m 4 +
+ f (2;C4dupldn +K(r-2z3C - 2,r4Cupdn )2r3C+2r 4CP, /A
2r 3C+2r4Cup,
213C
P, (r) dr
(r-2 3C)P, (r)dr
103
(A.19)
(A.20)

aJ( C,C Idf) + 2r3C+2r 4C-P /dn
C"=2(m1+m )-2r, 2r3C
aJ (C, CUPudn =2m -2 -
OCupIdn
P,(r)dr+K JM~2r 3C+2r 4C.P,,,
JmaP,(r)dr
2r 3C+2r 4Cup /dn
For positive link capacities, the following conditions must be satisfied:
M3 @4(C;) < < M3T3, ) , 1*4 -T3
0< <(o-ie, t< tT4
If these conditions are not satisfied, then this topology should not be used.
104
P, (r)dr] (A.21)
(A.22)
(A.23)

Appendix B
Derivation for LEO/MEO Systems
2-D M by N Torus
A 2-D torus graph models a LEO or MEO satellite system in polar constellation without
seam. The graph we analyze is depicted in Figure B-1.
N,~g I***
I I
.L SI II I~ijjjI I
.1 .6I II I
II
II
-- I---I I I
I I I II I I
I I I
I I I I* I I II I I
I I
* I I II I I II I I I
I I
I I I II I I II * I I
I I
* I I II I I I* I I I
Figure B-I 2-D Torus Graph
105
I % I
~ IA.-y
'-4:-4.---
M
A L

In this graph, there are M rows and N columns of satellites. The total number of
satellites in the constellation is MN and the total number of unidirectional ISLs is 4MN .
Under the uniform all to all traffic, and assuming high rejection cost, the maximum
amount of input traffic demand is r. = (MN) 2 .
The min-hop routing strategy is optimal in this case and the link capacities are
summarized in Table 6-1. Here we show the detailed derivation used to obtain the results
in Table 6-1.
1. M and N are odd integers >= 3.
If one node sends, the total number of minimum hops is:
(B.1)
N-1 N-1
2 2 ~M (N - 1) (N + 1)H = M Ji =2M i= 4
-(N-__) i=14
2
M-1 M-1
2 2~N (M - 1) (M + 1)H,=N L j=2NLJ= 4___M___ j=1
(B.2)
(B.3)
The overall numbers of hops in each direction is:
M2Nal = (N -1(N+1
4
MN 2 (M -1)(M +1)H =a 4y
106
(B.4)
(B.5)
N-1 M -1
2 2
H = L I(i + jl),-(N-1)) j -(M-1)
2 - 2 )I

The unidirectional link capacities are:
M 2 N(N-1)(N+1) -M(N2 _1)C =
4(2MN) 8
MN 2 (M -1)(M +1) N(M2 _1)4(2MN) 8
2. M and N are even integers >= 2.
If one node sends, the total number of minimum hops is:
N_
H =
N-1
H =M
+)2
M (M- -2
H,=N E Iji=N 2 r
j~l \w=
Overall numbers of hops in each direction:
H totalx
Howl, y
Per unidirectional link capacity:
(B.6)
(B.7)
2
N_
iN
J 2
(B.8)
(B.9)
(B.10)
MN 2
4
NM2
4j +Mi21
M 2N 3
4
M4N2
4
(B.11)
(B.12)
M 2N ).4(2MN)
MN 2
8(B.13)
107
M-
1(Iil+lj )

= M 3N 2 M 2N
4(2MN) 8
3. M is odd integer >=3 and N is even integer >= 2.
If one node sends, the total number of minimum hops is:
N _ -
H = t + jil)I,=(- ) j( ( -)
NN-- 1 (N_1T2 2- N MN2
H =M M 2 ji +- =-=N) i=1 2 4
M-1 M-1
2 2 N (M - 1)(M +1)H =N L j=2N=j= 4
_______l)) j=1 4
4. M is even integer >=2 and N is odd integer >= 3.
If one node sends, the total number of minimum hops is:
N-
H=
2=
N-1
Hx =M id
M- -1
Hy =N IHA=ji 2
N-1
2M M(N-1)(N+1)= = 4
(M
2 M NM2
'J2 j 4
108
(B.14)
(B.15)
(B.16)
(B.17)
M-1
1(Iil+ j )--- 2(-M
(B.18)
(B.19)
(B.20)

Since each node sends rm'ax to every node including itself, this value can be multiplied(MN)2
to all the link capacity values to obtain the entries in Table 6-1.
2-D M by N mesh
A M by N mesh graph can be used to model half of a LEO or MEO satellite constellation.
In this graph, there are M rows and N columns of satellites. The total number of
satellites in the constellation is MN and the total number of unidirectional ISLs is
2(M(N-1)+N(M -1))=2(2MN-M-N). Under uniform all to all traffic, and
assuming high rejection cost, the maximum amount of input traffic demand is
rf = (MN) 2 .
We can find the minimum hop in the graph using cut set arguments. The overall number
of minimum hops is:
H =2 (aM (MN - aM))+ (bN (MN - bN)) (B.21)a=1 b=1
N-1
Hotax = 2 (aM (MN -aM))a=1
2 M 2N2 (N -1) M 2N(N-1)(2N-1) M2N(N2 _1) (B.22)=2-
2 6 3
M-1
Htotay = 2 (bN (MN -bN))b=1 B.3
rM2N2 (M -1) N2M (M -1)(2M-1) N2M (M2 _1)=2 -)(.3
2 6 3
We can derive an average per unidirectional link capacity. This is a lower bound for the
worst case link capacity. This bound is achieved with equality when M=N=3.
109

C = Holu MN (N +1)2M(N-1) 6
Howly MN (M +1)
2N(M -1) 6
In summary, if we fix the total amount of traffic sent to be r.,
r" 2amount of traffic to every node including itself.
(MN)2
then each node sends
The average per unidirectional
link capacity is:
rmax (N+1) rm
6MN 6M
C r.(M+1)6MN
r6N
compare with
compare with
r (N-1)(N+1) rg.x N-1(N+). ~ for a torus graph- SM
r X(M-1)(M+1) r.(m 21 ) = ax for a torus graph
8N M2 8N
The actual link capacities can be obtained simply by making horizontal and vertical cuts
in the graph. We can compute the link capacity required for the link with the highest load.
In the x direction:
If N = odd,
If N = even, C,
M(N +1)
2
1 r Max _ rmaxM (MN) 2 2) 4M
In the y direction:
If M =odd, C
If M = even, C
(M+ 1) N (M -1) rmax )(2 2 4N )
=1- r. (MN 2
N (MN)2 2 4N
110
(B.24)
(B.25)
= 1 r rM (MN)2 C(N -1)
2(B.26)
(B.27)
(B.28)
(B.29)
SM
= ma "' 1 1 )4M N2
= I rm"x NYN ( MN)2

We can also compute the link capacity required for the link with the lowest load.
In the x direction: C.
In the y direction: C
1 rma (M) (M (N -1))= r_ I 1 )_M (MN) 2 M YN N 2 )
- r"x (N)(N (M -1))=N (MN) 2 N (M M 2)
The ratio between the lowest link capacity and the highest link capacity is:
In the x direction:
rmaXC'D _
If N = odd, C, =M N N~ mx'~1 N+1
r4a I I )
rm ax N1 - 2 4(N 1)
If N = even, C M N N N2
rma N4M
In the y direction:
If M = odd, C = N (M M2 4' rma )(1 1 M+1
4N m 2 )
If M = even, C =N (M 2
rnm
4N
111
(B.30)
(B.31)
(B.32)
(B.33)
(B.34)
4(M -1)m2
(B.35)


![A survey of routing techniques for satellite networks · A survey of routing techniques for satellite networks[J]. Journal of communications and information networks, 2016, 1(4):](https://img.pdfslide.net/doc/110x75/5f0908927e708231d424e972/a-survey-of-routing-techniques-for-satellite-networks-a-survey-of-routing-techniques.jpg)