Embed Size (px)
Citation preview

energies
Article
Capacity Management of Hyperscale Data CentersUsing Predictive Modelling
Raihan Ul Islam 1,* , Xhesika Ruci 1, Mohammad Shahadat Hossain 2 , Karl Andersson 1 andAh-Lian Kor 3
1 Pervasive and Mobile Computing Laboratory, Luleå University of Technology, 93187 Skellefteå, Sweden;[email protected] (X.R.); [email protected] (K.A.)
2 Department of Computer Science and Engineering, University of Chittagong, Chittagong 4331, Bangladesh;[email protected]
3 School of Computing, Creative Technologies and Engineering Leeds Beckett University, Leeds LS1 3HE, UK;[email protected]
* Correspondence: [email protected]
Received: 31 July 2019; Accepted: 3 September 2019; Published: 6 September 2019�����������������
Abstract: Big Data applications have become increasingly popular with the emergence of cloudcomputing and the explosion of artificial intelligence. The increasing adoption of data-intensivemachines and services is driving the need for more power to keep the data centers of theworld running. It has become crucial for large IT companies to monitor the energy efficiency of theirdata-center facilities and to take actions on the optimization of these heavy electricity consumers.This paper proposes a Belief Rule-Based Expert System (BRBES)-based predictive model to predictthe Power Usage Effectiveness (PUE) of a data center. The uniqueness of this model consists of theintegration of a novel learning mechanism consisting of parameter and structure optimization byusing BRBES-based adaptive Differential Evolution (BRBaDE), significantly improving the accuracyof PUE prediction. This model has been evaluated by using real-world data collected from a Facebookdata center located in Luleå, Sweden. In addition, to prove the robustness of the predictive model,it has been compared with other machine learning techniques, such as an Artificial Neural Network(ANN) and an Adaptive Neuro Fuzzy Inference System (ANFIS), where it showed a better result.Further, due to the flexibility of the BRBES-based predictive model, it can be used to capture thenonlinear dependencies of many variables of a data center, allowing the prediction of PUE withmuch accuracy. Consequently, this plays an important role to make data centers more energy-efficient.
Keywords: learning; differential evolution; belief rule-based expert systems; predictive modelling;data center.
1. Introduction
By 2020, ICT industries will account for 3.5% of global carbon emissions, which are predictedto grow by up to 14% by 2040 [1]. Data centers are becoming a predominant ICT industry due tothe rapid growth of Big Data applications, the Internet of Things (IoT), 5G, autonomous systems,Blockchain, and artificial intelligence (AI) [2,3]. In addition, it has been predicted that demand fordata centers will rise exponentially by 2025, which would make data centers consume 33% of the totalglobal ICT electricity consumption [4]. Furthermore, it is also predicted that data centers will use30% of the total world’s energy and, nevertheless, produce only 5.5% of the global carbon footprintdue to the adaptation of efficient energy sources and technologies. In addition, data centers willproduce 340 metric megatons of CO2 per year by 2030 [5]. All the above-mentioned statistics present
Energies 2019, 12, 3438; doi:10.3390/en12183438 www.mdpi.com/journal/energies
Energies 2019, 12, 3438 2 of 22
an alarming growth rate of power usage and Greenhouse Gas (GHG) emissions by data centers in thecoming decades. These facts have inspired researchers to increase power-usage efficiency and lower theenvironmental impact of data centers. The latest research work conducted by big IT companies in thesector reveals that the adoption of predictive modeling in the capacity management of data centers isthe key to unlocking stranded capacity and identify practices for higher efficiency and reliability [6–8].
Gao [8] used a Neural Network to predict the Power Usage Effectiveness (PUE) [9] of a Googledata center using data from different sensors with the aim of increasing the energy efficiency of the datacenter. However, this research does not address the different types of uncertainty caused by sensors [10].Hossain et al. [7] used a trained Belief Rule-Based Expert System (BRBES) to predict PUE withsensor-data uncertainty in a data center. BRBES consists of belief rules as knowledge base and evidentialreasoning as inference engine, which is capable of addressing different types of uncertainty such asincompleteness, ignorance, vagueness, imprecision, and ambiguity. Different parameters of belief rulessuch as, attribute weight, rule weights, and belief degrees are usually determined by domain experts.However, the values set by experts are not always accurate. Therefore, Hossain et al. [7] used randomlygenerated rules to learn about these parameters from the dataset. However, this method was notsuitable as the results were not reproducible. Yang et al. [11] proposed a learning mechanism forBRBES using a sequential quadratic programming-based optimization technique. For this, they havethe fmincon function of the MATLAB optimization tool box. The proposed learning mechanism fortraining the BRBES suffers from a local optimal problem where the algorithm finds the best solutionfrom the smallest number of candidates instead of all solutions to the problem. Therefore, a learningmechanism is needed that can address the aforementioned problem and provide a better prediction.
The Differential Evolution (DE) algorithm is not prone to a local optimal problem due to itsrandomness [12,13]. However, the control parameters of DE, such as the crossover (CR) and mutation(F) factors, play an important role in the success of DE. The BRBES-based adaptive DE algorithm,named BRBaDE [14], helps to identify the proper value of CR and F for DE. Furthermore, the learningmechanism for BRBES can be considered as two types. One is parameter optimization and the otherone is structure optimization. In parameter optimization, the BRBES parameters are optimized, whilein structure optimization the structure of belief rules of the BRBES is optimized. Yang et al. [15]proposed a parameter and structure optimization for BRBES using DE. However, their proposedmethod has the inherent problem of determining the optimal values of F and CR for DE. Therefore,BRBES accuracy can be improved by employing parameter and structure optimization using BRBaDEas a learning technique.
In our previous work [7], two parameters, indoor and outdoor temperature, were used forpredicting PUE. To improve prediction accuracy in this research work, wind speed and direction werealso included, as these parameters also influence the environment. The accurate prediction of PUEhelps data-center operators to take necessary steps for making their data centers more energy-efficient.This paper aims to demonstrate the employment of parameter and structure optimization usingBRBaDE as a learning technique for BRBES to predict the energy-efficiency metric, PUE, from existingdata generated within a data center. The raw data used for the experiments were sourced froma Facebook data center in Luleå. The collected data were used to provide trends and predict data-centerenergy efficiency.
The article is organized according to the following structure: Section 2 reviews related work, andSections 3 and 4 cover the methodology followed by the experimental part. Subsequently, Section 5contains the implementation of the predictive models that forecast PUE, followed by Section 6, whichpresents results and their analysis. Lastly, Section 7 outlines the conclusion and indicates our future work.
2. Related Work
Data centers are becoming a more integral part of our daily life. All major services, such astelecommunications, transport, public health, and urban traffic, are now using data centers to deployIT services. Due to the importance of the above-mentioned facilities and increasing demand, the power
Energies 2019, 12, 3438 3 of 22
consumption and operating cost of data centers are rapidly rising. Therefore, researchers are nowprimarily focusing on optimizing data centers.
In recent years, significant research has been devoted to the development of appropriate matricesfor measuring data-center energy efficiency. First, the energy efficiency of a system is measured as theratio of useful work done by a system to the total energy delivered to the system. For a data center,energy efficiency can be considered as useful work performed by different subsystems. According tothe Green Grid Association [16], PUE and Data Center Infrastructure Efficiency (DCiE), which areshown by Equations (1) and (2), can help to better understand and improve the energy efficiency ofexisting data centers. This also helps to support smarter managerial decision making for improvingdata-center efficiency.
PUE =TotalFacilityPowerITEquipmentPower
; 1 ≤ PUE (1)
DCiE =1
PUE(2)
IT Equipment Power includes the load associated with all IT equipment, such as computing,storage, and network devices.
Total Facility Power includes everything that supports the processing of IT equipment load(e.g., mechanical and cooling systems).
However, the Green Grid Association also proposed metrics such as Carbon Usage Effectiveness(CUE) [17], Water Usage Effectiveness (WUE) [18], and Electronics Disposal Efficiency (EDE) [19]to measure the CO2 footprint, water consumption per year, and the disposal efficiency of datacenters, respectively. From all these matrices, PUE and DCiE are considered as the industry defacto for measuring power efficiency.
Nowadays, data centers consist of numerous sensors that generate millions of data points everyday. These huge numbers of data are usually used for monitoring purposes. However, machine-learningalgorithms can exploit the use of these monitoring data to improve the energy efficiency of datacenters. In addition, machine-learning algorithms are capable of predicting PUE using these datawhile considering the complexity of the components of the data centers. According to Belden Inc. [20],one of the largest US-based manufacturers on networking, connectivity, and cable products: “It won’t belong before Data Center Infrastructure Management (DCIM) systems will routinely contain an AI toolthat not only optimizes critical mechanical- and electrical-equipment performance, but also optimizescompute and storage needs. AI will affect how data-center operations teams work and change what’sinvolved with day-to-day tasks like fulfilling normal maintenance needs and monitoring networks.They’ll become “automation engineers”, using the AI engine to optimize data centers”.
Furthermore, Vigilent [21] is another IT company that has succeeded in reducing data-centercooling capacity by implementing real-time monitoring and machine learning to match cooling needswith the exact cooling capacity. This frees up stranded capacity and allows to determine when coolinginfrastructure is at risk of failure, resulting in uptime improvement, and preventing unexpecteddowntime and revenue loss.
Moreover, Rego [22] developed a set of software tools named Prognose that could be used forthe predictive modelling of energy and capacity planning within a data center. Their model analyzesdifferent metrics that go into building a data center and is intended to perform predictive modellingthroughout the life of the data center (not just during planning).
Shoukourian et al. [23] have used neural network based machine learning approach for modelingthe coefficient of performance of a high performance data center. Balanici et al. [24] used server trafficflow to improve the power usage of a data center. They have used auto-regressive neural networksto predict the server traffic flow. Furthermore, power usage of a data center can be improved byoptimizing the control policy of the cooling system. Li et al. [25] proposed a Reinforcement Learningbased control policy of the cooling system of a data center. The proposed model has been able to
Energies 2019, 12, 3438 4 of 22
reduce 11% cooling cost in a simulation platform. Moreover, Haghshenas et al. [26] have also usedmulti-agent based Reinforcement Learning algorithm to minimize energy consumption of a large-scaledata center.
Gao [8] conducted extensive work to predict the PUE metric of a Google data center. This workaims to demonstrate that machine learning is an effective tool to leverage existing sensor data to modeldata-center performance and improve energy efficiency. The model has been tested and validated atGoogle’s data centers. In his work, a neural network was selected as the mathematical framework fortraining data-center energy-efficiency models. Their training dataset contained 19 normalized inputvariables and one normalized output, the data center PUE, each variable spanning 182,435 samples(two years of operational data). This custom AI DCIM solution reduced overall data-center powerconsumption by 15% and reduced cooling power by 40%. However, the data coming from sensorscontained different types of uncertainty, such as ignorance, incompleteness, ambiguity, vagueness,and imprecision. Different kinds of uncertainty exist in sensor data due to malfunctions, and faultyor duplicate sensor measurements [10]. A neural network uses forward propagation as an inferencingprocedure that does not have a mechanism to address data uncertainty. Therefore, BRBES can be used toaddress these uncertainties by using a Belief Rule Base (BRB) as the knowledge base and EvidentialReasoning (ER) as the inference engine.
Hossain et. al. [7] used trained BRBES to predict the PUE of a data center. BRBES has thecapability to address the uncertainties of sensor data [10]. Furthermore, Yang et al. [11] used a MATLABtool-based optimization technique fmincon as a learning methodology for training BRBES. However,this gradient-based method does not always perform better due to local optima-related problems.Furthermore, the above-mentioned research work used conjunctive BRB, which becomes computationallycostly as the number of rules grows with the increase of referential values and antecedent attributes.Therefore, a better learning mechanism is needed for training the BRBES and effective BRB that is notcomputationally costly.
Chang et al. [27] proposed an optimization model for disjunctive BRB where lower and upperbounds are set for the utility values of the referential values of the antecedent attributes. These strictconstraints influence the optimized model to become stuck in local optima instead of finding a globaloptimal solution. However, the disjunctive BRB does not grow exponentially with the increase ofreferential values and it is computationally less costly.
Yang et al. [15] proposed a join optimization model for BRBES that consisted of parameter andstructure optimization. A heuristic strategy is used to optimize the structure of BRB, while a DEalgorithm is used to perform parameter optimization. Furthermore, the generalization capabilityof BRBES is shown in this research work. This research work illustrates DE efficiency for BRBESparameter optimization. However, there is a lack of finding optimal values for the control parametersof DE, which may lead to better results.
In summary, the joint optimization of the parameters and structure for BRBES has shown betterresults among the different optimization techniques as mentioned above. Among evolutionaryalgorithms, DE is preferable for the joint optimization of BRBES, as it is better suited for multiplelocal minima. However, there is a lack of determining optimal values for DE control parameters.Furthermore, there should be a balance of exploration and exploitation of search space while findingthe optimal solution for using DE. Therefore, a hyperoptimized algorithm is required to find theoptimal values of the DE control parameters while ensuring the balanced exploration and exploitationof the search space. In the next sections, BRBES and its learning mechanism are discussed in detail.
3. BRBES
In this section, a brief description of BRBES is discussed. BRBES is an integrated expert systemframework for handling different types of uncertainty with support for both qualitative and quantitativedata [28]. BRBES consists of a knowledge base and an inference mechanism. Expert knowledge is elicitedand represented in a knowledge base, using belief structure, incorporated with IF-THEN rules, which is
Energies 2019, 12, 3438 5 of 22
named BRB. The inference mechanism uses ER for processing the input and generating output based onBRB [29].
Each belief rule of BRB is formulated using an antecedent and consequent. The antecedent consistsof antecedent attributes with referential values to represent the inputs for the system. The consequenthas the consequent attribute with the associated belief degrees that represent the output of the system.These rules can be prioritized using rule weights. An example of belief rule is given in Equation (3).
Rk :
IF (A1 is Vk
1 ) AND / OR (A2 is Vk2 ) AND / OR
. . . AND / OR (ATk is VkTk)
THEN (C1, β1k), (C2, β2k), . . . , (CN , βNk)
(3)
where β jk ≥ 0,N
∑j=1
β jk ≤ 1 with rule weight θk,
and attribute weights δk1, δk2, . . . δkTk, k ∈ 1, . . . , L
where A1, A2, . . . , ATk are the antecedent attributes of the kth rule. Vki (i = 1, . . . , Tk, k = 1, . . . , L) is
the referential value of the ith antecedent attribute. Cj is the jth referential value of the consequentattribute. β jk(j = 1, ..., N, k = 1, ..., L) is the degree of belief for the consequent reference value Cj.
IfN
∑j=1
β jk ≤ 1, then the kth rule is considered as complete; otherwise, it is incomplete.
A belief rule can also be explained with linguistic terms as shown in the following example.
Rk :
IF X2 (External Temperature) is MediumAND
X3 (Room Temperature) is High
THEN X1 (PUE) is{(Critical, 0.2), (Moderate, 0.5), (Low, 0.3)}
(4)
In the above rule, External Temperature and Room Temperature have the following referentialvalues: “Medium" and “High", while PUE is the consequent attribute with referential values, “Critical",“Moderate", and “Low". As the summation of belief degrees (0.2 + 0.5 + 0.3 = 1) is one, hence the ruleis considered complete.
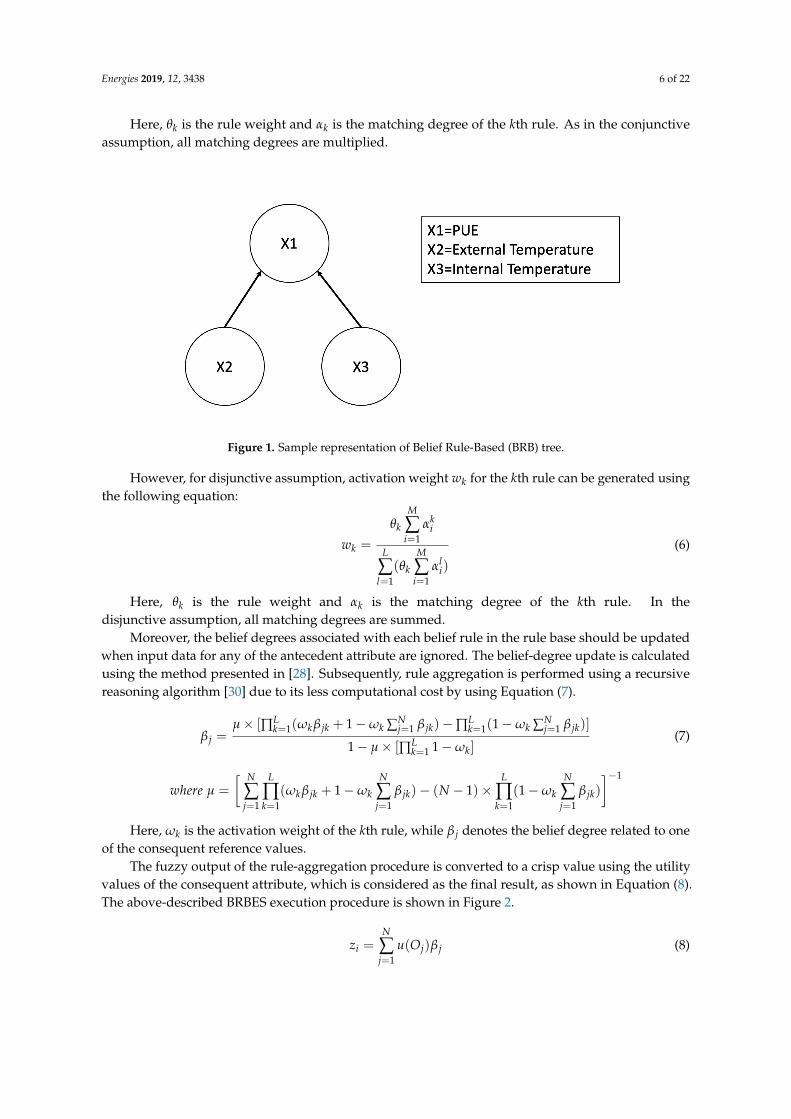
Furthermore, this can also be represented as a tree structure with two leaf nodes and one parent asshown in Figure 1. The logical connectives of the antecedent attributes in a belief rule can either be ANDor OR, which represent the conjunctive or the disjunctive assumptions of the rule, respectively. Based onthe logical connectivity of the BRB, a BRBES can be named either Conjunctive or Disjunctive BRB.
The inference procedures consist of four steps, namely, input transformation, rule activation,belief update, and rule aggregation using an evidential-reasoning approach. The input data aredistributed over the referential values of the antecedent attributes, which is called the matching degreeduring the input transformation. The belief rules are called packet antecedent, which are stored inshort-term memory. The activation weight of the rules are calculated using matching degrees.
Activation weight wk for the kth rule for conjunctive assumption can be generated using thefollowing equation:
wk =
θk
M
∏i=1
αki
L
∑l=1
(θk
M
∏i=1
αli)
(5)
Energies 2019, 12, 3438 6 of 22
Here, θk is the rule weight and αk is the matching degree of the kth rule. As in the conjunctiveassumption, all matching degrees are multiplied.
Figure 1. Sample representation of Belief Rule-Based (BRB) tree.
However, for disjunctive assumption, activation weight wk for the kth rule can be generated usingthe following equation:
wk =
θk
M
∑i=1
αki
L
∑l=1
(θk
M
∑i=1
αli)
(6)
Here, θk is the rule weight and αk is the matching degree of the kth rule. In thedisjunctive assumption, all matching degrees are summed.
Moreover, the belief degrees associated with each belief rule in the rule base should be updatedwhen input data for any of the antecedent attribute are ignored. The belief-degree update is calculatedusing the method presented in [28]. Subsequently, rule aggregation is performed using a recursivereasoning algorithm [30] due to its less computational cost by using Equation (7).
β j =µ× [∏L
k=1(ωkβ jk + 1−ωk ∑Nj=1 β jk)−∏L
k=1(1−ωk ∑Nj=1 β jk)]
1− µ× [∏Lk=1 1−ωk]
(7)
where µ =
[ N
∑j=1
L
∏k=1
(ωkβ jk + 1−ωk
N
∑j=1
β jk)− (N − 1)×L
∏k=1
(1−ωk
N
∑j=1
β jk)
]−1
Here, ωk is the activation weight of the kth rule, while β j denotes the belief degree related to oneof the consequent reference values.
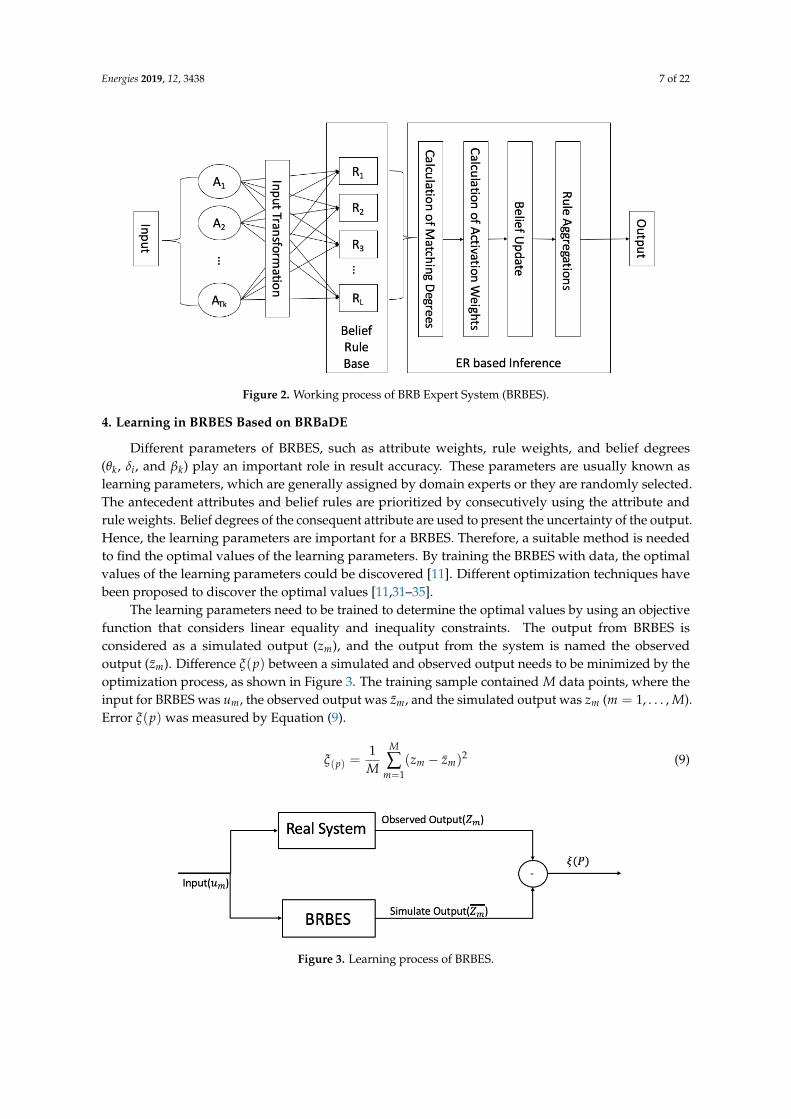
The fuzzy output of the rule-aggregation procedure is converted to a crisp value using the utilityvalues of the consequent attribute, which is considered as the final result, as shown in Equation (8).The above-described BRBES execution procedure is shown in Figure 2.
zi =N
∑j=1
u(Oj)β j (8)
Energies 2019, 12, 3438 7 of 22
Figure 2. Working process of BRB Expert System (BRBES).
4. Learning in BRBES Based on BRBaDE
Different parameters of BRBES, such as attribute weights, rule weights, and belief degrees(θk, δi, and βk) play an important role in result accuracy. These parameters are usually known aslearning parameters, which are generally assigned by domain experts or they are randomly selected.The antecedent attributes and belief rules are prioritized by consecutively using the attribute andrule weights. Belief degrees of the consequent attribute are used to present the uncertainty of the output.Hence, the learning parameters are important for a BRBES. Therefore, a suitable method is neededto find the optimal values of the learning parameters. By training the BRBES with data, the optimalvalues of the learning parameters could be discovered [11]. Different optimization techniques havebeen proposed to discover the optimal values [11,31–35].
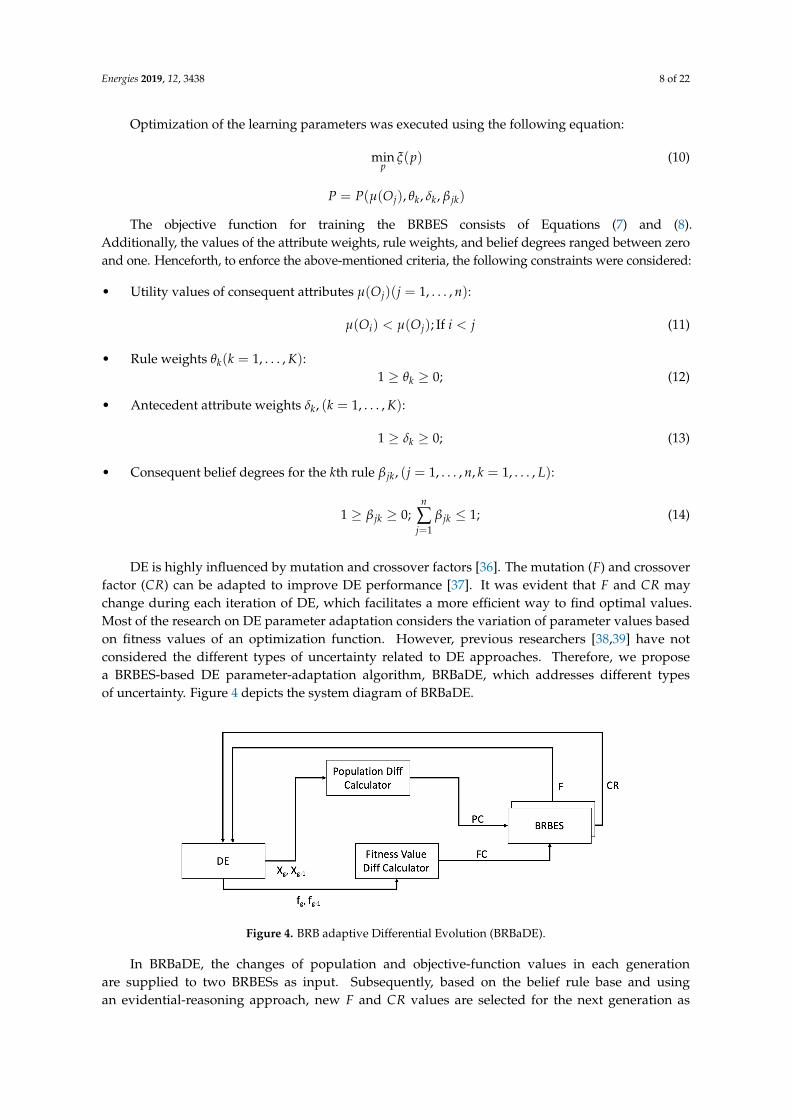
The learning parameters need to be trained to determine the optimal values by using an objectivefunction that considers linear equality and inequality constraints. The output from BRBES isconsidered as a simulated output (zm), and the output from the system is named the observedoutput (z̄m). Difference ξ(p) between a simulated and observed output needs to be minimized by theoptimization process, as shown in Figure 3. The training sample contained M data points, where theinput for BRBES was um, the observed output was z̄m, and the simulated output was zm (m = 1, . . . , M).Error ξ(p) was measured by Equation (9).
ξ(p) =1M
M
∑m=1
(zm − z̄m)2 (9)
Figure 3. Learning process of BRBES.
Energies 2019, 12, 3438 8 of 22
Optimization of the learning parameters was executed using the following equation:
minp
ξ(p) (10)
P = P(µ(Oj), θk, δk, β jk)
The objective function for training the BRBES consists of Equations (7) and (8).Additionally, the values of the attribute weights, rule weights, and belief degrees ranged between zeroand one. Henceforth, to enforce the above-mentioned criteria, the following constraints were considered:
• Utility values of consequent attributes µ(Oj)(j = 1, . . . , n):
µ(Oi) < µ(Oj); If i < j (11)
• Rule weights θk(k = 1, . . . , K):1 ≥ θk ≥ 0; (12)
• Antecedent attribute weights δk, (k = 1, . . . , K):
1 ≥ δk ≥ 0; (13)
• Consequent belief degrees for the kth rule β jk, (j = 1, . . . , n, k = 1, . . . , L):
1 ≥ β jk ≥ 0;n
∑j=1
β jk ≤ 1; (14)
DE is highly influenced by mutation and crossover factors [36]. The mutation (F) and crossoverfactor (CR) can be adapted to improve DE performance [37]. It was evident that F and CR maychange during each iteration of DE, which facilitates a more efficient way to find optimal values.Most of the research on DE parameter adaptation considers the variation of parameter values basedon fitness values of an optimization function. However, previous researchers [38,39] have notconsidered the different types of uncertainty related to DE approaches. Therefore, we proposea BRBES-based DE parameter-adaptation algorithm, BRBaDE, which addresses different typesof uncertainty. Figure 4 depicts the system diagram of BRBaDE.
Figure 4. BRB adaptive Differential Evolution (BRBaDE).
In BRBaDE, the changes of population and objective-function values in each generationare supplied to two BRBESs as input. Subsequently, based on the belief rule base and usingan evidential-reasoning approach, new F and CR values are selected for the next generation as
Energies 2019, 12, 3438 9 of 22
shown in Figure 4. The BRBES helps to achieve the optimal exploration and exploitation of the searchspace by considering the changes of population and objective-function values in each generation.
PC =
√√√√ 1NP
NP
∑i=1
D
∑j=1
(xgj,i − x(g−1)
j,i )2 (15)
FC =
√√√√ 1NP
NP
∑i=1
( f gi − f (g−1)
i )2 (16)
d11 = 1− (1 + PC)e−PC (17)
d12 = 1− (1 + FC)e−FC (18)
d21 = 2d11 (19)
d22 = 2d12 (20)
Here, PC is the change in magnitude of a population vector during the last two generations,and xg
j,i and xg−1j,i are the population vectors on the gth generation and (g− 1)th, respectively. FC is
the change in magnitude of the objective function during the last two generations, while the f gi and
f (g−1)i are the function values for the ith population on gth generation and (g − 1)th respectively.
The values of PC and FC have been rescaled between 0 to 1 using Equations (17) and (18), where d11
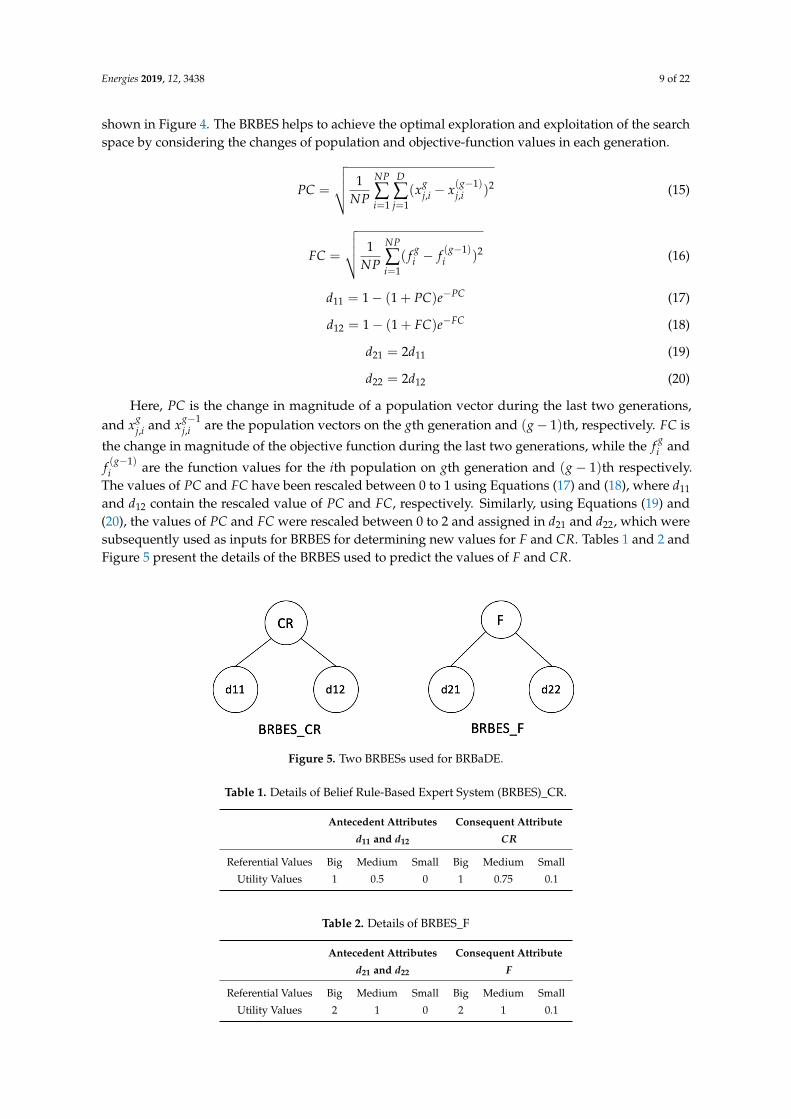
and d12 contain the rescaled value of PC and FC, respectively. Similarly, using Equations (19) and(20), the values of PC and FC were rescaled between 0 to 2 and assigned in d21 and d22, which weresubsequently used as inputs for BRBES for determining new values for F and CR. Tables 1 and 2 andFigure 5 present the details of the BRBES used to predict the values of F and CR.
Figure 5. Two BRBESs used for BRBaDE.
Table 1. Details of Belief Rule-Based Expert System (BRBES)_CR.
Antecedent Attributes Consequent Attribute
d11 and d12 CR
Referential Values Big Medium Small Big Medium Small
Utility Values 1 0.5 0 1 0.75 0.1
Table 2. Details of BRBES_F
Antecedent Attributes Consequent Attribute
d21 and d22 F
Referential Values Big Medium Small Big Medium Small
Utility Values 2 1 0 2 1 0.1
Energies 2019, 12, 3438 10 of 22
Therefore, the proposed BRBaDE provides a solution for addressing uncertainty in objectivefunctions by incorporating BRBES with DE. Furthermore, it facilitates optimal exploration andexploitation of the search space, which leads to finding the optimal solution with fewer iterations.
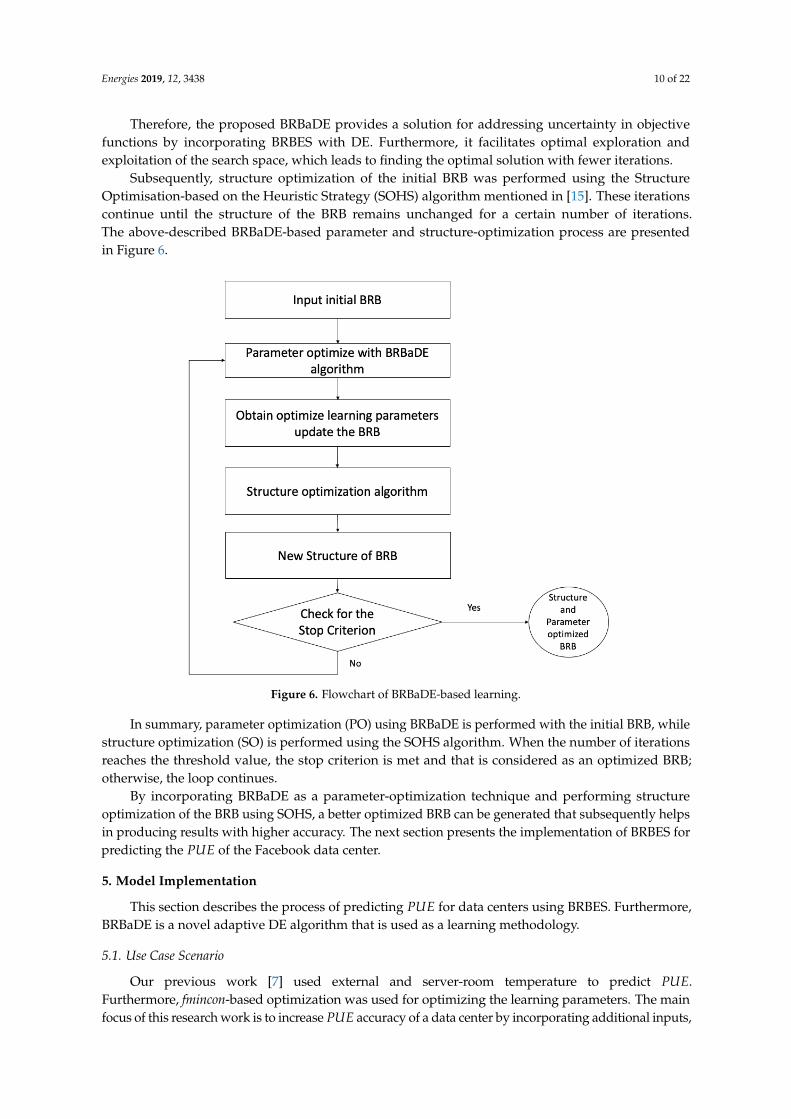
Subsequently, structure optimization of the initial BRB was performed using the StructureOptimisation-based on the Heuristic Strategy (SOHS) algorithm mentioned in [15]. These iterationscontinue until the structure of the BRB remains unchanged for a certain number of iterations.The above-described BRBaDE-based parameter and structure-optimization process are presentedin Figure 6.
Figure 6. Flowchart of BRBaDE-based learning.
In summary, parameter optimization (PO) using BRBaDE is performed with the initial BRB, whilestructure optimization (SO) is performed using the SOHS algorithm. When the number of iterationsreaches the threshold value, the stop criterion is met and that is considered as an optimized BRB;otherwise, the loop continues.
By incorporating BRBaDE as a parameter-optimization technique and performing structureoptimization of the BRB using SOHS, a better optimized BRB can be generated that subsequently helpsin producing results with higher accuracy. The next section presents the implementation of BRBES forpredicting the PUE of the Facebook data center.
5. Model Implementation
This section describes the process of predicting PUE for data centers using BRBES. Furthermore,BRBaDE is a novel adaptive DE algorithm that is used as a learning methodology.
5.1. Use Case Scenario
Our previous work [7] used external and server-room temperature to predict PUE.Furthermore, fmincon-based optimization was used for optimizing the learning parameters. The mainfocus of this research work is to increase PUE accuracy of a data center by incorporating additional inputs,
Energies 2019, 12, 3438 11 of 22
such as wind speed and direction. In addition, BRBaDE is used as a learning technique for BRBESto improve the learning process. The Facebook data center situated in Luleå, Sweden was chosen asa use case for this research work. The data center had sensors for measuring humidity and temperature.We collected data from the data center for a three-month period from 1 December 2017 to 25 February2018, where the data were sampled every seven hours. Furthermore, wind speed and direction forthe same period and location were collected from Weather Underground [40]. Preprocessing of theraw data is an important step for conducting different types of analysis. The raw data from thesensors were examined, and missing and abnormal data were removed. Wind-speed and directiondata for the corresponding date of the sensor data were collected from the Weather Underground site.After preprocessing, the dataset contained around 298 data points. The dataset consisted of timetemperature, humidity, wind speed, wind direction, and PUE. Temperature, humidity, wind speed,and wind direction were considered as input, while the PUE was considered as output. The datasetwas divided into a training and a testing set. The BRBES was trained using proposed PO and SO usingBRBaDE by the training dataset. Afterward, the testing dataset was used to evaluate the performance ofthe trained BRBES, which is presented in Section 6 in detail.
5.2. BRBES for PUE
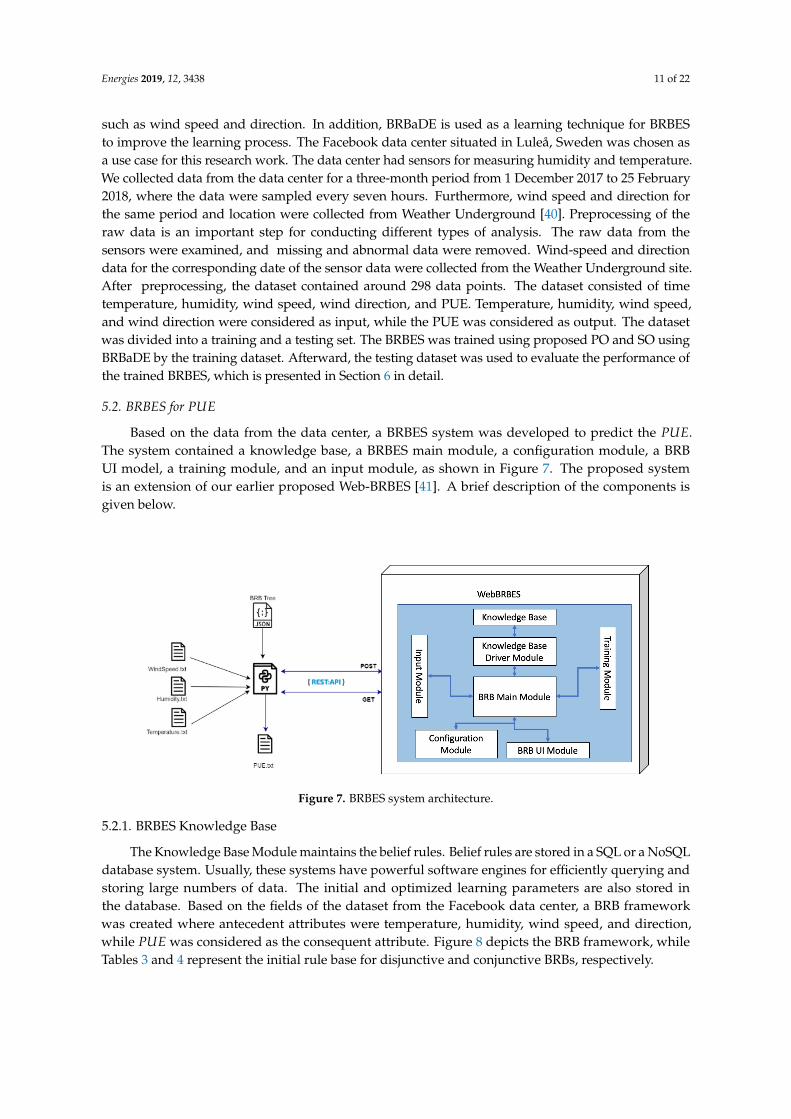
Based on the data from the data center, a BRBES system was developed to predict the PUE.The system contained a knowledge base, a BRBES main module, a configuration module, a BRBUI model, a training module, and an input module, as shown in Figure 7. The proposed systemis an extension of our earlier proposed Web-BRBES [41]. A brief description of the components isgiven below.
Figure 7. BRBES system architecture.
5.2.1. BRBES Knowledge Base
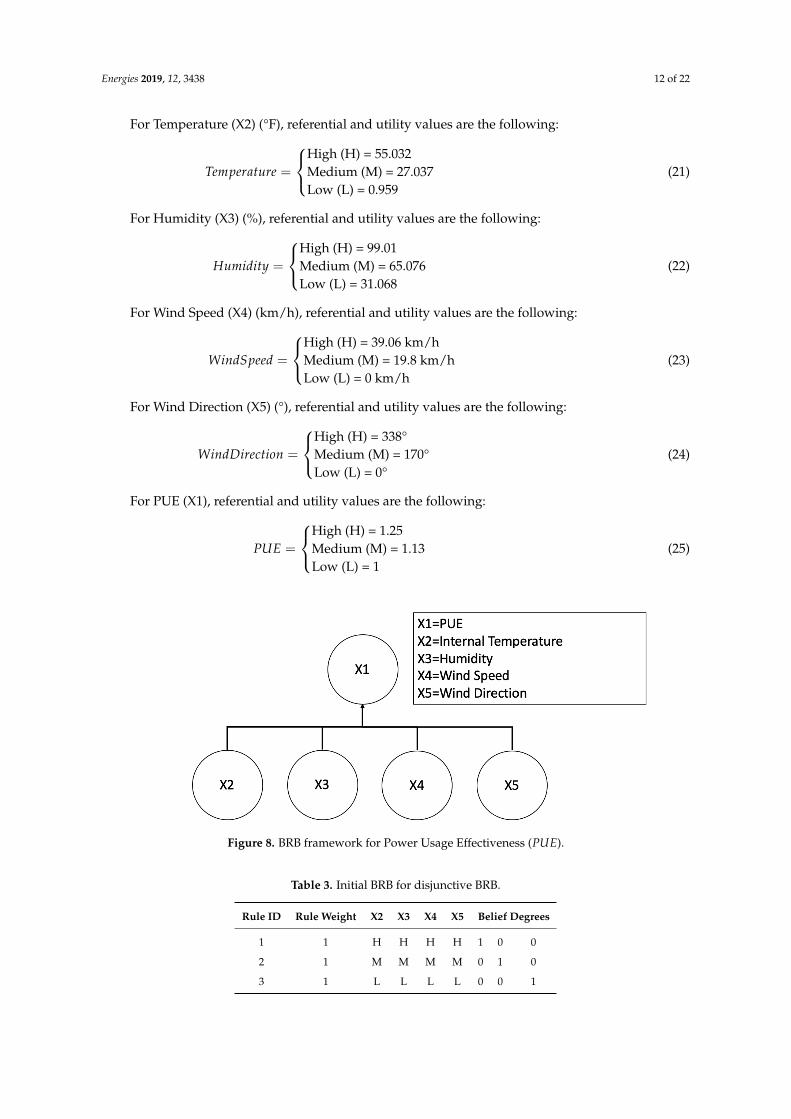
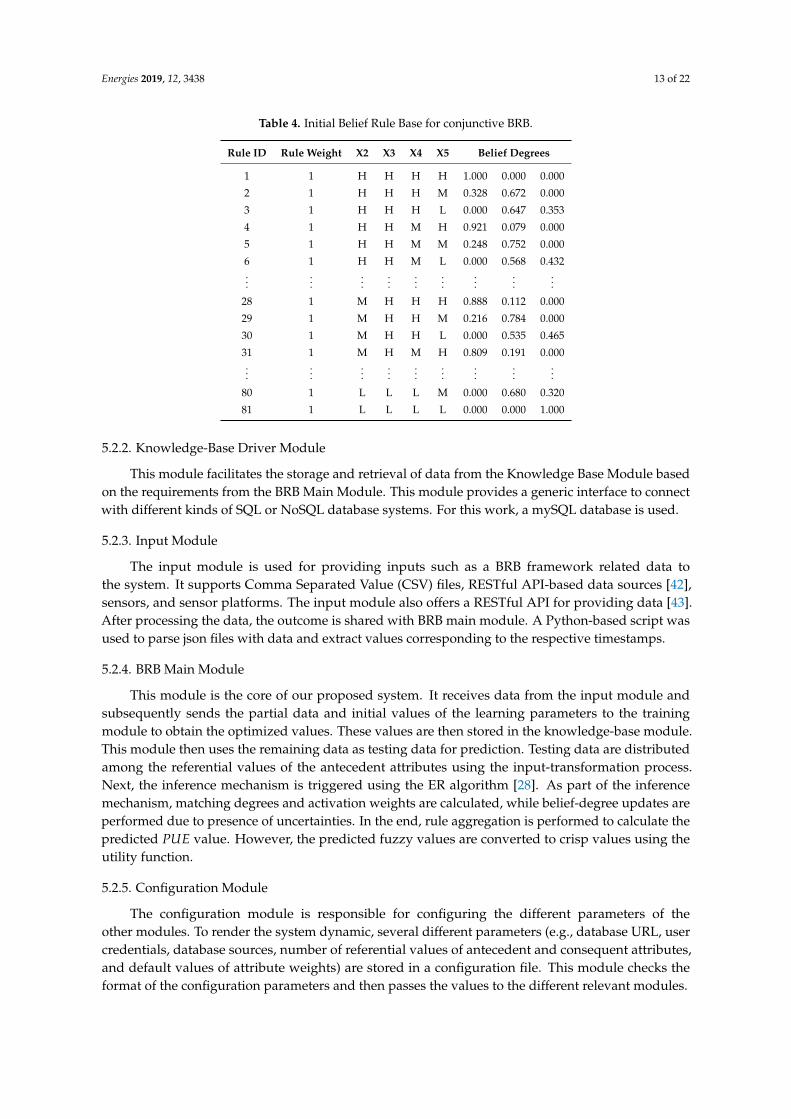
The Knowledge Base Module maintains the belief rules. Belief rules are stored in a SQL or a NoSQLdatabase system. Usually, these systems have powerful software engines for efficiently querying andstoring large numbers of data. The initial and optimized learning parameters are also stored inthe database. Based on the fields of the dataset from the Facebook data center, a BRB frameworkwas created where antecedent attributes were temperature, humidity, wind speed, and direction,while PUE was considered as the consequent attribute. Figure 8 depicts the BRB framework, whileTables 3 and 4 represent the initial rule base for disjunctive and conjunctive BRBs, respectively.
Energies 2019, 12, 3438 12 of 22
For Temperature (X2) (°F), referential and utility values are the following:
Temperature =
High (H) = 55.032Medium (M) = 27.037Low (L) = 0.959
(21)
For Humidity (X3) (%), referential and utility values are the following:
Humidity =
High (H) = 99.01Medium (M) = 65.076Low (L) = 31.068
(22)
For Wind Speed (X4) (km/h), referential and utility values are the following:
WindSpeed =
High (H) = 39.06 km/hMedium (M) = 19.8 km/hLow (L) = 0 km/h
(23)
For Wind Direction (X5) (°), referential and utility values are the following:
WindDirection =
High (H) = 338°Medium (M) = 170°Low (L) = 0°
(24)
For PUE (X1), referential and utility values are the following:
PUE =
High (H) = 1.25Medium (M) = 1.13Low (L) = 1
(25)
Figure 8. BRB framework for Power Usage Effectiveness (PUE).
Table 3. Initial BRB for disjunctive BRB.
Rule ID Rule Weight X2 X3 X4 X5 Belief Degrees
1 1 H H H H 1 0 0
2 1 M M M M 0 1 0
3 1 L L L L 0 0 1
Energies 2019, 12, 3438 13 of 22
Table 4. Initial Belief Rule Base for conjunctive BRB.
Rule ID Rule Weight X2 X3 X4 X5 Belief Degrees
1 1 H H H H 1.000 0.000 0.000
2 1 H H H M 0.328 0.672 0.000
3 1 H H H L 0.000 0.647 0.353
4 1 H H M H 0.921 0.079 0.000
5 1 H H M M 0.248 0.752 0.000
6 1 H H M L 0.000 0.568 0.432...
......
......
......
......
28 1 M H H H 0.888 0.112 0.000
29 1 M H H M 0.216 0.784 0.000
30 1 M H H L 0.000 0.535 0.465
31 1 M H M H 0.809 0.191 0.000...
......
......
......
......
80 1 L L L M 0.000 0.680 0.320
81 1 L L L L 0.000 0.000 1.000
5.2.2. Knowledge-Base Driver Module
This module facilitates the storage and retrieval of data from the Knowledge Base Module basedon the requirements from the BRB Main Module. This module provides a generic interface to connectwith different kinds of SQL or NoSQL database systems. For this work, a mySQL database is used.
5.2.3. Input Module
The input module is used for providing inputs such as a BRB framework related data tothe system. It supports Comma Separated Value (CSV) files, RESTful API-based data sources [42],sensors, and sensor platforms. The input module also offers a RESTful API for providing data [43].After processing the data, the outcome is shared with BRB main module. A Python-based script wasused to parse json files with data and extract values corresponding to the respective timestamps.
5.2.4. BRB Main Module
This module is the core of our proposed system. It receives data from the input module andsubsequently sends the partial data and initial values of the learning parameters to the trainingmodule to obtain the optimized values. These values are then stored in the knowledge-base module.This module then uses the remaining data as testing data for prediction. Testing data are distributedamong the referential values of the antecedent attributes using the input-transformation process.Next, the inference mechanism is triggered using the ER algorithm [28]. As part of the inferencemechanism, matching degrees and activation weights are calculated, while belief-degree updates areperformed due to presence of uncertainties. In the end, rule aggregation is performed to calculate thepredicted PUE value. However, the predicted fuzzy values are converted to crisp values using theutility function.
5.2.5. Configuration Module
The configuration module is responsible for configuring the different parameters of theother modules. To render the system dynamic, several different parameters (e.g., database URL, usercredentials, database sources, number of referential values of antecedent and consequent attributes,and default values of attribute weights) are stored in a configuration file. This module checks theformat of the configuration parameters and then passes the values to the different relevant modules.
Energies 2019, 12, 3438 14 of 22
5.2.6. BRB UI Module
This module provides a user interface to view PUE prediction. It also provides an option formanual input to predict the PUE of single data points.
5.2.7. Training Module
The training module is responsible for incorporating learning in BRBES, as described in Section 4.It fetches the initial values and training dataset from the BRB main module and returns the optimizedvalues of the learning parameters.
The training module performs learning by constructing an objective function usingEquations (7)–(10). Subsequently, the BRBaDE base parameter and structure optimization are performedbased on the objective function and constraints for the attribute weights, rule weights, and belief degrees.Finally, the optimal values of the learning parameters are passed to the BRB main module that is usedfor predicting the PUE of the data center.
6. Results
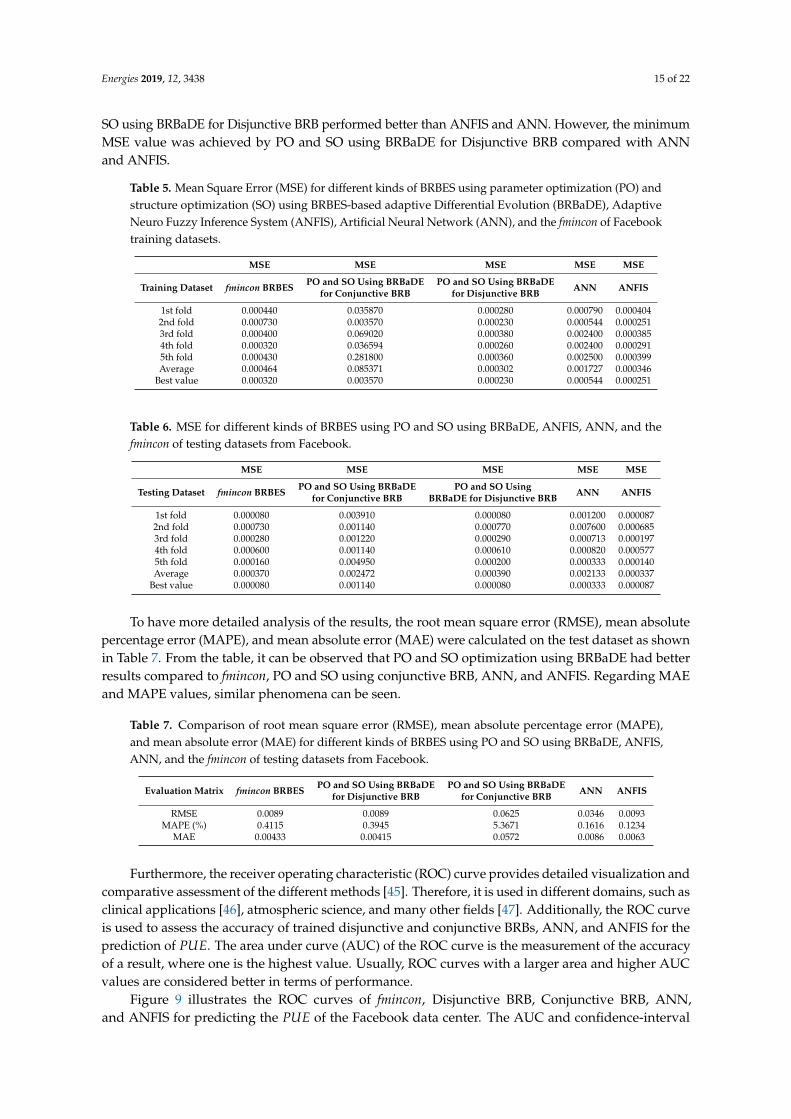
An accurate PUE prediction model is very useful for efficiently managing data centers. This allowsdata-center operators to evaluate data-center PUE sensitivity with respect to its operational parameters.Furthermore, a comparison of actual versus predicted PUE values provide invaluable insight intoreal-time plan efficiency and generating performance alerts. Additionally, a data-center efficiencymodel allows operators to simulate data-center operating configuration without making physicalchanges—note that this is a challenging task due to the complexity of modern data centers and theinteractions among multiple control systems. Therefore, it is very important to verify the accuracyof the predicted PUE. We used the Mean Square Error (MSE) metric, which is very commonly usedfor measuring the error of predicted PUE. The PO and SO using BRBaDE were implemented usingMATLAB 2018b. All experiments were conducted on a MacBook Pro with Intel Core i7 processor,2.2 GHz, and 16 GB RAM. The dataset was partitioned into a 80:20 ratio for training and testing withfivefold cross-validation. The results of training and testing are shown in Tables 5 and 6. The second,third, and fourth columns of the Tables 5 and 6 represent the MSE values for fmincon-based learning,PO and SO using BRBaDE for Conjunctive and Disjunctive BRBs. From Table 5, it can be observedthat PO and SO using BRBaDE for Disjunctive BRB preformed better than the other methods with thebest value of 0.000230, and an average value of 0.000302 for the training dataset. Similar results werealso observed for the test datasets from Table 6. The best MSE obtained by the BRBES for the trainingdataset after training it by PO for SO using BRBaDE for a disjunctive BRB was 0.0023, which is shownon the last row of the fourth column of Table 5 . On the other hand, the best MSE obtained by theBRBES while being trained by the fmincon-based learning mechanism was 0.000320, which can beseen from the last row and second column of Table 5 . The fmincon-based learning mechanism wasonly parameter optimization. Therefore, it can be concluded that result accuracy by BRBES could beimproved by employing parameter and structure optimization using BRBaDE as a learning technique.
In addition, the BRBES is compared with two other machine-learning techniques, namely, ArtificialNeural Network (ANN) and Adaptive Neuro Fuzzy Inference System (ANFIS) [44]. The ANN wasimplemented using MATLAB. The ANN had one input layer, one hidden layer with three neurons,and one output layer. Levenberg–Marquardt was used as the training algorithm for the ANN. The ANFISmodel was also developed in MATLAB. The "gaussmf" function of MATLAB was used as the membershipfunction for the inputs, and hybrid function was used for training the fuzzy interface function. The resultsare presented in the fifth and sixth columns of Tables 5 and 6 for training and testing, respectively. For thetraining dataset, it could be observed that the average MSE value of all cross-validation for PO andSO using BRBaDE for Disjunctive BR qas 0.000302, while ANN and ANFIS had 0.001727 and 0.00346,respectively. This clearly presents that PO and SO using BRBaDE for Disjunctive BRB performed betterthan ANN and ANFIS for the training dataset. For the testing dataset, the average MSE value of PO and
Energies 2019, 12, 3438 15 of 22
SO using BRBaDE for Disjunctive BRB performed better than ANFIS and ANN. However, the minimumMSE value was achieved by PO and SO using BRBaDE for Disjunctive BRB compared with ANNand ANFIS.
Table 5. Mean Square Error (MSE) for different kinds of BRBES using parameter optimization (PO) andstructure optimization (SO) using BRBES-based adaptive Differential Evolution (BRBaDE), AdaptiveNeuro Fuzzy Inference System (ANFIS), Artificial Neural Network (ANN), and the fmincon of Facebooktraining datasets.
MSE MSE MSE MSE MSE
Training Dataset fmincon BRBES PO and SO Using BRBaDE PO and SO Using BRBaDE ANN ANFISfor Conjunctive BRB for Disjunctive BRB
1st fold 0.000440 0.035870 0.000280 0.000790 0.0004042nd fold 0.000730 0.003570 0.000230 0.000544 0.0002513rd fold 0.000400 0.069020 0.000380 0.002400 0.0003854th fold 0.000320 0.036594 0.000260 0.002400 0.0002915th fold 0.000430 0.281800 0.000360 0.002500 0.000399Average 0.000464 0.085371 0.000302 0.001727 0.000346
Best value 0.000320 0.003570 0.000230 0.000544 0.000251
Table 6. MSE for different kinds of BRBES using PO and SO using BRBaDE, ANFIS, ANN, and thefmincon of testing datasets from Facebook.
MSE MSE MSE MSE MSE
Testing Dataset fmincon BRBES PO and SO Using BRBaDE PO and SO Using ANN ANFISfor Conjunctive BRB BRBaDE for Disjunctive BRB
1st fold 0.000080 0.003910 0.000080 0.001200 0.0000872nd fold 0.000730 0.001140 0.000770 0.007600 0.0006853rd fold 0.000280 0.001220 0.000290 0.000713 0.0001974th fold 0.000600 0.001140 0.000610 0.000820 0.0005775th fold 0.000160 0.004950 0.000200 0.000333 0.000140Average 0.000370 0.002472 0.000390 0.002133 0.000337
Best value 0.000080 0.001140 0.000080 0.000333 0.000087
To have more detailed analysis of the results, the root mean square error (RMSE), mean absolutepercentage error (MAPE), and mean absolute error (MAE) were calculated on the test dataset as shownin Table 7. From the table, it can be observed that PO and SO optimization using BRBaDE had betterresults compared to fmincon, PO and SO using conjunctive BRB, ANN, and ANFIS. Regarding MAEand MAPE values, similar phenomena can be seen.
Table 7. Comparison of root mean square error (RMSE), mean absolute percentage error (MAPE),and mean absolute error (MAE) for different kinds of BRBES using PO and SO using BRBaDE, ANFIS,ANN, and the fmincon of testing datasets from Facebook.
Evaluation Matrix fmincon BRBES PO and SO Using BRBaDE PO and SO Using BRBaDE ANN ANFISfor Disjunctive BRB for Conjunctive BRB
RMSE 0.0089 0.0089 0.0625 0.0346 0.0093MAPE (%) 0.4115 0.3945 5.3671 0.1616 0.1234
MAE 0.00433 0.00415 0.0572 0.0086 0.0063
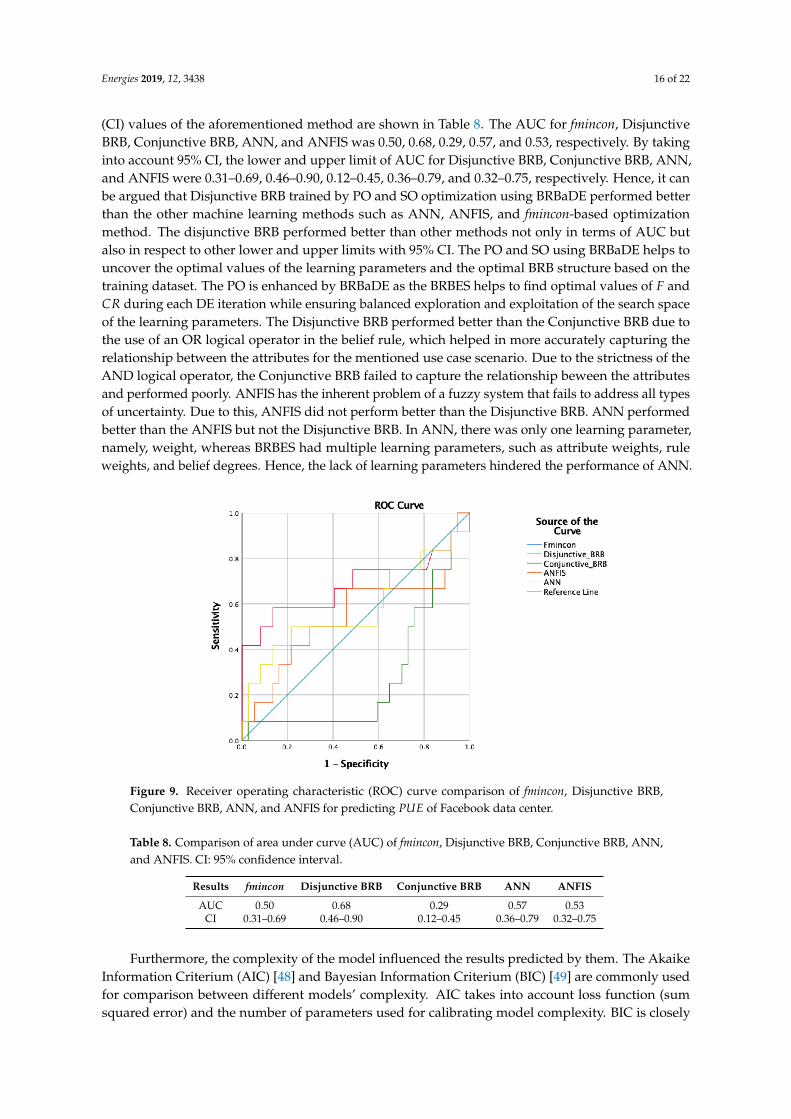
Furthermore, the receiver operating characteristic (ROC) curve provides detailed visualization andcomparative assessment of the different methods [45]. Therefore, it is used in different domains, such asclinical applications [46], atmospheric science, and many other fields [47]. Additionally, the ROC curveis used to assess the accuracy of trained disjunctive and conjunctive BRBs, ANN, and ANFIS for theprediction of PUE. The area under curve (AUC) of the ROC curve is the measurement of the accuracyof a result, where one is the highest value. Usually, ROC curves with a larger area and higher AUCvalues are considered better in terms of performance.
Figure 9 illustrates the ROC curves of fmincon, Disjunctive BRB, Conjunctive BRB, ANN,and ANFIS for predicting the PUE of the Facebook data center. The AUC and confidence-interval
Energies 2019, 12, 3438 16 of 22
(CI) values of the aforementioned method are shown in Table 8. The AUC for fmincon, DisjunctiveBRB, Conjunctive BRB, ANN, and ANFIS was 0.50, 0.68, 0.29, 0.57, and 0.53, respectively. By takinginto account 95% CI, the lower and upper limit of AUC for Disjunctive BRB, Conjunctive BRB, ANN,and ANFIS were 0.31–0.69, 0.46–0.90, 0.12–0.45, 0.36–0.79, and 0.32–0.75, respectively. Hence, it canbe argued that Disjunctive BRB trained by PO and SO optimization using BRBaDE performed betterthan the other machine learning methods such as ANN, ANFIS, and fmincon-based optimizationmethod. The disjunctive BRB performed better than other methods not only in terms of AUC butalso in respect to other lower and upper limits with 95% CI. The PO and SO using BRBaDE helps touncover the optimal values of the learning parameters and the optimal BRB structure based on thetraining dataset. The PO is enhanced by BRBaDE as the BRBES helps to find optimal values of F andCR during each DE iteration while ensuring balanced exploration and exploitation of the search spaceof the learning parameters. The Disjunctive BRB performed better than the Conjunctive BRB due tothe use of an OR logical operator in the belief rule, which helped in more accurately capturing therelationship between the attributes for the mentioned use case scenario. Due to the strictness of theAND logical operator, the Conjunctive BRB failed to capture the relationship beween the attributesand performed poorly. ANFIS has the inherent problem of a fuzzy system that fails to address all typesof uncertainty. Due to this, ANFIS did not perform better than the Disjunctive BRB. ANN performedbetter than the ANFIS but not the Disjunctive BRB. In ANN, there was only one learning parameter,namely, weight, whereas BRBES had multiple learning parameters, such as attribute weights, ruleweights, and belief degrees. Hence, the lack of learning parameters hindered the performance of ANN.
Figure 9. Receiver operating characteristic (ROC) curve comparison of fmincon, Disjunctive BRB,Conjunctive BRB, ANN, and ANFIS for predicting PUE of Facebook data center.
Table 8. Comparison of area under curve (AUC) of fmincon, Disjunctive BRB, Conjunctive BRB, ANN,and ANFIS. CI: 95% confidence interval.
Results fmincon Disjunctive BRB Conjunctive BRB ANN ANFIS
AUC 0.50 0.68 0.29 0.57 0.53CI 0.31–0.69 0.46–0.90 0.12–0.45 0.36–0.79 0.32–0.75
Furthermore, the complexity of the model influenced the results predicted by them. The AkaikeInformation Criterium (AIC) [48] and Bayesian Information Criterium (BIC) [49] are commonly usedfor comparison between different models’ complexity. AIC takes into account loss function (sumsquared error) and the number of parameters used for calibrating model complexity. BIC is closely
Energies 2019, 12, 3438 17 of 22
related to AIC, which is also based on likelihood function. However, the penalty of the parameters iscomparatively higher for BIC. Therefore, AIC and BIC are used to compare the complexity betweenfmincon-based BRBES optimization, PO, and SO using BRBaDE for disjunctive and conjunctive BRB,ANN, and ANFIS. Table 9 shows the results of AIC and BIC comparisons among the methods.Among the different methods, the Disjunctive BRB was preferable as it contained lesser values for AICand BIC. Thus, the model demonstrates its reliability compared to the other models.
Table 9. Model-complexity analysis for fmincon, Disjunctive BRB, Conjunctive BRB, ANFIS, and ANN.
Model Selection Methods fmincon BRBESPO and SO Using BRBaDE PO and SO Using
ANN ANFISfor Disjunctive BRB RBaDE for Conjunctive BRB
AIC −276.273 −352.307 −248.372 −194.379 −342.287
BIC −110.82 −270.628 −82.9185 −87.5673 −227.098
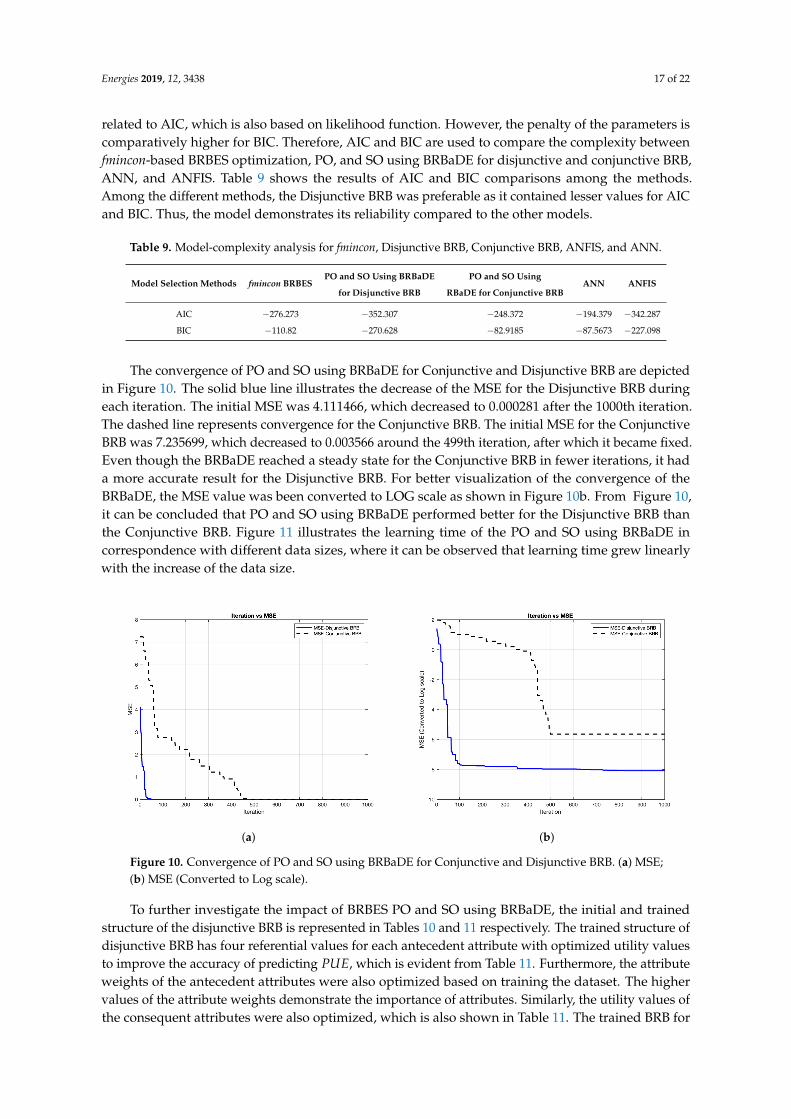
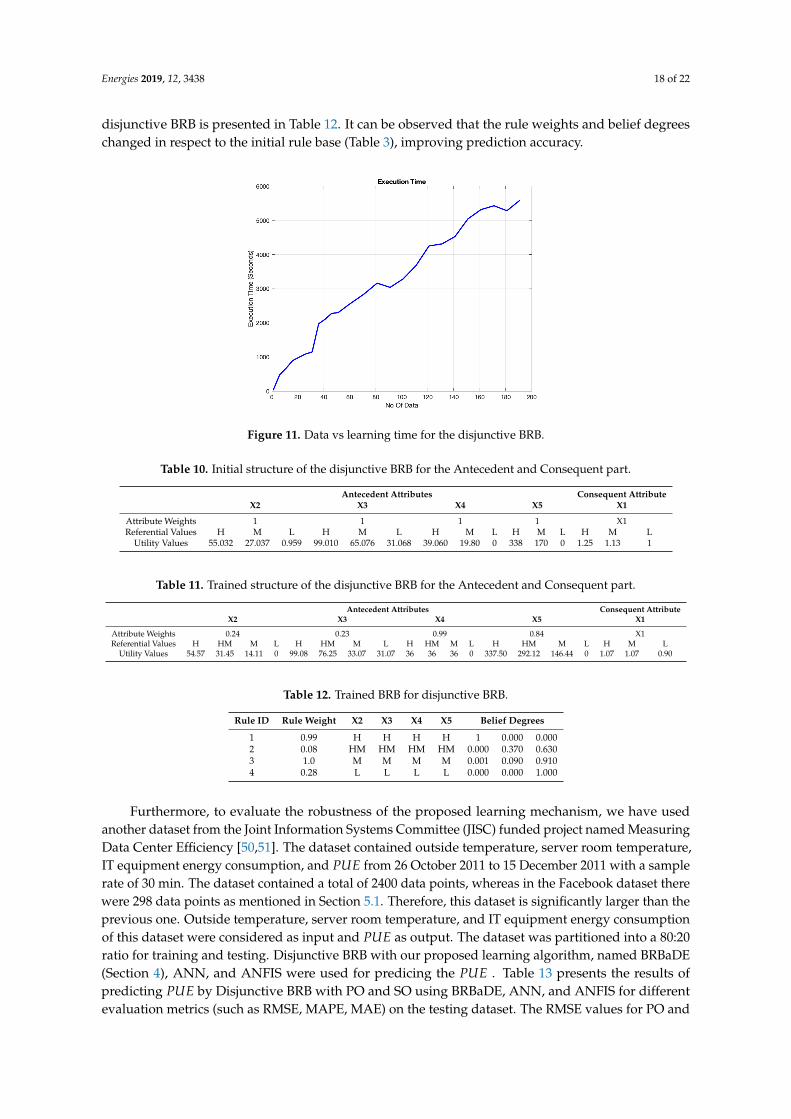
The convergence of PO and SO using BRBaDE for Conjunctive and Disjunctive BRB are depictedin Figure 10. The solid blue line illustrates the decrease of the MSE for the Disjunctive BRB duringeach iteration. The initial MSE was 4.111466, which decreased to 0.000281 after the 1000th iteration.The dashed line represents convergence for the Conjunctive BRB. The initial MSE for the ConjunctiveBRB was 7.235699, which decreased to 0.003566 around the 499th iteration, after which it became fixed.Even though the BRBaDE reached a steady state for the Conjunctive BRB in fewer iterations, it hada more accurate result for the Disjunctive BRB. For better visualization of the convergence of theBRBaDE, the MSE value was been converted to LOG scale as shown in Figure 10b. From Figure 10,it can be concluded that PO and SO using BRBaDE performed better for the Disjunctive BRB thanthe Conjunctive BRB. Figure 11 illustrates the learning time of the PO and SO using BRBaDE incorrespondence with different data sizes, where it can be observed that learning time grew linearlywith the increase of the data size.
(a) (b)
Figure 10. Convergence of PO and SO using BRBaDE for Conjunctive and Disjunctive BRB. (a) MSE;(b) MSE (Converted to Log scale).
To further investigate the impact of BRBES PO and SO using BRBaDE, the initial and trainedstructure of the disjunctive BRB is represented in Tables 10 and 11 respectively. The trained structure ofdisjunctive BRB has four referential values for each antecedent attribute with optimized utility valuesto improve the accuracy of predicting PUE, which is evident from Table 11. Furthermore, the attributeweights of the antecedent attributes were also optimized based on training the dataset. The highervalues of the attribute weights demonstrate the importance of attributes. Similarly, the utility values ofthe consequent attributes were also optimized, which is also shown in Table 11. The trained BRB for
Energies 2019, 12, 3438 18 of 22
disjunctive BRB is presented in Table 12. It can be observed that the rule weights and belief degreeschanged in respect to the initial rule base (Table 3), improving prediction accuracy.
Figure 11. Data vs learning time for the disjunctive BRB.
Table 10. Initial structure of the disjunctive BRB for the Antecedent and Consequent part.
Antecedent Attributes Consequent AttributeX2 X3 X4 X5 X1
Attribute Weights 1 1 1 1 X1Referential Values H M L H M L H M L H M L H M L
Utility Values 55.032 27.037 0.959 99.010 65.076 31.068 39.060 19.80 0 338 170 0 1.25 1.13 1
Table 11. Trained structure of the disjunctive BRB for the Antecedent and Consequent part.
Antecedent Attributes Consequent AttributeX2 X3 X4 X5 X1
Attribute Weights 0.24 0.23 0.99 0.84 X1Referential Values H HM M L H HM M L H HM M L H HM M L H M L
Utility Values 54.57 31.45 14.11 0 99.08 76.25 33.07 31.07 36 36 36 0 337.50 292.12 146.44 0 1.07 1.07 0.90
Table 12. Trained BRB for disjunctive BRB.
Rule ID Rule Weight X2 X3 X4 X5 Belief Degrees
1 0.99 H H H H 1 0.000 0.0002 0.08 HM HM HM HM 0.000 0.370 0.6303 1.0 M M M M 0.001 0.090 0.9104 0.28 L L L L 0.000 0.000 1.000
Furthermore, to evaluate the robustness of the proposed learning mechanism, we have usedanother dataset from the Joint Information Systems Committee (JISC) funded project named MeasuringData Center Efficiency [50,51]. The dataset contained outside temperature, server room temperature,IT equipment energy consumption, and PUE from 26 October 2011 to 15 December 2011 with a samplerate of 30 min. The dataset contained a total of 2400 data points, whereas in the Facebook dataset therewere 298 data points as mentioned in Section 5.1. Therefore, this dataset is significantly larger than theprevious one. Outside temperature, server room temperature, and IT equipment energy consumptionof this dataset were considered as input and PUE as output. The dataset was partitioned into a 80:20ratio for training and testing. Disjunctive BRB with our proposed learning algorithm, named BRBaDE(Section 4), ANN, and ANFIS were used for predicing the PUE . Table 13 presents the results ofpredicting PUE by Disjunctive BRB with PO and SO using BRBaDE, ANN, and ANFIS for differentevaluation metrics (such as RMSE, MAPE, MAE) on the testing dataset. The RMSE values for PO and

Energies 2019, 12, 3438 19 of 22
SO using BRBaDE, ANN, and ANFIS are 0.0139, 0.01418, and 0.0138 respectively. The MAPE valuesfor the above-mentioned algorithms are 0.0035, 0.0197, and 0.0074 respectively. Subsequently, 0.0111,0.0115, and 0.0112 are the MAE values for PO and SO using BRBaDE, ANN, and ANFIS respectively.For all the evaluation matrices, it can be observed that PO and SO using BRBaDE has the lowest valuethan the other methods. Thus it can be concluded that Disjunctive BRB with PO and SO using BRBaDEis performing better than ANN, and ANFIS.
Table 13. Comparison of root mean square error (RMSE), mean absolute percentage error (MAPE),and mean absolute error (MAE) for Disjunctive BRB using PO and SO using BRBaDE, ANN, and ANFISof testing datasets from Measuring Data Centre Efficiency project.
Evaluation Matrix PO and SO Using BRBaDE ANN ANFISfor Disjunctive BRB
RMSE 0.0139 0.01418 0.0138MAPE (%) 0.0035 0.0197 0.0074
MAE 0.0111 0.0115 0.0112
Thus from the above discussion it can be seen that PUE prediction using new learning algorithmBRBaDE performed better than the ANN and ANFIS due to its capability of addressing all kinds ofuncertainties in data. Furthermore, new learning algorithm BRBaDE helps to find optimal valuesbetter than the fmincon-based gradient algorithm used in MATLAB.
7. Conclusions
This study presented a BRBES-based learning system as a novel capacity-management techniquefor data centers to automate the monitoring and forecasting of PUE. This helps data-center operatorsto take necessary measures to ensure better PUE values and generate alarms in advance, while there isthe probability of exceeding the threshold value of PUE. Furthermore, an efficient PUE predictionmodel helps to evaluate data-center sensitivity with respect to its operational parameters. All thishelps data centers to become more energy-efficient and sustainable. We provided real-life examplesfrom big IT companies in the industry, and demonstrated the importance of this technique to captureand forecast dynamic nonlinearities of data-center variables. This has resulted in a significant increaseof energy efficiency for these energy-greedy facilities. Furthermore, it was also presented that PO andSO using BRBaDE helped a disjunctive BRB-based BRBES to optimize its learning parameters andthe structure of BRB, which, in turn, helped to achieve a more accurate prediction of the PUE of datacenters. The prediction of disjunctive BRB-based BRBES was compared with other machine-learningtechniques such as ANN and ANFIS. The results showed that disjunctive BRB outperformed ANN andANFIS due to BRBES’s inherent capability of addressing a vast range of uncertainties, optimizationof learning parameters, and structure of the BRB. Furthermore, it was shown that the new PO andSO using a BRBaDE-based learning mechanism performed better than the previous fmincon-basedlearning mechanism of BRBES. Since our model has the flexibility to incorporate different parametersfound in diverse domains, this model has the capability to address the problem of those domains.In this way, the generic capability of our model could be explored. In the future, this mode will be usedin different domains such as health informatics and disaster management to explore its capabilities.
Author Contributions: Conceptualization, K.A., M.S.H., A.-L.K., X.R. and R.U.I.; Methodology R.U.I.; Software,X.R. and R.U.I.; Writing–original draft preparation, X.R. and R.U.I.; Writing–review and editing, R.U.I., K.A.,M.S.H. and A.-L.K.; Supervision, K.A., M.S.H. and A.-L.K.
Funding: The research work was financially supported by the Swedish Research Council (under grant 2014-4251)and the Erasmus Mundus program PERCCOM [52], facilitated by the European Commission.
Acknowledgments: This research was conducted as part of the masters thesis [53] of Xhesika Ruci at the Pervasiveand Mobile Computing Laboratory, Luleå University of Technology, Sweden.
Conflicts of Interest: The authors declare no conflict of interest.

Energies 2019, 12, 3438 20 of 22
References
1. Vidal, J. ‘Tsunami of Data’ could Consume one Fifth of Global Electricity by 2025. 2017.Available online: https://www.climatechangenews.com/2017/12/11/tsunami-data-consume-one-fifth-global-electricity-2025/ (accessed on 31 July 2019).
2. Garg, S.; Kaur, K.; Kaddoum, G.; Gagnon, F.; Rodrigues, J.J. An Efficient Blockchain-based HierarchicalAuthentication Mechanism for Energy Trading in V2G Environment. In Proceedings of the ICC 2019Workshop on Research Advancements in Future Networking Technologies (RAFNET), Shanghai, China,20–24 May 2019.
3. Kaur, K.; Garg, S.; Kaddoum, G.; Ahmed, S.H.; Jayakody, D.N.K. En-OsCo: Energy-aware OsmoticComputing Framework using Hyper-heuristics. In Proceedings of the ACM MobiHoc Workshop onPervasive Systems in the IoT Era, Catania, Italy, 2 July 2019; pp. 19–24.
4. Andrae, A.S.; Edler, T. On global electricity usage of communication technology: Trends to 2030. Challenges2015, 6, 117–157. doi:10.3390/challe6010117. [CrossRef]
5. Qi, W.; Li, J. Towards optimal coordinated operation of distributed internet data center microgrids.In Proceedings of the 2016 IEEE Power and Energy Society General Meeting (PESGM), Boston, MA, USA,17–21 July 2016; pp. 1–5. doi:10.1109/PESGM.2016.7741732. [CrossRef]
6. Fallah, S.; Deo, R.; Shojafar, M.; Conti, M.; Shamshirband, S. Computational intelligence approachesfor energy load forecasting in smart energy management grids: State of the art, future challenges,and research directions. Energies 2018, 11, 596. doi:doi.org/10.3390/en11030596. [CrossRef]
7. Hossain, M.S.; Rahaman, S.; Kor, A.L.; Andersson, K.; Pattinson, C. A belief rule based expert systemfor datacenter PUE prediction under uncertainty. IEEE Trans. Sustain. Comput. 2017, 2, 140–153.doi:10.1109/TSUSC.2017.2697768. [CrossRef]
8. Gao, J. Machine Learning Applications for Data Center Optimization. 2014. Available online: https://ai.google/research/pubs/pub42542 (accessed on 31 July 2019).
9. Geng, H. Data Center Handbook; John Wiley & Sons: Hoboken, NJ, USA, 2014.10. Islam, R.U.; Hossain, M.S.; Andersson, K. A novel anomaly detection algorithm for sensor data
under uncertainty. Soft Comput. 2018, 22, 1623–1639. doi:10.1007/s00500-016-2425-2. [CrossRef]11. Yang, J.B.; Liu, J.; Xu, D.L.; Wang, J.; Wang, H. Optimization models for training belief-rule-based systems.
IEEE Trans. Syst. Man Cybern. 2007, 37, 569–585. doi:10.1109/TSMCA.2007.897606. [CrossRef]12. Storn, R.; Price, K. Differential evolution–a simple and efficient heuristic for global optimization over
continuous spaces. J. Glob. Optim. 1997, 11, 341–359. doi:10.1023/A:100820282. [CrossRef]13. Al-Dabbagh, R.D.; Neri, F.; Idris, N.; Baba, M.S. Algorithmic design issues in adaptive differential evolution
schemes: Review and taxonomy. Swarm Evol. Comput. 2018. doi:10.1016/j.swevo.2018.03.008. [CrossRef]14. Islam, R.U.; Hossain, M.S.; Andersson, K. A Novel Differential Evolution Approach to Improve Belief Rule Based
Expert System Learning; Springer: Berlin/Heidelberg, Germany, 2005.15. Yang, L.H.; Wang, Y.M.; Liu, J.; Martínez, L. A joint optimization method on parameter and structure
for belief-rule-based systems. Knowl. Based Syst. 2018, 142, 220–240. doi:10.1016/j.knosys.2017.11.039.[CrossRef]
16. Avelar, V.; Azevedo, D.; French, A.; Power, E.N. PUE: A Comprehensive Examination of the Metric;The Green Grid: London, UK, 2012.
17. Azevedo, D.; Patterson, M.; Pouchet, J.; Tipley, R. Carbon Usage Effectiveness (CUE): A Green Grid Data CenterSustainability Metric; The Green Grid: London, UK, 2010.
18. Azevedo, D.; Belady, S.C.; Pouchet, J. Water Usage Effectiveness (WUE™): A Green Grid DatacenterSustainability Metric; The Green Grid: London, UK, 2011.
19. Banks, M.; Benjamin, E.; Calderwood, T.; Llera, R.G.; J.Pflueger. Electronics Disposal Efficiency (EDE): An ITRecycling Metric For Enterprises and Data Centers; The Green Grid: London, UK, 2013.
20. Bodenski, D. Artificial Intelligence Uses in Data Centers. 2017. Available online: https://www.belden.com/blog/data-centers/artificial-intelligence-uses-in-data-centers (accessed on 31 July 2019).
21. Vigilent Optimizing Mission Critical Cooling. 2018. Available online: http://www.vigilent.com/who-we-serve/by-facility/data-centers/ (accessed on 31 July 2019).
Energies 2019, 12, 3438 21 of 22
22. Rego, C.W. Prognose could be a Game-Changer as the Leading TCO/Predictive Modeling Solution for theData Center Industry. 2017. Available online: http://www.vigilent.com/who-we-serve/by-facility/data-centers/ (accessed on 31 July 2019).
23. Shoukourian, H.; Wilde, T.; Labrenz, D.; Bode, A. Using machine learning for data center coolinginfrastructure efficiency prediction. In Proceedings of the 2017 IEEE International Parallel and DistributedProcessing Symposium Workshops (IPDPSW), Lake Buena Vista, FL, USA, 29 May–2 June 2017; pp. 954–963.
24. Balanici, M.; Pachnicke, S. Server Traffic Prediction Using Machine Learning for Optical Circuit SwitchingScheduling. In Proceedings of the 20th ITG-Symposium Photonic Networks, Leipzig, Germany, 8 May 2019;pp. 1–3.
25. Li, Y.; Wen, Y.; Tao, D.; Guan, K. Transforming cooling optimization for green data center via deepreinforcement learning. IEEE Trans. Cybern. 2019. doi:10.1109/TCYB.2019.2927410. [CrossRef]
26. Haghshenas, K.; Pahlevan, A.; Zapater, M.; Mohammadi, S.; Atienza, D. MAGNETIC: Multi-Agent MachineLearning-Based Approach for Energy Efficient Dynamic Consolidation in Data Centers. IEEE Trans.Serv. Comput. 2019. doi:10.1109/TSC.2019.2919555. [CrossRef]
27. Chang, L.; Zhou, Z.; You, Y.; Yang, L.; Zhou, Z. Belief rule based expert system for classificationproblems with new rule activation and weight calculation procedures. Inf. Sci. 2016, 336, 75–91.doi:10.1016/j.ins.2015.12.009. [CrossRef]
28. Yang, J.B.; Liu, J.; Wang, J.; Sii, H.S.; Wang, H.W. Belief rule-base inference methodology usingthe evidential reasoning approach-RIMER. IEEE Trans. Syst. Man, Cybern. 2006, 36, 266–285.doi:10.1109/TSMCA.2005.851270. [CrossRef]
29. Yang, J.B.; Singh, M.G. An evidential reasoning approach for multiple-attribute decision makingwith uncertainty. IEEE Trans. Syst. Man Cybern. 1994, 24, 1–18. doi:10.1109/21.259681. [CrossRef]
30. Wang, Y.M.; Yang, J.B.; Xu, D.L. Environmental impact assessment using the evidential reasoning approach.Eur. J. Oper. Res. 2006, 174, 1885–1913. doi:10.1016/j.ejor.2004.09.059. [CrossRef]
31. Chang, L.; Sun, J.; Jiang, J.; Li, M. Parameter learning for the belief rule base system in theresidual life probability prediction of metalized film capacitor. Knowl. Based Syst. 2015, 73, 69–80.doi:10.1016/j.knosys.2014.09.006. [CrossRef]
32. Chang, L.; Zhou, Y.; Jiang, J.; Li, M.; Zhang, X. Structure learning for belief rule base expert system: Acomparative study. Knowl. Based Syst. 2013, 39, 159–172. [CrossRef]
33. Wang, Y.M.; Yang, L.H.; Fu, Y.G.; Chang, L.L.; Chin, K.S. Dynamic rule adjustment approach for optimizingbelief rule-base expert system. Knowl. Based Syst. 2016, 96, 40–60. doi:10.1016/j.knosys.2016.01.003.[CrossRef]
34. Zhou, Z.J.; Hu, C.H.; Yang, J.B.; Xu, D.L.; Chen, M.Y.; Zhou, D.H. A sequential learning algorithm for onlineconstructing belief-rule-based systems. Expert Syst. Appl. 2010, 37, 1790–1799. doi:10.1016/j.eswa.2009.07.067.[CrossRef]
35. Chen, Y.W.; Yang, J.B.; Xu, D.L.; Zhou, Z.J.; Tang, D.W. Inference analysis and adaptive training for beliefrule based systems. Expert Syst. Appl. 2011, 38, 12845–12860. doi:10.1016/j.eswa.2011.04.077. [CrossRef]
36. Yang, X.S. Nature-Inspired Optimization Algorithms; Elsevier: Oxford, UK, 2014. doi:10.1016/C2013-0-01368-0.37. Das, S.; Suganthan, P.N. Differential evolution: A survey of the state-of-the-art. IEEE Trans. Evol. Comput.
2011, 15, 4–31. doi:10.1109/TEVC.2010.2059031. [CrossRef]38. Liu, J.; Lampinen, J. A fuzzy adaptive differential evolution algorithm. Soft Comput. 2005, 9, 448–462.
doi:10.1007/s00500-004-0363-x. [CrossRef]39. Leon, M.; Xiong, N. Greedy adaptation of control parameters in differential evolution for global optimization
problems. In Proceedings of the 2015 IEEE Congress on Evolutionary Computation (CEC), Sendai, Japan,25–28 May 2015; pp. 385–392. doi:10.1109/CEC.2015.7256916. [CrossRef]
40. Weather Underground. 2019. Available online: https://www.wunderground.com/(accessed on 31 July 2019).
41. Islam, R.U.; Andersson, K.; Hossain, M.S. A web based belief rule based expert system to predict flood.In Proceedings of the 17th International Conference on Information Integration and Web-BasedApplications & Services, Brussels, Belgium, 11–13 December 2015; pp. 1–8. doi:10.1145/2837185.2837212.[CrossRef]
42. Fielding, R.T. Architectural Styles and the Design of Network-Based Software Architectures. Ph.D. Thesis,University of California, Berkeley, CA, USA, 2000.

Energies 2019, 12, 3438 22 of 22
43. Sabbir Hridoy, M.R.; Hossain, M.S.; Islam, R.U.; Andersson, K. A web based belief rule based expertsystem for assessing flood risk. In Proceedings of the 19th International Conference on InformationIntegration and Web-based Applications & Services, Salzburg, Austria, 4–6 December 2017; pp. 434–440.doi:10.1145/3151759.3151807. [CrossRef]
44. Jang, J.S. ANFIS: Adaptive-network-based fuzzy inference system. IEEE Trans. Syst. Man Cybern. 1993,23, 665–685. doi:10.1109/21.256541. [CrossRef]
45. Gönen, M. Analyzing Receiver Operating Characteristic Curves with SAS; SAS Institute:Amsterdam, The Netherlands, 2007.
46. Hossain, M.S.; Hasan, M.A.; Uddin, M.; Islam, M.M.; Mustafa, R. A belief rule based expert systemto assess lung cancer under uncertainty. In Proceedings of the 2015 18th International Conference onComputer and Information Technology (ICCIT), Dhaka, Bangladesh, 21–23 December 2015; pp. 413–418.doi:10.1109/ICCITechn.2015.7488106. [CrossRef]
47. Zou, K.H.; O´ Malley, A.J.; Mauri, L. Receiver-operating characteristic analysis for evaluating diagnostictests and predictive models. Circulation 2007, 115, 654–657. doi:10.1161/CIRCULATIONAHA.105.594929.[CrossRef] [PubMed]
48. Akaike, H. Fitting autoregressive models for prediction. Ann. Inst. Stat. Math. 1969, 21, 243–247.doi:10.1007/BF02532251. [CrossRef]
49. Schwarz, G. Estimating the dimension of a model. Ann. Stat. 1978, 6, 461–464. doi:10.1214/aos/1176344136.[CrossRef]
50. Pattinson, C.; Cross, R. Measuring data centre efficiency. JISC Green Tech. Rep. 2013.51. Pattinson, C.; Kor, A.L.; Cross, R. Critical issues for data center energy efficiency.
In Green Information Technology; Elsevier: Amsterdam, The Netherland, 2015; pp. 223–248.52. Klimova, A.; Rondeau, E.; Andersson, K.; Porras, J.; Rybin, A.; Zaslavsky, A. An international Master’s
program in green ICT as a contribution to sustainable development. J. Clean. Prod. 2016, 135, 223–239.doi:10.1016/j.jclepro.2016.06.032. [CrossRef]
53. Ruci, X. Capacity Management in Hyper-Scale Datacenters using Predictive Modelling. Master’s Thesis,Luleå University of Technology, Luleå, Sweden, 2019.
© 2019 by the authors. Licensee MDPI, Basel, Switzerland. This article is an open accessarticle distributed under the terms and conditions of the Creative Commons Attribution(CC BY) license (http://creativecommons.org/licenses/by/4.0/).