Embed Size (px)
Citation preview
CAPE AGULHAS MUNICIPALITY MTREF 2018/2019 – 2020/2021 - Version 1 – 23 March 2018
March 2018 1
CAPE AGULHAS
MUNICIPALITY
MEDIUM TERM REVENUE AND
EXPENDITURE FRAMEWORK
2018/2019 TO 2020/2021
ANNUAL BUDGET OF
CAPE AGULHAS
MUNICIPALITY
2018/19 TO 2020/21
MEDIUM TERM REVENUE AND
EXPENDITURE FORECASTS
Copies of this document can be viewed:
In the foyers of all municipal buildings
All public libraries within the municipality
At www.capeagulhas.gov.za
March 2018 3
Table of Contents
PART 1 – ANNUAL BUDGET ...................................................................................................................... 4
1.1 VISION & MISSION ........................................................................................................................................ 4
1.2 MAYOR’S REPORT ....................................................................................................................................... 4
1.3 DRAFT COUNCIL RESOLUTIONS ................................................................................................................ 10
1.4 EXECUTIVE SUMMARY ............................................................................................................................... 11
1.5 OPERATING REVENUE FRAMEWORK ......................................................................................................... 30
1.6 OPERATING EXPENDITURE FRAMEWORK .................................................................................................. 37
1.7 CAPITAL EXPENDITURE .............................................................................................................................. 43
1.8 ANNUAL BUDGET TABLES .......................................................................................................................... 46
2 PART 2 – SUPPORTING DOCUMENTATION ............................................................................. 64
2.1 OVERVIEW OF THE ANNUAL BUDGET PROCESS ......................................................................................... 64
2.2 OVERVIEW OF ALIGNMENT OF ANNUAL BUDGET WITH IDP ....................................................................... 65
2.3 OVERVIEW OF BUDGET RELATED-POLICIES ............................................................................................... 70
2.4 OVERVIEW OF BUDGET ASSUMPTIONS ...................................................................................................... 70
2.5 OVERVIEW OF BUDGET FUNDING ............................................................................................................... 72
2.6 EXPENDITURE ON GRANTS AND RECONCILIATIONS OF UNSPENT FUNDS .................................................. 78
2.7 ALLOCATIONS AND GRANTS MADE BY THE MUNICIPALITY ......................................................................... 81
2.8 COUNCILOR AND EMPLOYEE BENEFITS ..................................................................................................... 82
2.9 MONTHLY TARGETS FOR REVENUE, EXPENDITURE AND CASH FLOW ........................................................ 83
2.10 CONTRACTS HAVING FUTURE BUDGETARY IMPLICATIONS ........................................................................ 90
2.11 CAPITAL EXPENDITURE DETAILS ................................................................................................................ 90
2.12 LEGISLATION COMPLIANCE STATUS ......................................................................................................... 105
2.13 OTHER SUPPORTING DOCUMENTS ........................................................................................................... 106
2.14 MANAGER’S QUALITY CERTIFICATE .......................................................................................................... 114
PART 3 – APPENDICES............................................................................................................................ 115
3.1 APPENDIX A – TARIFF LISTING ................................................................................................................ 115
3.2 APPENDIX B – DRAFT SDBIP ................................................................................................................. 115
3.3 APPENDIX C – MSCOA IMPLEMENTATION PLAN .................................................................................... 115
3.4 APPENDIX D – SERVICE LEVEL STANDARDS........................................................................................... 115

March 2018 4
Part 1 – Annual Budget
1.1 Vision & Mission
Our Vision
Together for excellence
Saam vir uitnemendheid
Sisonke siyagqwesa
Our Mission
To render excellent services through good governance, public ownership and partnership in order
to create a safer environment that will promote socio-economic growth and ensure future financial
sustainability in a prosperous southernmost community
This will be achieved through:
Fairness
Integrity
Accountability and responsibility
Transparency
Innovativeness
Responsiveness
Empathy
1.2 Mayor’s Report
In terms Section 152 of the Constitution of the Republic of South Africa, the objectives of local government are as follows:
a) To provide democratic and accountable government for local communities; b) To ensure the provision of services to communities in a sustainable manner; c) To promote social and economic development; d) To promote a safe and healthy environment; and e) To encourage the involvement of communities and community organisations in the
matters of Local Government. A municipality must strive, within its financial and administrative capacity, to achieve these objective set out in Section 152.

March 2018 5
As Mayor and Council we are committed to the following major focus areas:
- Youth Development - Development and upgrading of Recreational Facilities - Social Development and related projects - Local Economic Development (LED) - Beautification of Communities - Sport Development - Uplift and support elderlies - Safety and Security of the Community
In order to achieve or goals in the focus areas identified, it is imperative that we:
- Spend at least 95% of our budget allocations; - Tighten our oversite responsibility in each and every department (Financial monitoring and
reporting); - Be open minded, responsive and caring; - Work closer as a collective and respect one another’s job and responsibility; and - Employ capable officials who can contribute to service delivery. - Ensure sustained financial viability for maximum development support; - Sound financial administration; - Ensure internal control over municipality’s financial activities; - Maximise Revenue potential through effective debt collection and credit control practices; - Effective and efficient management of the municipality’s assets and motor vehicle fleet to
optimise the economic benefit over the useful live of the asset; - Develop and implement ICT Governance to realise the following benefits:
o Integrates and institutionalise good practices to ensure that the ICT component supports the business objectives
o The organisation will use ICT Governance Framework to drive the Stakeholders’ values.
o The organisation will also understand and manage the associated IT risks. - Provide an effective and efficient financial management service to external and internal
stakeholders in respect of council’s assets, liabilities, revenue and expenditure in a sustained manner;
Cape Agulhas Local Municipality, like so many other municipalities in South Africa, is faced with various challenges when balancing quality basic services and support to the financial and administrative capabilities of the municipalities. These challenges include, but is not limited to the following: - Ageing Infrastructure as one of the biggest threats to sustainable service delivery; - Population growth putting strain on the municipal infrastructure to keep track of service
delivery demands; - Housing backlogs; - Poverty in the municipal area and the ability to pay for basic services; and - Depletion of Cash Reserves (as highlighted below) This balancing act is further complicated by the unlimited needs of the citizens in the municipal area as discussed later in this report. Financial sustainability is largely influenced by the ability of the municipality to preserve, or even increase, cash resources. Municipalities should as far possible approve budgets that are within
March 2018 6
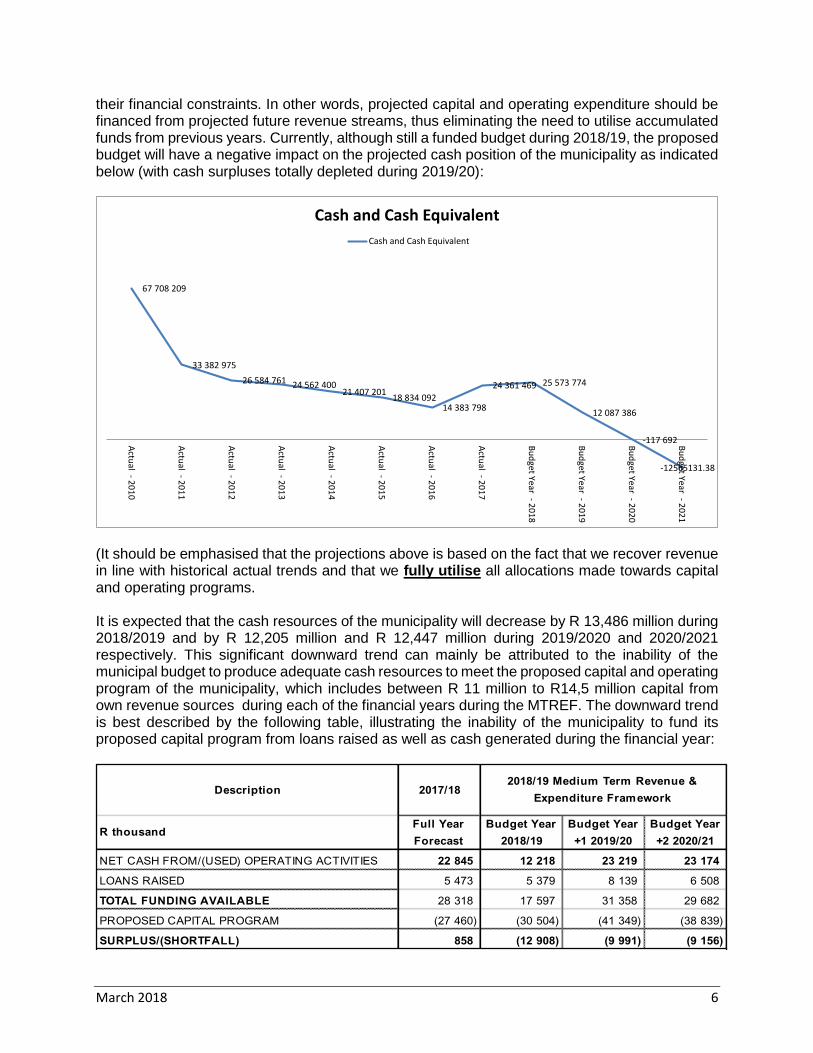
their financial constraints. In other words, projected capital and operating expenditure should be financed from projected future revenue streams, thus eliminating the need to utilise accumulated funds from previous years. Currently, although still a funded budget during 2018/19, the proposed budget will have a negative impact on the projected cash position of the municipality as indicated below (with cash surpluses totally depleted during 2019/20):
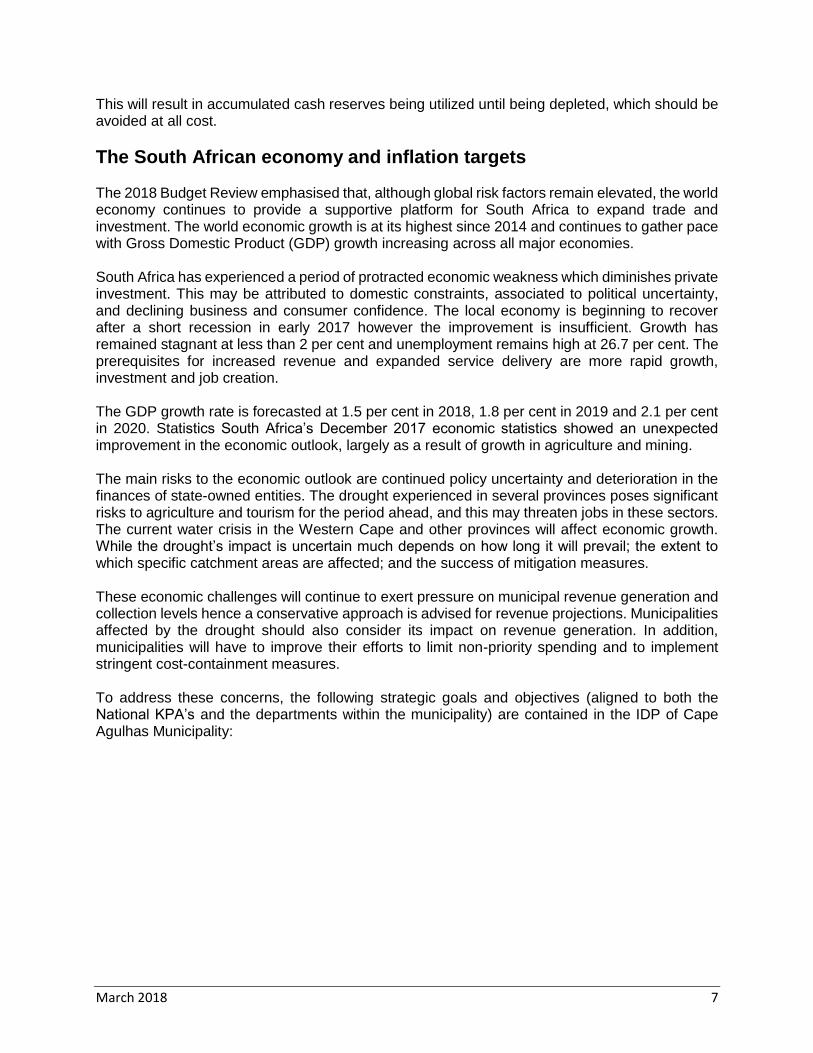
(It should be emphasised that the projections above is based on the fact that we recover revenue in line with historical actual trends and that we fully utilise all allocations made towards capital and operating programs. It is expected that the cash resources of the municipality will decrease by R 13,486 million during 2018/2019 and by R 12,205 million and R 12,447 million during 2019/2020 and 2020/2021 respectively. This significant downward trend can mainly be attributed to the inability of the municipal budget to produce adequate cash resources to meet the proposed capital and operating program of the municipality, which includes between R 11 million to R14,5 million capital from own revenue sources during each of the financial years during the MTREF. The downward trend is best described by the following table, illustrating the inability of the municipality to fund its proposed capital program from loans raised as well as cash generated during the financial year:
67 708 209
33 382 975
26 584 761 24 562 400 21 407 201
18 834 092 14 383 798
24 361 469 25 573 774
12 087 386
-117 692
-12565131.38
Actu
al - 20
10
Actu
al - 20
11
Actu
al - 20
12
Actu
al - 20
13
Actu
al - 20
14
Actu
al - 20
15
Actu
al - 20
16
Actu
al - 20
17
Bu
dge
t Year - 20
18
Bu
dge
t Year - 20
19
Bu
dge
t Year - 20
20
Bu
dge
t Year - 20
21
Cash and Cash Equivalent
Cash and Cash Equivalent
Description 2017/18
R thousandFull Year
Forecast
Budget Year
2018/19
Budget Year
+1 2019/20
Budget Year
+2 2020/21
NET CASH FROM/(USED) OPERATING ACTIVITIES 22 845 12 218 23 219 23 174
LOANS RAISED 5 473 5 379 8 139 6 508
TOTAL FUNDING AVAILABLE 28 318 17 597 31 358 29 682
PROPOSED CAPITAL PROGRAM (27 460) (30 504) (41 349) (38 839)
SURPLUS/(SHORTFALL) 858 (12 908) (9 991) (9 156)
2018/19 Medium Term Revenue &
Expenditure Framework
March 2018 7
This will result in accumulated cash reserves being utilized until being depleted, which should be avoided at all cost.
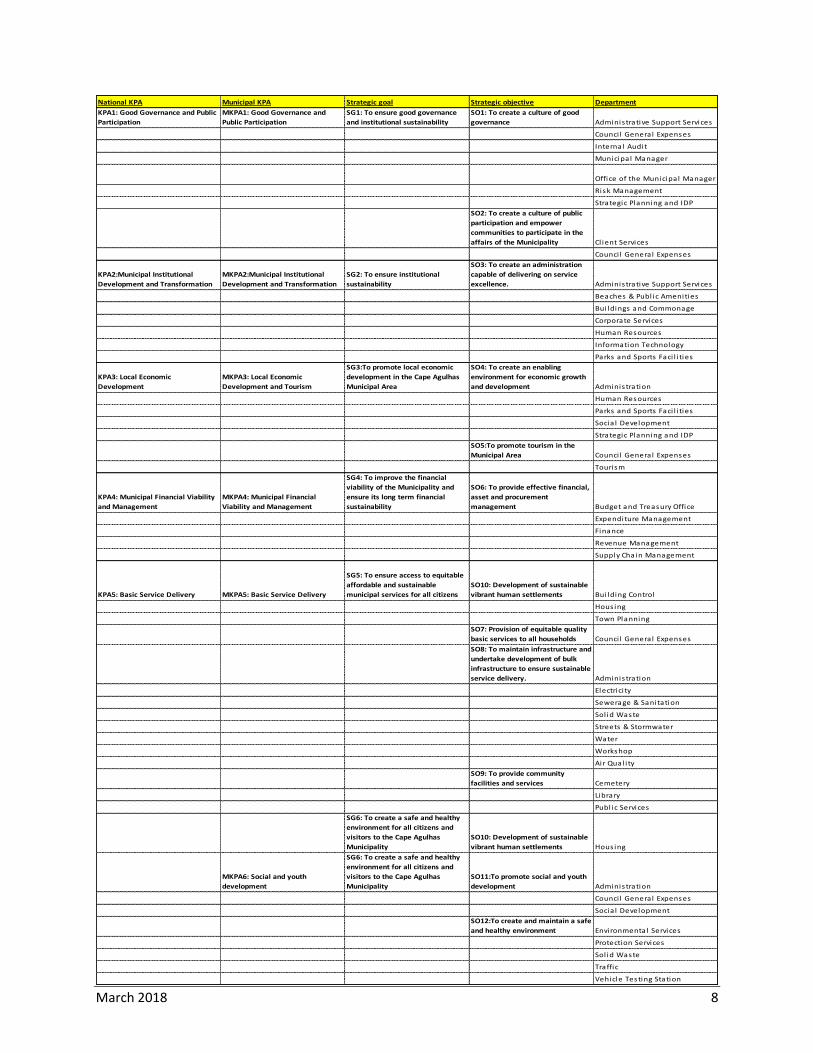
The South African economy and inflation targets The 2018 Budget Review emphasised that, although global risk factors remain elevated, the world economy continues to provide a supportive platform for South Africa to expand trade and investment. The world economic growth is at its highest since 2014 and continues to gather pace with Gross Domestic Product (GDP) growth increasing across all major economies. South Africa has experienced a period of protracted economic weakness which diminishes private investment. This may be attributed to domestic constraints, associated to political uncertainty, and declining business and consumer confidence. The local economy is beginning to recover after a short recession in early 2017 however the improvement is insufficient. Growth has remained stagnant at less than 2 per cent and unemployment remains high at 26.7 per cent. The prerequisites for increased revenue and expanded service delivery are more rapid growth, investment and job creation. The GDP growth rate is forecasted at 1.5 per cent in 2018, 1.8 per cent in 2019 and 2.1 per cent in 2020. Statistics South Africa’s December 2017 economic statistics showed an unexpected improvement in the economic outlook, largely as a result of growth in agriculture and mining. The main risks to the economic outlook are continued policy uncertainty and deterioration in the finances of state-owned entities. The drought experienced in several provinces poses significant risks to agriculture and tourism for the period ahead, and this may threaten jobs in these sectors. The current water crisis in the Western Cape and other provinces will affect economic growth. While the drought’s impact is uncertain much depends on how long it will prevail; the extent to which specific catchment areas are affected; and the success of mitigation measures. These economic challenges will continue to exert pressure on municipal revenue generation and collection levels hence a conservative approach is advised for revenue projections. Municipalities affected by the drought should also consider its impact on revenue generation. In addition, municipalities will have to improve their efforts to limit non-priority spending and to implement stringent cost-containment measures. To address these concerns, the following strategic goals and objectives (aligned to both the National KPA’s and the departments within the municipality) are contained in the IDP of Cape Agulhas Municipality:
March 2018 8
National KPA Municipal KPA Strategic goal Strategic objective Department
KPA1: Good Governance and Public
Participation
MKPA1: Good Governance and
Public Participation
SG1: To ensure good governance
and institutional sustainability
SO1: To create a culture of good
governance Adminis trative Support Services
Counci l Genera l Expenses
Internal Audit
Municipa l Manager
Office of the Municipa l Manager
Risk Management
Strategic Planning and IDP
SO2: To create a culture of public
participation and empower
communities to participate in the
affairs of the Municipality Cl ient Services
Counci l Genera l Expenses
KPA2:Municipal Institutional
Development and Transformation
MKPA2:Municipal Institutional
Development and Transformation
SG2: To ensure institutional
sustainability
SO3: To create an administration
capable of delivering on service
excellence. Adminis trative Support Services
Beaches & Publ ic Amenities
Bui ldings and Commonage
Corporate Services
Human Resources
Information Technology
Parks and Sports Faci l i ties
KPA3: Local Economic
Development
MKPA3: Local Economic
Development and Tourism
SG3:To promote local economic
development in the Cape Agulhas
Municipal Area
SO4: To create an enabling
environment for economic growth
and development Adminis tration
Human Resources
Parks and Sports Faci l i ties
Socia l Development
Strategic Planning and IDP
SO5:To promote tourism in the
Municipal Area Counci l Genera l Expenses
Tourism
KPA4: Municipal Financial Viability
and Management
MKPA4: Municipal Financial
Viability and Management
SG4: To improve the financial
viability of the Municipality and
ensure its long term financial
sustainability
SO6: To provide effective financial,
asset and procurement
management Budget and Treasury Office
Expenditure Management
Finance
Revenue Management
Supply Chain Management
KPA5: Basic Service Delivery MKPA5: Basic Service Delivery
SG5: To ensure access to equitable
affordable and sustainable
municipal services for all citizens
SO10: Development of sustainable
vibrant human settlements Bui lding Control
Hous ing
Town Planning
SO7: Provision of equitable quality
basic services to all households Counci l Genera l Expenses
SO8: To maintain infrastructure and
undertake development of bulk
infrastructure to ensure sustainable
service delivery. Adminis tration
Electrici ty
Sewerage & Sanitation
Sol id Waste
Streets & Stormwater
Water
Workshop
Air Qual i ty
SO9: To provide community
facilities and services Cemetery
Library
Publ ic Services
SG6: To create a safe and healthy
environment for all citizens and
visitors to the Cape Agulhas
Municipality
SO10: Development of sustainable
vibrant human settlements Hous ing
MKPA6: Social and youth
development
SG6: To create a safe and healthy
environment for all citizens and
visitors to the Cape Agulhas
Municipality
SO11:To promote social and youth
development Adminis tration
Counci l Genera l Expenses
Socia l Development
SO12:To create and maintain a safe
and healthy environment Environmental Services
Protection Services
Sol id Waste
Traffic
Vehicle Testing Station
March 2018 9
The Integrated Development Plan (IDP) is a 5 year strategic developmental plan, setting strategic and budget priorities as required in terms of the Municipal Systems Act of 2000. It is a plan to help us set our budget priorities, so in essence it indicates how Cape Agulhas Municipality will spend its money for the next five years. The IDP should be aligned with the development plans of provincial and national government, and is agreed upon between Cape Agulhas Municipality and the residents during the public participation process. Therefore the IDP enables Cape Agulhas Municipality to make the best use of scarce resources and it also enables the councillors to make decisions based on the needs and priorities of their communities. With the IDP, Cape Agulhas Municipality can:
- Develop a clear vision - Identify its key development priorities - Formulate appropriate strategies - Develop the appropriate organisational structure and systems - Align resources with development priorities
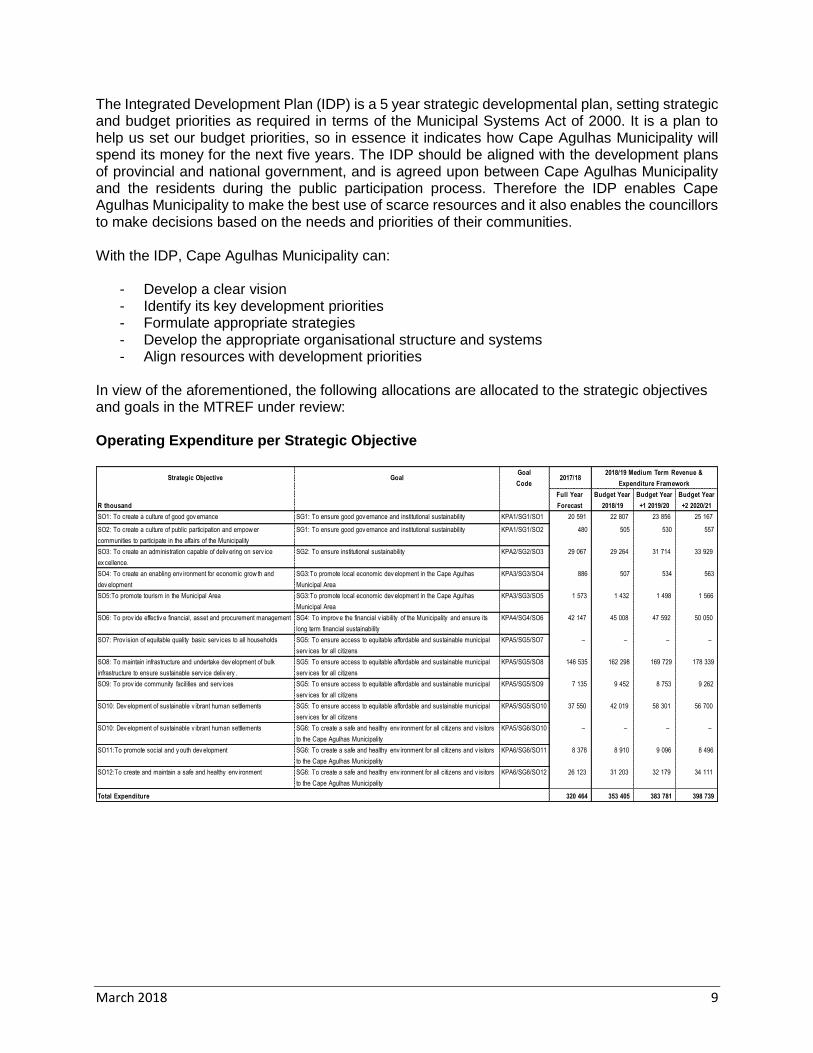
In view of the aforementioned, the following allocations are allocated to the strategic objectives and goals in the MTREF under review: Operating Expenditure per Strategic Objective
Strategic Objective GoalGoal
Code2017/18
R thousand
Full Year
Forecast
Budget Year
2018/19
Budget Year
+1 2019/20
Budget Year
+2 2020/21
SO1: To create a culture of good gov ernance SG1: To ensure good gov ernance and institutional sustainability KPA1/SG1/SO1 20 591 22 807 23 856 25 167
SO2: To create a culture of public participation and empow er
communities to participate in the affairs of the Municipality
SG1: To ensure good gov ernance and institutional sustainability KPA1/SG1/SO2 480 505 530 557
SO3: To create an administration capable of deliv ering on serv ice
ex cellence.
SG2: To ensure institutional sustainability KPA2/SG2/SO3 29 067 29 264 31 714 33 929
SO4: To create an enabling env ironment for economic grow th and
dev elopment
SG3:To promote local economic dev elopment in the Cape Agulhas
Municipal Area
KPA3/SG3/SO4 886 507 534 563
SO5:To promote tourism in the Municipal Area SG3:To promote local economic dev elopment in the Cape Agulhas
Municipal Area
KPA3/SG3/SO5 1 573 1 432 1 498 1 566
SO6: To prov ide effectiv e financial, asset and procurement management SG4: To improv e the financial v iability of the Municipality and ensure its
long term financial sustainability
KPA4/SG4/SO6 42 147 45 008 47 592 50 050
SO7: Prov ision of equitable quality basic serv ices to all households SG5: To ensure access to equitable affordable and sustainable municipal
serv ices for all citizens
KPA5/SG5/SO7 – – – –
SO8: To maintain infrastructure and undertake dev elopment of bulk
infrastructure to ensure sustainable serv ice deliv ery .
SG5: To ensure access to equitable affordable and sustainable municipal
serv ices for all citizens
KPA5/SG5/SO8 146 535 162 298 169 729 178 339
SO9: To prov ide community facilities and serv ices SG5: To ensure access to equitable affordable and sustainable municipal
serv ices for all citizens
KPA5/SG5/SO9 7 135 9 452 8 753 9 262
SO10: Dev elopment of sustainable v ibrant human settlements SG5: To ensure access to equitable affordable and sustainable municipal
serv ices for all citizens
KPA5/SG5/SO10 37 550 42 019 58 301 56 700
SO10: Dev elopment of sustainable v ibrant human settlements SG6: To create a safe and healthy env ironment for all citizens and v isitors
to the Cape Agulhas Municipality
KPA5/SG6/SO10 – – – –
SO11:To promote social and y outh dev elopment SG6: To create a safe and healthy env ironment for all citizens and v isitors
to the Cape Agulhas Municipality
KPA6/SG6/SO11 8 378 8 910 9 096 8 496
SO12:To create and maintain a safe and healthy env ironment SG6: To create a safe and healthy env ironment for all citizens and v isitors
to the Cape Agulhas Municipality
KPA6/SG6/SO12 26 123 31 203 32 179 34 111
Total Expenditure 320 464 353 405 383 781 398 739
2018/19 Medium Term Revenue &
Expenditure Framework
March 2018 10
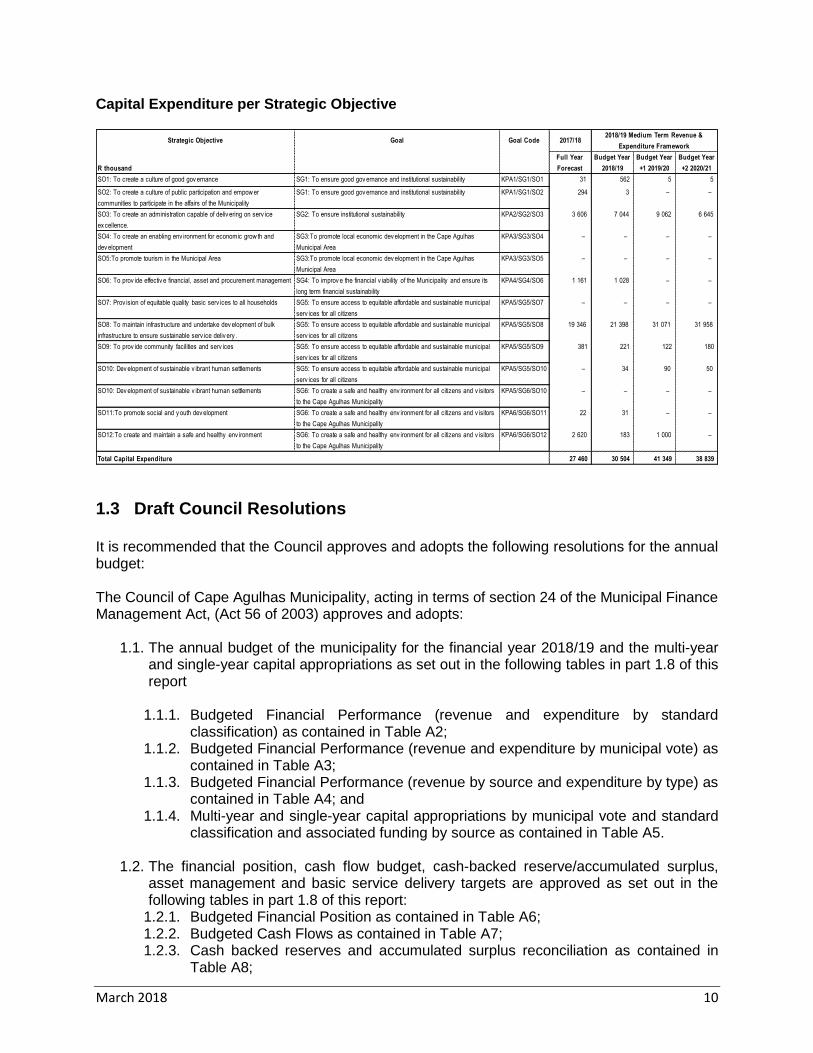
Capital Expenditure per Strategic Objective
1.3 Draft Council Resolutions
It is recommended that the Council approves and adopts the following resolutions for the annual budget: The Council of Cape Agulhas Municipality, acting in terms of section 24 of the Municipal Finance Management Act, (Act 56 of 2003) approves and adopts:
1.1. The annual budget of the municipality for the financial year 2018/19 and the multi-year
and single-year capital appropriations as set out in the following tables in part 1.8 of this report
1.1.1. Budgeted Financial Performance (revenue and expenditure by standard classification) as contained in Table A2;
1.1.2. Budgeted Financial Performance (revenue and expenditure by municipal vote) as contained in Table A3;
1.1.3. Budgeted Financial Performance (revenue by source and expenditure by type) as contained in Table A4; and
1.1.4. Multi-year and single-year capital appropriations by municipal vote and standard classification and associated funding by source as contained in Table A5.
1.2. The financial position, cash flow budget, cash-backed reserve/accumulated surplus,
asset management and basic service delivery targets are approved as set out in the following tables in part 1.8 of this report:
1.2.1. Budgeted Financial Position as contained in Table A6; 1.2.2. Budgeted Cash Flows as contained in Table A7; 1.2.3. Cash backed reserves and accumulated surplus reconciliation as contained in
Table A8;
Strategic Objective Goal Goal Code 2017/18
R thousand
Full Year
Forecast
Budget Year
2018/19
Budget Year
+1 2019/20
Budget Year
+2 2020/21
SO1: To create a culture of good gov ernance SG1: To ensure good gov ernance and institutional sustainability KPA1/SG1/SO1 31 562 5 5
SO2: To create a culture of public participation and empow er
communities to participate in the affairs of the Municipality
SG1: To ensure good gov ernance and institutional sustainability KPA1/SG1/SO2 294 3 – –
SO3: To create an administration capable of deliv ering on serv ice
ex cellence.
SG2: To ensure institutional sustainability KPA2/SG2/SO3 3 606 7 044 9 062 6 645
SO4: To create an enabling env ironment for economic grow th and
dev elopment
SG3:To promote local economic dev elopment in the Cape Agulhas
Municipal Area
KPA3/SG3/SO4 – – – –
SO5:To promote tourism in the Municipal Area SG3:To promote local economic dev elopment in the Cape Agulhas
Municipal Area
KPA3/SG3/SO5 – – – –
SO6: To prov ide effectiv e financial, asset and procurement management SG4: To improv e the financial v iability of the Municipality and ensure its
long term financial sustainability
KPA4/SG4/SO6 1 161 1 028 – –
SO7: Prov ision of equitable quality basic serv ices to all households SG5: To ensure access to equitable affordable and sustainable municipal
serv ices for all citizens
KPA5/SG5/SO7 – – – –
SO8: To maintain infrastructure and undertake dev elopment of bulk
infrastructure to ensure sustainable serv ice deliv ery .
SG5: To ensure access to equitable affordable and sustainable municipal
serv ices for all citizens
KPA5/SG5/SO8 19 346 21 398 31 071 31 958
SO9: To prov ide community facilities and serv ices SG5: To ensure access to equitable affordable and sustainable municipal
serv ices for all citizens
KPA5/SG5/SO9 381 221 122 180
SO10: Dev elopment of sustainable v ibrant human settlements SG5: To ensure access to equitable affordable and sustainable municipal
serv ices for all citizens
KPA5/SG5/SO10 – 34 90 50
SO10: Dev elopment of sustainable v ibrant human settlements SG6: To create a safe and healthy env ironment for all citizens and v isitors
to the Cape Agulhas Municipality
KPA5/SG6/SO10 – – – –
SO11:To promote social and y outh dev elopment SG6: To create a safe and healthy env ironment for all citizens and v isitors
to the Cape Agulhas Municipality
KPA6/SG6/SO11 22 31 – –
SO12:To create and maintain a safe and healthy env ironment SG6: To create a safe and healthy env ironment for all citizens and v isitors
to the Cape Agulhas Municipality
KPA6/SG6/SO12 2 620 183 1 000 –
Total Capital Expenditure 27 460 30 504 41 349 38 839
2018/19 Medium Term Revenue &
Expenditure Framework
March 2018 11
1.2.4. Asset management as contained in Table A9; and 1.2.5. Basic service delivery measurement as contained in Table A10.
2. The Council of Cape Agulhas Municipality, acting in terms of section 75A of the Local
Government: Municipal Systems Act (Act 32 of 2000) approves and adopts with effect from 1 July 2018: 2.1. the tariffs for property rates – as set out in Annexure A, 2.2. the tariffs for electricity – as set out in Annexure A 2.3. the tariffs for the supply of water – as set out in Annexure A 2.4. the tariffs for sanitation services – as set out in Annexure A 2.5. the tariffs for solid waste services – as set out in Annexure A
3. The Council of Cape Agulhas Municipality, acting in terms of 75A of the Local Government: Municipal Systems Act (Act 32 of 2000) approves and adopts with effect from 1 July 2018 the tariffs for other services, as set out in Annexure A.
4. Council takes note of the cash shortfall in the 2019/20 and 2020/21 financial year.
1.4 Executive Summary
1 July 2017 marked the beginning of a new era in the municipal environment with the implementation of mSCOA. As municipality we are committed to the overcome all the challenges to ensure that we maintain the audit benchmark set in previous financial years. . It should also be noted that the implementation of mSCOA has a significant effect on how we classify transactions when compared to previous financial year. Comparative information is not addressed in this report. The information is however available in the budget tables submitted to National and Provincial Treasury.
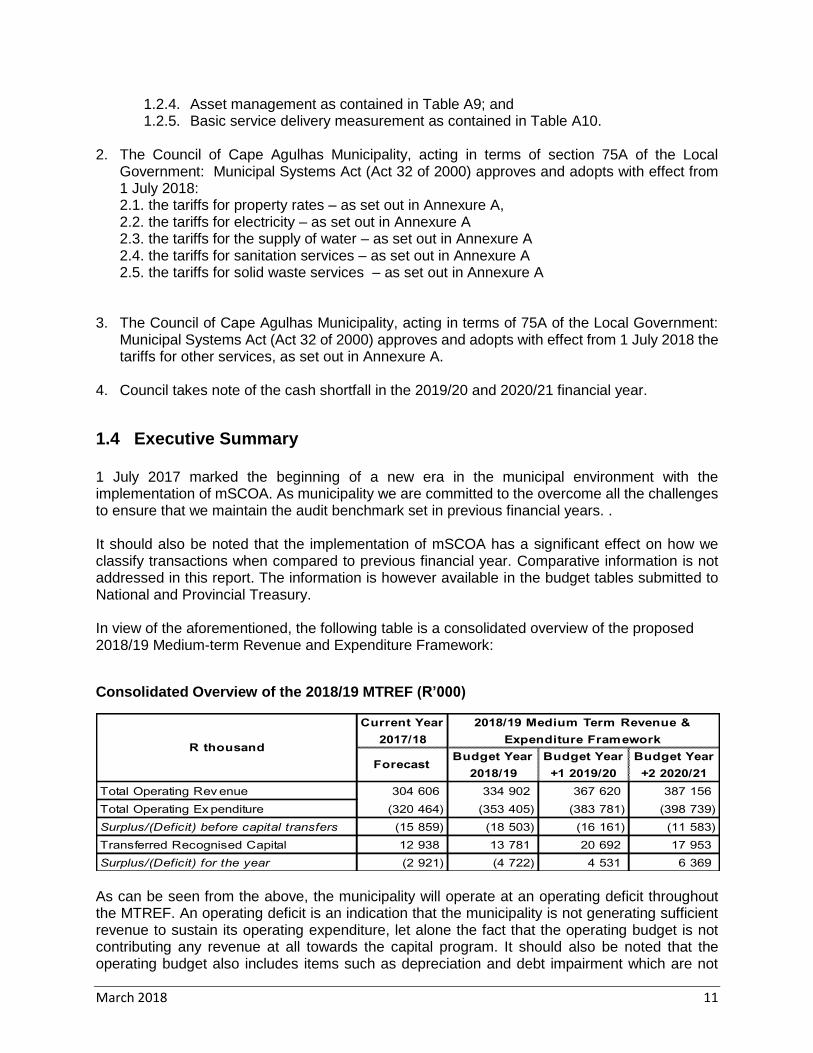
In view of the aforementioned, the following table is a consolidated overview of the proposed 2018/19 Medium-term Revenue and Expenditure Framework:
Consolidated Overview of the 2018/19 MTREF (R’000)
As can be seen from the above, the municipality will operate at an operating deficit throughout the MTREF. An operating deficit is an indication that the municipality is not generating sufficient revenue to sustain its operating expenditure, let alone the fact that the operating budget is not contributing any revenue at all towards the capital program. It should also be noted that the operating budget also includes items such as depreciation and debt impairment which are not
Current Year
2017/18
ForecastBudget Year
2018/19
Budget Year
+1 2019/20
Budget Year
+2 2020/21
Total Operating Rev enue 304 606 334 902 367 620 387 156
Total Operating Ex penditure (320 464) (353 405) (383 781) (398 739)
Surplus/(Deficit) before capital transfers (15 859) (18 503) (16 161) (11 583)
Transferred Recognised Capital 12 938 13 781 20 692 17 953
Surplus/(Deficit) for the year (2 921) (4 722) 4 531 6 369
R thousand
2018/19 Medium Term Revenue &
Expenditure Framework
March 2018 12
considered to be a “cash” expense. These item will not result in an immediate cash outflow. It should however be noted that non-cash items will eventually translate into cash outflow when for example the fully depreciated asset needs to be replaced. Municipalities are advised as a minimum to prepare or strive towards a balanced budget (ie revenue equals expenditure). Although a balanced budget is not necessarily considered a funded budget, it will definitely contribute to the “funded budget principle” over long run. The budget presented is aligned to the following vote structure:
The following 2 departments were added in the current MTREF to ensure more focused approach to the benefit of the municipal area in the areas concerned: Executive and Council – Tourism Engineering Services – Air Quality No changes were made to the Municipal Vote Structure as a whole. In line with the municipal structure, the following revenue and expenditure is appropriated to each vote:
Executive and Council Financial Services & ICT Corporate Services M anagement Services Engineering Services
Council Administration Budget & Treasury Administrative Support Services Director: Management Services Director: Engineering Services
Internal Audit Expenditure Management Building Control Beaches & Holiday Resorts Sewerage Services
Municipal Manager Director: Financial Services & ICT Client Services Buildings and Commonage Refuse Removal Services
Council Support Revenue Management Corporate Services Cemetery Streets & Stormwater
Shared Services Supply Chain Management Human Resources Environmental Services Water
Strategic Services Workshop Information Technology Human Settlements Workshop
Town Planning Information Systems Town Planning Library Services Building Control
Socio & Economic Development Parks and Sports Facilities Electricity Services
Administration Protective Services PMU Unit
Human Resources & Organisational
Development Public Services Air Quality
Tourism Social Development
Traffic & Law Enforcement
Traffic Licencing & Vehicle Testing
Station
Vote Description 2014/15 2015/16 2016/17
R thousandAudited
Outcome
Audited
Outcome
Audited
Outcome
Original
Budget
Adjusted
Budget
Full Year
Forecast
Budget Year
2018/19
Budget Year
+1 2019/20
Budget Year
+2 2020/21
Revenue by Vote
Vote 1 - Ex ecutiv e and Council 14 829 13 680 15 054 28 496 27 796 27 796 30 521 34 019 35 640
Vote 2 - Financial Serv ices & ICT 48 012 60 456 66 814 66 723 68 373 68 373 73 366 79 255 83 064
Vote 3 - Corporate Serv ices 955 2 241 2 490 – – – – – –
Vote 4 - Management Serv ices 41 824 20 664 21 919 45 214 54 214 54 214 60 771 76 595 76 395
Vote 5 - Engineering Serv ices 132 324 149 013 164 150 166 301 167 161 167 161 184 024 198 443 210 009
Total Revenue by Vote 237 944 246 054 270 427 306 734 317 544 317 544 348 683 388 313 405 108
Expenditure by Vote to be appropriated
Vote 1 - Ex ecutiv e and Council 21 144 20 567 23 029 41 823 41 562 41 562 43 109 46 137 47 702
Vote 2 - Financial Serv ices & ICT 32 547 42 083 45 262 47 136 47 669 47 669 51 708 55 218 58 266
Vote 3 - Corporate Serv ices 14 659 14 490 15 784 – – – – – –
Vote 4 - Management Serv ices 50 454 34 557 39 437 63 866 73 347 73 347 85 084 100 787 102 215
Vote 5 - Engineering Serv ices 114 531 130 248 144 192 156 097 157 886 157 886 173 504 181 640 190 556
Total Expenditure by Vote 233 335 241 944 267 704 308 922 320 464 320 464 353 405 383 781 398 739
Surplus/(Deficit) for the year 4 608 4 110 2 723 (2 187) (2 921) (2 921) (4 722) 4 531 6 369
Current Year 2017/182018/19 Medium Term Revenue &
Expenditure Framework

March 2018 13
Community Needs Analysis
The community needs analysis assesses current and future community needs so that future
planning is targeted at meeting local priorities in the most equitable, effective and efficient way
within the parameters of the Municipality’s mandate and resources.
The assessment focused on all needs of the community and not just those that fall within the
functional mandate of the Municipality. For this reason community needs identified in the IDP are
often perceived as a wish list and Municipalities are often seen as misleading the communities by
allowing them to list their needs and or concerns as it creates expectations. It is however important
to list all these needs as they also inform District, Provincial and National Planning. Furthermore,
it is very often a requirement from potential donors that a need be included in the Municipal IDP
before it will be considered.
Needs were classified as Municipal, Provincial, and other. The bulk of the other are needs
identified by the Elim Community which is a private town managed by the Moravian Church of
South Africa. The development of a sustainable service delivery model to this community is a
critical issue which the Municipality needs to resolve and a MOU has already been concluded that
identifies specific areas of co-operation.
Of the 207 needs on the analysis, 69 do not fall within the functional mandate of the Municipality.
This attests to a huge facilitation role on the part of the Municipality if we are going to deliver on
what is needed. The following graph shows the classification of the needs according to
responsibility.
FIGURE - COMMUNITY NEEDS ANALYSIS -RESPONSIBILITY
It was very apparent during the public and ward committee meetings that the strategic agenda of
the Municipality needs to focus on socio economic development. Safety and security, social
Cape Agulhas Municipality,
138
Province, 42
Other, 27
COMMUNITY NEEDS ANALYSIS - RESPONSIBILITY
March 2018 14
development, Economic development /Job creation and Public transport featured on the top of
every wards list and is therefore a cross cutting priority. There is an interrelatedness between
these and collectively these needs to a large extent informed many of the other needs. These
needs accounted for 30% of the needs but were also the driver behind the majority of the other
needs. Libraries, community parks and sport and recreation needs were seen as solutions to keep
the youth busy. The attractiveness of towns and main streets and pavements were seen as
contributors to economic development and mobility.
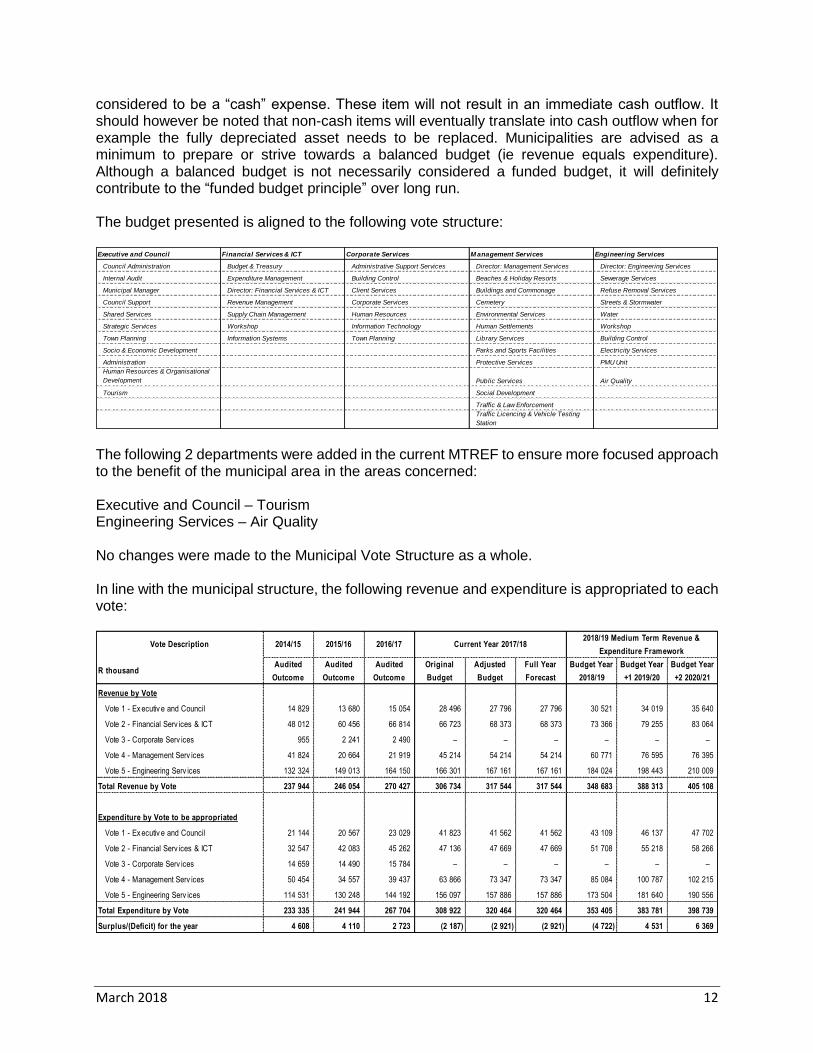
The following graph shows the needs classified per function. By far the greatest need from the
community in terms of infrastructure is for improved roads, pavements and storm water. This
includes Provincial roads. A limitation to this analysis in terms of infrastructure is that the
community do not have insight into the capacity of the Municipality’s bulk infrastructure in terms
of water, sanitation and electricity and do therefore not see it as that much of a need, whereas
roads, streets and pavements are very visible.
FIGURE - COMMUNITY NEEDS ANALYSIS BY FUNCTION
2%3%
9%
3%
9%
1%1%
6%
0%
24%
4%
2%
13%
3%
9%
4%
2%
3%
0%
5%
10%
15%
20%
25%
COMMUNITY NEEDS ANALYSIS BY FUNCTION
March 2018 15
The needs identified above draw awareness to the diversity of the community. CAM must take cognisance that it is governing a diverse society, socially and economically and therefore its policies must aim to satisfy this diversity. Financial Viability As previously mentioned, financial viability is imperative to ensure that high quality services are delivered to the community on a sustainable manner. In order to achieve financial viability, the municipal budget is guided by the approved long term financial plan of the municipality. The municipality further assesses their viability on the model jointly developed by Swartland Municipality and the Western Cape Provincial Treasury. This model assesses 10 key ratios that is considered the most important indicators when assessing the long term viability of the municipality. A weighting is attached to each indicator that will eventually provide the municipality with a viability score out of 100. The municipality should always strive for the maximum score of 100. Any score below 100 will be indicative of “sustainability cracks” that could eventually negatively impact on service delivery in the municipal area.
The 10 indicators, along with the proposed benchmark and weight are included in the following
table:
The 10 indicators provide the municipality with an assessment of the following major areas:
- Revenue Management
- Expenditure Management
- Debtor and Creditor Management
- Cash Management
- Asset Management
- Funding and Reserve Strategy
All the indicators will be discussed below. It should again be noted that these ratios are based on
the full implementation of the proposed capital and operating program and that revenue realise in
line with the most recent actual audited results.
ITEMBenchmark
Viability
Weight
Standard
1
Score
1
Standard
2
Score
2
Standard
3
Score
3
Standard
4
Score
4
Standard
5
Score
5
Asset Test Ratio 200% 10 200% 10 150% 8 100% 5 50% 2 0% 0
Payment Level (Excluding write-off of bad debts) > 95% 15 95% 15 90% 11 85% 6 80% 3 75% 0
Cash Generated from Operations as % of Revenue > 20% 8 20% 8 15% 6 10% 4 5% 2 0% 0
Purchase of PPE as % of Cash Generated < 100% 8 100% 8 110% 6 120% 4 135% 2 150% 0
Cost Coverage (Excluding Unspent Grants) 4 15 4 15 4 10 3 5 2 2 1 0
Debtors Turnover (days) (Before impairment) < 45 days 2 75 2 90 1 110 0 130 0 150 0
Longterm debt as % of Revenue < 40% 5 40% 5 50% 4 75% 3 95% 2 100% 0
Debt servicing cost to Revenue < 5% 8 5% 8 7.50% 6 10% 4 12.50% 2 15% 0
Short-term debt as % of Cash < 100% 4 50% 4 70% 3 80% 2 100% 1 125% 0
Cash Funded Budget over MTREF > R0 25 Yes 25 No 0 0 0 0 0 0 0

March 2018 16
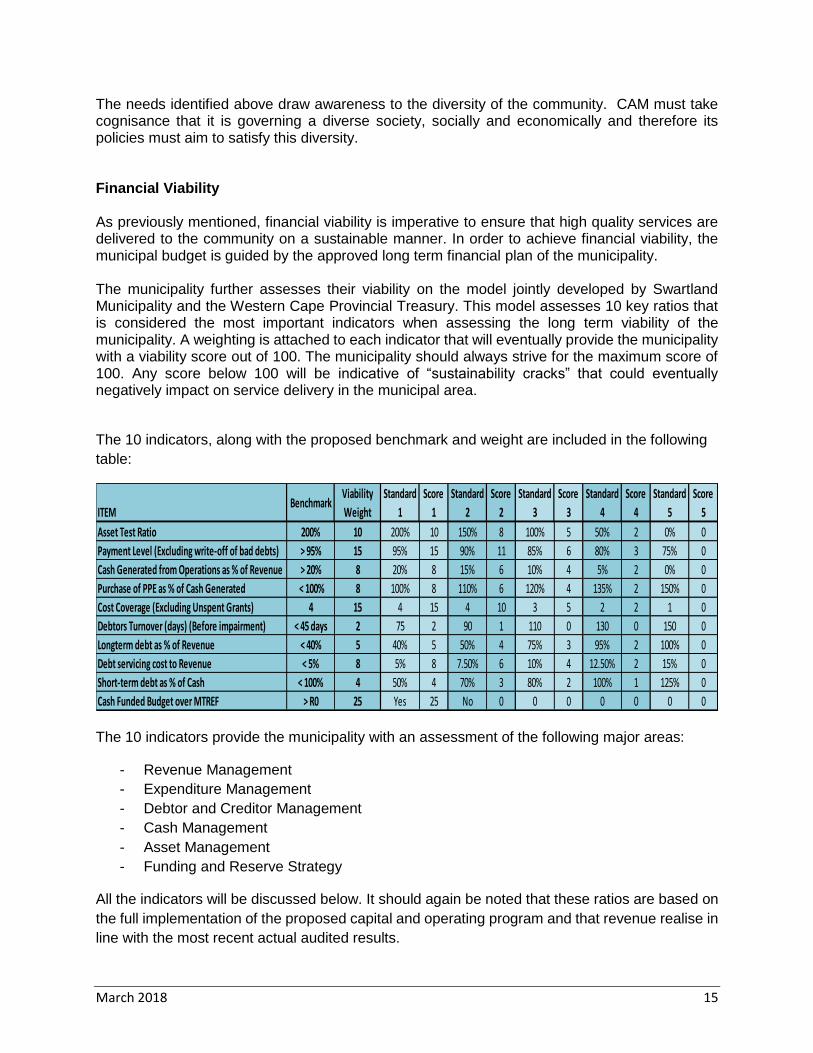
1.4.1.1 Asset Test Ratio
The asset test ratio provides with an indication of the municipality’s ability to settle commitments
if and when they become due. It is calculated as follows ratio between current assets (excluding
inventory) and current liabilities:
A ratio of 2:1 is considered to be appropriate.
This ratio has already slipped below the acceptable level of 2:1 during 2013/2014. It is not
expected that the level of 2:1 will be reached over the MTREF, as this ratio is very dependent on
adequate cash resources. As discussed earlier, the implementation of the proposed budget will
negatively impact on the cash position of the municipality. This negative impact is directly aligned
to the downward trend identified below:
From a viability scoring out of 10 for this indicator, the following is allocated for this indicator:
March 2018 17
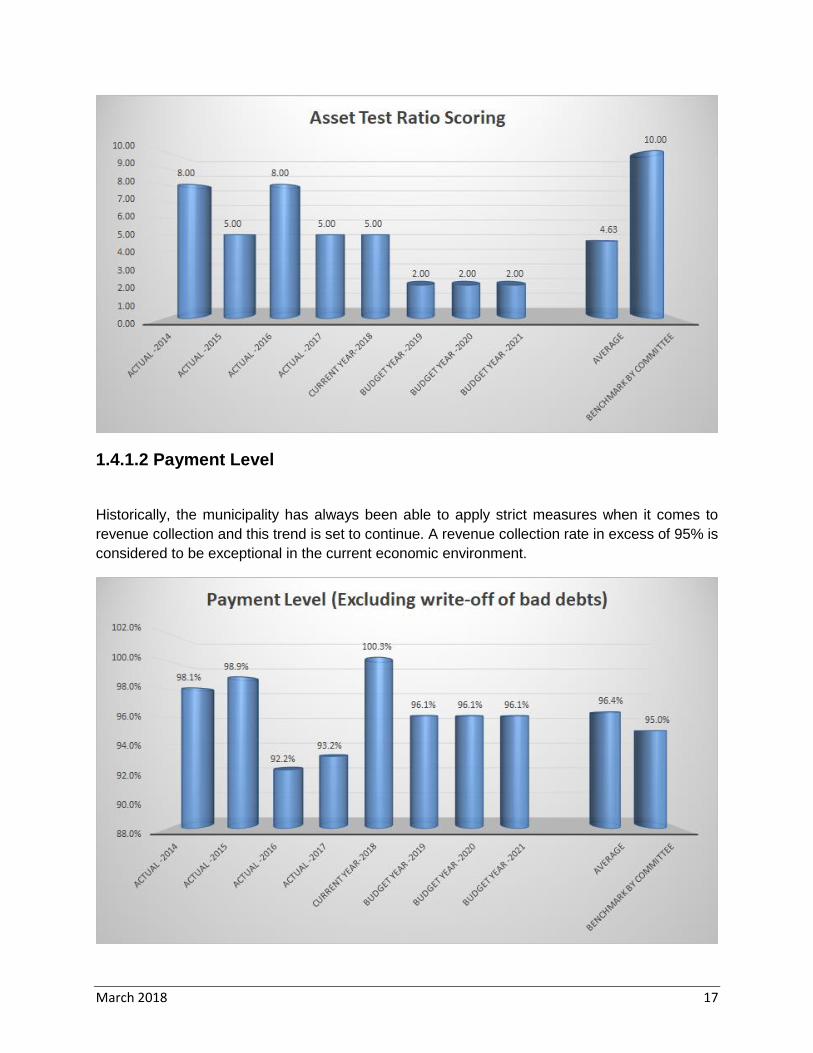
1.4.1.2 Payment Level
Historically, the municipality has always been able to apply strict measures when it comes to
revenue collection and this trend is set to continue. A revenue collection rate in excess of 95% is
considered to be exceptional in the current economic environment.
March 2018 18
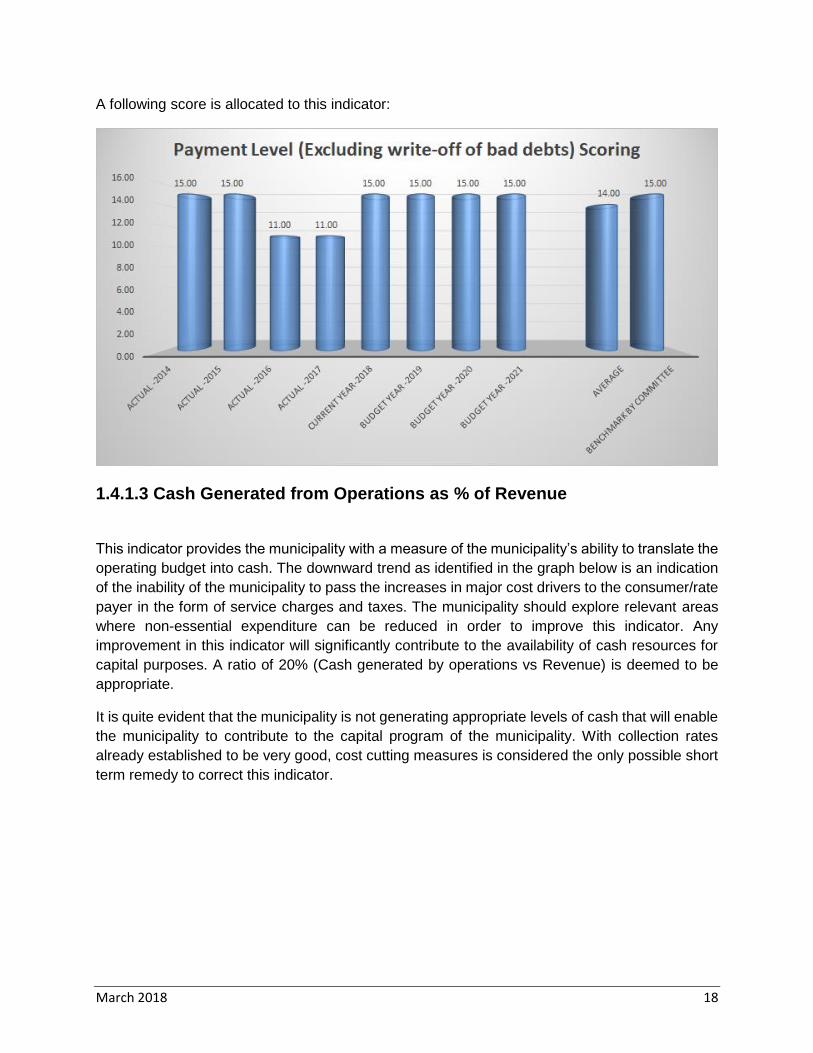
A following score is allocated to this indicator:
1.4.1.3 Cash Generated from Operations as % of Revenue
This indicator provides the municipality with a measure of the municipality’s ability to translate the
operating budget into cash. The downward trend as identified in the graph below is an indication
of the inability of the municipality to pass the increases in major cost drivers to the consumer/rate
payer in the form of service charges and taxes. The municipality should explore relevant areas
where non-essential expenditure can be reduced in order to improve this indicator. Any
improvement in this indicator will significantly contribute to the availability of cash resources for
capital purposes. A ratio of 20% (Cash generated by operations vs Revenue) is deemed to be
appropriate.
It is quite evident that the municipality is not generating appropriate levels of cash that will enable
the municipality to contribute to the capital program of the municipality. With collection rates
already established to be very good, cost cutting measures is considered the only possible short
term remedy to correct this indicator.

March 2018 19
From a possible score of 8, the municipality will score limited points over the MTREF.
March 2018 20
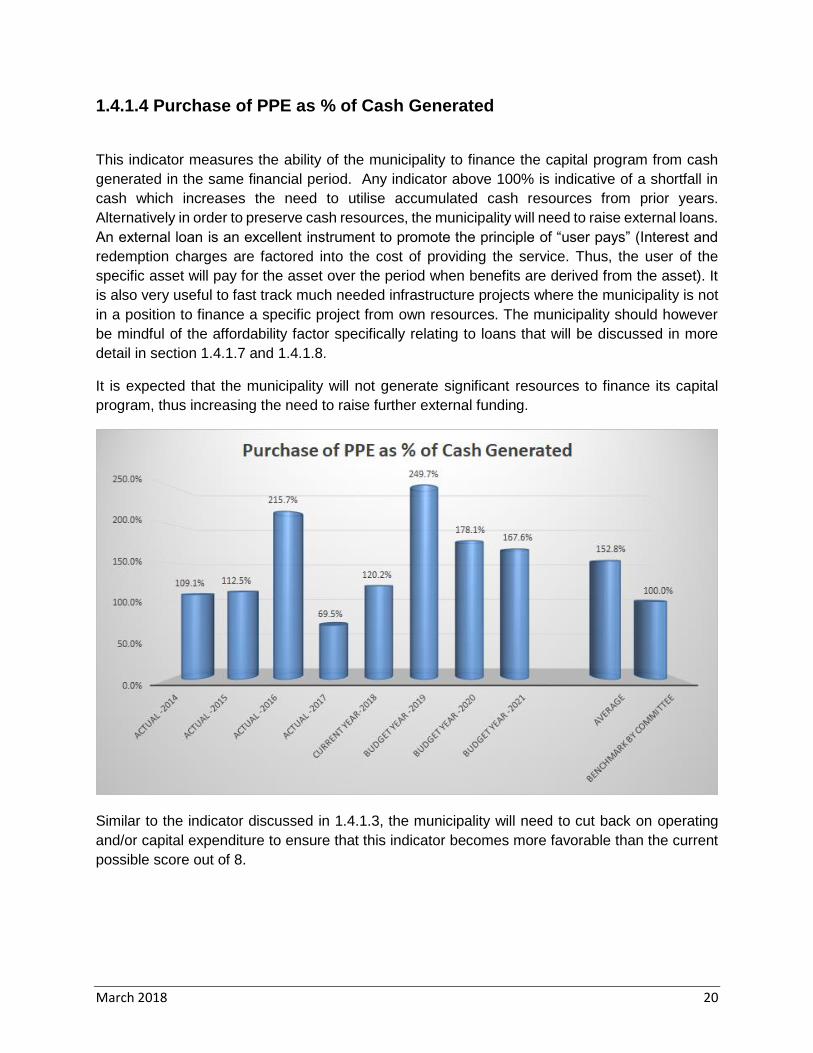
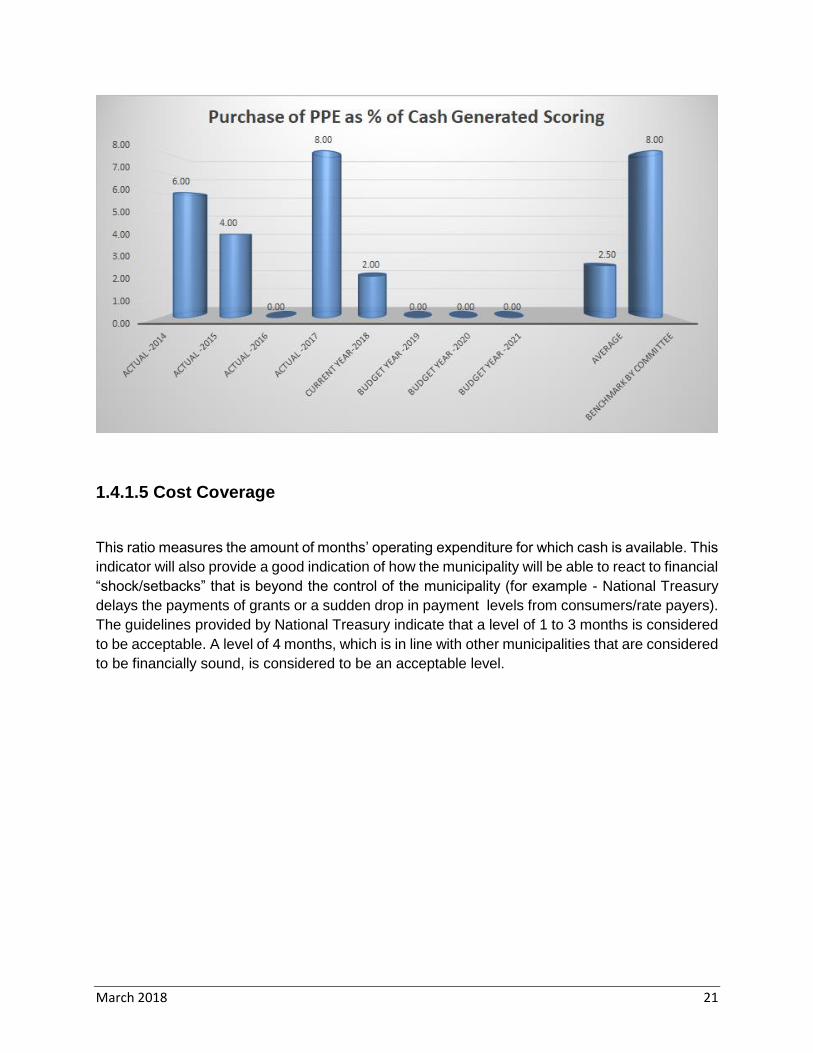
1.4.1.4 Purchase of PPE as % of Cash Generated
This indicator measures the ability of the municipality to finance the capital program from cash
generated in the same financial period. Any indicator above 100% is indicative of a shortfall in
cash which increases the need to utilise accumulated cash resources from prior years.
Alternatively in order to preserve cash resources, the municipality will need to raise external loans.
An external loan is an excellent instrument to promote the principle of “user pays” (Interest and
redemption charges are factored into the cost of providing the service. Thus, the user of the
specific asset will pay for the asset over the period when benefits are derived from the asset). It
is also very useful to fast track much needed infrastructure projects where the municipality is not
in a position to finance a specific project from own resources. The municipality should however
be mindful of the affordability factor specifically relating to loans that will be discussed in more
detail in section 1.4.1.7 and 1.4.1.8.
It is expected that the municipality will not generate significant resources to finance its capital
program, thus increasing the need to raise further external funding.
Similar to the indicator discussed in 1.4.1.3, the municipality will need to cut back on operating
and/or capital expenditure to ensure that this indicator becomes more favorable than the current
possible score out of 8.
March 2018 21
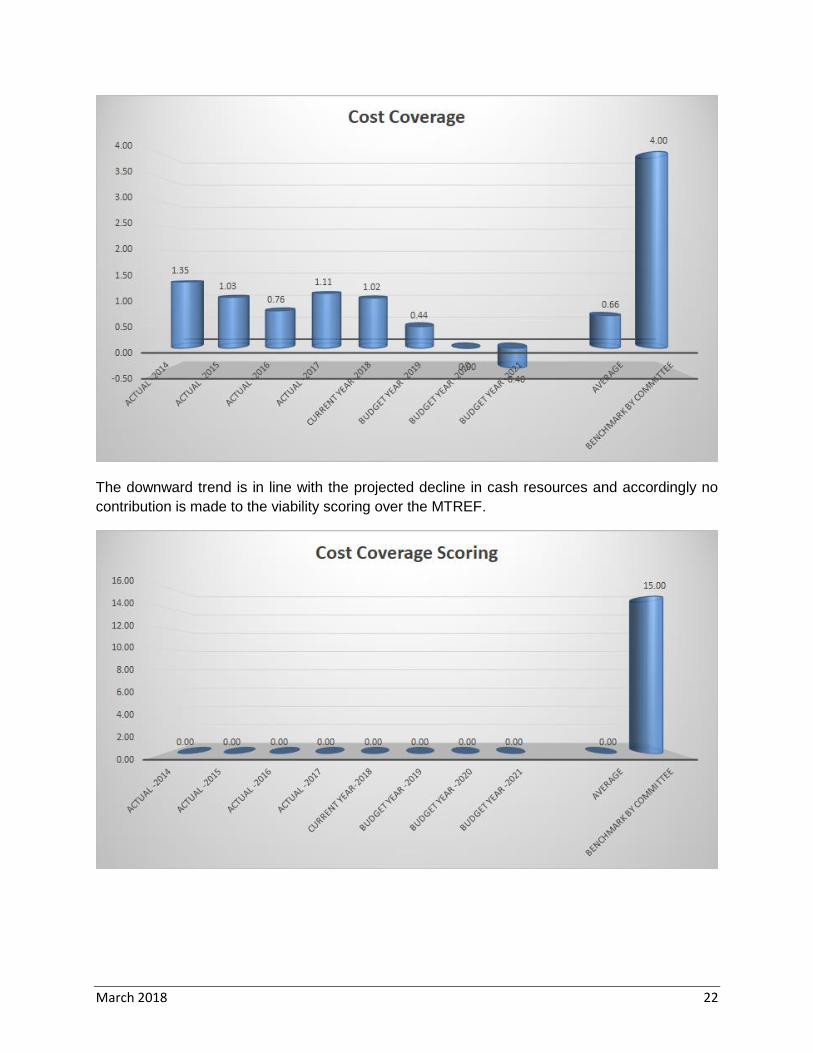
1.4.1.5 Cost Coverage
This ratio measures the amount of months’ operating expenditure for which cash is available. This
indicator will also provide a good indication of how the municipality will be able to react to financial
“shock/setbacks” that is beyond the control of the municipality (for example - National Treasury
delays the payments of grants or a sudden drop in payment levels from consumers/rate payers).
The guidelines provided by National Treasury indicate that a level of 1 to 3 months is considered
to be acceptable. A level of 4 months, which is in line with other municipalities that are considered
to be financially sound, is considered to be an acceptable level.
March 2018 22
The downward trend is in line with the projected decline in cash resources and accordingly no
contribution is made to the viability scoring over the MTREF.
March 2018 23
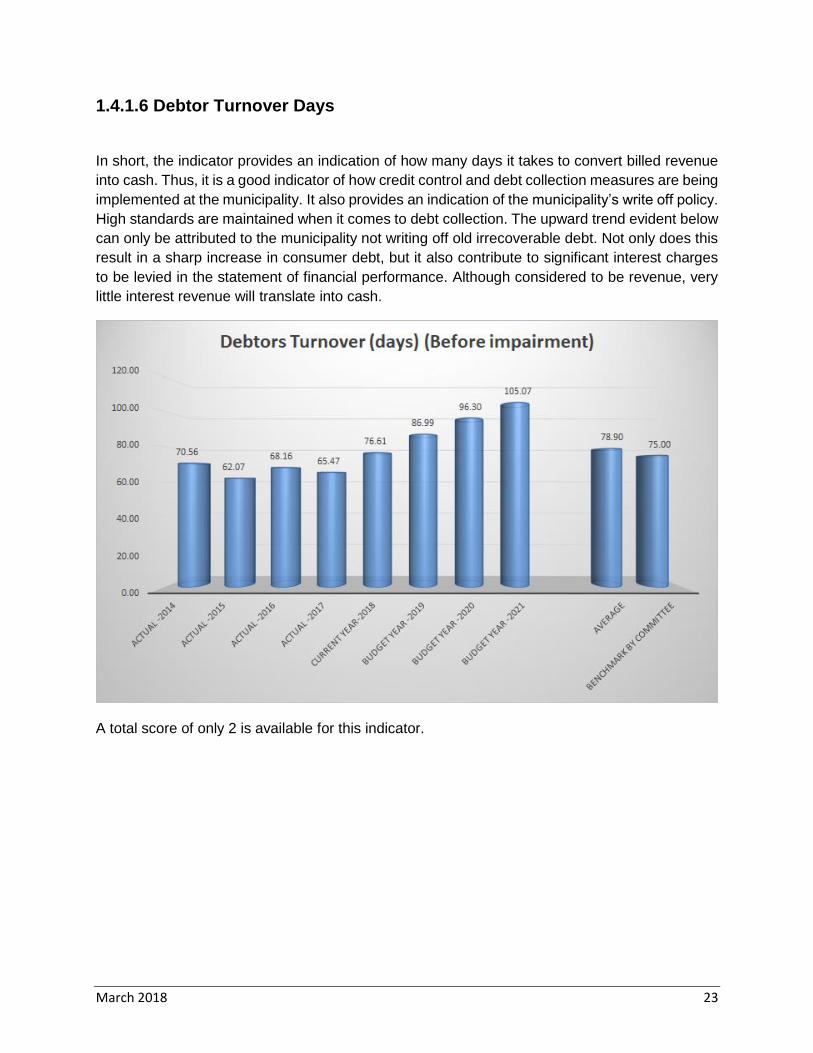
1.4.1.6 Debtor Turnover Days
In short, the indicator provides an indication of how many days it takes to convert billed revenue
into cash. Thus, it is a good indicator of how credit control and debt collection measures are being
implemented at the municipality. It also provides an indication of the municipality’s write off policy.
High standards are maintained when it comes to debt collection. The upward trend evident below
can only be attributed to the municipality not writing off old irrecoverable debt. Not only does this
result in a sharp increase in consumer debt, but it also contribute to significant interest charges
to be levied in the statement of financial performance. Although considered to be revenue, very
little interest revenue will translate into cash.
A total score of only 2 is available for this indicator.

March 2018 24
1.4.1.7 Long Term Debt as % of Revenue
External borrowing is an important part of the funding model of the municipality. Not only does it
instantly provide the municipality with relatively inexpensive capital to fast-track service delivery
and infrastructure backlogs, but it also ensures that the user of the infrastructure pay for the use
over the lifetime of the asset. The current capital program provides for a significant portion of the
program to be financed through external financing.
This indicator provides the municipality with a debt ceiling – the maximum level of external
borrowing that the municipality will be able to accommodate in the in the statement of financial
position before the “affordability” factor becomes a concern.
Currently the municipality is operating well below the debt ceiling of 40%. This is an area that the
municipality should definitely explore as a funding option over and above current borrowings
factored into the MTREF.

March 2018 25
A full score is allocated to this indicator for all periods under review, although it should be noted
that the municipality is not making full use of the benefits available in this area.
March 2018 26
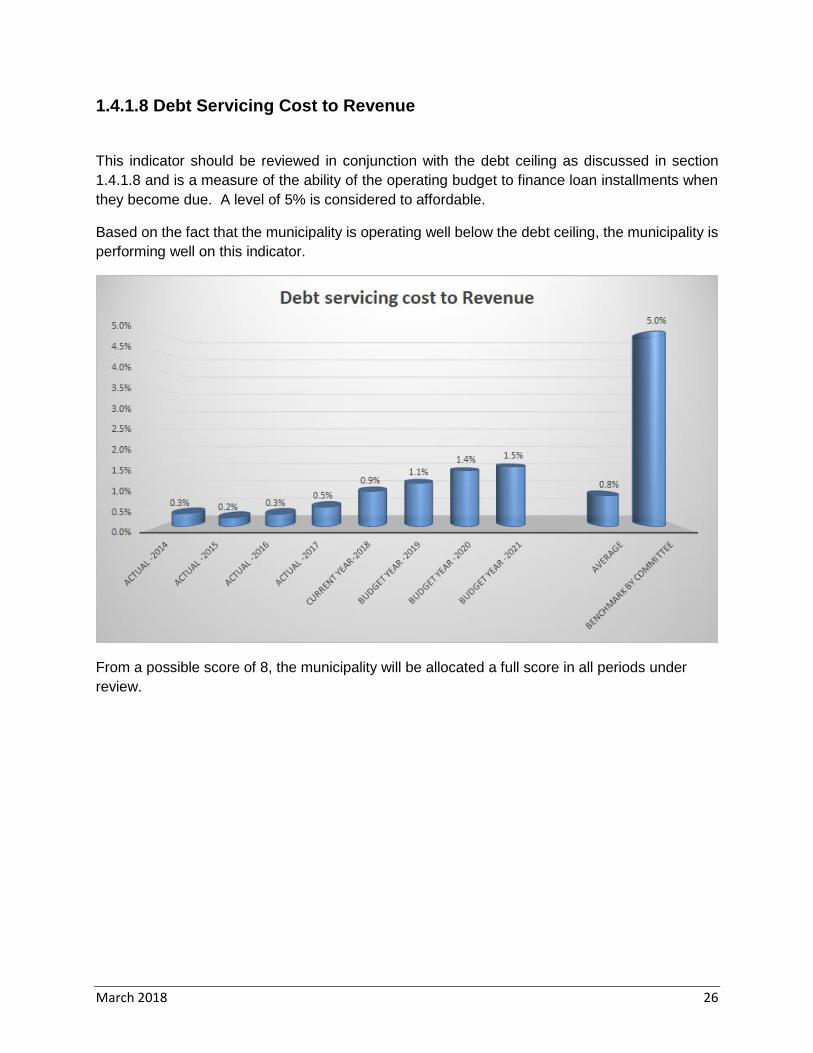
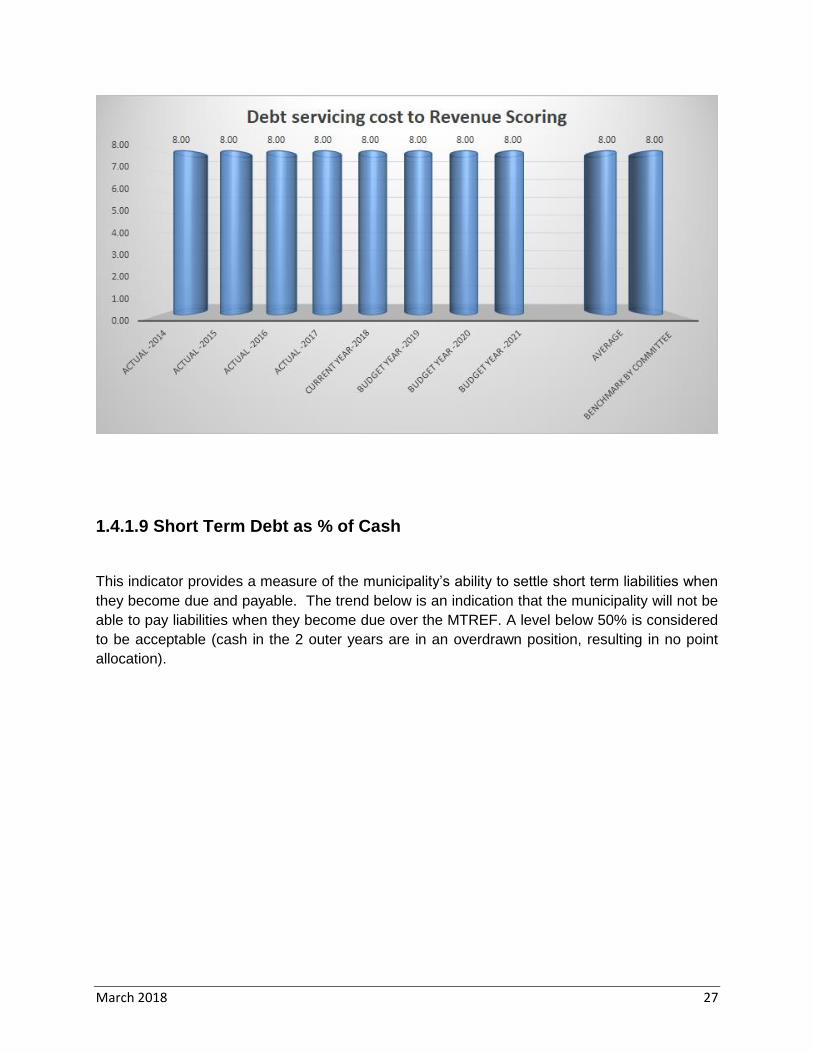
1.4.1.8 Debt Servicing Cost to Revenue
This indicator should be reviewed in conjunction with the debt ceiling as discussed in section
1.4.1.8 and is a measure of the ability of the operating budget to finance loan installments when
they become due. A level of 5% is considered to affordable.
Based on the fact that the municipality is operating well below the debt ceiling, the municipality is
performing well on this indicator.
From a possible score of 8, the municipality will be allocated a full score in all periods under
review.
March 2018 27
1.4.1.9 Short Term Debt as % of Cash
This indicator provides a measure of the municipality’s ability to settle short term liabilities when
they become due and payable. The trend below is an indication that the municipality will not be
able to pay liabilities when they become due over the MTREF. A level below 50% is considered
to be acceptable (cash in the 2 outer years are in an overdrawn position, resulting in no point
allocation).

March 2018 28
As cash resources decline and short term liabilities increase, the scoring allocated to this
indicator will drop to zero.
March 2018 29
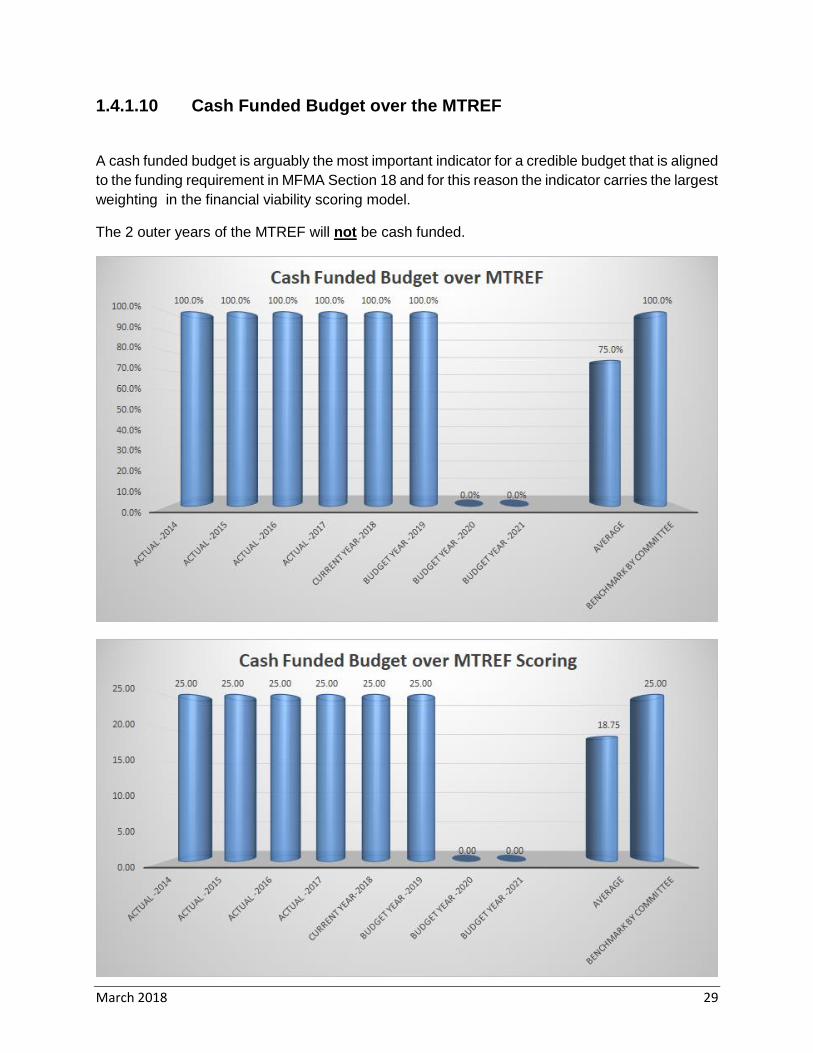
1.4.1.10 Cash Funded Budget over the MTREF
A cash funded budget is arguably the most important indicator for a credible budget that is aligned
to the funding requirement in MFMA Section 18 and for this reason the indicator carries the largest
weighting in the financial viability scoring model.
The 2 outer years of the MTREF will not be cash funded.
March 2018 30
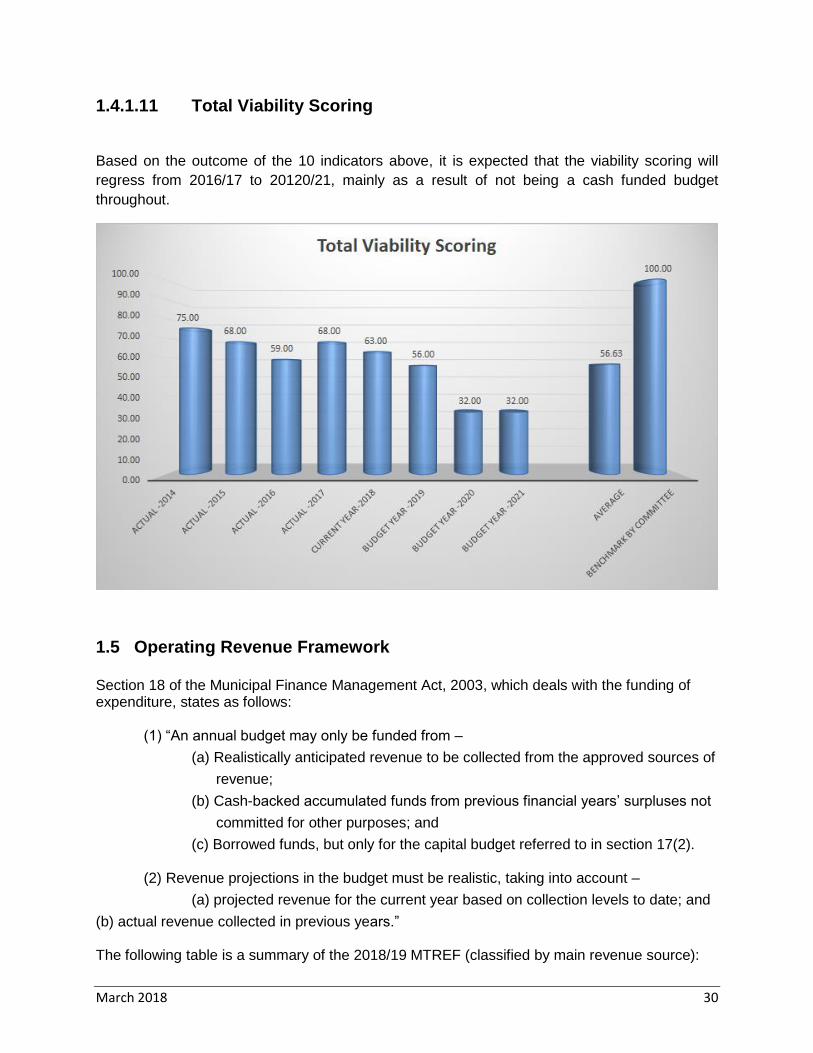
1.4.1.11 Total Viability Scoring
Based on the outcome of the 10 indicators above, it is expected that the viability scoring will
regress from 2016/17 to 20120/21, mainly as a result of not being a cash funded budget
throughout.
1.5 Operating Revenue Framework
Section 18 of the Municipal Finance Management Act, 2003, which deals with the funding of expenditure, states as follows:
(1) “An annual budget may only be funded from –
(a) Realistically anticipated revenue to be collected from the approved sources of
revenue;
(b) Cash-backed accumulated funds from previous financial years’ surpluses not
committed for other purposes; and
(c) Borrowed funds, but only for the capital budget referred to in section 17(2).
(2) Revenue projections in the budget must be realistic, taking into account –
(a) projected revenue for the current year based on collection levels to date; and
(b) actual revenue collected in previous years.”
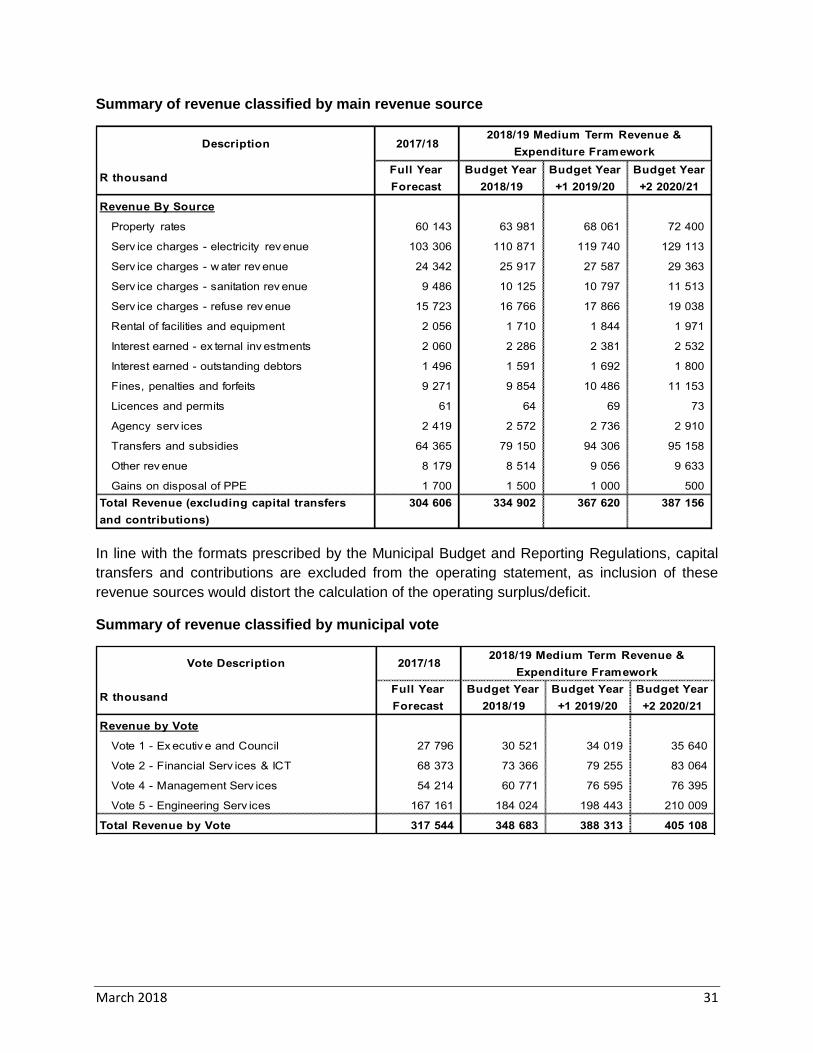
The following table is a summary of the 2018/19 MTREF (classified by main revenue source):
March 2018 31
Summary of revenue classified by main revenue source
In line with the formats prescribed by the Municipal Budget and Reporting Regulations, capital
transfers and contributions are excluded from the operating statement, as inclusion of these
revenue sources would distort the calculation of the operating surplus/deficit.
Summary of revenue classified by municipal vote
Description 2017/18
R thousandFull Year
Forecast
Budget Year
2018/19
Budget Year
+1 2019/20
Budget Year
+2 2020/21
Revenue By Source
Property rates 60 143 63 981 68 061 72 400
Serv ice charges - electricity rev enue 103 306 110 871 119 740 129 113
Serv ice charges - w ater rev enue 24 342 25 917 27 587 29 363
Serv ice charges - sanitation rev enue 9 486 10 125 10 797 11 513
Serv ice charges - refuse rev enue 15 723 16 766 17 866 19 038
Rental of facilities and equipment 2 056 1 710 1 844 1 971
Interest earned - ex ternal inv estments 2 060 2 286 2 381 2 532
Interest earned - outstanding debtors 1 496 1 591 1 692 1 800
Fines, penalties and forfeits 9 271 9 854 10 486 11 153
Licences and permits 61 64 69 73
Agency serv ices 2 419 2 572 2 736 2 910
Transfers and subsidies 64 365 79 150 94 306 95 158
Other rev enue 8 179 8 514 9 056 9 633
Gains on disposal of PPE 1 700 1 500 1 000 500
Total Revenue (excluding capital transfers
and contributions)
304 606 334 902 367 620 387 156
2018/19 Medium Term Revenue &
Expenditure Framework
Vote Description 2017/18
R thousandFull Year
Forecast
Budget Year
2018/19
Budget Year
+1 2019/20
Budget Year
+2 2020/21
Revenue by Vote
Vote 1 - Ex ecutiv e and Council 27 796 30 521 34 019 35 640
Vote 2 - Financial Serv ices & ICT 68 373 73 366 79 255 83 064
Vote 4 - Management Serv ices 54 214 60 771 76 595 76 395
Vote 5 - Engineering Serv ices 167 161 184 024 198 443 210 009
Total Revenue by Vote 317 544 348 683 388 313 405 108
2018/19 Medium Term Revenue &
Expenditure Framework
March 2018 32
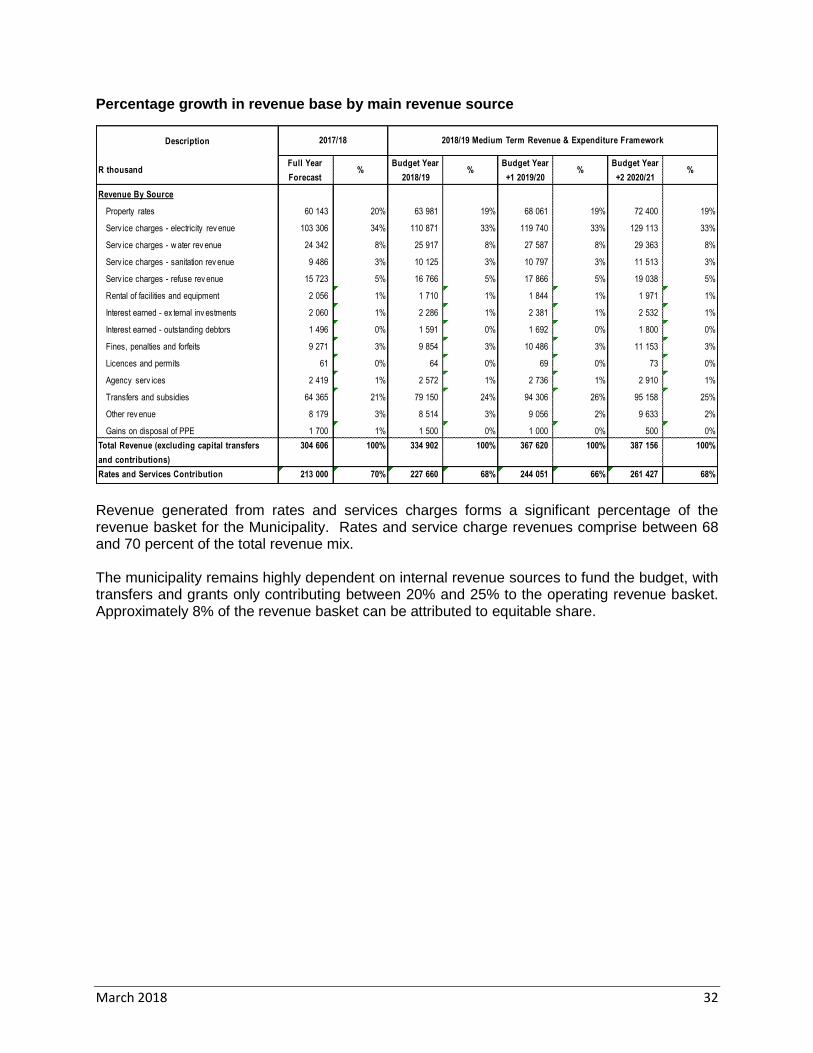
Percentage growth in revenue base by main revenue source
Revenue generated from rates and services charges forms a significant percentage of the revenue basket for the Municipality. Rates and service charge revenues comprise between 68 and 70 percent of the total revenue mix. The municipality remains highly dependent on internal revenue sources to fund the budget, with transfers and grants only contributing between 20% and 25% to the operating revenue basket. Approximately 8% of the revenue basket can be attributed to equitable share.
Description
R thousandFull Year
Forecast%
Budget Year
2018/19%
Budget Year
+1 2019/20%
Budget Year
+2 2020/21%
Revenue By Source
Property rates 60 143 20% 63 981 19% 68 061 19% 72 400 19%
Serv ice charges - electricity rev enue 103 306 34% 110 871 33% 119 740 33% 129 113 33%
Serv ice charges - w ater rev enue 24 342 8% 25 917 8% 27 587 8% 29 363 8%
Serv ice charges - sanitation rev enue 9 486 3% 10 125 3% 10 797 3% 11 513 3%
Serv ice charges - refuse rev enue 15 723 5% 16 766 5% 17 866 5% 19 038 5%
Rental of facilities and equipment 2 056 1% 1 710 1% 1 844 1% 1 971 1%
Interest earned - ex ternal inv estments 2 060 1% 2 286 1% 2 381 1% 2 532 1%
Interest earned - outstanding debtors 1 496 0% 1 591 0% 1 692 0% 1 800 0%
Fines, penalties and forfeits 9 271 3% 9 854 3% 10 486 3% 11 153 3%
Licences and permits 61 0% 64 0% 69 0% 73 0%
Agency serv ices 2 419 1% 2 572 1% 2 736 1% 2 910 1%
Transfers and subsidies 64 365 21% 79 150 24% 94 306 26% 95 158 25%
Other rev enue 8 179 3% 8 514 3% 9 056 2% 9 633 2%
Gains on disposal of PPE 1 700 1% 1 500 0% 1 000 0% 500 0%
Total Revenue (excluding capital transfers
and contributions)
304 606 100% 334 902 100% 367 620 100% 387 156 100%
Rates and Services Contribution 213 000 70% 227 660 68% 244 051 66% 261 427 68%
2017/18 2018/19 Medium Term Revenue & Expenditure Framework

March 2018 33
The following table gives a breakdown of the various operating grants and subsidies allocated to the municipality over the medium term:
Operating Transfers and Grant Receipts
National Treasury continues to encourage municipalities to keep increases in rates, tariffs and other charges as low as possible. Municipalities must justify in their budget documentation all increases in excess of the 5.3 per cent, which is the current projected inflation rate for 2018/19. The municipality budgets for the non-payment of accounts based on past experience of recovery rates. The municipality applies it Credit Control Policy stringently but there are always situations where there are defaults on payment. A recovery rate of approximately 95.85% is factored into the MTREF period.
1.5.1 Property Rates
Property rates cover the cost of the provision of general services. Determining the effective property rate tariff is therefore an integral part of the municipality’s budgeting process. An increase of 7 between 8.5 per cent in the Property Rates tariff is proposed for 2018/19.
Description 2017/18
R thousandFull Year
Forecast
Budget Year
2018/19
Budget Year
+1 2019/20
Budget Year
+2 2020/21
EXPENDITURE:
Operating expenditure of Transfers and Grants
National Government: 27 999 36 089 35 555 39 283
Local Gov ernment Equitable Share 25 190 27 606 29 861 32 338
Energy Efficiency and Demand-side [Schedule 5B] – 5 000 5 000 5 000
Ex panded Public Works Programme Integrated Grant for Municipalities [Schedule 5B] 1 131 1 141 – –
Local Gov ernment Financial Management Grant [Schedule 5B] 118 550 550 550
Municipal Infrastructure Grant [Schedule 5B] 1 560 1 792 144 1 395
Provincial Government: 36 366 43 060 58 751 55 875
Human Settlement Dev elopment 29 450 34 560 50 350 48 540
Library Serv ice Conditional Grant 5 336 7 001 5 915 6 171
Maintenance of Main Roads 84 83 – –
Community Dev elopment Workers 56 56 56 56
Financial Management Support (WC_FMGSG) 1 440 360 330 –
Greenest Municipality (Violence Protection) – 1 000 2 000 1 000
Thusong Centre – – 100 108
Total operating expenditure of Transfers and Grants: 64 365 79 150 94 306 95 158
2018/19 Medium Term Revenue &
Expenditure Framework
March 2018 34
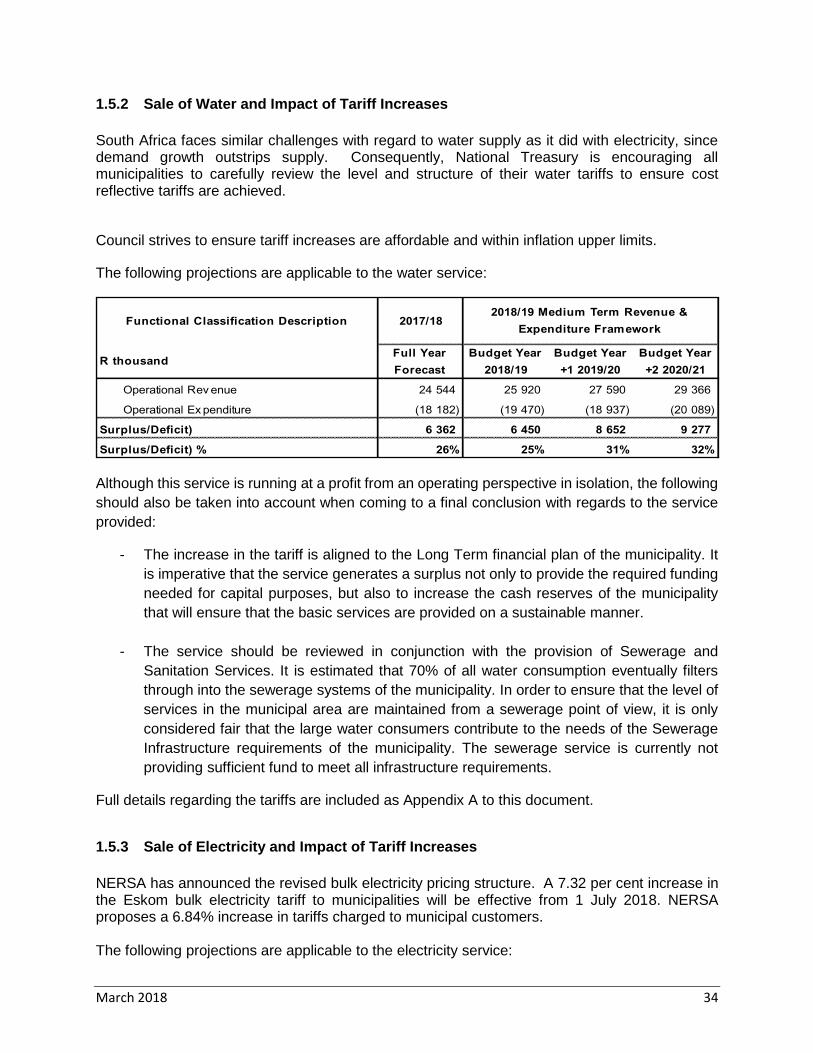
1.5.2 Sale of Water and Impact of Tariff Increases
South Africa faces similar challenges with regard to water supply as it did with electricity, since demand growth outstrips supply. Consequently, National Treasury is encouraging all municipalities to carefully review the level and structure of their water tariffs to ensure cost reflective tariffs are achieved.
Council strives to ensure tariff increases are affordable and within inflation upper limits.
The following projections are applicable to the water service:
Although this service is running at a profit from an operating perspective in isolation, the following
should also be taken into account when coming to a final conclusion with regards to the service
provided:
- The increase in the tariff is aligned to the Long Term financial plan of the municipality. It
is imperative that the service generates a surplus not only to provide the required funding
needed for capital purposes, but also to increase the cash reserves of the municipality
that will ensure that the basic services are provided on a sustainable manner.
- The service should be reviewed in conjunction with the provision of Sewerage and
Sanitation Services. It is estimated that 70% of all water consumption eventually filters
through into the sewerage systems of the municipality. In order to ensure that the level of
services in the municipal area are maintained from a sewerage point of view, it is only
considered fair that the large water consumers contribute to the needs of the Sewerage
Infrastructure requirements of the municipality. The sewerage service is currently not
providing sufficient fund to meet all infrastructure requirements.
Full details regarding the tariffs are included as Appendix A to this document.
1.5.3 Sale of Electricity and Impact of Tariff Increases
NERSA has announced the revised bulk electricity pricing structure. A 7.32 per cent increase in the Eskom bulk electricity tariff to municipalities will be effective from 1 July 2018. NERSA proposes a 6.84% increase in tariffs charged to municipal customers. The following projections are applicable to the electricity service:
Functional Classification Description 2017/18
R thousandFull Year
Forecast
Budget Year
2018/19
Budget Year
+1 2019/20
Budget Year
+2 2020/21
Operational Rev enue 24 544 25 920 27 590 29 366
Operational Ex penditure (18 182) (19 470) (18 937) (20 089)
Surplus/Deficit) 6 362 6 450 8 652 9 277
Surplus/Deficit) % 26% 25% 31% 32%
2018/19 Medium Term Revenue &
Expenditure Framework

March 2018 35
Full details regarding the tariffs are included as Appendix A to this document.
1.5.4 Sanitation and Impact of Tariff Increases
Council strives to ensure tariff increases are affordable and within inflation upper limits.
The following projections are applicable to the sewerage service:
Full details regarding the tariffs are included as Appendix A to this document.
1.5.5 Waste Removal and Impact of Tariff Increases
Council strives to ensure tariff increases are affordable and within inflation upper limits.
The following projections are applicable to the refuse service:
Functional Classification Description 2017/18
R thousandFull Year
Forecast
Budget Year
2018/19
Budget Year
+1 2019/20
Budget Year
+2 2020/21
Operational Rev enue 103 438 116 012 124 893 134 278
Operational Ex penditure (88 063) (100 170) (107 142) (114 390)
Surplus/Deficit) 15 375 15 843 17 751 19 888
Surplus/Deficit) % 15% 14% 14% 15%
2018/19 Medium Term Revenue &
Expenditure Framework
Functional Classification Description 2017/18
R thousandFull Year
Forecast
Budget Year
2018/19
Budget Year
+1 2019/20
Budget Year
+2 2020/21
Operational Rev enue 9 508 10 148 10 822 11 539
Operational Ex penditure (10 497) (11 525) (11 265) (11 349)
Surplus/Deficit) (989) (1 377) (444) 190
Surplus/Deficit) % -10% -14% -4% 2%
2018/19 Medium Term Revenue &
Expenditure Framework
Functional Classification Description 2017/18
R thousandFull Year
Forecast
Budget Year
2018/19
Budget Year
+1 2019/20
Budget Year
+2 2020/21
Operational Rev enue 15 973 16 766 17 866 19 038
Operational Ex penditure (19 319) (21 433) (22 626) (23 274)
Surplus/Deficit) (3 346) (4 667) (4 760) (4 235)
Surplus/Deficit) % -21% -28% -27% -22%
2018/19 Medium Term Revenue &
Expenditure Framework

March 2018 36
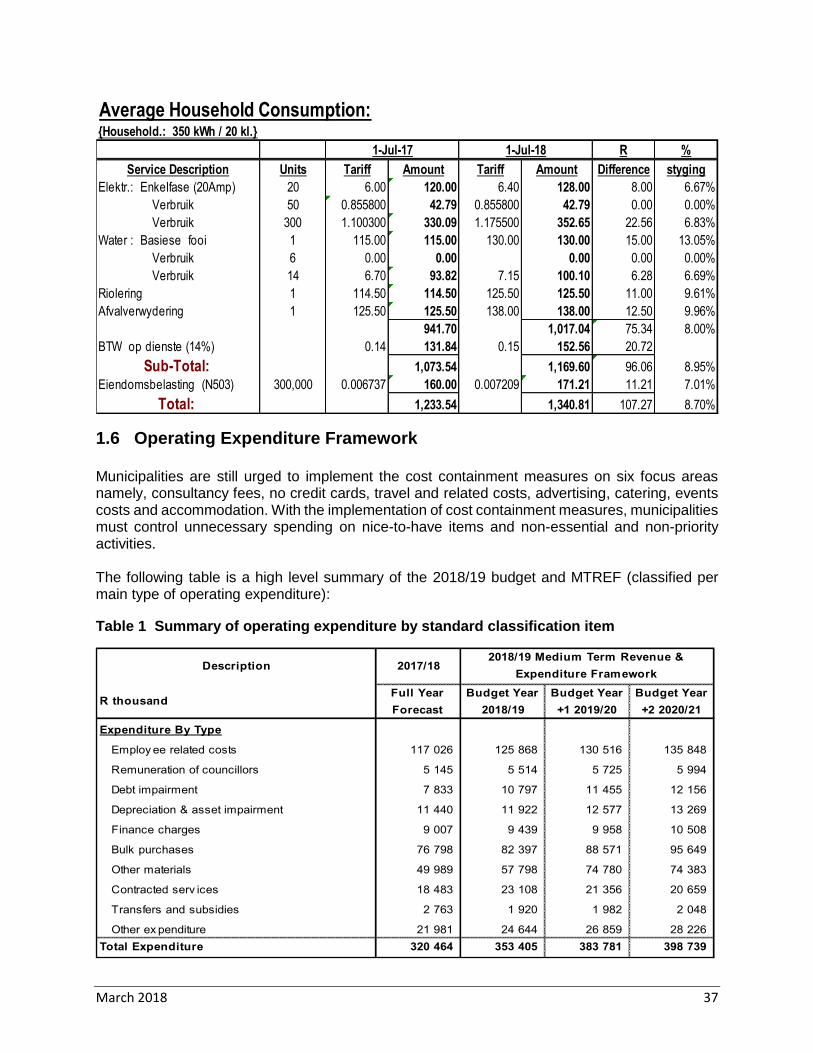
1.5.6 Overall impact of tariff increases on households
Information on the impact on households can is illustrated below.
Average Household Consumption:{Household.: 1 000 kWh / 30 kl.} R %
Service Description Units Tariff Amount Tariff Amount Difference Increase
Elec.: Single Phase (40Amp) 40 6.00 240.00 6.40 256.00 16.00 6.67%
Consumption 50 0.855800 42.79 0.855800 42.79 0.00 0.00%
Consumption 350 1.100300 385.11 1.175500 411.43 26.32 6.83%
Consumption 250 1.548600 387.15 1.688000 422.00 34.85 9.00%
Consumption 350 1.823700 638.30 1.966700 688.35 50.05 7.84%
Water : Basic Fee 1 115.00 115.00 130.00 130.00 15.00 13.05%
Consumption 6 0.00 0.00 0.00 0.00 0.00%
Consumption 14 6.70 93.82 7.15 100.10 6.28 6.69%
Consumption 10 6.93 69.28 7.45 74.50 5.22 7.53%
Sewerage 1 114.50 114.50 125.50 125.50 11.00 9.61%
Refuse Removal 1 125.50 125.50 138.00 138.00 12.50 9.96%
2,211.44 2,388.66 177.22 8.01%
VAT i.r.o.services (14%) 0.14 309.60 0.15 358.30 48.70
Sub-Total: 2,521.05 2,746.96 225.91 8.96%
Property Rates 1,000,000 0.006737 553.00 0.007209 591.74 38.74 7.01%
Total: 3,074.04 3,338.70 264.66 8.61%
1-Jul-17 1-Jul-18
Average Household Consumption:{Household.: 500 kWh / 25 kl.}
R %
Service Description Units Tariff Amount Tariff Amount Difference styging
Elec.: Single Phase (40Amp) 40 6.00 240.00 6.40 256.00 16.00 6.67%
Consumption 50 0.855800 42.79 0.855800 42.79 0.00 0.00%
Consumption 350 1.100300 385.11 1.175500 411.43 26.32 6.83%
Consumption 100 1.548600 154.86 1.688000 168.80 13.94 9.00%
Water : Basic Fee 1 115.00 115.00 130.00 130.00 15.00 13.05%
Consumption 6 0.00 0.00 0.00 0.00 0.00%
Consumption 14 6.70 93.82 7.15 100.10 6.28 6.69%
Consumption 5 6.93 34.64 7.45 37.25 2.61 7.53%
Sewerage 1 114.50 114.50 125.50 125.50 11.00 9.61%
Refuse Removal 1 125.50 125.50 138.00 138.00 12.50 9.96%
1,306.22 1,409.87 103.65 7.94%
VAT i.r.o.services (14%) 0.14 182.87 0.15 211.48 28.61
Sub-Total: 1,489.09 1,621.34 132.26 8.88%
Property Rates (B1460 ) 500,000 0.006737 272.29 0.007209 291.36 19.08 7.01%
Total: 1,761.37 1,912.71 151.33 8.59%
1-Jul-17 1-Jul-18
March 2018 37
1.6 Operating Expenditure Framework
Municipalities are still urged to implement the cost containment measures on six focus areas namely, consultancy fees, no credit cards, travel and related costs, advertising, catering, events costs and accommodation. With the implementation of cost containment measures, municipalities must control unnecessary spending on nice-to-have items and non-essential and non-priority activities. The following table is a high level summary of the 2018/19 budget and MTREF (classified per main type of operating expenditure):
Table 1 Summary of operating expenditure by standard classification item
Average Household Consumption:{Household.: 350 kWh / 20 kl.}
R %
Service Description Units Tariff Amount Tariff Amount Difference styging
Elektr.: Enkelfase (20Amp) 20 6.00 120.00 6.40 128.00 8.00 6.67%
Verbruik 50 0.855800 42.79 0.855800 42.79 0.00 0.00%
Verbruik 300 1.100300 330.09 1.175500 352.65 22.56 6.83%
Water : Basiese fooi 1 115.00 115.00 130.00 130.00 15.00 13.05%
Verbruik 6 0.00 0.00 0.00 0.00 0.00%
Verbruik 14 6.70 93.82 7.15 100.10 6.28 6.69%
Riolering 1 114.50 114.50 125.50 125.50 11.00 9.61%
Afvalverwydering 1 125.50 125.50 138.00 138.00 12.50 9.96%
941.70 1,017.04 75.34 8.00%
BTW op dienste (14%) 0.14 131.84 0.15 152.56 20.72
Sub-Total: 1,073.54 1,169.60 96.06 8.95%
Eiendomsbelasting (N503) 300,000 0.006737 160.00 0.007209 171.21 11.21 7.01%
Total: 1,233.54 1,340.81 107.27 8.70%
1-Jul-17 1-Jul-18
Description 2017/18
R thousandFull Year
Forecast
Budget Year
2018/19
Budget Year
+1 2019/20
Budget Year
+2 2020/21
Expenditure By Type
Employ ee related costs 117 026 125 868 130 516 135 848
Remuneration of councillors 5 145 5 514 5 725 5 994
Debt impairment 7 833 10 797 11 455 12 156
Depreciation & asset impairment 11 440 11 922 12 577 13 269
Finance charges 9 007 9 439 9 958 10 508
Bulk purchases 76 798 82 397 88 571 95 649
Other materials 49 989 57 798 74 780 74 383
Contracted serv ices 18 483 23 108 21 356 20 659
Transfers and subsidies 2 763 1 920 1 982 2 048
Other ex penditure 21 981 24 644 26 859 28 226
Total Expenditure 320 464 353 405 383 781 398 739
2018/19 Medium Term Revenue &
Expenditure Framework
March 2018 38
The budgeted allocation for employee related costs for the 2018/19 financial year totals R125.868 million, which equals 35.62 per cent of the total operating expenditure. This percentage is set to remain very constant over the two outer years of the MTREF at 34.01 per cent and 34.07 per cent respectively. However, before the municipality reaches any conclusions with regards to levels of employee related costs of the municipality, the municipality should assess the impact of any items that could distort these figures. The municipality should for example exclude any material conditional grant expenditure that can fluctuate significantly year-on year. The cost associated with the remuneration of councilors is determined by the Minister of Co-operative Governance and Traditional Affairs in accordance with the Remuneration of Public Office Bearers Act, 1998 (Act 20 of 1998). The most recent proclamation in this regard has been taken into account in compiling the Municipality’s budget. The provision of debt impairment was determined based on an annual collection rate of 95.85 per cent and the Debt Write-off Policy of the Municipality. While this expenditure is considered to be a non-cash flow item, it informed the total cost associated with rendering the services of the municipality, as well as the municipality’s realistically anticipated revenues. Provision for depreciation and asset impairment has been informed by the Municipality’s Asset Management Policy. Depreciation is widely considered a proxy for the measurement of the rate of asset consumption. Bulk purchases are largely informed by the purchase of electricity from Eskom, which amounted to 7.34%. Although the municipality is not in control of the increase in the cost of bulk purchases, the municipality could still implement measures to reduce distribution losses as well as internal consumption. Other materials consist out of all items that are accounted for using inventory accounts in the mSCOA structure. The following items are included in Other Materials:

March 2018 39
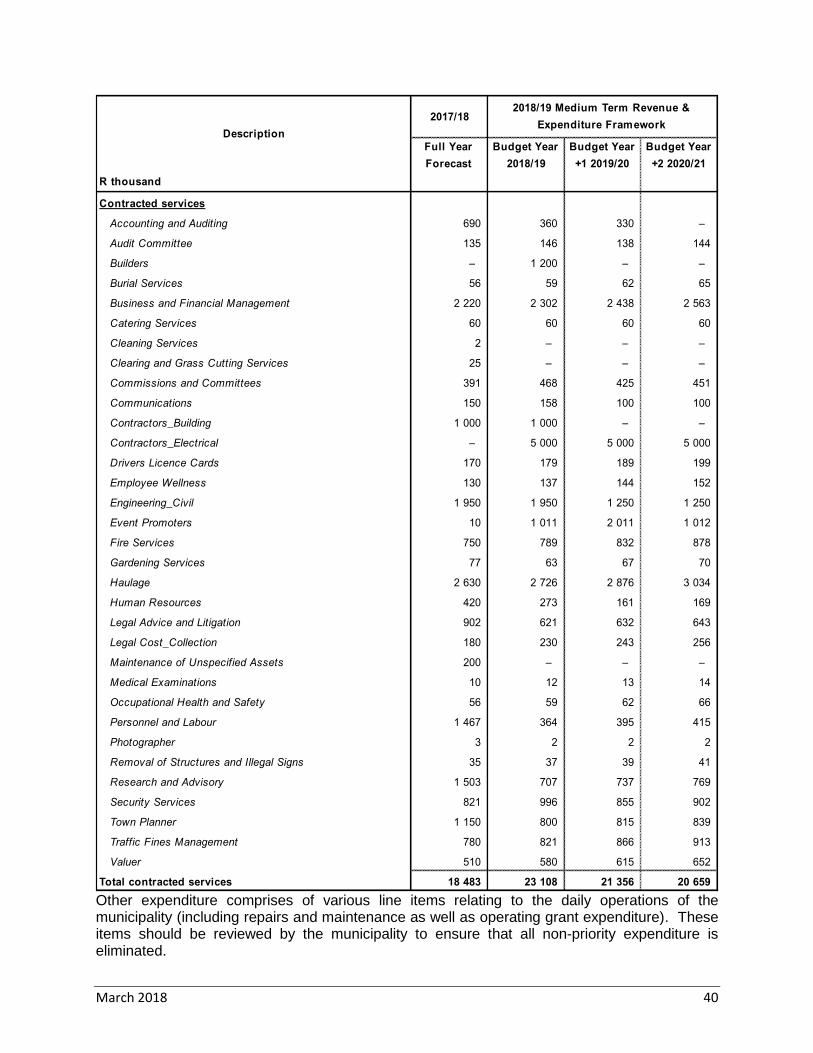
Contracted services consist of the following and are linked to the delivery of primary services. The classification of Contracted Services were largely influenced by the mSCOA chart of accounts.
2017/18
Full Year
Forecast
Budget Year
2018/19
Budget Year
+1 2019/20
Budget Year
+2 2020/21
R thousand
OTHER MATERIALS
Animal Welfare Materials 125 200 211 223
Chemicals 2 830 3 200 3 376 3 562
Cleaning Materials 313 344 363 382
Electricity Connections 187 205 218 231
First Aid Equipment 12 17 18 19
Fuel 2 894 3 108 3 280 3 463
Gas Consumed 48 51 54 57
Housing Stock 29 450 34 560 50 350 48 540
Maintenance Materials 12 186 13 880 14 566 15 378
Oil and Lubricants 73 83 88 92
Printing Consumables 100 105 110 116
Refreshments 122 181 191 261
Refuse Bags 651 791 834 880
Sew erage Connections 5 5 5 6
Small Tools 57 69 72 76
Stationery Consumed 905 967 1 009 1 060
Sundry Consumables 22 24 25 26
Water Connections 10 10 11 11
TOTAL 49 989 57 798 74 780 74 383
Description
2018/19 Medium Term Revenue &
Expenditure Framework
March 2018 40
Other expenditure comprises of various line items relating to the daily operations of the municipality (including repairs and maintenance as well as operating grant expenditure). These items should be reviewed by the municipality to ensure that all non-priority expenditure is eliminated.
2017/18
Full Year
Forecast
Budget Year
2018/19
Budget Year
+1 2019/20
Budget Year
+2 2020/21
R thousand
Contracted services
Accounting and Auditing 690 360 330 –
Audit Committee 135 146 138 144
Builders – 1 200 – –
Burial Services 56 59 62 65
Business and Financial Management 2 220 2 302 2 438 2 563
Catering Services 60 60 60 60
Cleaning Services 2 – – –
Clearing and Grass Cutting Services 25 – – –
Commissions and Committees 391 468 425 451
Communications 150 158 100 100
Contractors_Building 1 000 1 000 – –
Contractors_Electrical – 5 000 5 000 5 000
Drivers Licence Cards 170 179 189 199
Employee Wellness 130 137 144 152
Engineering_Civil 1 950 1 950 1 250 1 250
Event Promoters 10 1 011 2 011 1 012
Fire Services 750 789 832 878
Gardening Services 77 63 67 70
Haulage 2 630 2 726 2 876 3 034
Human Resources 420 273 161 169
Legal Advice and Litigation 902 621 632 643
Legal Cost_Collection 180 230 243 256
Maintenance of Unspecified Assets 200 – – –
Medical Examinations 10 12 13 14
Occupational Health and Safety 56 59 62 66
Personnel and Labour 1 467 364 395 415
Photographer 3 2 2 2
Removal of Structures and Illegal Signs 35 37 39 41
Research and Advisory 1 503 707 737 769
Security Services 821 996 855 902
Town Planner 1 150 800 815 839
Traffic Fines Management 780 821 866 913
Valuer 510 580 615 652
Total contracted services 18 483 23 108 21 356 20 659
Description
2018/19 Medium Term Revenue &
Expenditure Framework
March 2018 41
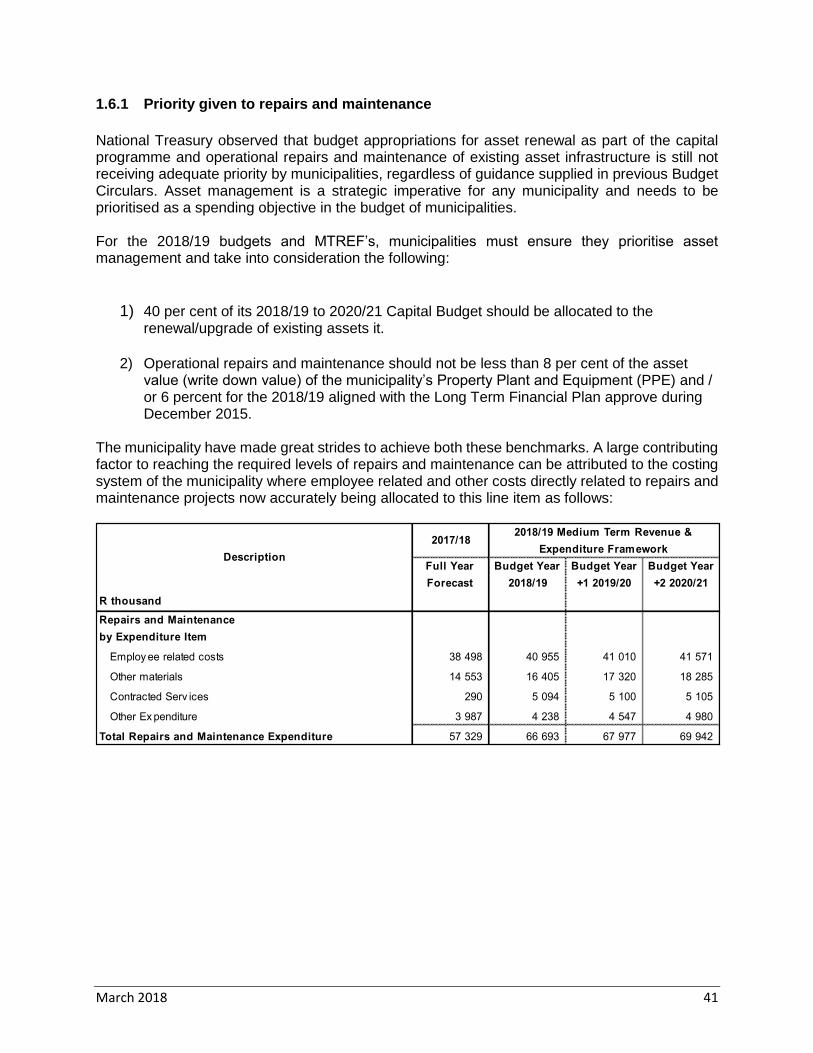
1.6.1 Priority given to repairs and maintenance
National Treasury observed that budget appropriations for asset renewal as part of the capital programme and operational repairs and maintenance of existing asset infrastructure is still not receiving adequate priority by municipalities, regardless of guidance supplied in previous Budget Circulars. Asset management is a strategic imperative for any municipality and needs to be prioritised as a spending objective in the budget of municipalities. For the 2018/19 budgets and MTREF’s, municipalities must ensure they prioritise asset management and take into consideration the following:
1) 40 per cent of its 2018/19 to 2020/21 Capital Budget should be allocated to the
renewal/upgrade of existing assets it.
2) Operational repairs and maintenance should not be less than 8 per cent of the asset value (write down value) of the municipality’s Property Plant and Equipment (PPE) and / or 6 percent for the 2018/19 aligned with the Long Term Financial Plan approve during December 2015.
The municipality have made great strides to achieve both these benchmarks. A large contributing factor to reaching the required levels of repairs and maintenance can be attributed to the costing system of the municipality where employee related and other costs directly related to repairs and maintenance projects now accurately being allocated to this line item as follows:
2017/18
Full Year
Forecast
Budget Year
2018/19
Budget Year
+1 2019/20
Budget Year
+2 2020/21
R thousand
Repairs and Maintenance
by Expenditure Item
Employ ee related costs 38 498 40 955 41 010 41 571
Other materials 14 553 16 405 17 320 18 285
Contracted Serv ices 290 5 094 5 100 5 105
Other Ex penditure 3 987 4 238 4 547 4 980
Total Repairs and Maintenance Expenditure 57 329 66 693 67 977 69 942
Description
2018/19 Medium Term Revenue &
Expenditure Framework
March 2018 42
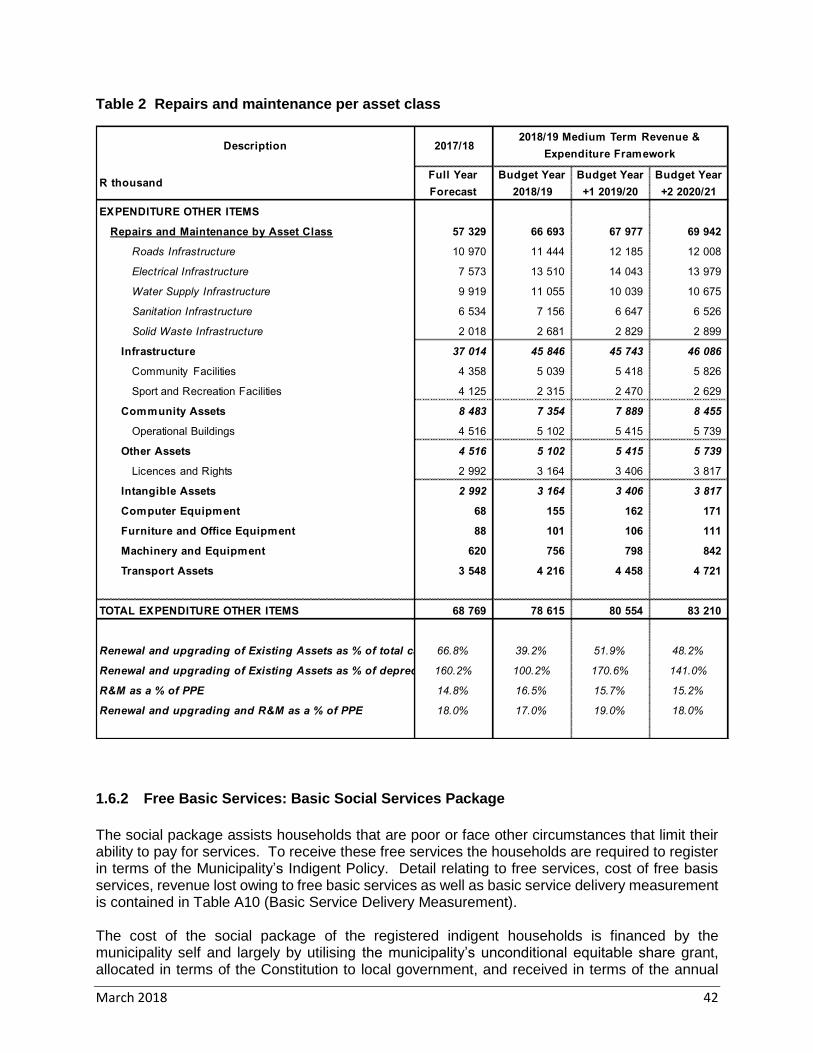
Table 2 Repairs and maintenance per asset class
1.6.2 Free Basic Services: Basic Social Services Package
The social package assists households that are poor or face other circumstances that limit their ability to pay for services. To receive these free services the households are required to register in terms of the Municipality’s Indigent Policy. Detail relating to free services, cost of free basis services, revenue lost owing to free basic services as well as basic service delivery measurement is contained in Table A10 (Basic Service Delivery Measurement). The cost of the social package of the registered indigent households is financed by the municipality self and largely by utilising the municipality’s unconditional equitable share grant, allocated in terms of the Constitution to local government, and received in terms of the annual
Description 2017/18
R thousandFull Year
Forecast
Budget Year
2018/19
Budget Year
+1 2019/20
Budget Year
+2 2020/21
EXPENDITURE OTHER ITEMS
Repairs and Maintenance by Asset Class 57 329 66 693 67 977 69 942
Roads Infrastructure 10 970 11 444 12 185 12 008
Electrical Infrastructure 7 573 13 510 14 043 13 979
Water Supply Infrastructure 9 919 11 055 10 039 10 675
Sanitation Infrastructure 6 534 7 156 6 647 6 526
Solid Waste Infrastructure 2 018 2 681 2 829 2 899
Infrastructure 37 014 45 846 45 743 46 086
Community Facilities 4 358 5 039 5 418 5 826
Sport and Recreation Facilities 4 125 2 315 2 470 2 629
Community Assets 8 483 7 354 7 889 8 455
Operational Buildings 4 516 5 102 5 415 5 739
Other Assets 4 516 5 102 5 415 5 739
Licences and Rights 2 992 3 164 3 406 3 817
Intangible Assets 2 992 3 164 3 406 3 817
Computer Equipment 68 155 162 171
Furniture and Office Equipment 88 101 106 111
Machinery and Equipment 620 756 798 842
Transport Assets 3 548 4 216 4 458 4 721
TOTAL EXPENDITURE OTHER ITEMS 68 769 78 615 80 554 83 210
Renewal and upgrading of Existing Assets as % of total capex66.8% 39.2% 51.9% 48.2%
Renewal and upgrading of Existing Assets as % of deprecn 160.2% 100.2% 170.6% 141.0%
R&M as a % of PPE 14.8% 16.5% 15.7% 15.2%
Renewal and upgrading and R&M as a % of PPE 18.0% 17.0% 19.0% 18.0%
2018/19 Medium Term Revenue &
Expenditure Framework
March 2018 43
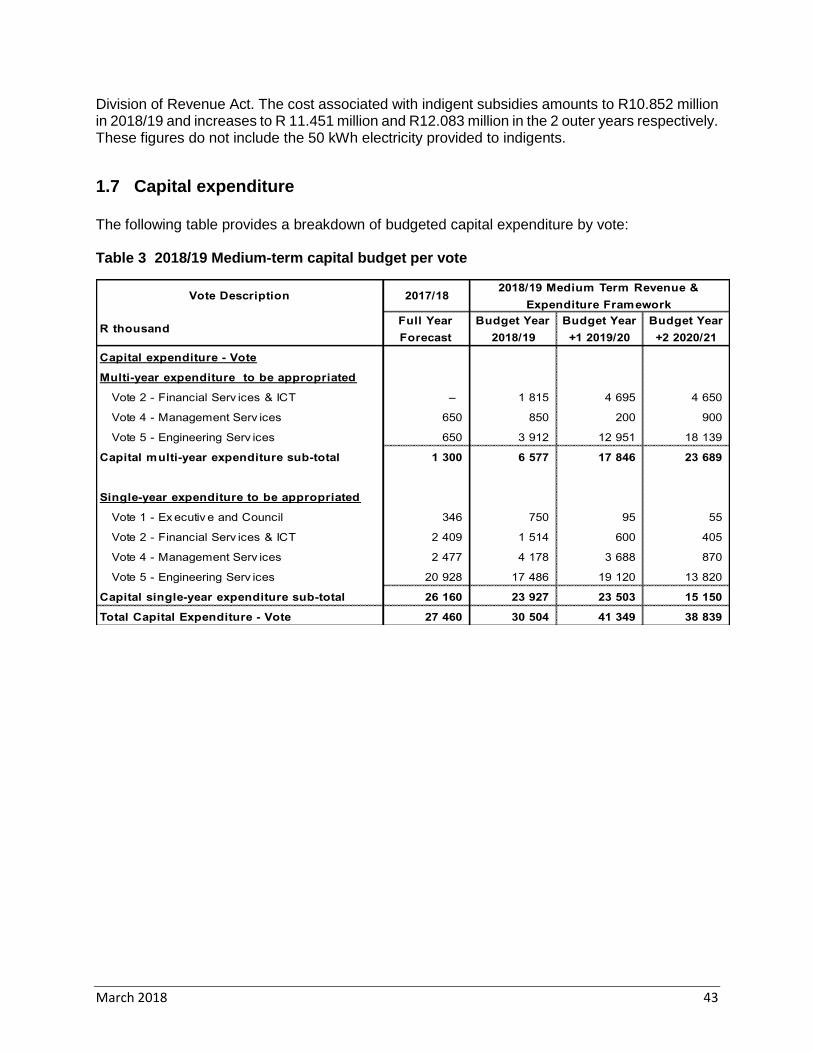
Division of Revenue Act. The cost associated with indigent subsidies amounts to R10.852 million in 2018/19 and increases to R 11.451 million and R12.083 million in the 2 outer years respectively. These figures do not include the 50 kWh electricity provided to indigents.
1.7 Capital expenditure
The following table provides a breakdown of budgeted capital expenditure by vote: Table 3 2018/19 Medium-term capital budget per vote
Vote Description 2017/18
R thousandFull Year
Forecast
Budget Year
2018/19
Budget Year
+1 2019/20
Budget Year
+2 2020/21
Capital expenditure - Vote
Multi-year expenditure to be appropriated
Vote 2 - Financial Serv ices & ICT – 1 815 4 695 4 650
Vote 4 - Management Serv ices 650 850 200 900
Vote 5 - Engineering Serv ices 650 3 912 12 951 18 139
Capital multi-year expenditure sub-total 1 300 6 577 17 846 23 689
Single-year expenditure to be appropriated
Vote 1 - Ex ecutiv e and Council 346 750 95 55
Vote 2 - Financial Serv ices & ICT 2 409 1 514 600 405
Vote 4 - Management Serv ices 2 477 4 178 3 688 870
Vote 5 - Engineering Serv ices 20 928 17 486 19 120 13 820
Capital single-year expenditure sub-total 26 160 23 927 23 503 15 150
Total Capital Expenditure - Vote 27 460 30 504 41 349 38 839
2018/19 Medium Term Revenue &
Expenditure Framework

March 2018 44
The following table provides more information on the breakdown of the capital budget.
Description 2017/18
R thousandFull Year
Forecast
Budget Year
2018/19
Budget Year
+1 2019/20
Budget Year
+2 2020/21
CAPITAL EXPENDITURE
Total New Assets 9 128 18 553 19 893 20 133
Roads Infrastructure 200 90 210 220
Storm water Infrastructure 5 998 7 741 500 500
Electrical Infrastructure 1 100 2 100 5 240 3 325
Sanitation Infrastructure – 1 120 1 000 2 000
Solid Waste Infrastructure – – 1 000 –
Infrastructure 7 298 11 051 7 950 6 045
Community Facilities 270 770 150 –
Sport and Recreation Facilities 170 2 260 1 690 500
Community Assets 440 3 030 1 840 500
Operational Buildings 95 – – –
Other Assets 95 – – –
Licences and Rights 8 – 250 50
Intangible Assets 8 – 250 50
Computer Equipment 200 136 – –
Furniture and Office Equipment 188 80 162 8
Machinery and Equipment 459 4 257 9 691 13 530
Transport Assets 440 – – –
Total Renewal of Existing Assets 6 525 5 329 11 312 9 803
Roads Infrastructure 200 1 550 780 700
Water Supply Infrastructure 2 060 2 450 1 000 2 000
Sanitation Infrastructure 877 331 6 171 6 473
Infrastructure 3 137 4 331 7 951 9 173
Community Facilities 350 – – –
Community Assets 350 – – –
Computer Equipment 172 288 255 210
Furniture and Office Equipment 193 339 230 140
Machinery and Equipment 2 424 372 277 –
Transport Assets 250 – 2 600 280
2018/19 Medium Term Revenue &
Expenditure Framework
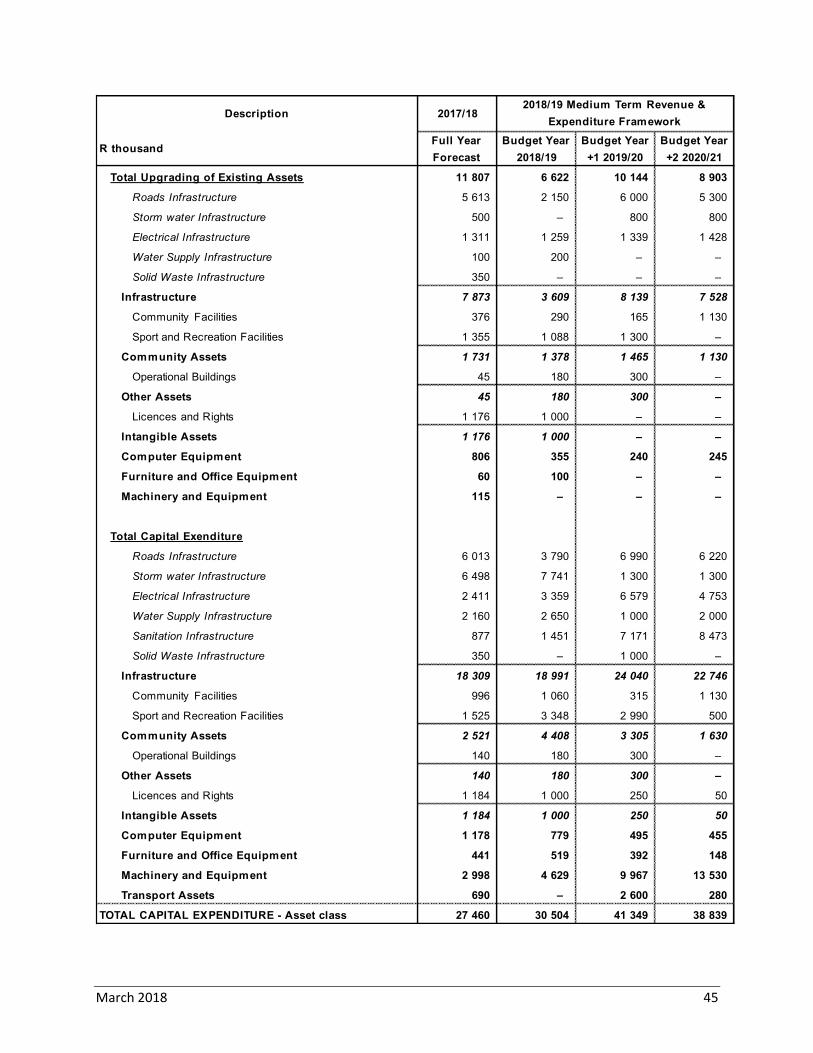
March 2018 45
Description 2017/18
R thousandFull Year
Forecast
Budget Year
2018/19
Budget Year
+1 2019/20
Budget Year
+2 2020/21
Total Upgrading of Existing Assets 11 807 6 622 10 144 8 903
Roads Infrastructure 5 613 2 150 6 000 5 300
Storm water Infrastructure 500 – 800 800
Electrical Infrastructure 1 311 1 259 1 339 1 428
Water Supply Infrastructure 100 200 – –
Solid Waste Infrastructure 350 – – –
Infrastructure 7 873 3 609 8 139 7 528
Community Facilities 376 290 165 1 130
Sport and Recreation Facilities 1 355 1 088 1 300 –
Community Assets 1 731 1 378 1 465 1 130
Operational Buildings 45 180 300 –
Other Assets 45 180 300 –
Licences and Rights 1 176 1 000 – –
Intangible Assets 1 176 1 000 – –
Computer Equipment 806 355 240 245
Furniture and Office Equipment 60 100 – –
Machinery and Equipment 115 – – –
Total Capital Exenditure
Roads Infrastructure 6 013 3 790 6 990 6 220
Storm water Infrastructure 6 498 7 741 1 300 1 300
Electrical Infrastructure 2 411 3 359 6 579 4 753
Water Supply Infrastructure 2 160 2 650 1 000 2 000
Sanitation Infrastructure 877 1 451 7 171 8 473
Solid Waste Infrastructure 350 – 1 000 –
Infrastructure 18 309 18 991 24 040 22 746
Community Facilities 996 1 060 315 1 130
Sport and Recreation Facilities 1 525 3 348 2 990 500
Community Assets 2 521 4 408 3 305 1 630
Operational Buildings 140 180 300 –
Other Assets 140 180 300 –
Licences and Rights 1 184 1 000 250 50
Intangible Assets 1 184 1 000 250 50
Computer Equipment 1 178 779 495 455
Furniture and Office Equipment 441 519 392 148
Machinery and Equipment 2 998 4 629 9 967 13 530
Transport Assets 690 – 2 600 280
TOTAL CAPITAL EXPENDITURE - Asset class 27 460 30 504 41 349 38 839
2018/19 Medium Term Revenue &
Expenditure Framework
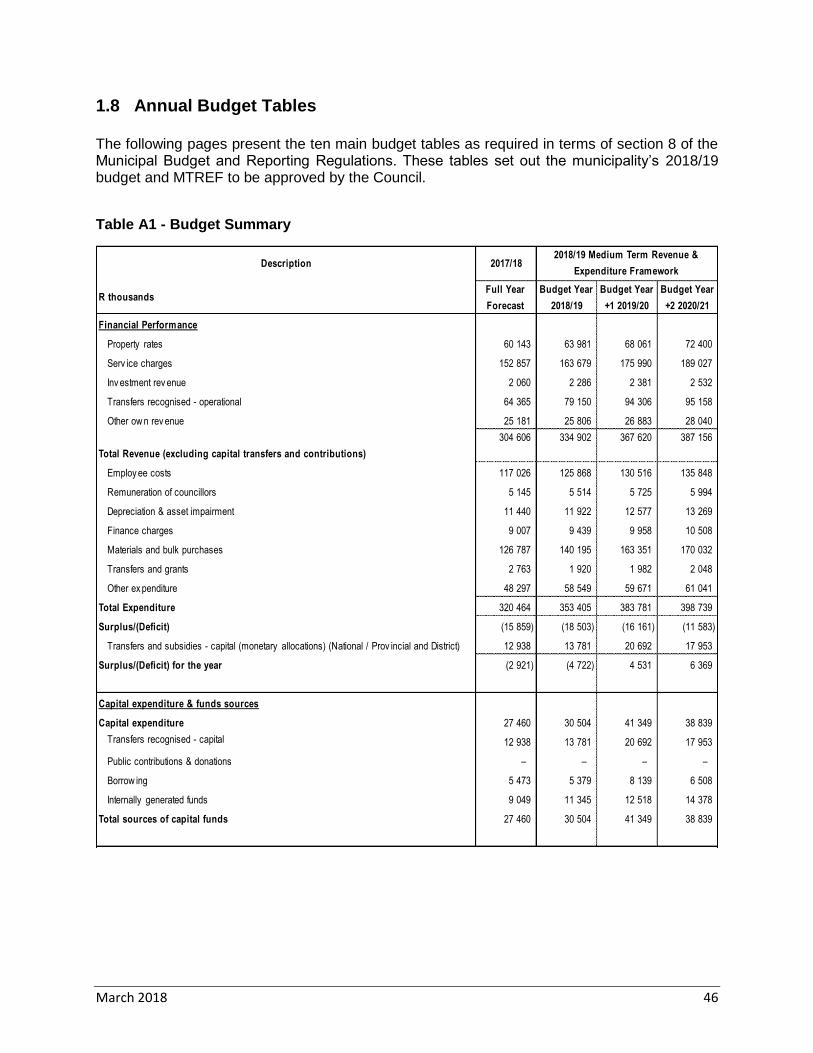
March 2018 46
1.8 Annual Budget Tables
The following pages present the ten main budget tables as required in terms of section 8 of the Municipal Budget and Reporting Regulations. These tables set out the municipality’s 2018/19 budget and MTREF to be approved by the Council.
Table A1 - Budget Summary
Description 2017/18
R thousandsFull Year
Forecast
Budget Year
2018/19
Budget Year
+1 2019/20
Budget Year
+2 2020/21
Financial Performance
Property rates 60 143 63 981 68 061 72 400
Serv ice charges 152 857 163 679 175 990 189 027
Inv estment rev enue 2 060 2 286 2 381 2 532
Transfers recognised - operational 64 365 79 150 94 306 95 158
Other ow n rev enue 25 181 25 806 26 883 28 040
Total Revenue (excluding capital transfers and contributions)
304 606 334 902 367 620 387 156
Employ ee costs 117 026 125 868 130 516 135 848
Remuneration of councillors 5 145 5 514 5 725 5 994
Depreciation & asset impairment 11 440 11 922 12 577 13 269
Finance charges 9 007 9 439 9 958 10 508
Materials and bulk purchases 126 787 140 195 163 351 170 032
Transfers and grants 2 763 1 920 1 982 2 048
Other ex penditure 48 297 58 549 59 671 61 041
Total Expenditure 320 464 353 405 383 781 398 739
Surplus/(Deficit) (15 859) (18 503) (16 161) (11 583)
Transfers and subsidies - capital (monetary allocations) (National / Prov incial and District) 12 938 13 781 20 692 17 953
Surplus/(Deficit) for the year (2 921) (4 722) 4 531 6 369
Capital expenditure & funds sources
Capital expenditure 27 460 30 504 41 349 38 839
Transfers recognised - capital 12 938 13 781 20 692 17 953
Public contributions & donations – – – –
Borrow ing 5 473 5 379 8 139 6 508
Internally generated funds 9 049 11 345 12 518 14 378
Total sources of capital funds 27 460 30 504 41 349 38 839
2018/19 Medium Term Revenue &
Expenditure Framework

March 2018 47
Description 2017/18
R thousandsFull Year
Forecast
Budget Year
2018/19
Budget Year
+1 2019/20
Budget Year
+2 2020/21
Financial position
Total current assets 59 656 51 679 45 564 52 021
Total non current assets 431 880 450 432 479 172 504 711
Total current liabilities 55 248 60 853 67 607 83 080
Total non current liabilities 129 151 138 842 150 183 160 336
Community w ealth/Equity 307 137 302 415 306 946 313 316
Cash flows
Net cash from (used) operating 22 845 12 218 23 219 23 174
Net cash from (used) inv esting (25 729) (28 973) (40 318) (38 308)
Net cash from (used) financing 4 096 3 269 4 894 2 686
Cash/cash equivalents at the year end 25 574 12 087 (118) (12 565)
Cash backing/surplus reconciliation
Cash and inv estments av ailable 25 574 12 087 (118) (12 565)
Application of cash and inv estments 26 726 17 802 4 724 86
Balance - surplus (shortfall) (1 152) (5 715) (4 842) (12 652)
Asset management
Asset register summary (WDV) 431 715 450 298 479 070 504 640
Depreciation 11 440 11 922 12 577 13 269
Renew al of Ex isting Assets 6 525 5 329 11 312 9 803
Repairs and Maintenance 57 329 66 693 67 977 69 942
Free services
Cost of Free Basic Serv ices prov ided 9 205 9 684 10 219 10 784
Rev enue cost of free serv ices prov ided 1 110 1 168 1 232 1 300
Households below minimum service level
Water: 1 1 1 1
Sanitation/sew erage: 1 1 1 1
Energy : 1 1 1 1
Refuse: – – – –
2018/19 Medium Term Revenue &
Expenditure Framework
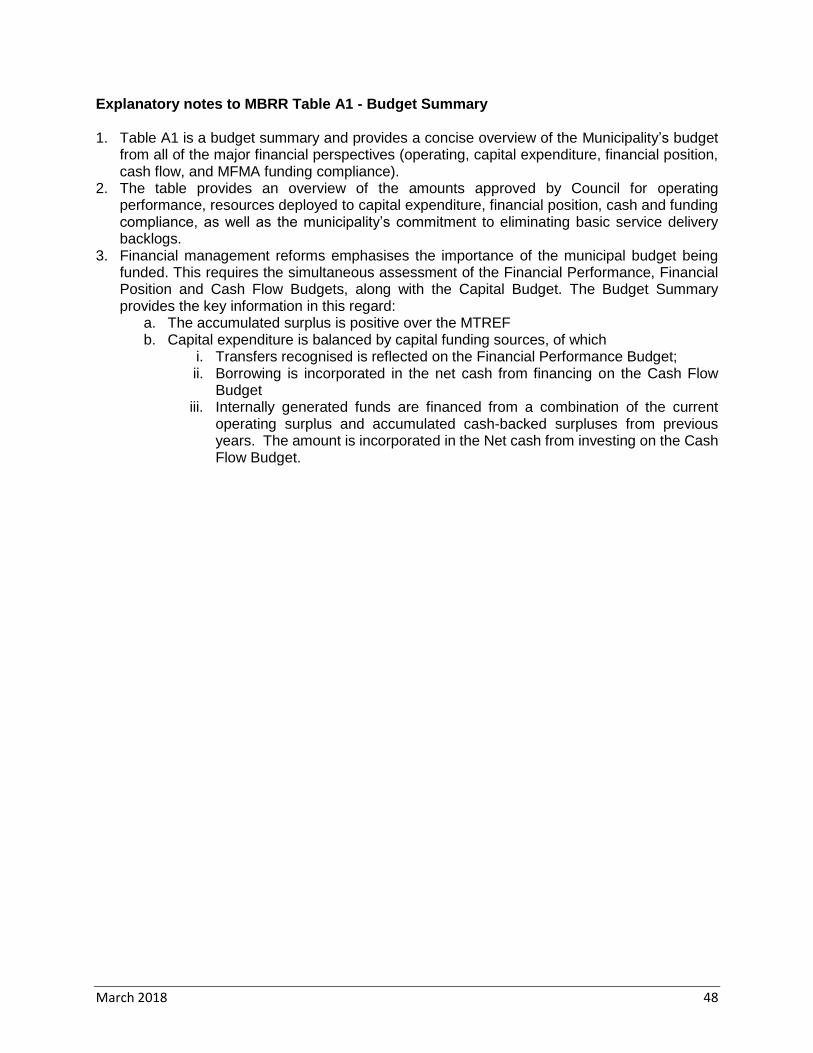
March 2018 48
Explanatory notes to MBRR Table A1 - Budget Summary 1. Table A1 is a budget summary and provides a concise overview of the Municipality’s budget
from all of the major financial perspectives (operating, capital expenditure, financial position, cash flow, and MFMA funding compliance).
2. The table provides an overview of the amounts approved by Council for operating performance, resources deployed to capital expenditure, financial position, cash and funding compliance, as well as the municipality’s commitment to eliminating basic service delivery backlogs.
3. Financial management reforms emphasises the importance of the municipal budget being funded. This requires the simultaneous assessment of the Financial Performance, Financial Position and Cash Flow Budgets, along with the Capital Budget. The Budget Summary provides the key information in this regard:
a. The accumulated surplus is positive over the MTREF b. Capital expenditure is balanced by capital funding sources, of which
i. Transfers recognised is reflected on the Financial Performance Budget; ii. Borrowing is incorporated in the net cash from financing on the Cash Flow
Budget iii. Internally generated funds are financed from a combination of the current
operating surplus and accumulated cash-backed surpluses from previous years. The amount is incorporated in the Net cash from investing on the Cash Flow Budget.
March 2018 49
MBRR Table A2 - Budgeted Financial Performance (revenue and expenditure by standard classification)
Functional Classification Description 2018
R thousandFull Year
Forecast
Budget Year
2018/19
Budget Year
+1 2019/20
Budget Year
+2 2020/21
Revenue - Functional
Governance and administration 107 369 114 497 121 663 128 418
Ex ecutiv e and council 25 190 27 606 29 861 32 338
Finance and administration 82 179 86 891 91 802 96 080
Community and public safety 42 571 49 678 65 829 63 815
Community and social serv ices 6 023 8 535 8 592 7 950
Sport and recreation 7 098 6 583 6 887 7 325
Housing 29 450 34 560 50 350 48 540
Economic and environmental services 13 140 13 661 14 530 15 454
Planning and dev elopment 1 283 1 364 1 451 1 543
Road transport 11 857 12 297 13 079 13 911
Trading services 154 464 170 847 186 291 197 422
Energy sources 104 438 118 012 130 013 137 478
Water management 24 544 25 920 27 590 29 366
Waste w ater management 9 508 10 148 10 822 11 539
Waste management 15 973 16 766 17 866 19 038
Total Revenue - Functional 317 544 348 683 388 313 405 108
Expenditure - Functional
Governance and administration 90 842 94 633 98 488 103 991
Ex ecutiv e and council 14 448 14 955 15 491 16 185
Finance and administration 74 800 77 907 81 189 85 874
Internal audit 1 594 1 770 1 808 1 932
Community and public safety 53 448 60 096 77 009 75 829
Community and social serv ices 11 337 13 505 13 818 13 550
Sport and recreation 10 958 10 757 11 513 12 325
Housing 31 152 35 834 51 679 49 953
Economic and environmental services 40 113 45 344 47 538 48 999
Planning and dev elopment 8 944 9 171 9 803 10 132
Road transport 31 169 36 097 37 430 38 754
Env ironmental protection – 77 305 113
Trading services 136 062 152 598 159 971 169 102
Energy sources 88 063 100 170 107 142 114 390
Water management 18 182 19 470 18 937 20 089
Waste w ater management 10 497 11 525 11 265 11 349
Waste management 19 319 21 433 22 626 23 274
Other – 735 775 818
Total Expenditure - Functional 320 464 353 405 383 781 398 739
Surplus/(Deficit) for the year (2 921) (4 722) 4 531 6 369
2018/19 Medium Term Revenue &
Expenditure Framework
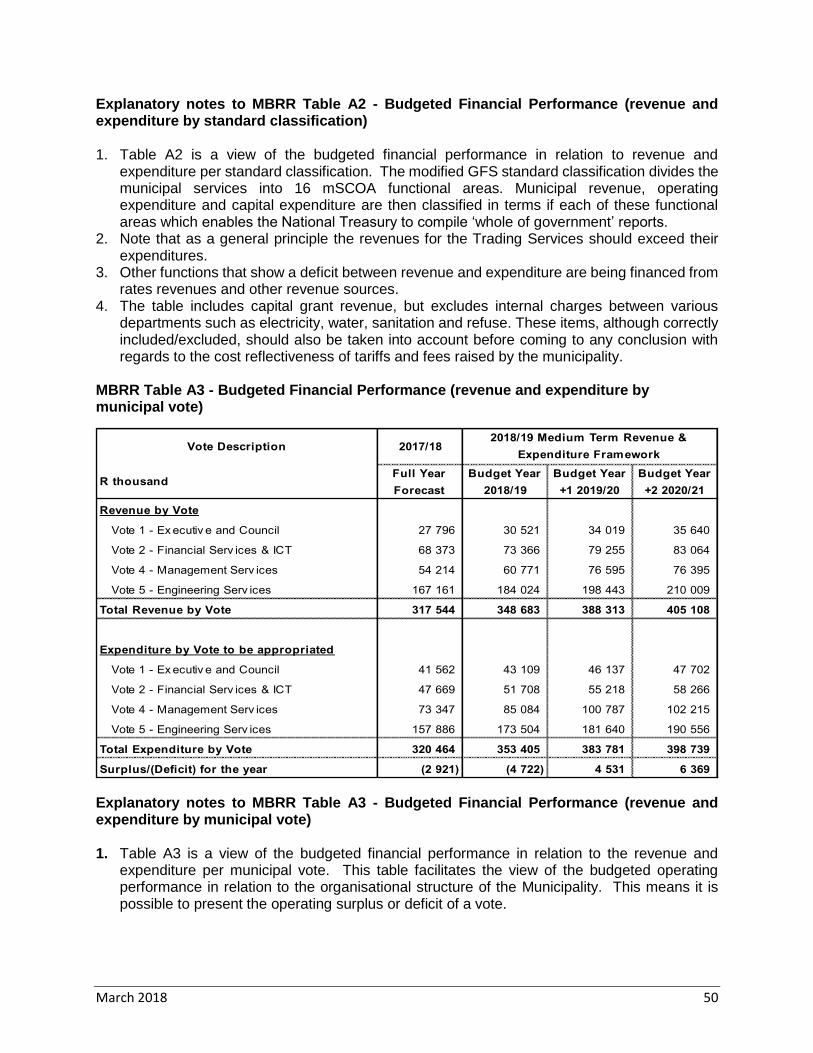
March 2018 50
Explanatory notes to MBRR Table A2 - Budgeted Financial Performance (revenue and expenditure by standard classification) 1. Table A2 is a view of the budgeted financial performance in relation to revenue and
expenditure per standard classification. The modified GFS standard classification divides the municipal services into 16 mSCOA functional areas. Municipal revenue, operating expenditure and capital expenditure are then classified in terms if each of these functional areas which enables the National Treasury to compile ‘whole of government’ reports.
2. Note that as a general principle the revenues for the Trading Services should exceed their expenditures.
3. Other functions that show a deficit between revenue and expenditure are being financed from rates revenues and other revenue sources.
4. The table includes capital grant revenue, but excludes internal charges between various departments such as electricity, water, sanitation and refuse. These items, although correctly included/excluded, should also be taken into account before coming to any conclusion with regards to the cost reflectiveness of tariffs and fees raised by the municipality.
MBRR Table A3 - Budgeted Financial Performance (revenue and expenditure by municipal vote)
Explanatory notes to MBRR Table A3 - Budgeted Financial Performance (revenue and expenditure by municipal vote) 1. Table A3 is a view of the budgeted financial performance in relation to the revenue and
expenditure per municipal vote. This table facilitates the view of the budgeted operating performance in relation to the organisational structure of the Municipality. This means it is possible to present the operating surplus or deficit of a vote.
Vote Description 2017/18
R thousandFull Year
Forecast
Budget Year
2018/19
Budget Year
+1 2019/20
Budget Year
+2 2020/21
Revenue by Vote
Vote 1 - Ex ecutiv e and Council 27 796 30 521 34 019 35 640
Vote 2 - Financial Serv ices & ICT 68 373 73 366 79 255 83 064
Vote 4 - Management Serv ices 54 214 60 771 76 595 76 395
Vote 5 - Engineering Serv ices 167 161 184 024 198 443 210 009
Total Revenue by Vote 317 544 348 683 388 313 405 108
Expenditure by Vote to be appropriated
Vote 1 - Ex ecutiv e and Council 41 562 43 109 46 137 47 702
Vote 2 - Financial Serv ices & ICT 47 669 51 708 55 218 58 266
Vote 4 - Management Serv ices 73 347 85 084 100 787 102 215
Vote 5 - Engineering Serv ices 157 886 173 504 181 640 190 556
Total Expenditure by Vote 320 464 353 405 383 781 398 739
Surplus/(Deficit) for the year (2 921) (4 722) 4 531 6 369
2018/19 Medium Term Revenue &
Expenditure Framework
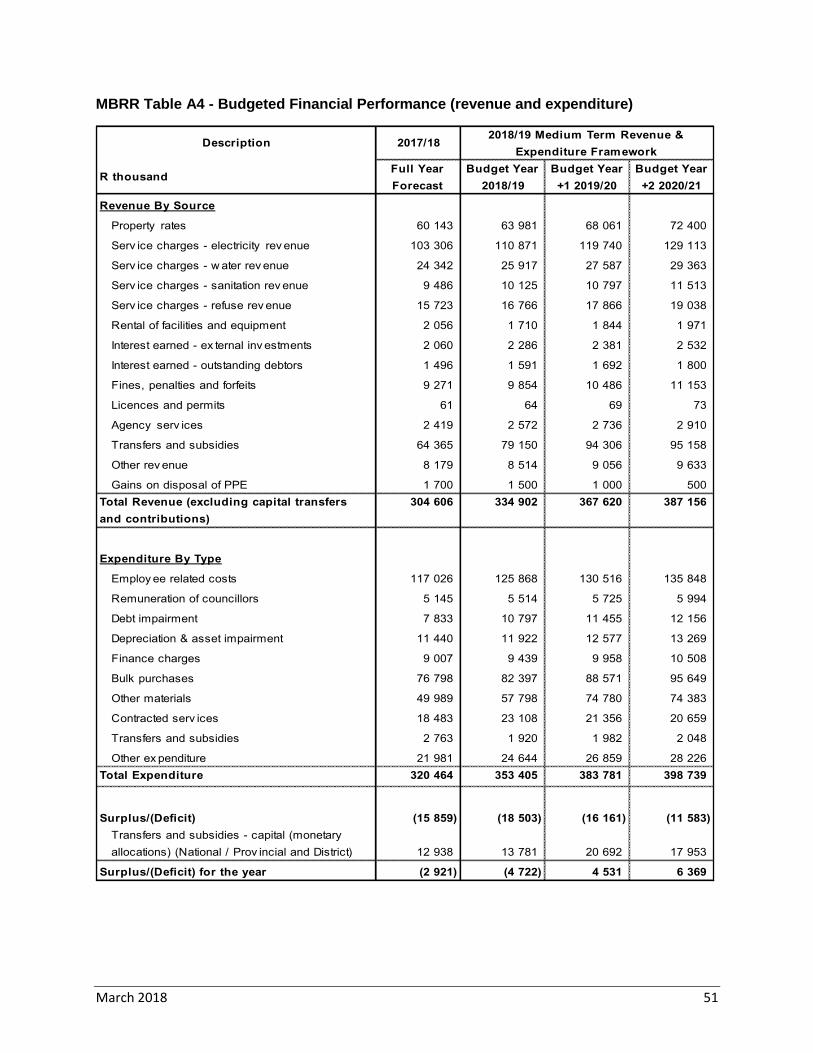
March 2018 51
MBRR Table A4 - Budgeted Financial Performance (revenue and expenditure)
Description 2017/18
R thousandFull Year
Forecast
Budget Year
2018/19
Budget Year
+1 2019/20
Budget Year
+2 2020/21
Revenue By Source
Property rates 60 143 63 981 68 061 72 400
Serv ice charges - electricity rev enue 103 306 110 871 119 740 129 113
Serv ice charges - w ater rev enue 24 342 25 917 27 587 29 363
Serv ice charges - sanitation rev enue 9 486 10 125 10 797 11 513
Serv ice charges - refuse rev enue 15 723 16 766 17 866 19 038
Rental of facilities and equipment 2 056 1 710 1 844 1 971
Interest earned - ex ternal inv estments 2 060 2 286 2 381 2 532
Interest earned - outstanding debtors 1 496 1 591 1 692 1 800
Fines, penalties and forfeits 9 271 9 854 10 486 11 153
Licences and permits 61 64 69 73
Agency serv ices 2 419 2 572 2 736 2 910
Transfers and subsidies 64 365 79 150 94 306 95 158
Other rev enue 8 179 8 514 9 056 9 633
Gains on disposal of PPE 1 700 1 500 1 000 500
Total Revenue (excluding capital transfers
and contributions)
304 606 334 902 367 620 387 156
Expenditure By Type
Employ ee related costs 117 026 125 868 130 516 135 848
Remuneration of councillors 5 145 5 514 5 725 5 994
Debt impairment 7 833 10 797 11 455 12 156
Depreciation & asset impairment 11 440 11 922 12 577 13 269
Finance charges 9 007 9 439 9 958 10 508
Bulk purchases 76 798 82 397 88 571 95 649
Other materials 49 989 57 798 74 780 74 383
Contracted serv ices 18 483 23 108 21 356 20 659
Transfers and subsidies 2 763 1 920 1 982 2 048
Other ex penditure 21 981 24 644 26 859 28 226
Total Expenditure 320 464 353 405 383 781 398 739
Surplus/(Deficit) (15 859) (18 503) (16 161) (11 583)
Transfers and subsidies - capital (monetary
allocations) (National / Prov incial and District) 12 938 13 781 20 692 17 953
Surplus/(Deficit) for the year (2 921) (4 722) 4 531 6 369
2018/19 Medium Term Revenue &
Expenditure Framework
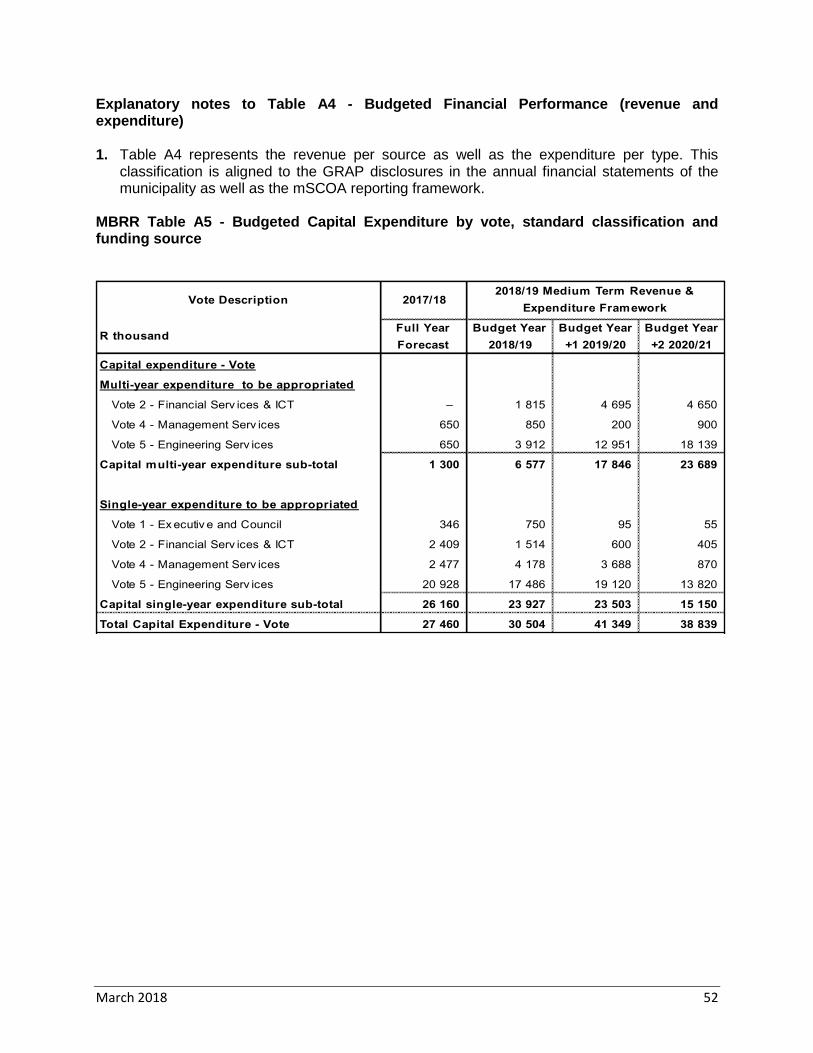
March 2018 52
Explanatory notes to Table A4 - Budgeted Financial Performance (revenue and expenditure) 1. Table A4 represents the revenue per source as well as the expenditure per type. This
classification is aligned to the GRAP disclosures in the annual financial statements of the municipality as well as the mSCOA reporting framework.
MBRR Table A5 - Budgeted Capital Expenditure by vote, standard classification and funding source
Vote Description 2017/18
R thousandFull Year
Forecast
Budget Year
2018/19
Budget Year
+1 2019/20
Budget Year
+2 2020/21
Capital expenditure - Vote
Multi-year expenditure to be appropriated
Vote 2 - Financial Serv ices & ICT – 1 815 4 695 4 650
Vote 4 - Management Serv ices 650 850 200 900
Vote 5 - Engineering Serv ices 650 3 912 12 951 18 139
Capital multi-year expenditure sub-total 1 300 6 577 17 846 23 689
Single-year expenditure to be appropriated
Vote 1 - Ex ecutiv e and Council 346 750 95 55
Vote 2 - Financial Serv ices & ICT 2 409 1 514 600 405
Vote 4 - Management Serv ices 2 477 4 178 3 688 870
Vote 5 - Engineering Serv ices 20 928 17 486 19 120 13 820
Capital single-year expenditure sub-total 26 160 23 927 23 503 15 150
Total Capital Expenditure - Vote 27 460 30 504 41 349 38 839
2018/19 Medium Term Revenue &
Expenditure Framework
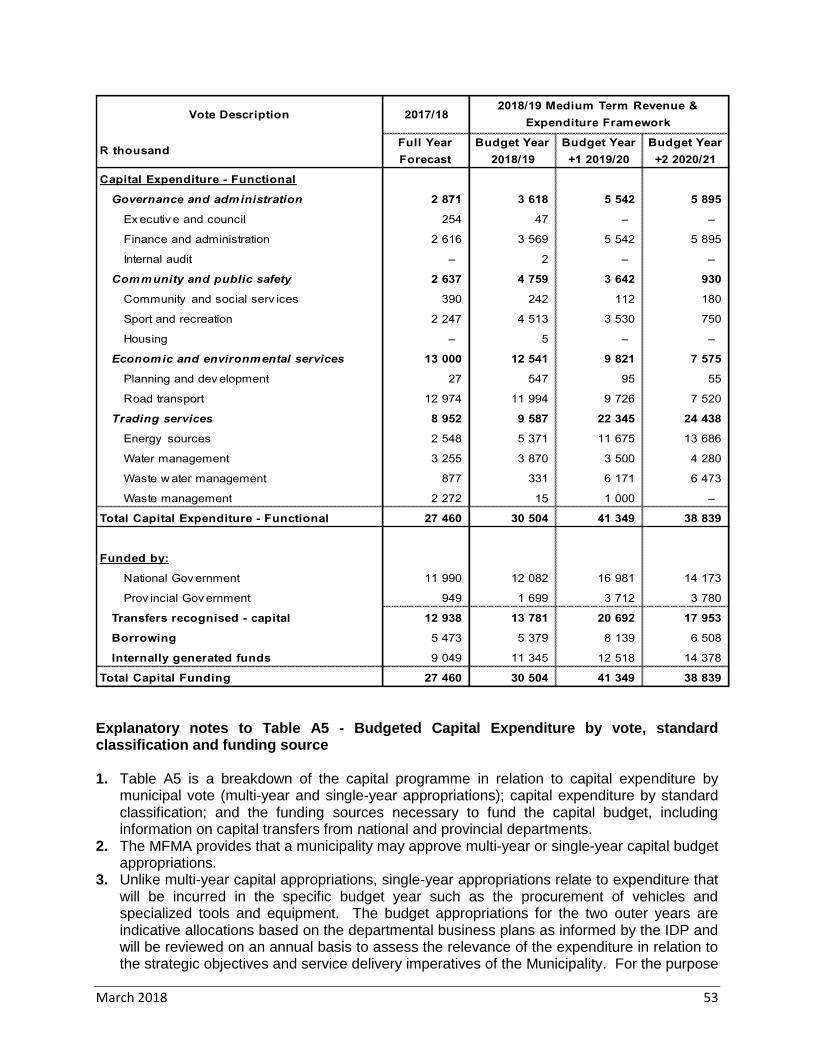
March 2018 53
Explanatory notes to Table A5 - Budgeted Capital Expenditure by vote, standard classification and funding source 1. Table A5 is a breakdown of the capital programme in relation to capital expenditure by
municipal vote (multi-year and single-year appropriations); capital expenditure by standard classification; and the funding sources necessary to fund the capital budget, including information on capital transfers from national and provincial departments.
2. The MFMA provides that a municipality may approve multi-year or single-year capital budget appropriations.
3. Unlike multi-year capital appropriations, single-year appropriations relate to expenditure that will be incurred in the specific budget year such as the procurement of vehicles and specialized tools and equipment. The budget appropriations for the two outer years are indicative allocations based on the departmental business plans as informed by the IDP and will be reviewed on an annual basis to assess the relevance of the expenditure in relation to the strategic objectives and service delivery imperatives of the Municipality. For the purpose
Vote Description 2017/18
R thousandFull Year
Forecast
Budget Year
2018/19
Budget Year
+1 2019/20
Budget Year
+2 2020/21
Capital Expenditure - Functional
Governance and administration 2 871 3 618 5 542 5 895
Ex ecutiv e and council 254 47 – –
Finance and administration 2 616 3 569 5 542 5 895
Internal audit – 2 – –
Community and public safety 2 637 4 759 3 642 930
Community and social serv ices 390 242 112 180
Sport and recreation 2 247 4 513 3 530 750
Housing – 5 – –
Economic and environmental services 13 000 12 541 9 821 7 575
Planning and dev elopment 27 547 95 55
Road transport 12 974 11 994 9 726 7 520
Trading services 8 952 9 587 22 345 24 438
Energy sources 2 548 5 371 11 675 13 686
Water management 3 255 3 870 3 500 4 280
Waste w ater management 877 331 6 171 6 473
Waste management 2 272 15 1 000 –
Total Capital Expenditure - Functional 27 460 30 504 41 349 38 839
Funded by:
National Gov ernment 11 990 12 082 16 981 14 173
Prov incial Gov ernment 949 1 699 3 712 3 780
Transfers recognised - capital 12 938 13 781 20 692 17 953
Borrowing 5 473 5 379 8 139 6 508
Internally generated funds 9 049 11 345 12 518 14 378
Total Capital Funding 27 460 30 504 41 349 38 839
2018/19 Medium Term Revenue &
Expenditure Framework
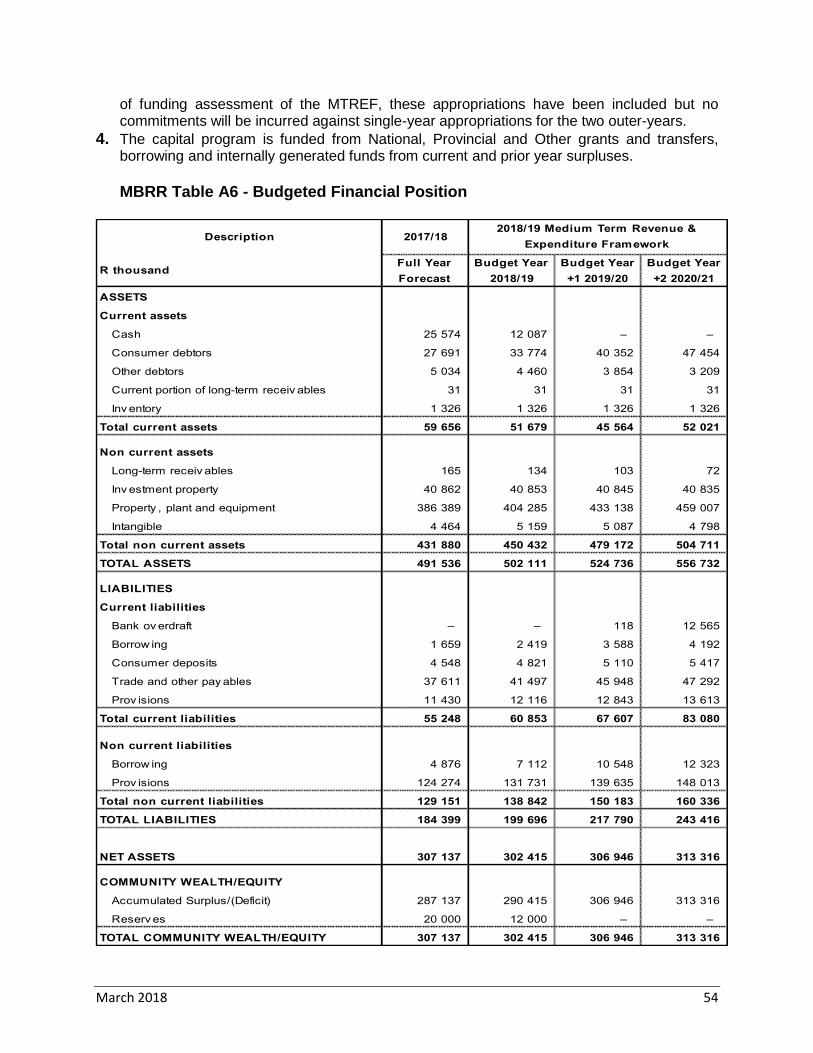
March 2018 54
of funding assessment of the MTREF, these appropriations have been included but no commitments will be incurred against single-year appropriations for the two outer-years.
4. The capital program is funded from National, Provincial and Other grants and transfers, borrowing and internally generated funds from current and prior year surpluses. MBRR Table A6 - Budgeted Financial Position
Description 2017/18
R thousandFull Year
Forecast
Budget Year
2018/19
Budget Year
+1 2019/20
Budget Year
+2 2020/21
ASSETS
Current assets
Cash 25 574 12 087 – –
Consumer debtors 27 691 33 774 40 352 47 454
Other debtors 5 034 4 460 3 854 3 209
Current portion of long-term receiv ables 31 31 31 31
Inv entory 1 326 1 326 1 326 1 326
Total current assets 59 656 51 679 45 564 52 021
Non current assets
Long-term receiv ables 165 134 103 72
Inv estment property 40 862 40 853 40 845 40 835
Property , plant and equipment 386 389 404 285 433 138 459 007
Intangible 4 464 5 159 5 087 4 798
Total non current assets 431 880 450 432 479 172 504 711
TOTAL ASSETS 491 536 502 111 524 736 556 732
LIABILITIES
Current liabilities
Bank ov erdraft – – 118 12 565
Borrow ing 1 659 2 419 3 588 4 192
Consumer deposits 4 548 4 821 5 110 5 417
Trade and other pay ables 37 611 41 497 45 948 47 292
Prov isions 11 430 12 116 12 843 13 613
Total current liabilities 55 248 60 853 67 607 83 080
Non current liabilities
Borrow ing 4 876 7 112 10 548 12 323
Prov isions 124 274 131 731 139 635 148 013
Total non current liabilities 129 151 138 842 150 183 160 336
TOTAL LIABILITIES 184 399 199 696 217 790 243 416
NET ASSETS 307 137 302 415 306 946 313 316
COMMUNITY WEALTH/EQUITY
Accumulated Surplus/(Deficit) 287 137 290 415 306 946 313 316
Reserv es 20 000 12 000 – –
TOTAL COMMUNITY WEALTH/EQUITY 307 137 302 415 306 946 313 316
2018/19 Medium Term Revenue &
Expenditure Framework
March 2018 55
Explanatory notes to Table A6 - Budgeted Financial Position 1. Table A6 is consistent with international standards of good financial management practice,
and improves understandability for councilors and management of the impact of the budget on the statement of financial position (balance sheet).
2. This format of presenting the statement of financial position is aligned to GRAP1, which is generally aligned to the international version which presents Assets less Liabilities as “accounting” Community Wealth. The order of items within each group illustrates items in order of liquidity; i.e. assets readily converted to cash, or liabilities immediately required to be met from cash, appear first.
3. Table A6 is supported by an extensive table of notes (SA3) providing a detailed analysis of the major components of a number of items, including: • Call investments deposits; • Consumer debtors; • Property, plant and equipment; • Trade and other payables; • Provisions non-current; • Changes in net assets; and • Reserves
4. The municipal equivalent of equity is Community Wealth/Equity. The justification is that ownership and the net assets of the municipality belong to the community.
5. Any movement on the Budgeted Financial Performance or the Capital Budget will inevitably impact on the Budgeted Financial Position. As an example, the collection rate assumption will impact on the cash position of the municipality and subsequently inform the level of cash and cash equivalents at year end. Similarly, the collection rate assumption should inform the budget appropriation for debt impairment which in turn would impact on the provision for bad debt. These budget and planning assumptions form a critical link in determining the applicability and relevance of the budget as well as the determination of ratios and financial indicators. In addition the funding compliance assessment is informed directly by forecasting the statement of financial position.
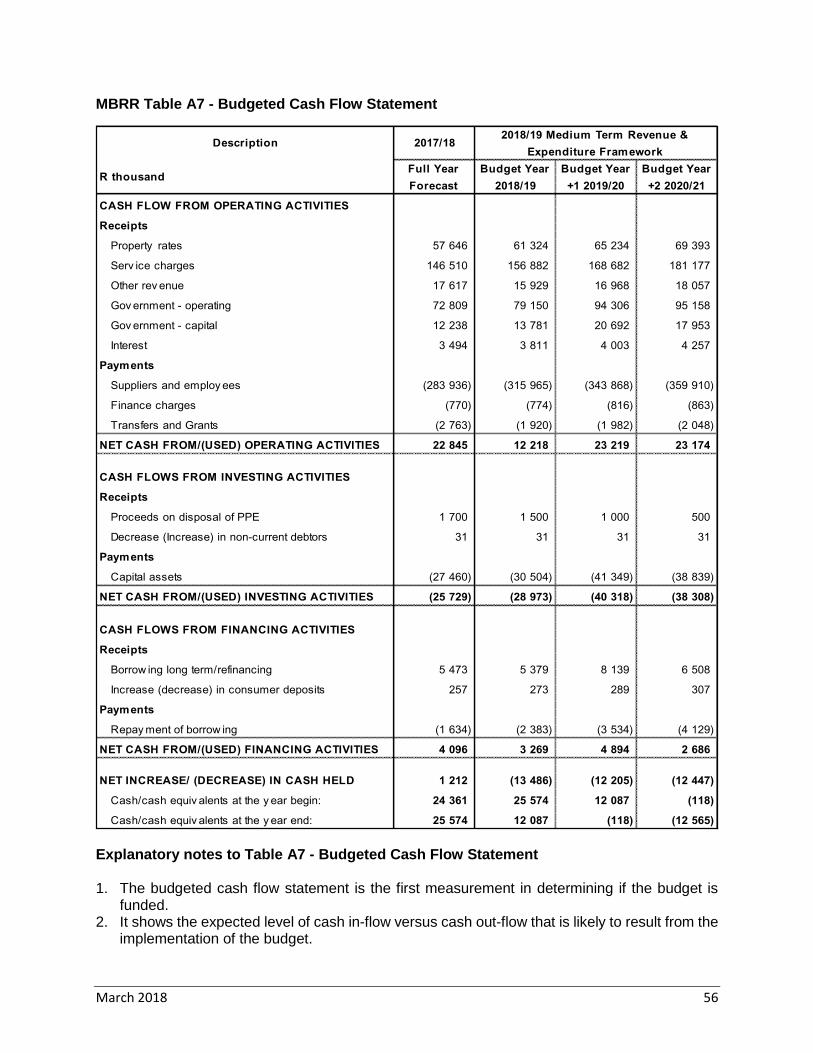
March 2018 56
MBRR Table A7 - Budgeted Cash Flow Statement
Explanatory notes to Table A7 - Budgeted Cash Flow Statement 1. The budgeted cash flow statement is the first measurement in determining if the budget is
funded. 2. It shows the expected level of cash in-flow versus cash out-flow that is likely to result from the
implementation of the budget.
Description 2017/18
R thousandFull Year
Forecast
Budget Year
2018/19
Budget Year
+1 2019/20
Budget Year
+2 2020/21
CASH FLOW FROM OPERATING ACTIVITIES
Receipts
Property rates 57 646 61 324 65 234 69 393
Serv ice charges 146 510 156 882 168 682 181 177
Other rev enue 17 617 15 929 16 968 18 057
Gov ernment - operating 72 809 79 150 94 306 95 158
Gov ernment - capital 12 238 13 781 20 692 17 953
Interest 3 494 3 811 4 003 4 257
Payments
Suppliers and employ ees (283 936) (315 965) (343 868) (359 910)
Finance charges (770) (774) (816) (863)
Transfers and Grants (2 763) (1 920) (1 982) (2 048)
NET CASH FROM/(USED) OPERATING ACTIVITIES 22 845 12 218 23 219 23 174
CASH FLOWS FROM INVESTING ACTIVITIES
Receipts
Proceeds on disposal of PPE 1 700 1 500 1 000 500
Decrease (Increase) in non-current debtors 31 31 31 31
Payments
Capital assets (27 460) (30 504) (41 349) (38 839)
NET CASH FROM/(USED) INVESTING ACTIVITIES (25 729) (28 973) (40 318) (38 308)
CASH FLOWS FROM FINANCING ACTIVITIES
Receipts
Borrow ing long term/refinancing 5 473 5 379 8 139 6 508
Increase (decrease) in consumer deposits 257 273 289 307
Payments
Repay ment of borrow ing (1 634) (2 383) (3 534) (4 129)
NET CASH FROM/(USED) FINANCING ACTIVITIES 4 096 3 269 4 894 2 686
NET INCREASE/ (DECREASE) IN CASH HELD 1 212 (13 486) (12 205) (12 447)
Cash/cash equiv alents at the y ear begin: 24 361 25 574 12 087 (118)
Cash/cash equiv alents at the y ear end: 25 574 12 087 (118) (12 565)
2018/19 Medium Term Revenue &
Expenditure Framework
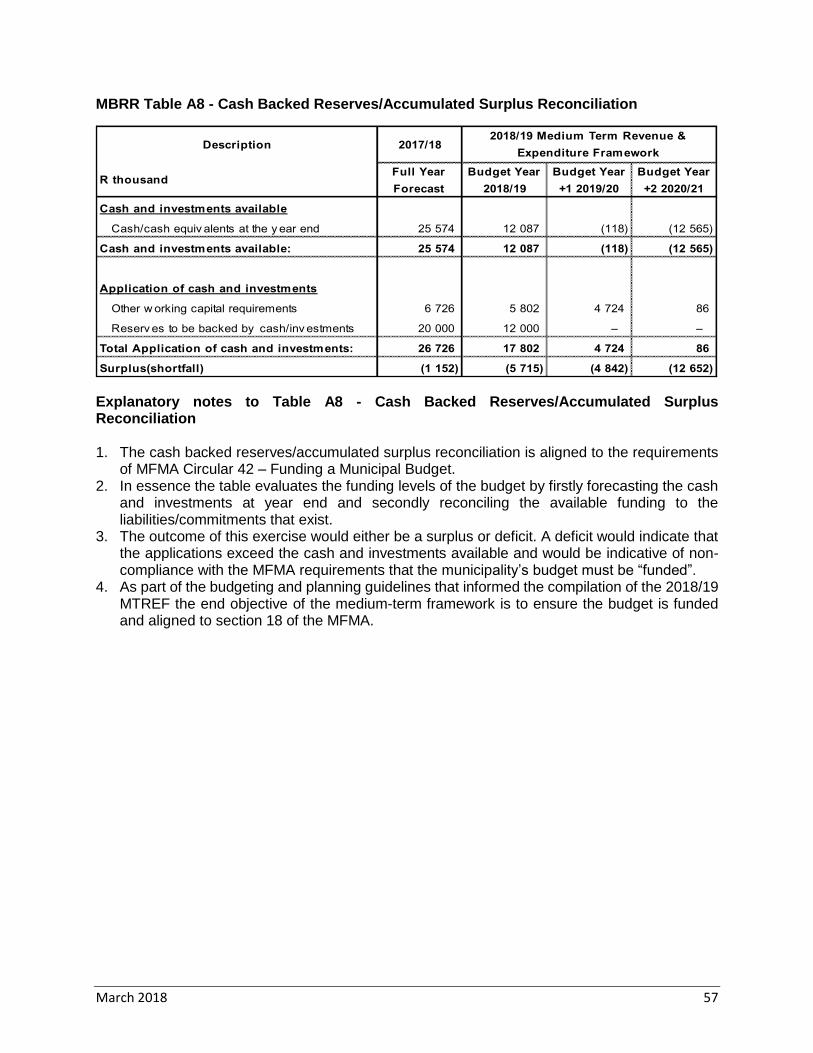
March 2018 57
MBRR Table A8 - Cash Backed Reserves/Accumulated Surplus Reconciliation
Explanatory notes to Table A8 - Cash Backed Reserves/Accumulated Surplus Reconciliation 1. The cash backed reserves/accumulated surplus reconciliation is aligned to the requirements
of MFMA Circular 42 – Funding a Municipal Budget. 2. In essence the table evaluates the funding levels of the budget by firstly forecasting the cash
and investments at year end and secondly reconciling the available funding to the liabilities/commitments that exist.
3. The outcome of this exercise would either be a surplus or deficit. A deficit would indicate that the applications exceed the cash and investments available and would be indicative of non-compliance with the MFMA requirements that the municipality’s budget must be “funded”.
4. As part of the budgeting and planning guidelines that informed the compilation of the 2018/19 MTREF the end objective of the medium-term framework is to ensure the budget is funded and aligned to section 18 of the MFMA.
Description 2017/18
R thousandFull Year
Forecast
Budget Year
2018/19
Budget Year
+1 2019/20
Budget Year
+2 2020/21
Cash and investments available
Cash/cash equiv alents at the y ear end 25 574 12 087 (118) (12 565)
Cash and investments available: 25 574 12 087 (118) (12 565)
Application of cash and investments
Other w orking capital requirements 6 726 5 802 4 724 86
Reserv es to be backed by cash/inv estments 20 000 12 000 – –
Total Application of cash and investments: 26 726 17 802 4 724 86
Surplus(shortfall) (1 152) (5 715) (4 842) (12 652)
2018/19 Medium Term Revenue &
Expenditure Framework
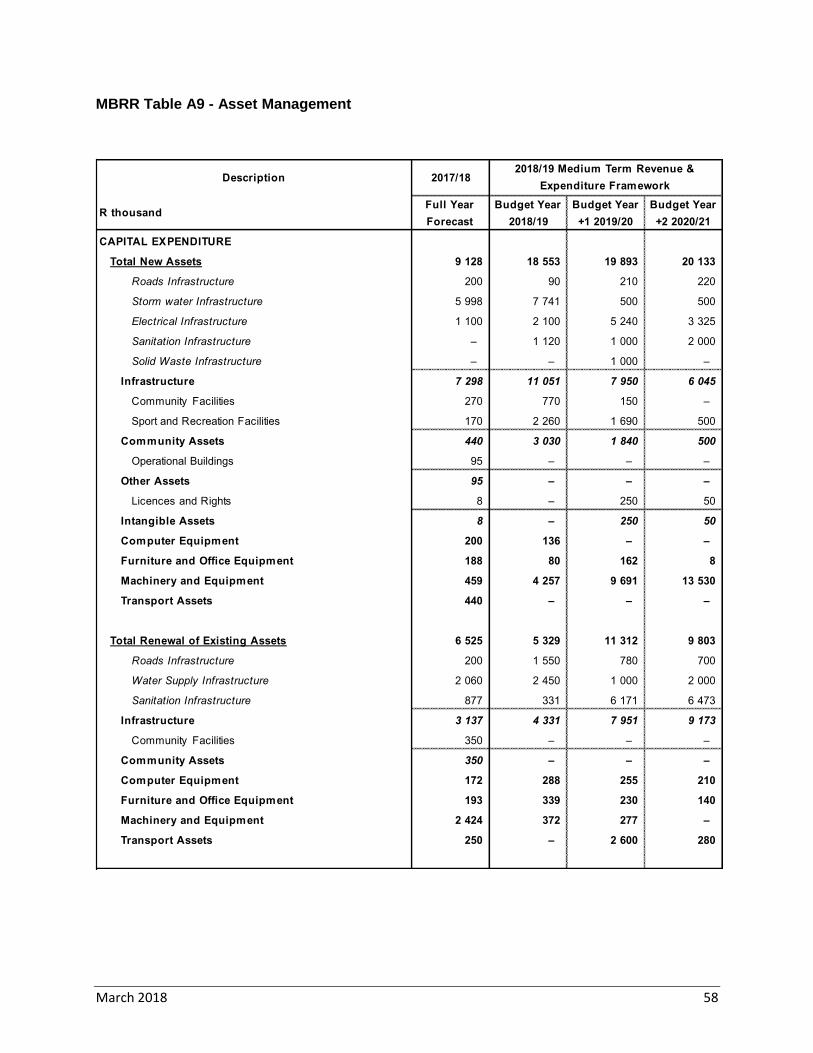
March 2018 58
MBRR Table A9 - Asset Management
Description 2017/18
R thousandFull Year
Forecast
Budget Year
2018/19
Budget Year
+1 2019/20
Budget Year
+2 2020/21
CAPITAL EXPENDITURE
Total New Assets 9 128 18 553 19 893 20 133
Roads Infrastructure 200 90 210 220
Storm water Infrastructure 5 998 7 741 500 500
Electrical Infrastructure 1 100 2 100 5 240 3 325
Sanitation Infrastructure – 1 120 1 000 2 000
Solid Waste Infrastructure – – 1 000 –
Infrastructure 7 298 11 051 7 950 6 045
Community Facilities 270 770 150 –
Sport and Recreation Facilities 170 2 260 1 690 500
Community Assets 440 3 030 1 840 500
Operational Buildings 95 – – –
Other Assets 95 – – –
Licences and Rights 8 – 250 50
Intangible Assets 8 – 250 50
Computer Equipment 200 136 – –
Furniture and Office Equipment 188 80 162 8
Machinery and Equipment 459 4 257 9 691 13 530
Transport Assets 440 – – –
Total Renewal of Existing Assets 6 525 5 329 11 312 9 803
Roads Infrastructure 200 1 550 780 700
Water Supply Infrastructure 2 060 2 450 1 000 2 000
Sanitation Infrastructure 877 331 6 171 6 473
Infrastructure 3 137 4 331 7 951 9 173
Community Facilities 350 – – –
Community Assets 350 – – –
Computer Equipment 172 288 255 210
Furniture and Office Equipment 193 339 230 140
Machinery and Equipment 2 424 372 277 –
Transport Assets 250 – 2 600 280
2018/19 Medium Term Revenue &
Expenditure Framework

March 2018 59
Description 2017/18
R thousandFull Year
Forecast
Budget Year
2018/19
Budget Year
+1 2019/20
Budget Year
+2 2020/21
Total Upgrading of Existing Assets 11 807 6 622 10 144 8 903
Roads Infrastructure 5 613 2 150 6 000 5 300
Storm water Infrastructure 500 – 800 800
Electrical Infrastructure 1 311 1 259 1 339 1 428
Water Supply Infrastructure 100 200 – –
Solid Waste Infrastructure 350 – – –
Infrastructure 7 873 3 609 8 139 7 528
Community Facilities 376 290 165 1 130
Sport and Recreation Facilities 1 355 1 088 1 300 –
Community Assets 1 731 1 378 1 465 1 130
Operational Buildings 45 180 300 –
Other Assets 45 180 300 –
Licences and Rights 1 176 1 000 – –
Intangible Assets 1 176 1 000 – –
Computer Equipment 806 355 240 245
Furniture and Office Equipment 60 100 – –
Machinery and Equipment 115 – – –
Total Capital Exenditure
Roads Infrastructure 6 013 3 790 6 990 6 220
Storm water Infrastructure 6 498 7 741 1 300 1 300
Electrical Infrastructure 2 411 3 359 6 579 4 753
Water Supply Infrastructure 2 160 2 650 1 000 2 000
Sanitation Infrastructure 877 1 451 7 171 8 473
Solid Waste Infrastructure 350 – 1 000 –
Infrastructure 18 309 18 991 24 040 22 746
Community Facilities 996 1 060 315 1 130
Sport and Recreation Facilities 1 525 3 348 2 990 500
Community Assets 2 521 4 408 3 305 1 630
Operational Buildings 140 180 300 –
Other Assets 140 180 300 –
Licences and Rights 1 184 1 000 250 50
Intangible Assets 1 184 1 000 250 50
Computer Equipment 1 178 779 495 455
Furniture and Office Equipment 441 519 392 148
Machinery and Equipment 2 998 4 629 9 967 13 530
Transport Assets 690 – 2 600 280
TOTAL CAPITAL EXPENDITURE - Asset class 27 460 30 504 41 349 38 839
2018/19 Medium Term Revenue &
Expenditure Framework
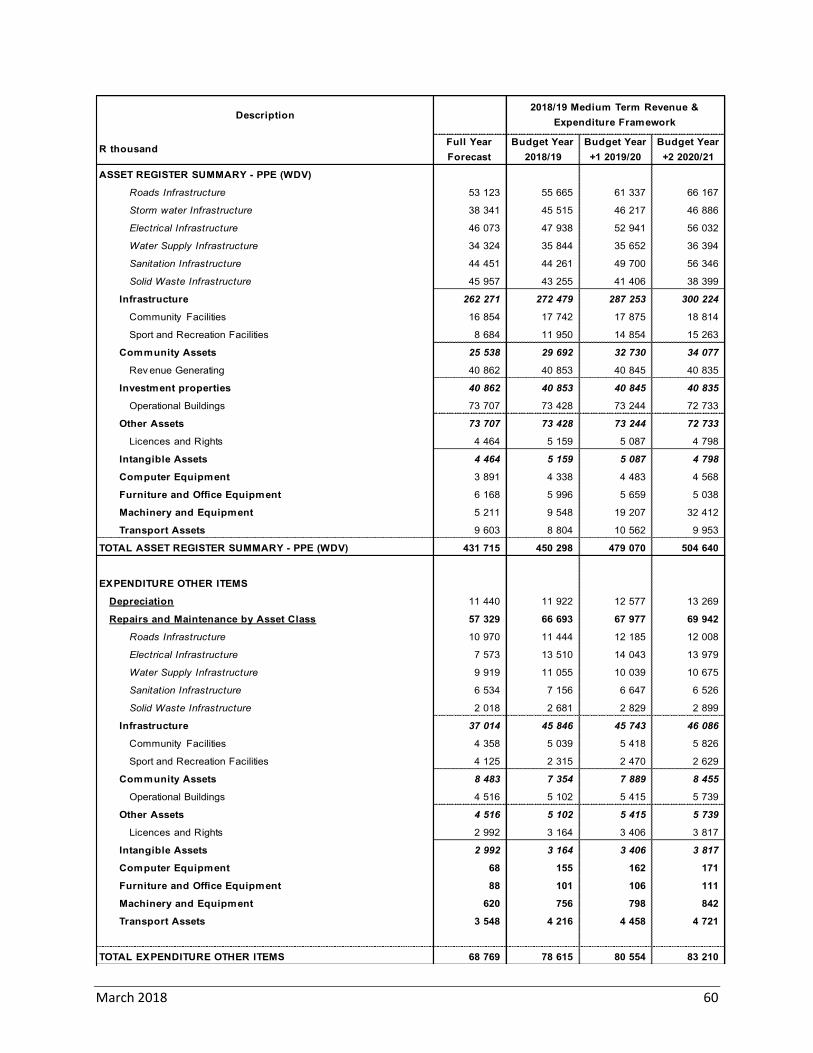
March 2018 60
Description
R thousandFull Year
Forecast
Budget Year
2018/19
Budget Year
+1 2019/20
Budget Year
+2 2020/21
ASSET REGISTER SUMMARY - PPE (WDV)
Roads Infrastructure 53 123 55 665 61 337 66 167
Storm water Infrastructure 38 341 45 515 46 217 46 886
Electrical Infrastructure 46 073 47 938 52 941 56 032
Water Supply Infrastructure 34 324 35 844 35 652 36 394
Sanitation Infrastructure 44 451 44 261 49 700 56 346
Solid Waste Infrastructure 45 957 43 255 41 406 38 399
Infrastructure 262 271 272 479 287 253 300 224
Community Facilities 16 854 17 742 17 875 18 814
Sport and Recreation Facilities 8 684 11 950 14 854 15 263
Community Assets 25 538 29 692 32 730 34 077
Rev enue Generating 40 862 40 853 40 845 40 835
Investment properties 40 862 40 853 40 845 40 835
Operational Buildings 73 707 73 428 73 244 72 733
Other Assets 73 707 73 428 73 244 72 733
Licences and Rights 4 464 5 159 5 087 4 798
Intangible Assets 4 464 5 159 5 087 4 798
Computer Equipment 3 891 4 338 4 483 4 568
Furniture and Office Equipment 6 168 5 996 5 659 5 038
Machinery and Equipment 5 211 9 548 19 207 32 412
Transport Assets 9 603 8 804 10 562 9 953
TOTAL ASSET REGISTER SUMMARY - PPE (WDV) 431 715 450 298 479 070 504 640
EXPENDITURE OTHER ITEMS
Depreciation 11 440 11 922 12 577 13 269
Repairs and Maintenance by Asset Class 57 329 66 693 67 977 69 942
Roads Infrastructure 10 970 11 444 12 185 12 008
Electrical Infrastructure 7 573 13 510 14 043 13 979
Water Supply Infrastructure 9 919 11 055 10 039 10 675
Sanitation Infrastructure 6 534 7 156 6 647 6 526
Solid Waste Infrastructure 2 018 2 681 2 829 2 899
Infrastructure 37 014 45 846 45 743 46 086
Community Facilities 4 358 5 039 5 418 5 826
Sport and Recreation Facilities 4 125 2 315 2 470 2 629
Community Assets 8 483 7 354 7 889 8 455
Operational Buildings 4 516 5 102 5 415 5 739
Other Assets 4 516 5 102 5 415 5 739
Licences and Rights 2 992 3 164 3 406 3 817
Intangible Assets 2 992 3 164 3 406 3 817
Computer Equipment 68 155 162 171
Furniture and Office Equipment 88 101 106 111
Machinery and Equipment 620 756 798 842
Transport Assets 3 548 4 216 4 458 4 721
TOTAL EXPENDITURE OTHER ITEMS 68 769 78 615 80 554 83 210
2018/19 Medium Term Revenue &
Expenditure Framework

March 2018 61
Explanatory notes to Table A9 - Asset Management
1. Table A9 provides an overview of municipal capital allocations to building new assets and the renewal of existing assets, as well as spending on repairs and maintenance by asset class.
2. National Treasury has recommended that municipalities should allocate at least 40 per cent of their capital budget to the renewal of existing assets, and allocations to repairs and maintenance should be 8 per cent of PPE. The Municipality does not meet both these recommendations.
MBRR Table A10 - Basic Service Delivery Measurement
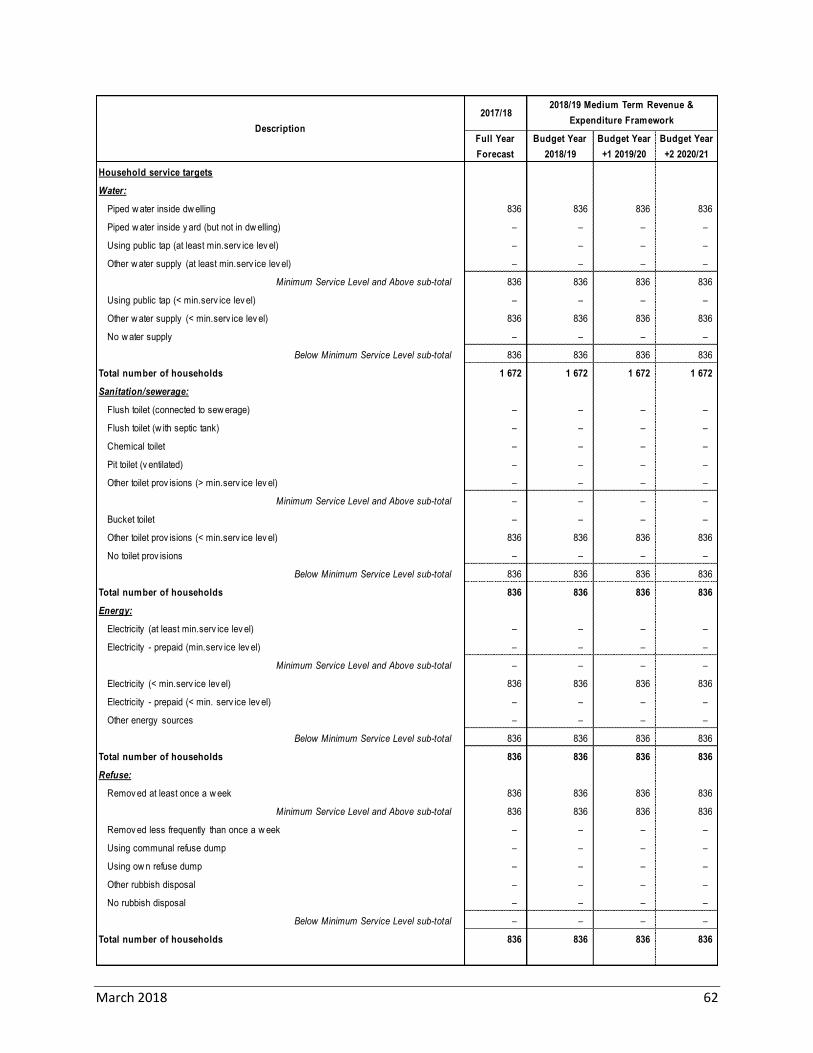
March 2018 62
2017/18
Full Year
Forecast
Budget Year
2018/19
Budget Year
+1 2019/20
Budget Year
+2 2020/21
Household service targets
Water:
Piped w ater inside dw elling 836 836 836 836
Piped w ater inside y ard (but not in dw elling) – – – –
Using public tap (at least min.serv ice lev el) – – – –
Other w ater supply (at least min.serv ice lev el) – – – –
Minimum Service Level and Above sub-total 836 836 836 836
Using public tap (< min.serv ice lev el) – – – –
Other w ater supply (< min.serv ice lev el) 836 836 836 836
No w ater supply – – – –
Below Minimum Service Level sub-total 836 836 836 836
Total number of households 1 672 1 672 1 672 1 672
Sanitation/sewerage:
Flush toilet (connected to sew erage) – – – –
Flush toilet (w ith septic tank) – – – –
Chemical toilet – – – –
Pit toilet (v entilated) – – – –
Other toilet prov isions (> min.serv ice lev el) – – – –
Minimum Service Level and Above sub-total – – – –
Bucket toilet – – – –
Other toilet prov isions (< min.serv ice lev el) 836 836 836 836
No toilet prov isions – – – –
Below Minimum Service Level sub-total 836 836 836 836
Total number of households 836 836 836 836
Energy:
Electricity (at least min.serv ice lev el) – – – –
Electricity - prepaid (min.serv ice lev el) – – – –
Minimum Service Level and Above sub-total – – – –
Electricity (< min.serv ice lev el) 836 836 836 836
Electricity - prepaid (< min. serv ice lev el) – – – –
Other energy sources – – – –
Below Minimum Service Level sub-total 836 836 836 836
Total number of households 836 836 836 836
Refuse:
Remov ed at least once a w eek 836 836 836 836
Minimum Service Level and Above sub-total 836 836 836 836
Remov ed less frequently than once a w eek – – – –
Using communal refuse dump – – – –
Using ow n refuse dump – – – –
Other rubbish disposal – – – –
No rubbish disposal – – – –
Below Minimum Service Level sub-total – – – –
Total number of households 836 836 836 836
Description
2018/19 Medium Term Revenue &
Expenditure Framework
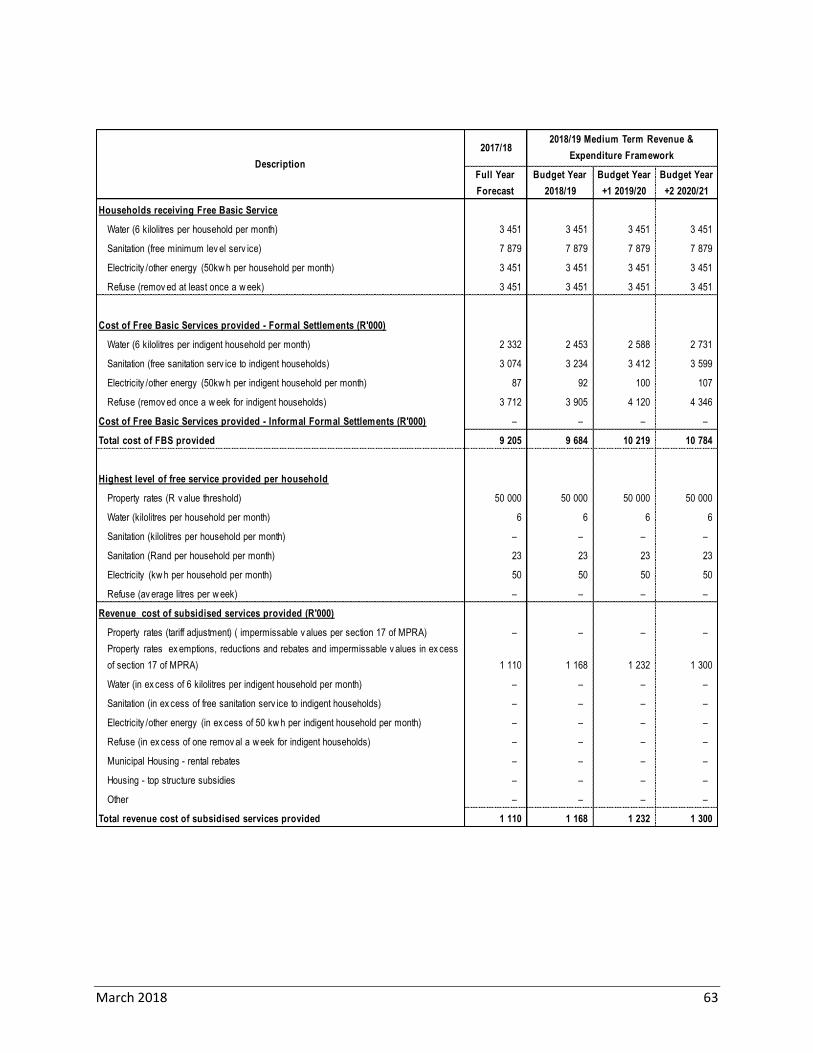
March 2018 63
2017/18
Full Year
Forecast
Budget Year
2018/19
Budget Year
+1 2019/20
Budget Year
+2 2020/21
Households receiving Free Basic Service
Water (6 kilolitres per household per month) 3 451 3 451 3 451 3 451
Sanitation (free minimum lev el serv ice) 7 879 7 879 7 879 7 879
Electricity /other energy (50kw h per household per month) 3 451 3 451 3 451 3 451
Refuse (remov ed at least once a w eek) 3 451 3 451 3 451 3 451
Cost of Free Basic Services provided - Formal Settlements (R'000)
Water (6 kilolitres per indigent household per month) 2 332 2 453 2 588 2 731
Sanitation (free sanitation serv ice to indigent households) 3 074 3 234 3 412 3 599
Electricity /other energy (50kw h per indigent household per month) 87 92 100 107
Refuse (remov ed once a w eek for indigent households) 3 712 3 905 4 120 4 346
Cost of Free Basic Services provided - Informal Formal Settlements (R'000) – – – –
Total cost of FBS provided 9 205 9 684 10 219 10 784
Highest level of free service provided per household
Property rates (R v alue threshold) 50 000 50 000 50 000 50 000
Water (kilolitres per household per month) 6 6 6 6
Sanitation (kilolitres per household per month) – – – –
Sanitation (Rand per household per month) 23 23 23 23
Electricity (kw h per household per month) 50 50 50 50
Refuse (av erage litres per w eek) – – – –
Revenue cost of subsidised services provided (R'000)
Property rates (tariff adjustment) ( impermissable v alues per section 17 of MPRA) – – – –
Property rates ex emptions, reductions and rebates and impermissable v alues in ex cess
of section 17 of MPRA) 1 110 1 168 1 232 1 300
Water (in ex cess of 6 kilolitres per indigent household per month) – – – –
Sanitation (in ex cess of free sanitation serv ice to indigent households) – – – –
Electricity /other energy (in ex cess of 50 kw h per indigent household per month) – – – –
Refuse (in ex cess of one remov al a w eek for indigent households) – – – –
Municipal Housing - rental rebates – – – –
Housing - top structure subsidies – – – –
Other – – – –
Total revenue cost of subsidised services provided 1 110 1 168 1 232 1 300
Description
2018/19 Medium Term Revenue &
Expenditure Framework
March 2018 64
2 Part 2 – Supporting Documentation
2.1 Overview of the annual budget process POLITICAL OVERSIGHT OF THE BUDGET PROCESS Section 53 (1) (a) of the MFMA (no 56 of 2003) stipulates that the Mayor of a municipality must provide general political guidance over the budget process and the priorities that must guide the preparation of a budget. Political oversight of the budget process is necessary to ensure that the needs and priorities of the community, as set out in the IDP, are properly linked to the municipality’s spending plans. The mayoral committee is one of the key elements in accomplishing the linkage between the IDP and the Budget of a municipality. SCHEDULE OF KEY DEADLINES RELATING TO THE BUDGET PROCESS The mayor must, according to the MFMA, co-ordinate the processes for preparing the annual budget and for reviewing the municipality’s IDP and budget-related policies. The mayor therefore tabled a schedule of key deadlines with regards to the budgetary process and the review of the municipality’s IDP. These key dates are available on the website of the municipality PURPOSE OF THE BUDGET AND IDP PROCESS PLAN The purpose of the process plan is to indicate the various planned activities and strategies on which the municipality will embark to compose its Integrated Development Plan for the five year cycle (2017/2018-2021/2022) and the budget for the 2018/2019 financial year and the two outer years. The process plan enhances integration and alignment between the IDP and the Budget, thereby ensuring the development of an IDP-based budget. It fulfils the role of an operational framework for the IDP and Budget process outlining the manner in which this process was undertaken. In addition, it identifies the activities in the processes around the key statutory annual operational processes of the budget and IDP compilation, performance management implementation and the adoption of the municipality’s annual report.
2.1.1 IDP and Service Delivery and Budget Implementation Plan
The Municipality’s IDP is its principal strategic planning instrument, which directly guides and informs its planning, budget, management and development actions. This framework is rolled out into objectives, key performance indicators and targets for implementation which directly inform the Service Delivery and Budget Implementation Plan.

March 2018 65
2.1.2 Community Consultation
A full consultation process was carried out during April 2018. During this process members of the community were afforded the opportunity to provide inputs and comments on the draft budget presented to them. The comments and inputs will be reviewed and where viable, the proposals will be incorporated into the final budget to be presented for approval.
2.2 Overview of alignment of annual budget with IDP The Constitution mandates local government with the responsibility to exercise local developmental and cooperative governance. The eradication of imbalances in South African society can only be realized through a credible integrated developmental planning process. Municipalities in South Africa need to utilise integrated development planning as a method to plan future development in their areas and so find the best solutions to achieve sound long-term development goals. A municipal IDP provides a five year strategic programme of action aimed at setting short, medium and long term strategic and budget priorities to create a development platform, which correlates with the term of office of the political incumbents. The plan aligns the resources and the capacity of a municipality to its overall development aims and guides the municipal budget. An IDP is therefore a key instrument which municipalities use to provide vision, leadership and direction to all those that have a role to play in the development of a municipal area. The IDP enables municipalities to make the best use of scarce resources and speed up service delivery. Integrated developmental planning in the South African context is amongst others, an approach to planning aimed at involving the municipality and the community to jointly find the best solutions towards sustainable development. Furthermore, integrated development planning provides a strategic environment for managing and guiding all planning, development and decision making in the municipality. It is important that the IDP developed by municipalities correlate with National and Provincial intent. It must aim to co-ordinate the work of local and other spheres of government in a coherent plan to improve the quality of life for all the people living in that area. Applied to the Municipality, issues of national and provincial importance should be reflected in the IDP of the municipality. A clear understanding of such intent is therefore imperative to ensure that the Municipality strategically complies with the key national and provincial priorities. The 2018/19 MTREF has therefore been directly informed by the IDP process and the following tables provide the reconciliation between the IDP strategic objectives and operating revenue, operating expenditure and capital expenditure.
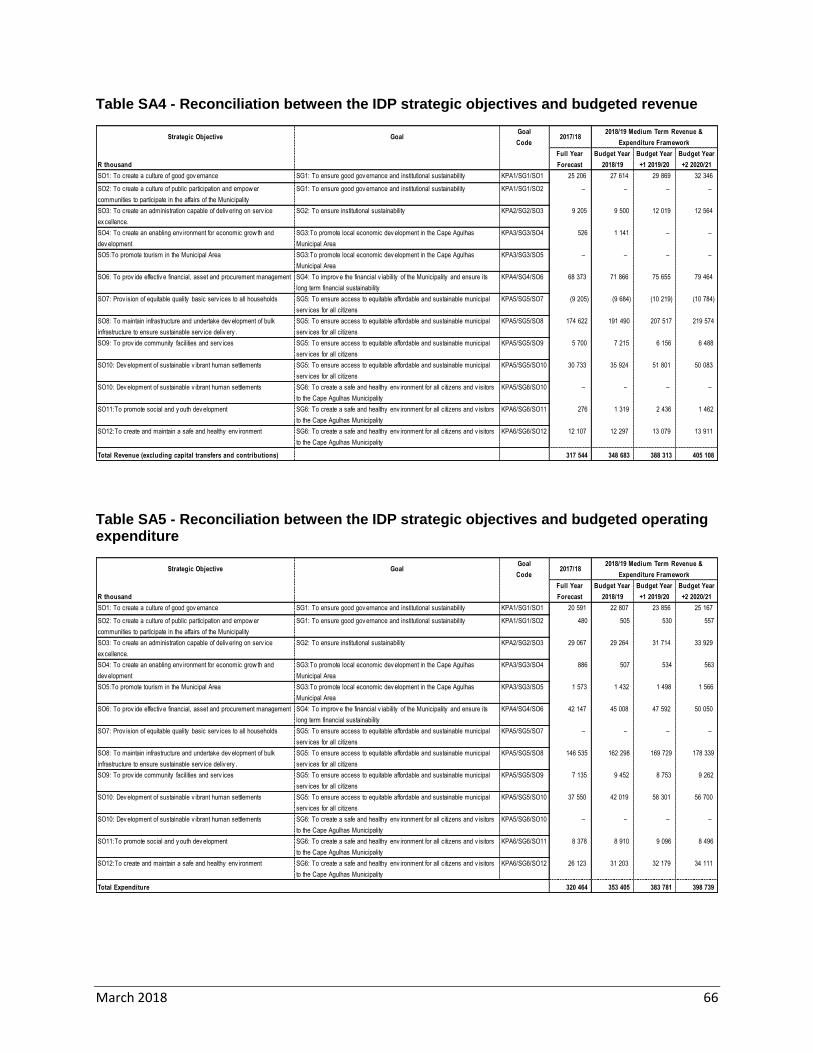
March 2018 66
Table SA4 - Reconciliation between the IDP strategic objectives and budgeted revenue
Table SA5 - Reconciliation between the IDP strategic objectives and budgeted operating expenditure
Strategic Objective GoalGoal
Code2017/18
R thousand
Full Year
Forecast
Budget Year
2018/19
Budget Year
+1 2019/20
Budget Year
+2 2020/21
SO1: To create a culture of good gov ernance SG1: To ensure good gov ernance and institutional sustainability KPA1/SG1/SO1 25 206 27 614 29 869 32 346
SO2: To create a culture of public participation and empow er
communities to participate in the affairs of the Municipality
SG1: To ensure good gov ernance and institutional sustainability KPA1/SG1/SO2 – – – –
SO3: To create an administration capable of deliv ering on serv ice
ex cellence.
SG2: To ensure institutional sustainability KPA2/SG2/SO3 9 205 9 500 12 019 12 564
SO4: To create an enabling env ironment for economic grow th and
dev elopment
SG3:To promote local economic dev elopment in the Cape Agulhas
Municipal Area
KPA3/SG3/SO4 526 1 141 – –
SO5:To promote tourism in the Municipal Area SG3:To promote local economic dev elopment in the Cape Agulhas
Municipal Area
KPA3/SG3/SO5 – – – –
SO6: To prov ide effectiv e financial, asset and procurement management SG4: To improv e the financial v iability of the Municipality and ensure its
long term financial sustainability
KPA4/SG4/SO6 68 373 71 866 75 655 79 464
SO7: Prov ision of equitable quality basic serv ices to all households SG5: To ensure access to equitable affordable and sustainable municipal
serv ices for all citizens
KPA5/SG5/SO7 (9 205) (9 684) (10 219) (10 784)
SO8: To maintain infrastructure and undertake dev elopment of bulk
infrastructure to ensure sustainable serv ice deliv ery .
SG5: To ensure access to equitable affordable and sustainable municipal
serv ices for all citizens
KPA5/SG5/SO8 174 622 191 490 207 517 219 574
SO9: To prov ide community facilities and serv ices SG5: To ensure access to equitable affordable and sustainable municipal
serv ices for all citizens
KPA5/SG5/SO9 5 700 7 215 6 156 6 488
SO10: Dev elopment of sustainable v ibrant human settlements SG5: To ensure access to equitable affordable and sustainable municipal
serv ices for all citizens
KPA5/SG5/SO10 30 733 35 924 51 801 50 083
SO10: Dev elopment of sustainable v ibrant human settlements SG6: To create a safe and healthy env ironment for all citizens and v isitors
to the Cape Agulhas Municipality
KPA5/SG6/SO10 – – – –
SO11:To promote social and y outh dev elopment SG6: To create a safe and healthy env ironment for all citizens and v isitors
to the Cape Agulhas Municipality
KPA6/SG6/SO11 276 1 319 2 436 1 462
SO12:To create and maintain a safe and healthy env ironment SG6: To create a safe and healthy env ironment for all citizens and v isitors
to the Cape Agulhas Municipality
KPA6/SG6/SO12 12 107 12 297 13 079 13 911
Total Revenue (excluding capital transfers and contributions) 317 544 348 683 388 313 405 108
2018/19 Medium Term Revenue &
Expenditure Framework
Strategic Objective GoalGoal
Code2017/18
R thousand
Full Year
Forecast
Budget Year
2018/19
Budget Year
+1 2019/20
Budget Year
+2 2020/21
SO1: To create a culture of good gov ernance SG1: To ensure good gov ernance and institutional sustainability KPA1/SG1/SO1 20 591 22 807 23 856 25 167
SO2: To create a culture of public participation and empow er
communities to participate in the affairs of the Municipality
SG1: To ensure good gov ernance and institutional sustainability KPA1/SG1/SO2 480 505 530 557
SO3: To create an administration capable of deliv ering on serv ice
ex cellence.
SG2: To ensure institutional sustainability KPA2/SG2/SO3 29 067 29 264 31 714 33 929
SO4: To create an enabling env ironment for economic grow th and
dev elopment
SG3:To promote local economic dev elopment in the Cape Agulhas
Municipal Area
KPA3/SG3/SO4 886 507 534 563
SO5:To promote tourism in the Municipal Area SG3:To promote local economic dev elopment in the Cape Agulhas
Municipal Area
KPA3/SG3/SO5 1 573 1 432 1 498 1 566
SO6: To prov ide effectiv e financial, asset and procurement management SG4: To improv e the financial v iability of the Municipality and ensure its
long term financial sustainability
KPA4/SG4/SO6 42 147 45 008 47 592 50 050
SO7: Prov ision of equitable quality basic serv ices to all households SG5: To ensure access to equitable affordable and sustainable municipal
serv ices for all citizens
KPA5/SG5/SO7 – – – –
SO8: To maintain infrastructure and undertake dev elopment of bulk
infrastructure to ensure sustainable serv ice deliv ery .
SG5: To ensure access to equitable affordable and sustainable municipal
serv ices for all citizens
KPA5/SG5/SO8 146 535 162 298 169 729 178 339
SO9: To prov ide community facilities and serv ices SG5: To ensure access to equitable affordable and sustainable municipal
serv ices for all citizens
KPA5/SG5/SO9 7 135 9 452 8 753 9 262
SO10: Dev elopment of sustainable v ibrant human settlements SG5: To ensure access to equitable affordable and sustainable municipal
serv ices for all citizens
KPA5/SG5/SO10 37 550 42 019 58 301 56 700
SO10: Dev elopment of sustainable v ibrant human settlements SG6: To create a safe and healthy env ironment for all citizens and v isitors
to the Cape Agulhas Municipality
KPA5/SG6/SO10 – – – –
SO11:To promote social and y outh dev elopment SG6: To create a safe and healthy env ironment for all citizens and v isitors
to the Cape Agulhas Municipality
KPA6/SG6/SO11 8 378 8 910 9 096 8 496
SO12:To create and maintain a safe and healthy env ironment SG6: To create a safe and healthy env ironment for all citizens and v isitors
to the Cape Agulhas Municipality
KPA6/SG6/SO12 26 123 31 203 32 179 34 111
Total Expenditure 320 464 353 405 383 781 398 739
2018/19 Medium Term Revenue &
Expenditure Framework
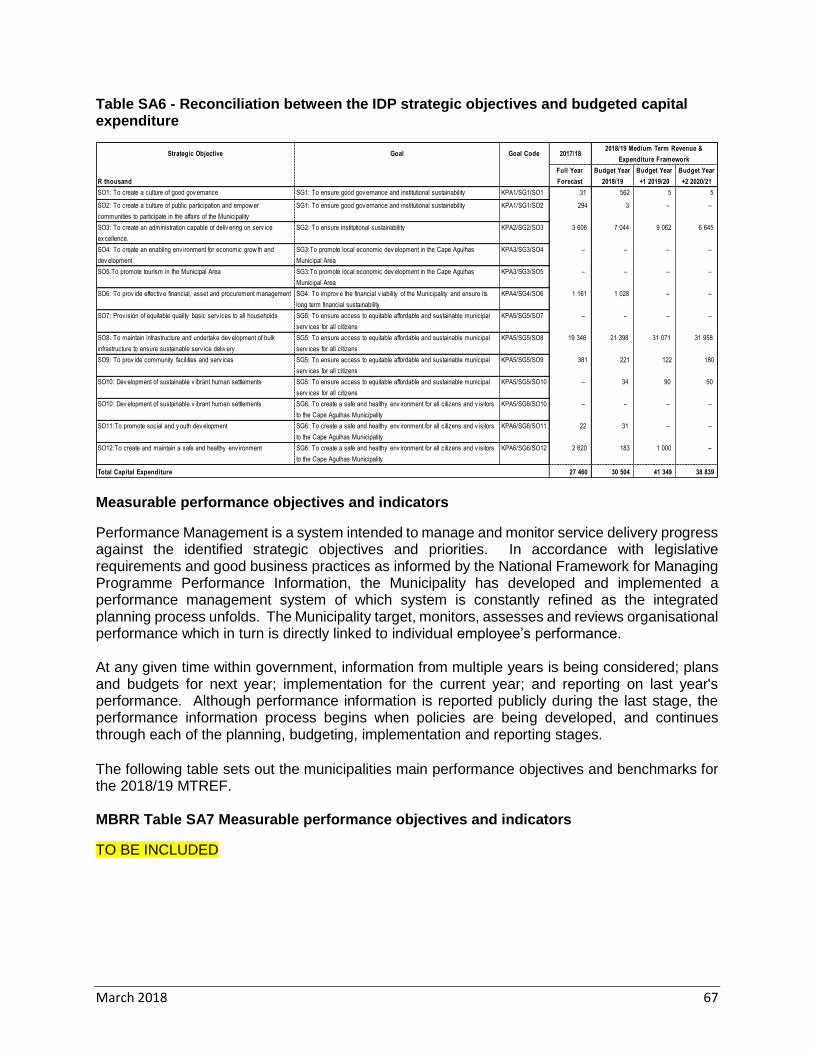
March 2018 67
Table SA6 - Reconciliation between the IDP strategic objectives and budgeted capital expenditure
Measurable performance objectives and indicators
Performance Management is a system intended to manage and monitor service delivery progress against the identified strategic objectives and priorities. In accordance with legislative requirements and good business practices as informed by the National Framework for Managing Programme Performance Information, the Municipality has developed and implemented a performance management system of which system is constantly refined as the integrated planning process unfolds. The Municipality target, monitors, assesses and reviews organisational performance which in turn is directly linked to individual employee’s performance. At any given time within government, information from multiple years is being considered; plans and budgets for next year; implementation for the current year; and reporting on last year's performance. Although performance information is reported publicly during the last stage, the performance information process begins when policies are being developed, and continues through each of the planning, budgeting, implementation and reporting stages. The following table sets out the municipalities main performance objectives and benchmarks for the 2018/19 MTREF. MBRR Table SA7 Measurable performance objectives and indicators
TO BE INCLUDED
Strategic Objective Goal Goal Code 2017/18
R thousand
Full Year
Forecast
Budget Year
2018/19
Budget Year
+1 2019/20
Budget Year
+2 2020/21
SO1: To create a culture of good gov ernance SG1: To ensure good gov ernance and institutional sustainability KPA1/SG1/SO1 31 562 5 5
SO2: To create a culture of public participation and empow er
communities to participate in the affairs of the Municipality
SG1: To ensure good gov ernance and institutional sustainability KPA1/SG1/SO2 294 3 – –
SO3: To create an administration capable of deliv ering on serv ice
ex cellence.
SG2: To ensure institutional sustainability KPA2/SG2/SO3 3 606 7 044 9 062 6 645
SO4: To create an enabling env ironment for economic grow th and
dev elopment
SG3:To promote local economic dev elopment in the Cape Agulhas
Municipal Area
KPA3/SG3/SO4 – – – –
SO5:To promote tourism in the Municipal Area SG3:To promote local economic dev elopment in the Cape Agulhas
Municipal Area
KPA3/SG3/SO5 – – – –
SO6: To prov ide effectiv e financial, asset and procurement management SG4: To improv e the financial v iability of the Municipality and ensure its
long term financial sustainability
KPA4/SG4/SO6 1 161 1 028 – –
SO7: Prov ision of equitable quality basic serv ices to all households SG5: To ensure access to equitable affordable and sustainable municipal
serv ices for all citizens
KPA5/SG5/SO7 – – – –
SO8: To maintain infrastructure and undertake dev elopment of bulk
infrastructure to ensure sustainable serv ice deliv ery .
SG5: To ensure access to equitable affordable and sustainable municipal
serv ices for all citizens
KPA5/SG5/SO8 19 346 21 398 31 071 31 958
SO9: To prov ide community facilities and serv ices SG5: To ensure access to equitable affordable and sustainable municipal
serv ices for all citizens
KPA5/SG5/SO9 381 221 122 180
SO10: Dev elopment of sustainable v ibrant human settlements SG5: To ensure access to equitable affordable and sustainable municipal
serv ices for all citizens
KPA5/SG5/SO10 – 34 90 50
SO10: Dev elopment of sustainable v ibrant human settlements SG6: To create a safe and healthy env ironment for all citizens and v isitors
to the Cape Agulhas Municipality
KPA5/SG6/SO10 – – – –
SO11:To promote social and y outh dev elopment SG6: To create a safe and healthy env ironment for all citizens and v isitors
to the Cape Agulhas Municipality
KPA6/SG6/SO11 22 31 – –
SO12:To create and maintain a safe and healthy env ironment SG6: To create a safe and healthy env ironment for all citizens and v isitors
to the Cape Agulhas Municipality
KPA6/SG6/SO12 2 620 183 1 000 –
Total Capital Expenditure 27 460 30 504 41 349 38 839
2018/19 Medium Term Revenue &
Expenditure Framework
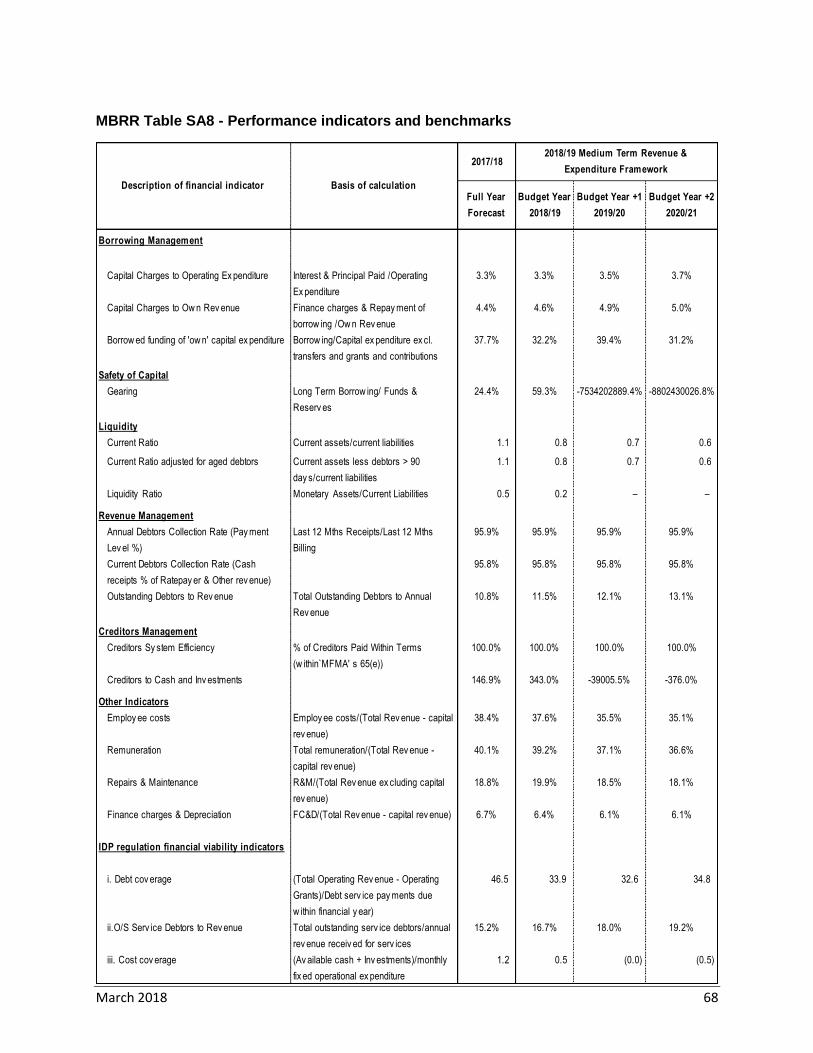
March 2018 68
MBRR Table SA8 - Performance indicators and benchmarks
2017/18
Full Year
Forecast
Budget Year
2018/19
Budget Year +1
2019/20
Budget Year +2
2020/21
Borrowing Management
Capital Charges to Operating Ex penditure Interest & Principal Paid /Operating
Ex penditure
3.3% 3.3% 3.5% 3.7%
Capital Charges to Ow n Rev enue Finance charges & Repay ment of
borrow ing /Ow n Rev enue
4.4% 4.6% 4.9% 5.0%
Borrow ed funding of 'ow n' capital ex penditure Borrow ing/Capital ex penditure ex cl.
transfers and grants and contributions
37.7% 32.2% 39.4% 31.2%
Safety of Capital
Gearing Long Term Borrow ing/ Funds &
Reserv es
24.4% 59.3% -7534202889.4% -8802430026.8%
Liquidity
Current Ratio Current assets/current liabilities 1.1 0.8 0.7 0.6
Current Ratio adjusted for aged debtors Current assets less debtors > 90
day s/current liabilities
1.1 0.8 0.7 0.6
Liquidity Ratio Monetary Assets/Current Liabilities 0.5 0.2 – –
Revenue Management
Annual Debtors Collection Rate (Pay ment
Lev el %)
Last 12 Mths Receipts/Last 12 Mths
Billing
95.9% 95.9% 95.9% 95.9%
Current Debtors Collection Rate (Cash
receipts % of Ratepay er & Other rev enue)
95.8% 95.8% 95.8% 95.8%
Outstanding Debtors to Rev enue Total Outstanding Debtors to Annual
Rev enue
10.8% 11.5% 12.1% 13.1%
Creditors Management
Creditors Sy stem Efficiency % of Creditors Paid Within Terms
(w ithin`MFMA' s 65(e))
100.0% 100.0% 100.0% 100.0%
Creditors to Cash and Inv estments 146.9% 343.0% -39005.5% -376.0%
Other Indicators
Employ ee costs Employ ee costs/(Total Rev enue - capital
rev enue)
38.4% 37.6% 35.5% 35.1%
Remuneration Total remuneration/(Total Rev enue -
capital rev enue)
40.1% 39.2% 37.1% 36.6%
Repairs & Maintenance R&M/(Total Rev enue ex cluding capital
rev enue)
18.8% 19.9% 18.5% 18.1%
Finance charges & Depreciation FC&D/(Total Rev enue - capital rev enue) 6.7% 6.4% 6.1% 6.1%
IDP regulation financial viability indicators
i. Debt cov erage (Total Operating Rev enue - Operating
Grants)/Debt serv ice pay ments due
w ithin financial y ear)
46.5 33.9 32.6 34.8
ii.O/S Serv ice Debtors to Rev enue Total outstanding serv ice debtors/annual
rev enue receiv ed for serv ices
15.2% 16.7% 18.0% 19.2%
iii. Cost cov erage (Av ailable cash + Inv estments)/monthly
fix ed operational ex penditure
1.2 0.5 (0.0) (0.5)
Description of financial indicator Basis of calculation
2018/19 Medium Term Revenue &
Expenditure Framework

March 2018 69
Performance indicators and benchmarks
2.2.1.1 Borrowing Management
Capital expenditure in local government can be funded by capital grants, own-source revenue and long term borrowing. The ability of a municipality to raise long term borrowing is largely dependent on its creditworthiness and financial position.
2.2.1.2 Safety of Capital
The gearing ratio is a measure of the total long term borrowings over funds and reserves.
2.2.1.3 Liquidity
• Current ratio is a measure of the current assets divided by the current liabilities and as a benchmark the Municipality has set a limit of 2, hence at no point in time should this ratio be less than 2.
• The liquidity ratio is a measure of the ability of the municipality to utilize cash and cash equivalents to extinguish or retire its current liabilities immediately. Ideally the municipality should have the equivalent cash and cash equivalents on hand to meet at least the current liabilities, which should translate into a liquidity ratio of 1. Anything below 1 indicates a shortage in cash to meet creditor obligations.
2.2.1.4 Revenue Management
• As part of the financial sustainability strategy, an aggressive revenue management framework has been implemented to increase cash inflow, not only from current billings but also from debtors that are in arrears in excess of 90 days. The intention of the strategy is to streamline the revenue value chain by ensuring accurate billing, customer service, credit control and debt collection. Payment levels and credit control is considered to be favorable.
2.2.1.5 Creditors Management
• The Municipality has managed to ensure that creditors are settled within the legislated 30 days of invoice or statement. This has had a favorable impact on suppliers’ perceptions of risk of doing business with the Municipality, which is expected to benefit the Municipality in the form of more competitive pricing of tenders, as suppliers compete for the Municipality’s business.
2.2.1.6 Other Indicators
• Employee costs is one of the main cost drivers in any municipality. Any increase in this balance should be carefully considered.
• Repairs and maintenance as percentage of operating revenue is showing improved levels when compared to previous budget cycles. This is mainly due to improved cost allocations, where items such as Employee Related Costs and Contracted Services are now being more accurately allocated to maintenance projects.
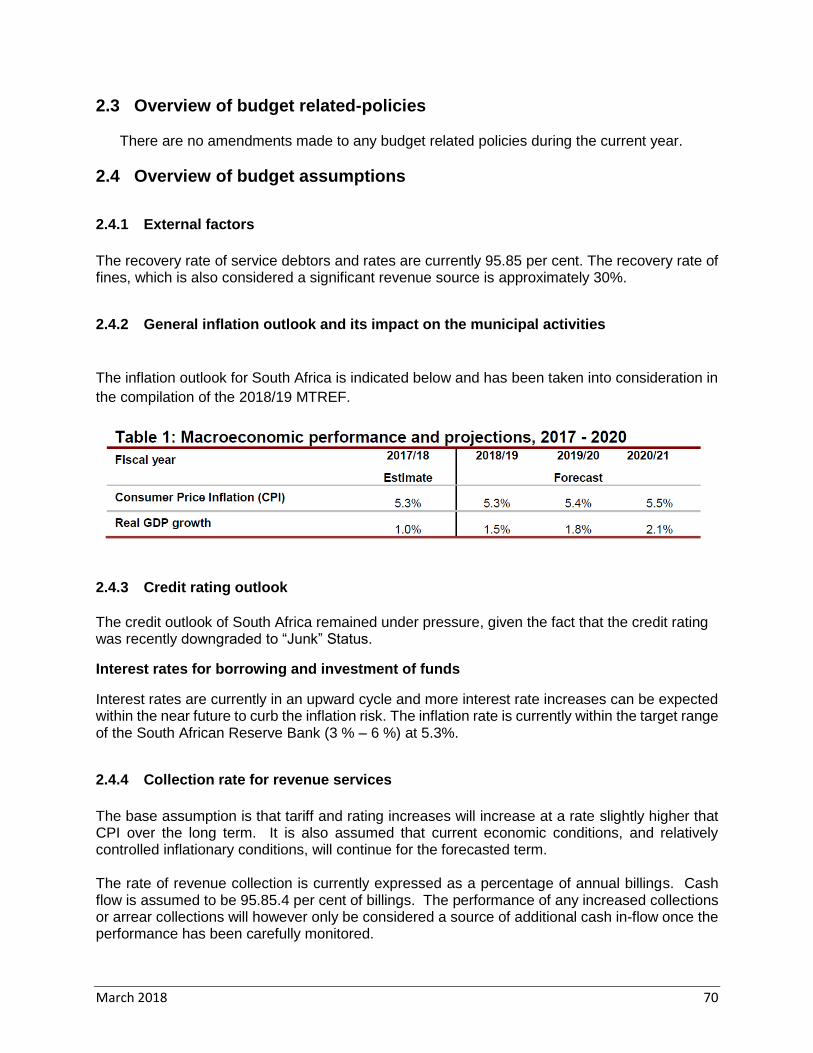
March 2018 70
2.3 Overview of budget related-policies There are no amendments made to any budget related policies during the current year.
2.4 Overview of budget assumptions
2.4.1 External factors
The recovery rate of service debtors and rates are currently 95.85 per cent. The recovery rate of fines, which is also considered a significant revenue source is approximately 30%.
2.4.2 General inflation outlook and its impact on the municipal activities
The inflation outlook for South Africa is indicated below and has been taken into consideration in
the compilation of the 2018/19 MTREF.
2.4.3 Credit rating outlook
The credit outlook of South Africa remained under pressure, given the fact that the credit rating was recently downgraded to “Junk” Status.
Interest rates for borrowing and investment of funds
Interest rates are currently in an upward cycle and more interest rate increases can be expected within the near future to curb the inflation risk. The inflation rate is currently within the target range of the South African Reserve Bank (3 % – 6 %) at 5.3%.
2.4.4 Collection rate for revenue services
The base assumption is that tariff and rating increases will increase at a rate slightly higher that CPI over the long term. It is also assumed that current economic conditions, and relatively controlled inflationary conditions, will continue for the forecasted term. The rate of revenue collection is currently expressed as a percentage of annual billings. Cash flow is assumed to be 95.85.4 per cent of billings. The performance of any increased collections or arrear collections will however only be considered a source of additional cash in-flow once the performance has been carefully monitored.
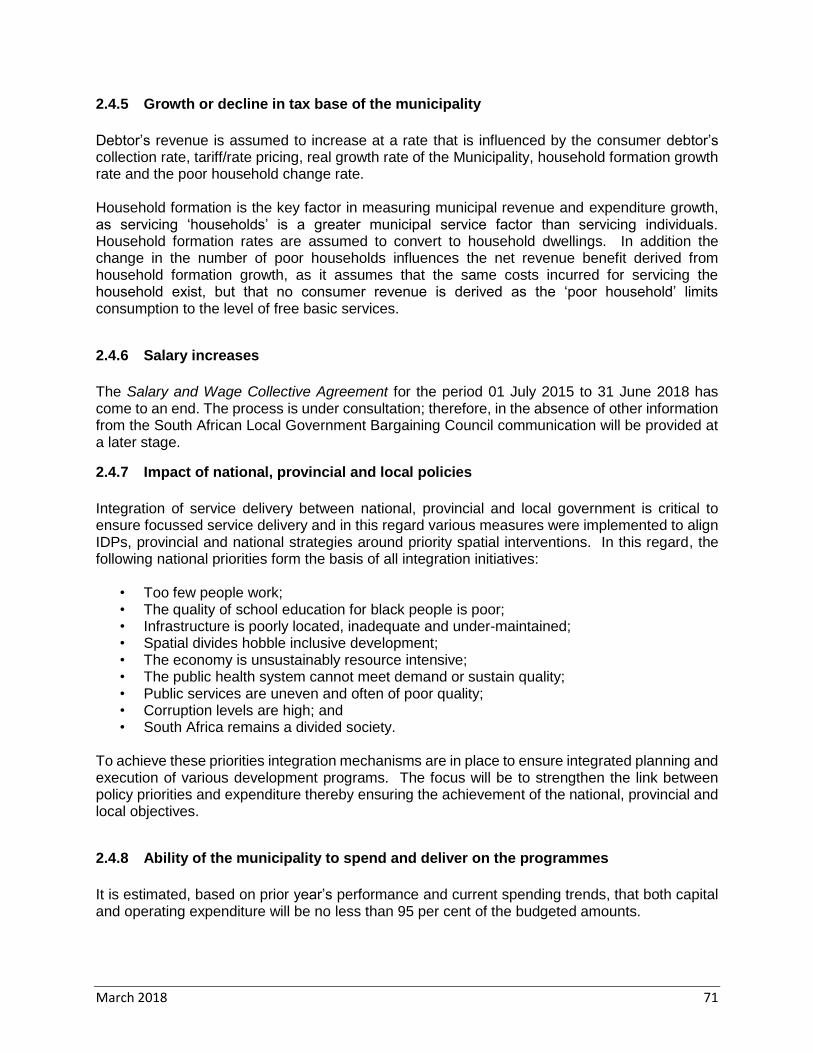
March 2018 71
2.4.5 Growth or decline in tax base of the municipality
Debtor’s revenue is assumed to increase at a rate that is influenced by the consumer debtor’s collection rate, tariff/rate pricing, real growth rate of the Municipality, household formation growth rate and the poor household change rate. Household formation is the key factor in measuring municipal revenue and expenditure growth, as servicing ‘households’ is a greater municipal service factor than servicing individuals. Household formation rates are assumed to convert to household dwellings. In addition the change in the number of poor households influences the net revenue benefit derived from household formation growth, as it assumes that the same costs incurred for servicing the household exist, but that no consumer revenue is derived as the ‘poor household’ limits consumption to the level of free basic services.
2.4.6 Salary increases
The Salary and Wage Collective Agreement for the period 01 July 2015 to 31 June 2018 has come to an end. The process is under consultation; therefore, in the absence of other information from the South African Local Government Bargaining Council communication will be provided at a later stage.
2.4.7 Impact of national, provincial and local policies
Integration of service delivery between national, provincial and local government is critical to ensure focussed service delivery and in this regard various measures were implemented to align IDPs, provincial and national strategies around priority spatial interventions. In this regard, the following national priorities form the basis of all integration initiatives:
• Too few people work; • The quality of school education for black people is poor; • Infrastructure is poorly located, inadequate and under-maintained; • Spatial divides hobble inclusive development; • The economy is unsustainably resource intensive; • The public health system cannot meet demand or sustain quality; • Public services are uneven and often of poor quality; • Corruption levels are high; and • South Africa remains a divided society.
To achieve these priorities integration mechanisms are in place to ensure integrated planning and execution of various development programs. The focus will be to strengthen the link between policy priorities and expenditure thereby ensuring the achievement of the national, provincial and local objectives.
2.4.8 Ability of the municipality to spend and deliver on the programmes
It is estimated, based on prior year’s performance and current spending trends, that both capital and operating expenditure will be no less than 95 per cent of the budgeted amounts.
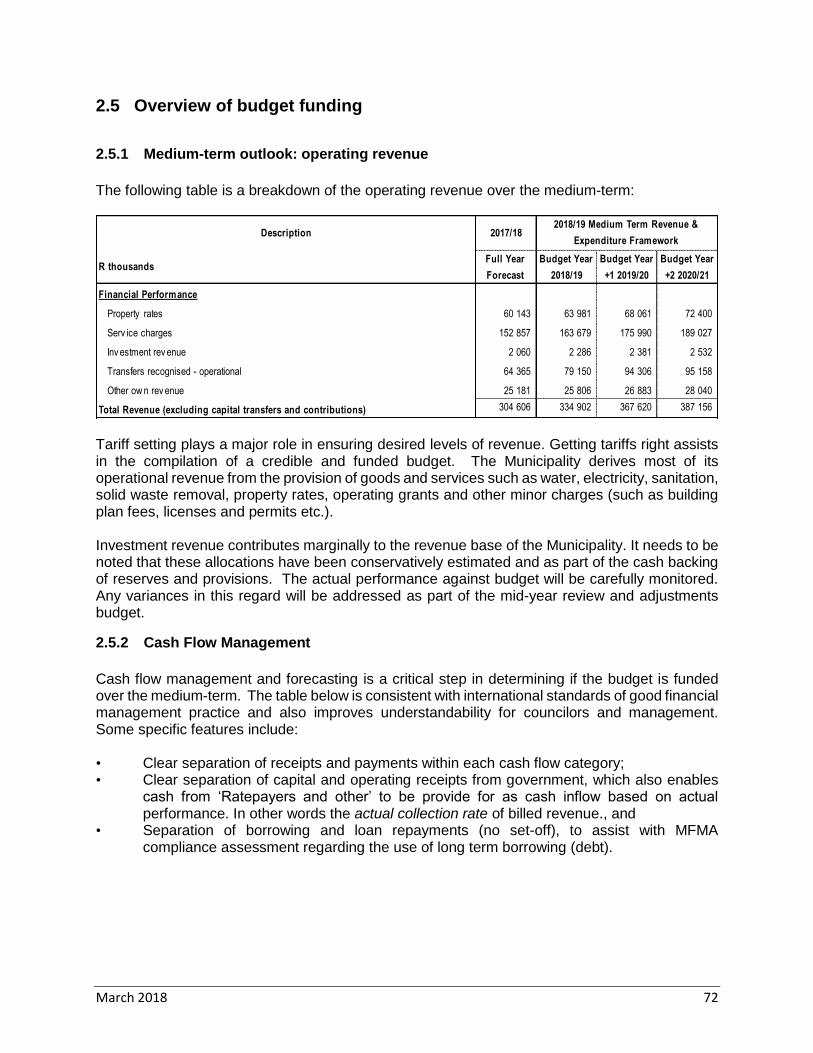
March 2018 72
2.5 Overview of budget funding
2.5.1 Medium-term outlook: operating revenue
The following table is a breakdown of the operating revenue over the medium-term:
Tariff setting plays a major role in ensuring desired levels of revenue. Getting tariffs right assists in the compilation of a credible and funded budget. The Municipality derives most of its operational revenue from the provision of goods and services such as water, electricity, sanitation, solid waste removal, property rates, operating grants and other minor charges (such as building plan fees, licenses and permits etc.). Investment revenue contributes marginally to the revenue base of the Municipality. It needs to be noted that these allocations have been conservatively estimated and as part of the cash backing of reserves and provisions. The actual performance against budget will be carefully monitored. Any variances in this regard will be addressed as part of the mid-year review and adjustments budget.
2.5.2 Cash Flow Management
Cash flow management and forecasting is a critical step in determining if the budget is funded over the medium-term. The table below is consistent with international standards of good financial management practice and also improves understandability for councilors and management. Some specific features include: • Clear separation of receipts and payments within each cash flow category; • Clear separation of capital and operating receipts from government, which also enables
cash from ‘Ratepayers and other’ to be provide for as cash inflow based on actual performance. In other words the actual collection rate of billed revenue., and
• Separation of borrowing and loan repayments (no set-off), to assist with MFMA compliance assessment regarding the use of long term borrowing (debt).
Description 2017/18
R thousandsFull Year
Forecast
Budget Year
2018/19
Budget Year
+1 2019/20
Budget Year
+2 2020/21
Financial Performance
Property rates 60 143 63 981 68 061 72 400
Serv ice charges 152 857 163 679 175 990 189 027
Inv estment rev enue 2 060 2 286 2 381 2 532
Transfers recognised - operational 64 365 79 150 94 306 95 158
Other ow n rev enue 25 181 25 806 26 883 28 040
Total Revenue (excluding capital transfers and contributions) 304 606 334 902 367 620 387 156
2018/19 Medium Term Revenue &
Expenditure Framework
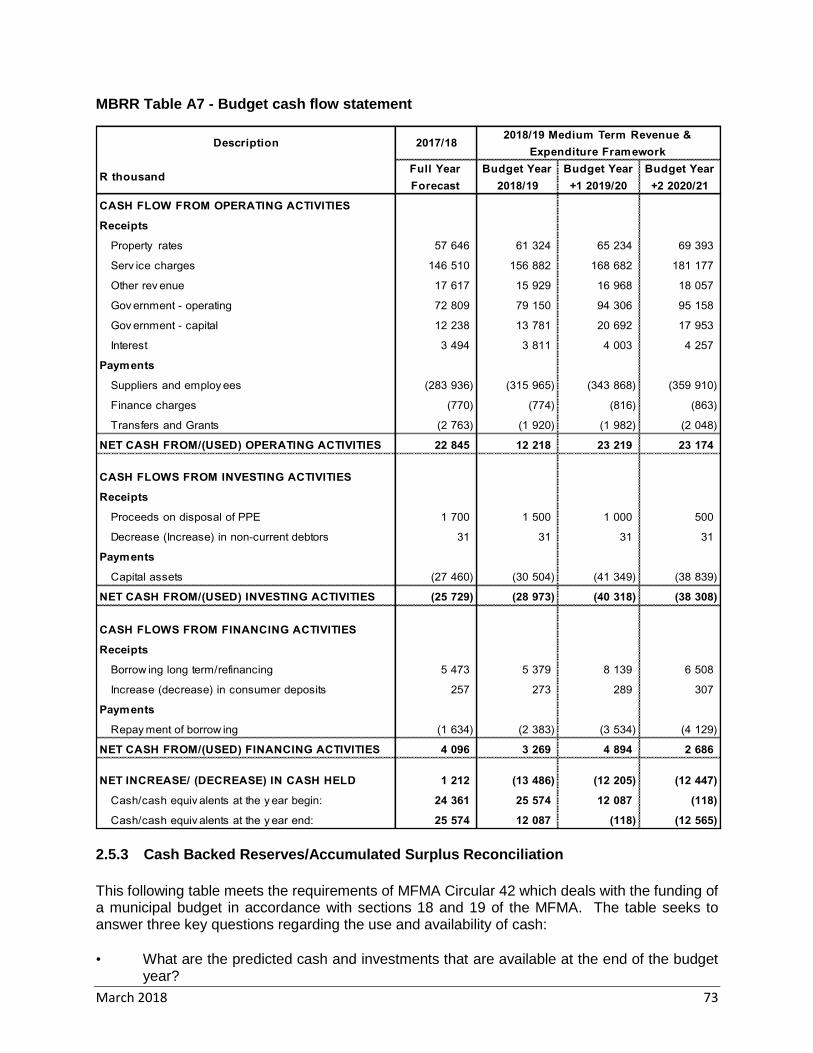
March 2018 73
MBRR Table A7 - Budget cash flow statement
2.5.3 Cash Backed Reserves/Accumulated Surplus Reconciliation
This following table meets the requirements of MFMA Circular 42 which deals with the funding of a municipal budget in accordance with sections 18 and 19 of the MFMA. The table seeks to answer three key questions regarding the use and availability of cash: • What are the predicted cash and investments that are available at the end of the budget
year?
Description 2017/18
R thousandFull Year
Forecast
Budget Year
2018/19
Budget Year
+1 2019/20
Budget Year
+2 2020/21
CASH FLOW FROM OPERATING ACTIVITIES
Receipts
Property rates 57 646 61 324 65 234 69 393
Serv ice charges 146 510 156 882 168 682 181 177
Other rev enue 17 617 15 929 16 968 18 057
Gov ernment - operating 72 809 79 150 94 306 95 158
Gov ernment - capital 12 238 13 781 20 692 17 953
Interest 3 494 3 811 4 003 4 257
Payments
Suppliers and employ ees (283 936) (315 965) (343 868) (359 910)
Finance charges (770) (774) (816) (863)
Transfers and Grants (2 763) (1 920) (1 982) (2 048)
NET CASH FROM/(USED) OPERATING ACTIVITIES 22 845 12 218 23 219 23 174
CASH FLOWS FROM INVESTING ACTIVITIES
Receipts
Proceeds on disposal of PPE 1 700 1 500 1 000 500
Decrease (Increase) in non-current debtors 31 31 31 31
Payments
Capital assets (27 460) (30 504) (41 349) (38 839)
NET CASH FROM/(USED) INVESTING ACTIVITIES (25 729) (28 973) (40 318) (38 308)
CASH FLOWS FROM FINANCING ACTIVITIES
Receipts
Borrow ing long term/refinancing 5 473 5 379 8 139 6 508
Increase (decrease) in consumer deposits 257 273 289 307
Payments
Repay ment of borrow ing (1 634) (2 383) (3 534) (4 129)
NET CASH FROM/(USED) FINANCING ACTIVITIES 4 096 3 269 4 894 2 686
NET INCREASE/ (DECREASE) IN CASH HELD 1 212 (13 486) (12 205) (12 447)
Cash/cash equiv alents at the y ear begin: 24 361 25 574 12 087 (118)
Cash/cash equiv alents at the y ear end: 25 574 12 087 (118) (12 565)
2018/19 Medium Term Revenue &
Expenditure Framework

March 2018 74
• How are those funds used? • What is the net funds available or funding shortfall? A surplus would indicate the cash-backed accumulated surplus that was/is available. A shortfall (applications > cash and investments) is indicative of non-compliance with section 18 of the MFMA requirement that the municipality’s budget must be ‘funded’. Non-compliance with section 18 is assumed because a shortfall would indirectly indicate that the annual budget is not appropriately funded (budgeted spending is greater than funds available or to be collected). It is also important to analyse trends to understand the consequences, e.g. the budget year might indicate a small surplus situation, which in itself is an appropriate outcome, but if in prior years there were much larger surpluses then this negative trend may be a concern that requires closer examination. MBRR Table A8 - Cash backed reserves/accumulated surplus reconciliation
The municipality will not be cash funded for the entire MTREF. It is very important for the municipality to increase cash levels in order to allow for a contribution to the capital replacement reserve and support the financial viability of the municipality as a whole. Unspent conditional transfers (grants) are automatically assumed to be an obligation as the municipality has received government transfers in advance of meeting the conditions. Ordinarily, unless there are special circumstances, the municipality is obligated to return unspent conditional grant funds to the national revenue fund at the end of the financial year. The main purpose of other working capital is to ensure that sufficient funds are available to meet obligations as they fall due. A key challenge is often the mismatch between the timing of receipts of funds from debtors and payments due to employees and creditors. High levels of debtor non-payment and receipt delays will have a greater requirement for working capital, resulting in cash flow challenges.
2.5.4 Funding compliance measurement
National Treasury requires that the municipality assess its financial sustainability against fourteen different measures that look at various aspects of the financial health of the municipality. These measures are contained in the following table. All the information comes directly from the annual
Description 2017/18
R thousandFull Year
Forecast
Budget Year
2018/19
Budget Year
+1 2019/20
Budget Year
+2 2020/21
Cash and investments available
Cash/cash equiv alents at the y ear end 25 574 12 087 (118) (12 565)
Cash and investments available: 25 574 12 087 (118) (12 565)
Application of cash and investments
Other w orking capital requirements 6 726 5 802 4 724 86
Reserv es to be backed by cash/inv estments 20 000 12 000 – –
Total Application of cash and investments: 26 726 17 802 4 724 86
Surplus(shortfall) (1 152) (5 715) (4 842) (12 652)
2018/19 Medium Term Revenue &
Expenditure Framework
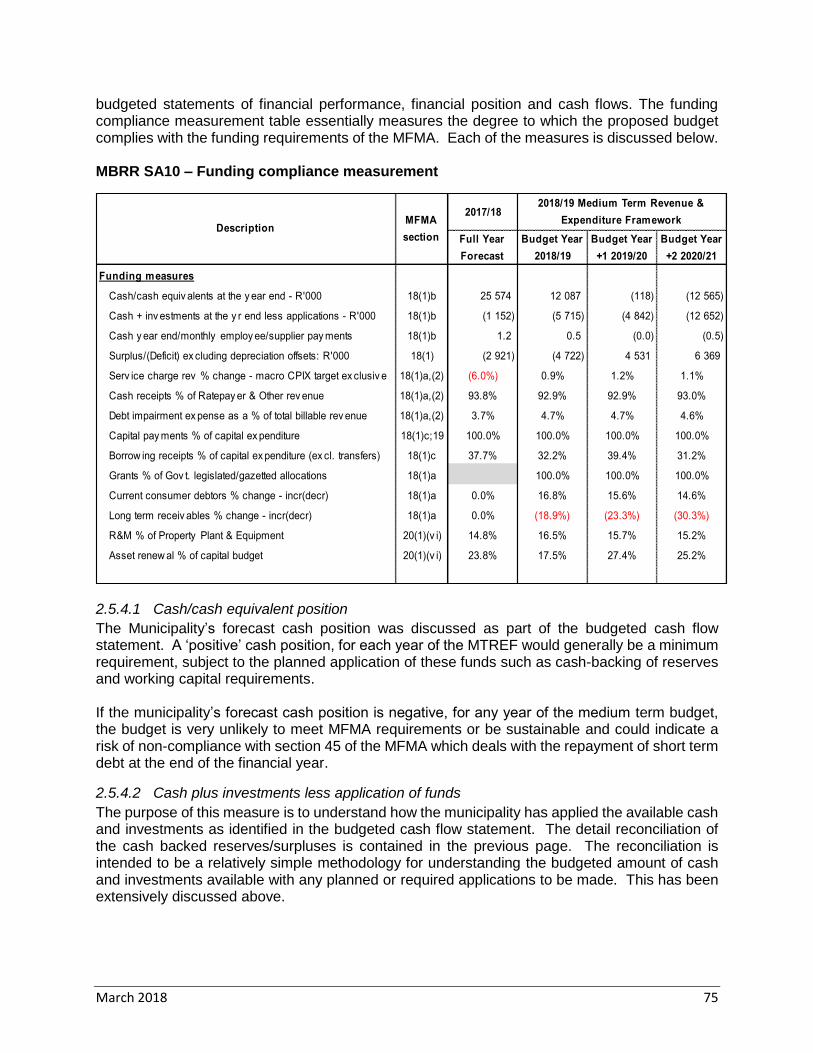
March 2018 75
budgeted statements of financial performance, financial position and cash flows. The funding compliance measurement table essentially measures the degree to which the proposed budget complies with the funding requirements of the MFMA. Each of the measures is discussed below. MBRR SA10 – Funding compliance measurement
2.5.4.1 Cash/cash equivalent position
The Municipality’s forecast cash position was discussed as part of the budgeted cash flow statement. A ‘positive’ cash position, for each year of the MTREF would generally be a minimum requirement, subject to the planned application of these funds such as cash-backing of reserves and working capital requirements. If the municipality’s forecast cash position is negative, for any year of the medium term budget, the budget is very unlikely to meet MFMA requirements or be sustainable and could indicate a risk of non-compliance with section 45 of the MFMA which deals with the repayment of short term debt at the end of the financial year.
2.5.4.2 Cash plus investments less application of funds
The purpose of this measure is to understand how the municipality has applied the available cash and investments as identified in the budgeted cash flow statement. The detail reconciliation of the cash backed reserves/surpluses is contained in the previous page. The reconciliation is intended to be a relatively simple methodology for understanding the budgeted amount of cash and investments available with any planned or required applications to be made. This has been extensively discussed above.
2017/18
Full Year
Forecast
Budget Year
2018/19
Budget Year
+1 2019/20
Budget Year
+2 2020/21
Funding measures
Cash/cash equiv alents at the y ear end - R'000 18(1)b 25 574 12 087 (118) (12 565)
Cash + inv estments at the y r end less applications - R'000 18(1)b (1 152) (5 715) (4 842) (12 652)
Cash y ear end/monthly employ ee/supplier pay ments 18(1)b 1.2 0.5 (0.0) (0.5)
Surplus/(Deficit) ex cluding depreciation offsets: R'000 18(1) (2 921) (4 722) 4 531 6 369
Serv ice charge rev % change - macro CPIX target ex clusiv e 18(1)a,(2) (6.0%) 0.9% 1.2% 1.1%
Cash receipts % of Ratepay er & Other rev enue 18(1)a,(2) 93.8% 92.9% 92.9% 93.0%
Debt impairment ex pense as a % of total billable rev enue 18(1)a,(2) 3.7% 4.7% 4.7% 4.6%
Capital pay ments % of capital ex penditure 18(1)c;19 100.0% 100.0% 100.0% 100.0%
Borrow ing receipts % of capital ex penditure (ex cl. transfers) 18(1)c 37.7% 32.2% 39.4% 31.2%
Grants % of Gov t. legislated/gazetted allocations 18(1)a 100.0% 100.0% 100.0%
Current consumer debtors % change - incr(decr) 18(1)a 0.0% 16.8% 15.6% 14.6%
Long term receiv ables % change - incr(decr) 18(1)a 0.0% (18.9%) (23.3%) (30.3%)
R&M % of Property Plant & Equipment 20(1)(v i) 14.8% 16.5% 15.7% 15.2%
Asset renew al % of capital budget 20(1)(v i) 23.8% 17.5% 27.4% 25.2%
DescriptionMFMA
section
2018/19 Medium Term Revenue &
Expenditure Framework
March 2018 76
2.5.4.3 Monthly average payments covered by cash or cash equivalents
The purpose of this measure is to understand the level of financial risk should the municipality be under stress from a collection and cash in-flow perspective. Regardless of the annual cash position an evaluation should be made of the ability of the Municipality to meet monthly payments as and when they fall due. It is especially important to consider the position should the municipality be faced with an unexpected disaster that threatens revenue collection such as rate boycotts.
2.5.4.4 Surplus/deficit excluding depreciation offsets
The main purpose of this measure is to understand if the revenue levels are sufficient to conclude that the community is making a sufficient contribution for the municipal resources consumed each year. An ‘adjusted’ surplus/deficit is achieved by offsetting the amount of depreciation related to externally funded assets. Municipalities need to assess the result of this calculation taking into consideration its own circumstances and levels of backlogs. If the outcome is a deficit, it may indicate that rates and service charges are insufficient to ensure that the community is making a sufficient contribution toward the economic benefits they are consuming over the medium term. It needs to be noted that a surplus or deficit does not necessarily mean that the budget is funded from a cash flow perspective and the first two measures in the table are therefore critical.
2.5.4.5 Property Rates/service charge revenue as a percentage increase less macro inflation
target
The purpose of this measure is to understand whether the municipality is contributing appropriately to the achievement of national inflation targets. This measure is based on the increase in ‘revenue’, which will include both the change in the tariff as well as any assumption about real growth such as new property development, services consumption growth etc. The factor is calculated by deducting the maximum macro-economic inflation target increase (which is currently 3 - 6 per cent). The result is intended to be an approximation of the real increase in revenue.
2.5.4.6 Cash receipts as a percentage of ratepayer and other revenue
This factor is a macro measure of the rate at which funds are ‘collected’. This measure is intended to analyse the underlying assumed collection rate for the MTREF to determine the relevance and credibility of the budget assumptions contained in the budget. Given that the assumed collection rate was based on a 95 per cent performance target, the cash flow statement has been conservatively determined when compared to actual results in 2016/2017. However, the percentage in the above table includes direct receipts for services being paid in cash such as agency services and permits. This measure and performance objective will have to be meticulously managed. Should performance with the mid-year review and adjustments be positive in relation to actual collections of billed revenue, the adjustments budget will be amended accordingly.
2.5.4.7 Debt impairment expense as a percentage of billable revenue
This factor measures whether the provision for debt impairment is being adequately funded and is based on the underlying assumption that the provision for debt impairment (doubtful and bad debts) has to be increased to offset under-collection of billed revenues.
March 2018 77
2.5.4.8 Capital payments percentage of capital expenditure
The purpose of this measure is to determine whether the timing of payments has been taken into consideration when forecasting the cash position. It can be seen that a 100 per cent payments has been factored into the cash position forecasted over the entire financial year.
2.5.4.9 Transfers/grants revenue as a percentage of Government transfers/grants available
The purpose of this measurement is mainly to ensure that all available transfers from national and provincial government have been budgeted for. A percentage less than 100 per cent could indicate that not all grants as contained in the Division of Revenue Act (DoRA) have been budgeted for. The Municipality has budgeted for all transfers and therefore no percentage is being shown as outstanding.
2.5.4.10 Consumer debtors change (Current and Non-current)
The purpose of these measures is to ascertain whether budgeted reductions in outstanding debtors are realistic. There are 2 measures shown for this factor; the change in current debtors and the change in long term receivables, both from the Budgeted Financial Position. Both measures show a relatively stable trend in line with the Municipality’s policy of settling debtors accounts within 30 days.
2.5.4.11 Repairs and maintenance expenditure level
This measure must be considered important within the context of the funding measures criteria because a trend that indicates insufficient funds are being committed to asset repair could also indicate that the overall budget is not credible and/or sustainable in the medium to long term because the revenue budget is not being protected. .
2.5.4.12 Asset renewal/rehabilitation expenditure level
This measure has a similar objective to aforementioned objective relating to repairs and maintenance. A requirement of the detailed capital budget is to categorise each capital project as a new asset or a renewal/rehabilitation project. The objective is to summarise and understand the proportion of budgets being provided for new assets and also asset sustainability. A declining or low level of renewal funding may indicate that a budget is not credible and/or sustainable and future revenue is not being protected, similar to the justification for ‘repairs and maintenance’ budgets.
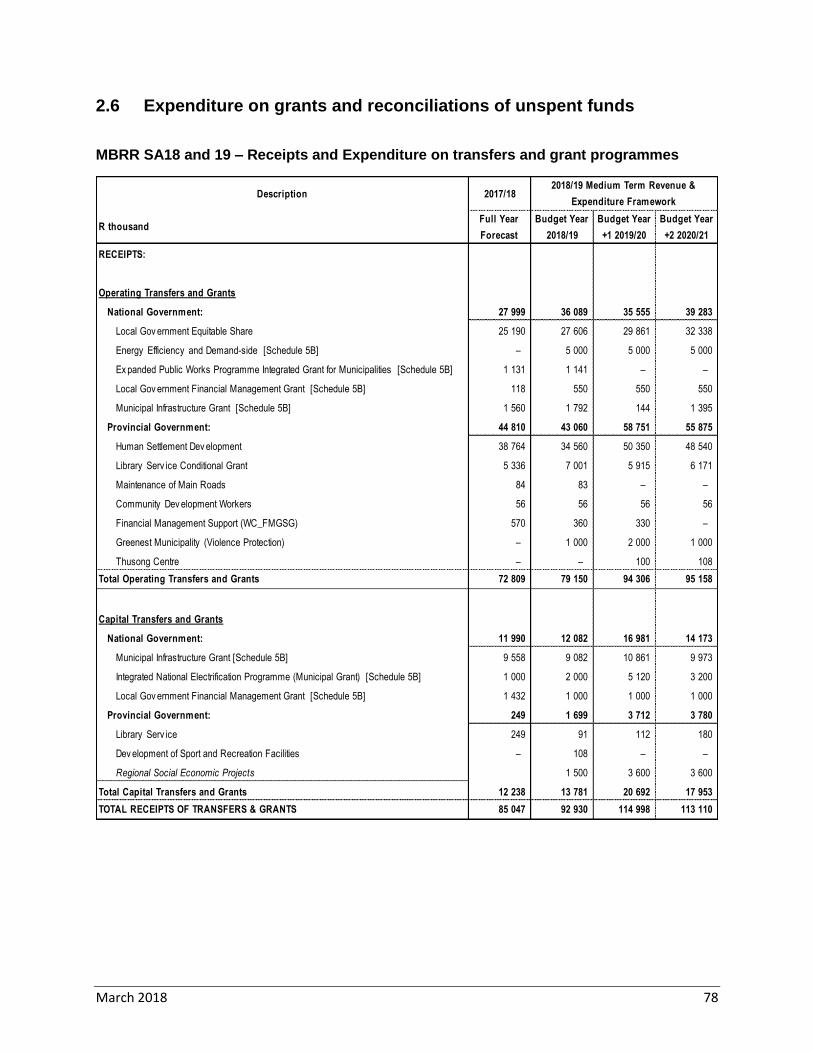
March 2018 78
2.6 Expenditure on grants and reconciliations of unspent funds
MBRR SA18 and 19 – Receipts and Expenditure on transfers and grant programmes
Description 2017/18
R thousandFull Year
Forecast
Budget Year
2018/19
Budget Year
+1 2019/20
Budget Year
+2 2020/21
RECEIPTS:
Operating Transfers and Grants
National Government: 27 999 36 089 35 555 39 283
Local Gov ernment Equitable Share 25 190 27 606 29 861 32 338
Energy Efficiency and Demand-side [Schedule 5B] – 5 000 5 000 5 000
Ex panded Public Works Programme Integrated Grant for Municipalities [Schedule 5B] 1 131 1 141 – –
Local Gov ernment Financial Management Grant [Schedule 5B] 118 550 550 550
Municipal Infrastructure Grant [Schedule 5B] 1 560 1 792 144 1 395
Provincial Government: 44 810 43 060 58 751 55 875
Human Settlement Dev elopment 38 764 34 560 50 350 48 540
Library Serv ice Conditional Grant 5 336 7 001 5 915 6 171
Maintenance of Main Roads 84 83 – –
Community Dev elopment Workers 56 56 56 56
Financial Management Support (WC_FMGSG) 570 360 330 –
Greenest Municipality (Violence Protection) – 1 000 2 000 1 000
Thusong Centre – – 100 108
Total Operating Transfers and Grants 72 809 79 150 94 306 95 158
Capital Transfers and Grants
National Government: 11 990 12 082 16 981 14 173
Municipal Infrastructure Grant [Schedule 5B] 9 558 9 082 10 861 9 973
Integrated National Electrification Programme (Municipal Grant) [Schedule 5B] 1 000 2 000 5 120 3 200
Local Gov ernment Financial Management Grant [Schedule 5B] 1 432 1 000 1 000 1 000
Provincial Government: 249 1 699 3 712 3 780
Library Serv ice 249 91 112 180
Dev elopment of Sport and Recreation Facilities – 108 – –
Regional Social Economic Projects 1 500 3 600 3 600
Total Capital Transfers and Grants 12 238 13 781 20 692 17 953
TOTAL RECEIPTS OF TRANSFERS & GRANTS 85 047 92 930 114 998 113 110
2018/19 Medium Term Revenue &
Expenditure Framework
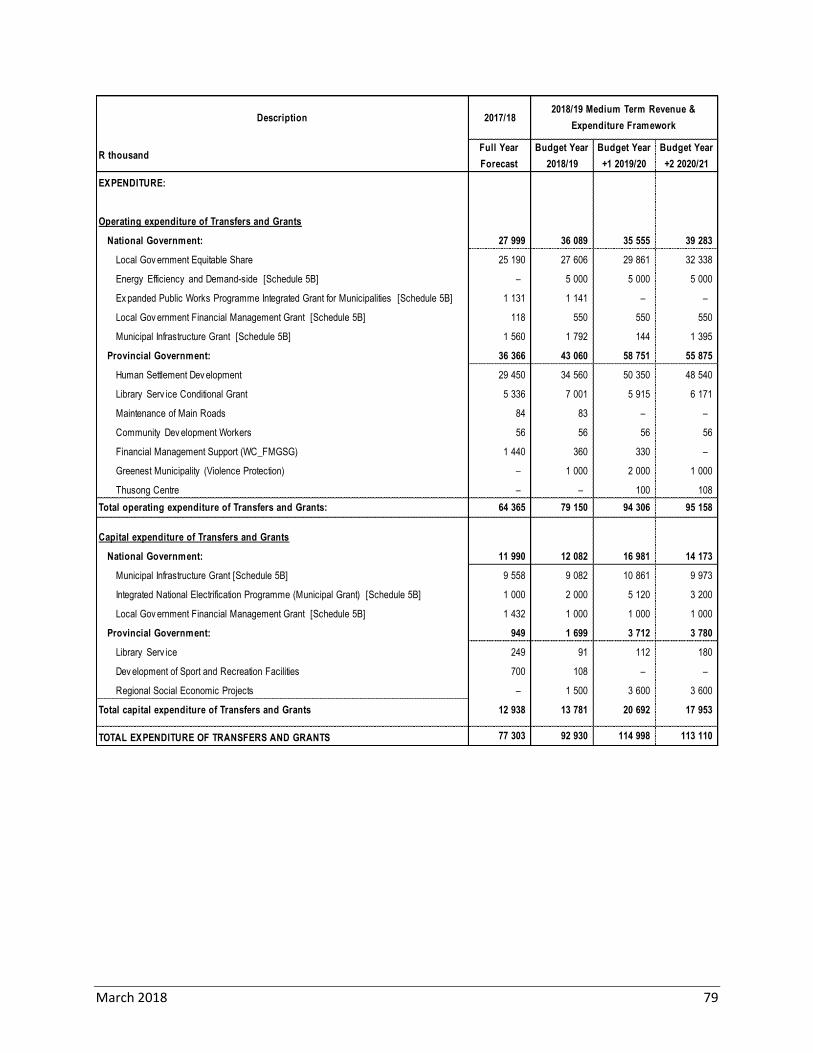
March 2018 79
Description 2017/18
R thousandFull Year
Forecast
Budget Year
2018/19
Budget Year
+1 2019/20
Budget Year
+2 2020/21
EXPENDITURE:
Operating expenditure of Transfers and Grants
National Government: 27 999 36 089 35 555 39 283
Local Gov ernment Equitable Share 25 190 27 606 29 861 32 338
Energy Efficiency and Demand-side [Schedule 5B] – 5 000 5 000 5 000
Ex panded Public Works Programme Integrated Grant for Municipalities [Schedule 5B] 1 131 1 141 – –
Local Gov ernment Financial Management Grant [Schedule 5B] 118 550 550 550
Municipal Infrastructure Grant [Schedule 5B] 1 560 1 792 144 1 395
Provincial Government: 36 366 43 060 58 751 55 875
Human Settlement Dev elopment 29 450 34 560 50 350 48 540
Library Serv ice Conditional Grant 5 336 7 001 5 915 6 171
Maintenance of Main Roads 84 83 – –
Community Dev elopment Workers 56 56 56 56
Financial Management Support (WC_FMGSG) 1 440 360 330 –
Greenest Municipality (Violence Protection) – 1 000 2 000 1 000
Thusong Centre – – 100 108
Total operating expenditure of Transfers and Grants: 64 365 79 150 94 306 95 158
Capital expenditure of Transfers and Grants
National Government: 11 990 12 082 16 981 14 173
Municipal Infrastructure Grant [Schedule 5B] 9 558 9 082 10 861 9 973
Integrated National Electrification Programme (Municipal Grant) [Schedule 5B] 1 000 2 000 5 120 3 200
Local Gov ernment Financial Management Grant [Schedule 5B] 1 432 1 000 1 000 1 000
Provincial Government: 949 1 699 3 712 3 780
Library Serv ice 249 91 112 180
Dev elopment of Sport and Recreation Facilities 700 108 – –
Regional Social Economic Projects – 1 500 3 600 3 600
Total capital expenditure of Transfers and Grants 12 938 13 781 20 692 17 953
TOTAL EXPENDITURE OF TRANSFERS AND GRANTS 77 303 92 930 114 998 113 110
2018/19 Medium Term Revenue &
Expenditure Framework
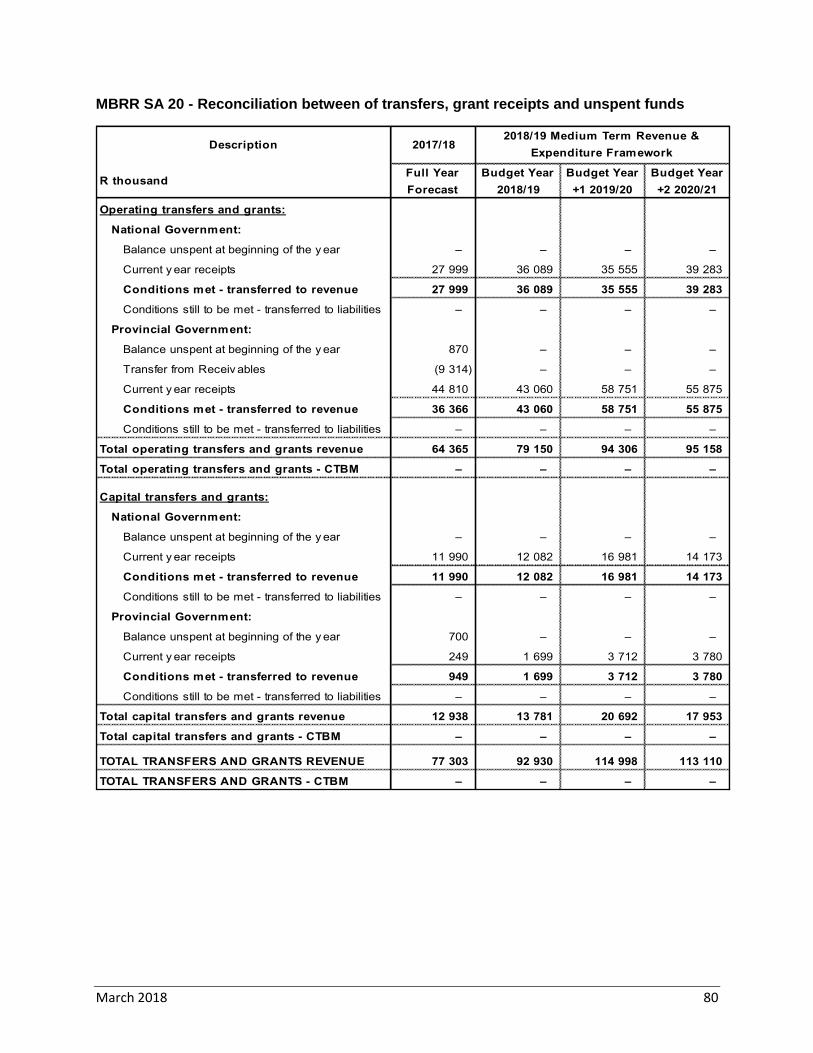
March 2018 80
MBRR SA 20 - Reconciliation between of transfers, grant receipts and unspent funds
Description 2017/18
R thousandFull Year
Forecast
Budget Year
2018/19
Budget Year
+1 2019/20
Budget Year
+2 2020/21
Operating transfers and grants:
National Government:
Balance unspent at beginning of the y ear – – – –
Current y ear receipts 27 999 36 089 35 555 39 283
Conditions met - transferred to revenue 27 999 36 089 35 555 39 283
Conditions still to be met - transferred to liabilities – – – –
Provincial Government:
Balance unspent at beginning of the y ear 870 – – –
Transfer from Receiv ables (9 314) – – –
Current y ear receipts 44 810 43 060 58 751 55 875
Conditions met - transferred to revenue 36 366 43 060 58 751 55 875
Conditions still to be met - transferred to liabilities – – – –
Total operating transfers and grants revenue 64 365 79 150 94 306 95 158
Total operating transfers and grants - CTBM – – – –
Capital transfers and grants:
National Government:
Balance unspent at beginning of the y ear – – – –
Current y ear receipts 11 990 12 082 16 981 14 173
Conditions met - transferred to revenue 11 990 12 082 16 981 14 173
Conditions still to be met - transferred to liabilities – – – –
Provincial Government:
Balance unspent at beginning of the y ear 700 – – –
Current y ear receipts 249 1 699 3 712 3 780
Conditions met - transferred to revenue 949 1 699 3 712 3 780
Conditions still to be met - transferred to liabilities – – – –
Total capital transfers and grants revenue 12 938 13 781 20 692 17 953
Total capital transfers and grants - CTBM – – – –
TOTAL TRANSFERS AND GRANTS REVENUE 77 303 92 930 114 998 113 110
TOTAL TRANSFERS AND GRANTS - CTBM – – – –
2018/19 Medium Term Revenue &
Expenditure Framework
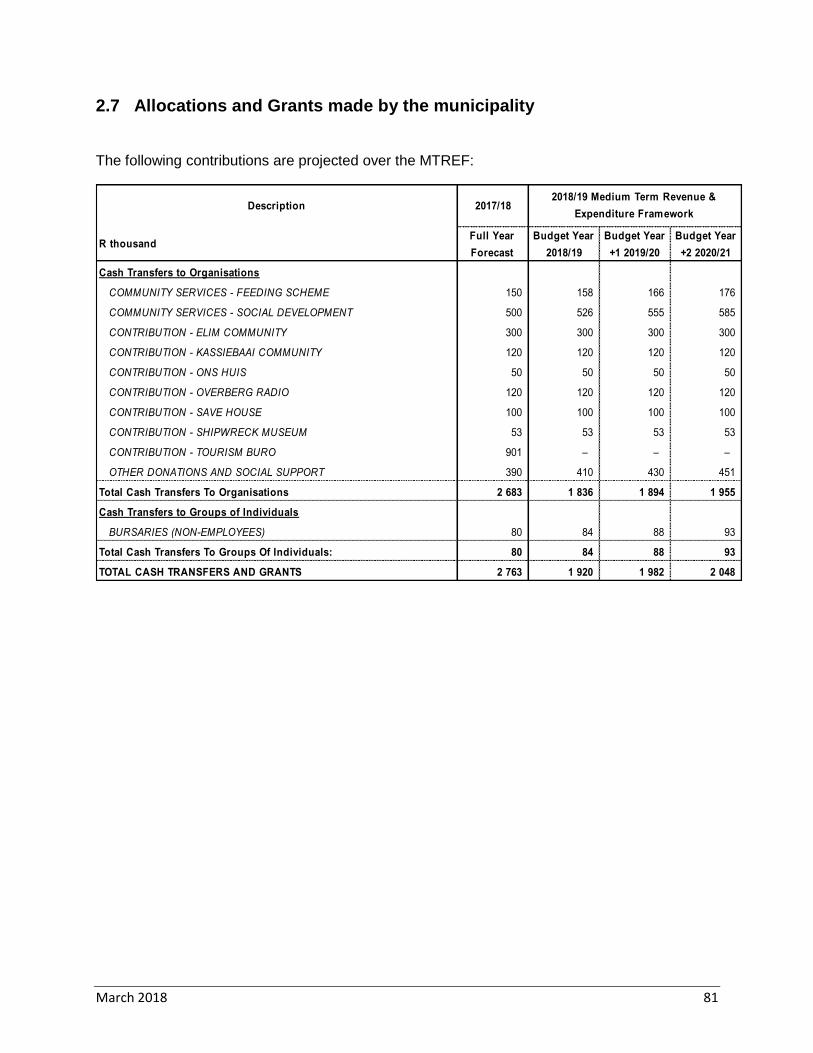
March 2018 81
2.7 Allocations and Grants made by the municipality
The following contributions are projected over the MTREF:
Description 2017/18
R thousandFull Year
Forecast
Budget Year
2018/19
Budget Year
+1 2019/20
Budget Year
+2 2020/21
Cash Transfers to Organisations
COMMUNITY SERVICES - FEEDING SCHEME 150 158 166 176
COMMUNITY SERVICES - SOCIAL DEVELOPMENT 500 526 555 585
CONTRIBUTION - ELIM COMMUNITY 300 300 300 300
CONTRIBUTION - KASSIEBAAI COMMUNITY 120 120 120 120
CONTRIBUTION - ONS HUIS 50 50 50 50
CONTRIBUTION - OVERBERG RADIO 120 120 120 120
CONTRIBUTION - SAVE HOUSE 100 100 100 100
CONTRIBUTION - SHIPWRECK MUSEUM 53 53 53 53
CONTRIBUTION - TOURISM BURO 901 – – –
OTHER DONATIONS AND SOCIAL SUPPORT 390 410 430 451
Total Cash Transfers To Organisations 2 683 1 836 1 894 1 955
Cash Transfers to Groups of Individuals
BURSARIES (NON-EMPLOYEES) 80 84 88 93
Total Cash Transfers To Groups Of Individuals: 80 84 88 93
TOTAL CASH TRANSFERS AND GRANTS 2 763 1 920 1 982 2 048
2018/19 Medium Term Revenue &
Expenditure Framework
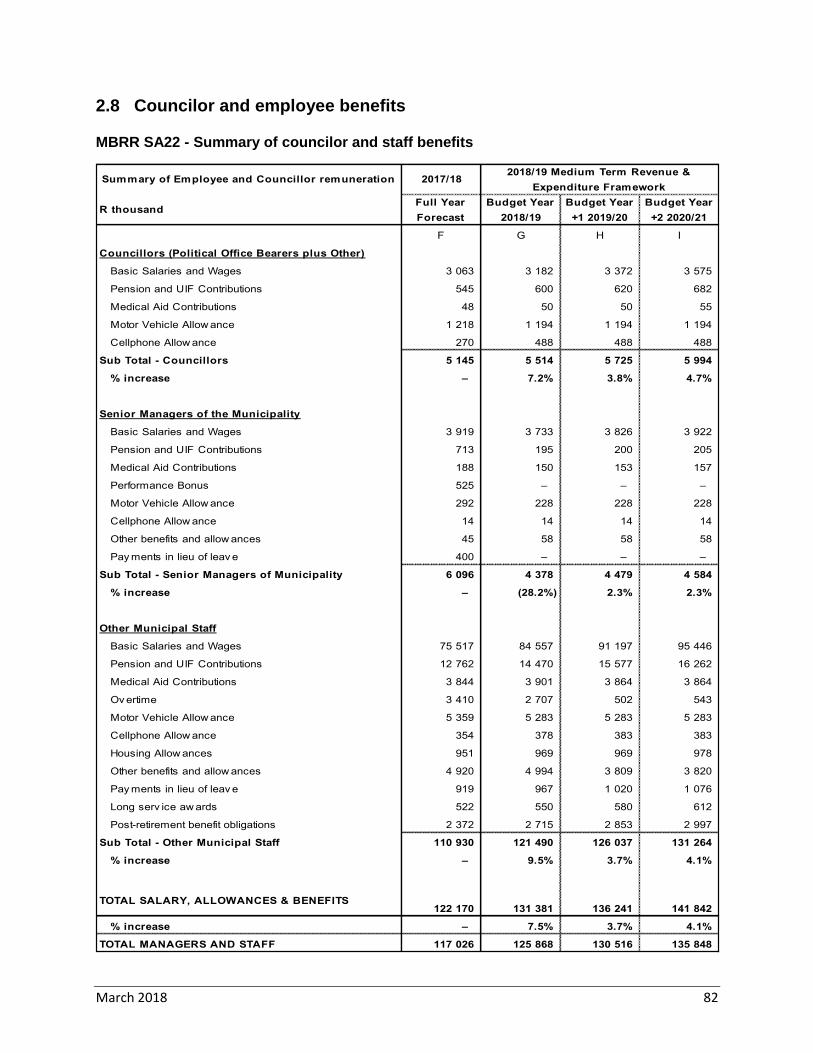
March 2018 82
2.8 Councilor and employee benefits
MBRR SA22 - Summary of councilor and staff benefits
Summary of Employee and Councillor remuneration 2017/18
R thousandFull Year
Forecast
Budget Year
2018/19
Budget Year
+1 2019/20
Budget Year
+2 2020/21
F G H I
Councillors (Political Office Bearers plus Other)
Basic Salaries and Wages 3 063 3 182 3 372 3 575
Pension and UIF Contributions 545 600 620 682
Medical Aid Contributions 48 50 50 55
Motor Vehicle Allow ance 1 218 1 194 1 194 1 194
Cellphone Allow ance 270 488 488 488
Sub Total - Councillors 5 145 5 514 5 725 5 994
% increase – 7.2% 3.8% 4.7%
Senior Managers of the Municipality
Basic Salaries and Wages 3 919 3 733 3 826 3 922
Pension and UIF Contributions 713 195 200 205
Medical Aid Contributions 188 150 153 157
Performance Bonus 525 – – –
Motor Vehicle Allow ance 292 228 228 228
Cellphone Allow ance 14 14 14 14
Other benefits and allow ances 45 58 58 58
Pay ments in lieu of leav e 400 – – –
Sub Total - Senior Managers of Municipality 6 096 4 378 4 479 4 584
% increase – (28.2%) 2.3% 2.3%
Other Municipal Staff
Basic Salaries and Wages 75 517 84 557 91 197 95 446
Pension and UIF Contributions 12 762 14 470 15 577 16 262
Medical Aid Contributions 3 844 3 901 3 864 3 864
Ov ertime 3 410 2 707 502 543
Motor Vehicle Allow ance 5 359 5 283 5 283 5 283
Cellphone Allow ance 354 378 383 383
Housing Allow ances 951 969 969 978
Other benefits and allow ances 4 920 4 994 3 809 3 820
Pay ments in lieu of leav e 919 967 1 020 1 076
Long serv ice aw ards 522 550 580 612
Post-retirement benefit obligations 2 372 2 715 2 853 2 997
Sub Total - Other Municipal Staff 110 930 121 490 126 037 131 264
% increase – 9.5% 3.7% 4.1%
TOTAL SALARY, ALLOWANCES & BENEFITS122 170 131 381 136 241 141 842
% increase – 7.5% 3.7% 4.1%
TOTAL MANAGERS AND STAFF 117 026 125 868 130 516 135 848
2018/19 Medium Term Revenue &
Expenditure Framework
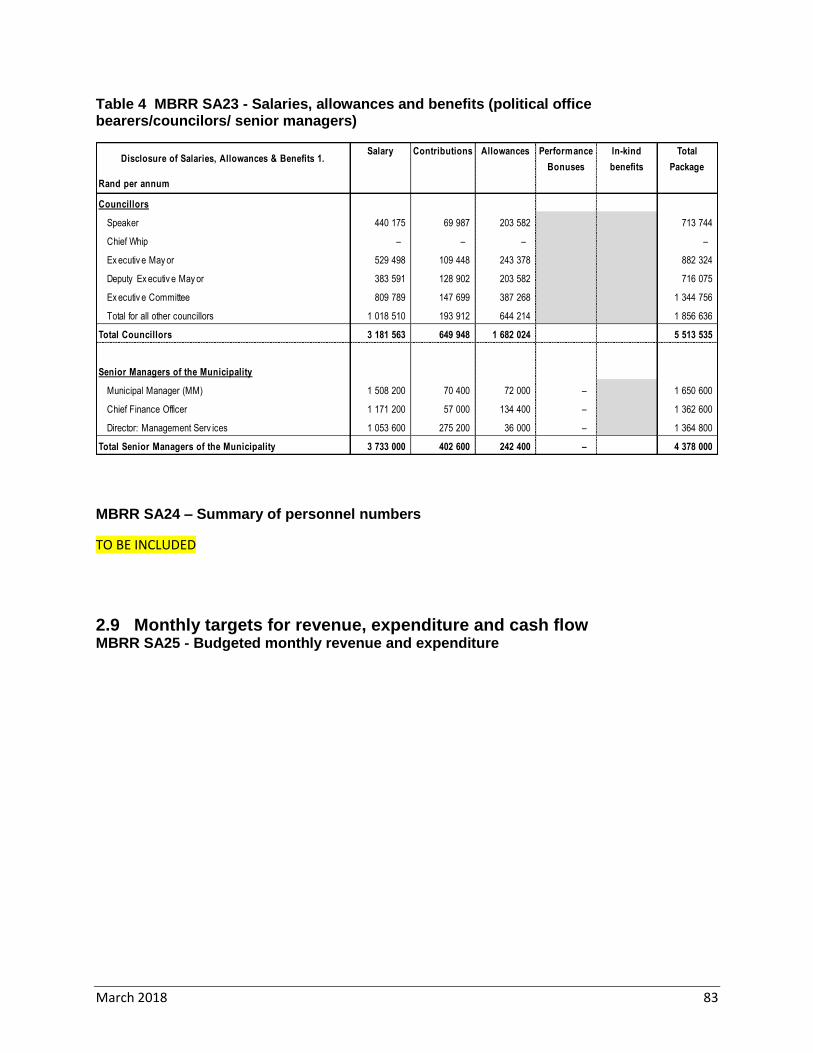
March 2018 83
Table 4 MBRR SA23 - Salaries, allowances and benefits (political office bearers/councilors/ senior managers)
MBRR SA24 – Summary of personnel numbers
TO BE INCLUDED
2.9 Monthly targets for revenue, expenditure and cash flow MBRR SA25 - Budgeted monthly revenue and expenditure
Disclosure of Salaries, Allowances & Benefits 1.In-kind
benefits
Total
Package
Rand per annum
Councillors
Speaker 440 175 69 987 203 582 713 744
Chief Whip – – – –
Ex ecutiv e May or 529 498 109 448 243 378 882 324
Deputy Ex ecutiv e May or 383 591 128 902 203 582 716 075
Ex ecutiv e Committee 809 789 147 699 387 268 1 344 756
Total for all other councillors 1 018 510 193 912 644 214 1 856 636
Total Councillors 3 181 563 649 948 1 682 024 5 513 535
Senior Managers of the Municipality
Municipal Manager (MM) 1 508 200 70 400 72 000 – 1 650 600
Chief Finance Officer 1 171 200 57 000 134 400 – 1 362 600
Director: Management Serv ices 1 053 600 275 200 36 000 – 1 364 800
Total Senior Managers of the Municipality 3 733 000 402 600 242 400 – 4 378 000
Salary Contributions Allowances Performance
Bonuses
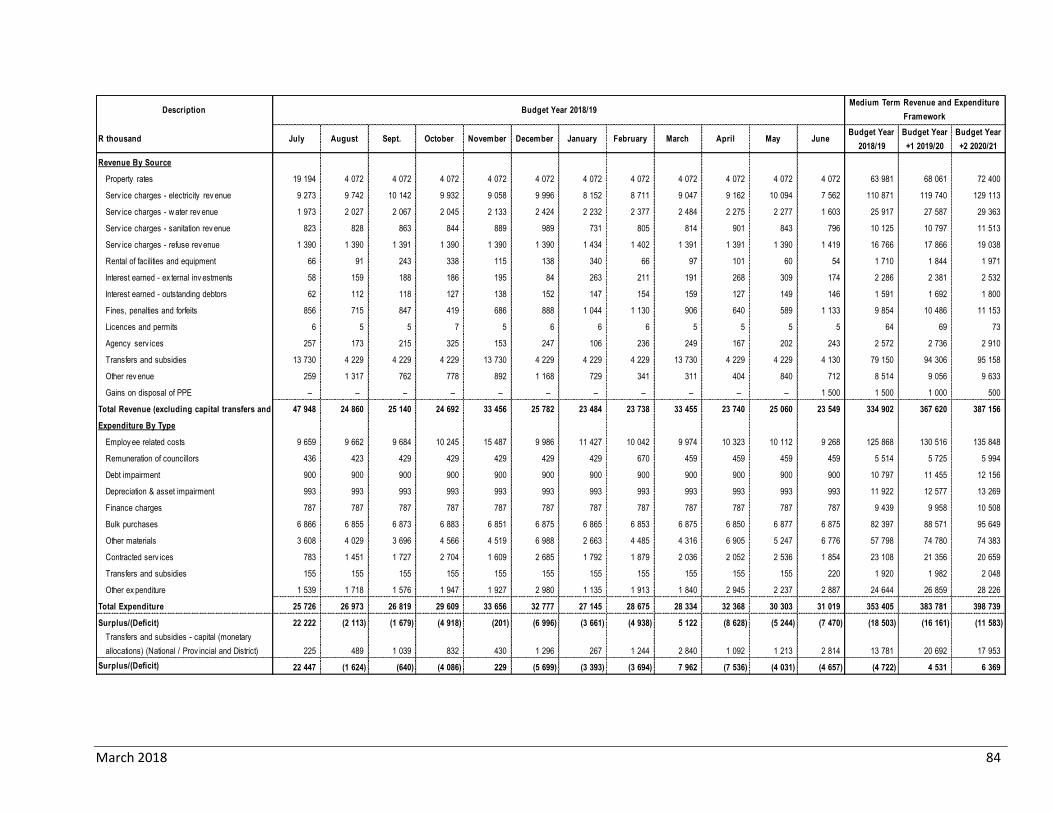
March 2018 84
Description
R thousand July August Sept. October November December January February March April May JuneBudget Year
2018/19
Budget Year
+1 2019/20
Budget Year
+2 2020/21
Revenue By Source
Property rates 19 194 4 072 4 072 4 072 4 072 4 072 4 072 4 072 4 072 4 072 4 072 4 072 63 981 68 061 72 400
Serv ice charges - electricity rev enue 9 273 9 742 10 142 9 932 9 058 9 996 8 152 8 711 9 047 9 162 10 094 7 562 110 871 119 740 129 113
Serv ice charges - w ater rev enue 1 973 2 027 2 067 2 045 2 133 2 424 2 232 2 377 2 484 2 275 2 277 1 603 25 917 27 587 29 363
Serv ice charges - sanitation rev enue 823 828 863 844 889 989 731 805 814 901 843 796 10 125 10 797 11 513
Serv ice charges - refuse rev enue 1 390 1 390 1 391 1 390 1 390 1 390 1 434 1 402 1 391 1 391 1 390 1 419 16 766 17 866 19 038
Rental of facilities and equipment 66 91 243 338 115 138 340 66 97 101 60 54 1 710 1 844 1 971
Interest earned - ex ternal inv estments 58 159 188 186 195 84 263 211 191 268 309 174 2 286 2 381 2 532
Interest earned - outstanding debtors 62 112 118 127 138 152 147 154 159 127 149 146 1 591 1 692 1 800
Fines, penalties and forfeits 856 715 847 419 686 888 1 044 1 130 906 640 589 1 133 9 854 10 486 11 153
Licences and permits 6 5 5 7 5 6 6 6 5 5 5 5 64 69 73
Agency serv ices 257 173 215 325 153 247 106 236 249 167 202 243 2 572 2 736 2 910
Transfers and subsidies 13 730 4 229 4 229 4 229 13 730 4 229 4 229 4 229 13 730 4 229 4 229 4 130 79 150 94 306 95 158
Other rev enue 259 1 317 762 778 892 1 168 729 341 311 404 840 712 8 514 9 056 9 633
Gains on disposal of PPE – – – – – – – – – – – 1 500 1 500 1 000 500
Total Revenue (excluding capital transfers and contributions)47 948 24 860 25 140 24 692 33 456 25 782 23 484 23 738 33 455 23 740 25 060 23 549 334 902 367 620 387 156
Expenditure By Type
Employ ee related costs 9 659 9 662 9 684 10 245 15 487 9 986 11 427 10 042 9 974 10 323 10 112 9 268 125 868 130 516 135 848
Remuneration of councillors 436 423 429 429 429 429 429 670 459 459 459 459 5 514 5 725 5 994
Debt impairment 900 900 900 900 900 900 900 900 900 900 900 900 10 797 11 455 12 156
Depreciation & asset impairment 993 993 993 993 993 993 993 993 993 993 993 993 11 922 12 577 13 269
Finance charges 787 787 787 787 787 787 787 787 787 787 787 787 9 439 9 958 10 508
Bulk purchases 6 866 6 855 6 873 6 883 6 851 6 875 6 865 6 853 6 875 6 850 6 877 6 875 82 397 88 571 95 649
Other materials 3 608 4 029 3 696 4 566 4 519 6 988 2 663 4 485 4 316 6 905 5 247 6 776 57 798 74 780 74 383
Contracted serv ices 783 1 451 1 727 2 704 1 609 2 685 1 792 1 879 2 036 2 052 2 536 1 854 23 108 21 356 20 659
Transfers and subsidies 155 155 155 155 155 155 155 155 155 155 155 220 1 920 1 982 2 048
Other ex penditure 1 539 1 718 1 576 1 947 1 927 2 980 1 135 1 913 1 840 2 945 2 237 2 887 24 644 26 859 28 226
Total Expenditure 25 726 26 973 26 819 29 609 33 656 32 777 27 145 28 675 28 334 32 368 30 303 31 019 353 405 383 781 398 739
Surplus/(Deficit) 22 222 (2 113) (1 679) (4 918) (201) (6 996) (3 661) (4 938) 5 122 (8 628) (5 244) (7 470) (18 503) (16 161) (11 583)
Transfers and subsidies - capital (monetary
allocations) (National / Prov incial and District) 225 489 1 039 832 430 1 296 267 1 244 2 840 1 092 1 213 2 814 13 781 20 692 17 953
Surplus/(Deficit) 22 447 (1 624) (640) (4 086) 229 (5 699) (3 393) (3 694) 7 962 (7 536) (4 031) (4 657) (4 722) 4 531 6 369
Budget Year 2018/19Medium Term Revenue and Expenditure
Framework
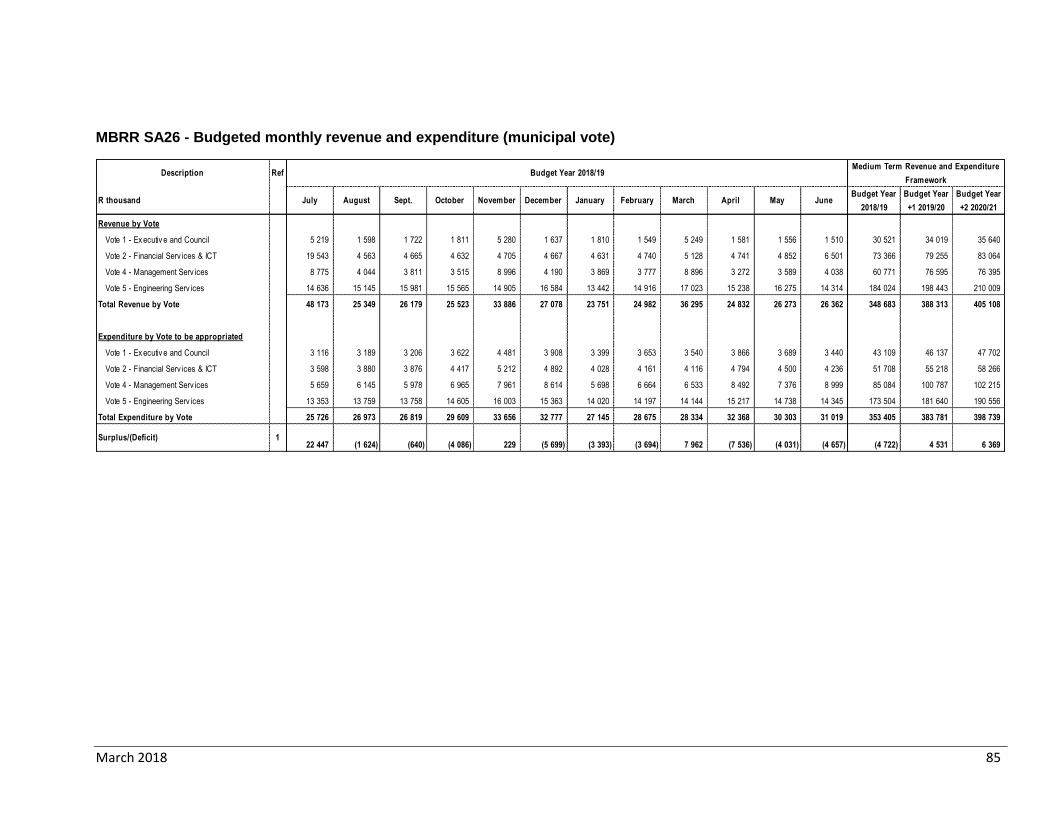
March 2018 85
MBRR SA26 - Budgeted monthly revenue and expenditure (municipal vote)
Description Ref
R thousand July August Sept. October November December January February March April May JuneBudget Year
2018/19
Budget Year
+1 2019/20
Budget Year
+2 2020/21
Revenue by Vote
Vote 1 - Ex ecutiv e and Council 5 219 1 598 1 722 1 811 5 280 1 637 1 810 1 549 5 249 1 581 1 556 1 510 30 521 34 019 35 640
Vote 2 - Financial Serv ices & ICT 19 543 4 563 4 665 4 632 4 705 4 667 4 631 4 740 5 128 4 741 4 852 6 501 73 366 79 255 83 064
Vote 4 - Management Serv ices 8 775 4 044 3 811 3 515 8 996 4 190 3 869 3 777 8 896 3 272 3 589 4 038 60 771 76 595 76 395
Vote 5 - Engineering Serv ices 14 636 15 145 15 981 15 565 14 905 16 584 13 442 14 916 17 023 15 238 16 275 14 314 184 024 198 443 210 009
Total Revenue by Vote 48 173 25 349 26 179 25 523 33 886 27 078 23 751 24 982 36 295 24 832 26 273 26 362 348 683 388 313 405 108
Expenditure by Vote to be appropriated
Vote 1 - Ex ecutiv e and Council 3 116 3 189 3 206 3 622 4 481 3 908 3 399 3 653 3 540 3 866 3 689 3 440 43 109 46 137 47 702
Vote 2 - Financial Serv ices & ICT 3 598 3 880 3 876 4 417 5 212 4 892 4 028 4 161 4 116 4 794 4 500 4 236 51 708 55 218 58 266
Vote 4 - Management Serv ices 5 659 6 145 5 978 6 965 7 961 8 614 5 698 6 664 6 533 8 492 7 376 8 999 85 084 100 787 102 215
Vote 5 - Engineering Serv ices 13 353 13 759 13 758 14 605 16 003 15 363 14 020 14 197 14 144 15 217 14 738 14 345 173 504 181 640 190 556
Total Expenditure by Vote 25 726 26 973 26 819 29 609 33 656 32 777 27 145 28 675 28 334 32 368 30 303 31 019 353 405 383 781 398 739
Surplus/(Deficit) 122 447 (1 624) (640) (4 086) 229 (5 699) (3 393) (3 694) 7 962 (7 536) (4 031) (4 657) (4 722) 4 531 6 369
Budget Year 2018/19Medium Term Revenue and Expenditure
Framework
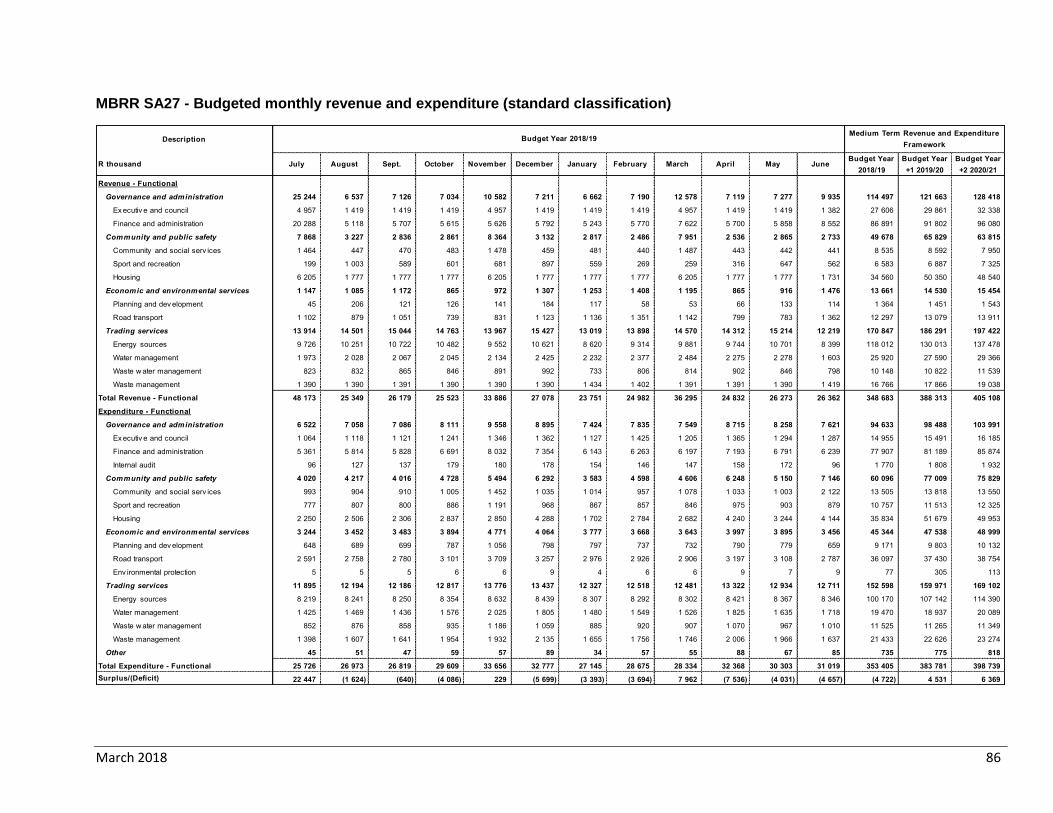
March 2018 86
MBRR SA27 - Budgeted monthly revenue and expenditure (standard classification)
Description
R thousand July August Sept. October November December January February March April May JuneBudget Year
2018/19
Budget Year
+1 2019/20
Budget Year
+2 2020/21
Revenue - Functional
Governance and administration 25 244 6 537 7 126 7 034 10 582 7 211 6 662 7 190 12 578 7 119 7 277 9 935 114 497 121 663 128 418
Ex ecutiv e and council 4 957 1 419 1 419 1 419 4 957 1 419 1 419 1 419 4 957 1 419 1 419 1 382 27 606 29 861 32 338
Finance and administration 20 288 5 118 5 707 5 615 5 626 5 792 5 243 5 770 7 622 5 700 5 858 8 552 86 891 91 802 96 080
Community and public safety 7 868 3 227 2 836 2 861 8 364 3 132 2 817 2 486 7 951 2 536 2 865 2 733 49 678 65 829 63 815
Community and social serv ices 1 464 447 470 483 1 478 459 481 440 1 487 443 442 441 8 535 8 592 7 950
Sport and recreation 199 1 003 589 601 681 897 559 269 259 316 647 562 6 583 6 887 7 325
Housing 6 205 1 777 1 777 1 777 6 205 1 777 1 777 1 777 6 205 1 777 1 777 1 731 34 560 50 350 48 540
Economic and environmental services 1 147 1 085 1 172 865 972 1 307 1 253 1 408 1 195 865 916 1 476 13 661 14 530 15 454
Planning and dev elopment 45 206 121 126 141 184 117 58 53 66 133 114 1 364 1 451 1 543
Road transport 1 102 879 1 051 739 831 1 123 1 136 1 351 1 142 799 783 1 362 12 297 13 079 13 911
Trading services 13 914 14 501 15 044 14 763 13 967 15 427 13 019 13 898 14 570 14 312 15 214 12 219 170 847 186 291 197 422
Energy sources 9 726 10 251 10 722 10 482 9 552 10 621 8 620 9 314 9 881 9 744 10 701 8 399 118 012 130 013 137 478
Water management 1 973 2 028 2 067 2 045 2 134 2 425 2 232 2 377 2 484 2 275 2 278 1 603 25 920 27 590 29 366
Waste w ater management 823 832 865 846 891 992 733 806 814 902 846 798 10 148 10 822 11 539
Waste management 1 390 1 390 1 391 1 390 1 390 1 390 1 434 1 402 1 391 1 391 1 390 1 419 16 766 17 866 19 038
Total Revenue - Functional 48 173 25 349 26 179 25 523 33 886 27 078 23 751 24 982 36 295 24 832 26 273 26 362 348 683 388 313 405 108
Expenditure - Functional
Governance and administration 6 522 7 058 7 086 8 111 9 558 8 895 7 424 7 835 7 549 8 715 8 258 7 621 94 633 98 488 103 991
Ex ecutiv e and council 1 064 1 118 1 121 1 241 1 346 1 362 1 127 1 425 1 205 1 365 1 294 1 287 14 955 15 491 16 185
Finance and administration 5 361 5 814 5 828 6 691 8 032 7 354 6 143 6 263 6 197 7 193 6 791 6 239 77 907 81 189 85 874
Internal audit 96 127 137 179 180 178 154 146 147 158 172 96 1 770 1 808 1 932
Community and public safety 4 020 4 217 4 016 4 728 5 494 6 292 3 583 4 598 4 606 6 248 5 150 7 146 60 096 77 009 75 829
Community and social serv ices 993 904 910 1 005 1 452 1 035 1 014 957 1 078 1 033 1 003 2 122 13 505 13 818 13 550
Sport and recreation 777 807 800 886 1 191 968 867 857 846 975 903 879 10 757 11 513 12 325
Housing 2 250 2 506 2 306 2 837 2 850 4 288 1 702 2 784 2 682 4 240 3 244 4 144 35 834 51 679 49 953
Economic and environmental services 3 244 3 452 3 483 3 894 4 771 4 064 3 777 3 668 3 643 3 997 3 895 3 456 45 344 47 538 48 999
Planning and dev elopment 648 689 699 787 1 056 798 797 737 732 790 779 659 9 171 9 803 10 132
Road transport 2 591 2 758 2 780 3 101 3 709 3 257 2 976 2 926 2 906 3 197 3 108 2 787 36 097 37 430 38 754
Env ironmental protection 5 5 5 6 6 9 4 6 6 9 7 9 77 305 113
Trading services 11 895 12 194 12 186 12 817 13 776 13 437 12 327 12 518 12 481 13 322 12 934 12 711 152 598 159 971 169 102
Energy sources 8 219 8 241 8 250 8 354 8 632 8 439 8 307 8 292 8 302 8 421 8 367 8 346 100 170 107 142 114 390
Water management 1 425 1 469 1 436 1 576 2 025 1 805 1 480 1 549 1 526 1 825 1 635 1 718 19 470 18 937 20 089
Waste w ater management 852 876 858 935 1 186 1 059 885 920 907 1 070 967 1 010 11 525 11 265 11 349
Waste management 1 398 1 607 1 641 1 954 1 932 2 135 1 655 1 756 1 746 2 006 1 966 1 637 21 433 22 626 23 274
Other 45 51 47 59 57 89 34 57 55 88 67 85 735 775 818
Total Expenditure - Functional 25 726 26 973 26 819 29 609 33 656 32 777 27 145 28 675 28 334 32 368 30 303 31 019 353 405 383 781 398 739
Surplus/(Deficit) 22 447 (1 624) (640) (4 086) 229 (5 699) (3 393) (3 694) 7 962 (7 536) (4 031) (4 657) (4 722) 4 531 6 369
Budget Year 2018/19Medium Term Revenue and Expenditure
Framework
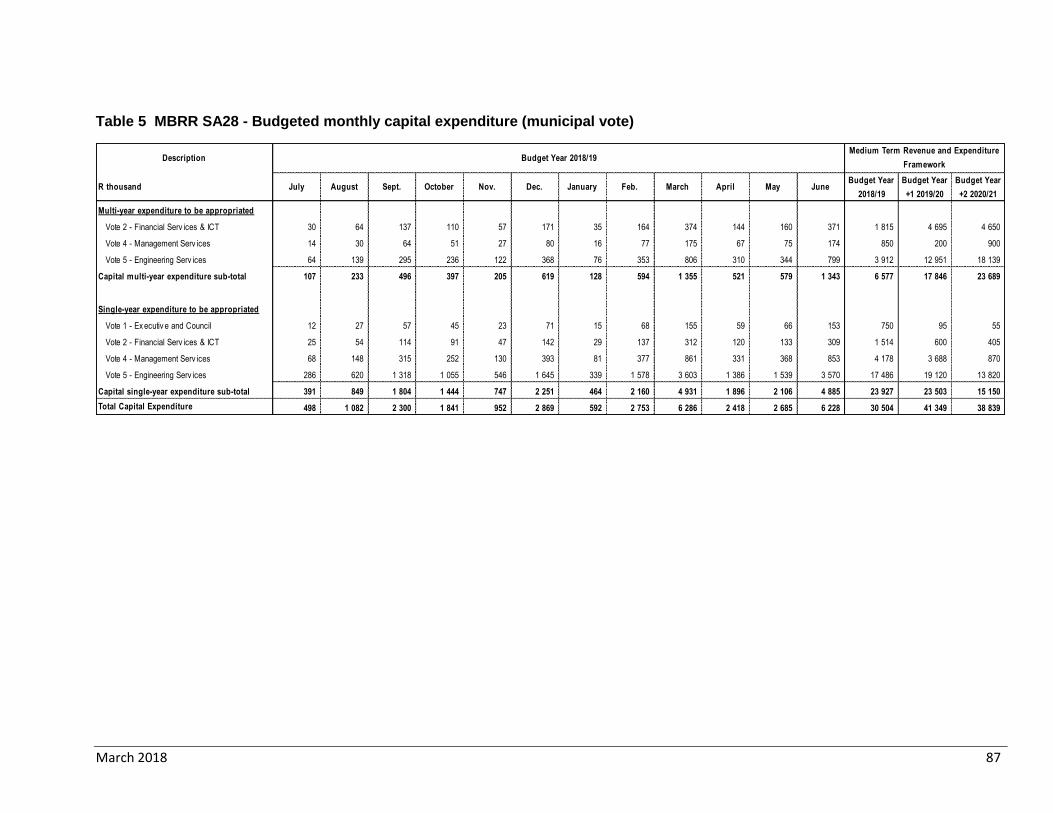
March 2018 87
Table 5 MBRR SA28 - Budgeted monthly capital expenditure (municipal vote)
Description
R thousand July August Sept. October Nov. Dec. January Feb. March April May JuneBudget Year
2018/19
Budget Year
+1 2019/20
Budget Year
+2 2020/21
Multi-year expenditure to be appropriated
Vote 2 - Financial Serv ices & ICT 30 64 137 110 57 171 35 164 374 144 160 371 1 815 4 695 4 650
Vote 4 - Management Serv ices 14 30 64 51 27 80 16 77 175 67 75 174 850 200 900
Vote 5 - Engineering Serv ices 64 139 295 236 122 368 76 353 806 310 344 799 3 912 12 951 18 139
Capital multi-year expenditure sub-total 107 233 496 397 205 619 128 594 1 355 521 579 1 343 6 577 17 846 23 689
Single-year expenditure to be appropriated
Vote 1 - Ex ecutiv e and Council 12 27 57 45 23 71 15 68 155 59 66 153 750 95 55
Vote 2 - Financial Serv ices & ICT 25 54 114 91 47 142 29 137 312 120 133 309 1 514 600 405
Vote 4 - Management Serv ices 68 148 315 252 130 393 81 377 861 331 368 853 4 178 3 688 870
Vote 5 - Engineering Serv ices 286 620 1 318 1 055 546 1 645 339 1 578 3 603 1 386 1 539 3 570 17 486 19 120 13 820
Capital single-year expenditure sub-total 391 849 1 804 1 444 747 2 251 464 2 160 4 931 1 896 2 106 4 885 23 927 23 503 15 150
Total Capital Expenditure 498 1 082 2 300 1 841 952 2 869 592 2 753 6 286 2 418 2 685 6 228 30 504 41 349 38 839
Budget Year 2018/19Medium Term Revenue and Expenditure
Framework

March 2018 88
Table 6 MBRR SA29 - Budgeted monthly capital expenditure (standard classification)
Description
R thousand July August Sept. October Nov. Dec. January Feb. March April May JuneBudget Year
2018/19
Budget Year
+1 2019/20
Budget Year
+2 2020/21
Capital Expenditure - Functional
Governance and administration 59 128 273 218 113 340 70 327 746 287 318 739 3 618 5 542 5 895
Ex ecutiv e and council 1 2 4 3 1 4 1 4 10 4 4 10 47 – –
Finance and administration 58 127 269 215 111 336 69 322 736 283 314 729 3 569 5 542 5 895
Internal audit 0 0 0 0 0 0 0 0 0 0 0 0 2 – –
Community and public safety 78 169 359 287 148 448 92 430 981 377 419 972 4 759 3 642 930
Community and social serv ices 4 9 18 15 8 23 5 22 50 19 21 49 242 112 180
Sport and recreation 74 160 340 272 141 424 88 407 930 358 397 921 4 513 3 530 750
Housing 0 0 0 0 0 0 0 0 1 0 0 1 5 – –
Economic and environmental services 205 445 946 757 391 1 180 243 1 132 2 584 994 1 104 2 560 12 541 9 821 7 575
Planning and dev elopment 9 19 41 33 17 51 11 49 113 43 48 112 547 95 55
Road transport 196 425 904 724 374 1 128 233 1 083 2 472 951 1 056 2 449 11 994 9 726 7 520
Trading services 157 340 723 579 299 902 186 865 1 976 760 844 1 957 9 587 22 345 24 438
Energy sources 88 190 405 324 168 505 104 485 1 107 426 473 1 096 5 371 11 675 13 686
Water management 63 137 292 234 121 364 75 349 798 307 341 790 3 870 3 500 4 280
Waste w ater management 5 12 25 20 10 31 6 30 68 26 29 68 331 6 171 6 473
Waste management 0 1 1 1 0 1 0 1 3 1 1 3 15 1 000 –
Total Capital Expenditure - Functional 498 1 082 2 300 1 841 952 2 869 592 2 753 6 286 2 418 2 685 6 228 30 504 41 349 38 839
Funded by:
National Gov ernment 197 429 911 729 377 1 136 234 1 091 2 490 958 1 063 2 467 12 082 16 981 14 173
Prov incial Gov ernment 28 60 128 103 53 160 33 153 350 135 150 347 1 699 3 712 3 780
Transfers recognised - capital 225 489 1 039 832 430 1 296 267 1 244 2 840 1 092 1 213 2 814 13 781 20 692 17 953
Borrowing 88 191 406 325 168 506 104 485 1 108 426 473 1 098 5 379 8 139 6 508
Internally generated funds 185 402 855 685 354 1 067 220 1 024 2 338 899 999 2 316 11 345 12 518 14 378
Total Capital Funding 498 1 082 2 300 1 841 952 2 869 592 2 753 6 286 2 418 2 685 6 228 30 504 41 349 38 839
Budget Year 2018/19Medium Term Revenue and Expenditure
Framework
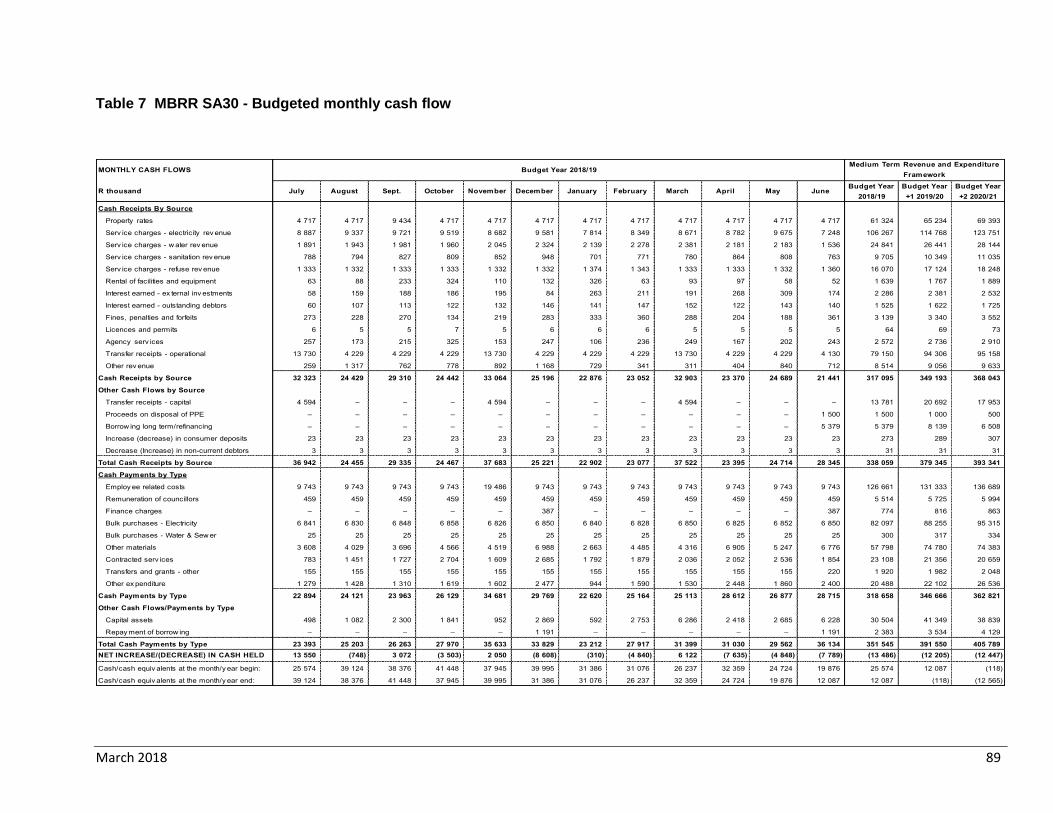
March 2018 89
Table 7 MBRR SA30 - Budgeted monthly cash flow
MONTHLY CASH FLOWS
R thousand July August Sept. October November December January February March April May JuneBudget Year
2018/19
Budget Year
+1 2019/20
Budget Year
+2 2020/21
Cash Receipts By Source
Property rates 4 717 4 717 9 434 4 717 4 717 4 717 4 717 4 717 4 717 4 717 4 717 4 717 61 324 65 234 69 393
Serv ice charges - electricity rev enue 8 887 9 337 9 721 9 519 8 682 9 581 7 814 8 349 8 671 8 782 9 675 7 248 106 267 114 768 123 751
Serv ice charges - w ater rev enue 1 891 1 943 1 981 1 960 2 045 2 324 2 139 2 278 2 381 2 181 2 183 1 536 24 841 26 441 28 144
Serv ice charges - sanitation rev enue 788 794 827 809 852 948 701 771 780 864 808 763 9 705 10 349 11 035
Serv ice charges - refuse rev enue 1 333 1 332 1 333 1 333 1 332 1 332 1 374 1 343 1 333 1 333 1 332 1 360 16 070 17 124 18 248
Rental of facilities and equipment 63 88 233 324 110 132 326 63 93 97 58 52 1 639 1 767 1 889
Interest earned - ex ternal inv estments 58 159 188 186 195 84 263 211 191 268 309 174 2 286 2 381 2 532
Interest earned - outstanding debtors 60 107 113 122 132 146 141 147 152 122 143 140 1 525 1 622 1 725
Fines, penalties and forfeits 273 228 270 134 219 283 333 360 288 204 188 361 3 139 3 340 3 552
Licences and permits 6 5 5 7 5 6 6 6 5 5 5 5 64 69 73
Agency serv ices 257 173 215 325 153 247 106 236 249 167 202 243 2 572 2 736 2 910
Transfer receipts - operational 13 730 4 229 4 229 4 229 13 730 4 229 4 229 4 229 13 730 4 229 4 229 4 130 79 150 94 306 95 158
Other rev enue 259 1 317 762 778 892 1 168 729 341 311 404 840 712 8 514 9 056 9 633
Cash Receipts by Source 32 323 24 429 29 310 24 442 33 064 25 196 22 876 23 052 32 903 23 370 24 689 21 441 317 095 349 193 368 043
Other Cash Flows by Source
Transfer receipts - capital 4 594 – – – 4 594 – – – 4 594 – – – 13 781 20 692 17 953
Proceeds on disposal of PPE – – – – – – – – – – – 1 500 1 500 1 000 500
Borrow ing long term/refinancing – – – – – – – – – – – 5 379 5 379 8 139 6 508
Increase (decrease) in consumer deposits 23 23 23 23 23 23 23 23 23 23 23 23 273 289 307
Decrease (Increase) in non-current debtors 3 3 3 3 3 3 3 3 3 3 3 3 31 31 31
Total Cash Receipts by Source 36 942 24 455 29 335 24 467 37 683 25 221 22 902 23 077 37 522 23 395 24 714 28 345 338 059 379 345 393 341
Cash Payments by Type
Employ ee related costs 9 743 9 743 9 743 9 743 19 486 9 743 9 743 9 743 9 743 9 743 9 743 9 743 126 661 131 333 136 689
Remuneration of councillors 459 459 459 459 459 459 459 459 459 459 459 459 5 514 5 725 5 994
Finance charges – – – – – 387 – – – – – 387 774 816 863
Bulk purchases - Electricity 6 841 6 830 6 848 6 858 6 826 6 850 6 840 6 828 6 850 6 825 6 852 6 850 82 097 88 255 95 315
Bulk purchases - Water & Sew er 25 25 25 25 25 25 25 25 25 25 25 25 300 317 334
Other materials 3 608 4 029 3 696 4 566 4 519 6 988 2 663 4 485 4 316 6 905 5 247 6 776 57 798 74 780 74 383
Contracted serv ices 783 1 451 1 727 2 704 1 609 2 685 1 792 1 879 2 036 2 052 2 536 1 854 23 108 21 356 20 659
Transfers and grants - other 155 155 155 155 155 155 155 155 155 155 155 220 1 920 1 982 2 048
Other ex penditure 1 279 1 428 1 310 1 619 1 602 2 477 944 1 590 1 530 2 448 1 860 2 400 20 488 22 102 26 536
Cash Payments by Type 22 894 24 121 23 963 26 129 34 681 29 769 22 620 25 164 25 113 28 612 26 877 28 715 318 658 346 666 362 821
Other Cash Flows/Payments by Type
Capital assets 498 1 082 2 300 1 841 952 2 869 592 2 753 6 286 2 418 2 685 6 228 30 504 41 349 38 839
Repay ment of borrow ing – – – – – 1 191 – – – – – 1 191 2 383 3 534 4 129
Total Cash Payments by Type 23 393 25 203 26 263 27 970 35 633 33 829 23 212 27 917 31 399 31 030 29 562 36 134 351 545 391 550 405 789
NET INCREASE/(DECREASE) IN CASH HELD 13 550 (748) 3 072 (3 503) 2 050 (8 608) (310) (4 840) 6 122 (7 635) (4 848) (7 789) (13 486) (12 205) (12 447)
Cash/cash equiv alents at the month/y ear begin: 25 574 39 124 38 376 41 448 37 945 39 995 31 386 31 076 26 237 32 359 24 724 19 876 25 574 12 087 (118)
Cash/cash equiv alents at the month/y ear end: 39 124 38 376 41 448 37 945 39 995 31 386 31 076 26 237 32 359 24 724 19 876 12 087 12 087 (118) (12 565)
Budget Year 2018/19Medium Term Revenue and Expenditure
Framework
March 2018 90
2.10 Contracts having future budgetary implications
In terms of the Municipality’s Supply Chain Management Policy, no contracts are awarded beyond the medium-term revenue and expenditure framework (three years). In ensuring adherence to this contractual time frame limitation, all reports submitted to either the Bid Evaluation and Adjudication Committees must obtain formal financial comments from the Financial Management Division of the Treasury Department. Schedule SA35 is not applicable at the municipality.
2.11 Capital expenditure details
The following four tables present details of the Municipality’s capital expenditure programme, firstly on new assets, then the renewal of assets, then the upgrading of assets, then the repair and maintenance of assets and finally the depreciation per asset class.

March 2018 91
MBRR SA34a - Capital expenditure on new assets by asset class
Description 2017/18
R thousandFull Year
Forecast
Budget Year
2018/19
Budget Year
+1 2019/20
Budget Year
+2 2020/21
Capital expenditure on new assets by Asset Class/Sub-class
Infrastructure 7 298 11 051 7 950 6 045
Roads Infrastructure 200 90 210 220
Road Furniture 200 90 210 220
Storm w ater Infrastructure 5 998 7 741 500 500
Storm water Conveyance 5 998 7 741 500 500
Electrical Infrastructure 1 100 2 100 5 240 3 325
LV Networks 1 100 2 100 5 240 3 325
Sanitation Infrastructure – 1 120 1 000 2 000
Pump Station – 120 – –
Reticulation – 1 000 1 000 2 000
Solid Waste Infrastructure – – 1 000 –
Landfill Sites – – 1 000 –
Community Assets 440 3 030 1 840 500
Community Facilities 270 770 150 –
Cemeteries/Crematoria 120 120 – –
Public Open Space 150 150 150 –
Markets – 500 – –
Sport and Recreation Facilities 170 2 260 1 690 500
Outdoor Facilities 170 2 260 1 690 500
Other assets 95 – – –
Operational Buildings 95 – – –
Municipal Offices 95 – – –
Intangible Assets 8 – 250 50
Licences and Rights 8 – 250 50
Computer Software and Applications 8 – 250 50
Computer Equipment 200 136 – –
Computer Equipment 200 136 – –
Furniture and Office Equipment 188 80 162 8
Furniture and Office Equipment 188 80 162 8
Machinery and Equipment 459 4 257 9 691 13 530
Machinery and Equipment 459 4 257 9 691 13 530
Transport Assets 440 – – –
Transport Assets 440 – – –
Total Capital Expenditure on new assets 9 128 18 553 19 893 20 133
2018/19 Medium Term Revenue &
Expenditure Framework
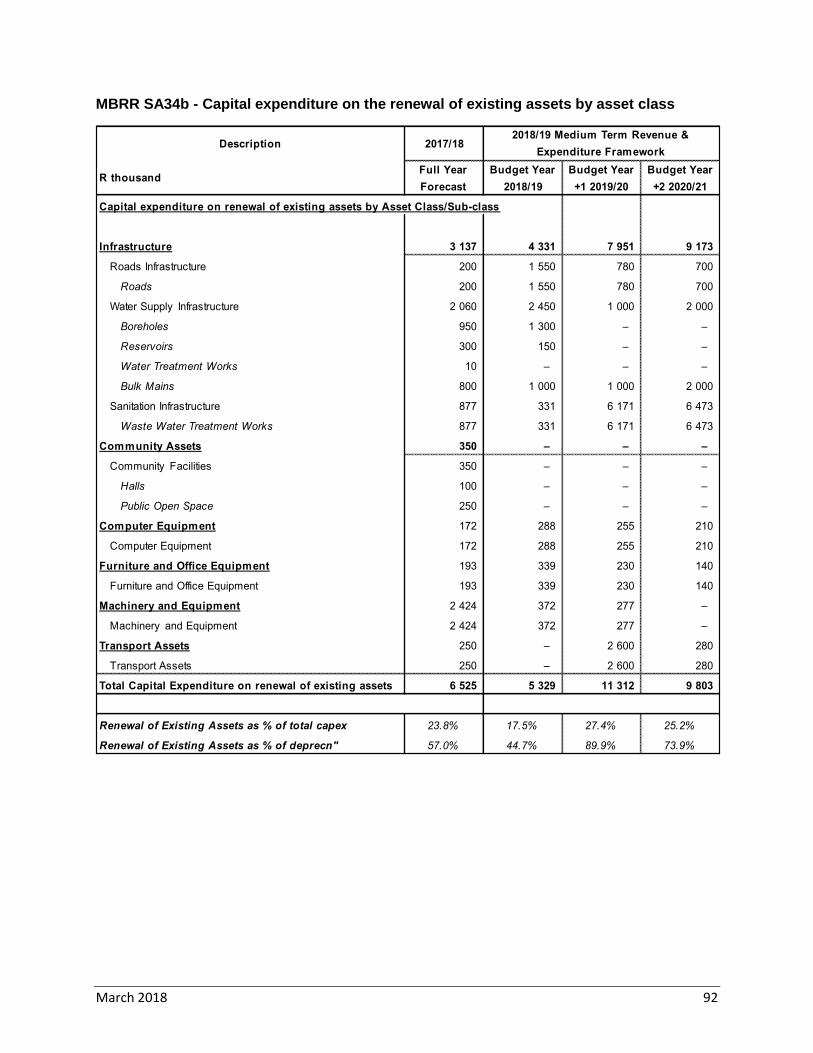
March 2018 92
MBRR SA34b - Capital expenditure on the renewal of existing assets by asset class
Description 2017/18
R thousandFull Year
Forecast
Budget Year
2018/19
Budget Year
+1 2019/20
Budget Year
+2 2020/21
Capital expenditure on renewal of existing assets by Asset Class/Sub-class
Infrastructure 3 137 4 331 7 951 9 173
Roads Infrastructure 200 1 550 780 700
Roads 200 1 550 780 700
Water Supply Infrastructure 2 060 2 450 1 000 2 000
Boreholes 950 1 300 – –
Reservoirs 300 150 – –
Water Treatment Works 10 – – –
Bulk Mains 800 1 000 1 000 2 000
Sanitation Infrastructure 877 331 6 171 6 473
Waste Water Treatment Works 877 331 6 171 6 473
Community Assets 350 – – –
Community Facilities 350 – – –
Halls 100 – – –
Public Open Space 250 – – –
Computer Equipment 172 288 255 210
Computer Equipment 172 288 255 210
Furniture and Office Equipment 193 339 230 140
Furniture and Office Equipment 193 339 230 140
Machinery and Equipment 2 424 372 277 –
Machinery and Equipment 2 424 372 277 –
Transport Assets 250 – 2 600 280
Transport Assets 250 – 2 600 280
Total Capital Expenditure on renewal of existing assets 6 525 5 329 11 312 9 803
Renewal of Existing Assets as % of total capex 23.8% 17.5% 27.4% 25.2%
Renewal of Existing Assets as % of deprecn" 57.0% 44.7% 89.9% 73.9%
2018/19 Medium Term Revenue &
Expenditure Framework
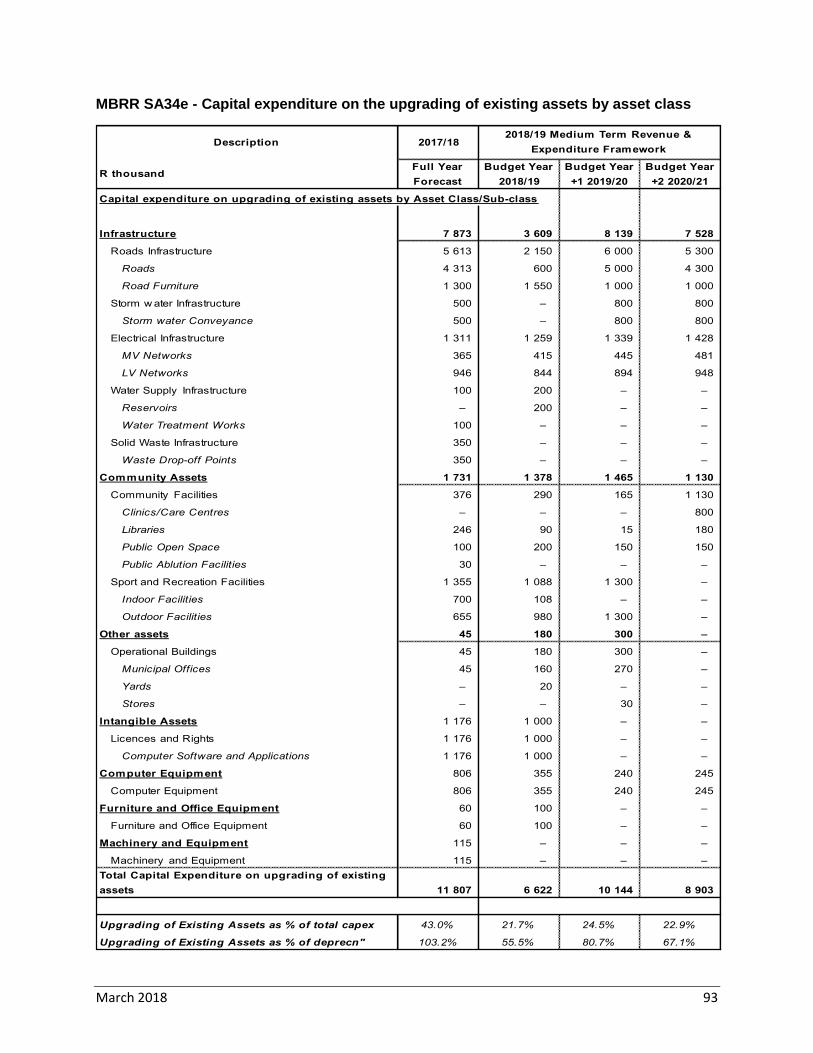
March 2018 93
MBRR SA34e - Capital expenditure on the upgrading of existing assets by asset class
Description 2017/18
R thousandFull Year
Forecast
Budget Year
2018/19
Budget Year
+1 2019/20
Budget Year
+2 2020/21
Capital expenditure on upgrading of existing assets by Asset Class/Sub-class
Infrastructure 7 873 3 609 8 139 7 528
Roads Infrastructure 5 613 2 150 6 000 5 300
Roads 4 313 600 5 000 4 300
Road Furniture 1 300 1 550 1 000 1 000
Storm w ater Infrastructure 500 – 800 800
Storm water Conveyance 500 – 800 800
Electrical Infrastructure 1 311 1 259 1 339 1 428
MV Networks 365 415 445 481
LV Networks 946 844 894 948
Water Supply Infrastructure 100 200 – –
Reservoirs – 200 – –
Water Treatment Works 100 – – –
Solid Waste Infrastructure 350 – – –
Waste Drop-off Points 350 – – –
Community Assets 1 731 1 378 1 465 1 130
Community Facilities 376 290 165 1 130
Clinics/Care Centres – – – 800
Libraries 246 90 15 180
Public Open Space 100 200 150 150
Public Ablution Facilities 30 – – –
Sport and Recreation Facilities 1 355 1 088 1 300 –
Indoor Facilities 700 108 – –
Outdoor Facilities 655 980 1 300 –
Other assets 45 180 300 –
Operational Buildings 45 180 300 –
Municipal Offices 45 160 270 –
Yards – 20 – –
Stores – – 30 –
Intangible Assets 1 176 1 000 – –
Licences and Rights 1 176 1 000 – –
Computer Software and Applications 1 176 1 000 – –
Computer Equipment 806 355 240 245
Computer Equipment 806 355 240 245
Furniture and Office Equipment 60 100 – –
Furniture and Office Equipment 60 100 – –
Machinery and Equipment 115 – – –
Machinery and Equipment 115 – – –
Total Capital Expenditure on upgrading of existing
assets 11 807 6 622 10 144 8 903
Upgrading of Existing Assets as % of total capex 43.0% 21.7% 24.5% 22.9%
Upgrading of Existing Assets as % of deprecn" 103.2% 55.5% 80.7% 67.1%
2018/19 Medium Term Revenue &
Expenditure Framework
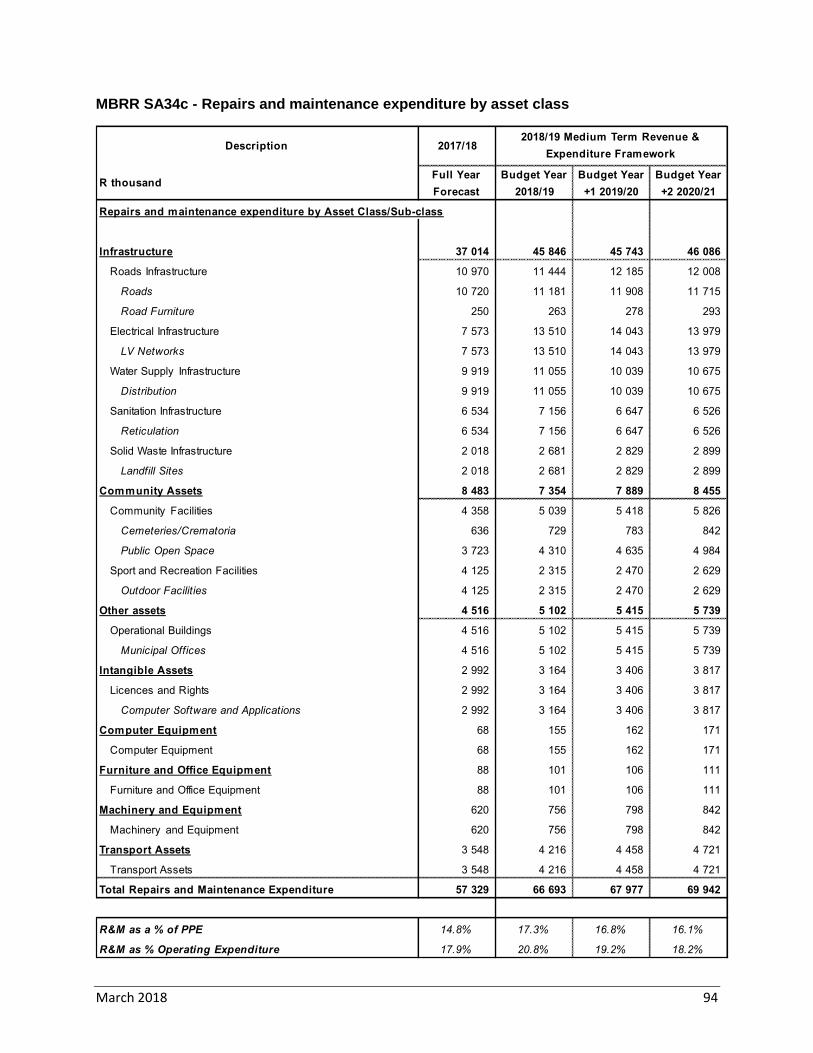
March 2018 94
MBRR SA34c - Repairs and maintenance expenditure by asset class
Description 2017/18
R thousandFull Year
Forecast
Budget Year
2018/19
Budget Year
+1 2019/20
Budget Year
+2 2020/21
Repairs and maintenance expenditure by Asset Class/Sub-class
Infrastructure 37 014 45 846 45 743 46 086
Roads Infrastructure 10 970 11 444 12 185 12 008
Roads 10 720 11 181 11 908 11 715
Road Furniture 250 263 278 293
Electrical Infrastructure 7 573 13 510 14 043 13 979
LV Networks 7 573 13 510 14 043 13 979
Water Supply Infrastructure 9 919 11 055 10 039 10 675
Distribution 9 919 11 055 10 039 10 675
Sanitation Infrastructure 6 534 7 156 6 647 6 526
Reticulation 6 534 7 156 6 647 6 526
Solid Waste Infrastructure 2 018 2 681 2 829 2 899
Landfill Sites 2 018 2 681 2 829 2 899
Community Assets 8 483 7 354 7 889 8 455
Community Facilities 4 358 5 039 5 418 5 826
Cemeteries/Crematoria 636 729 783 842
Public Open Space 3 723 4 310 4 635 4 984
Sport and Recreation Facilities 4 125 2 315 2 470 2 629
Outdoor Facilities 4 125 2 315 2 470 2 629
Other assets 4 516 5 102 5 415 5 739
Operational Buildings 4 516 5 102 5 415 5 739
Municipal Offices 4 516 5 102 5 415 5 739
Intangible Assets 2 992 3 164 3 406 3 817
Licences and Rights 2 992 3 164 3 406 3 817
Computer Software and Applications 2 992 3 164 3 406 3 817
Computer Equipment 68 155 162 171
Computer Equipment 68 155 162 171
Furniture and Office Equipment 88 101 106 111
Furniture and Office Equipment 88 101 106 111
Machinery and Equipment 620 756 798 842
Machinery and Equipment 620 756 798 842
Transport Assets 3 548 4 216 4 458 4 721
Transport Assets 3 548 4 216 4 458 4 721
Total Repairs and Maintenance Expenditure 57 329 66 693 67 977 69 942
R&M as a % of PPE 14.8% 17.3% 16.8% 16.1%
R&M as % Operating Expenditure 17.9% 20.8% 19.2% 18.2%
2018/19 Medium Term Revenue &
Expenditure Framework
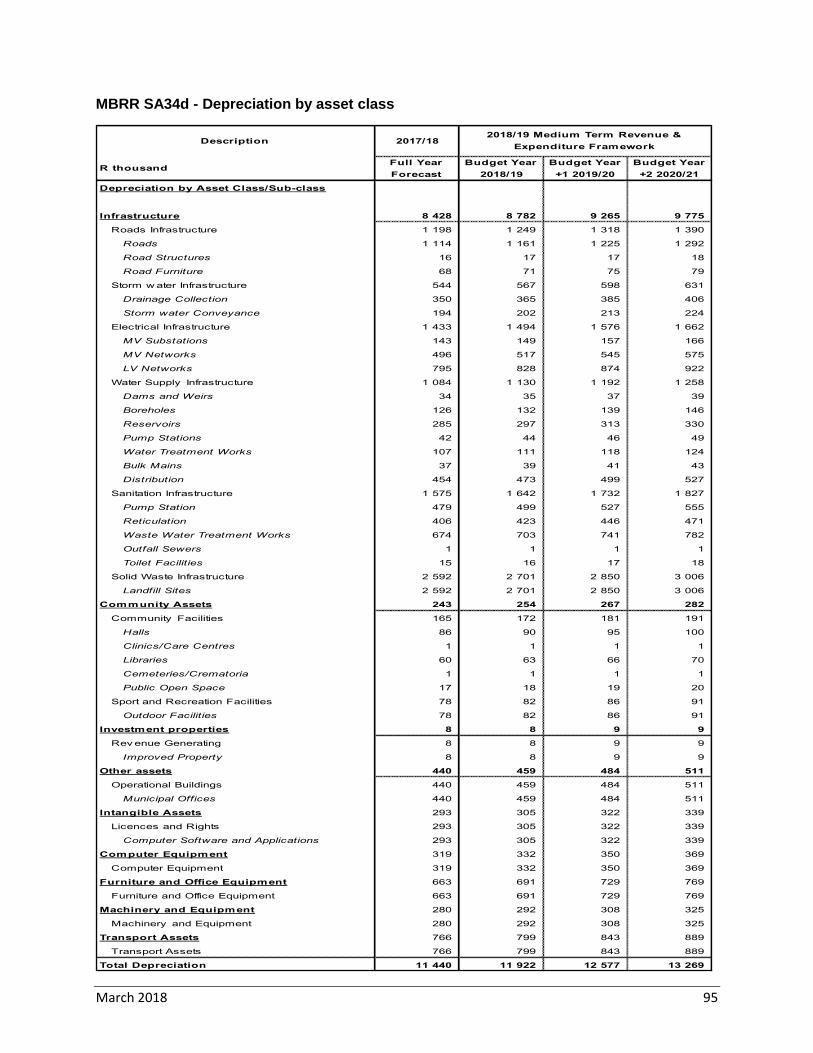
March 2018 95
MBRR SA34d - Depreciation by asset class
Description 2017/18
R thousandFull Year
Forecast
Budget Year
2018/19
Budget Year
+1 2019/20
Budget Year
+2 2020/21
Depreciation by Asset Class/Sub-class
Infrastructure 8 428 8 782 9 265 9 775
Roads Infrastructure 1 198 1 249 1 318 1 390
Roads 1 114 1 161 1 225 1 292
Road Structures 16 17 17 18
Road Furniture 68 71 75 79
Storm w ater Infrastructure 544 567 598 631
Drainage Collection 350 365 385 406
Storm water Conveyance 194 202 213 224
Electrical Infrastructure 1 433 1 494 1 576 1 662
MV Substations 143 149 157 166
MV Networks 496 517 545 575
LV Networks 795 828 874 922
Water Supply Infrastructure 1 084 1 130 1 192 1 258
Dams and Weirs 34 35 37 39
Boreholes 126 132 139 146
Reservoirs 285 297 313 330
Pump Stations 42 44 46 49
Water Treatment Works 107 111 118 124
Bulk Mains 37 39 41 43
Distribution 454 473 499 527
Sanitation Infrastructure 1 575 1 642 1 732 1 827
Pump Station 479 499 527 555
Reticulation 406 423 446 471
Waste Water Treatment Works 674 703 741 782
Outfall Sewers 1 1 1 1
Toilet Facilities 15 16 17 18
Solid Waste Infrastructure 2 592 2 701 2 850 3 006
Landfill Sites 2 592 2 701 2 850 3 006
Community Assets 243 254 267 282
Community Facilities 165 172 181 191
Halls 86 90 95 100
Clinics/Care Centres 1 1 1 1
Libraries 60 63 66 70
Cemeteries/Crematoria 1 1 1 1
Public Open Space 17 18 19 20
Sport and Recreation Facilities 78 82 86 91
Outdoor Facilities 78 82 86 91
Investment properties 8 8 9 9
Rev enue Generating 8 8 9 9
Improved Property 8 8 9 9
Other assets 440 459 484 511
Operational Buildings 440 459 484 511
Municipal Offices 440 459 484 511
Intangible Assets 293 305 322 339
Licences and Rights 293 305 322 339
Computer Software and Applications 293 305 322 339
Computer Equipment 319 332 350 369
Computer Equipment 319 332 350 369
Furniture and Office Equipment 663 691 729 769
Furniture and Office Equipment 663 691 729 769
Machinery and Equipment 280 292 308 325
Machinery and Equipment 280 292 308 325
Transport Assets 766 799 843 889
Transport Assets 766 799 843 889
Total Depreciation 11 440 11 922 12 577 13 269
2018/19 Medium Term Revenue &
Expenditure Framework

March 2018 96
MBRR SA35 - Future financial implications of the capital budget
No future implications identified on the capital budget beyond the MTREF period.
MBRR SA36 - Detailed capital budget per municipal vote
Municipal Vote/Capital projectAsset Class Asset Sub-Class
R thousand 3 3
Current Year
2017/18
Full Year
Forecast
Budget Year
2018/19
Budget Year
+1 2019/20
Budget Year
+2 2020/21Ward location
New or
renewal
Parent municipality:
List all capital projects grouped by Municipal Vote
5.5 - Water WC033_SECURE BOREHOLES (KAM AREA) KPA5/SG5/SO8 Water Supply Infrastructure Boreholes 200 – – – Whole of Municipality R
5.4 - Streets & Stormw ater WC033_Stormw ater - Master pl -Napier KPA5/SG5/SO8 Storm water Infrastructure Storm water Conveyance – – 200 200 Napier U
5.4 - Streets & Stormw ater WC033_Storm Water Master pl - SBay KPA5/SG5/SO8 Storm water Infrastructure Storm water Conveyance 200 – 200 200 Struisbaai U
5.4 - Streets & Stormw ater WC033_Stormw ater Master pl - Bdorp KPA5/SG5/SO8 Storm water Infrastructure Storm water Conveyance 100 – 200 200 Bredasdorp U
5.4 - Streets & Stormw ater WC033_Stormw ater Master pl - Agulhas KPA5/SG5/SO8 Storm water Infrastructure Storm water Conveyance 200 – 200 200 Agulhas U
5.4 - Streets & Stormw ater WC033_Upgrade Road to Landfill Site Bredasdorp to Struisbay KPA5/SG5/SO8 Roads Infrastructure Roads – 600 300 300 Bredasdorp U
5.4 - Streets & Stormw ater WC033_SIDEWALKS SBAAI/LA KPA5/SG5/SO8 Roads Infrastructure Road Furniture 500 800 500 500 Agulhas U
5.4 - Streets & Stormw ater WC033_Nuw erus Streets - Adam Street KPA5/SG5/SO8 Roads Infrastructure Roads 1 247 – – – Napier U
5.4 - Streets & Stormw ater WC033_Stormw ater pipeline - Area F KPA5/SG5/SO8 Storm water Infrastructure Storm water Conveyance 5 798 7 741 – – Bredasdorp N
5.4 - Streets & Stormw ater WC033_Sidew alks Long Street (B/Dorp) KPA5/SG5/SO8 Roads Infrastructure Road Furniture 400 – – – Bredasdorp U
5.4 - Streets & Stormw ater WC033_Sidew alks - Bredasdorp (Wards) KPA5/SG5/SO8 Roads Infrastructure Road Furniture 400 500 500 500 Bredasdorp U
5.4 - Streets & Stormw ater WC033_Furniture (Manager & Superv isor) KPA5/SG5/SO8 Furniture and Office Equipment Furniture and Office Equipment 25 – 25 – Bredasdorp R
5.4 - Streets & Stormw ater WC033_Speed Bumps CAM (3 per w ard) KPA5/SG5/SO8 Roads Infrastructure Road Furniture 200 – 210 220 Bredasdorp N
5.4 - Streets & Stormw ater WC033_3 x Plate Compactors KPA5/SG5/SO8 Machinery and Equipment Machinery and Equipment 45 – – – Whole of Municipality N
5.4 - Streets & Stormw ater WC033_2 x Jackhammers Heav y Duty KPA5/SG5/SO8 Machinery and Equipment Machinery and Equipment 45 – – – Whole of Municipality N
5.4 - Streets & Stormw ater WC033_Industrial Road Struisbay KPA5/SG5/SO8 Roads Infrastructure Roads 900 – – – Struisbaai U
5.4 - Streets & Stormw ater WC033_Ou Meule Link to Sw ellendam Road (B/dorp) KPA5/SG5/SO8 Roads Infrastructure Roads 1 316 – – – Bredasdorp U
5.4 - Streets & Stormw ater WC033_Kerbs Ou Meule street (B/Dorp) KPA5/SG5/SO8 Storm water Infrastructure Storm water Conveyance 200 – 500 500 Bredasdorp N
5.8 - Electricity Serv ices WC033_Street Lights - New KPA5/SG5/SO8 Electrical Infrastructure LV Networks 150 – – – Whole of Municipality U
5.8 - Electricity Serv ices WC033_Electrification - Informal Set KPA5/SG5/SO8 Electrical Infrastructure LV Networks 100 100 120 125 Whole of Municipality N
1.1 - Council Administration WC033_Vehicle (LDV) w ith canopy KPA1/SG1/SO2 Transport Assets Transport Assets 220 – – – Whole of Municipality N
1.1 - Council Administration WC033_Collab Ward Committee Management Module KPA1/SG1/SO2 Intangible Assets Computer Software and Applications 26 – – – Whole of Municipality U
1.1 - Council Administration WC033_Coreldraw softw are KPA1/SG1/SO2 Intangible Assets Computer Software and Applications 8 – – – Whole of Municipality N
1.6 - Strategic Serv ices WC033_Flipchart Easel KPA1/SG1/SO1 Furniture and Office Equipment Furniture and Office Equipment 1 – – – Whole of Municipality N
1.6 - Strategic Serv ices WC033_Pull-up banners X6 KPA1/SG1/SO1 Furniture and Office Equipment Furniture and Office Equipment 6 2 2 2 Whole of Municipality N
1.6 - Strategic Serv ices WC033_Backdrop KPA1/SG1/SO1 Furniture and Office Equipment Furniture and Office Equipment 1 – – – Whole of Municipality N
1.6 - Strategic Serv ices WC033_Photographic lights KPA1/SG1/SO1 Furniture and Office Equipment Furniture and Office Equipment 10 – – – Whole of Municipality N
1.6 - Strategic Serv ices WC033_Voice Recording dev ice KPA1/SG1/SO1 Furniture and Office Equipment Furniture and Office Equipment 6 – – – Whole of Municipality N
1.6 - Strategic Serv ices WC033_Camera Tripod KPA1/SG1/SO1 Furniture and Office Equipment Furniture and Office Equipment 3 – – – Whole of Municipality N
1.5 - Shared Serv ices WC033_Chair KPA1/SG1/SO1 Furniture and Office Equipment Furniture and Office Equipment 4 – – – Whole of Municipality N
Project information
Program/Project descriptionIDP Goal code
2
2018/19 Medium Term Revenue &
Expenditure Framework
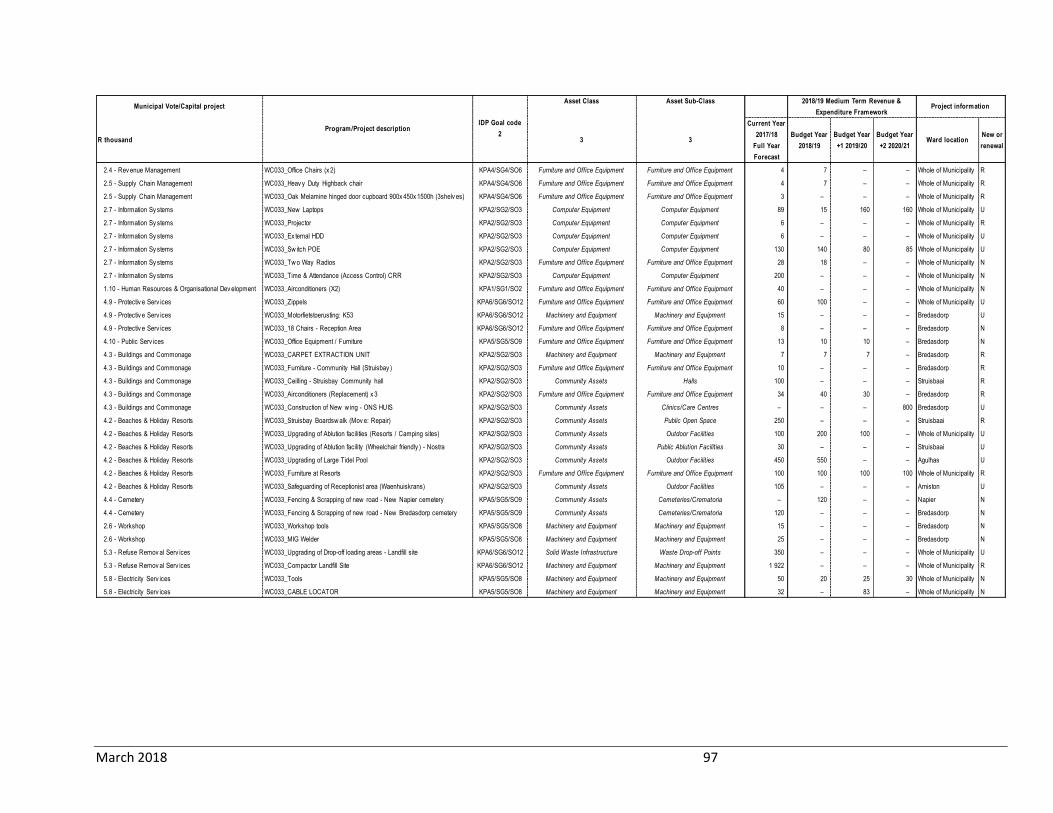
March 2018 97
Municipal Vote/Capital projectAsset Class Asset Sub-Class
R thousand 3 3
Current Year
2017/18
Full Year
Forecast
Budget Year
2018/19
Budget Year
+1 2019/20
Budget Year
+2 2020/21Ward location
New or
renewal
2.4 - Rev enue Management WC033_Office Chairs (x 2) KPA4/SG4/SO6 Furniture and Office Equipment Furniture and Office Equipment 4 7 – – Whole of Municipality R
2.5 - Supply Chain Management WC033_Heav y Duty Highback chair KPA4/SG4/SO6 Furniture and Office Equipment Furniture and Office Equipment 4 7 – – Whole of Municipality R
2.5 - Supply Chain Management WC033_Oak Melamine hinged door cupboard 900x 450x 1500h (3shelv es) KPA4/SG4/SO6 Furniture and Office Equipment Furniture and Office Equipment 3 – – – Whole of Municipality R
2.7 - Information Sy stems WC033_New Laptops KPA2/SG2/SO3 Computer Equipment Computer Equipment 89 15 160 160 Whole of Municipality U
2.7 - Information Sy stems WC033_Projector KPA2/SG2/SO3 Computer Equipment Computer Equipment 6 – – – Whole of Municipality R
2.7 - Information Sy stems WC033_Ex ternal HDD KPA2/SG2/SO3 Computer Equipment Computer Equipment 6 – – – Whole of Municipality U
2.7 - Information Sy stems WC033_Sw itch POE KPA2/SG2/SO3 Computer Equipment Computer Equipment 130 140 80 85 Whole of Municipality U
2.7 - Information Sy stems WC033_Tw o Way Radios KPA2/SG2/SO3 Furniture and Office Equipment Furniture and Office Equipment 28 18 – – Whole of Municipality N
2.7 - Information Sy stems WC033_Time & Attendance (Access Control) CRR KPA2/SG2/SO3 Computer Equipment Computer Equipment 200 – – – Whole of Municipality N
1.10 - Human Resources & Organisational Dev elopment WC033_Airconditioners (X2) KPA1/SG1/SO2 Furniture and Office Equipment Furniture and Office Equipment 40 – – – Whole of Municipality N
4.9 - Protectiv e Serv ices WC033_Zippels KPA6/SG6/SO12 Furniture and Office Equipment Furniture and Office Equipment 60 100 – – Whole of Municipality U
4.9 - Protectiv e Serv ices WC033_Motorfietstoerusting: K53 KPA6/SG6/SO12 Machinery and Equipment Machinery and Equipment 15 – – – Bredasdorp U
4.9 - Protectiv e Serv ices WC033_18 Chairs - Reception Area KPA6/SG6/SO12 Furniture and Office Equipment Furniture and Office Equipment 8 – – – Bredasdorp N
4.10 - Public Serv ices WC033_Office Equipment / Furniture KPA5/SG5/SO9 Furniture and Office Equipment Furniture and Office Equipment 13 10 10 – Bredasdorp N
4.3 - Buildings and Commonage WC033_CARPET EXTRACTION UNIT KPA2/SG2/SO3 Machinery and Equipment Machinery and Equipment 7 7 7 – Bredasdorp R
4.3 - Buildings and Commonage WC033_Furniture - Community Hall (Struisbay ) KPA2/SG2/SO3 Furniture and Office Equipment Furniture and Office Equipment 10 – – – Bredasdorp R
4.3 - Buildings and Commonage WC033_Ceilling - Struisbay Community hall KPA2/SG2/SO3 Community Assets Halls 100 – – – Struisbaai R
4.3 - Buildings and Commonage WC033_Airconditioners (Replacement) x 3 KPA2/SG2/SO3 Furniture and Office Equipment Furniture and Office Equipment 34 40 30 – Bredasdorp R
4.3 - Buildings and Commonage WC033_Construction of New w ing - ONS HUIS KPA2/SG2/SO3 Community Assets Clinics/Care Centres – – – 800 Bredasdorp U
4.2 - Beaches & Holiday Resorts WC033_Struisbay Boardsw alk (Mov e: Repair) KPA2/SG2/SO3 Community Assets Public Open Space 250 – – – Struisbaai R
4.2 - Beaches & Holiday Resorts WC033_Upgrading of Ablution facilities (Resorts / Camping sites) KPA2/SG2/SO3 Community Assets Outdoor Facilities 100 200 100 – Whole of Municipality U
4.2 - Beaches & Holiday Resorts WC033_Upgrading of Ablution facility (Wheelchair friendly ) - Nostra KPA2/SG2/SO3 Community Assets Public Ablution Facilities 30 – – – Struisbaai U
4.2 - Beaches & Holiday Resorts WC033_Upgrading of Large Tidel Pool KPA2/SG2/SO3 Community Assets Outdoor Facilities 450 550 – – Agulhas U
4.2 - Beaches & Holiday Resorts WC033_Furniture at Resorts KPA2/SG2/SO3 Furniture and Office Equipment Furniture and Office Equipment 100 100 100 100 Whole of Municipality R
4.2 - Beaches & Holiday Resorts WC033_Safeguarding of Receptionist area (Waenhuiskrans) KPA2/SG2/SO3 Community Assets Outdoor Facilities 105 – – – Arniston U
4.4 - Cemetery WC033_Fencing & Scrapping of new road - New Napier cemetery KPA5/SG5/SO9 Community Assets Cemeteries/Crematoria – 120 – – Napier N
4.4 - Cemetery WC033_Fencing & Scrapping of new road - New Bredasdorp cemetery KPA5/SG5/SO9 Community Assets Cemeteries/Crematoria 120 – – – Bredasdorp N
2.6 - Workshop WC033_Workshop tools KPA5/SG5/SO8 Machinery and Equipment Machinery and Equipment 15 – – – Bredasdorp N
2.6 - Workshop WC033_MIG Welder KPA5/SG5/SO8 Machinery and Equipment Machinery and Equipment 25 – – – Bredasdorp N
5.3 - Refuse Remov al Serv ices WC033_Upgrading of Drop-off loading areas - Landfill site KPA6/SG6/SO12 Solid Waste Infrastructure Waste Drop-off Points 350 – – – Whole of Municipality U
5.3 - Refuse Remov al Serv ices WC033_Compactor Landfill Site KPA6/SG6/SO12 Machinery and Equipment Machinery and Equipment 1 922 – – – Whole of Municipality R
5.8 - Electricity Serv ices WC033_Tools KPA5/SG5/SO8 Machinery and Equipment Machinery and Equipment 50 20 25 30 Whole of Municipality N
5.8 - Electricity Serv ices WC033_CABLE LOCATOR KPA5/SG5/SO8 Machinery and Equipment Machinery and Equipment 32 – 83 – Whole of Municipality N
Program/Project descriptionIDP Goal code
2
2018/19 Medium Term Revenue &
Expenditure FrameworkProject information
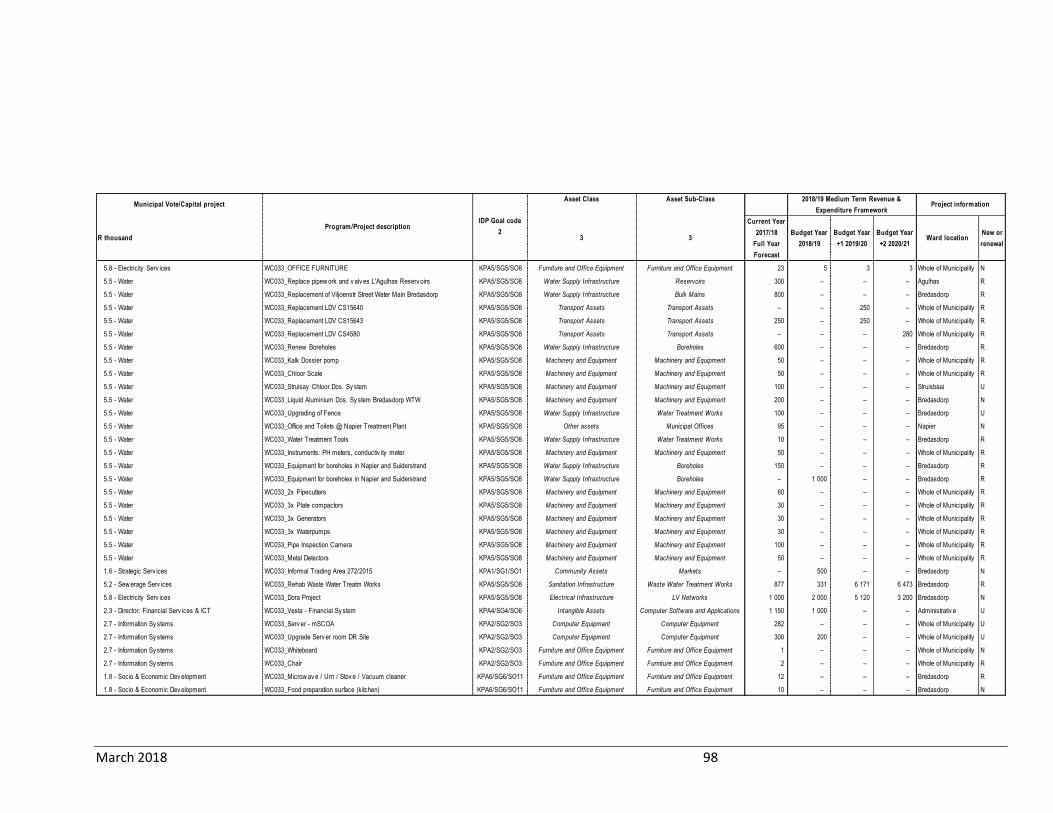
March 2018 98
Municipal Vote/Capital projectAsset Class Asset Sub-Class
R thousand 3 3
Current Year
2017/18
Full Year
Forecast
Budget Year
2018/19
Budget Year
+1 2019/20
Budget Year
+2 2020/21Ward location
New or
renewal
5.8 - Electricity Serv ices WC033_OFFICE FURNITURE KPA5/SG5/SO8 Furniture and Office Equipment Furniture and Office Equipment 23 5 3 3 Whole of Municipality N
5.5 - Water WC033_Replace pipew ork and v alv es L'Agulhas Reserv oirs KPA5/SG5/SO8 Water Supply Infrastructure Reservoirs 300 – – – Agulhas R
5.5 - Water WC033_Replacement of Viljoenstr Street Water Main Bredasdorp KPA5/SG5/SO8 Water Supply Infrastructure Bulk Mains 800 – – – Bredasdorp R
5.5 - Water WC033_Replacement LDV CS15640 KPA5/SG5/SO8 Transport Assets Transport Assets – – 250 – Whole of Municipality R
5.5 - Water WC033_Replacement LDV CS15643 KPA5/SG5/SO8 Transport Assets Transport Assets 250 – 250 – Whole of Municipality R
5.5 - Water WC033_Replacement LDV CS4580 KPA5/SG5/SO8 Transport Assets Transport Assets – – – 280 Whole of Municipality R
5.5 - Water WC033_Renew Boreholes KPA5/SG5/SO8 Water Supply Infrastructure Boreholes 600 – – – Bredasdorp R
5.5 - Water WC033_Kalk Dossier pomp KPA5/SG5/SO8 Machinery and Equipment Machinery and Equipment 50 – – – Whole of Municipality R
5.5 - Water WC033_Chloor Scale KPA5/SG5/SO8 Machinery and Equipment Machinery and Equipment 50 – – – Whole of Municipality R
5.5 - Water WC033_Struisay Chloor Dos. Sy stem KPA5/SG5/SO8 Machinery and Equipment Machinery and Equipment 100 – – – Struisbaai U
5.5 - Water WC033_Liquid Aluminium Dos. Sy stem Bredasdorp WTW KPA5/SG5/SO8 Machinery and Equipment Machinery and Equipment 200 – – – Bredasdorp N
5.5 - Water WC033_Upgrading of Fence KPA5/SG5/SO8 Water Supply Infrastructure Water Treatment Works 100 – – – Bredasdorp U
5.5 - Water WC033_Office and Toilets @ Napier Treatment Plant KPA5/SG5/SO8 Other assets Municipal Offices 95 – – – Napier N
5.5 - Water WC033_Water Treatment Tools KPA5/SG5/SO8 Water Supply Infrastructure Water Treatment Works 10 – – – Bredasdorp R
5.5 - Water WC033_Instruments: PH meters, conductiv ity meter KPA5/SG5/SO8 Machinery and Equipment Machinery and Equipment 50 – – – Whole of Municipality R
5.5 - Water WC033_Equipment for boreholes in Napier and Suiderstrand KPA5/SG5/SO8 Water Supply Infrastructure Boreholes 150 – – – Bredasdorp R
5.5 - Water WC033_Equipment for boreholes in Napier and Suiderstrand KPA5/SG5/SO8 Water Supply Infrastructure Boreholes – 1 000 – – Bredasdorp R
5.5 - Water WC033_2x Pipecutters KPA5/SG5/SO8 Machinery and Equipment Machinery and Equipment 60 – – – Whole of Municipality R
5.5 - Water WC033_3x Plate compactors KPA5/SG5/SO8 Machinery and Equipment Machinery and Equipment 30 – – – Whole of Municipality R
5.5 - Water WC033_3x Generators KPA5/SG5/SO8 Machinery and Equipment Machinery and Equipment 30 – – – Whole of Municipality R
5.5 - Water WC033_3x Waterpumps KPA5/SG5/SO8 Machinery and Equipment Machinery and Equipment 30 – – – Whole of Municipality R
5.5 - Water WC033_Pipe Inspection Camera KPA5/SG5/SO8 Machinery and Equipment Machinery and Equipment 100 – – – Whole of Municipality R
5.5 - Water WC033_Metal Detectors KPA5/SG5/SO8 Machinery and Equipment Machinery and Equipment 50 – – – Whole of Municipality R
1.6 - Strategic Serv ices WC033_Informal Trading Area 272/2015 KPA1/SG1/SO1 Community Assets Markets – 500 – – Bredasdorp N
5.2 - Sew erage Serv ices WC033_Rehab Waste Water Treatm Works KPA5/SG5/SO8 Sanitation Infrastructure Waste Water Treatment Works 877 331 6 171 6 473 Bredasdorp R
5.8 - Electricity Serv ices WC033_Dora Project KPA5/SG5/SO8 Electrical Infrastructure LV Networks 1 000 2 000 5 120 3 200 Bredasdorp N
2.3 - Director: Financial Serv ices & ICT WC033_Vesta - Financial Sy stem KPA4/SG4/SO6 Intangible Assets Computer Software and Applications 1 150 1 000 – – Administrativ e U
2.7 - Information Sy stems WC033_Serv er - mSCOA KPA2/SG2/SO3 Computer Equipment Computer Equipment 282 – – – Whole of Municipality U
2.7 - Information Sy stems WC033_Upgrade Serv er room DR Site KPA2/SG2/SO3 Computer Equipment Computer Equipment 300 200 – – Whole of Municipality U
2.7 - Information Sy stems WC033_Whiteboard KPA2/SG2/SO3 Furniture and Office Equipment Furniture and Office Equipment 1 – – – Whole of Municipality N
2.7 - Information Sy stems WC033_Chair KPA2/SG2/SO3 Furniture and Office Equipment Furniture and Office Equipment 2 – – – Whole of Municipality R
1.8 - Socio & Economic Dev elopment WC033_Microw av e / Urn / Stov e / Vacuum cleaner KPA6/SG6/SO11 Furniture and Office Equipment Furniture and Office Equipment 12 – – – Bredasdorp R
1.8 - Socio & Economic Dev elopment WC033_Food preparation surface (kitchen) KPA6/SG6/SO11 Furniture and Office Equipment Furniture and Office Equipment 10 – – – Bredasdorp N
Program/Project descriptionIDP Goal code
2
2018/19 Medium Term Revenue &
Expenditure FrameworkProject information
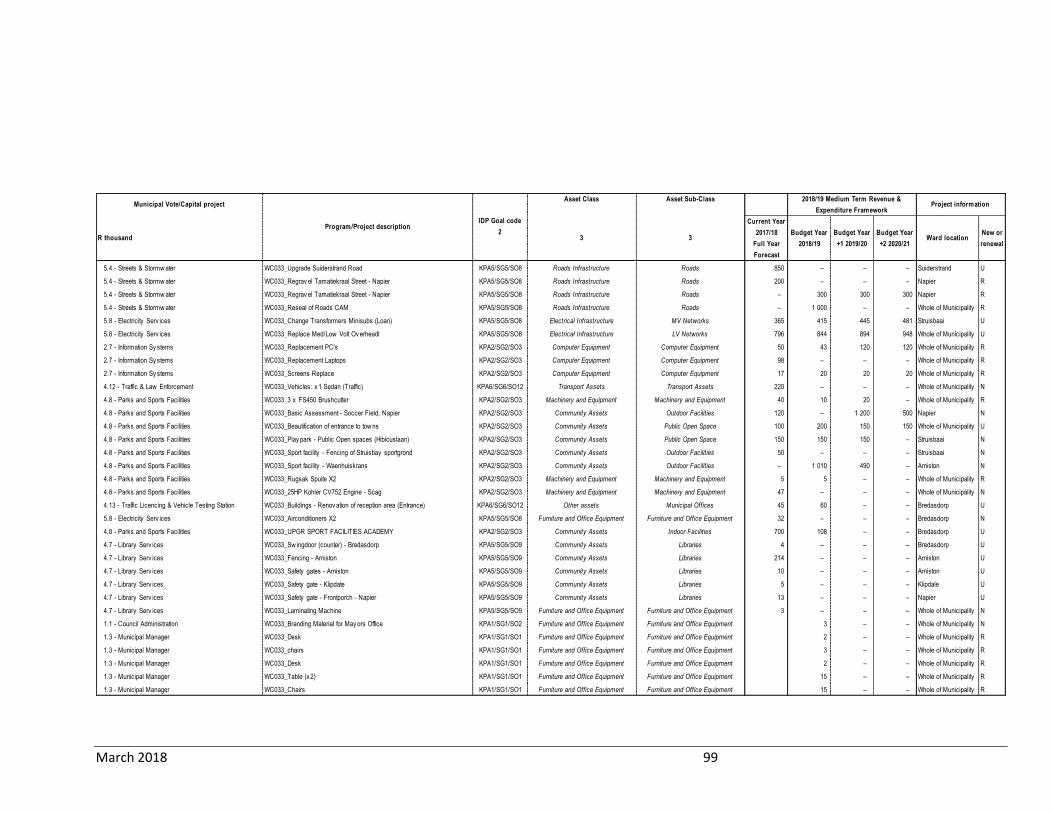
March 2018 99
Municipal Vote/Capital projectAsset Class Asset Sub-Class
R thousand 3 3
Current Year
2017/18
Full Year
Forecast
Budget Year
2018/19
Budget Year
+1 2019/20
Budget Year
+2 2020/21Ward location
New or
renewal
5.4 - Streets & Stormw ater WC033_Upgrade Suiderstrand Road KPA5/SG5/SO8 Roads Infrastructure Roads 850 – – – Suiderstrand U
5.4 - Streets & Stormw ater WC033_Regrav el Tamatiekraal Street - Napier KPA5/SG5/SO8 Roads Infrastructure Roads 200 – – – Napier R
5.4 - Streets & Stormw ater WC033_Regrav el Tamatiekraal Street - Napier KPA5/SG5/SO8 Roads Infrastructure Roads – 300 300 300 Napier R
5.4 - Streets & Stormw ater WC033_Reseal of Roads CAM KPA5/SG5/SO8 Roads Infrastructure Roads – 1 000 – – Whole of Municipality R
5.8 - Electricity Serv ices WC033_Change Transformers Minisubs (Loan) KPA5/SG5/SO8 Electrical Infrastructure MV Networks 365 415 445 481 Struisbaai U
5.8 - Electricity Serv ices WC033_Replace Med/Low Volt Ov erheadl KPA5/SG5/SO8 Electrical Infrastructure LV Networks 796 844 894 948 Whole of Municipality U
2.7 - Information Sy stems WC033_Replacement PC's KPA2/SG2/SO3 Computer Equipment Computer Equipment 50 43 120 120 Whole of Municipality R
2.7 - Information Sy stems WC033_Replacement Laptops KPA2/SG2/SO3 Computer Equipment Computer Equipment 98 – – – Whole of Municipality R
2.7 - Information Sy stems WC033_Screens Replace KPA2/SG2/SO3 Computer Equipment Computer Equipment 17 20 20 20 Whole of Municipality R
4.12 - Traffic & Law Enforcement WC033_Vehicles: x 1 Sedan (Traffic) KPA6/SG6/SO12 Transport Assets Transport Assets 220 – – – Whole of Municipality N
4.8 - Parks and Sports Facilities WC033_3 x FS450 Brushcutter KPA2/SG2/SO3 Machinery and Equipment Machinery and Equipment 40 10 20 – Whole of Municipality R
4.8 - Parks and Sports Facilities WC033_Basic Assessment - Soccer Field, Napier KPA2/SG2/SO3 Community Assets Outdoor Facilities 120 – 1 200 500 Napier N
4.8 - Parks and Sports Facilities WC033_Beautification of entrance to tow ns KPA2/SG2/SO3 Community Assets Public Open Space 100 200 150 150 Whole of Municipality U
4.8 - Parks and Sports Facilities WC033_Play park - Public Open spaces (Hibicuslaan) KPA2/SG2/SO3 Community Assets Public Open Space 150 150 150 – Struisbaai N
4.8 - Parks and Sports Facilities WC033_Sport facility - Fencing of Struisbay sportgrond KPA2/SG2/SO3 Community Assets Outdoor Facilities 50 – – – Struisbaai N
4.8 - Parks and Sports Facilities WC033_Sport facility - Waenhuiskrans KPA2/SG2/SO3 Community Assets Outdoor Facilities – 1 010 490 – Arniston N
4.8 - Parks and Sports Facilities WC033_Rugsak Spuite X2 KPA2/SG2/SO3 Machinery and Equipment Machinery and Equipment 5 5 – – Whole of Municipality R
4.8 - Parks and Sports Facilities WC033_25HP Kohler CV752 Engine - Scag KPA2/SG2/SO3 Machinery and Equipment Machinery and Equipment 47 – – – Whole of Municipality N
4.13 - Traffic Licencing & Vehicle Testing Station WC033_Buildings - Renov ation of reception area (Entrance) KPA6/SG6/SO12 Other assets Municipal Offices 45 60 – – Bredasdorp U
5.8 - Electricity Serv ices WC033_Airconditioners X2 KPA5/SG5/SO8 Furniture and Office Equipment Furniture and Office Equipment 32 – – – Bredasdorp N
4.8 - Parks and Sports Facilities WC033_UPGR SPORT FACILITIES ACADEMY KPA2/SG2/SO3 Community Assets Indoor Facilities 700 108 – – Bredasdorp U
4.7 - Library Serv ices WC033_Sw ingdoor (counter) - Bredasdorp KPA5/SG5/SO9 Community Assets Libraries 4 – – – Bredasdorp U
4.7 - Library Serv ices WC033_Fencing - Arniston KPA5/SG5/SO9 Community Assets Libraries 214 – – – Arniston U
4.7 - Library Serv ices WC033_Safety gates - Arniston KPA5/SG5/SO9 Community Assets Libraries 10 – – – Arniston U
4.7 - Library Serv ices WC033_Safety gate - Klipdate KPA5/SG5/SO9 Community Assets Libraries 5 – – – Klipdale U
4.7 - Library Serv ices WC033_Safety gate - Frontporch - Napier KPA5/SG5/SO9 Community Assets Libraries 13 – – – Napier U
4.7 - Library Serv ices WC033_Laminating Machine KPA5/SG5/SO9 Furniture and Office Equipment Furniture and Office Equipment 3 – – – Whole of Municipality N
1.1 - Council Administration WC033_Branding Material for May ors Office KPA1/SG1/SO2 Furniture and Office Equipment Furniture and Office Equipment 3 – – Whole of Municipality N
1.3 - Municipal Manager WC033_Desk KPA1/SG1/SO1 Furniture and Office Equipment Furniture and Office Equipment 2 – – Whole of Municipality R
1.3 - Municipal Manager WC033_chairs KPA1/SG1/SO1 Furniture and Office Equipment Furniture and Office Equipment 3 – – Whole of Municipality R
1.3 - Municipal Manager WC033_Desk KPA1/SG1/SO1 Furniture and Office Equipment Furniture and Office Equipment 2 – – Whole of Municipality R
1.3 - Municipal Manager WC033_Table (x 2) KPA1/SG1/SO1 Furniture and Office Equipment Furniture and Office Equipment 15 – – Whole of Municipality R
1.3 - Municipal Manager WC033_Chairs KPA1/SG1/SO1 Furniture and Office Equipment Furniture and Office Equipment 15 – – Whole of Municipality R
Program/Project descriptionIDP Goal code
2
2018/19 Medium Term Revenue &
Expenditure FrameworkProject information

March 2018 100
Municipal Vote/Capital projectAsset Class Asset Sub-Class
R thousand 3 3
Current Year
2017/18
Full Year
Forecast
Budget Year
2018/19
Budget Year
+1 2019/20
Budget Year
+2 2020/21Ward location
New or
renewal
1.3 - Municipal Manager WC033_Yskas KPA1/SG1/SO1 Furniture and Office Equipment Furniture and Office Equipment 4 – – Whole of Municipality R
1.3 - Municipal Manager WC033_Microw av e KPA1/SG1/SO1 Furniture and Office Equipment Furniture and Office Equipment 1 – – Whole of Municipality R
1.3 - Municipal Manager WC033_Urn (10 Litre) X2 KPA1/SG1/SO1 Furniture and Office Equipment Furniture and Office Equipment 3 – – Whole of Municipality R
1.2 - Internal Audit WC033_Whiteboard Magnetic Aluminium Frame 1200mm X 1500mm KPA1/SG1/SO1 Furniture and Office Equipment Furniture and Office Equipment 2 – – Whole of Municipality R
1.6 - Strategic Serv ices WC033_Panel Heaters (3) KPA1/SG1/SO1 Furniture and Office Equipment Furniture and Office Equipment 2 – – Whole of Municipality R
1.6 - Strategic Serv ices WC033_Laminating machine (A3) KPA1/SG1/SO1 Furniture and Office Equipment Furniture and Office Equipment 1 – – Whole of Municipality R
1.6 - Strategic Serv ices WC033_Telev ision screens- municipal buildings KPA1/SG1/SO1 Furniture and Office Equipment Furniture and Office Equipment – 3 3 Whole of Municipality N
1.6 - Strategic Serv ices WC033_Desk KPA1/SG1/SO1 Furniture and Office Equipment Furniture and Office Equipment 4 – – Whole of Municipality R
1.6 - Strategic Serv ices WC033_Wall Banner KPA1/SG1/SO1 Furniture and Office Equipment Furniture and Office Equipment 8 – – Whole of Municipality N
1.6 - Strategic Serv ices WC033_White board KPA1/SG1/SO1 Furniture and Office Equipment Furniture and Office Equipment 1 – – Whole of Municipality R
1.7 - Tow n Planning WC033_Laptop KPA5/SG5/SO10 Computer Equipment Computer Equipment 15 – – Whole of Municipality R
1.7 - Tow n Planning WC033_Visitor Chairs (x 2) KPA5/SG5/SO10 Furniture and Office Equipment Furniture and Office Equipment 5 – – Whole of Municipality R
1.7 - Tow n Planning WC033_Office Chairs( x 1) KPA5/SG5/SO10 Furniture and Office Equipment Furniture and Office Equipment 3 – – Whole of Municipality R
1.7 - Tow n Planning WC033_Voice Recorder KPA5/SG5/SO10 Furniture and Office Equipment Furniture and Office Equipment 5 – – Whole of Municipality R
1.7 - Tow n Planning WC033_White board KPA5/SG5/SO10 Furniture and Office Equipment Furniture and Office Equipment 2 – – Whole of Municipality R
1.7 - Tow n Planning WC033_Drone KPA5/SG5/SO10 Furniture and Office Equipment Furniture and Office Equipment – 40 – Whole of Municipality N
1.7 - Tow n Planning WC033_Softw are for Image processing for Drones KPA5/SG5/SO10 Intangible Assets Computer Software and Applications – 50 50 Whole of Municipality N
1.9 - Administration WC033_Chair KPA2/SG2/SO3 Furniture and Office Equipment Furniture and Office Equipment 4 – – Whole of Municipality R
1.9 - Administration WC033_Mail Archiv ing KPA2/SG2/SO3 Computer Equipment Computer Equipment 120 – – Whole of Municipality N
1.8 - Socio & Economic Dev elopment WC033_Plastic Chairs for Thusong Hall KPA6/SG6/SO11 Furniture and Office Equipment Furniture and Office Equipment 10 – – Bredasdorp R
1.8 - Socio & Economic Dev elopment WC033_Tables for Thusong Hall KPA6/SG6/SO11 Furniture and Office Equipment Furniture and Office Equipment 10 – – Bredasdorp R
1.8 - Socio & Economic Dev elopment WC033_Pop Up Banners * 3 KPA6/SG6/SO11 Furniture and Office Equipment Furniture and Office Equipment 3 – – Bredasdorp N
1.8 - Socio & Economic Dev elopment WC033_Outdoor Benches *2 for Thusong centre KPA6/SG6/SO11 Furniture and Office Equipment Furniture and Office Equipment 8 – – Bredasdorp N
2.4 - Rev enue Management WC033_Desk Calculator (x 2) KPA4/SG4/SO6 Furniture and Office Equipment Furniture and Office Equipment 2 – – Whole of Municipality R
2.4 - Rev enue Management WC033_Steel cabinet 4 draw ers (X2) KPA4/SG4/SO6 Furniture and Office Equipment Furniture and Office Equipment 5 – – Whole of Municipality R
2.5 - Supply Chain Management WC033_Airconditioners (Struisbaai Stores) KPA4/SG4/SO6 Furniture and Office Equipment Furniture and Office Equipment 8 – – Struisbaai R
2.7 - Information Sy stems WC033_UPS small (Offices) KPA2/SG2/SO3 Computer Equipment Computer Equipment 15 20 20 Whole of Municipality R
2.7 - Information Sy stems WC033_Rack mount UPS KPA2/SG2/SO3 Furniture and Office Equipment Furniture and Office Equipment 20 – – Whole of Municipality R
2.7 - Information Sy stems WC033_Access Points - Netw ork KPA2/SG2/SO3 Computer Equipment Computer Equipment 45 45 – Whole of Municipality R
2.7 - Information Sy stems WC033_Netw ork Replacement LAN KPA2/SG2/SO3 Computer Equipment Computer Equipment 150 50 50 Whole of Municipality R
2.7 - Information Sy stems WC033_New PC's KPA2/SG2/SO3 Computer Equipment Computer Equipment 16 – – Whole of Municipality N
2.7 - Information Sy stems WC033_Time Attendance and Access Control - Boomgates KPA2/SG2/SO3 Machinery and Equipment Machinery and Equipment 120 – – Whole of Municipality N
2.7 - Information Sy stems WC033_Public Engagement app KPA2/SG2/SO3 Intangible Assets Computer Software and Applications – 200 – Whole of Municipality N
Program/Project descriptionIDP Goal code
2
2018/19 Medium Term Revenue &
Expenditure FrameworkProject information
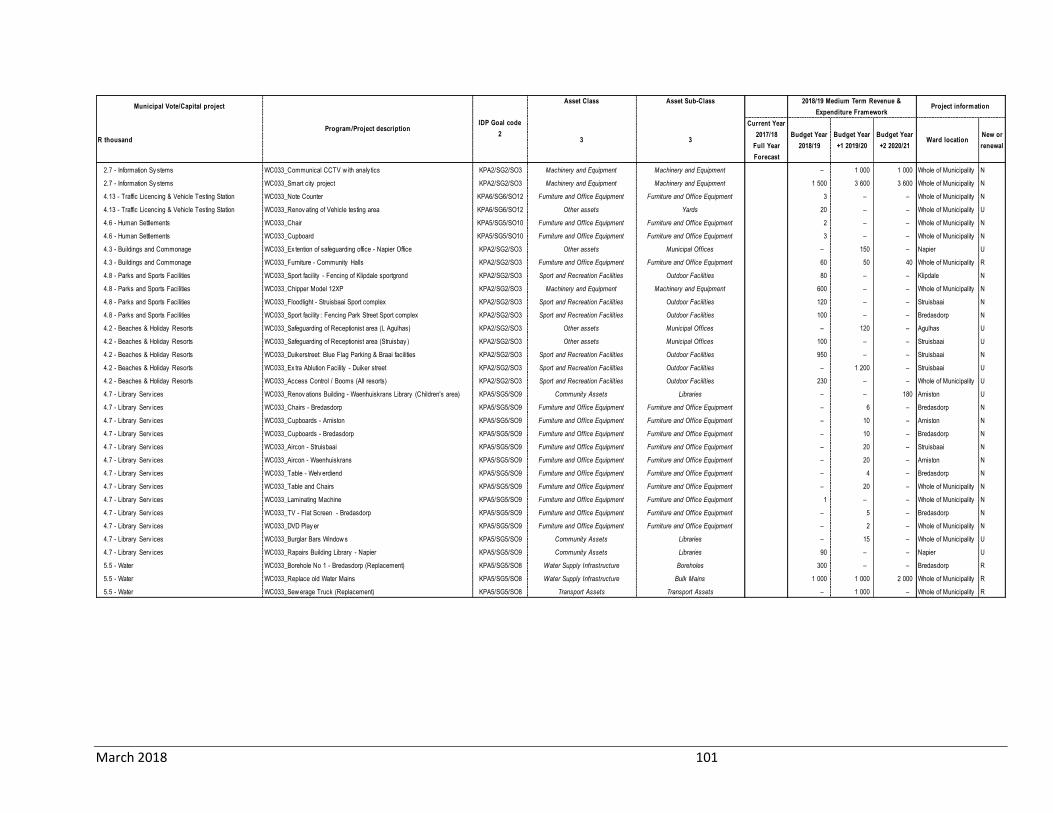
March 2018 101
Municipal Vote/Capital projectAsset Class Asset Sub-Class
R thousand 3 3
Current Year
2017/18
Full Year
Forecast
Budget Year
2018/19
Budget Year
+1 2019/20
Budget Year
+2 2020/21Ward location
New or
renewal
2.7 - Information Sy stems WC033_Communical CCTV w ith analy tics KPA2/SG2/SO3 Machinery and Equipment Machinery and Equipment – 1 000 1 000 Whole of Municipality N
2.7 - Information Sy stems WC033_Smart city project KPA2/SG2/SO3 Machinery and Equipment Machinery and Equipment 1 500 3 600 3 600 Whole of Municipality N
4.13 - Traffic Licencing & Vehicle Testing Station WC033_Note Counter KPA6/SG6/SO12 Furniture and Office Equipment Furniture and Office Equipment 3 – – Whole of Municipality N
4.13 - Traffic Licencing & Vehicle Testing Station WC033_Renov ating of Vehicle testing area KPA6/SG6/SO12 Other assets Yards 20 – – Whole of Municipality U
4.6 - Human Settlements WC033_Chair KPA5/SG5/SO10 Furniture and Office Equipment Furniture and Office Equipment 2 – – Whole of Municipality N
4.6 - Human Settlements WC033_Cupboard KPA5/SG5/SO10 Furniture and Office Equipment Furniture and Office Equipment 3 – – Whole of Municipality N
4.3 - Buildings and Commonage WC033_Ex tention of safeguarding office - Napier Office KPA2/SG2/SO3 Other assets Municipal Offices – 150 – Napier U
4.3 - Buildings and Commonage WC033_Furniture - Community Halls KPA2/SG2/SO3 Furniture and Office Equipment Furniture and Office Equipment 60 50 40 Whole of Municipality R
4.8 - Parks and Sports Facilities WC033_Sport facility - Fencing of Klipdale sportgrond KPA2/SG2/SO3 Sport and Recreation Facilities Outdoor Facilities 80 – – Klipdale N
4.8 - Parks and Sports Facilities WC033_Chipper Model 12XP KPA2/SG2/SO3 Machinery and Equipment Machinery and Equipment 600 – – Whole of Municipality N
4.8 - Parks and Sports Facilities WC033_Floodlight - Struisbaai Sport complex KPA2/SG2/SO3 Sport and Recreation Facilities Outdoor Facilities 120 – – Struisbaai N
4.8 - Parks and Sports Facilities WC033_Sport facility : Fencing Park Street Sport complex KPA2/SG2/SO3 Sport and Recreation Facilities Outdoor Facilities 100 – – Bredasdorp N
4.2 - Beaches & Holiday Resorts WC033_Safeguarding of Receptionist area (L Agulhas) KPA2/SG2/SO3 Other assets Municipal Offices – 120 – Agulhas U
4.2 - Beaches & Holiday Resorts WC033_Safeguarding of Receptionist area (Struisbay ) KPA2/SG2/SO3 Other assets Municipal Offices 100 – – Struisbaai U
4.2 - Beaches & Holiday Resorts WC033_Duikerstreet: Blue Flag Parking & Braai facilities KPA2/SG2/SO3 Sport and Recreation Facilities Outdoor Facilities 950 – – Struisbaai N
4.2 - Beaches & Holiday Resorts WC033_Ex tra Ablution Facility - Duiker street KPA2/SG2/SO3 Sport and Recreation Facilities Outdoor Facilities – 1 200 – Struisbaai U
4.2 - Beaches & Holiday Resorts WC033_Access Control / Booms (All resorts) KPA2/SG2/SO3 Sport and Recreation Facilities Outdoor Facilities 230 – – Whole of Municipality U
4.7 - Library Serv ices WC033_Renov ations Building - Waenhuiskrans Library (Children's area) KPA5/SG5/SO9 Community Assets Libraries – – 180 Arniston U
4.7 - Library Serv ices WC033_Chairs - Bredasdorp KPA5/SG5/SO9 Furniture and Office Equipment Furniture and Office Equipment – 6 – Bredasdorp N
4.7 - Library Serv ices WC033_Cupboards - Arniston KPA5/SG5/SO9 Furniture and Office Equipment Furniture and Office Equipment – 10 – Arniston N
4.7 - Library Serv ices WC033_Cupboards - Bredasdorp KPA5/SG5/SO9 Furniture and Office Equipment Furniture and Office Equipment – 10 – Bredasdorp N
4.7 - Library Serv ices WC033_Aircon - Struisbaai KPA5/SG5/SO9 Furniture and Office Equipment Furniture and Office Equipment – 20 – Struisbaai N
4.7 - Library Serv ices WC033_Aircon - Waenhuiskrans KPA5/SG5/SO9 Furniture and Office Equipment Furniture and Office Equipment – 20 – Arniston N
4.7 - Library Serv ices WC033_Table - Welv erdiend KPA5/SG5/SO9 Furniture and Office Equipment Furniture and Office Equipment – 4 – Bredasdorp N
4.7 - Library Serv ices WC033_Table and Chairs KPA5/SG5/SO9 Furniture and Office Equipment Furniture and Office Equipment – 20 – Whole of Municipality N
4.7 - Library Serv ices WC033_Laminating Machine KPA5/SG5/SO9 Furniture and Office Equipment Furniture and Office Equipment 1 – – Whole of Municipality N
4.7 - Library Serv ices WC033_TV - Flat Screen - Bredasdorp KPA5/SG5/SO9 Furniture and Office Equipment Furniture and Office Equipment – 5 – Bredasdorp N
4.7 - Library Serv ices WC033_DVD Play er KPA5/SG5/SO9 Furniture and Office Equipment Furniture and Office Equipment – 2 – Whole of Municipality N
4.7 - Library Serv ices WC033_Burglar Bars Window s KPA5/SG5/SO9 Community Assets Libraries – 15 – Whole of Municipality U
4.7 - Library Serv ices WC033_Rapairs Building Library - Napier KPA5/SG5/SO9 Community Assets Libraries 90 – – Napier U
5.5 - Water WC033_Borehole No 1 - Bredasdorp (Replacement) KPA5/SG5/SO8 Water Supply Infrastructure Boreholes 300 – – Bredasdorp R
5.5 - Water WC033_Replace old Water Mains KPA5/SG5/SO8 Water Supply Infrastructure Bulk Mains 1 000 1 000 2 000 Whole of Municipality R
5.5 - Water WC033_Sew erage Truck (Replacement) KPA5/SG5/SO8 Transport Assets Transport Assets – 1 000 – Whole of Municipality R
Program/Project descriptionIDP Goal code
2
2018/19 Medium Term Revenue &
Expenditure FrameworkProject information
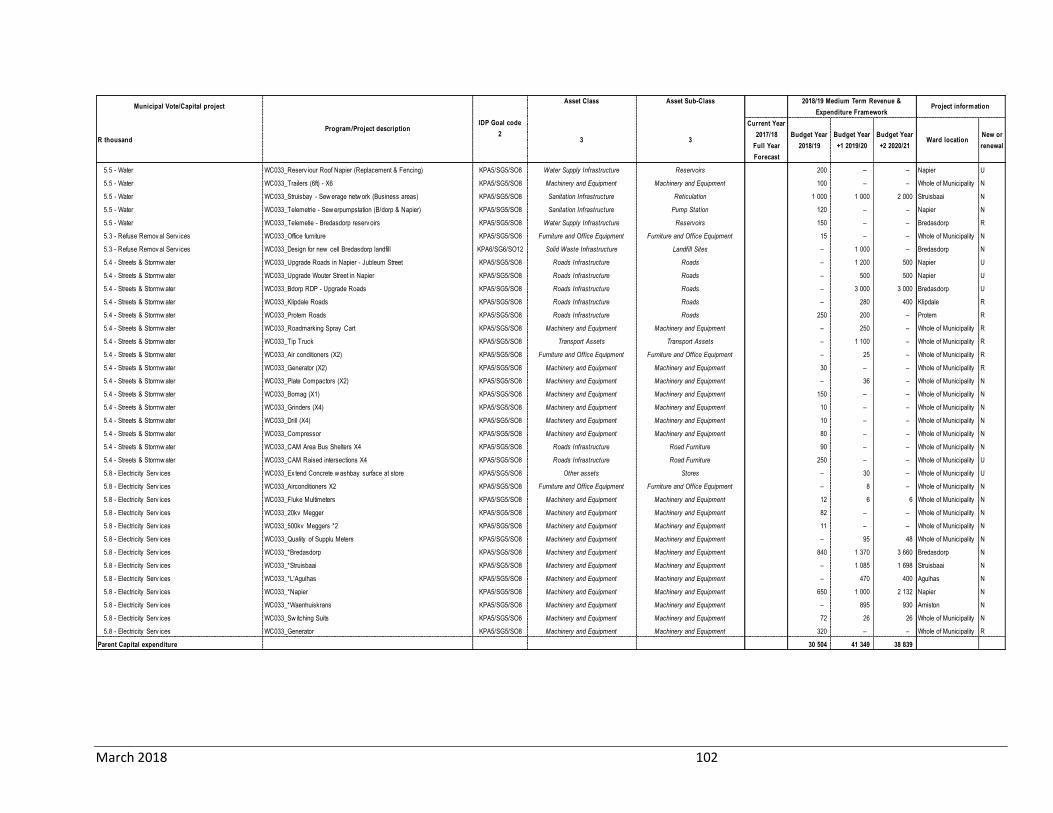
March 2018 102
Municipal Vote/Capital projectAsset Class Asset Sub-Class
R thousand 3 3
Current Year
2017/18
Full Year
Forecast
Budget Year
2018/19
Budget Year
+1 2019/20
Budget Year
+2 2020/21Ward location
New or
renewal
5.5 - Water WC033_Reserv iour Roof Napier (Replacement & Fencing) KPA5/SG5/SO8 Water Supply Infrastructure Reservoirs 200 – – Napier U
5.5 - Water WC033_Trailers (6ft) - X6 KPA5/SG5/SO8 Machinery and Equipment Machinery and Equipment 100 – – Whole of Municipality N
5.5 - Water WC033_Struisbay - Sew erage netw ork (Business areas) KPA5/SG5/SO8 Sanitation Infrastructure Reticulation 1 000 1 000 2 000 Struisbaai N
5.5 - Water WC033_Telemetrie - Sew erpumpstation (B/dorp & Napier) KPA5/SG5/SO8 Sanitation Infrastructure Pump Station 120 – – Napier N
5.5 - Water WC033_Telemetie - Bredasdorp reserv oirs KPA5/SG5/SO8 Water Supply Infrastructure Reservoirs 150 – – Bredasdorp R
5.3 - Refuse Remov al Serv ices WC033_Office furniture KPA5/SG5/SO8 Furniture and Office Equipment Furniture and Office Equipment 15 – – Whole of Municipality N
5.3 - Refuse Remov al Serv ices WC033_Design for new cell Bredasdorp landfill KPA6/SG6/SO12 Solid Waste Infrastructure Landfill Sites – 1 000 – Bredasdorp N
5.4 - Streets & Stormw ater WC033_Upgrade Roads in Napier - Jubleum Street KPA5/SG5/SO8 Roads Infrastructure Roads – 1 200 500 Napier U
5.4 - Streets & Stormw ater WC033_Upgrade Wouter Street in Napier KPA5/SG5/SO8 Roads Infrastructure Roads – 500 500 Napier U
5.4 - Streets & Stormw ater WC033_Bdorp RDP - Upgrade Roads KPA5/SG5/SO8 Roads Infrastructure Roads – 3 000 3 000 Bredasdorp U
5.4 - Streets & Stormw ater WC033_Klipdale Roads KPA5/SG5/SO8 Roads Infrastructure Roads – 280 400 Klipdale R
5.4 - Streets & Stormw ater WC033_Protem Roads KPA5/SG5/SO8 Roads Infrastructure Roads 250 200 – Protem R
5.4 - Streets & Stormw ater WC033_Roadmarking Spray Cart KPA5/SG5/SO8 Machinery and Equipment Machinery and Equipment – 250 – Whole of Municipality R
5.4 - Streets & Stormw ater WC033_Tip Truck KPA5/SG5/SO8 Transport Assets Transport Assets – 1 100 – Whole of Municipality R
5.4 - Streets & Stormw ater WC033_Air conditioners (X2) KPA5/SG5/SO8 Furniture and Office Equipment Furniture and Office Equipment – 25 – Whole of Municipality R
5.4 - Streets & Stormw ater WC033_Generator (X2) KPA5/SG5/SO8 Machinery and Equipment Machinery and Equipment 30 – – Whole of Municipality R
5.4 - Streets & Stormw ater WC033_Plate Compactors (X2) KPA5/SG5/SO8 Machinery and Equipment Machinery and Equipment – 36 – Whole of Municipality N
5.4 - Streets & Stormw ater WC033_Bomag (X1) KPA5/SG5/SO8 Machinery and Equipment Machinery and Equipment 150 – – Whole of Municipality N
5.4 - Streets & Stormw ater WC033_Grinders (X4) KPA5/SG5/SO8 Machinery and Equipment Machinery and Equipment 10 – – Whole of Municipality N
5.4 - Streets & Stormw ater WC033_Drill (X4) KPA5/SG5/SO8 Machinery and Equipment Machinery and Equipment 10 – – Whole of Municipality N
5.4 - Streets & Stormw ater WC033_Compressor KPA5/SG5/SO8 Machinery and Equipment Machinery and Equipment 80 – – Whole of Municipality N
5.4 - Streets & Stormw ater WC033_CAM Area Bus Shelters X4 KPA5/SG5/SO8 Roads Infrastructure Road Furniture 90 – – Whole of Municipality N
5.4 - Streets & Stormw ater WC033_CAM Raised intersections X4 KPA5/SG5/SO8 Roads Infrastructure Road Furniture 250 – – Whole of Municipality U
5.8 - Electricity Serv ices WC033_Ex tend Concrete w ashbay surface at store KPA5/SG5/SO8 Other assets Stores – 30 – Whole of Municipality U
5.8 - Electricity Serv ices WC033_Airconditioners X2 KPA5/SG5/SO8 Furniture and Office Equipment Furniture and Office Equipment – 8 – Whole of Municipality N
5.8 - Electricity Serv ices WC033_Fluke Multimeters KPA5/SG5/SO8 Machinery and Equipment Machinery and Equipment 12 6 6 Whole of Municipality N
5.8 - Electricity Serv ices WC033_20kv Megger KPA5/SG5/SO8 Machinery and Equipment Machinery and Equipment 82 – – Whole of Municipality N
5.8 - Electricity Serv ices WC033_500kv Meggers *2 KPA5/SG5/SO8 Machinery and Equipment Machinery and Equipment 11 – – Whole of Municipality N
5.8 - Electricity Serv ices WC033_Quality of Supplu Meters KPA5/SG5/SO8 Machinery and Equipment Machinery and Equipment – 95 48 Whole of Municipality N
5.8 - Electricity Serv ices WC033_*Bredasdorp KPA5/SG5/SO8 Machinery and Equipment Machinery and Equipment 840 1 370 3 660 Bredasdorp N
5.8 - Electricity Serv ices WC033_*Struisbaai KPA5/SG5/SO8 Machinery and Equipment Machinery and Equipment – 1 085 1 698 Struisbaai N
5.8 - Electricity Serv ices WC033_*L'Agulhas KPA5/SG5/SO8 Machinery and Equipment Machinery and Equipment – 470 400 Agulhas N
5.8 - Electricity Serv ices WC033_*Napier KPA5/SG5/SO8 Machinery and Equipment Machinery and Equipment 650 1 000 2 132 Napier N
5.8 - Electricity Serv ices WC033_*Waenhuiskrans KPA5/SG5/SO8 Machinery and Equipment Machinery and Equipment – 895 930 Arniston N
5.8 - Electricity Serv ices WC033_Sw itching Suits KPA5/SG5/SO8 Machinery and Equipment Machinery and Equipment 72 26 26 Whole of Municipality N
5.8 - Electricity Serv ices WC033_Generator KPA5/SG5/SO8 Machinery and Equipment Machinery and Equipment 320 – – Whole of Municipality R
Parent Capital expenditure 30 504 41 349 38 839
Program/Project descriptionIDP Goal code
2
2018/19 Medium Term Revenue &
Expenditure FrameworkProject information
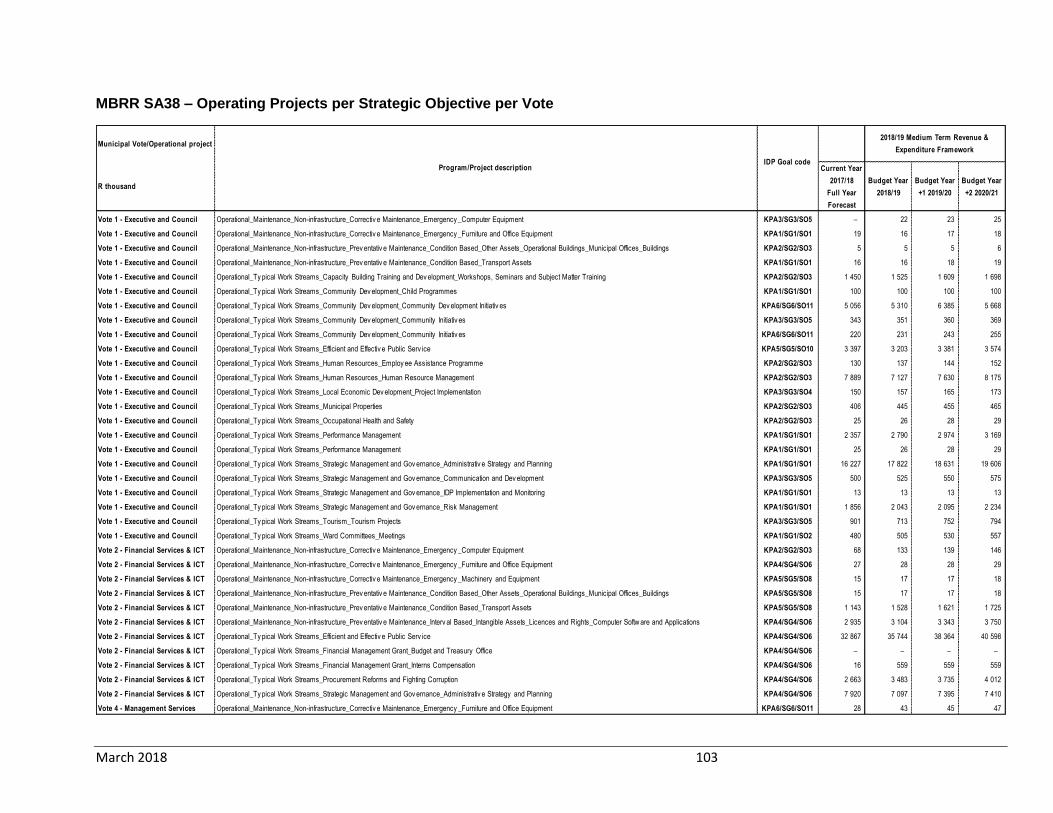
March 2018 103
MBRR SA38 – Operating Projects per Strategic Objective per Vote
Municipal Vote/Operational project
R thousand
Current Year
2017/18
Full Year
Forecast
Budget Year
2018/19
Budget Year
+1 2019/20
Budget Year
+2 2020/21
Vote 1 - Executive and Council Operational_Maintenance_Non-infrastructure_Correctiv e Maintenance_Emergency _Computer Equipment KPA3/SG3/SO5 – 22 23 25
Vote 1 - Executive and Council Operational_Maintenance_Non-infrastructure_Correctiv e Maintenance_Emergency _Furniture and Office Equipment KPA1/SG1/SO1 19 16 17 18
Vote 1 - Executive and Council Operational_Maintenance_Non-infrastructure_Prev entativ e Maintenance_Condition Based_Other Assets_Operational Buildings_Municipal Offices_Buildings KPA2/SG2/SO3 5 5 5 6
Vote 1 - Executive and Council Operational_Maintenance_Non-infrastructure_Prev entativ e Maintenance_Condition Based_Transport Assets KPA1/SG1/SO1 16 16 18 19
Vote 1 - Executive and Council Operational_Ty pical Work Streams_Capacity Building Training and Dev elopment_Workshops, Seminars and Subject Matter Training KPA2/SG2/SO3 1 450 1 525 1 609 1 698
Vote 1 - Executive and Council Operational_Ty pical Work Streams_Community Dev elopment_Child Programmes KPA1/SG1/SO1 100 100 100 100
Vote 1 - Executive and Council Operational_Ty pical Work Streams_Community Dev elopment_Community Dev elopment Initiativ es KPA6/SG6/SO11 5 056 5 310 6 385 5 668
Vote 1 - Executive and Council Operational_Ty pical Work Streams_Community Dev elopment_Community Initiativ es KPA3/SG3/SO5 343 351 360 369
Vote 1 - Executive and Council Operational_Ty pical Work Streams_Community Dev elopment_Community Initiativ es KPA6/SG6/SO11 220 231 243 255
Vote 1 - Executive and Council Operational_Ty pical Work Streams_Efficient and Effectiv e Public Serv ice KPA5/SG5/SO10 3 397 3 203 3 381 3 574
Vote 1 - Executive and Council Operational_Ty pical Work Streams_Human Resources_Employ ee Assistance Programme KPA2/SG2/SO3 130 137 144 152
Vote 1 - Executive and Council Operational_Ty pical Work Streams_Human Resources_Human Resource Management KPA2/SG2/SO3 7 889 7 127 7 630 8 175
Vote 1 - Executive and Council Operational_Ty pical Work Streams_Local Economic Dev elopment_Project Implementation KPA3/SG3/SO4 150 157 165 173
Vote 1 - Executive and Council Operational_Ty pical Work Streams_Municipal Properties KPA2/SG2/SO3 406 445 455 465
Vote 1 - Executive and Council Operational_Ty pical Work Streams_Occupational Health and Safety KPA2/SG2/SO3 25 26 28 29
Vote 1 - Executive and Council Operational_Ty pical Work Streams_Performance Management KPA1/SG1/SO1 2 357 2 790 2 974 3 169
Vote 1 - Executive and Council Operational_Ty pical Work Streams_Performance Management KPA1/SG1/SO1 25 26 28 29
Vote 1 - Executive and Council Operational_Ty pical Work Streams_Strategic Management and Gov ernance_Administrativ e Strategy and Planning KPA1/SG1/SO1 16 227 17 822 18 631 19 606
Vote 1 - Executive and Council Operational_Ty pical Work Streams_Strategic Management and Gov ernance_Communication and Dev elopment KPA3/SG3/SO5 500 525 550 575
Vote 1 - Executive and Council Operational_Ty pical Work Streams_Strategic Management and Gov ernance_IDP Implementation and Monitoring KPA1/SG1/SO1 13 13 13 13
Vote 1 - Executive and Council Operational_Ty pical Work Streams_Strategic Management and Gov ernance_Risk Management KPA1/SG1/SO1 1 856 2 043 2 095 2 234
Vote 1 - Executive and Council Operational_Ty pical Work Streams_Tourism_Tourism Projects KPA3/SG3/SO5 901 713 752 794
Vote 1 - Executive and Council Operational_Ty pical Work Streams_Ward Committees_Meetings KPA1/SG1/SO2 480 505 530 557
Vote 2 - Financial Services & ICT Operational_Maintenance_Non-infrastructure_Correctiv e Maintenance_Emergency _Computer Equipment KPA2/SG2/SO3 68 133 139 146
Vote 2 - Financial Services & ICT Operational_Maintenance_Non-infrastructure_Correctiv e Maintenance_Emergency _Furniture and Office Equipment KPA4/SG4/SO6 27 28 28 29
Vote 2 - Financial Services & ICT Operational_Maintenance_Non-infrastructure_Correctiv e Maintenance_Emergency _Machinery and Equipment KPA5/SG5/SO8 15 17 17 18
Vote 2 - Financial Services & ICT Operational_Maintenance_Non-infrastructure_Prev entativ e Maintenance_Condition Based_Other Assets_Operational Buildings_Municipal Offices_Buildings KPA5/SG5/SO8 15 17 17 18
Vote 2 - Financial Services & ICT Operational_Maintenance_Non-infrastructure_Prev entativ e Maintenance_Condition Based_Transport Assets KPA5/SG5/SO8 1 143 1 528 1 621 1 725
Vote 2 - Financial Services & ICT Operational_Maintenance_Non-infrastructure_Prev entativ e Maintenance_Interv al Based_Intangible Assets_Licences and Rights_Computer Softw are and Applications KPA4/SG4/SO6 2 935 3 104 3 343 3 750
Vote 2 - Financial Services & ICT Operational_Ty pical Work Streams_Efficient and Effectiv e Public Serv ice KPA4/SG4/SO6 32 867 35 744 38 364 40 598
Vote 2 - Financial Services & ICT Operational_Ty pical Work Streams_Financial Management Grant_Budget and Treasury Office KPA4/SG4/SO6 – – – –
Vote 2 - Financial Services & ICT Operational_Ty pical Work Streams_Financial Management Grant_Interns Compensation KPA4/SG4/SO6 16 559 559 559
Vote 2 - Financial Services & ICT Operational_Ty pical Work Streams_Procurement Reforms and Fighting Corruption KPA4/SG4/SO6 2 663 3 483 3 735 4 012
Vote 2 - Financial Services & ICT Operational_Ty pical Work Streams_Strategic Management and Gov ernance_Administrativ e Strategy and Planning KPA4/SG4/SO6 7 920 7 097 7 395 7 410
Vote 4 - Management Services Operational_Maintenance_Non-infrastructure_Correctiv e Maintenance_Emergency _Furniture and Office Equipment KPA6/SG6/SO11 28 43 45 47
Program/Project descriptionIDP Goal code
2018/19 Medium Term Revenue &
Expenditure Framework
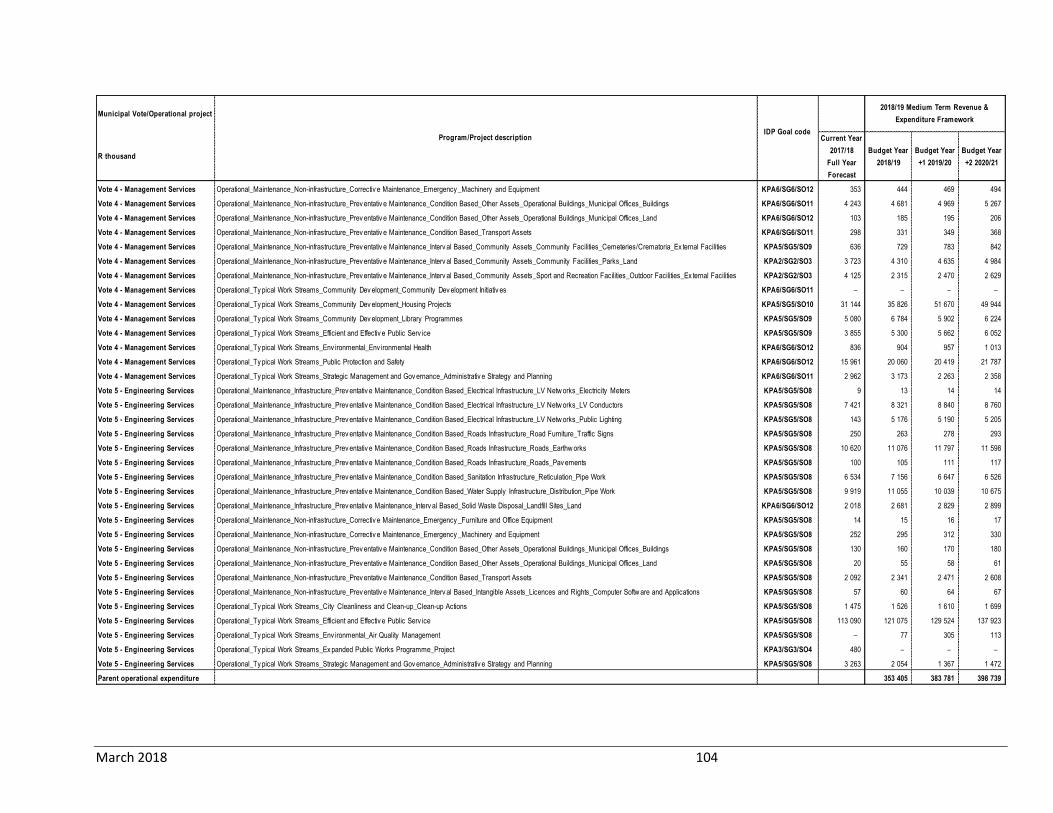
March 2018 104
Municipal Vote/Operational project
R thousand
Current Year
2017/18
Full Year
Forecast
Budget Year
2018/19
Budget Year
+1 2019/20
Budget Year
+2 2020/21
Vote 4 - Management Services Operational_Maintenance_Non-infrastructure_Correctiv e Maintenance_Emergency _Machinery and Equipment KPA6/SG6/SO12 353 444 469 494
Vote 4 - Management Services Operational_Maintenance_Non-infrastructure_Prev entativ e Maintenance_Condition Based_Other Assets_Operational Buildings_Municipal Offices_Buildings KPA6/SG6/SO11 4 243 4 681 4 969 5 267
Vote 4 - Management Services Operational_Maintenance_Non-infrastructure_Prev entativ e Maintenance_Condition Based_Other Assets_Operational Buildings_Municipal Offices_Land KPA6/SG6/SO12 103 185 195 206
Vote 4 - Management Services Operational_Maintenance_Non-infrastructure_Prev entativ e Maintenance_Condition Based_Transport Assets KPA6/SG6/SO11 298 331 349 368
Vote 4 - Management Services Operational_Maintenance_Non-infrastructure_Prev entativ e Maintenance_Interv al Based_Community Assets_Community Facilities_Cemeteries/Crematoria_Ex ternal Facilities KPA5/SG5/SO9 636 729 783 842
Vote 4 - Management Services Operational_Maintenance_Non-infrastructure_Prev entativ e Maintenance_Interv al Based_Community Assets_Community Facilities_Parks_Land KPA2/SG2/SO3 3 723 4 310 4 635 4 984
Vote 4 - Management Services Operational_Maintenance_Non-infrastructure_Prev entativ e Maintenance_Interv al Based_Community Assets_Sport and Recreation Facilities_Outdoor Facilities_Ex ternal Facilities KPA2/SG2/SO3 4 125 2 315 2 470 2 629
Vote 4 - Management Services Operational_Ty pical Work Streams_Community Dev elopment_Community Dev elopment Initiativ es KPA6/SG6/SO11 – – – –
Vote 4 - Management Services Operational_Ty pical Work Streams_Community Dev elopment_Housing Projects KPA5/SG5/SO10 31 144 35 826 51 670 49 944
Vote 4 - Management Services Operational_Ty pical Work Streams_Community Dev elopment_Library Programmes KPA5/SG5/SO9 5 080 6 784 5 902 6 224
Vote 4 - Management Services Operational_Ty pical Work Streams_Efficient and Effectiv e Public Serv ice KPA5/SG5/SO9 3 855 5 300 5 662 6 052
Vote 4 - Management Services Operational_Ty pical Work Streams_Env ironmental_Env ironmental Health KPA6/SG6/SO12 836 904 957 1 013
Vote 4 - Management Services Operational_Ty pical Work Streams_Public Protection and Safety KPA6/SG6/SO12 15 961 20 060 20 419 21 787
Vote 4 - Management Services Operational_Ty pical Work Streams_Strategic Management and Gov ernance_Administrativ e Strategy and Planning KPA6/SG6/SO11 2 962 3 173 2 263 2 358
Vote 5 - Engineering Services Operational_Maintenance_Infrastructure_Prev entativ e Maintenance_Condition Based_Electrical Infrastructure_LV Netw orks_Electricity Meters KPA5/SG5/SO8 9 13 14 14
Vote 5 - Engineering Services Operational_Maintenance_Infrastructure_Prev entativ e Maintenance_Condition Based_Electrical Infrastructure_LV Netw orks_LV Conductors KPA5/SG5/SO8 7 421 8 321 8 840 8 760
Vote 5 - Engineering Services Operational_Maintenance_Infrastructure_Prev entativ e Maintenance_Condition Based_Electrical Infrastructure_LV Netw orks_Public Lighting KPA5/SG5/SO8 143 5 176 5 190 5 205
Vote 5 - Engineering Services Operational_Maintenance_Infrastructure_Prev entativ e Maintenance_Condition Based_Roads Infrastructure_Road Furniture_Traffic Signs KPA5/SG5/SO8 250 263 278 293
Vote 5 - Engineering Services Operational_Maintenance_Infrastructure_Prev entativ e Maintenance_Condition Based_Roads Infrastructure_Roads_Earthw orks KPA5/SG5/SO8 10 620 11 076 11 797 11 598
Vote 5 - Engineering Services Operational_Maintenance_Infrastructure_Prev entativ e Maintenance_Condition Based_Roads Infrastructure_Roads_Pav ements KPA5/SG5/SO8 100 105 111 117
Vote 5 - Engineering Services Operational_Maintenance_Infrastructure_Prev entativ e Maintenance_Condition Based_Sanitation Infrastructure_Reticulation_Pipe Work KPA5/SG5/SO8 6 534 7 156 6 647 6 526
Vote 5 - Engineering Services Operational_Maintenance_Infrastructure_Prev entativ e Maintenance_Condition Based_Water Supply Infrastructure_Distribution_Pipe Work KPA5/SG5/SO8 9 919 11 055 10 039 10 675
Vote 5 - Engineering Services Operational_Maintenance_Infrastructure_Prev entativ e Maintenance_Interv al Based_Solid Waste Disposal_Landfill Sites_Land KPA6/SG6/SO12 2 018 2 681 2 829 2 899
Vote 5 - Engineering Services Operational_Maintenance_Non-infrastructure_Correctiv e Maintenance_Emergency _Furniture and Office Equipment KPA5/SG5/SO8 14 15 16 17
Vote 5 - Engineering Services Operational_Maintenance_Non-infrastructure_Correctiv e Maintenance_Emergency _Machinery and Equipment KPA5/SG5/SO8 252 295 312 330
Vote 5 - Engineering Services Operational_Maintenance_Non-infrastructure_Prev entativ e Maintenance_Condition Based_Other Assets_Operational Buildings_Municipal Offices_Buildings KPA5/SG5/SO8 130 160 170 180
Vote 5 - Engineering Services Operational_Maintenance_Non-infrastructure_Prev entativ e Maintenance_Condition Based_Other Assets_Operational Buildings_Municipal Offices_Land KPA5/SG5/SO8 20 55 58 61
Vote 5 - Engineering Services Operational_Maintenance_Non-infrastructure_Prev entativ e Maintenance_Condition Based_Transport Assets KPA5/SG5/SO8 2 092 2 341 2 471 2 608
Vote 5 - Engineering Services Operational_Maintenance_Non-infrastructure_Prev entativ e Maintenance_Interv al Based_Intangible Assets_Licences and Rights_Computer Softw are and Applications KPA5/SG5/SO8 57 60 64 67
Vote 5 - Engineering Services Operational_Ty pical Work Streams_City Cleanliness and Clean-up_Clean-up Actions KPA5/SG5/SO8 1 475 1 526 1 610 1 699
Vote 5 - Engineering Services Operational_Ty pical Work Streams_Efficient and Effectiv e Public Serv ice KPA5/SG5/SO8 113 090 121 075 129 524 137 923
Vote 5 - Engineering Services Operational_Ty pical Work Streams_Env ironmental_Air Quality Management KPA5/SG5/SO8 – 77 305 113
Vote 5 - Engineering Services Operational_Ty pical Work Streams_Ex panded Public Works Programme_Project KPA3/SG3/SO4 480 – – –
Vote 5 - Engineering Services Operational_Ty pical Work Streams_Strategic Management and Gov ernance_Administrativ e Strategy and Planning KPA5/SG5/SO8 3 263 2 054 1 367 1 472
Parent operational expenditure 353 405 383 781 398 739
Program/Project descriptionIDP Goal code
2018/19 Medium Term Revenue &
Expenditure Framework
March 2018 105
2.12 Legislation compliance status
Compliance with the MFMA implementation requirements have been substantially adhered to through the following activities: 1. Service Delivery and Implementation Plan
The detail SDBIP document is at a draft stage and attached as Appendix B to be finalised after approval of the 2018/19 MTREF at least 30 days before the start of the next financial year directly aligned and informed by the 2017/18 MTREF.
2. In year reporting
Reporting to National Treasury in electronic format was fully complied with on a monthly basis. Section 71 reporting to the Executive Mayor (within 10 working days) has progressively improved and includes monthly published financial performance on the Municipality’s website.
3. Internship programme
The Municipality is participating in the Municipal Financial Management Internship programme and has employed 3 interns undergoing training in various divisions of the Financial Services Department. Currently a further 2 vacancies are in process of being filled.
4. Budget and Treasury Office
The Budget and Treasury Office has been established and a Manager have been appointed during September 2015 in accordance with the MFMA. The unit needs to be further capacitated in order to fulfill its legislative objective and to be fully effective to deliver in terms of its mandate accordingly.
5. Audit Committee
An Audit Committee has been established and is fully functional. 6. Annual Report
Annual report is compiled in terms of the MFMA and National Treasury requirements. 7. MFMA Training
No MFMA training is currently underway. Skills Competency training is currently in progress at the municipality with only a few individuals in the final stages of the programme.
8. Policies
Budget related policies will be reviewed and updated if so required for final submission with the approval of the 2018/19 MTREF & outer two years.

March 2018 106
2.13 Other supporting documents
All other supporting schedules not specifically addressed in this document are included below.
MBRR SA1 - Supporting detail to 'Budgeted Financial Performance'
2017/18
Full Year
Forecast
Budget Year
2018/19
Budget Year
+1 2019/20
Budget Year
+2 2020/21
R thousand
REVENUE ITEMS:
Property rates
Total Property Rates 61 253 65 149 69 292 73 699
less Revenue Foregone (exemptions, reductions and rebates and
impermissable values in excess of section 17 of MPRA) 1 110 1 168 1 232 1 300
Net Property Rates 60 143 63 981 68 061 72 400
Service charges - electricity revenue
Total Serv ice charges - electricity rev enue 103 393 110 963 119 840 129 220
less Cost of Free Basis Services (50 kwh per indigent household per
month) 87 92 100 107
Net Service charges - electricity revenue 103 306 110 871 119 740 129 113
Service charges - water revenue
Total Serv ice charges - w ater rev enue 26 674 28 370 30 175 32 094
less Cost of Free Basis Services (6 kilolitres per indigent household
per month) 2 332 2 453 2 588 2 731
Net Service charges - water revenue 24 342 25 917 27 587 29 363
Service charges - sanitation revenue
Total Serv ice charges - sanitation rev enue 12 560 13 359 14 209 15 112
less Cost of Free Basis Services (free sanitation service to indigent
households) 3 074 3 234 3 412 3 599
Net Service charges - sanitation revenue 9 486 10 125 10 797 11 513
Service charges - refuse revenue
Total refuse remov al rev enue 19 435 20 671 21 986 23 385
less Cost of Free Basis Services (removed once a week to indigent
households) 3 712 3 905 4 120 4 346
Net Service charges - refuse revenue 15 723 16 766 17 866 19 038
Description
2018/19 Medium Term Revenue &
Expenditure Framework
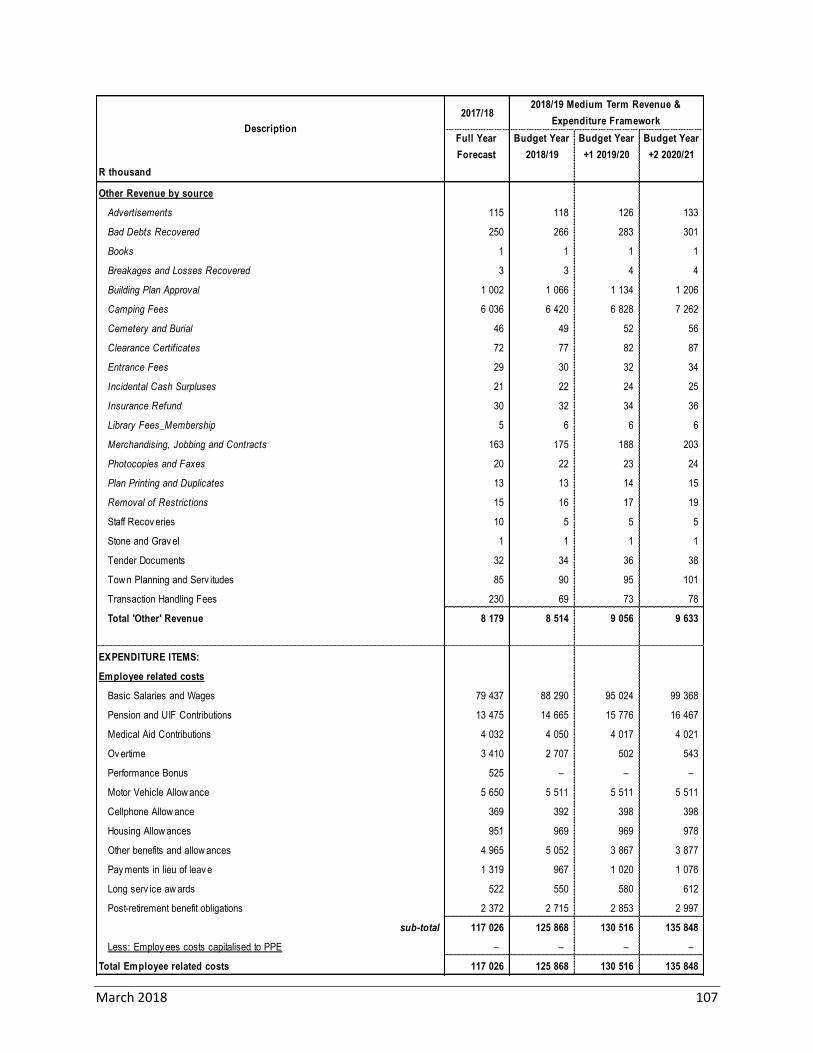
March 2018 107
2017/18
Full Year
Forecast
Budget Year
2018/19
Budget Year
+1 2019/20
Budget Year
+2 2020/21
R thousand
Other Revenue by source
Advertisements 115 118 126 133
Bad Debts Recovered 250 266 283 301
Books 1 1 1 1
Breakages and Losses Recovered 3 3 4 4
Building Plan Approval 1 002 1 066 1 134 1 206
Camping Fees 6 036 6 420 6 828 7 262
Cemetery and Burial 46 49 52 56
Clearance Certificates 72 77 82 87
Entrance Fees 29 30 32 34
Incidental Cash Surpluses 21 22 24 25
Insurance Refund 30 32 34 36
Library Fees_Membership 5 6 6 6
Merchandising, Jobbing and Contracts 163 175 188 203
Photocopies and Faxes 20 22 23 24
Plan Printing and Duplicates 13 13 14 15
Removal of Restrictions 15 16 17 19
Staff Recov eries 10 5 5 5
Stone and Grav el 1 1 1 1
Tender Documents 32 34 36 38
Tow n Planning and Serv itudes 85 90 95 101
Transaction Handling Fees 230 69 73 78
Total 'Other' Revenue 8 179 8 514 9 056 9 633
EXPENDITURE ITEMS:
Employee related costs
Basic Salaries and Wages 79 437 88 290 95 024 99 368
Pension and UIF Contributions 13 475 14 665 15 776 16 467
Medical Aid Contributions 4 032 4 050 4 017 4 021
Ov ertime 3 410 2 707 502 543
Performance Bonus 525 – – –
Motor Vehicle Allow ance 5 650 5 511 5 511 5 511
Cellphone Allow ance 369 392 398 398
Housing Allow ances 951 969 969 978
Other benefits and allow ances 4 965 5 052 3 867 3 877
Pay ments in lieu of leav e 1 319 967 1 020 1 076
Long serv ice aw ards 522 550 580 612
Post-retirement benefit obligations 2 372 2 715 2 853 2 997
sub-total 117 026 125 868 130 516 135 848
Less: Employ ees costs capitalised to PPE – – – –
Total Employee related costs 117 026 125 868 130 516 135 848
Description
2018/19 Medium Term Revenue &
Expenditure Framework
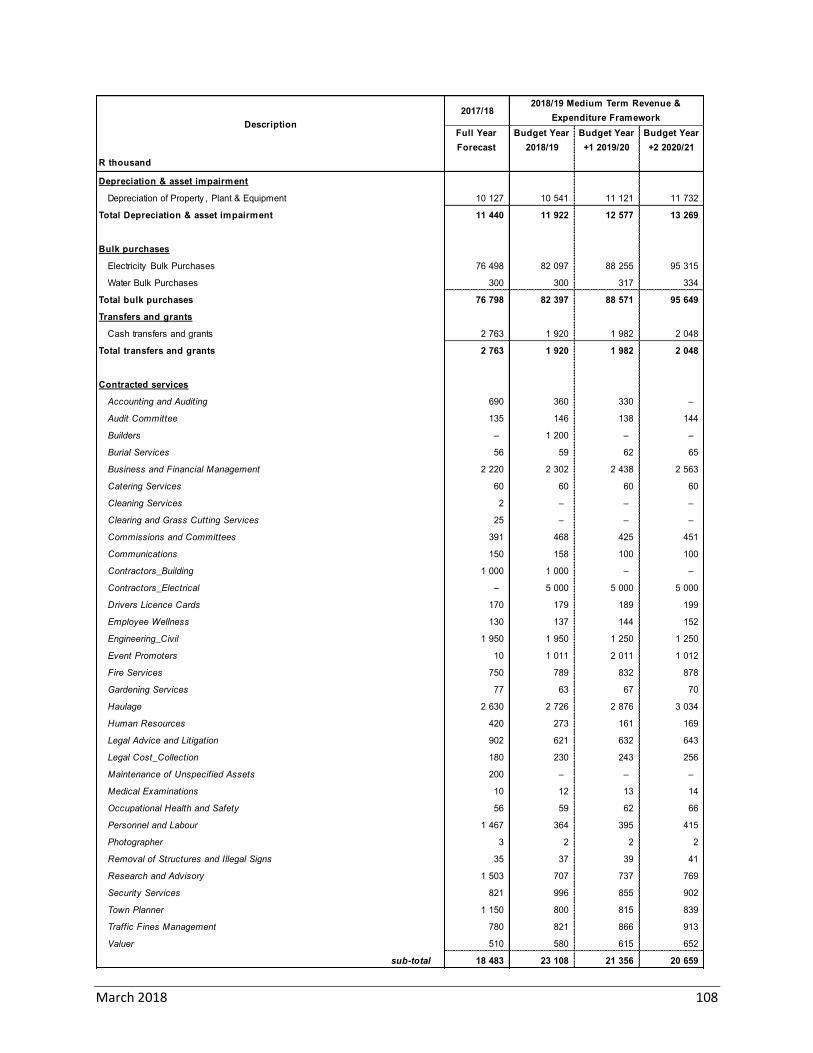
March 2018 108
2017/18
Full Year
Forecast
Budget Year
2018/19
Budget Year
+1 2019/20
Budget Year
+2 2020/21
R thousand
Depreciation & asset impairment
Depreciation of Property , Plant & Equipment 10 127 10 541 11 121 11 732
Total Depreciation & asset impairment 11 440 11 922 12 577 13 269
Bulk purchases
Electricity Bulk Purchases 76 498 82 097 88 255 95 315
Water Bulk Purchases 300 300 317 334
Total bulk purchases 76 798 82 397 88 571 95 649
Transfers and grants
Cash transfers and grants 2 763 1 920 1 982 2 048
Total transfers and grants 2 763 1 920 1 982 2 048
Contracted services
Accounting and Auditing 690 360 330 –
Audit Committee 135 146 138 144
Builders – 1 200 – –
Burial Services 56 59 62 65
Business and Financial Management 2 220 2 302 2 438 2 563
Catering Services 60 60 60 60
Cleaning Services 2 – – –
Clearing and Grass Cutting Services 25 – – –
Commissions and Committees 391 468 425 451
Communications 150 158 100 100
Contractors_Building 1 000 1 000 – –
Contractors_Electrical – 5 000 5 000 5 000
Drivers Licence Cards 170 179 189 199
Employee Wellness 130 137 144 152
Engineering_Civil 1 950 1 950 1 250 1 250
Event Promoters 10 1 011 2 011 1 012
Fire Services 750 789 832 878
Gardening Services 77 63 67 70
Haulage 2 630 2 726 2 876 3 034
Human Resources 420 273 161 169
Legal Advice and Litigation 902 621 632 643
Legal Cost_Collection 180 230 243 256
Maintenance of Unspecified Assets 200 – – –
Medical Examinations 10 12 13 14
Occupational Health and Safety 56 59 62 66
Personnel and Labour 1 467 364 395 415
Photographer 3 2 2 2
Removal of Structures and Illegal Signs 35 37 39 41
Research and Advisory 1 503 707 737 769
Security Services 821 996 855 902
Town Planner 1 150 800 815 839
Traffic Fines Management 780 821 866 913
Valuer 510 580 615 652
sub-total 18 483 23 108 21 356 20 659
Description
2018/19 Medium Term Revenue &
Expenditure Framework
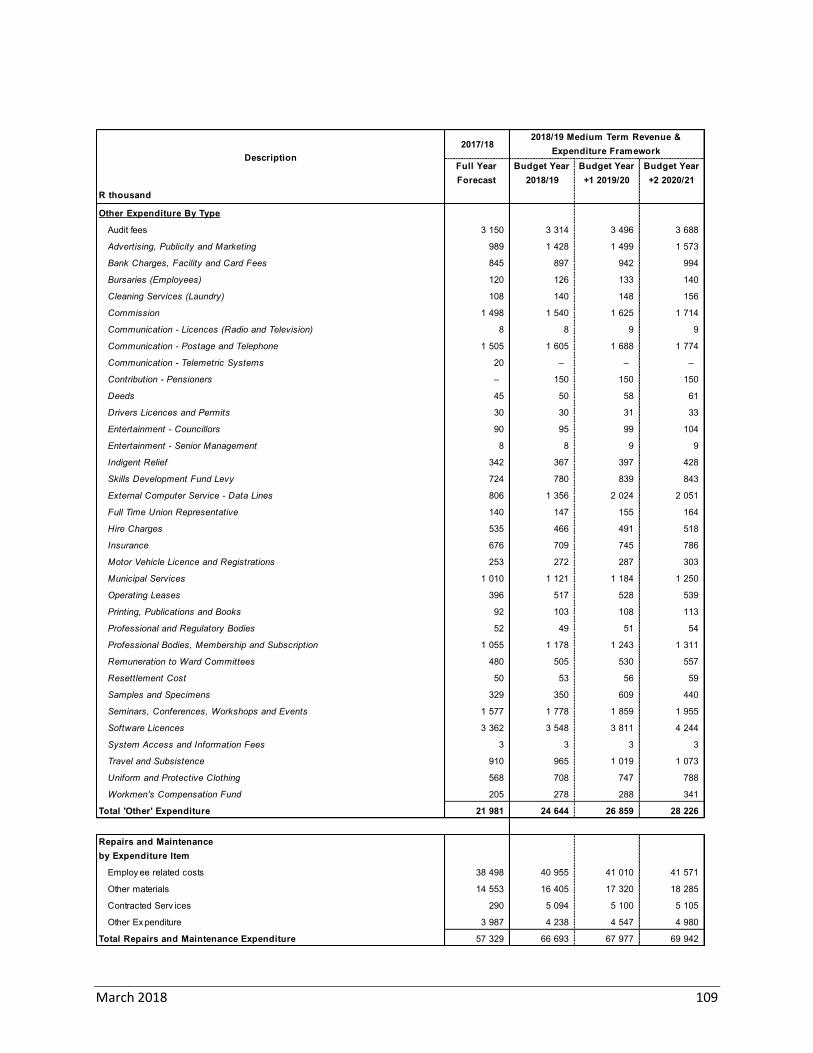
March 2018 109
2017/18
Full Year
Forecast
Budget Year
2018/19
Budget Year
+1 2019/20
Budget Year
+2 2020/21
R thousand
Other Expenditure By Type
Audit fees 3 150 3 314 3 496 3 688
Advertising, Publicity and Marketing 989 1 428 1 499 1 573
Bank Charges, Facility and Card Fees 845 897 942 994
Bursaries (Employees) 120 126 133 140
Cleaning Services (Laundry) 108 140 148 156
Commission 1 498 1 540 1 625 1 714
Communication - Licences (Radio and Television) 8 8 9 9
Communication - Postage and Telephone 1 505 1 605 1 688 1 774
Communication - Telemetric Systems 20 – – –
Contribution - Pensioners – 150 150 150
Deeds 45 50 58 61
Drivers Licences and Permits 30 30 31 33
Entertainment - Councillors 90 95 99 104
Entertainment - Senior Management 8 8 9 9
Indigent Relief 342 367 397 428
Skills Development Fund Levy 724 780 839 843
External Computer Service - Data Lines 806 1 356 2 024 2 051
Full Time Union Representative 140 147 155 164
Hire Charges 535 466 491 518
Insurance 676 709 745 786
Motor Vehicle Licence and Registrations 253 272 287 303
Municipal Services 1 010 1 121 1 184 1 250
Operating Leases 396 517 528 539
Printing, Publications and Books 92 103 108 113
Professional and Regulatory Bodies 52 49 51 54
Professional Bodies, Membership and Subscription 1 055 1 178 1 243 1 311
Remuneration to Ward Committees 480 505 530 557
Resettlement Cost 50 53 56 59
Samples and Specimens 329 350 609 440
Seminars, Conferences, Workshops and Events 1 577 1 778 1 859 1 955
Software Licences 3 362 3 548 3 811 4 244
System Access and Information Fees 3 3 3 3
Travel and Subsistence 910 965 1 019 1 073
Uniform and Protective Clothing 568 708 747 788
Workmen's Compensation Fund 205 278 288 341
Total 'Other' Expenditure 21 981 24 644 26 859 28 226
Repairs and Maintenance
by Expenditure Item
Employ ee related costs 38 498 40 955 41 010 41 571
Other materials 14 553 16 405 17 320 18 285
Contracted Serv ices 290 5 094 5 100 5 105
Other Ex penditure 3 987 4 238 4 547 4 980
Total Repairs and Maintenance Expenditure 57 329 66 693 67 977 69 942
Description
2018/19 Medium Term Revenue &
Expenditure Framework
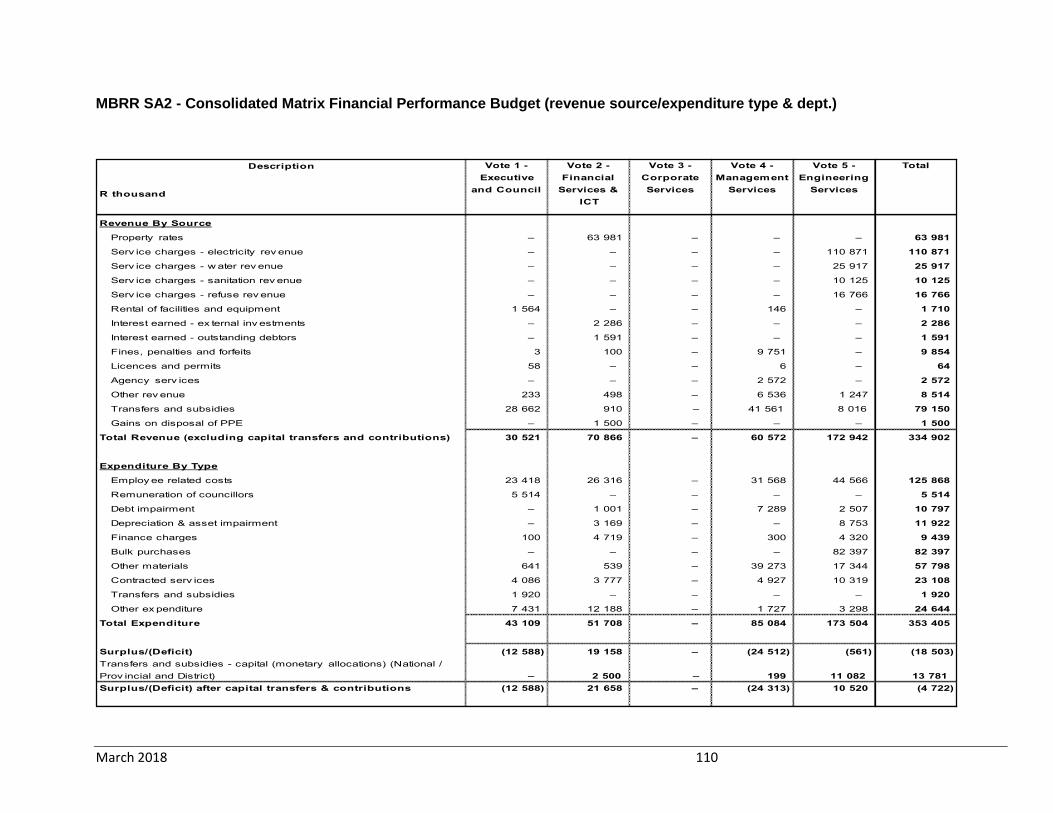
March 2018 110
MBRR SA2 - Consolidated Matrix Financial Performance Budget (revenue source/expenditure type & dept.)
Description
R thousand
Revenue By Source
Property rates – 63 981 – – – 63 981
Serv ice charges - electricity rev enue – – – – 110 871 110 871
Serv ice charges - w ater rev enue – – – – 25 917 25 917
Serv ice charges - sanitation rev enue – – – – 10 125 10 125
Serv ice charges - refuse rev enue – – – – 16 766 16 766
Rental of facilities and equipment 1 564 – – 146 – 1 710
Interest earned - ex ternal inv estments – 2 286 – – – 2 286
Interest earned - outstanding debtors – 1 591 – – – 1 591
Fines, penalties and forfeits 3 100 – 9 751 – 9 854
Licences and permits 58 – – 6 – 64
Agency serv ices – – – 2 572 – 2 572
Other rev enue 233 498 – 6 536 1 247 8 514
Transfers and subsidies 28 662 910 – 41 561 8 016 79 150
Gains on disposal of PPE – 1 500 – – – 1 500
Total Revenue (excluding capital transfers and contributions) 30 521 70 866 – 60 572 172 942 334 902
Expenditure By Type
Employ ee related costs 23 418 26 316 – 31 568 44 566 125 868
Remuneration of councillors 5 514 – – – – 5 514
Debt impairment – 1 001 – 7 289 2 507 10 797
Depreciation & asset impairment – 3 169 – – 8 753 11 922
Finance charges 100 4 719 – 300 4 320 9 439
Bulk purchases – – – – 82 397 82 397
Other materials 641 539 – 39 273 17 344 57 798
Contracted serv ices 4 086 3 777 – 4 927 10 319 23 108
Transfers and subsidies 1 920 – – – – 1 920
Other ex penditure 7 431 12 188 – 1 727 3 298 24 644
Total Expenditure 43 109 51 708 – 85 084 173 504 353 405
Surplus/(Deficit) (12 588) 19 158 – (24 512) (561) (18 503)
Transfers and subsidies - capital (monetary allocations) (National /
Prov incial and District) – 2 500 – 199 11 082 13 781
Surplus/(Deficit) after capital transfers & contributions (12 588) 21 658 – (24 313) 10 520 (4 722)
TotalVote 1 -
Executive
and Council
Vote 2 -
Financial
Services &
ICT
Vote 3 -
Corporate
Services
Vote 4 -
Management
Services
Vote 5 -
Engineering
Services
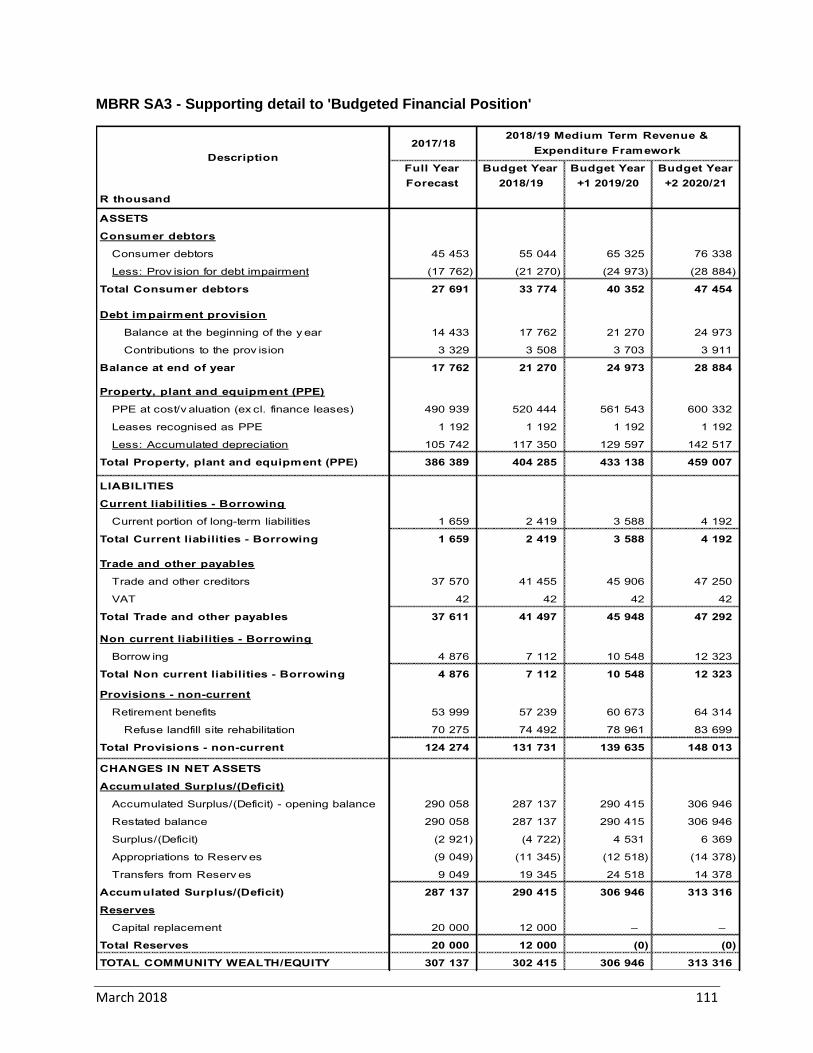
March 2018 111
MBRR SA3 - Supporting detail to 'Budgeted Financial Position'
2017/18
Full Year
Forecast
Budget Year
2018/19
Budget Year
+1 2019/20
Budget Year
+2 2020/21
R thousand
ASSETS
Consumer debtors
Consumer debtors 45 453 55 044 65 325 76 338
Less: Prov ision for debt impairment (17 762) (21 270) (24 973) (28 884)
Total Consumer debtors 27 691 33 774 40 352 47 454
Debt impairment provision
Balance at the beginning of the y ear 14 433 17 762 21 270 24 973
Contributions to the prov ision 3 329 3 508 3 703 3 911
Balance at end of year 17 762 21 270 24 973 28 884
Property, plant and equipment (PPE)
PPE at cost/v aluation (ex cl. finance leases) 490 939 520 444 561 543 600 332
Leases recognised as PPE 1 192 1 192 1 192 1 192
Less: Accumulated depreciation 105 742 117 350 129 597 142 517
Total Property, plant and equipment (PPE) 386 389 404 285 433 138 459 007
LIABILITIES
Current liabilities - Borrowing
Current portion of long-term liabilities 1 659 2 419 3 588 4 192
Total Current liabilities - Borrowing 1 659 2 419 3 588 4 192
Trade and other payables
Trade and other creditors 37 570 41 455 45 906 47 250
VAT 42 42 42 42
Total Trade and other payables 37 611 41 497 45 948 47 292
Non current liabilities - Borrowing
Borrow ing 4 876 7 112 10 548 12 323
Total Non current liabilities - Borrowing 4 876 7 112 10 548 12 323
Provisions - non-current
Retirement benefits 53 999 57 239 60 673 64 314
Refuse landfill site rehabilitation 70 275 74 492 78 961 83 699
Total Provisions - non-current 124 274 131 731 139 635 148 013
CHANGES IN NET ASSETS
Accumulated Surplus/(Deficit)
Accumulated Surplus/(Deficit) - opening balance 290 058 287 137 290 415 306 946
Restated balance 290 058 287 137 290 415 306 946
Surplus/(Deficit) (2 921) (4 722) 4 531 6 369
Appropriations to Reserv es (9 049) (11 345) (12 518) (14 378)
Transfers from Reserv es 9 049 19 345 24 518 14 378
Accumulated Surplus/(Deficit) 287 137 290 415 306 946 313 316
Reserves
Capital replacement 20 000 12 000 – –
Total Reserves 20 000 12 000 (0) (0)
TOTAL COMMUNITY WEALTH/EQUITY 307 137 302 415 306 946 313 316
Description
2018/19 Medium Term Revenue &
Expenditure Framework
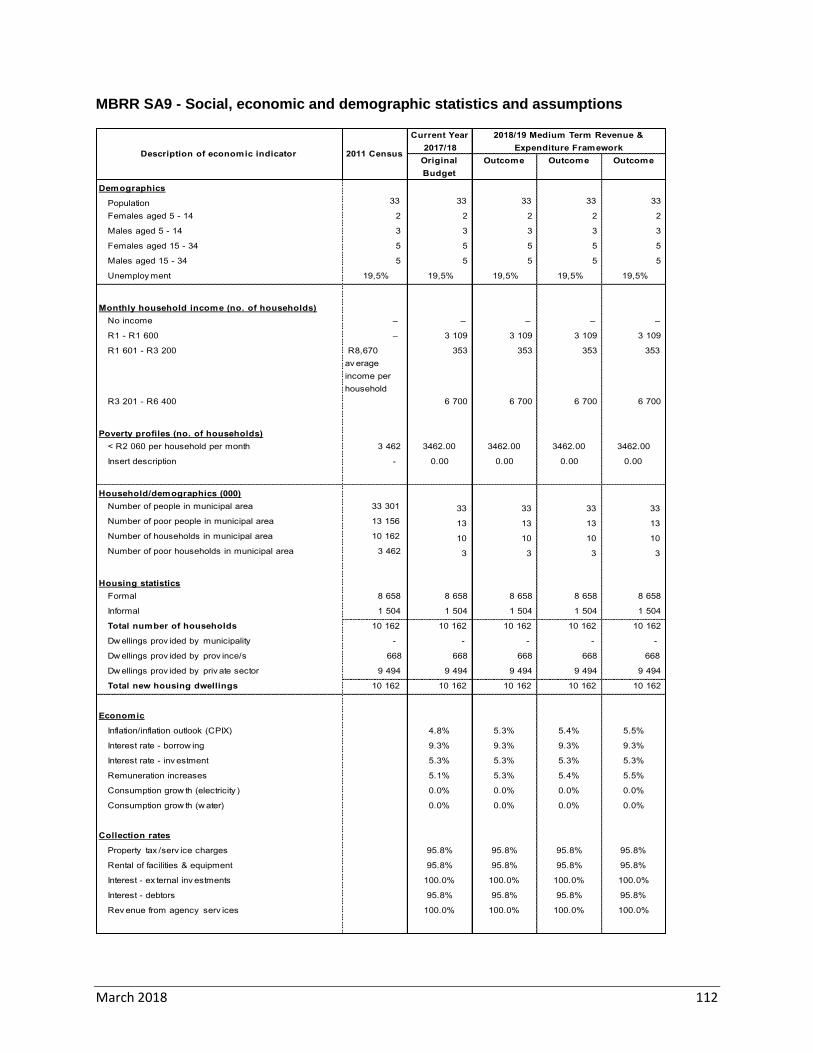
March 2018 112
MBRR SA9 - Social, economic and demographic statistics and assumptions
Current Year
2017/18
Original
Budget
Outcome Outcome Outcome
Demographics
Population 33 33 33 33 33
Females aged 5 - 14 2 2 2 2 2
Males aged 5 - 14 3 3 3 3 3
Females aged 15 - 34 5 5 5 5 5
Males aged 15 - 34 5 5 5 5 5
Unemploy ment 19,5% 19,5% 19,5% 19,5% 19,5%
Monthly household income (no. of households)
No income – – – – –
R1 - R1 600 – 3 109 3 109 3 109 3 109
R1 601 - R3 200 R8,670
av erage
income per
household
353 353 353 353
R3 201 - R6 400 6 700 6 700 6 700 6 700
Poverty profiles (no. of households)
< R2 060 per household per month 3 462 3462.00 3462.00 3462.00 3462.00
Insert description - 0.00 0.00 0.00 0.00
Household/demographics (000)
Number of people in municipal area 33 301 33 33 33 33
Number of poor people in municipal area 13 156 13 13 13 13
Number of households in municipal area 10 162 10 10 10 10
Number of poor households in municipal area 3 462 3 3 3 3
Housing statistics
Formal 8 658 8 658 8 658 8 658 8 658
Informal 1 504 1 504 1 504 1 504 1 504
Total number of households 10 162 10 162 10 162 10 162 10 162
Dw ellings prov ided by municipality - - - - -
Dw ellings prov ided by prov ince/s 668 668 668 668 668
Dw ellings prov ided by priv ate sector 9 494 9 494 9 494 9 494 9 494
Total new housing dwellings 10 162 10 162 10 162 10 162 10 162
Economic
Inflation/inflation outlook (CPIX) 4.8% 5.3% 5.4% 5.5%
Interest rate - borrow ing 9.3% 9.3% 9.3% 9.3%
Interest rate - inv estment 5.3% 5.3% 5.3% 5.3%
Remuneration increases 5.1% 5.3% 5.4% 5.5%
Consumption grow th (electricity ) 0.0% 0.0% 0.0% 0.0%
Consumption grow th (w ater) 0.0% 0.0% 0.0% 0.0%
Collection rates
Property tax /serv ice charges 95.8% 95.8% 95.8% 95.8%
Rental of facilities & equipment 95.8% 95.8% 95.8% 95.8%
Interest - ex ternal inv estments 100.0% 100.0% 100.0% 100.0%
Interest - debtors 95.8% 95.8% 95.8% 95.8%
Rev enue from agency serv ices 100.0% 100.0% 100.0% 100.0%
2018/19 Medium Term Revenue &
Expenditure FrameworkDescription of economic indicator 2011 Census
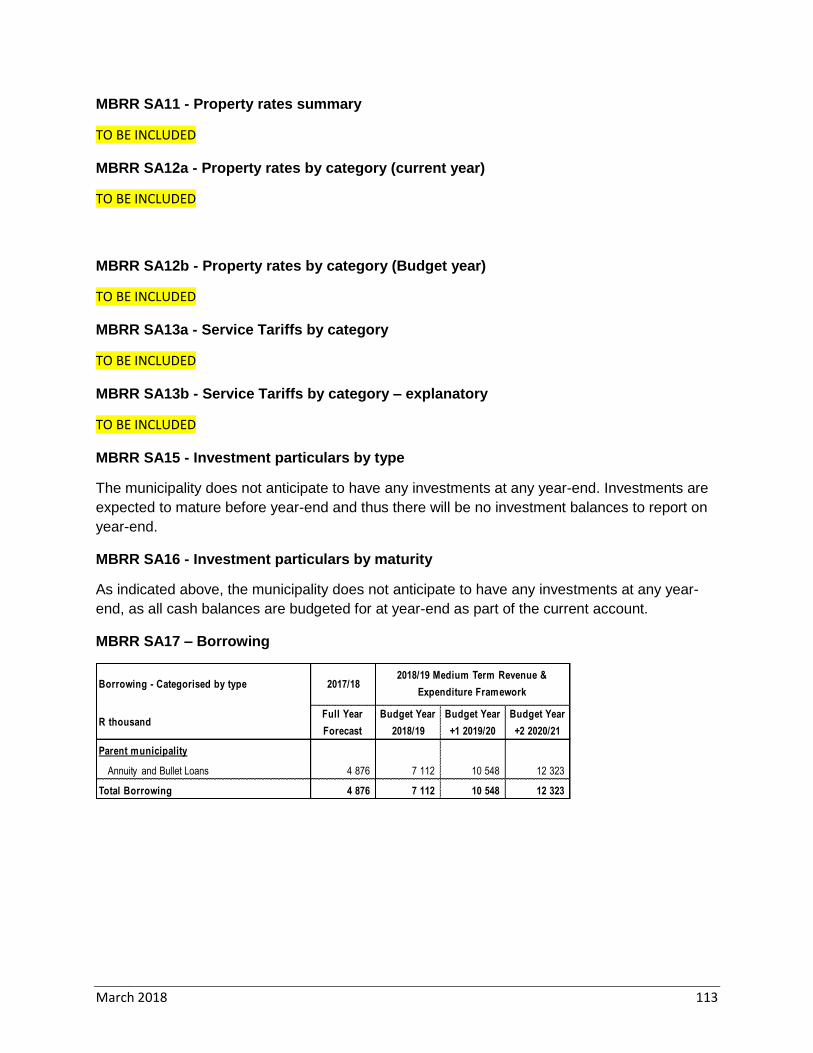
March 2018 113
MBRR SA11 - Property rates summary
TO BE INCLUDED
MBRR SA12a - Property rates by category (current year)
TO BE INCLUDED
MBRR SA12b - Property rates by category (Budget year)
TO BE INCLUDED
MBRR SA13a - Service Tariffs by category
TO BE INCLUDED
MBRR SA13b - Service Tariffs by category – explanatory
TO BE INCLUDED
MBRR SA15 - Investment particulars by type
The municipality does not anticipate to have any investments at any year-end. Investments are
expected to mature before year-end and thus there will be no investment balances to report on
year-end.
MBRR SA16 - Investment particulars by maturity
As indicated above, the municipality does not anticipate to have any investments at any year-
end, as all cash balances are budgeted for at year-end as part of the current account.
MBRR SA17 – Borrowing
Borrowing - Categorised by type 2017/18
R thousandFull Year
Forecast
Budget Year
2018/19
Budget Year
+1 2019/20
Budget Year
+2 2020/21
Parent municipality
Annuity and Bullet Loans 4 876 7 112 10 548 12 323
Total Borrowing 4 876 7 112 10 548 12 323
2018/19 Medium Term Revenue &
Expenditure Framework
March 2018 114
2.14 Manager’s quality certificate
I …………………………………, Municipal Manager of Cape Agulhas Municipality, hereby certify
that the annual budget and supporting documentation have been prepared in accordance with
the Municipal Finance Management Act and the regulations made under the Act, and that the
annual budget and supporting documents are consistent with the Integrated Development Plan
of the municipality.
Print Name: _____________________________________________
Municipal Manager of Cape Agulhas Municipality
Signature: ______________________________________________
Date: _____________________________
March 2018 115
Part 3 – Appendices
3.1 Appendix A – Tariff Listing
Attached.
3.2 Appendix B – Draft SDBIP
Attached.
3.3 Appendix C – mSCOA Implementation Plan
Attached.
3.4 Appendix D– Service Level Standards
Attached.