Embed Size (px)
Citation preview

University of Kentucky University of Kentucky
UKnowledge UKnowledge
KWRRI Research Reports Kentucky Water Resources Research Institute
12-1971
Capillary-Diffusion and Self-Diffusion of Liquid Water in Capillary-Diffusion and Self-Diffusion of Liquid Water in
Unsaturated Soils Unsaturated Soils
Ronald E. Phillips University of Kentucky
V. L. Quisenberry Jr. University of Kentucky
Follow this and additional works at: https://uknowledge.uky.edu/kwrri_reports
Part of the Soil Science Commons, and the Water Resource Management Commons
Right click to open a feedback form in a new tab to let us know how this document benefits you. Right click to open a feedback form in a new tab to let us know how this document benefits you.
Repository Citation Repository Citation Phillips, Ronald E. and Quisenberry, V. L. Jr., "Capillary-Diffusion and Self-Diffusion of Liquid Water in Unsaturated Soils" (1971). KWRRI Research Reports. 148. https://uknowledge.uky.edu/kwrri_reports/148
This Report is brought to you for free and open access by the Kentucky Water Resources Research Institute at UKnowledge. It has been accepted for inclusion in KWRRI Research Reports by an authorized administrator of UKnowledge. For more information, please contact [email protected].

Research. Report No. 47
CAPILLARY-DIFFUSION AND SELF-DIFFUSION OF LIQUID WATER IN UNSATURATED SOILS
Ronald E. Pb.illips Principal Investigator
Graduate Student Assistant: V. L. Quisenberry, Jr.
Project Number A-011-KY (Completion Report) Agreement Number 14-01-0001-1636 Period of Project - April 1, 1967 - June 30, 1970
University of Kentucky Water Resources Institute Lexington, Kentucky
Tb.e work on wb.ich th.is report is based was supported in part by funds provided by the Office of Water Resources Research., United States Department of the Interior, as authorized under the Water Resources Act of 1964.
December, 1971
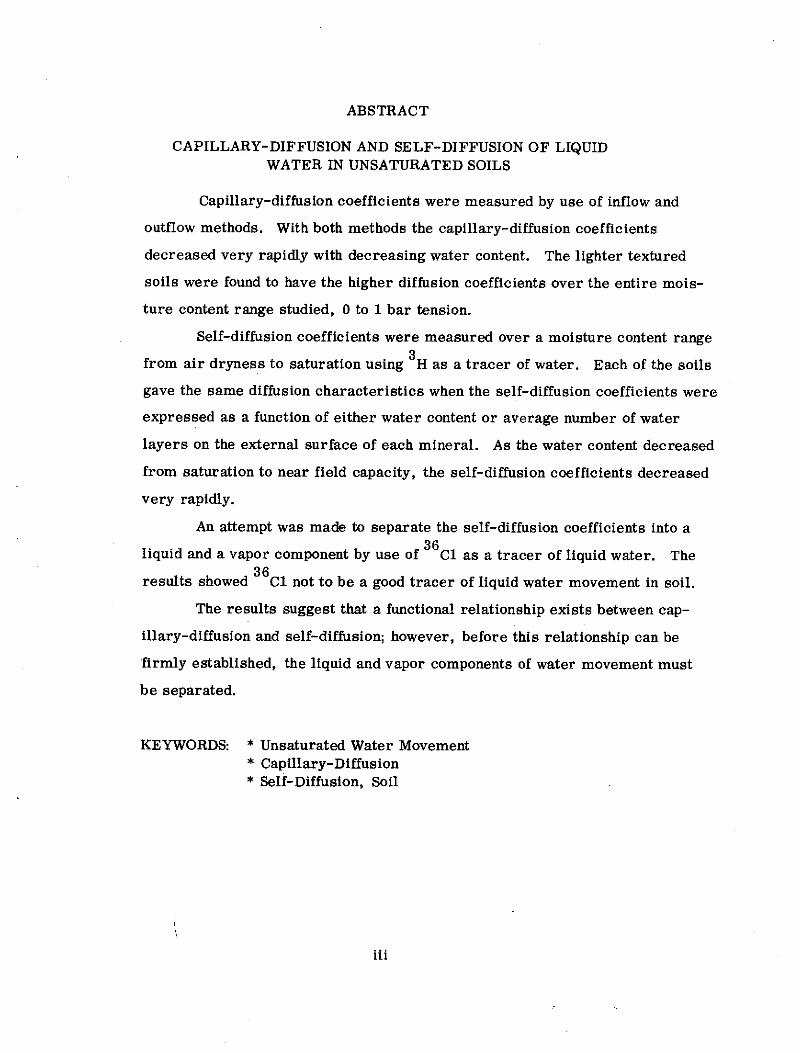
ABSTRACT
CAPILLARY-DIFFUSION AND SELF-DIFFUSION OF LIQUID WATER IN UNSATURATED SOILS
Capillary-diffusion coefficients were measured by use of inflow and
outflow methods. With both methods the capillary-diffusion coefficients
decreased very rapidly with decreasing water content. The lighter textured
soils were found to have the higher diffusion coefficients over the entire mois
ture content range studied, 0 to 1 bar tension.
Self-diffusion coefficients were measured over a moisture content range
from air dryness to saturation using 3
H as a tracer of water. Each of the soils
gave the same diffusion characteristics when the self-diffusion coefficients were
expressed as a function of either water content or average number of water
layers on the external surface of each mineral. As the water content decreased
from saturation to near field capacity, the self-diffusion coefficients decreased
very rapidly.
An attempt was made to separate the self-diffusion coefficients into a
liquid and a vapor component by use of 36c1 as a tracer of liquid water. The
results showed 36c1 not to be a good tracer of liquid water movement in soil.
The results suggest that a functional relationship exists between cap
illary-diffusion and self-diffusion; however, before this relationship can be
firmly established, the liquid and vapor components of water movement must
be separated.
KEYWORDS: * Unsaturated Water Movement * Capillary-Diffusion * Self-Diffusion, Soil
iii

TABLE OF CONTENTS
Page
ABSTRACT . iii
LIST OF TABLES . vii
LIST OF FIGURES . ix
OBJECTIVES 1
RESEARCH PROCEDURES 2
Capillary-Diffusion (Outflow Method) . 2 Capillary-Diffusion (Inflow Method) 4 Self-Diffusion 5 Vapor Diffusion (lnflow Method) 6
DATA AND RESULTS 7
Physical and Mineralogical Characteristics 7 Capillary-Diffusion (Outflow Method) . 7 Capillary-Diffusion (lnflow Method) • • 13 Comparison of the Outflow & lnflow Methods 15 Self-Diffusion 22 Separation of Liquid and Vapor Self-Diffusion Coefficients 29 Relationship Between-Capillary-Diffusion and Self-
Diffusion Coefficients • 30 Practical Considerations of Capillary-Diffusion Coefficients . 33
SUMMARY AND CONCLUSIONS 34
LITERATURE CITED 38
v

Table
1
LIST OF TABLES
Some Pb.yslcal and Mineralogical Characteristics of Maury Silt Loam, Pembroke Silt Loam, Henry Silt Loam, Burgin Silty Clay Loam, Eden Silty Clay Loam, Yolo Loam, and Huntington Loam.
vii
Page
3

Figure
1
LIST OF FIGURES
Soil-Water Retention Curves of Yolo Loam, Burgin Silty Clay Loam, and Maury Silt Loam .
2 Soil-Water Retention Curves of Eden Silty Clay Loam,
3
Pembroke Silt Loam, Henry Silt Loam, and Huntington Loam
Capillary- Diffusion Coefficients as a Function of Volumetric Water Content as Measured by the Outflow Method for Yolo Loam, Maury Silt Loam, and Burgin Silty Clay Loam .
4 Capillary-Diffusion Ceofficients as a Function of Vol-
5
6
7
umetric Water Content as Measured by the Outflow Method for Pembroke Silt Loam, Eden silty Clay Loam, and Huntington Loam.
Relationship of Advance of the Wetted Front and Square Root of Time for Huntington Loam.
Relationship of Advance of the Wetted Front and Square Root of Time for Burgin Silty Clay Loam
Capillary-Diffusion Coefficients as a Function of , Volumetric Water Content as Measured by the Inflow Method for Yolo Loam, Maury Silt Loam, and Burgin Silty Clay Loam ,
8 Capillary-Diffusion Coefficients as a Function of
9
10
Volumetric Water Content as Measured by the Inflow Method for Pembroke Silt Loam, Eden Silty Clay Loam, and Huntington Loam ,
Comparison of Inflow and Outflow Capillary-Diffusion Coefficients for Yolo Loam, Maury Silt Loam, and Burgin Silty Clay Loam .
Comparison of the Inflow and Outflow Capillary-Diffusion Coefficients for Huntington Loam, Pembroke Silt Loam, and Eden Silty Clay Loam .
ix
Page
8
9
10
11
14
16
17
18
20
21

Figure
11
12
Self-Diffusion Ceofflcients as a Function of Volumetric Water Content for Maury Silt Loam and Eden Silty Clay Loam, The Encircled characters represent the coefficients obtained by the method of Jackson (1964), the non-enclosed characters represent the coefficients obtained by the method of Phillips and Brown (1968). Each data point in the figure represents the average of four values
Self-Diffusion Coefficients as a Function of Volumetric Water Content for Henry Silt Loam, Huntington Loam, and Burgin Silty Clay Loam
13 Self-Diffusion Coefficients as a Function of Volumetric Water Content for Pembroke Silt Loam and Yolo Loam
14 Relationship of Self-Diffusion Coefficients to Average Number of Water Layers on Each Mineral Surface
Page
23
24
25
For Maury Silt Loam and Eden Silty Clay Loam . 26
15 Relationship of Self-Diffusion Coefficients to Average Number of Water Layers on Each Mineral Surface for Burgin Silty Clay Loam and Huntington Loam. 27
16 Relationship of Self-Diffusion Coefficients to Average Number of Water Layers on Each Mineral Surface for Yolo Loam and Pembroke Silt Loam . 28
17 Self-Diffusion of Water in Huntington Loam as Measured by 3H and 36c1 31
18 Relationship of Capillary-Diffusion Coefficients as Function of Self-Diffusion Coefficients for Maury Silt Loam, Pembroke Silt Loam, Huntington Loam, Yolo Loam, Eden Silty Clay Loam, and Burgin Silty Clay Loam 32
x

OBJECTIVES
1. To evaluate the effect of soil water content, clay type, and clay
content upon the capillary-diffusion and self-diffusion of liquid
water in unsaturated soil.
2. To attempt to establish a functional relationship between capillary
diffusion and self-diffusion of liquid water in unsaturated soil.
At the present time, the usable water supply in the world is becoming
critical. Therefore, it is essential that the hydrologic cycle be understood.
The segment of the cycle which involves the movement of water within the soil
and from the soil to the plant is one of the more important portions of the
hydrologic cycle. An adequate supply of water for the production of food and
fiber is an important indirect contribution of this segment of the hydrologic
cycle.
The top meter of soil acts as a giant reservoir for the storage of water.
However, the water held within the soil is ever in a dynamic state. Water
moves from soil pores to plant roots and moves through the pores downward,
laterally, or to the soil surface. The water may later be lost from the soil due
to transpiration and evaporation or by drainage into underground aquifers.
Movement of much of the soil water occurs under low tension ( 0 to 1
bar) even though water held at tensions up to 15 bars is potentially available for
subsequent plant use or evaporation. The rate at which these processes occur
is primarily a function of the rate of water movement with the soil mass, the
evaporative potential of the soil surface, and the leaf area of the growing plants.
The amount of water held and the rates of water movement vary greatly among
soils. The rates at which soils transmit water is known qualitatively, but little
is known quantitatively, especially under field conditions. A complete description
of soil water movement is a prerequisite to understanding the processes of
evaporation, transpiration, or drainage which in turn are prerequisites to an

understanding of the conservation and efficient use of both soil water and
irrigation water.
A description of soil water movement will enable workers in other areas
of soil science to explain various problems that are related to water and its
movement. The areas of soil chemistry, soil fertility, soil microbiology, soil
genesis, and soil mineralogy will all benefit from an understanding of the
dynamic soil water processes. Today the citizenry is concerned about
environmental pollutants, many of which supposedly come from agriculture:
nitrates, phosphates, herbicides, insecticides, and soil sediment. Before we
can describe and control these areas of concern, we must describe the media
in which they move: soil water is perhaps the most important medium of
transport.
The flux of water in soil is the product of two quantities, the potential
gradient and the diffusivity term which may be dependent upon the soil water
content. Consequently, to predict the flux of water in soil it is imperative that
work be done to measure these diffusion coefficients in the laboratory under
controlled conditions. Later, these values can be used in the field so that a
quantitative description of soil water movement can be obtained.
RESEARCH PROCEDURES
Six Kentucky soils: Maury, Pembroke, Eden, Burgin, Henry, and
Huntington; and one California soil, Yolo, were ustid in this study to measure
the capillary-diffusion and self-diffusion coefficients of soil water. Table I
shows the soil type, location sampled, the particle size distribution, the
dominant clay mineral, and the total and external surface areas of each of these
soils. All soils were sampled in the A horizon with the exception of the Henry p
which was sampled in the B2
.
Capillary- Diffusion (Outflow Method)
The procedures used to measure the soil water diffusivity coefficients
by the outflow method is that described by Doering (1965). Subsamples of
Maury, Huntington, Eden, Burgin, Pembroke, and Yolo were passed through a
40-mesh sieve and carefully packed in pressure cells which were equipped with
- 2 -

TABLE I. Some Physical and Mineralogical Characteristics of Maury Silt Loam, Pembroke Silt Loam, Henry Silt Loam, Burgin Silty Clay Loam, Eden Silty Clay Loam, Yolo Loam, and Huntington Loam.
Soil Type External Total (location sampled) % % % Predominant Surface Area Surface Area
Sand Silt Clay Clay1 m 2/gm m 2/gm
Maury silt loam 1. 39 75.11 23.50 Al-inter layered 27.35 64.84 (Fayette County) vermiculite
Pembroke silt loam 2.91 76.90 20.19 Mica 29.40 67.91 (Nelson County)
I Huntington loam 45.94 37.93 16.13 Vermiculite, 32.70 69.29
"" (Greenup County) Montmorlllonite
Henry silt loam 1. 70 81. 00 17. 20 Montmorillonite (Calloway County)
Eden silty clay loam 2.70 66.76 30. 54 Vermiculite, 53.50 166.62 (Grant County) Mica
Burgin silty clay loam 2.00 69.80 28,20 Al-interlayered 49.29 113. 33 (Fayette County) montmorillonite
Yolo loam 41,80 39.95 19.15 Montmorillonite 41. 20 76.23 (Davis, Calif. ) -1
Probable clay mineral which is predominat in the clay fraction.

porous plates. Three different porous plates were used in order to obtain
diffusivity values over a large soil moisture range. The three plates had
bubbling pressures of O. 2, 1. 0, and 3. 0 bars.
After the soils were packed in the cells, each soil sample was water
saturated, the cell was attached to a dropflow counter as described by Doering
and Decker (1964), and a pressure slightly less than the bubbling pressure of
the porous plate was applied to the system. Each sample was dewatered once
to the lowest water content possible with a given porous plate. The dewatering
process was done to stabilize the soil mass and insure a more uniform soil
medium. The soil was then resaturated with water and again attached to the
drop-flow counter for a measurement. The drop-flow counter recorded the
water outflow from the soil as a function of time. After the soil water attained
equilibrium, the cell was removed, resaturated, and another trial made.
The diffusivity values were calculated by using Gardner's solution of the
diffusion equation (1962). The boundary and initial conditions of these
experiments were the same as those used in Gardner's solution.
Capillary-Diffusion (Inflow Method)
The method used to measure the soil water diffusivity coefficients by the
inflow method is similar to that employed by Bruce and Klute (1956). Diffusivity
values were obtained for the same soils as in the outflow method.
Soils were uniformly packed by hand into an acrylic column 50 cm in
length. The column was composed of fifty 1-cm rings, 2-cm in diameter. The
rings were held in a horizontal position by placing the rings in a slightly larger
column which was open on one side to permit the rings to be taken out
separately and easily.
To furnish a water supply with a given tension to the system, a buret
containing a side-arm was used. The side-arm was open to the atmosphere,
and consequently, the water held in that position was at atmospheric pressure.
A porous plate was connected to the buret by plastic tubing. Before the start
of the diffusion process, the tygon tubing from the buret was connected to the
porous plate and filled with water. During the filling operation the side-arm and
the tubing to the porous plate were shut off by clamps. The porous plate was
-4-

attached to the soil column and the height of the side-=arm-was adjusted to the -- .-,.
desired level. Once the porous plate was firmly fitted tothe soil column, the
clamps were removed, permitting water to flow into the system under tension.
A diagramatic sketch of the experimental system is given by Bruce and Klute
(1956).
After the diffusion process was completed, the porous plate was
separated from the column and the gravimetric water content was determined
for each of the 1-cm rings in the column.
The capillary-diffusion coefficients were calculated using equation (1)
which is the solution of the diffusion equation corresponding to the initial and
boundary conditions:
D (9) 1 dx 2t d9
9 J x
9. 1
d9 (1)
where 9 is moisture content on a volume basis, t is the time in minutes, x
is the distance in cm, and 9. is the initial water content of the soil, and I
D ( 9) is the capillary-diffusion coefficient which is assumed to be a unique
function of 9.
Self- Diffusion
Self-diffusion coefficients were measured for Maury, Huntington,
Pembroke, Eden, Henry, Burgin, and Yolo soils using a modification of the
method used by Phillips and Brown (1968).
Subsamples of each soil at each of several water content wE'lre prepared
as follows. The soils were passed through a 40-mesh sieve. The samples,
each containing 40 gms of oven-dry soil, were wetted with distilled water to
obtain the desired moisture content. After soil water equilibrium had been
obtained, 2 µ Ci of tritiated water was added to one sample of each water
treatment. Each sample was then thoroughly mixed periodically with a spatula
during the following day in order to insure a uniform distribution of tritiated
water throughout the soil sample.
The soil samples containing either tritiated water or normal water were
packed into lucite cylinders, each measuring 2 cm in length and 1. 92 cm in
- 5 -

diameter. To start the diffusion process, one end of a cylinder containing
tritiated water was placed against one end of a cylinder containing normal
water at an equal water content. Copper discs were placed at the ends of eacll
of tile cylinders, and a "C" clamp was used to hold tile cylinders in close
contact. Masking tape was placed around the cylinders at tile interface to
prevent evaporation. The "C" clamp llolding the cylinder was enclosed in a
plastic bag and placed in a desiccator above a free water surface to further
reduce evaporation. At the end of tile diffusion period, approximately 4-10
hours, depending on the water content of the soil, tile half-cells were separated
and the soil from eacll cylinder was stored in a small air-tigllt jar. Tile soil
was mixed periodically for one day to obtain a uniform distribution of the
tritiated water within tile sample. A known weigllt of subsample was taken
from each jar and placed into a liquid scintillation counting vial. Tile scintillat
ion liquid was made up according to tile following recipe: 500 ml toluene,
500 ml dioxane, 104. 0 gms napthalene, 6. 60 gms PPO, and 0.130 gm POPOP.
Tile vials were shaken by hand and placed in cold storage over night before
counting. Tile self-diffusion coefficients were calculated using equation (2)
which is equation (7) of Pllillips and Brown (1964):
(2)
wllere Dis tile self-diffusion coefficient in cm2 /sec, 11 is 3.1416, F is the
fraction of the tritiated water molecules whicll diffused across tile interface of
tile initially tagged and untagged soil sample, ll is the length of the llalf-cell
in cm, and t is tile time of the diffusion process in seconds.
Tile method used to measure the self-diffusion ofwater in soil by using 36
Cl as a tracer of water is identical to tllat used for tritiated water with tile 3 36
exception tl:tat H was replaced by Cl.
Vapor Diffusion (Inflow Method)
A metllod similar to that reported by Jackson (1964a) was used to
measure tile diffusion coefficients of water vapor into relatively dry soils.
The same soils were used in tllis experiment as were used to measure tile
self-diffusion coefficients of tritiated water.
- 6 -

An acrylic plastic column 10 cm long and 2 cm in diameter was con
structed. The column was composed of 0. 5 cm and 1. 0 cm rings which were
held in place by tape and sealed with paraffin over the entire length of the
column. One end was sealed with a rubber stopper which was coated with
paraffin. Soil which had been dried at 50 C was carefully packed into the
column and quickly placed in a desiccator above a free water surface. This
produced an atmosphere of approximately 100 percent relative humidity. The
only water that could enter the soil system had to do so by vapor movement
from the open end of the column.
After the diffusion process was completed, the column was sectioned,
and the moisture content of each ring section was determined gravimetrically.
The vapor diffusion coefficients were calculated with the use of equation (1)
since the initial and boundary conditions were identical to those in the develop
ment of equation (1).
DA TA AND RESULTS
Physical and Mineralogical Characteristics
The six Kentucky soils: Maury, Eden, Henry, Burgin, Pembroke, and
Huntington; and one California soil, Yolo, used in this study are described
in Table I. This table shows the particle size distribution, the dominant clay
mineral present, and total and external surface area of each of these soils.
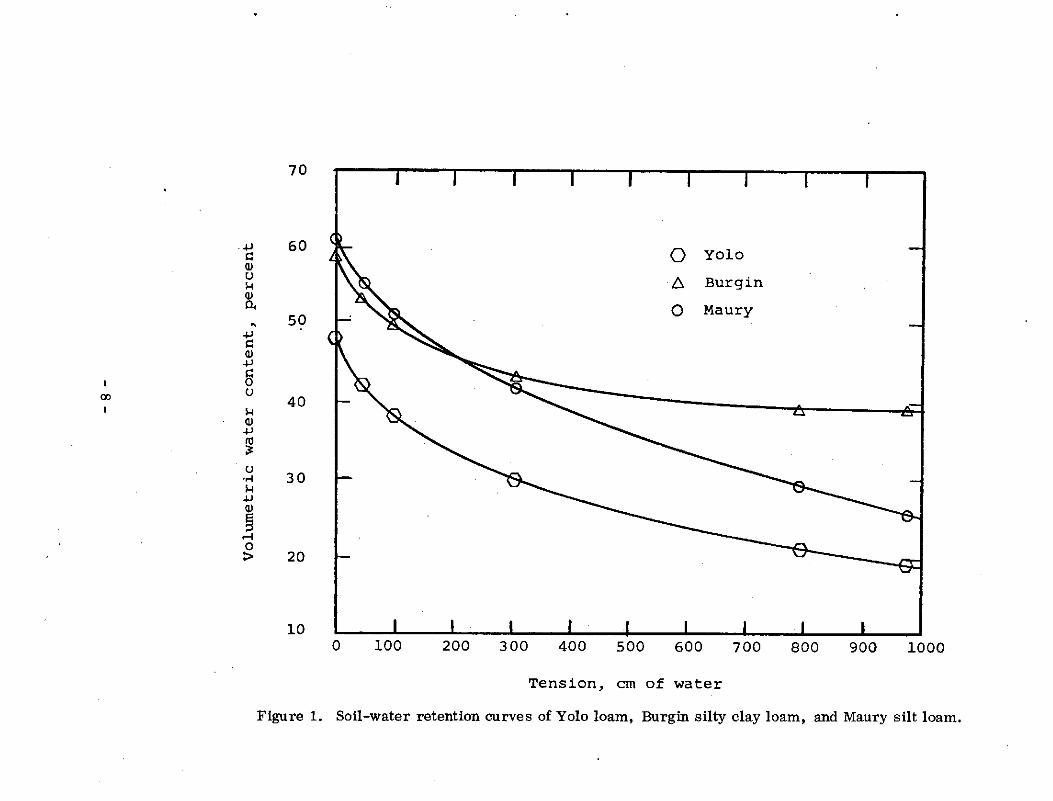
Figures 1 and 2 show the relationship between water retention of the
soils as a function of the water tension. The differences found among the
various soils can be related to the characteristics found in Table I.. The soils
with higher clay contents hold more water for a given tension than do the other
soils, and the slopes of the moisture release curves indicate that the release
of the water is slower in the soils with the higher clay contents.
Capillary-Diffusion (Outflow Method)
Figures 3 and 4 show the measured diffusivity values of the soils
studied as a function of the water content on a volume basis. The values
shown in the figures represent the average coefficients measured at several
water contents. The method of averaging the values consisted of plotting all
- 7 -
70
. .µ 60
~ 0 Yolo c
Q) u t:,,. Burgin k Q)
0 0. Maury ' 50
.µ c Q) .µ
§ u 00 40
I k Q) .µ
"' ;J
u 30 ....
k .µ
§ .--! 0 ::,. 20
10 0 100 200 300 400 500 600 700 800 900 1000
Tension, cm of water
Figure 1. Soil-water retention curves of Yolo loam, Burgin silty clay loam, and Maury silt loam.

I
CD
70
60 ~ 0 Eden .µ c:: Q) .i\ A Pembroke CJ k Q)
l\ ~ D p. Henry 50
• .µ ,k\ " -.............. 0 Huntington c:: Q) .µ c:: 0 CJ 40 1-1 Q) .µ 11]
~
CJ 30 . ., 1-1 .µ
~ ;:,
..-i 0 20 :>
10 0 100 200 300 400 500 600 700 800 900 1000
Tension, cm of water
Figure 2. Soil-water retention curves of Eden silty clay loam, Pembroke silt loam, Henry silt le-am, and Huntington loam.

'
.:: ·ri Yolo E '-OJ E u
10° ' .µ
.:: (l) ·ri u ·ri ..., ...,
Maury (l) 0 u .:: 0 ·ri (j]
:::, ..., 10-1 ...,
·ri 'O I >< I-< ,0
o-l o-l ·ri P. ,0
CJ
. Burgin
10-2
20 30 40 50 60
Volumetric water content, percent
Figure 3. Capillary-diffusion coefficients as a function of volumetric water content as measured by the outflow method for Yolo loam, Maury
silt loam, and Burgin silty clay loam.
- 10 -

i::: ..... E: '-Oj 10° 6 ' .µ
i::: (lJ ·.-l u .....
""' ""' (lJ
0 u i::: 0 ·.-l 00 ::,
""' ""' ·.-l 'Cl I :>, 14 ro
..-!
..-! ·.-l 0.. ro CJ
~ Pembroke
20 30 40 50
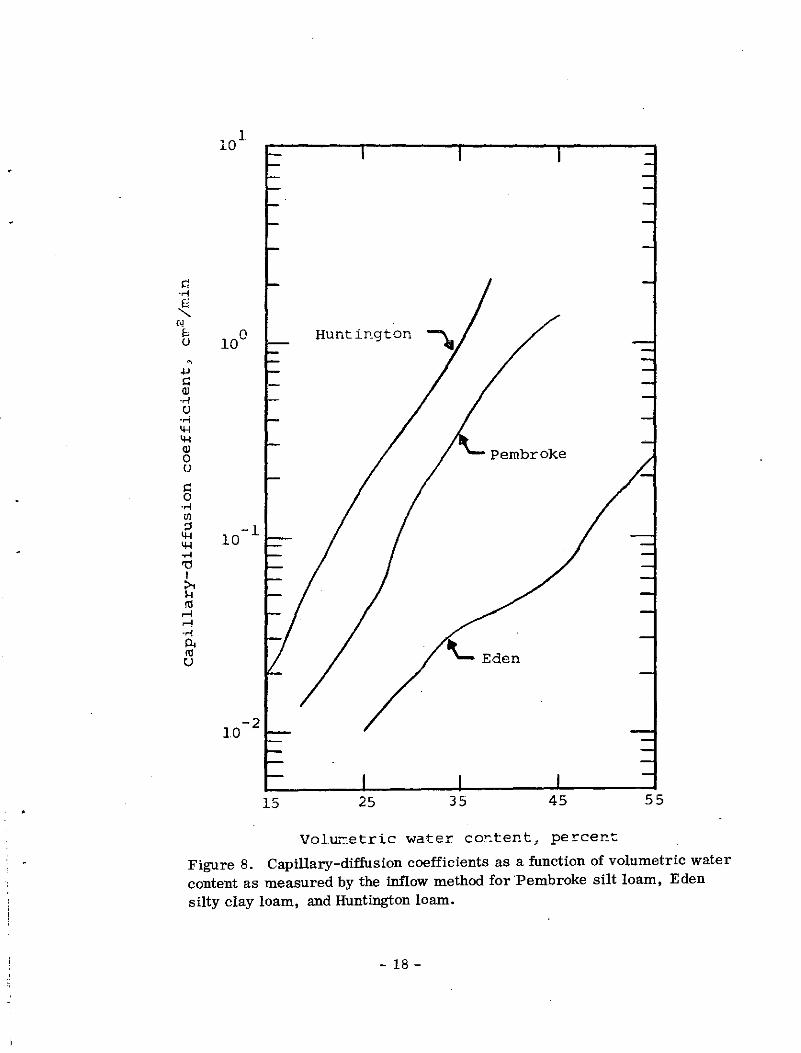
Volumetric.water content, percent Figure 4. Capillary-diffusion coefficients as a function of volumetric water content as measured by the outflow method for Pembroke silt loam, Eden silty clay loam, and Huntington loam.
- 11 -
the obtained diffusivity values versus the water content on a volume basis and
drawing a smooth curve through the greatest concentration of points. This
method seems preferable to that of taking a simple mean, because this method
permits a smooth cu:-ve to be drawn through the points which gives a better
representation of the entire range for comparing the diffusivity values of the
different soils. In order to measure the diffusion coefficients over a large
range of water contents, it was necessary to combine data from three different
porous plates, each with a different bubbling pressure. The water content
range was divided into three segments for measurement of the diffusion
coefficients: water contents corresponding to tensions of Oto 0. 2, 0.1 to O. 9,
and from 0. 8 to 1. 2 bars. The overlapping tensions from one plate to another
permitted a smooth transition in coefficients in going from one plate to
another. The first and last few values obtained for each pressure increment
were discarded.
As shown in Figures 3 and 4, the diffusivity values of the soils studied
vary greatly with the moisture content range considered. In each case the
diffusion coefficients decreased very rapidly with decreasing water content.
Pore size, continuity, and number are probably the most important factors
influencing capillary diffusion values at any given water content, because the
textural distribution, kind of clay, bulk density, and organic matter all
influence these properties. The loams, Yolo and Huntington, have higher
diffusivity values than the silt loams, Maury and Pembroke, which in turn are
higher than the silty clay loams, Eden and Burgin.
The greatest differences among the soils in regard to the diffusion rates
were found at the higher water contents. At a water content of 40 percent on a
volume basis, the diffusivity value of the Yolo loam was nearly 1000 times as
great as the Burgin silty clay loam. At this same water content, the Maury silt
loam was approximately 50 times greater than the Burgin. A loam has many
more large pores than a silty clay loam. At water contents approaching
saturation many of these large pores in a loam are filled with water. As a
given pressure gradient is applied to the soil system, the largest pores drain
first and more rapidly than the smaller pores as found in the soils with
- 12 -

relatively high clay contents. As a consequence of the pore geometry, a loam
releases more water for a given period of time than a soil which contains many
more small pores.
In the intermediate water content range, approximately 20 to 35 per
cent on a volume basis, the diffusivity values of the different soils are more
nearly the same value than at the higher water contents, although the lighter
textured soils still have the higher values. At a volumetric water content of
30 percent on a volume basis, the diffusivity value of the Yolo is less than
100 times as great as the Burgin silty clay loam; this is 10 times smaller
than it is at 40 percent. The Maury has a value of approximately 4 times the
Burgin at 30 percent water content, about 1/12 as large as the value at 50
percent. The reason that the coefficients are more nearly the same in this
drier range is due to the fact that many of the large pores in the loams and the
silt loams have already drained, The number and size of pores, which are
still saturated in the loams and silt loams, are more nearly equal to the
number and size of pores still saturated with water in the silty clay loams.
Even so, at this lower water content the equivalent radii of the pores filled
with water in the silty clay loams are still smaller than those in the loams and
silt loams.
Capillary-Diffusion (Inflow Method)
A second method was used t6 measure the capillary-diffusion coefficients
of the six soils. Whereas, the first method involved introducing an applied air
pressure to the soil system, the inflow method involved the flow of water into
the system under a tension. In the mathematical solution of the diffusion
equation, an assumption is made that the relationship between the distance of the
wetted front and the square root of time required to reach that distance is linear.
Nielson et al. (1962), working with California soils, have shown that this
relationship holds only for a tension up to approximately 2 cm of water.
Figure 5 shows the distance of the advance of the wetted front as a
function of the square root of time for the Huntington loam. With an applied
tension of 2 cm of water, a linear relationship was found to exist for the
- 13 -

s u
-.µ i:: 0 la
4-1
t,, i::
·el .µ .µ
~ Q)
.i:: .µ
4-1 0
Q)
u i:: rt! >
'Cl ~
40
0 2 cm water tension
A 5 cm water tension
30
20
10
0 0 10 20 30 40
Square root of time, min
Figure 5. Relationship of advance of the wetted front and square root of time for Huntington loam.

•
duration of the experiment. The relationship for a tension of 5 cm of water
was found to be linear for some time after which the relationship became
curvilinear. The two systems yielded approximately the same diffusivity
values for a given water tension, if the system with the higher tension was
stopped soon after the linear relationship ceased to exist. Tensions of 10 cm
of water, or greater, yielded lower diffusion values for the entire moisture
content range studied. Similar relationships were found to exist for the Yolo
loam, the Maury silt loam, and the Pembroke silt loam.
The distance of the advance of the wetted front as a function of the
square root of time for the Burgin silty clay loam is shown in Figure 6. An
applied tension of 2 cm of water resulted in a relationship that was nearly
linear for the entire time of the experiment. However, the curve was not
linear for a tension of 5 cm as it was for the Huntington loam and the other
lighter textured soils. Greater tensions gave even more deviation from lin
earity. The Eden silty clay loam produced curves very similar to the
Burgin.
Figures 7 and 8 show the average capillary-diffusion coefficient as a
function of the water content for the inflow method. The values were averaged
in the same manner as they were for the outflow method. As with the outflow
method, the diffusion coefficients decrease very rapidly with decreasing water
content. At the higher water contents the diffusivity values of the Yolo loam
and the Huntington loam are much higher than for the Maury silt loam. Pem
broke silt loam, and the Burgin silty clay loam which are in turn greater than
for the Eden silty clay loam. Capillary-diffusion measurements by the inflow
method yielded values for the Burgin as high as for the Maury and the Pem
broke. At the lower water content, the diffusivity values of the several soils
were much more nearly the same than they were at water contents approaching
saturation .
Comparison of the Outflow and Inflow Methods
Although both methods are designed to measure the same diffusion
coefficient, the two methods used in this study differ in their experimental
design, and consequently differ in their mathematical development. Due to
- 15 -

•
.... "'
40
E: L 0 2 cm water tension CJ
' 30 D 5 cm water tension .µ ,::
I A 10 / a 0 cm water tension 1-1
4-1 I ¥ D
0, ,:: .....
I 7 .µ D .µ Q) 20 ~ I ,,,FT a Q)
.c:
.µ
4-1 0
r c A
Q) A CJ A ,:: 10 fll A >
'"Cl A
"' A
0 0 10 20 30 40
• Square root of time_, min
Figure 6. Relationship of advance of the wetted front and square root of time for Burgin silty clay loam.
50

•
~ . ., E --....
N 10° = u
-.µ i:: (1) . ., u . .,
4-4 4-4 (1)
0 u i:: 0 ·rf OJ
10-1 ::, 4-4 4-4 ·rf 't1 I >, M
"' ..... ..... ·rf P. :a CJ
15 25 35 45 5 -::,
Volu:r.etric water content, percent Figure 7. Capillary-diffusion coefficients as a function of volumetric water cqntent as measured by the inflow method for Yolo loam, Maury silt loam, and Burgin silty clay loam.
- 17 -
..., a Q) ·rl CJ
•rl 11--1 11--1 Q)
0 CJ
a 0 ·rl Ul
~ 10- 1 .... 'O I >, I-< ro
.-1
.-1 ·rl
~ \_ Eden
10-2
15 25 35 45
Volu.-:-,etric water cor.ter.t, percer.t
55
Figure 8. Capillary-diffusion coefficients as a function of volumetric water content as measured by the inflow method for.Pembroke silt loam, Eden silty clay loam, and Huntington loam.
- 18 -
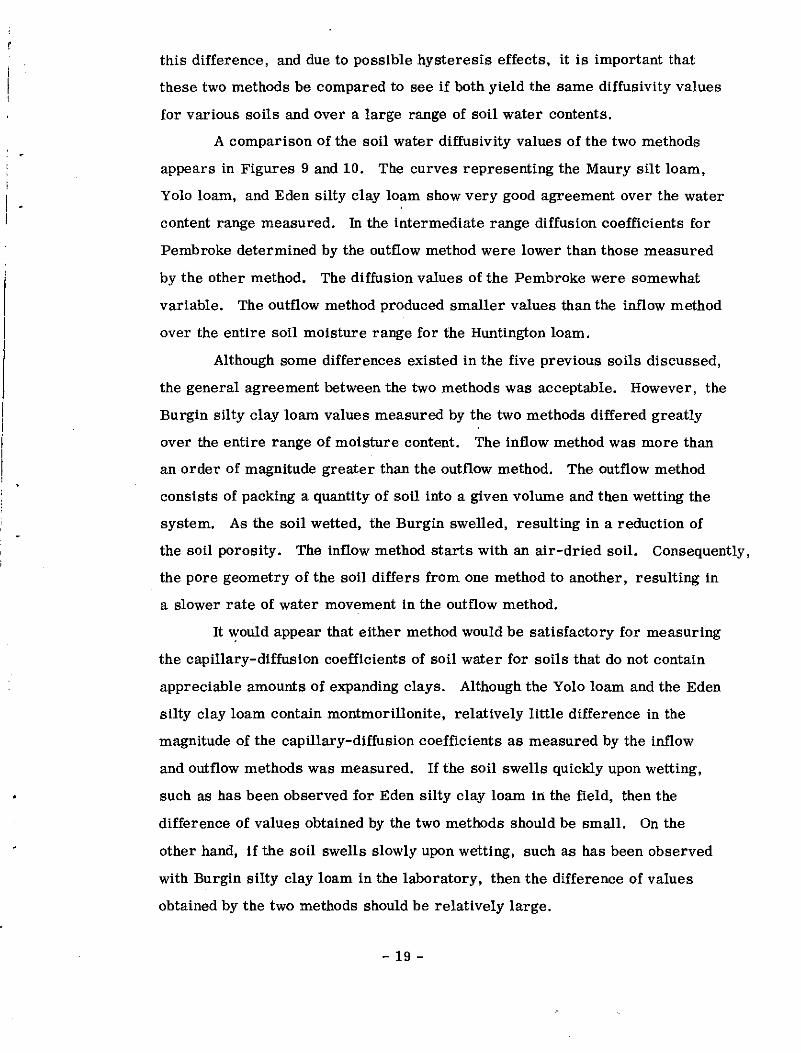
this difference, and due to possible hysteresis effects, it is important th.at
these two methods be compared to see if both yield the same diffusivity values
for various soils and over a large range of soil water contents.
A comparison of the soil water diffusivity values of the two methods
appears in Figures 9 and 10. The curves representing the Maury silt loam,
Yolo loam, and Eden silty clay loam show very good agreement over the water
content range measured. In the intermediate range diffusion coefficients for
Pembroke determined by the outflow method were lower than those measured
by the other method. The diffusion values of the Pembroke were somewhat
variable. The outflow method produced smaller values than the inflow method
over the entire soil moisture range for the Huntington loam.
Although some differences existed in the five previous soils discussed,
the general agreement between the two methods was acceptable. However, the
Burgin silty clay loam values measured by the two methods differed greatly
over the entire range of moisture content. The inflow method was more than
an order of magnitude greater than the outflow method. The outflow method
consists of packing a quantity of soil into a given volume and th.en wetting the
system. As the soil wetted, the Burgin swelled, resulting in a reduction of
the soil porosity. The inflow method starts with an air-dried soil. Consequently,
the pore geometry of the soil differs from one method to another, resulting in
a slower rate of water movement in the outflow method.
It would appear that either method would be satisfactory for measuring
the capillary-diffusion coefficients of soil water for soils th.at do not contain
appreciable amounts of expanding clays. Although the Yolo loam and the Eden
silty clay loam contain montmorillonite, relatively little difference in the
magnitude of the capillary-diffusion coefficients as measured by the inflow
and outflow methods was measured. If the soil swells quickly upon wetting,
such as has been observed for Eden silty clay loam in the field, th.en the
difference of values obtained by the two methods should be small. On the
other hand, if the soil swells slowly upon wetting, such as has been observed
with Burgin silty clay loam in the laboratory, then the difference of values
obtained by the two methods should be relatively large.
- 19 -

101 - I
I Yolo~/
I Inflow I
I Outflow
i:: Yolo I . ..;
~ ,
I /
/
"' I /
s 10°
I Maury~,/ u
I ,, /
- / ,I
.µ I ,, , ,
i:: I / /'.
Q) I . ..; u I /
. ..; I
4-1 I I
4-1 I 1'1\... Q)
I
0 I I Burgin u I I
I I i:: I I
' 0 I I I . ..;
"' I I
::! I I 4-1 10-l I 4-1 I I . ..; I 'O I >, I I-< I\... Maury ro I
,...; I ,...; I . ..; ' 0.. ' ro ' 0 I
I , , , I
10-2
15 25 35 45 55
Volumetric water content, percent
Figure 9. Comparison of inflow and outflow capillary-diffusion coefficients for Yolo loam, Maury silt loam, and Burgin silty clay loam.
- 20 -

c: . .., ~ N
E: ' u '·
' .µ c: (l) . .., u . .., .... .... (l) 0 u c: 0 . .., {/)
::1 .... .... . .., 'O I ::,.. 14 ro
...-!
...-! . .., °' ro u
•
1 10
Inflow Huntington-_
Outflow
I
Huntington .....,.,, I I
10° I
I I
I I I
I I ,. ,. I
I I I I
I I I
I I I I /
I I I I
I I I I I
I I
I I
10-1 I I ,.
I ,
I / , I
I I .,.
I ,
I I I ,
I I I
I .., / I
/ L
,,"'\..Eden 10- 2
15 25 35 45 55
Volumetric water content, percent
Figure 10. Comparison of the inflow and outflow capillary-diffusion coefficients for Huntington loam, Pembroke silt loam, and Eden silty clay loam.
- 21 -

•
Self- Diffusion
Figures 11, 12, and 13 show the self-diffusion or molecular coefficient
of the water molecule as a function of the water content on a volume basis for
the seven soils used in this study. The resulting curves are similar in shape
for each of the soils; however, the diffusion coefficients differ among water
contents for the various soils.
Each curve shows a rapid decrease in the self-diffusion coefficients as
the water content decreases from near saturation to approximately 30 to 40
percent water on a volume basis. At some given water content for each soil,
the diffusion coefficient begins to increase as the water content is further
reduced. This increase continues until a water content of about 5 to 10 per
cent is reached. As the water content was reduced to near zero, the diffusion
coefficients decreased very rapidly.
All researchers reporting self-diffusion coefficients for given soils
have found the diffusion coefficients to be constant over a large portion of the
water content range, in most cases from a water content of about 15 to 20
percent on a volume basis to saturation. The results of this work are not in
agreement with other workers on this finding, since as the water content
decreased from near saturation to approximately field capacity, the diffusion
coefficients decreased.
Figures 14, 15 and 16 show the self-diffusion coefficients as a function
of the number of water layers on each mineral surface. It would appear
reasonable to expect a decrease in the diffusion coefficient with a decrease in
the water content if the water is entirely in the liquid form. The three most
important factors influencing the diffusion of a water molecule in a soil-
water system with water contents in the range of plant growth are: (1) path
length of the diffusing molecule, (2) the attraction of the mineral surface for
the polar water molecule, and (3) the viscosity of the soil water. Low (1961)
has advanced the theory that the water on the mineral surface is somewhat 0
ordered out to a distance of approximately 50 A when the clay is saturated with
monovalent ions. Kemper et al. (1964) found that the mobility of water
- 22 -

"" <->
<: 0 f--
~ rt 11 ..... n
~ OJ rt m 11
n 0 ::, rt m ::, rt ' 'o m 11 n m ::, rt
f-- "' w
Self-diffusion coefficient x 104 , cm2 /min
.i:,. u, O"I . .., ex, "' f--0
f-f--
f-
"' o.---~~"T""~~-r~~~,-~~-r~~--,r-~~-,-~~-.-~~--.~~~...-~~-,-~~---.
f--0
"' 0
w
:l ~ I-
O"I 0
:;: t,;J OJ 0. c m 11 ::, '<
)
-;; '-~~--~~~ ..... ~~--~~~ ..... ~~ ........... ~~--~~~--~~ ..... ~~~ ..... ~~ .... ~~~-' Figure 11. Self-diffusion coefficients as a function of volumetric water content for Maury silt loam and Eden silty clay loam. The encircled characters represent the coefficients obtained by the method of Jackson (1964), the nonenclosed characters represent the coefficients obtained by the method of Phillips and Brown (1968). Each data point in the figure represents the average of four values.

I
"' ""'
< 0 .... ~ rt Ii ..... rJ
:e: DJ rt (1)
Ii
rJ
8 rt (1) ::, rt • 'O (1)
Ii rJ (1) ::, rt
•
0
.... 0
N 0
w 0
.;,. 0
u, 0
°' 0
.... N
Self-diffusion coefficient x 104 , cm2 /min
w u,
ttl c Ii l!:l ..... ::,
°' ..., 00 \.D
.... 0
::i: (1) ::, Ii '-<
,)
....
.!-:-' .... N
'c5--~~ ..... ~~~--~~--'~~~ ..... ~~~"-~~....&.~~~ ...... ~~--'~~~-'-~~~"-~~--1 Figure 12. Self-diffusion coefficients as a function of volumetric water content for Henry silt loam, Huntington loam, and Burgin silty clay loam. The encircled characters represent the coefficients obtained by the method of Jackson (1964), the non-enclosed characters represent the coefficients obtained by the method of Phillips and Brown (1968), Each data point in the figure represents the average of four values.

I
"" C11
< 0 .... ~ fl)
rt '1 >'· (l
~ rt' fl)
'1
(l
0 ::, rt fl) ::, rt • 'Cl fl)
'1 (l fl) ::, rt
•
.... "' w
Self-diffusion coefficient x 104 , cm2 /min
"" l11 °' ..... (X) ID .... 0
.... .... .... "' al I I I t"'L I lib I I I JC iJ. I I
.... 0
"' 0
w 0
"" 0 I
~t-
~r ..... 0
I
><: 0 .... 0
',:) fl)
s tJ' '1
~ fl)
I I I
Figure 13. Self-diffusion coefficients as a function of volumetric water content for Pembroke silt loam and Yolo loam. The encircled characters represent the coefficients obtained by the method of Jackson (1964), the non-enclosed characters represent the coefficients obtained by the method of Phillips and Brown (1968). Each data point in the figure represents the average of four values.

11
~ 10
. ..;
~ "E, 9 u
• st
0 ...; 8 >: .µ ~ Q) 7 . ..; u Maury . ..; ~ ~ Q) 6 0 u • ~ 0 . ..; 5 {/) ::, ~ ~ . ..; 'O 4 I ~ ...; Q) Cll
3
2
0 10 20 30 40 50 60 70
• Average number of water layers on mineral surface
Figure 14. Relationship of self-diffusion coefficients to average number of water layers on each mineral surface for Maury silt loam and Eden silty clay loam.
- 26 -

,,
12
11
i:: 10 ..... ~ (\j
e 9 u
-sj' 0 .-l 8 >: .µ i:: Q) 7 ..... u .....
""' ""' Q) 6 0 u i:: Huntington 0 ..... 5 Ul ::,
""' ""' ..... 'O 4 I
""' .-l Q) (/l
3
2
1 0 10 20 30 40 50 60 70
Average number of water layers on mineral surface
Figure 15., Relationship of self-diffusion coefficients to average number of water layers on each mineral surface for Burgin silty clay loam and Huntington loam.
- 27 -

•
12
11
10 s::
.,.; Ei
" 0 "' 9 i:: u
-"" 0 8 .-I
)<
.... s:: 7 QI ·rl u ·rl 'H 'H 6 QI 0 u s:: 0 5 ·rl Ul ::l 'H 'H ·rl 4 '.Cl I
'H .-I QI IQ 3
2
1 0 10 20 30 40 50 60 70
Average number of water layers on mineral surface
Figure 16. Relationship of self-diffusion coefficients to average number of water layers on each mineral surface for Yolo loam and Pembroke silt loam.
- 28 -

'
0
molecules in Na-bentonite is reduced slightly as far as 50 A from the clay 0
mineral surface. At 10 A in a Ca-bentonite, the water molecules were 0. 8
times as mobile as the molecules of bulk water. This could account for some
decrease in the diffusion rate out to about 17 water layers assuming a Na-clay
system. Since there was a decrease in the diffusion rate as the number of
water layers was reduced from a saturated condition to approximately field
capacity, and the number of water layers at this latter water content was
greater than 20 in each case, the viscosity of the water should have had little,
if any, effect on the diffusion rate. The soils in this study were Ca dominated 0
and the viscosity should not have been affected more than 10 to 15 A from the
clay mineral surface. The decrease in the self-diffusion coefficients as the
water content decreased was probably due to an increase in tortuosity, but no
valid explanation can be given as to why these data do not agree with the constant
diffusion coefficient values for a moisture content range from saturation to
field capacity that have been previously reported in the literature by Kunze and
Kirkham (1961) and Nakayama and Jackson (1963). After the self-diffusion
coefficients reached a minimum value, they then increased to a maximum
value as water content further decreased, because of water vapor movement.
As the water contents further decreased, the attractive forces of the mineral
surfaces for the water molecule were too strong to permit freedom of move
ment resulting in a decrease of the self-diffusion coefficients. In the loams
and the silt loams the effect of vapor movement became apparent when the void
pore space was no greater than three percent. In the silty clay loams void pore
spaces of greater than 25 percent were necessary before vapor diffusion was
detectable. These observations are related to the fact that the soils of
relatively low clay contents have a greater number of large and continuous
pores at water contents just below saturation.
Separation of Liquid and Vapor Self-Diffusion Coefficients
An attempt was made to separate the self-diffusion coefficients of the
Huntington loam into the liquid and vapor components. The tracer used in this
experiment was 36c1. The diffusion coefficient of Cl in liquid water at 25° C
is 1. 96 x 10-5 cm2 / sec. This is 0. 8 that of the diffusion coefficient of 3
HOH
- 29 -
•
in bulk water (Wang et al. , 1953). It was reasoned that it would be possible to
measure the diffusion coefficient of 36
cl In a soil-water system and then
multiply the value by 1. 24 (diffusion rate of 3
HOH .;- diffusion rate of 36
Cl) to
obtain the diffusion rate of liquid water. Kunze and Kirkham (1961) have used
this procedure previously. The results of this experiment are shown in Figure
17.
The diffusion coefficients of the liquid water decrease with water
content until the influence of water vapor movement becomes apparent. How
ever, the diffusion coefficients of water measured with 36
c1 were constant over
the range of intermediate and higher water contents. The diffusion coefficients 36
of Cl were found to be greater than water at water contents on a volume
basis of 20, 25, and 30 percent. Thus it would appear that It is impossible to
directly measure the diffusion coefficient of liquid water by using the 36
Cl
molecule as a tracer.
If one could correct for the anion exclusion volume of the 36
Cl, it might
be possible to relate the two diffusion coefficients. However, little work has
been done in calculating the anion exclusion volumes of soils under unsaturated
conditions.
Relationship Between Capillary- Diffusion and Self-Diffusion Coefficients
Kunze and Kirkham (1961) presented a relationship between the self
diffusion and the capillary-diffusion coefficients. They reported that a single
curve expressed the relationship between the two diffusion coefficients for
each of three soils studied. The solid curve in Figure 18 is taken from the
paper by Kunze and Kirkham. The points plotted in the figure represent all
the diffusion coefficients collected in this work. It can be noted that there is
good agreement with the curve at capillary-diffusion coefficients greater
than 5 x 10⁻²
cm2 /min. The values below this point deviate to the right of the
curve due to the fact that the self-diffusion coefficients are increasing
because of vapor diffusion .
Self-diffusion coefficients reported by Kunze and Kirkham were
obtained by use of 36
cl which is questionable since the differences measured
- 30 -

•
11
10 i:: ·.-!
~ N 9 = CJ
-<I' 36Cl 0 8 ....
x .µ A i:: 7 Ql ·.-! CJ
·.-! .... .... 6 Ql 0 CJ
i:: 0 5 ·.-! (IJ
::, .... .... ·.-! 4 3H 'tl I ....
.-I Cl) Cl) 3
2
0 10 20 30 40
Volumetric water content, percent
Figure 17. Self-diffusion of water in Huntington loam as measured by 3H and 36c1.
- 31 -

I
c,, N>
en n, I-"' H, I
0. I-'· H, H, s::: fJl I-'· 0 ::,
(l
0 n, H, H, I-'· (l I-'· n, ::, rl" • (l
s " s'
I-'· ::,
•
I-"' 0
I I-"' w 0
I u,
I-"' 0
I .i,.
I-"' 0
I w
•
Capillary-diffusion coefficient, cm2 /min
I-"' 0
I
"'
0 0
0 0
0 -e 0
0 0
0 0
a 0 0
I-"' 0
I I-"'
0
9 % 0 00
9, 0
0
0
I-"' 0
0
0
0
0
I-"' 0
I-"'
Figure 18. Relationship of capillary-diffusion coefficients as function of sell-diffusion coefficients for Maury silt loam, Pembroke silt loam, Huntington loam, Yolo loam, Eden silty clay loam, and Burgin silty clay loam. The solid line represents the relationship reported by Kunze and Kirkham (1961); the points are those obtained in this work.

•
•
36 3 with Cl and HOH shown in Figure 17 for Huntington loam are large over a
large water content range. However, it would appear safe to assume that a
functional relationship does exist between the two diffusion coefficients for the
liquid water diffusion coefficients.
Practical Considerations of Capillary-Diffusion Coefficients
Fick' s first law states that the flux of water is proportional to the
diffusion coefficient multiplied by the concentration of driving gradient. With
the concentration gradient held constant, the higher the diffusion coefficient the
greater the flux of water moving through a cross-sectional area in a given
period of time.
One of the most important facets of evaporation of soil water is the
ability of the saturated or unsaturated soil to transmit water upward to the soil
surface. Thus, in a consideration of the loss of water due to evaporation from
a soil, it is important to know the capillary-diffusion coefficients at given
water contents as well as the physical, chemical, and mineralogical character
istics of the soil. A sand soil, although it has a high diffusion coefficient, may
not be able to transport water upward for an appreciable distance, because the
size of the capillary pores are too large to maintain the capillary rise of the
water. On the other hand, a soil high in clay may not be able to transport
water to the surface fast enough to meet evaporative demands, because of
relatively small capillary-diffusion coefficients. When the evaporative demand
is greater than the diffusive flux, the capillaries are broken and subsequent
water transport is disrupted. A silt loam soil will often lose more water due to
evaporation, because the sizes of the pores are such as to maintain capillary
rise and the diffusion coefficient is large enough to transmit water to the soil
surface fast enough to satisfy the evaporative demand.
The inflow diffusion coefficient of the Burgin silty clay loam is about
an order of magnitude greater than the coefficient measured by the outflow
method. This may not be too different from what is observed in field conditions .
The Burgin, when Initially dry, has an Infiltration rate as high as the Maury
silt loam. But once the soil is wetted, the soil conducts water very slowly
because of the swelling effect of the clay. This reduction in the average pore
- 33 -

•
•
size results in a lower capillary-diffusion coefficient. Another point is
illustrated with the Eden silty clay loam. The inflow and the outflow
diffusivities are very similar, However, the Eden does not lose much water
due to evaporation. This is a soil in which the capillary-diffusion coefficient is
too small to transport water to the soil surface to meet normal evaporative
demands. The Maury silt loam is known to lose a great deal of water each
year due to evaporation; its evaporation rate is approximately O. 6 of open pan
evaporation (Karraker et al. , 1950). This observation is in agreement with
the present work since the inflow capillary-diffusion and the outflow capillary
diffusion rates are nearly equal. Thus, the soil can transmit water fast
enough to meet the evaporative potential and the continuity of the pore water
is maintained.
Growing plants transpire enormous quantities of water which they
remove from the soil. Often the soil water is not replenished by rain or irrigation
over periods of weeks or months. Hence the soil acts as a moisture reservoir
for the plant. Since plant roots remove water from the soil, there exists a soil
moisture gradient between the plant root surface and some given distance away
from the root. For a given gradient, the flux of water to the plant root will be
dependent upon the diffusivity of the soil water. This work showed the diff-
usivity of the loams to be greater than the silt loams, which in turn were
greater than the silty clay loams. This means that the loams are better able
to supply the plant with water in the water content range studied. Also, due
to the fact that the evaporative loss of water from the loam is not as great as
that of the silt loams, the loams used in this study should be a more efficient
source of water for plant growth.
SUMMARY AND CONCLUSIONS
Capillary-diffusion and self-diffusion coefficients of liquid water in
unsaturated soils were determined by laboratory methods for several soils:
Maury silt loam, Pembroke silt loam, Eden silty clay loam, Burgin silty clay
loam, Henry silt loam, Huntington loam and Yolo loam.
Capillary-diffusion coefficients were measured by use of inflow and out
flow methods. With both methods the capillary-diffusion coefficients decreased
- 34 -

.. •
•
'
very rapidly with decreasing water content. The soils with lower clay contents
were found to have higher diffusion coefficients over the entire moisture content
range studied, 0 to 1 bar tension, than the soils with the higher clay contents.
A comparison of the two methods showed that the inflow method yielded
slightly higher capillary-diffusion coefficients for the Yolo, Huntington, and
Pembroke. The inflow method gave coefficients about an order of magnitude
greater than the outflow method for the Burgin silty clay loam. This
difference was explained on the basis of the swelling property of the dominant
clay mineral montmorillonite, in the soil. The two methods yielded
approximately the same values for the Maury and the Eden.
The self-diffusion coefficients of the seven soils were measured over
a moisture content range from air dryness to saturation using 3HOH as a tracer
of water. Each of the soils gave the same diffusion characteristics when the
self-diffusion coefficients were expressed as a function of either water content
or average number of water layers on the external mineral surface. As the
water content decreased from saturation to near field capacity, the self
diffusion coefficients decreased very rapidly. When some critical amount of
void pore space became available for the movement of water vapor, the
diffusion coefficients of the soils increased very rapidly until a water content
of about 5 to 10 percent on a volume basis was reached. As the water content
was further reduced to air-dryness, the self-diffusion coefficients again
decreased.
An attempt was made to separate the diffusion coefficients into a liquid
and a vapor component by use of 36c1 as a tracer of liquid water. The results
showed that 36
Cl is not a good tracer of liquid water since the 36 Cl yielded
higher diffusion coefficients than the water over the intermediate and higher
water contents, and that these 36
Cl diffusion coefficients were constant,
whereas the liquid diffusion coefficients decreased with decreasing water
content.
A plot of the capillary-diffusion coefficient at a given water content as
a function of the self-diffusion coefficient measured at the same water content
- 35 -

•
resulted in the points for all soils falling approximately on the same curve.
This would suggest that a functional relationship does exist between the two
diffusion coefficients. It was suggested that before a functional relationship
could be derived, the liquid and vapor components would have to be separated.
By comparing the capillary-diffusion coefficients obtained by the two
methods with the physical and mineralogical data, qualitative estimates of tran
spiration and evaporation of soil water in 1he field were postulated. Soils
with higher inflow diffusion coefficients than outflow coefficients would not
release water from the soil as rapidly as soils that have nearly equal inflow
and outflow rates. However, for evaporation to occur to any great extent, the
outflow rate must be fast enough to meet the evaporative demands .
- 36 -

•
•
Publications Resulting From the Project
Quisenberry, V. L., Jr., 1971. Capillary-diffusion and self-diffusion of liquid water In unsaturated soils. M. S. Thesis. Universitu of Kentucky Library.
Quisenberry, V. L., Jr. and R. E. Phillips. 1972. Capillary-diffusion and Self-Diffusion of Liquid Water in Unsaturated Soils. (Manuscript in preparation; It will be submitted to Soil Science for publication) .
- 37 -
r
•
•.
,.
I '
I I
LITERATURE CITED
Bruce, B. R. and A. Klute. 1956. The Measurement of Soil Water Diffusivity. Soil Sci. Soc. Amer. Proc. 20:458-462.
Doering, E. J. and D. L. Decker. 1964. Apparatus for Measuring Low Rates of Water Flow. Soil Sci. Soc. Amer. Proc. 28:716-718 .
Doering E. J. 1965. Soil-Water Diffusivity by the One-Step Method. Soil Sci. 99: 322-326.
Gardner, W. R. 1962. Note on Separation and Solution of Diffusion Type Equations. Soil Sci. Soc. Amer. Proc. 26:404,
Jackson, R. D. 1964. Water Vapor Diffusion in Relatively Dry Soil: I. Theoretical Considerations and Sorption Experiments. Soil Sci. Soc. Amer. Proc. 28: 172-176.
Karraker, P. E., Bortner, C. E. and E. N. Fergus. 1950. Nitrogen Balance in Lysimeters as Affected by Growing Kentucky Bluegrass and Certain Legumes Separately and Together. Bulletin 557. Kentucky Agric. Exp. Station.
Kemper, W. D., Maasland, D. E. L. and L. K. Porter. 1964. Mobility of Water Adajacent to Mineral Surfaces. Soil Sci. Soc. Amer .. Proc. 28: 164-166 .
Kunze, R. J. and Don Kirkham. 1961. Capillary-Diffusion and Self-Diffusion of Soil Water. Soil Sci. 97:145-151.
Low, P. F. 1961. Physical Chemistry of Clay-Water Interaction. Advances in Agronomy 13:269-328.
Nakayama, F. S. and R. D. Jackson. 1963. Diffusion of Tritiated Water In Soils. Soil Sci. Soc, Amer. Proc. 27:255-258.
Nielsen, D. R., Biggar, J. W. and J. M. Davidson. 1962. Experimental Consideration of Diffusion Analysis in Unsaturated Flow Problems. Soil Sci. Soc. Amer. Proc. 26:107-111.
Phillips, R. E. and D. A. Brown. 1964. Ion Diffusion: II. Comparison of Apparent Self and Counter Diffusion Coefficients. Soll Sci. Soc. Amer. Proc. 28:758-763.
- 38 -

'
'
I .
I
Phillips, R. E. and D. A. Brown. 1968. Self-Diffusion of Tritlated Water In Montmorillonite and Kaolinite Clay. Soil Sci. Soc. Amer. Proc. 32: 302-306.
Wang, J. H., Robinson, C. V. and I. S. Edeleman. 1953. Self-Diffusion and Structure of Liquid Waters: III. Measurement of the Self-Diffusion of Liquid Water With 2H, 3H, and 180 as Tracer. J. Amer. Chem. Soc. 75:466-470.
- 39 -


![University of Groningen Enantioselective liquid-liquid ... · Compared to other methods, such as chiral liquid chromatography[11] and chiral capillary electrophoresis,[12] liquid-liquid](https://img.pdfslide.net/doc/110x75/5f0b599c7e708231d43014d4/university-of-groningen-enantioselective-liquid-liquid-compared-to-other-methods.jpg)