Embed Size (px)
Citation preview

Capillary electrochromatography : fundamentals andapplicationsCitation for published version (APA):Jiskra, J. (2002). Capillary electrochromatography : fundamentals and applications. Eindhoven: TechnischeUniversiteit Eindhoven. https://doi.org/10.6100/IR558066
DOI:10.6100/IR558066
Document status and date:Published: 01/01/2002
Document Version:Publisher’s PDF, also known as Version of Record (includes final page, issue and volume numbers)
Please check the document version of this publication:
• A submitted manuscript is the version of the article upon submission and before peer-review. There can beimportant differences between the submitted version and the official published version of record. Peopleinterested in the research are advised to contact the author for the final version of the publication, or visit theDOI to the publisher's website.• The final author version and the galley proof are versions of the publication after peer review.• The final published version features the final layout of the paper including the volume, issue and pagenumbers.Link to publication
General rightsCopyright and moral rights for the publications made accessible in the public portal are retained by the authors and/or other copyright ownersand it is a condition of accessing publications that users recognise and abide by the legal requirements associated with these rights.
• Users may download and print one copy of any publication from the public portal for the purpose of private study or research. • You may not further distribute the material or use it for any profit-making activity or commercial gain • You may freely distribute the URL identifying the publication in the public portal.
If the publication is distributed under the terms of Article 25fa of the Dutch Copyright Act, indicated by the “Taverne” license above, pleasefollow below link for the End User Agreement:www.tue.nl/taverne
Take down policyIf you believe that this document breaches copyright please contact us at:[email protected] details and we will investigate your claim.
Download date: 23. Apr. 2020

CAPILLARY ELECTROCHROMATOGRAPHY; FUNDAMENTALS AND APPLICATIONS
PROEFSCHRIFT
ter verkrijging van de graad van doctor aan de
Technische Universiteit Eindhoven, op gezag van de Rector
Magnificus, prof.dr. R.A. van Santen, voor een commissie
aangewezen door het College voor Promoties in het openbaar te
verdedigen op dinsdag 1 oktober 2002 om 16.00 uur
door
Jan Jiskra
geboren te Turnov, Tsjechië

Dit proefschrift is goedgekeurd door de promotoren: prof.dr.ir. C.A.M.G. Cramers en prof.dr. G.J. de Jong Copromotor: dr. H.A. Claessens

Jaroslav Seifert
Píseň
Bílým šátkem mává,
kdo se loučí,
každého dne se něco končí,
něco překrásného končí.
Poštovní holub křídly o vzduch
bije,
vraceje se domů;
s nadějí i bez naděje,
věčně se vracíme domů.
Šetři si slzy
a usměj se uplakanýma očima,
každého dne se něco počíná,
něco překrásného se počíná.

CIP-DATA LIBRARY TECHNISCHE UNIVERSITEIT EINDHOVEN Jiskra, Jan Capillary electrochromatography : fundamentals and applications / by Jan Jiskra. – Eindhoven : Technische Universiteit Eindhoven, 2002. Proefschrift. – ISBN 90-386-2584-7 NUR 967 Subject headings: capillary electrochromatography / CEC / reversed phase stationary phases / reversed phase stationary phases ; testing / CEC ; retention mechanism Bibliotheek Werktuigbouwkunde en Scheikundige Technologie Postbus 513, 5600 MB Eindhoven W-hal 0.01, tel. 040-2472555 © Copyright 2002, J. Jiskra Omslagontwerp: Jan-Willem Luiten, JWL Production, Eindhoven Druk: Universiteitsdrukkerij, TU Eindhoven

Contents - i -
CONTENTS
1 INTRODUCTION AND SCOPE ................................................................................................... 1
2 STATIONARY AND MOBILE PHASES IN CAPILLARY ELECTROCHROMATOGRAPHY ................................................................................................ 5
2.1 INTRODUCTION ..................................................................................................................................5 2.2 ELECTROOSMOTIC FLOW .................................................................................................................6 2.3 STATIONARY PHASES IN CEC ..........................................................................................................7 2.3.1 NORMAL PHASES...............................................................................................................................8 2.3.2 REVERSED PHASES ..........................................................................................................................13 2.3.3 PHASES WITH ENHANCED EOF .......................................................................................................26 2.3.4 PHASES WITH CHARGED GROUPS ....................................................................................................27 2.3.5 CHIRAL AND SPECIAL STATIONARY PHASES .................................................................................36 2.3.6 ORGANIC POLYMER BASED .............................................................................................................39 2.4 MOBILE PHASES...............................................................................................................................43 2.4.1 NON-AQUEOUS MOBILE PHASES .....................................................................................................46 2.5 CONCLUSIONS ..................................................................................................................................47
3 CHROMATOGRAPHIC PROPERTIES OF REVERSED PHASE STATIONARY PHASES UNDER PRESSURE AND ELECTRO DRIVEN CONDITIONS; EFFECT OF ORGANIC MODIFIER ..................................................................................................................................... 65
3.1 INTRODUCTION ................................................................................................................................65 3.2 EXPERIMENTAL ...............................................................................................................................67 3.2.1 COLUMNS.........................................................................................................................................67 3.2.2 INSTRUMENTATION .........................................................................................................................68 3.2.3 CHEMICALS......................................................................................................................................69 3.2.4 TEST PROCEDURE ............................................................................................................................69 3.3 RESULTS AND DISCUSSION ..............................................................................................................71 3.3.1 COLUMN HYDROPHOBICITY AND HYDROPHOBIC SELECTIVITY.....................................................71 3.3.2 SILANOL ACTIVITY ..........................................................................................................................78 3.4 CONCLUSIONS ..................................................................................................................................83
4 CHROMATOGRAPHIC PROPERTIES OF REVERSED PHASE STATIONARY PHASES UNDER PRESSURE AND ELECTRO DRIVEN CONDITIONS; EFFECT OF BUFFER COMPOSITION............................................................................................................................. 87
4.1 INTRODUCTION ................................................................................................................................88 4.2 EXPERIMENTAL ...............................................................................................................................89 4.2.1 COLUMNS.........................................................................................................................................89 4.2.2 INSTRUMENTATION .........................................................................................................................90 4.2.3 CHEMICALS......................................................................................................................................90 4.2.4 TEST PROCEDURE ............................................................................................................................92 4.3 RESULTS AND DISCUSSION ..............................................................................................................92 4.3.1 POLAR COMPOUNDS ........................................................................................................................92 4.3.2 APOLAR COMPOUNDS......................................................................................................................96 4.4 CONCLUSIONS ............................................................................................................................... 100

- ii - Contents
5 PREPARATION AND CHARACTERIZATION OF MONOLITHIC POLYMER COLUMNS FOR CAPILLARY ELECTROCHROMATOGRAPHY.............................................................105
5.1 INTRODUCTION ............................................................................................................................. 106 5.2 EXPERIMENTAL ............................................................................................................................ 107 5.2.1 CHEMICALS................................................................................................................................... 107 5.2.2 COLUMN PREPARATION................................................................................................................ 107 5.2.3 INSTRUMENTATION ...................................................................................................................... 109 5.3 RESULTS AND DISCUSSION ........................................................................................................... 110 5.3.1 COLUMN EFFICIENCY IN CEC ...................................................................................................... 110 5.3.2 SELECTIVITY AND RETENTION IN CEC........................................................................................ 112 5.3.3 COMPARISON BETWEEN HPLC AND CEC................................................................................... 120 5.3.4 POROSITY...................................................................................................................................... 124 5.3.5 REPRODUCIBILITY AND STABILITY.............................................................................................. 125 5.4 CONCLUSION................................................................................................................................. 127
6 QUANTITATIVE STRUCTURE RETENTION RELATIONSHIPS IN COMPARATIVE STUDIES OF BEHAVIOUR OF STATIONARY PHASES UNDER HIGH-PERFORMANCE LIQUID CHROMATOGRAPHY AND CAPILLARY ELECTROCHROMATOGRAPHY CONDITIONS............................................................................................................................... 131
6.1 INTRODUCTION ............................................................................................................................. 132 6.2 EXPERIMENTAL ............................................................................................................................ 133 6.2.1 COLUMNS...................................................................................................................................... 133 6.2.2 INSTRUMENTATION ...................................................................................................................... 135 6.2.3 CHEMICALS................................................................................................................................... 135 6.2.4 TEST PROCEDURE ......................................................................................................................... 136 6.3 RESULTS AND DISCUSSION ........................................................................................................... 137 6.4 CONCLUSIONS ............................................................................................................................... 151
7 THERMODYNAMIC BEHAVIOUR IN CAPILLARY ELECTROCHROMATOGRAPHY .............................................................................................155
7.1 INTRODUCTION ............................................................................................................................. 155 7.2 EXPERIMENTAL ............................................................................................................................ 158 7.2.1 CHEMICALS................................................................................................................................... 158 7.2.2 COLUMNS...................................................................................................................................... 158 7.2.3 INSTRUMENTATION ...................................................................................................................... 159 7.2.4 TEST PROCEDURE ......................................................................................................................... 160 7.3 RESULTS AND DISCUSSION ........................................................................................................... 161 7.3.1 EFFECT OF TEMPERATURE ON THE ELECTROOSMOTIC FLOW ..................................................... 161 7.3.2 VAN ‘T HOFF PLOTS...................................................................................................................... 164 7.4 CONCLUSIONS ............................................................................................................................... 169
8 METHOD DEVELOPMENT FOR THE SEPARATION OF STEROIDS BY CAPILLARY ELECTROCHROMATOGRAPHY .............................................................................................173
8.1 INTRODUCTION ............................................................................................................................. 173 8.2 EXPERIMENTAL ............................................................................................................................ 175 8.2.1 CHEMICALS................................................................................................................................... 175 8.2.2 COLUMNS...................................................................................................................................... 176 8.2.3 INSTRUMENTATION ...................................................................................................................... 177 8.2.4 PREDICTION SOFTWARE ............................................................................................................... 177 8.3 RESULTS AND DISCUSSION ........................................................................................................... 178

Contents - iii -
8.3.1 PRELIMINARY EXPERIMENTS ....................................................................................................... 178 8.3.2 SELECTIVITIES .............................................................................................................................. 179 8.3.3 EFFECT OF ACETONITRILE COMPOSITION .................................................................................... 182 8.3.4 EFFECT OF PH OF TRIS BUFFER.................................................................................................... 185 8.3.5 EFFECT OF TRIS CONCENTRATION ............................................................................................... 185 8.3.6 EFFECT OF TEMPERATURE............................................................................................................ 188 8.3.7 EFFECT OF INJECTED PLUG WIDTH............................................................................................... 188 8.3.8 REPEATABILITY ............................................................................................................................ 192 8.3.9 DETECTION LIMITS ....................................................................................................................... 192 8.4 CONCLUSIONS ............................................................................................................................... 193
9 SEPARATION OF BASIC CENTRAL NERVOUS SYSTEM DRUGS BY CAPILLARY ELECTROCHROMATOGRAPHY .............................................................................................195
9.1 INTRODUCTION ............................................................................................................................. 195 9.2 EXPERIMENTAL ............................................................................................................................ 197 9.2.1 CHEMICALS................................................................................................................................... 197 9.2.2 COLUMNS...................................................................................................................................... 198 9.2.3 INSTRUMENTATION ...................................................................................................................... 199 9.3 RESULTS AND DISCUSSION ........................................................................................................... 199 9.3.1 PRELIMINARY EXPERIMENTS ....................................................................................................... 199 9.3.2 COLUMN AND MOBILE PHASE MODIFIER CHOICE ........................................................................ 201 9.3.3 HYPERSIL C8 MOS....................................................................................................................... 201 9.3.4 HYPERSIL PHENYL........................................................................................................................ 205 9.3.5 REPEATABILITY, INFLUENCE OF VARIABLES AND DETECTION LIMITS ...................................... 208 9.4 CONCLUSIONS ............................................................................................................................... 211
SUMMARY ..........................................................................................................................................213
SAMENVATTING..............................................................................................................................217
DANKWOORD...................................................................................................................................221
CURRICULUM VITAE......................................................................................................................223
BIBLIOGRAPHY................................................................................................................................225


- 1 -
CHAPTER 1 1 INTRODUCTION AND SCOPE
Capillary electrochromatography (CEC) is a separation technique in which the flow of the
mobile phase or buffer is driven through a chromatographic column by an electric field,
rather than by an applied pressure. As a consequence, it is a technique that combines the
separation and selectivity potential of high-performance liquid chromatography (HPLC)
and the high efficiency of capillary electrophoresis (CE), originating from the plug-like flow
profile that is inherent of this latter technique. The origin of the use of an electroosmotic
flow (EOF) in chromatography was already suggested in 1939 by Strain [1] using a
combination of electrophoretic and chromatographic adsorption methods for the
separation of a number of organic dyes on Tswett adsorption columns [2]. However, this
suggestion has not developed any further until 1974 when Pretorius and co-workers [3]
applied this concept for the use of an electroosmosic flow in liquid chromatography. At the
beginning of 1980s, technical developments in the field of the manufacturing capillaries
pushed electroseparation techniques forward for practical laboratory use. In spite of the
promising and interesting perspectives of CEC, until now a number of fundamental
questions have only been partly answered. In addition to that, especially the behaviour of
both stationary and mobile phases, as well as solutes under applied high-voltage conditions,
are major fundamental questions in CEC. Obviously, a knowledge of such behaviour is
important for the prediction and/or optimization of separations, method development and
also the transfer of separation protocols from related, well-established techniques such as
HPLC, to CEC. Moreover, too few convincing applications have been shown to justify the
wide spread introduction of CEC as a sound routine analysis technique. This Ph.D. thesis is
devoted to the study of the chromatographic / electrophoretic behaviour of mainly
reversed-phase (RP) stationary phases and eluents under pressure-driven (viz. HPLC) and

- 2 - Chapter 1
electro-driven (viz. CEC) conditions with special attention on the chromatographic
element.
Chapter 2 reviews the current status of CEC with a focus on the behaviour of stationary
and mobile phases under CEC conditions compared to the behaviour under HPLC
conditions. In this chapter, a number of applications is presented, too.
Chapter 3 studies the chromatographic properties such as the retention factor, silanol
activity and hydrophobicity of seven different RP stationary phases using different portions
of the organic modifier, acetonitrile or methanol in an aqueous solvent buffer. Applying a
number of testing methods, the differences in behaviour of the stationary phases under
CEC and HPLC conditions are demonstrated.
Chapter 4 further explores the chromatographic properties of RP stationary phases under
CEC conditions using different buffers and/or buffer compositions. Depending on the
type of buffer applied, substantial differences in the behaviour of the stationary phases
under CEC and HPLC conditions were observed.
Chapter 5 concentrates on the characterization of a new type of stationary phases viz.
monolithic polymers under CEC conditions. In this study it is demonstrated that under
CEC conditions this new type of stationary phase possesses attractive properties such as
high polarity and the presence of unique pores.
Chapter 6 applies quantitative structure retention relationship (QSRR) methods as a tool for
learning more about the separation mechanism under CEC conditions. It is shown that
QSRRs are capable of distinguishing between CEC and HPLC separation mechanisms.
Chapter 7 is devoted to the thermodynamic background of the separation of specific
analytes under CEC and HPLC conditions. Analyzing Van’t Hoff plots, differences in
separation mechanisms between CEC and HPLC modes are shown.
Chapters 8 and 9 demonstrate the systematic development of methods in CEC. In these
two studies the separations of steroid hormones and central nervous system drugs were
optimized.

- 3 -
REFERENCES
1. H.H. Strain, J. Am. Chem. Soc., 61 (1939) 1292.
2. M. Tswett, Ber. Dtsch. Bot. Ges., 24 (1906) 384.
3. V. Pretorius, B.J. Hopkins, J.D. Schieke, J. Chromatogr., 99 (1974) 23.

- 4 - Chapter 1

- 5 -
CHAPTER 2 2 STATIONARY AND MOBILE PHASES IN CAPILLARY
ELECTROCHROMATOGRAPHY
Summary
This review paper describes the state-of-the-art of capillary electrochromatography (CEC).
Properties of and interactions between stationary and mobile phases applied in CEC are
described and discussed; developments in stationary phases are reviewed. Special attention
is paid to the comparison of the behaviour of stationary and/or mobile phases under CEC
versus HPLC conditions with respect to variables such as particle and pore size of the
stationary phase, mobile phase composition, and temperature. These issues are discussed
throughout the paper. A number of applications in CEC is presented as well.
2.1 Introduction Capillary electrochromatography (CEC) is a chromatographic technique in which the
mobile phase is driven through the chromatographic bed by electroosmosis rather than by
pressure as applied in liquid chromatography (LC). In 1974 Pretorius [1] reported the use of
electroosmosis as a new concept for high-speed LC, making many research groups focus
their attention on CEC. The role of stationary phases, mobile phases and solutes
determining chrom atographic properties of CEC systems has been intensively investigated
over the past two decades. These efforts have resulted in new perspectives for this
This chapter has been submitted for publication in Journal of Separation Science.

- 6 - Chapter 2
technique and brought challenging solutions for many application problems. This review
provides a thorough overview of stationary and mobile phases for CEC, as well as in a view
on its relationship to the pressure-driven chromatographic technique. The influence of the
type of the stationary phase, mobile phase composition, applied voltage, and temperature
are discussed, together with questions about and possible answers to the chromatographic
relationship between CEC and HPLC. The chromatographic parameters of solutes such as
retention factor, selectivity, and efficiency, and the behaviour of the electroosmotic flow
and its influence on the separation properties are emphasized, too. A number of reports of
a fundamental nature [2-25], related to the status of CEC columns, column technology and
stationary phases [26-39] as well as application oriented articles [39-50, 415-416] have
shown a rapid development of this technique. Finally, approaches to new CEC stationary
phases, their future prospects and characteristics are discussed too.
2.2 Electroosmotic flow Electroosmotic flow (EOF) is the bulk flow of liquid in a capillary and is a consequence of
the surface charge on the interior capillary wall [51]. Obviously, stationary phases in CEC
possessing a much higher surface area than an interior capillary wall, are major contributors
to EOF in CEC too [52-56]. Such a charge originates from the ionization of the surface
silanols or any other ionizable groups, or from the adsorption of ionic species on the
surface. A double layer of electric charge is then formed by counter ions built-up on the
surface, which maintain the balance between the solution and surface charge. The voltage
drop between the charged surface and the counter ions at the plane of shear is known as
the zeta potential (ζ). Upon the application of voltage along a capillary, solvated cations or
anions in the diffuse layer migrate toward the cathode or anode (depending on the surface
charge), dragging the solvent molecules with them. The velocity of the movement (EOF) is
described by the equation below [57]:
η
ζεε Ev rEOF
0= (2.1)
where ε0 is the permittivity in vacuum, εr the relative permittivity, ζ the zeta potential, E the
applied electric field and η the solvent viscosity. The flow profile differs from the parabolic

Stationary and Mobile Phases in CEC - 7 -
flow in HPLC and was thoroughly studied already in 1965 by Rice et al. [58]. These authors
predicted that vEOF is nearly plug-like if the capillary (channel) diameter d>>δ is where δ is
the double layer thickness. Further calculations on this subject were performed by Knox
and Grant [59, 60] resulting in acceptable prediction values for the EOF in capillary tubes.
The influence of the thickness and the channel (pore) diameter on the chromatographic
performance will be discussed in detail in Section 2.3. Generally, the zeta potential, double
layer thickness and viscosity are parameters strongly influenced by a number of factors,
such as the nature of the surface and surface charge, mobile phase composition and
temperature.
2.3 Stationary Phases in CEC A schematic overview of stationary phases used in CEC is shown in Figure 2.1.
Normal Phases
Example: C8, C18, C30, polymeric phases
Conventional
Example: CEC Hypersil C18
Phases with Enhacened EOF
Example: Cation- or Anion-exchangers
Phases with Charged Groups
Example: fluorocarbon coated; chiral stationary phases: β-CD bonded, cholesteryl, vancomycin bonded
Special Phases
Reversed Phases
Silica Based
Acrylamide Gels
Polymethacrylates
Cellulose based
PEEK based
Organic Polymer Based
Stationary Phases in CEC
Figure 2.1
Overview of stationary phases used in CEC.

- 8 - Chapter 2
As can be seen, a variety of stationary phases is applied in CEC to investigate fundamental
problems in CEC and solve application problems. At the start of CEC, an attempt was
made to use conventional HPLC phases as stationary phases in CEC. However, this
approach failed in a number of cases because particular stationary phases were unable to
generate a substantial or stable EOF under the applied mobile phase composition. This
resulted in the development of new generations of stationary phases for CEC, where
advanced silanization procedures substantially reduced the number of free silanols needed
to generate EOF. A number of manufacturers and scientists attempted to develop
stationary phases that are more suitable for CEC. This included higher and more stable
EOF, column performance and column preparation. The following sections provide a
detailed overview of the stationary phases used in CEC.
2.3.1 Normal Phases Normal phases are by definition stationary phases that are more polar compared to the
apolar mobile phase. As in HPLC, also in CEC the number of applications under normal
phases conditions is limited. Lai and Dabek-Zlotorzynska [61] used normal phase CEC
mode to separate caffeine, theophylline and theobromine on silica using acetonitrile/Tris,
isopropanol/hexane/Tris and acetonitrile/isopropanol/hexane/ammonium acetate mobile
phases with an efficiency up to 63,000 plates/m. Bare silica has also been successfully used
in the separation of basic compounds.
Wei et al. [62] separated strong bases such as berberine and jatrorrhizine using ACN/Tris
mobile phase (Figure 2.2). The authors discussed the contribution of high silanol density of
bare silica, adsorption of counterions and influence of organic modifier properties (ε/η) to
the EOF. The effect of ionic strength (k vs. 1/csalt) and the higher retention of basics at
higher pH suggested an ion-exchange mechanism of separation. Using the same mobile
phase Gillott et al. [63] separated pharmaceutical bases. In spite of high efficiency,
irreproducible retention and splitting peaks were found. The use of competing bases such
as triethanolamine (TEA)-phosphate and TEA-trifluoroacetate may overcome these
problems. Under such conditions, acids, bases and neutrals can be simultaneously
separated.

Stationary and Mobile Phases in CEC - 9 -
Maruška et al. [65] used columns packed with Polygosil 100-10 silica (Macherey-Nagel
GmbH) using pure ACN, MeOH and MeOH / EtOH / hexane mobile phases to separate
non-polar to very polar compounds.
Figure 2.2
Electrochromatogram of the separation of seven basic drugs on a Micra silica stationary
phase. Experimental conditions: packed column, 27 cm (20 cm effective length) × 75 µm
I.D. (internal diameter); packing: silica dp=3 µm; mobile phase: CH3CN-10 mM TRIS-HCl
buffer (pH 8.29) (80/20, V/V). Solutes: 1, aniline; 2, cocaine hydrochloride; 3, berberine
hydrochloride; 4, thebaine; 5, jatrorrhizine hydrochloride; 6, ephedrine hydrochloride; 7,
codeine phosphate.
The authors used octadecylated cellulose, revealing normal and reversed-phase properties
depending on the solvents used. Furthermore, Grom-Sil silica (Grom Analytik+HPLC
GmbH) has used in fritless CEC experiments [66] or in experiments with on-line coupled
NMR [67]. Nucleosil silicas (Macherey-Nagel GmbH) with pore diameters of different
porosities were extensively investigated by a number of groups [68, 69, 400] to study the
fundamentals of CEC. The group of Venema [68, 400] studied pore-flow effects by size
exclusion electrochromatography using predominantly DMF (dimethylformamide)/LiBr
(lithium bromide) as a mobile phase. This group found significant pore flow under CEC
conditions (Figure 2.3).

- 10 - Chapter 2
Figure 2.3
Retention of polystyrene standards with A) Nucleosil 5 µm, 500 Å and B) Nucleosil 5 µm,
100 Å. Signs: A) Q: Pressure drive; ×: electro drive, mobile phase: DMF/0.1 mmol.L-1 LiBr;
∆: electro drive, mobile phase: DMF/0.5 mmol.L-1 LiBr; ◊: electro drive, mobile phase:
DMF/1 mmol.L-1 LiBr; field strength: 10 kV. Signs B) Q: Pressure drive; ×: electro drive,
mobile phase DMF/1 mmol.L-1 LiBr; ∆: electro drive, mobile phase: DMF/10 mmol.L-1
LiBr; ◊: electro drive, mobile phase: DMF/20 mmol.L-1 LiBr; field strength: 10 kV; τ,
exclusion coefficient; Log M, logarithm of polymer concentration.
Such pore flow increases intraparticle mass transfer and thus produces higher efficiencies
than can been achieved in LC. However, the disadvantage of a large pore flow is the
resulting smaller retention window under the size-exclusion condition. This can be
overcome by using stationary phases with smaller pores and is also more easily controlled
A)
B)
Stationary and Mobile Phases in CEC - 11 -
via the ionic strength of the eluent. Increasing the ionic strength causes larger pore flow,
and at low ionic strengths double layer overlap results in a decrease in the pore flow. A
comparison of through-pore flows for the Nucleosil silicas of 100 Å and 500 Å and mobile
phase strengths ranging from 0.1 mmol.L-1 of LiBr up to 20 mmol.L-1 of LiBr is given in
Figure 2.3.
In the same way Stol et al. [69, 70] characterized size exclusion systems in CEC on
LiChrosorb Si silica and Nucleosil silica using DMF/LiCl as the mobile phase. For the
prediction of the separation results the authors used two models describing the channel
system, parallel cylindrical channel with different diameters and cylindrical channels with
different diameters in series. They successfully predicted pore flow and exclusion limits
using these two models (Figure 2.4). Pressure and electro-driven flow has also been studied
by Witowski and Kennedy [71] with respect to fast chromatography. It has been shown for
both non-porous ODS and bare silica that efficiencies up to 370,000 plates/m can be
achieved in pressure-driven mode and from 670,000 to 1,000,000 plates/m in electro-driven
mode. Ye et al. [73] used bare silica dynamically coated with cetyltrimethylammonium
bromide (CTAB). A successful separation of anilines and peptides could be achieved. It is
also worth mentioning that due to a change in the amounts of adsorbed CTAB, non-linear
log k versus percentage of methanol was found in this particular case. Wei et al. [64] used
bare silica dynamically coated with hydroxypropyl-β-cyclodextrin (hydroxypropyl-β-CD). In
that paper, where CE was compared with CEC, it was found out that hydroxypropyl-β-CD
is adsorbed on bare silica resulting in a cation-exchange mechanism. This was obvious from
the resolution dependence on pH, ionic strength and an organic modifier (MeOH).

- 12 - Chapter 2
Figure 2.4
Relative retention of polystyrene standards in an electrically driven system on Lichrosorb
Si-100 silica stationary phase. (●): experimental values; (─): predictions with the parallel (a)
and series (b) models; (---): prediction for a pressure driven system. Mobile phase: (A)
DMF/1 mM LiCl; (B) DMF / 10 mM LiCl; τ, exclusion coefficient.

Stationary and Mobile Phases in CEC - 13 -
2.3.2 Reversed Phases
2.3.2.1 Conventional Reversed-phase Stationary Phases Due to the availability of many HPLC reversed-phase stationary phases, an obvious trend in
using these phases can be seen throughout the history of CEC. Moreover, the use of
conventional, non-endcapped stationary phases with high silanol activity is advantageous
since such phases provide a sufficient and stable EOF. A complete list of stationary phases
and references are listed in Table 2.1.
Table 2.1 Reversed-phase stationary phases applied in CEC.
Manufacturer Name/type of the reversed
phase
References
Hypersil C18
(incl. CEC phases)
52, 59, 60, 66, 74-132, 406-408, 417
Hypersil C8 78, 80-81, 83-85, 90, 93, 101, 133-
136
Hypersil ThermoQuest
Hypersil Phenyl 78, 81, 93, 95, 101, 133, 137
Spherisorb ODS (type I, II) 54, 81, 85, 98, 100-101, 117, 124,
130, 133, 138-161, 390, 407, 409-
410, 417
Waters
SymmetryShield 144
Macherey-Nagel Nucleosil (C18 and C8) 124, 126, 162-179. 398 (entrapped
in polymethacrylate)
NPS 61, 71, 101, 143-148, 180-189, 390 Micra Scientific
Synchropack 208
Merck LiChrosper, Purospher,
Monospher, Chromspher
60, 74, 95, 124, 163, 190-194, 239-
240, 411
Grom GromSil ODS 66-67, 106, 195-203

- 14 - Chapter 2
Table 2.1 continued Manufacturer Name/type of the reversed
phase
References
Nomura Chemical Co. Devosil 144, 153, 204, 205, 401
Jones Chromatography Apex ODS 209
SynChrom SynChrom 206-207
Hamilton Hamilton 164
Agilent Technologies Zorbax (ODS, C8) 124, 132, 150, 210-219
Vydac Vydac 220-223
C18 131, 226-235
C8 131
Unimicro
Phenyl 131, 236
Whatman Partisil 72, 124, 187
Yamamura Chemical
Company
YMC (ODS, C30) 60 (home made ODS), 173, 175,
237-238
VDS Optilab OptiLabSpher 163
Rainin Rainin ODS 265, 392
Shisedo Capcell 120SG ODS 385, 397
Organosilica Organosilica 224-225
Home made or non-
specified
- 60, 114, 180, 241-244, 264, 395
Continuous bed - 245-255, 379, 386
Open tubular (OT) and
etched
- 256-263, 378, 396, 399

Stationary and Mobile Phases in CEC - 15 -
This broad spectrum of reversed-phase stationary phases has been applied in numerous
applications and fundamental studies. Several important application areas can be
distinguished:
A) neutrals, acids, bases – standards
B) pharmaceuticals – antibiotics, barbiturates, steroids
C) environmentals
D) biomolecules – amino acids, peptides and proteins, saccharides.
In more fundamentally oriented research projects, basic questions about the behaviour of
stationary and mobile phases, and separation mechanisms, have been the focus of intensive
studies. Extensive studies on chromatographic behaviour in terms of retention, selectivity
and column stability were performed by Dittman et al. [52, 82-83, 315]. Typically, as in
HPLC, these authors found different selectivities for different reversed-phase stationary
phases under CEC conditions; similar observations were made for different organic
modifiers. Within the tested set of columns, a different EOF is generated. The highest EOF
observed by these authors was for the CEC Hypersil C18 stationary phase (Figure 2.5) and
Spherisorb C6/SCX (strong cation exchanger) stationary phase. This group also studied the
ratio of ε/η and its relationship to EOF. The inconsistency in this relationship is caused by
a change in the surface charge density and the adsorption of the ions on the surface,
resulting in changes in the double layer properties. Zimina et al. [124] suggested that the
EOF velocity is proportional to the surface area, so that stationary phases with larger
surface areas generate higher EOF unless deactivated (Figure 2.6). An example of a
deactivated RP LC stationary phase is BDS Hypersil ODS stationary phase. The
immobilization of the stationary phase in a column by heating techniques, for example, is
another major concern in CEC. Different selectivities and EOF velocities were observed by
Adam et al. [100] after the immobilization of a specific stationary phase in a similar set of
columns using a heating technique. Here, the stationary phase is immobilized by a heated
wire moving along the column, resulting in a satisfactory mechanical stability of the column.
The authors are aware of possible extensive heating of the column and an eventual loss of
hydrocarbonaceous chains from the RPLC-phase. This problem also is characteristic of the
majority of frit (in and/or outlet) preparation techniques. In addition, loss of

- 16 - Chapter 2
hydrocarbonaceous chains from frits prepared by fusing the stationary phase may cause
extra peak broadening and/or tailing due to adsorption. After frit preparation by fusing, the
groups of Carney [146], Behnke [200] and Chen [265] redeactivated frits again using
different agents such as chloro-dimethyloctadecylsilane or diphenyltetramethyldisilazane. As
a result, an improved baseline, less spikes and a significant reduction of adsorption of
dansyl-leucine derivative were observed. Obviously, this is related to the exposure of
silanols to the analytes causing unwanted interactions.
Figure 2.5
Separation of PAHs on five reversed-phase C18 stationary phases. Column 250(335) mm ×
0.1 mm, 3 µm, mobile phase: acetonitrile-50 mM Tris-HCl, pH 8 (80/20, V/V), voltage:
20 kV, temperature: 20°C, 10 bar pressure applied to both ends of capillary, 20°C. Samples
injected were not identical for depicted stationary phases but all contained thiourea (1),
naphthalene (2), and fluoranthene (3).
Lurie et al. [135] analyzed basic compounds on the CEC Hypersil C18 stationary phase
using 0.2% hexylamine as a mobile phase additive. Such additives adsorb on surface silanols
and consequently unwanted interactions between components and the silanol groups are
limited. A similar approach was also applied to Hypersil and Waters stationary phases by
Dittmann et al. [85] and Hilhorst et al. [417].

Stationary and Mobile Phases in CEC - 17 -
Figure 2.6
Relationship between electroosmotic flow and reported surface areas of stationary phases.
Stationary phases: Nucleosil 5 C18, LiChrospher RP-18, Spherisorb Diol, Zorbax BP ODS,
Spherisorb S5 ODS2, Hypersil ODS, mobile phase: acetonitrile-50 mM CAPSO buffer
pH 9.53 (70/30, V/V), EOF marker: thiourea.
Rue et al. [226] used pressurized gradient CEC for the analysis of eighteen amino-acid
derivatives on a Unimicro C18 stationary phase. With increasing voltage the resolution
increased, however, peaks disappeared at high voltage. The authors suggested that this was
due to adsorption of the components at the stationary phase. The same group investigated
the behaviour of the Unimicro C18 stationary phase under pressurized CEC using forward
and reversed pressure. In both cases, they found that the EOF was the dominant mobile
phase driving force. Eimer et al. [136] found that retention factors of hydrophobic analytes
were 36-40% lower in pressurized CEC compared to HPLC. They explained this by the
higher polarity of the stationary phase under the applied voltage (Figure 2.7).

- 18 - Chapter 2
Figure 2.7
Change of selectivity in capillary LC due to the voltage applied before a run (15 kV for 20
min). (1) Ethosuccinimide, (2) phenytoin, (3) pyrimidone, (4) carbamazepine-10,11-diol,
(5) carbamazepine-10,11-epoxid, (6) carbamazepine. Column: 100 mm × 0.1 mm
Spherisorb ODS-1, total length 260 mm, mobile phase: methanol-5 mM tetraborate buffer
pH 8.5 (60/40, V/V), voltage: -12 kV.
Furthermore, Ishizuka et al. [404] found lower k values of alkylbenzenes and aromatic
hydrocarbons on octadecylated silica rods (Figure 2.8) under CEC condition compared to

Stationary and Mobile Phases in CEC - 19 -
HPLC. The same authors found a smaller effect of k-values on the plate height in CEC
compared to HPLC.
Figure 2.8
Chromatograms obtained for alkylbenzenes (C6H5(CH2)nH, n = 0-6 (a, c)) and polyaromatic
hydrocarbons (b, d)) in pressure-driven (HPLC (a, b)) and electro-driven (CEC (c, d))
elution. Stationary phase: continuous macroporous silica gel (reversed-phase), mobile phase:
(a, b) 80% acetonitrile; (c, d) acetonitrile-Tris-HCl, 50 mM, pH 8 (80/20, V/V). Pressure:
(a, b) 0.9 kg/cm2. Applied voltage: (c, d) 750 V/cm.
The differences in the velocity along the streamlines of the EOF in the various parts of the
through-pores due to the plug-type flow profiles are claimed to be responsible for that
phenomenon. In addition, Jiskra et al. [131] also observed that the chromatographic
characteristics are dependent on whether a column is operated under HPLC or CEC
conditions. In that paper, linear relationships of log k versus percentage of methanol and
acetonitrile on a Unimicro C8 stationary phase for benzene as the test component were
presented and discussed (see Figure 3.4 in Chapter 3). Moreover, slopes of log k vs.
percentage of acetonitrile for both separation modes, HPLC and CEC, were significantly
different (Figure 3.4 A in Chapter 3). In addition to that, for methanol as the organic
modifier, different values of log kw (retention factor extrapolated to pure water as the
mobile phase) were found too for these two separation modes (Figure 3.4B in Chapter 3).
- 20 - Chapter 2
Moffat et al. [105] the studied analysis of pesticides by CEC and HPLC and found a non-
linear relationship of ln k vs. percentage of acetonitrile. However, CEC and HPLC analysis
profiles and retention factors were almost identical. Asiaie et al. [255] found linear
relationships for log k vs. percentage of acetonitrile for benzyl alcohol and benzaldehyde,
and the differences between CEC and HPLC were negligible. Jinno et al. [220] used
cholesteryl stationary phase and a Vydac C18 stationary phase in the analysis of
benzodiazepines; the authors assume the same chromatographic properties for both
stationary phases. In that study, plots of kCEC vs. kLC proved to be linear with the exception
of two compounds, cloxazolam and medazepam, for which a nonlinear kCEC vs. kLC
relationship was observed. Wen et al. [210] studied the dynamics of CEC and found a linear
correlation of retention factors under CEC and HPLC conditions on a Zorbax ODS, a
Spherisorb stationary phase (ODS and SCX) and also on a gigaporous polystyrene-
divinylbenzene (PS-DVB) column. These authors confirmed the existence of an
intraparticle flow under CEC conditions. In addition, these authors also studied and
compared parameters for the Van Deemter equation under pressure and electro-driven
conditions. Figure 2.9A outlines the A-term, representing the eddy diffusion under HPLC
and CEC conditions. Three phases were compared, a Spherisorb ODS 300 Å, a Spherisorb
SCX 300 Å and a polystyrene-divinylbenzene stationary phase PL-SCX 1000 Å (Polymer
Labs, Church Stretton, UK). In all these cases, A-terms were on average two to four times
lower under CEC conditions than for micro-HPLC. In Figure 2.9B, the intraparticle mass
transfer is shown (determining the magnitude of the C-term) under HPLC and CEC
condition. The authors also found linear van ‘t Hoff plots for the components, e.g.
acrylamide, benzaldehyde, naphthalene, biphenyl, fluorene and m-terphenyl, which is typical
for the majority of RP separations. Tang et al. [245] studied CEC monolithic columns where
particles of specific reversed-phase stationary phases (Spherisorb ODS1 and Nucleosil C18
1400 Å stationary phases) were entrapped in a continuous bed of silica. These columns
were used for the separation of corticosteroids, alkaloids and aromatic amines. As could be
expected, the high-pore Nucleosil C18 stationary phase exhibited significantly higher
efficiency than the Spherisorb ODS1 (80 Å) stationary phase. Furthermore, Chirica et al.
[169] found that the surface charge on a monolithic (entrapped) column is close to the same
as a conventionally packed (i.e. non-entrapped) column. The increase in the efficiency due
to pore flow was extensively studied by Stol et al. [162, 170] using Nucleosil C18 stationary
phases with different porosities.

Stationary and Mobile Phases in CEC - 21 -
The influence of the pore size and ionic strength on the experimentally obtained
efficiencies are depicted in Figures 2.10 and 2.11. As already mentioned in Section 2.3.1,
higher through-pore flow causes higher mass transfer and thus higher efficiencies. From
Figure 2.10 and 2.11 it can be seen that highest efficiencies occur in large pore stationary
phases and higher ionic strength mobile phases. A similar study was performed by Li et al.
[167] and Seifar et al. [74] on Nucleosil C18 stationary phases with different particle sizes.
Although the efficiency decreased from 3 µm > 5 µm > 7 µm particle sizes, no relationship
between EOF and particle size was found in that study. Banholzer et al. [165] employed the
Smoluchowski equation (Eq. 2.1) on a Nucleosil C18 stationary phase in the study of the
influence of mobile phase composition on behaviour in CEC. They found out that the
maximum velocity of EOF can be reached using the buffer (sodium phosphate)
concentration of 0.4 - 4 mmol.L-1, however, no correlation of the plate number on buffer
concentration could be found. It was concluded that the dependence of the velocity of
EOF on the buffer concentration could not be due to double-layer overlap effects. In
addition, no correlation of ε/η of the mobile phase with the velocity of EOF was found.

- 22 - Chapter 2
Figure 2.9
(A) Plots of parameter A against the buffer concentration in the µ-HPLC mode (∆) and the
CEC mode (○). Columns, (a) 21/29 cm×50 µm capillaries packed with 5 µm Spherisorb
ODS 300 Å; (b) 26/34 cm×50 µm capillaries packed with 5 µm Spherisorb SCX 300 Å;
(c) 34/42 cm×75 µm capillaries packed with 8 µm PL-SCX 1000 Å; eluents, (a) sodium
phosphate in water-acetonitrile mixture (1:1, V/V), (b-c) sodium-phosphate in water,
pH 7.0. (B) Artist's rendition of intraparticle mass transfer with, (a) viscous flow,
(b) electroosmotic flow. The slowness of mass transfer determines the magnitude of C-
term. In HPLC, transport of solutes is by diffusion only while in CEC, intraparticle EOF
augments transport between the interstitial fluid and the binding sites inside the porous
particles by convection. The circulating patterns inside particle symbolize that even in dead-
end pores EOF can enhance intraparticulate mass transport by convective mixing.
A)
B)

Stationary and Mobile Phases in CEC - 23 -
Figure 2.10
The effect of pore size of the three different stationary phases on the theoretical plate
height (H) of the fluorine peak against linear velocities (U) of the mobile phase. Columns
were approximately 33 cm long (25 cm effective). Mobile phase: acetonitrile-water (80:20,
V/V) containing 10 mmol.L-1 tetraborate, pH 8.3. Stationary phase: Nucleosil C18 7 µm
with porosities: (▲)=500 Å, (■)=1000 Å, (♦)=4000 Å.
Figure 2.11
The effect of tetraborate buffer concentration on the separation efficiency on Nucleosil
4000 7 µm C18. Mobile phase: acetonitrile-water (80/20, V/V) and buffer,
(♦)=0.1 mmol.L-1 tetraborate pH 8.3; (■)=1.0 mmol.L-1; (▲)=10 mmol.L-1.

- 24 - Chapter 2
Tallarek et al. [238, 316] extensively studied flow-field dynamics in pressure and electro-
driven systems and found a significant performance advantage of the electro-driven mode
for both open-tubular and packed capillary systems. These authors found that the dynamic
displacement time in electro-driven systems is significantly shorter than that in pressure-
driven systems (Figures 2.12 A, B).
Figure 2.12
(A) Axial displacement probability distribution, Pav(R,∆), of the fluid molecules near the
surface in a 0.65 m × 250 µm I.D. (360 µm O.D.) fused-silica capillary. (a) Electroosmotic
flow (E=23.1 kV/m, I=49 µA). (b) Pressure-driven flow. Stationary phase: 40 µm
rehydroxylated silica particles, mobile phase, borate buffer (2 × 10⁻³ M, pH 9.0); observation
time, ∆=14.2 ms; ambient temperature, 26±0.5°C.
(B) Reduced axial plate height (ha=Ha/dp) versus the reduced flow velocity (ν=dpuav/Dm) for
the CHPLC (capillary HPLC) and CEC modes.
A)
B)

Stationary and Mobile Phases in CEC - 25 -
Using two different stationary phases, YMC C18 and a Nucleosil C18, Pyell et al. [173]
studied band broadening in CEC using on-column injection and on-column detection. The
authors applied a mathematical peak shape and theoretical peak width mode to study their
relationship to injection plug lengths. A maximum tolerated injection plug length was
predicted:
NU
LLtIeo
T
µ×= 7.0max (2.2)
where L is the column length to the detection window, LT the total column length, µeo the
electroosmotic mobility, UI the injection voltage and N the plate number. Moreover, these
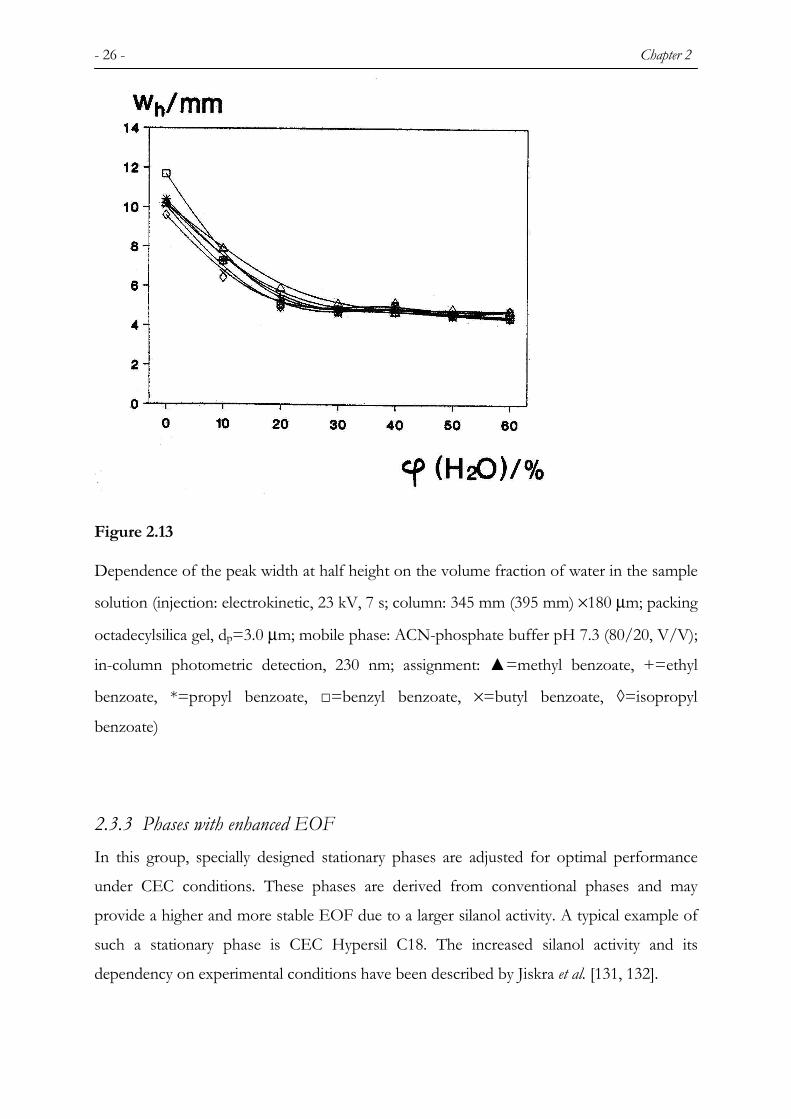
authors found a clear relationship between peak width and sample composition with
respect to the water content therein (Figure 2.13). Such zone sharpening is well known
from capillary electrophoresis. Stevens et al. [72] in 1983 studied flow profiles in CEC on
normal and reversed-phase stationary phases. The accurate flow profile from this reference
is depicted in Figure 2.14.
Extensive studies on retention mechanisms have also been performed by Wei [233] on a
Unimicro C18 stationary phase. The authors evaluated the retention behaviour of solutes
with solvatochromic parameters (LSER) and found the molecular volume (V),
dipolarity/polarizability (π), hydrogen bond acidity (α) and hydrogen bond basicity (β) of
the solute of equal importance in CEC. In contrast, V and β were found to be the most
significant parameters for the retention of solutes in HPLC. In that paper, the possible
distortion of the double layer by a strong electric field in CEC resulting in a different kind
of retention behaviour was discussed as well.
- 26 - Chapter 2
Figure 2.13
Dependence of the peak width at half height on the volume fraction of water in the sample
solution (injection: electrokinetic, 23 kV, 7 s; column: 345 mm (395 mm) ×180 µm; packing
octadecylsilica gel, dp=3.0 µm; mobile phase: ACN-phosphate buffer pH 7.3 (80/20, V/V);
in-column photometric detection, 230 nm; assignment: ▲=methyl benzoate, +=ethyl
benzoate, *=propyl benzoate, □=benzyl benzoate, ×=butyl benzoate, ◊=isopropyl
benzoate)
2.3.3 Phases with enhanced EOF In this group, specially designed stationary phases are adjusted for optimal performance
under CEC conditions. These phases are derived from conventional phases and may
provide a higher and more stable EOF due to a larger silanol activity. A typical example of
such a stationary phase is CEC Hypersil C18. The increased silanol activity and its
dependency on experimental conditions have been described by Jiskra et al. [131, 132].

Stationary and Mobile Phases in CEC - 27 -
Figure 2.14
Accurate representation of the electroosmotic flow velocity profile; δ, thickness of double
layer.
2.3.4 Phases with charged groups This group consists of reversed phases stationary phases that are additionally modified with
charged functional groups either directly on the silica surface or on the hydrocarbonaceous
chains.
2.3.4.1 Strong Cation Exchangers The great advantage of charged stationary phases (both cation and anion exchangers) is the
limited dependency of the EOF on the buffer pH as shown in Figure 2.15 [195]. Cikalo et
al. [268, 269] studied behaviour of the EOF and the field strength in open tubular and
packed capillaries.

- 28 - Chapter 2
Table 2.2 Ion-exchangers, silica based stationary phases applied in CEC.
A)
Manufacturer Name/type of the cation
exchanger (CX) phase
References
Spherisorb SCX (SCX, C3/SCX,
C6/SCX, C18/SCX)
52, 54, 80-81, 83, 100, 101, 139,
147, 149, 151, 158, 267-273,
408
Waters
Symmetry 149
Hypersil ThermoQuest Hypersil SCX, Duet 52, 80, 87, 97, 276
AllTech AllTech SCX 101
BioRad BioRad SCX 104
Tosoh - 389
Xtec Consultants - 161, 274-275
Home made Sulfonated and octadecylated 55, 277, 278, 317, 413
B)
Manufacturer Name/type of anion
exchanger (AX) phase
References
Waters Spherisorb SAX 280, 319
Hypersil ThermoQuest Hypersil SAX 87, 97
AllTech AllTech SAX 281
Xtec Consultants - 161, 275, 388
Home made +monolithic - 56, 282-286

Stationary and Mobile Phases in CEC - 29 -
Figure 2.15
Plots of electroosmotic flow versus mobile phase pH for sol-gel bonded continuous bed
columns. Conditions - column: 25/34 cm × 75 µm I.D. continuous bed columns
containing sol-gel bonded (□) 3 µm, 80 Å ODS1, and (∆) 3 µm, 80 Å ODS/SCX; mobile
phase: ACN/H2O/50 mM phosphate buffer (70/25:5, V/V/V); injection: 5 kV × 2 s;
applied voltage: 30 kV; EOF marker: 0.3 mM thiourea.
The contribution of the packing to the EOF is shown in Figure 2.16. The authors also
studied the field strength in the packed and open section of the capillary using different
portions of packed sections of a Spherisorb SCX stationary phase. They found that the field
strength remained similar at moderate eluent pH. For extreme eluent pH-value, however,
field strengths were larger. Differences in EOF along the capillary may explain bubble
formation in some CEC systems. Smith et al. [149] studied the contribution of charged
packing to the EOF and found that the contribution of walls to the EOF to be minor. This
finding is in agreement with results of Dittmann et al. [52]. Hilder et al. [87] prepared frits in
open tubular (OT) capillaries from ODS, SCX and SAX packing materials and found
increased EOF values for OT+frit compared to OT columns alone. The highest EOF was
achieved for SCX packing materials.

- 30 - Chapter 2
Figure 2.16
Effect of length of SCX packed bed on the EOF at pH 10.5 (●), 7.5 (□) and 2.9 (▲). µEOF
values calculated using the assumption that the voltage drop is (a) over the total length of
capillary and (b) over the packed section only. Conditions – column: 25/33 effective/total
length, 100 µm I.D. packed with Spherisorb SCX dp=3 µm; mobile phase: acetonitrile- 10
mM buffer (carbonate, phosphate or KCl-HCl) different pH (80/20, V/V); EOF marker:
thiourea; applied voltage: 10 kV.
Zhang et al. [55, 277, 278, 317] investigated sulfonated octadecylated silica. Strong and
constant EOF values over a wide range of pH were observed (Figure 2.17).

Stationary and Mobile Phases in CEC - 31 -
Figure 2.17
Effect of the pH of the mobile phase on the EOF. Conditions – column: 20.5 cm/27 cm
effective/total length, 100 µm I.D. packed with 10 µm particles of octadecyl, ODS (1),
octadecylsulfonated, ODSS (2) and sulfonated-ODSS (3) silica stationary phase; mobile
phase: ACN/1.25 mM sodium phosphate (75/25, V/V); applied voltage: 20 kV; EOF
marker: thiourea.
In addition to that, different elution patterns due to the permanently charged sublayer of
sulfonated hydrocarbonaceous chains were found (Figure 2.18) too. The authors discussed
three retention models:
1) Ion-pair
2) Dynamic ion exchange
3) Dynamic complex exchange
The authors concluded that the last model could best reproduce experimental observations.
Similarly, a strong cation exchanger on a silica support with polymeric layers carrying
sulfonic moieties was used by Wei [279] for the analysis of compounds containing nitrogen
(berberine, palmitine and jatrorrhizine). Good efficiencies and reproducibilities were
obtained but some analyte peaks showed significant tailing.
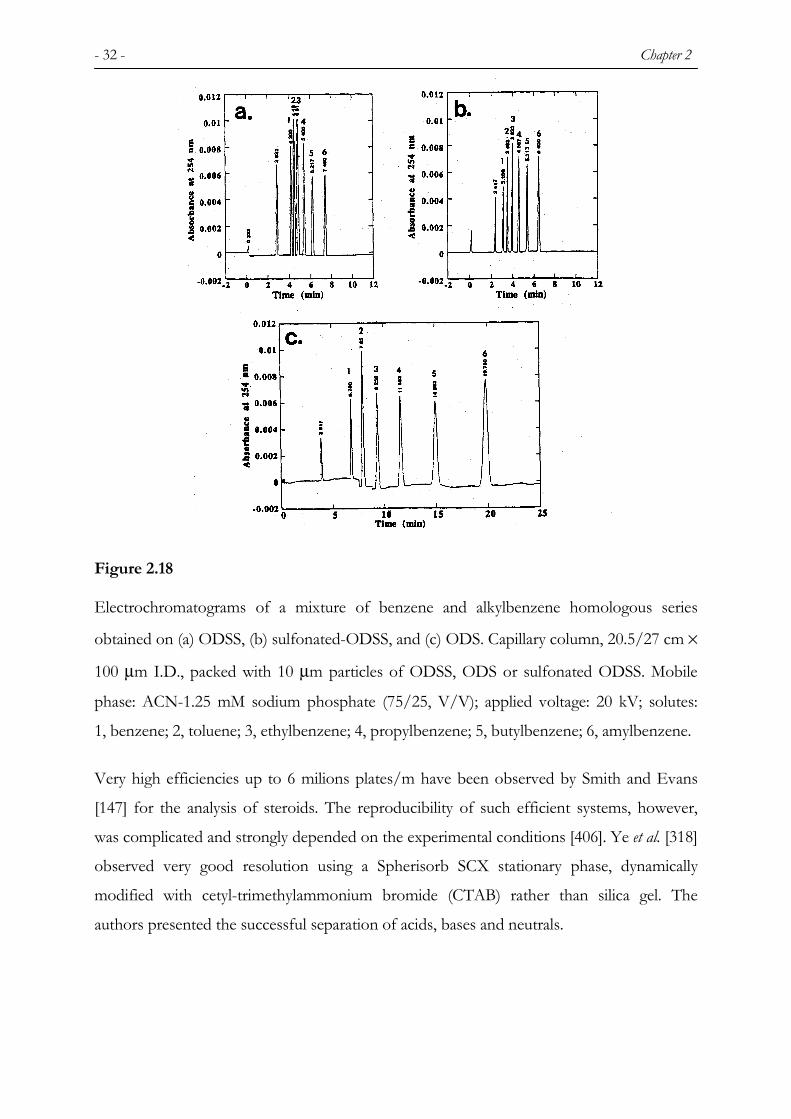
- 32 - Chapter 2
Figure 2.18
Electrochromatograms of a mixture of benzene and alkylbenzene homologous series
obtained on (a) ODSS, (b) sulfonated-ODSS, and (c) ODS. Capillary column, 20.5/27 cm ×
100 µm I.D., packed with 10 µm particles of ODSS, ODS or sulfonated ODSS. Mobile
phase: ACN-1.25 mM sodium phosphate (75/25, V/V); applied voltage: 20 kV; solutes:
1, benzene; 2, toluene; 3, ethylbenzene; 4, propylbenzene; 5, butylbenzene; 6, amylbenzene.
Very high efficiencies up to 6 milions plates/m have been observed by Smith and Evans
[147] for the analysis of steroids. The reproducibility of such efficient systems, however,
was complicated and strongly depended on the experimental conditions [406]. Ye et al. [318]
observed very good resolution using a Spherisorb SCX stationary phase, dynamically
modified with cetyl-trimethylammonium bromide (CTAB) rather than silica gel. The
authors presented the successful separation of acids, bases and neutrals.

Stationary and Mobile Phases in CEC - 33 -
2.3.4.2 Anion Exchangers A list of commonly applied anion exchangers can be found is in Table 2.2. Strong anion
exchanger stationary phases usually show a stable EOF from pH 2 to pH 6-8. As already
mentioned in the previous section, strong anion exchangers are used in most of the
investigations.
Figure 2.19
(A) The effect of buffer pH on the linear velocity of the EOF in 3 µm Waters Spherisorb
SAX packed columns, measured using thiourea and uracil. Conditions: Duplex column (●).
Mobile phase: acetonitrile-20 mM buffer (pH variable) (50/50, V/V). Applied voltage: -
20 kV. Column dimensions: 220 mm ×100 µm I.D. (total length 305 mm). Fully packed
column (■). Mobile phase: acetonitrile-20 mM ammonium acetate buffer (pH variable)
(50/50, V/V). Applied voltage: -20 kV. Column dimensions: 220 mm × 100 µm I.D. (total
column length 220 mm). (B) The effect of pH on linear velocity in untreated fused-silica,
PVA and amine coated capillary packed with 3 µm Waters Spherisorb SAX material.
Conditions: mobile phase: acetonitrile-20 mM sodium dihydrogenphosphate pH 2.5
(50/50, V/V). Applied voltage –25 kV. Injection –5 kV for 5 s. Column dimensions:
220 mm × 100 µm I.D. (total column length 320 mm)
A) B)

- 34 - Chapter 2
Byrne et al. [319] did a detailed study of the contribution of the capillary wall and stationary
phase to the EOF using a Spherisorb SAX stationary phase. The columns under study were
either fully or partially (viz. duplex) packed. The results are shown in Figure 2.19A. From
their data the influence of the open part of the column on the EOF is obvious. The wall
contribution was also compared for columns with the internal wall chemically derived by
amino groups or covered with polyvinylalcohol (PVA). For the sake of comparison, in
Figure 2.19B the results for a normal capillary is shown as a reference. Clearly, in this
experimental framework, the contribution of the capillary wall to the EOF is substantial.
The capillary coated with PVA showed nearly no EOF dependency on pH. The reverse is
true for the capillary coated with amine or for the normal, untreated capillary. However,
Scherer et al. [282] found that negative charges in an open tube part do not significantly
influence the EOF (Figure 2.20).
Figure 2.20
Influence of the capillary wall charges on the mobility of the EOF. Conditions – columns:
100 µm I.D. packed with TAM2 and TAMS3 connected to 50 µm I.D. detection capillaries
of different lengths; mobile phase: ACN-water-20 mM Tris pH 7 (70/20/10, V/V/V);
voltage: -25 kV; injection: -3 kV, 3 s; detection: UV, 210 nm; inert marker: thiourea.
Similarly, as also discussed in the previous section, anion exchange materials can be
dynamically coated. Ye et al. [320] used sulfonated β-cyclodextrins for the separation of
enantiomers of alkaloids and some important pharmaceuticals (Figure 2.21).

Stationary and Mobile Phases in CEC - 35 -
Figure 2.21
Chiral separation of tryptophan, atropine and verapamil in a single run by strong anion
exchanger-CEC dynamically modified with sulfated-β-cyclodextrin. Conditions: stationary
phase: Spherisorb SAX, dp=5 µm; applied voltage, 15 kV; mobile phase: methanol-2
mg/mL sulfated-β-cyclodextrin in 20 mM acetic acid-triethanolamine buffer (pH 4.0)
(30/70, V/V). Solutes: (1) L-tryptophan, (2) D-tryptophan, (3) and (4) atropine, (5) and (6)
verapamil.

- 36 - Chapter 2
2.3.5 Chiral and Special Stationary Phases Table 2.3 Chiral and other, silica based stationary phases applied in CEC.
Type Name/type of the phase References
Vancomycin bonded 287-290, 377
β-Cyclodextrin bonded 293-300, 391, 417
Quinine bonded 179, 292
Teicoplanin bonded 301
Cellulose derivative 302-304, 314
Amino acid bonded 304-305
Chiral polymer bonded 306-307
Naproxen bonded, Whelk-O 308, 381
Chiral stationary
phases (CSP)
Cholesteryl 220
Antibody 380
Fluorinated 309
Polymer coated 310-312
Special Purpose
Ionenene coated 313
Obviously, many tailor-made stationary phases include chiral stationary phases with a
physically or chemically bonded chiral selector. The combination of high efficiency and
enantioselectivity in CEC is very promising for this type of separations. However, the
preparation of a chiral stationary phase, the experimental conditions and the equilibration
of a column are difficult in many cases. Therefore, a number of authors use an
enantioselector in the mobile phase, rather than covalently bonded on the stationary phase.
Moreover, the most common solvent, acetonitrile, cannot be used in enantioseparation due
to the loss in enantioselectivity. Often methanol is used instead. However, Krause et al.
[304] reported better resolution of enantiomers on cellulose CSP using acetonitrile as an
organic modifier (Figure 2.22). In addition, the poor coverage of that stationary phase

Stationary and Mobile Phases in CEC - 37 -
results in high adsorption behaviour, which is close to that for normal phases. In some
cases, however, LC provides better separation.
Figure 2.22
CEC enantioseparation of bendroflumethazide in a Chiraspher®-packed capillary using (a)
methanol/50 mM NaH2PO4, pH 8.0 (60/40,V/V) and (b) acetonitrile/50 mM NaH2PO4,
pH 8.0 (40:60, V/V). Applied voltage: (a) 20 kV, (b) 12.5 kV; applied pressure: 10 bar on
inlet and outlet vial.
Otsuka et al. [303] found differences in the enantioseparation of propranolol under CEC
and HPLC modes using silica gel coated with cellulose-tris(3,5-dimethylphenylcarbamate).
These changes, however, can be associated to differences in the silica supports used.
Meyring et al. [418] used different polysaccharide types of stationary phases in non-aqueous
µ-LC and CEC in the separation of thalidomide and its hydroxylated derivatives. In CEC,
however, the baseline separation of six components could not be achieved. Lämmerhoffer
[179, 292] immobilized quinine derivative on different silica supports (Kromasil, Hypersil,

- 38 - Chapter 2
Micra NPS) and found different EOF and its dependency on the pH (Figure 2.23).
Figure 2.23
Influence of mobile phase pH (apparent pH, pHa) on electroosmotic mobility (µeo) on weak
anion echanger (WAX) type CSPs A-C. For sake of comparison also the EOF
characteristics of a reversed-phase type CEC capillary column are depicted in the plot. CEC
conditions - mobile phase: (a) MeOH-10 mM CH3COOH (pHa adjusted with
triethylamine, NEt3) (80:20, V/V); (b) ACN-100 mM MES (pHa adjusted with NEt3)
(80:20, V/V); EOF marker: thiourea; temperature: 20°C; voltage: ±15 kV; injection: ±5
kV/5 s; detection: UV at 250 nm.
Reynolds et al. [225] prepared non-porous organo-silica spheres with different sizes and
surface areas and found no correlation between the surface area of the stationary phase and
the velocity of the EOF. This contrasts with the findings of Zimina et al. [124] on
conventional reversed phase stationary phases as already mentioned in Section 2.3.2.1. The
group of Chaiyasut et al. [309] studied fluorinated bonded silica and observed changes in the
elution profiles of neutral compounds at different voltages (Figure 2.24). The authors
suggested that this must be attributed to the alteration of the stationary phase under the
applied voltage. In addition, the retention mechanism of benzene and o-cresol appeared to
be the same. The retention mechanisms of aniline and o-nitrophenol, however, were
different, probably due to dipole-dipole interaction with fluorine atoms of the bonded
phase. Nonlinearity in the EOF vs. voltage also suggests changes in the surface charge

Stationary and Mobile Phases in CEC - 39 -
density. Matyska et al. [257] studying the temperature influences in OT-CEC with bonded
cholesteryl phase found irregularities due to the changes in surface morphology.
Figure 2.24
Relationship between apllied voltage and k’/ '0k value of neutral compounds. Solutes are
aniline (diamond), o-nitrophenol (triangle), o-cresol (circle) and benzene (rectangular).
Conditions – column: 18.7 cm/33.3 cm effective/total length, I.D. 150 µm, packed with
fluorinated bonded silica stationary phase; mobile phase: 0.1% aqueous
tetrabutylammonium chloride containing 0.1% acetic acid (pH 3.35).
2.3.6 Organic polymer based The major advantage of polymer-based columns is their flexibility and ease of preparation.
The fritless technology resulting from in-situ preparation and the possibilities offered by
tuning the retention and (enantio-)selectivity of components by building in different
retentive groups, as well as its potential high efficiency, shows a promising future for
polymer-based CEC columns. Intensive studies on the preparation and modification of
polymeric monolithic columns were performed by Peters et al. [326-328, 350]. This group

- 40 - Chapter 2
studied the electrochromatographic performance of monoliths based on a cross-linked
polymethacrylate.
Table 2.4 Polymer based stationary phases applied in CEC.
Type Type of the phase References
Positively Charged 224, 321-343, 383
Negatively Charged 282, 332, 343-348, 412
Chiral with in-built chiral
selector
349-351, 345-347
Polacrylate,
polyacrylamide,
polymethacrylate based
Chiral, molecular imprinted 352-357, 393-394
PS-DVB - 358-364
Cellulose based - 365
PEEK, ECTFE 366-367 Other
other 285, 311, 368-376, 382, 384, 387
The properties and behaviour of these columns could easily be tuned by the ratio of
monomers, the amount and composition of the porogenic solvent, and by the amount of
aminopropanesulfonic acid yielding in sufficient charge on the polymeric surface. Polymeric
back-bones together with butyl side chains from butyl methacrylate monomer are
responsible for the reversed-phase behaviour of these stationary phases. Examples of
separation of benzene derivatives are shown in Figures 2.25 and 2.26. Further studies have
also been performed by Jiang et al. [342]. They studied the performance of the monolithic
columns prepared from ethyleneglycol dimethacrylate and butyl methacrylate under HPLC
and CEC conditions. Apart from the high efficiency under CEC conditions, higher polarity
(viz. tailing broad peak of benzylamine) and broad peaks for small bulky compounds like
1,3,5-triisopropylbenzene were found (see Figures 5.7 and 5.12 in Chapter 5). It has been
suggested that a substantial broadening of these bulky components compared to other
small molecules is caused by the micropores in the organic monolith. Furthermore, as also
suggested by other authors, part of these micropores may have a dead end. These so-called

Stationary and Mobile Phases in CEC - 41 -
ink pot pores strongly limit the unhindered back-diffusion of components out of such
pores. This effort of course is more dramatic for bulky types of molecules. It appears that
the broadening of peaks is a more common problem. In addition, other authors like e.g.
Dulay et al. [224] and Tan et al. [242] worked on polymethacrylate monoliths, Jinno et al.
[365] on cellulose acetate fibres, Fujimoto et al. [367] on derivatized PEEK observed such a
phenomenon.
Figure 2.25
Effect of porosity of monolithic capillaries on their electrochromatographic properties.
Conditions: capillary column, 150 µm I.D. × 30 cm active length; stationary phase:
polymethacrylate monolithic column with 0.6 mol % AMPS in monomer mixture; mode
pore size of 4000 (a), 1230 (b), and 670 nm (c); mobile phase: ACN-5 mmol/L phosphate
buffer pH 7 (80/20, V/V); UV detection at 215 nm; voltage 25 kV; pressure in vials,
0.2 MPa; sample concentration, 2 mg/mL of each compound; injection, 5 kV for 3 s.
Peaks: thiourea (1), benzyl alcohol (2), benzaldehyde (3), benzene (4), toluene
(5), ethylbenzene (6), propylbenzene (7), butylbenzene (8), and amylbenzene (9).
Some of these authors attributed the differences in the adsorption of the aromatic part of
the component molecule to the sorptive interaction of π-electrons with the polymeric
monolith. By determining desorption-sorption cycles of organic anions such as benzoic
acid, phtalic acid or benzenesulfonic acid Kitagawa et al. [368, 370] proved that organic

- 42 - Chapter 2
anion-exchange gel matrix is able to recognize the direction of the applied electric field.
This has, of course, a direct effect on the distribution coefficient. In spite of these
observations, most authors report linear dependencies of log k versus the percentage of
organic modifier in the mobile phase similar as in pressure driven reversed-phase
chromatography. Analyzing polar compounds, deviations from the linearity have also been
observed on some highly charged polymers [342].
Figure 2.26
Separation of benzene derivatives on monolithic capillary column using mobile phases
containing different percentages of acetonitrile. Conditions: column: polymethacrylate
monolith; column diameters: 100 µm I.D. × 30 cm active length; mobile phase, 60/40
(V/V) (a), 70/30 (V/V) (b), and 80/20 (V/V) (c) mixtures of acetonitrile and 5 mM
phosphate buffer, pH 7.
Successful chiral separations using organic based monoliths were demonstrated too. Two
types of chiral stationary phases have been prepared:
Stationary and Mobile Phases in CEC - 43 -
i) with a built-in chiral selector
ii) based on a molecular imprinting technology.
So far, type i) proved to be more successful in enantioseparations of such types of columns.
Furthermore, type ii) monoliths have lower demands on preparation.
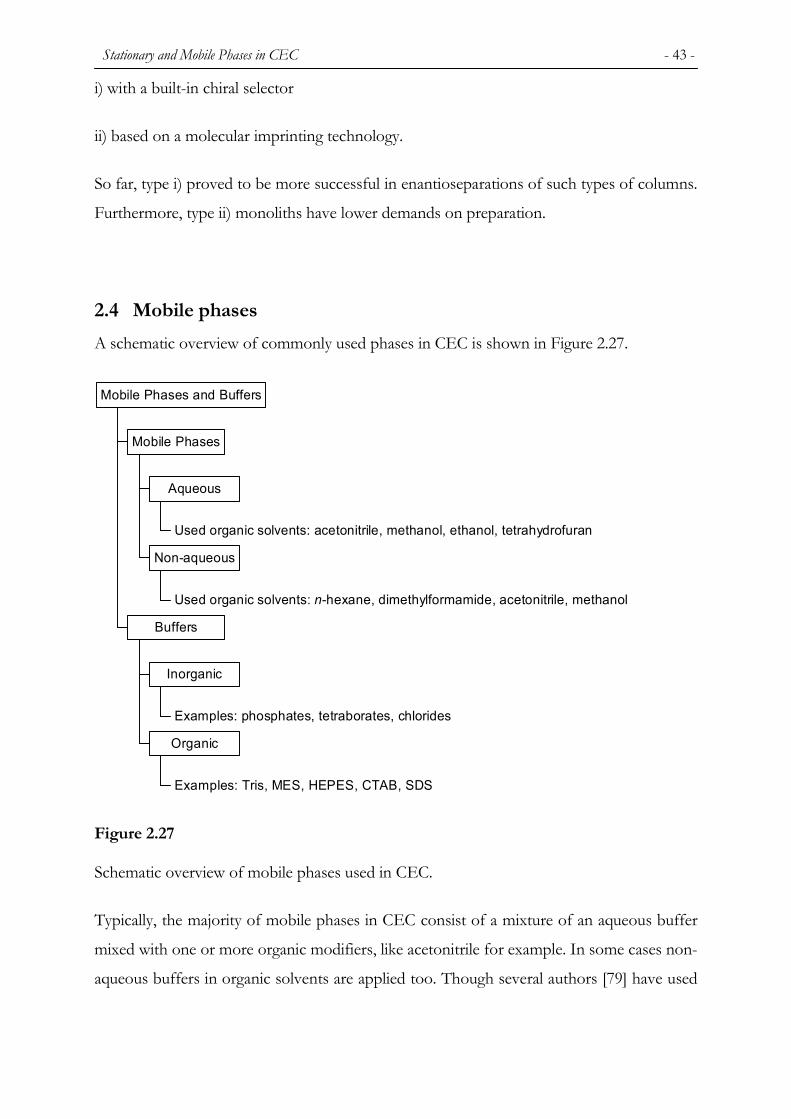
2.4 Mobile phases A schematic overview of commonly used phases in CEC is shown in Figure 2.27.
Used organic solvents: acetonitrile, methanol, ethanol, tetrahydrofuran
Aqueous
Used organic solvents: n-hexane, dimethylformamide, acetonitrile, methanol
Non-aqueous
Mobile Phases
Examples: phosphates, tetraborates, chlorides
Inorganic
Examples: Tris, MES, HEPES, CTAB, SDS
Organic
Buffers
Mobile Phases and Buffers
Figure 2.27
Schematic overview of mobile phases used in CEC.
Typically, the majority of mobile phases in CEC consist of a mixture of an aqueous buffer
mixed with one or more organic modifiers, like acetonitrile for example. In some cases non-
aqueous buffers in organic solvents are applied too. Though several authors [79] have used

- 44 - Chapter 2
non-buffered mobile phases, there is some concern about the stability of the EOF and thus
on the reproducibility of the obtained data (see Figure 4.1 in Chapter 4).
As discussed earlier, acetonitrile as the organic modifier has the most optimal ε/η ratio.
EOF-values generated using ACN containing systems are about two times higher than for
MeOH [52, 402] and about three times higher than for THF [52]. It is also interesting to
study the EOF dependency on the percentage of organic modifier in the mobile phase. The
relationship between ε/η and the percentage of organic solvent is described in Figure 2.28.
Figure 2.28
Variation of the ratio of the dielectric constant and the viscosity, ε/η, with solvent
composition at 25°C. Conditions - capillary: fused-silica capillary 43 cm/96 cm
effective/total length, 100 µm I.D., mobile phase: organic solvent-10 mM KCl + 1 mM
phosphoric acid + KOH; solvent code: meoh, methanol; etoh, ethanol; proh, 2-propanol;
acn, acetonitrile; dmso, dimethylsulfoxide; acet, acetone.

Stationary and Mobile Phases in CEC - 45 -
The results for acetonitrile as an organic modifier reported in the literature, however, are
contradictory. Several authors report both an increase [e.g. 52, 62, 82, 103, 105, 113, 116,
165, 190, 215, 223, 255, 360] and a decrease [79, 95, 98, 343, 361, 405] of the EOF with an
increasing concentration of acetonitrile as the organic modifier in the buffer. Asiaie et al.
[255] compared the effect of acetonitrile concentration on the EOF in unmodified,
octadecylated fused-silica capillaries and on sintered and reoctadecylated Zorbax ODS
stationary phases. The results are presented in Figure 2.28.
Figure 2.28
Plots of electrosmotic mobility as a function of acetonitrile concentration. (●) 75 µm I.D. ×
23 effective/33 cm total length fused-silica capillary with monolithic packing of sintered
and reoctadecylated 6-µm Zorbax-ODS (80 Å), (○) 50 µm I.D. × 20 cm effective/27 cm
total length open fused-silica capillary with octadecylated innerwall and (□) 50 µm I.D. × 20
cm effective/27 cm total length raw open fused-silica capillary. Mobile phase: ACN/10 mM
sodium tetraborate, pH 8.0; detection, 214 nm; electrokinetic injection, 1 s, 5 kV; EOF
marker, 2 µl/mL formamide in the mobile phase.
In open unmodified capillaries the EOF velocity decreases with increasing organic modifier
(ACN) concentration. In contrast, reversed observations were obtained for ODS open and
packed capillary. It should be noted that in the reported cases the ionic strength is not kept
constant while changing the content of the organic modifier. In addition, miniaturized
techniques are also favourable for separations carried out with expensive solvents. As an
example, deuterated solvents have been used [67, 158, 197, 403] in CEC/NMR. Particularly

- 46 - Chapter 2
for non-porous stationary phases, while aiming to achieve a constant and stable EOF,
several authors report the addition of SDS to the buffer in a sub-critical micellar
concentration [74, 89, 181, 189, 239, 340, 392, 400].
2.4.1 Non-aqueous mobile phases Though applications on non-aqueous CEC are not
commonly applied yet, a number of them have been
developed. A precondition here is that salts to be used in
non-aqueous systems must be compatible and soluble in
the solvent. Among them lithium and ammonium salts
are the most commonly used. The major use of non-
aqueous CEC has been applied on samples with
potentially high retention properties, such as fats [109-
111, 123] or fullerenes [419] and also for more
fundamentally oriented studies, i.e. through-pore flow in
particle beads (see sections 2.3.1 and 2.3.2). Wright et al.
[79] investigated the electrochromatographic behaviour
of polyaromatic hydrocarbons using non-aqueous and
aqueous non-buffered mobile phases. The authors
discussed possibilities for different association structures
of the molecules of the mobile phase during fluctuations
in the zeta potential and thus EOF. Furthermore, the
authors showed an obvious relationship between vEOF
and the ε/η ratio of the buffer (Figure 2.29).
Figure 2. 29
Relationship of electroosmotic mobility (µeo) to (A) permittivity (ε), (B) viscosity (η), and
(C) permittivity/viscosity ratio (ε/η). Conditions – column: fused-silica capillary 45 cm/75
cm effective/total length, 50 µm I.D.; mobile phase: pure water, methanol (MeOH),
acetonitrile (ACN), dimethylformamide (DMF) and dimethylsulfoxide (DMSO); EOF
marker: acetone.

Stationary and Mobile Phases in CEC - 47 -
2.5 Conclusions The capillary electrochromatography, CEC, developed in the past years has become a
highly efficient separation technique. The present lack of sufficient robustness of this
technique particularly in terms of column preparation, column and EOF stability, however,
gave CEC a position of complimentarity rather than making it competing technique
compared to HPLC for example. Presently, the state of the art of CEC can be characterized
as follows:
a) There is a strong tendency to manufacture CEC columns from silica and organic
monoliths. It can be expected that the use of conventional HPLC-like columns will
decrease.
b) In physico-chemical terms the role of organic modifier is not very clear yet. From an
experimental point of view in CEC acetonitrile is preferred over methanol.
To increase the role of CEC, more attention must be paid to the separation mechanism,
behaviour of the stationary phases, mobile phases and solutes under electro-driven
conditions. Still there exits substantial contradiction in literature on the interpretation of
data obtained under CEC conditions. Increasing the knowledge of the fundamentals is one
of the necessary conditions to turn CEC into a reliable separation technique well positioned
between the techniques like HPLC for example. Furthermore, with the successful
development of new stationary phases for CEC, this technique may become an interesting
alternative technique in many application protocols.
REFERENCES
1. A.S. Rathore, Cs. Horváth, J. Chromatogr. A, 781 (1997) 185.
2. J.S. Kowalczyk, Chem. Anal. (Warsaw), 41 (1996) 157.
3. L.A. Colón, G. Burgos, T.D. Maloney, J.M. Cintrón, R.L. Rodríguez, Electrophoresis,
21 (2000) 3965.
4. M.G. Cikalo, K.D. Bartle, M.M. Robson, P. Myers, M.R. Euerby, Analyst, 123 (1998)
87R.
5. M.M. Robson, M.G. Cikalo, P. Myers, M.R. Euerby, K.D. Bartle, J. Microcolumn Sep.,
9 (1997) 357.

- 48 - Chapter 2
6. K.D. Bartle, R.A. Carney, A. Cavazza, M.G. Cikalo, P. Myers, M.M. Robson, S.C.P.
Roulin, K. Sealey, J. Chromatogr. A, 892 (2000) 279.
7. M.M. Dittmann, K. Wienand, F. Bek, G.P. Rozing, LC-GC, 13 (1995) 800.
8. A.L. Crego, A. González, M.L. Marina, Crit. Rev. Anal. Chem., 26 (1996) 261.
9. L.A. Colón, K.K. Reynolds, R. Alicea-Maldonando, A.M. Fermier, Electrophoresis, 18
(1997) 2162.
10. R. Stevenson, K. Mistry, I.S. Krull, Intl. Laboratory, 11 (1998) 11C.
11. T. Tsuda, LC-GC Eur., 5 (1992) 26.
12. R. Weinberger, Am. Lab (Shelton, Conn.), 29 (1997) 24FF.
13. N.W. Smith, A.S. Carter-Finch, J. Chromatogr. A, 892 (2000) 219.
14. K.D. Bartle, P. Myers, J. Chromatogr. A, 916 (2001) 3.
15. T. de Boer, R.A. de Zeeuw, G.J. de Jong, K. Ensing, Electrophoresis, 20 (1999) 2989.
16. L. Schweitz, M. Patersson, T. Johansson, S. Nilsson, J. Chromatogr. A, 892 (2000) 203.
17. J.H. Knox, R. Boughtflower, TrAC, Trends Anal. Chem., 19 (2000) 643.
18. F. Steiner, B. Scherer, J. Chromatogr. A, 887 (2000) 55.
19. G. Choudhary, A. Apffel, H. Yin, W. Hancock, J. Chromatogr. A, 887 (2000) 85.
20. C.A. Rimmer, S.M. Piraino, J.G. Dorsey, J. Chromatogr. A, 887 (2000) 115.
21. R.E. Majors, LC-GC, 16 (1998) 96.
22. J.H. Miyawa, M.S. Alasandro, LC-GC, 16 (1998) 36.
23. K.D. Altria, J. Chromatogr. A, 856 (1999) 443.
24. K.D. Altria, N.W. Smith, C.H. Turnbull, Chromatographia, 46 (1997) 664.
25. J.J. Pesek, M.T. Matyska, Electrophoresis, 18 (1997) 2228.
26. L. Schweitz, L.I. Andersson, S. Nilsson, J. Chromatogr. A, 817 (1998) 5.
27. M. Pursch, L.C. Sander, J. Chromatogr. A, 887 (2000) 313.
28. J.J. Pesek, M.T. Matyska, J. Chromatogr. A, 887 (2000) 31.
29. H. Zou, M. Ye, Electrophoresis, 21 (2000) 4073.
30. G.M.J. Bruin, Electrophoresis, 21 (2000) 3931.
31. K. Jinno, H. Sawada, TrAC, Trends Anal. Chem., 19 (2000) 664.
32. U. Pyell, J. Chromatogr. A, 892 (2000) 257.
33. L.A. Colón, T.D. Maloney, A.M. Fermier, J. Chromatogr. A, 887 (2000) 43.
34. K.K. Unger, D. Kumar, M. Grün, G. Büchel, S. Lüdtke, T. Adam, K. Schumacher, S.
Renker, J. Chromatogr. A, 892 (2000) 47.
35. L.I. Andersson, J. Chromatogr. B, 745 (2000) 3.

Stationary and Mobile Phases in CEC - 49 -
36. F. Svec, E.C. Peters, D. Sýkora, C. Yu, J.M.J. Fréchet, J. High Resolut. Chromatogr., 23
(2000) 3.
37. F. Svec, E.C. Peters, D. Sýkora, J.M.J. Fréchet, J. Chromatogr. A, (2000) 3.
38. Q. Tang, M.L. Lee, TrAc, Trends Anal. Chem., 19 (2000) 648.
39. V. Schurig, D. Wistuba, Electrophoresis, 20 (1999) 2313.
40. D. Wistuba, V. Schurig, J. Chromatogr. A, 875 (2000) 255.
41. I.S. Krull, A. Sebag, R. Stevenson, J. Chromatogr. A, 887 (2000) 137.
42. D. Wistuba, V. Schurig, Electrophoresis, 21 (2000) 4136.
43. A. Karcher, Z. El Rassi, Electrophoresis, 20 (1999) 3280.
44. Z. El Rassi, Electrophoresis, 20 (1999) 3134.
45. G.W. Sovocool, W.C. Brumley, J.R. Donelly, Electrophoresis, 20 (1999) 3297.
46. P.T. Vallano, V.T. Remcho, J. Chromatogr. A, 887 (2000) 125.
47. K. Walhagen, K.K. Unger, M.T.W. Hearn, J. Chromatogr. A, 887 (2000) 165.
48. T.D. Hatajik, P.R. Brown, J. Capillary Electrophor., 5 (1998) 143.
49. K.D. Altria, N.W. Smith, C.H. Turnbull, J. Chromatogr. B, (1998) 341.
50. G. Blaschke, B. Chankvetadze, J. Chromatogr. A, 875 (2000) 3.
51. HP booklet
52. M.M. Dittmann, G.P. Rozing, J. Microcolumn Sep., 9 (1997) 399.
53. A.S. Rathore, Cs. Horváth, Anal. Chem., 70 (1998) 3271.
54. A.S. Rathore, E. Wen, Cs. Horváth, Anal. Chem., 71 (1999) 2633.
55. M. Zhang, Z. El Rassi, Electrophoresis, 19 (1998) 2068.
56. C. Yang, Z. El Rassi, Electrophoresis, 21 (2000) 1977.
57. J. Jiskra, H.A. Claessens, C.A. Cramers, J. Sep. Sci., 25 (2002) 1.
58. C. Rice, R. Whitehead, J. Phys. Chem., 69 (1965) 4017.
59. J.H. Knox, I.H. Grant, Chromatographia, 24 (1987) 135.
60. J.H. Knox, I.H. Grant, Chromatographia, 32 (1991) 317.
61. E.P.C. Lai, E. Dabek-Zlotorzynska, Electrophoresis, 20 (1999) 2366.
62. W. Wei, G.A. Luo, G.Y. Hua, C. Yan, J. Chromatogr. A, 817 (1998), 65.
63. N.C. Gillott, M.R. Euerby, C.M. Johnson, D.A. Barrett, P.N. Shaw, Chromatographia,
51 (2000), 167.
64. W. Wei, G.A. Luo, R. Xiang, C. Yan, J. Microcolumn Sep., 11 (1999) 263.
65. A. Maruška, U. Pyell, J. Chromatogr. A, 782 (1997) 167.
66. M. Mayer, E. Rapp, C. Marck, G.J.M. Bruin, Electrophoresis, 20 (1999) 43.
- 50 - Chapter 2
67. K. Pusecker, J. Schewitz, P. Gfrörer, L.-H. Tseng, K. Albert, E. Bayer, Anal. Chem., 70
(1998) 3280.
68. E. Venema, J.C. Kraak, H. Poppe, R. Tijssen, J. Chromatogr. A, 837 (1999) 3.
69. R. Stol, W.Th. Kok, H. Poppe, J. Chromatogr. A, 914 (2001) 201.
70. R. Stol, H. Poppe, W.Th. Kok, J. Chromatogr. A, 887 (2000) 199.
71. S.R. Witowski, R.T. Kennedy, J. Microcolumn Sep., 11 (1999) 723.
72. T.S. Stevens, H.J. Cortes, Anal. Chem., 55 (1983) 1365.
73. M. Ye, H. Zou, Z. Liu, J. Ni, Y. Zhang, J. Chromatogr. A, 855 (1999) 137.
74. R.M. Seifar, S. Heemstra, W. Th. Kok, J.C. Kraak, Biomed. Chromatogr. 12 (1998)
140.
75. S. Suzuki, M. Yamamoto, Y. Kuwahara, K. Makiura, S. Honda, Electrophoresis, 19
(1998) 2682.
76. L. Roed, E. Lundanes, T. Greibrokk, J. Microcolumn Sep., 11 (1999) 421.
77. J. Helboe, S.H. Hansen, J. Chromatogr. A, 836 (1999) 315.
78. N.C. Gillot, M. R. Euerby, C.M. Johnson, D.A. Barret, P.N. Shaw, Anal. Commun., 35
(1998) 217.
79. P.B. Wright, A.S. Lister, J.G. Dorsey, Anal. Chem., 69 (1997) 3251.
80. K. Walhagen, K.K. Unger, A.M. Olsson, M.T.W. Hearn, J. Chromatogr. A, 853 (1999)
263.
81. M.R. Euerby, C.M. Johnson, K.D. Bartle, LC-GC, (1998) 386.
82. M.M. Dittmann, G.P. Rozing, J. Chromatogr. A, 744 (1996) 63.
83. M.M. Dittmann, G.P. Rozing, Biomed. Chromatogr., 12 (1998) 136.
84. K. Walhagen, K.K. Unger, M.T.W. Hearn, J. Chromatogr. A, 894 (2000) 35.
85. M.M. Dittmann, K. Masuch, G.P. Rozing, J. Chromatogr. A, 887 (2000) 209.
86. P.A. Cooper, K.M. Jessop, F. Moffatt, Electrophoresis, 21 (2000) 1574.
87. E.F. Hilder, C.W. Klampfl, P.R. Haddad, P. Myers, Analyst, 215 (2000) 1.
88. L.Y. Fang, E.A. Huang, M.M. Safarpour, J. Capillary Electrophor., 5 (1998) 115.
89. C.W. Henry III, M.E. McCarroll, I.M. Warner, J. Chromatogr. A, 905 (2001) 319.
90. I.S. Lurie, R.P. Meyers, T.S. Conver, Anal. Chem., 70 (1998) 3255.
91. M.R. Euerby, D. Gilligan, C.M. Johnson, K.D. Bartle, Analyst (Cambridge, U.K.),
(1997) 1087.
92. M. R Euerby, C.M. Johnson, S.F. Smyth, N.C. Gillot, D.A. Barrett, P.N. Shaw, J.
Microcolumn Sep., 11 (1999) 305.

Stationary and Mobile Phases in CEC - 51 -
93. L.A. Frame, M.L. Robinson, W.J. Lough, J. Chromatogr. A, 798 (1998) 243.
94. H. Yamamoto, J. Bauman, F. Erni, J. Chromatogr., 593 (1992) 313.
95. S.L. Abidi, K.A. Rennick, J. Chromatogr. A, 913 (2001) 379.
96. M. Lämmerhofer, W. Lindner, J. Chromatogr. A, 839 (1999) 167.
97. E.F. Hilder, M. Macka, P.R. Haddad, Anal. Commun., 36 (1999) 299.
98. C. Yan, D. Schaufelberger, F. Erni, J. Chromatogr. A, 670 (1994) 15.
99. R.M. Seifar, S. Heemstra, W.Th. Kok, J.C. Kraak, H. Poppe, J. Microcolumn Sep., 10
(1998) 41.
100. T. Adam, K.K. Unger, M.M. Dittmann, G.P. Rozing, J. Chromatogr. A, 887 (2000)
327.
101. P.D.A. Angus, C.W. Demarest, T. Catalano, J. F. Stobaugh, J. Chromatogr. A, 887
(2000) 347.
102. A. Hilmi, J.H.T. Luong, Electrophoresis, 21 (2000) 1395.
103. D.A. Stead, R.G. Reid, R.B. Taylor, J. Chromatogr. A, 798 (1998) 259.
104. J. Wang, D. Schaufelberger, N.A. Guzman, J. Chromatogr. Sci., 36 (1998) 155.
105. F. Moffat, P.A. Cooper, K.M. Jessop, J. Chromatogr. A, 855 (2000) 215.
106. N.M. Djordjevic, P.W.J. Fowler, F. Houdiere, G. Lerch, J. Liq. Chromatogr. Relat.
Technol., 21 (1998) 2219.
107. K. Walhagen, K.K. Unger, M.T.W. Hearn, J. Chromatogr. A, 893 (2000) 401.
108. S.E. Van Den Bosch, S. Heemstra, J.C. Kraak, H. Poppe, J. Chromatogr. A, 755 (1996)
165.
109. A. Dermaux, A. Medvedovici, M. Ksir, E. Van Hove, M. Talbi, P. Sandra, J.
Microcolumn Sep., 11 (1999) 451.
110. A. Dermaux, P. Sandra, V. Ferraz, Electrophoresis, 20 (1999) 74.
111. A. Dermaux, P. Sandra, M. Ksir, K. Fellat, F. Zarrouck, J. High Resolut. Chromatogr.,
21 (1998) 545.
112. A.S. Lister, J.G. Dorsey, D.E. Burton, J. High Resolut. Chromatogr., 20 (1997) 523.
113. A.S. Lister, C.A. Rimmer, J.G. Dorsey, J. Chromatogr. A, 828 (1998) 105.
114. G.A. Lord, D.B. Gordon, L.W. Tetler, C.M. Carr, J. Chromatogr. A, 700 (1995) 27.
115. J.M. Miyawa, D.K. Lloyd, M.S. Alasandro, J. High Resolut. Chromatogr., 21 (1998)
161.
116. F. Moffatt, P.A. Cooper, K.M. Jessop, J. Chromatogr. A, 855 (2000) 215.

- 52 - Chapter 2
117. F. Moffatt, P. Chamberlain, P.A. Cooper, K.M. Jessop, Chromatographia, 48 (1998)
481.
118. F. Moffatt, P.A. Cooper, K.M. Jessop, Anal. Chem., 71 (1999) 1119.
119. P.K. Owens, J. Johansson, Anal. Chem., 72 (2000) 740.
120. J. Reilly, M. Saeed, J. Chromatogr. A, 829 (1998) 175.
121. K.J. Reynolds, T.D. Maloney, A.M. Fermier, L.A. Colón, Analyst, 123 (1998) 1493.
122. M. Saeed, M. Depala, D.H. Craston, I.G.M. Anderson, Chromatographia, 49 (1999)
391.
123. P. Sandra, A. Dermaux, V. Ferraz, M.M. Dittmann, G.P. Rozing, J. Microcolumn Sep.,
9 (1997) 409.
124. T.M. Zimina, R.M. Smith, P. Myers, J. Chromatogr. A, 758 (1997) 191.
125. J. Seavels, M. Wuyts, A. Van Schepdael, E. Roets, J. Hoogmartnes, J. Pharm Biomed.
Anal., 20 (1999) 513.
126. J. Ding, P. Vouros, Anal. Chem., 69 (1997) 379.
127. D. Jianmei, J. Szeliga, A. Dipple, P. Vouros, J. Chromatogr. A, 781 (1997) 327.
128. J. Ding, T. Barlow, A. Dipple, P. Vouros, J. Am. Soc. Mass Spectrom., 9 (1998) 823.
129. S.R. Sirimanne, J.R. Barr, D.G. Patterson, Jr., J. Microcolumn Sep., 11 (1999) 109.
130. R.J. Boughtflower, T. Underwood, C.J. Paterson, Chromatographia, 40 (1995) 329.
131. J. Jiskra, C.A. Cramers, M. Byelik, H.A. Claessens, J. Chromatogr. A, 862 (1999) 121.
132. J. Jiskra, T. Jiang, H.A. Claessens, C.A. Cramers, J Microcolumn Sep., 12 (2000) 530.
133. P.D.A Angus, E. Victorino, K.M. Payne, C.W. Demerest, T. Catalano, J.F. Stobaugh,
Electrophoresis, 19 (1998) 2073.
134. R. Stol, M. Mazareeuw, U.R. Tjaden, J. Van Der Graaf, J. Chromatogr. A, 873 (2000)
293.
135. I.S. Lurie, T.S. Conver, V.L. Ford, Anal. Chem., 70 (1998) 4563.
136. T. Eimer, K.K. Unger, J. Van Der Greef, TrAC, Trends Anal. Chem., 15 (1996) 463.
137. X. Cahours, P. Morin, L. Agrofoglio, M. Dreux, J. High Resolut. Chromatogr., 23
(2000) 138.
138. M. Qui, X.-F. Li, C. Stathakis, N.J. Dovichi, J. Chromatogr. A, 853 (1999) 131.
139. V. Spikmans, S.J. Lane, U.R. Tjaden, J. Van Der Graaf, Rapid Commun. Mass
Spectrom., 13 (1999) 141.
140. N.M. Djordjevic, F. Fitzpatrick, F. Houdiere, G. Lerch, G.P. Rozing, J. Chromatogr. A,
887 (2000) 245.

Stationary and Mobile Phases in CEC - 53 -
141. M.R. Euerby, C.M. Johnson, K.D. Bartle, P. Myers, S.C.P. Roulin, Anal. Commun., 33
(1996) 403.
142. M.G. Cikalo, K.D. Bartle, P. Myers, J. Chromatogr. A, 836 (1999) 35.
143. B. Xin, M. Lee, J. Microcolumn Sep., 11 (1999) 271.
144. N.W. Smith, J. Chromatogr. A, 887 (2000) 233.
145. S.C.P. Roulin, R. Dmoch, R.A. Carney, K.D. Bartle, P. Myers, M.R. Euerby, C.M.
Johnson, J. Chromatogr. A, 887 (2000) 307.
146. R.A. Carney, M.M. Robson, K.D. Bartle, P. Myers, J. High Resolut. Chromatogr., 22
(1999) 29.
147. N.W. Smith, M.B. Evans, Chromatographia, 41 (1995) 197.
148. L. Zhang, W. Shi, H. Zou, J.Y. Ni, Y. Zhang, J. Liq. Chromatogr. Relat. Technol., 22
(1999) 2715.
149. N. Smith, M.B. Evans, J. Chromatogr. A, 832 (1999) 41.
150. N.W. Smith, M.B. Evans, Chromatographia, 38 (1994) 649.
151. M.G. Cikalo, K.D. Bartle, P. Myers, Anal. Chem., 71 (1999) 1820.
152. G.A. Lord, D.B. Gordon, P. Myers, B.W. King, J. Chromatogr. A, 768 (1997) 9.
153. N.W. Smith, CAST (1999) 10.
154. N.P. Cassells, C.S. Lane, M. Depala, M. Saeed, D.H. Craston, Chemospher,e 40 (2000)
609.
155. R.D. Oleschuk, L.L. Shultz-Lockyear, Y. Ning, D.J. Harrison, Anal. Chem., 72 (2000)
585.
156. L. Zhang, H. Zou, W. Shi, J.Y. Ni, Y. Zahng, J. Capillary Electrophor., 5 (1998) 97.
157. Y. Zhang, W. Shi, L. Zhang, H. Zou, J. Chromatogr. A, 802 (1998) 59.
158. D. Hindocha, N.W. Smith, J. Chromatogr. A, 904 (2000) 99.
159. M.M. Robson, K.D. Bartle, P. Myers, Chromatographia, 50 (1999) 711.
160. M.M. Robson, S.C.P. Roulin, S.M. Shariff, M.W. Raynor, K.D. Bartle, A.A. Clifford, P.
Myers, M.R. Euerby, C.M. Johnson, Chromatographia, 43 (1996) 313.
161. C.W. Klampfl, W. Buchberger, P.R. Haddad, J. Chromatogr. A, 911 (2001) 277.
162. R. Stol, W.Th. Kok, H. Poppe, J. Chromatogr. A, 853 (1999) 45.
163. M. Schmid, F. Bäuml, A.P. Köhne, T. Welsch, J. High Resolut. Chromatogr., 22 (1999)
438.
164. M. Hugener, A.P. Tinke, W.M.A. Niessen, U.R. Tjaden, J. Van Der Greef, J.
Chromatogr., 647 (1993) 375.

- 54 - Chapter 2
165. A. Banholczer, U. Pyell, J. Chromatogr. A, 869 (2000) 363.
166. L. Roed, E. Lundanes, T. Greibrokk, J. Chromatogr. A, 890 (2000) 347.
167. D. Li, V.T. Remcho, J. Microcolumn Sep., 9 (1997) 389.
168. G. Chirica, V.T. Remcho, Electrophoresis, 21 (2000) 3093.
169. G. Chirica, V.T. Remcho, Electrophoresis, 20 (1999) 50.
170. R. Stol, H. Poppe, W.Th. Kok, Anal. Chem., 73 (2001) 3332.
171. M. Mazareeuw, V. Spikmans, U.R. Tjaden, J. Van Der Greef, J. Chromatogr. 879
(2000) 219.
172. N.M. Djordjevic, F. Fitzpatrick, F. Houdiere, G. Lerch, J. High Resolut. Chromatogr.,
22 (1999) 599.
173. U. Pyell, H. Rebscher, A. Banholczer, J. Chromatogr. A, 779 (1997) 155.
174. P.T. Vallano, V.T. Remcho, Anal. Chem., 72 (2000) 4255.
175. U. Pyell, H. Rebscher, A. Banholczer, J. Chromatogr. A, 779 (1997) 155.
176. A. Banholczer, U. Pyell, J. Microcolumn Sep., 10 (1998) 321.
177. H. Rebscher, U. Pyell, Chromatographia, 42 (1996) 171.
178. T. Tegeler, Z. El Rassi, Anal. Chem., 73 (2001) 3365.
179. E. Tobler, M. Lämmerhofer, W. Lindner, J. Chromatogr. A, 875 (2000) 341.
180. S. Luedtke, T. Adam, N. Von Doehren, K.K. Unger, J. Chromatogr. A, 887 (2000)
339.
181. J.-T. Lim, R.N. Zare, C.G. Bailey, D.J. Rakestraw, C. Yan, Electrophoresis, 21 (2000)
737.
182. I.S. Lurie, C.G. Bailey, D.S. Anex, M.J. Bethea, T.D. McKibben, J.F. Casale, J.
Chromatogr. A, 870 (2000) 53.
183. P.D.A. Angus, C.W. Demarest, T. Catalano, J.F. Stobaugh, Electrophoresis, 20 (1999)
2349.
184. H. Engelhardt, S. Lamotte, F.-T. Hafner, Am. Lab., 30 (1998) 40.
185. C.G. Bailey, C. Yan, Anal. Chem., 70 (1998) 3275.
186. R. Dadoo, R.N. Zare, C. Yan, D.S. Anex, Electrophoresis, 70 (1998) 4787.
187. I.S. Lurie, C.G. Bailey, D.S. Anex, M.J. Bethea, T.D. McKibben, J.F. Casale, J.
Chromatogr. A, 870 (2000) 53.
188. J.-R. Chen, R.N. Zare, E.C. Peters, F. Svec, J.J. Frechét, Anal. Chem., 73 (2001) 1987.
189. C.G. Bailey, S.R. Wallenborg, Electrophoresis, 21 (2000) 3081.
190. H. Rebscher, U. Pyell, Chromatographia, 38 (1994) 737.

Stationary and Mobile Phases in CEC - 55 -
191. C. Desiderio, L. Ossicini, S. Fanali, J. Chromatogr. A, 887 (2000) 489.
192. D.B. Strickmann, G. Blaschke, J. Chromatogr. B, 748 (2000) 213.
193. C. Desiderio, S. Fanali, J. Chromatogr. A, 895 (2000) 123.
194. D. Nurok, M.C. Frost, D.M. Chenoweth, J. Chromatogr. A, 903 (2000) 211.
195. E. Rapp, E. Bayer, J. Chromatogr. A, 887 (2000) 367.
196. K. Schmeer, B. Behnke, E. Bayer, Anal. Chem., 67 (1995) 3656.
197. P. Gfrörer, J. Schewitz, K. Pusecker, L.-H. Tseng, K. Albert, E. Bayer, Electrophoresis,
20 (1999) 3.
198. B. Behnke, J. Johansson, E. Bayer, S. Nilsson, Electrophoresis, 21 (2000) 3102.
199. B. Behnke, E. Bayer, J. Chromatogr. A, 680 (1994) 93.
200. B. Behnke, J. Johansson, S. Zhang, E. Bayerm S. Nilsson, J. Chromatogr. A, 818 (1998)
257.
201. B. Behnke, J.W. Metzger, Electrophoresis, 20 (1999) 80.
202. C. Rentel, P. Gfrörer, E. Bayer, Electrophoresis, 20 (1999) 2329.
203. P. Gfrörer, L.-H. Tseng, E. Rapp, K. Albert, E. Bayer, Anal. Chem., 73 (2001) 3234.
204. T. Tsuda, Anal. Chem., 59 (1987) 521.
205. T. Tsuda, Analusis, 26 (1998) M48.
206. C. Yan, R. Dadoo, R.N. Zare, D.J. Rakestraw, D.S. Anex, Anal. Chem., 68 (1996) 2726.
207. C. Yan, R. Dadoo, H. Zhao, R.N. Zare, D.J. Rakestraw, Anal. Chem., 67 (1995) 2026.
208. A.M. Fermier, L.A. Colón, J. Microcolumn Sep., 10 (1998) 439.
209. M.R. Taylor, P. Teale, S.A. Westwood, D. Perret, Anal.Chem. 69 (1997) 2554.
210. E. Wen, R. Asiaie, Cs. Horváth, J. Chromatogr. A, 855 (1999) 349.
211. A.S. Rathore, Cs. Horváth, Anal. Chem., 70 (1998) 3069.
212. Q.-H. Wan, J. Chromatogr. A, 782 (1997) 181.
213. C.G. Huber, G. Choudhary, Cs. Horváth, Anal. Chem., 69 (1997) 4429.
214. C. Yang, Z. El Rassi, Electrophoresis, 20 (1999) 2337.
215. R.M. Seifar, J.C. Kraak, W.Th. Kok, H. Poppe, J. Chromatogr. A, 808 (1998) 71.
216. G. Choudhary, Cs. Horváth, J. Chromatogr. A, 781 (1997) 161.
217. G. Choudhary, Cs. Horváth, J.F. Banks, J. Chromatogr. A, 828 (1998) 469.
218. C. Yang, Z. El Rassi, Electrophoresis, 20 (1999) 18.
219. C. Yang, Z. El Rassi, Electrophoresis, 19 (1998) 2061.
220. K. Jinno, H. Sawada, A.P. Catabay, H. Watanabe, N.B.H. Sabli, J.J. Pesek, M.T.
Matyska, J. Chromatogr. A, 887 (2000) 479.

- 56 - Chapter 2
221. P. Huang, J.-T. Wu, D.M. Lubman, Anal. Chem., 70 (1998) 3003.
222. K.W. Whitaker, M.J. Sepaniak, Electrophoresis, 15 (1994) 1341.
223. Q. Tang, B. Xin, M. Lee, J. Chromatogr. A, 837 (1999) 35.
224. M. T. Dulay, J.P. Quirino, B.D. Bennett, M. Kato, R.N. Zare, Anal. Chem., 73 (2001),
3921.
225. K.J. Reynolds, L.A. Colón, J. Liq. Chromatogr. Relat. Technol., 23 (2000) 161.
226. Q.-H. Ru, J. Yao, G.A. Luo, Y.-X. Zhang, C. Yan, J. Chromatogr. A, 894 (2000) 337.
227. S. Thiam, S.A. Shamsi, C.W. Henry III, J.W. Robinson, I.M. Warner, Anal. Chem., 72
(2000) 2541.
228. V. Lopez-Avila, J. Bedenedicto, C. Yan, J. High Resolut. Chromatogr., 20 (1997) 615.
229. E. Dabek-Zlotorzynska, E.P.C. Lai, J. Chromatogr. A, 853 (1999) 487.
230. W. Guo, J.A. Koropchak, C. Yan, J. Chromatogr. A, 849 (1999) 587.
231. Q.-H. Ru, G.-A. Luo, Y.-R. Fu, J. Chromatogr. A, 924 (2001) 331.
232. Y.S. Fung, Y.H. Long, J. Chromatogr. A, 907 (2001) 301.
233. W. Wei, Y.M. Wang, G.A. Luo, R.J. Wang, Y.H. Guan, C. Yan, J. Liq. Chromatogr.
Relat. Technol., 21 (1998) 1433.
234. R. Dadoo, C. Yan, R.N. Zare, D.S. Anex, D.J. Rakestraw, G.A. Hux, LC-GC, 15
(1997) 630.
235. V. Lopez-Avila, J. Benedicto, C. Yan, J. Chromatogr. Sci., 37 (1999) 165.
236. X. Cahours, P. Morin, M. Dreux, J. Chromatogr. A, 845 (1999) 203.
237. L. Roed, E. Lundanes, T. Greibrokk, Electrophoresis, 20 (1999) 2373.
238. U. Tallarek, D. Van Dusschoten, H. Van As, G. Guiochon, E. Bayer, Angew. Chem.,
Int. Ed., 37 (1998) 1882.
239. R.M. Seifar, J.C. Kraak, H. Poppe, W. Th. Kok, J. Chromatogr. A, 832 (1999) 133.
240. R.M. Seifar, W.Th. Kok, J.C. Kraak, H. Poppe, Chromatographia, 46 (1997) 131.
241. S. Suzuki, Y. Kuwahara, K. Makiura, S. Honda, J. Chromatogr. A, 873 (2000) 247.
242. T. Tanigawa, T. Nakagawa, K. Kimata, H. Nagayama, K. Hosoya, N. Tanaka, J.
Chromatogr. A, 887 (2000) 299.
243. M.T. Dulay, C. Yan, D.J. Rakestraw, R.N. Zare, J. Chromatogr. A, 725 (1996) 361.
244. J. Dickson, M. Odom, F. Ducheneaux, J. Murray, R.E. Milofsky, Anal. Chem., 72
(2000) 3038.
245. Q. Tang, M. Lee, J. High Resolut. Chromatogr., 23 (2000) 73.

Stationary and Mobile Phases in CEC - 57 -
246. N. Tanaka, N. Nagayama, H. Kobayashi, T. Ikegami, K. Hosoya, N. Ishizuka, H.
Minakuchi, K. Nakanishi, K. Cabrera, D. Lubda, J. High Resolut. Chromatogr., 23
(2000) 111.
247. C.K. Ratnayake, C.S. Oh, M.P. Henry, J. Chromatogr. A, 887 (2000) 277.
248. C. Fujimoto, J. High Resolut. Chromatogr., 23 (2000) 89.
249. C.K. Ratnayake, C.S. Oh, M.P. Henry, J. High Resolut. Chromatogr., 23 (2000) 81.
250. A.L. Crego, J. Martínez, M.L. Marina, J. Chromatogr. A, 869 (2000) 329.
251. M.C. Breadmore, M.Macka, N. Avdalovic, P.R. Haddad, Anal. Chem., 73 (2001) 820.
252. J.J. Pesek, M.T. Matyska, J.E. Sandoval, E.J. Williamsen, J. Liq. Chromatogr. Relat.
Technol., 19 (1996) 2843.
253. B. He, J. Ji, F. Regnier, J. Chromatogr. A, 853 (1999) 257.
254. M.T. Dulay, R.P. Kulkarni, R.N. Zare, Anal. Chem., 70 (1998) 5103.
255. R. Asiaie, X. Huang, D. Farnan, Cs. Horváth, J. Chromatogr. A, 806 (1998) 251.
256. S.C. Jacobsen, R. Hergenroeder, L.B. Koutny, J.M. Ramsey, Anal. Chem., 66 (1994)
2369.
257. M.T. Matyska, J.J. Pesek, R.I. Boysen, M.T.W. Hearn J. Chromatogr. A, 924 (2001)
211.
258. J.J. Pesek, M.T. Matyska, L. Mauskar, J. Chromatogr. A, 763 (1997) 307.
259. J.J. Pesek, M.T. Matyska, S. Cho, J. Chromatogr. A, 845 (1999) 237.
260. J.J. Pesek, M.T. Matyska, J. Capillary Electrophor,. 4 (1997) 213.
261. M.T. Matyska, J.J. Pesek, L. Yang, J. Chromatogr. A, 887 (2000) 497.
262. M.T. Matyska, Chem. Anal. (Warsaw), 43 (1998) 637.
263. M.J. Hoffman, A. Dovletoglou, J. High Resolut. Chromatogr., 22 (1999) 309.
264. L.C. Sander, M. Pursch, B. Maerker, S.A. Wise, Anal. Chem., 71 (1999) 3477.
265. Y. Chen, G. Gerhardt, R.M. Cassidy, Anal. Chem., 72 (2000) 610.
266. Y. Deng, J. Zhang, T. Tsuda, P.H. Yu, A.A. Boulton, R.M. Cassidy, Anal. Chem., 70
(1998) 4586.
267. R.N. Warriner, A.S. Craze, D.E. Games, S.J. Lane, Rapid Commun. Mass Spectrom.,
12 (1998) 1143.
268. M.G. Cikalo, K.D. Bartle, P. Myers, J. Chromatogr. A, 836 (1999) 25.
269. M.G. Cikalo, K.D. Bartle, P. Myers, Anal. Chem., 71 (1999) 1820.
270. S.J. Lane, A. Pipe, Rapid Commun. Mass Spectrom., 12 (1998) 667.
271. M. Ye, H. Zou, Z. Liu, J.Y. Ni, Y. Zhang, Anal. Chem., 72 (2000) 616.

- 58 - Chapter 2
272. M. Ye, H. Zou, Z. Liu, J.Y. Ni, J. Chromatogr. A, 869 (2000) 385.
273. S. Constantin, R. Freitag, J. Chromatogr. A, 887 (2000) 253.
274. C.W. Klampfl, P.R. Haddad, J. Chromatogr. A, 884 (2000) 277.
275. C.W. Klampfl, E.F. Hilder, P.R. Haddad, J. Chromatogr. A, 888 (2000) 267.
276. V. Spikmans, S.J. Lane, N.W. Smith, Chromatographia, 51 (2000) 18.
277. M. Zhang, Z. El Rassi, Electrophoresis, 20 (1999) 31.
278. M. Zhang, C. Yang, Z. El Rassi, Anal. Chem., 71 (1999) 3277.
279. W. Wei, G.A. Luo, C. Yan, Am. Lab. (Shelton, Conn.), 30 (1998) 20C.
280. M. Ye, H. Zou, Z. Liu, J.Y. Ni, J. Chromatogr. A, 887 (2000) 223.
281. P. Huang, X. Jin, Y. Chen, J.R. Srinivasan, D.M. Lubman, Anal. Chem., 71 (1999)
1786.
282. B. Scherer, F. Steiner, J. Chromatogr. A, 924 (2001) 197.
283. J. Zhang, X. Huang, S. Zhang, Cs. Horváth, Anal. Chem., 72 (2000) 3022.
284. J. Hayes, A. Malik, Anal. Chem., 72 (2000) 4090.
285. N. Guan, Z. Zeng, Y. Wang, E. Fu, J. Cheng, Anal. Chim. Acta, 418 (2000) 145.
286. J.D. Hayes, A. Malik, Anal. Chem., 73 (2001) 987.
287. C. Desiderio, Z. Atukuri, S. Fanali, Electrophoresis, 22 (2001) 535.
288. H. Wikström, L.A. Svensson, A. Torstensson, P.K. Owens, J. Chromatogr. A, 869
(2000) 395.
289. A. Dermaux, F. Lynen, P. Sandra, J. High Resolut. Chromatogr., 21 (1998) 575.
290. M. Kato, M.T. Dulay, B. Bennett, J.-R. Chen, R.N. Zare, Electrophoresis, 21 (2000)
3145.
291. M. Lämmerhofer, E. Tobler, W. Lindner, J. Chromatogr. A, 887 (2000) 421.
292. M. Lämmerhofer, W. Lindner, J. Chromatogr. A, 829 (1999) 115.
293. D. Wistuba, H. Czesla, M. Roeder, V. Schurig, J. Chromatogr. A, 815 (1998) 183.
294. M. Zhang, Z. El Rassi, Electrophoresis, 21 (2000) 3126.
295. M. Zhang, Z. El Rassi, Electrophoresis, 21 (2000) 3135.
296. M. Meyring, B. Chankvetadze, J. Chromatogr. A, 876 (2000) 157.
297. M. Girod, B. Chankvetadze, G. Blaschke, J. Chromatogr. A, 887 (2000) 439.
298. F. Lelièvre, C. Yan, R.N. Zare, P. Gareil, J. Chromatogr. A, 723 (1996) 145.
299. S. Mayer, V. Schurig, J. High Resolut. Chromatogr., 15 (1992) 129.
300. D. Wistuba, V. Schurig, Electrophoresis, 21 (2000) 3152.
301. A.S. Carter-Finch, N.W. Smith, J. Chromatogr. A, 848 (1999) 375.

Stationary and Mobile Phases in CEC - 59 -
302. K. Kawamura, K. Otsuka, S. Terabe, J. Chromatogr. A, 924 (2001) 251.
303. K. Otsuka, C. Mikami, S. Terabe, J. Chromatogr. A, 887 (2000) 457.
304. K. Krause, M. Girod, B. Chankvetadze, G. Blaschke, J. Chromatogr. A, 837 (1999) 51.
305. M. Kato, M.T. Dulay, B.D. Bennett, J.P. Quirino, R.N. Zare, J. Chromatogr. A, 924
(2001) 187.
306. K. Krause, B. Chankvetadze, Y. Okamoto, G. Blaschke, J. Microcolumn Sep., 12
(2000) 398.
307. K. Krause, B. Chankvetadze, Y. Okamoto, G. Balschke, Electrophoresis, 20 (1999)
2772.
308. C. Wolf, P.L. Spence, W.H. Pirkle, E.M. Derrico, D.M. Cavender, G.P. Rozing, J.
Chromatogr. A, 782 (1997) 175.
309. C. Chaiyasut, T. Tsuda, S. Kitagawa, H. Walda, T. Monde, Y. Nakabeya, J.
Microcolumn Sep., 11 (1999) 590.
310. J.J. Pesek, M.T. Matyska, J. Liq. Chromatogr. Relat. Technol. 21 (1998) 2923-2934
311. W. Xu, F. Regnier, J. Chromatography A 853 (1999) 243.
312. G. Zhang, B. Xu, J. Chromatogr. A, 912 (2001) 335.
313. A.V. Pirogov, W. Buchberger, J. Chromatogr. A, 916 (2001) 51.
314. S. Mayer, X. Briand, E. Francotte, J. Chromatogr. A, 875 (2000) 331.
315. M.M. Dittmann, G.P. Rozing, G. Ross, T. Adam, K.K. Unger, J. Capillary
Electrophor., 4 (1997) 201.
316. U. Tallarek, E. Rapp, T. Scheenen, E. Bayer, H. Van As, Anal. Chem., 72 (2000) 2292.
317. M. Zhang, G.K. Ostrander, Z. El Rassi, J. Chromatogr. A, 887 (2000) 287.
318. M. Ye, H. Zou, Z. Liu, J. Ni, Y. Zhang, J. Chromatogr. A, 855 (1999) 137.
319. C.D. Byrne, N.W. Smith, H.S. Dearie, F. Moffatt, S.A.C. Wren, K.P. Evans, J.
Chromatogr. A, 927 (2001), 169.
320. M. Ye, H. Zou, Z. Lei, R. Wu, Z. Liu, J.Y. Ni, Electrophoresis, 22 (2001) 518.
321. R. Wu, H. Zou, M. Ye, Z. Lei, J.Y. Ni, Electrophoresis, 22 (2001) 544.
322. Z.J. Tan, V.T. Remcho, J. Microcolumn Sep., 10 (1998) 99.
323. Z.J. Tan, V.T. Remcho, Anal. Chem., 69 (1997) 581.
324. C. Fujimoto, Anal. Chem., 67 (1995) 2050.
325. C. Fujimoto, Y. Fujise, E. Matsuzawa, Anal. Chem., 68 (1996) 2753.
326. E.C. Peters, M. Petro, F. Svec, J.M.J. Fréchet, Anal. Chem., 69 (1997) 3646.
327. E.C. Peters, M. Petro, F. Svec, J.M.J. Fréchet, Anal. Chem., 70 (1998) 2296.

- 60 - Chapter 2
328. E.C. Peters, M. Petro, F. Svec, J.M.J. Fréchet, Anal. Chem., 70 (1998) 2288.
329. A.M. Enlund, C. Ericson, S. Hjerten, D. Westerlund, Electrophoresis, 22 (2001) 511.
330. J.-L. Liao, N. Chen, C. Ericson, S. Hjertén, Anal. Chem., 68 (1996) 3468.
331. T. Koide, K. Ueno, Anal. Sci., 15 (1999) 791.
332. R. Shediac, S.M. Ngola, D.J. Throckmorton, D.S. Anex, T.J. Shepodd, A.K. Singh, J.
Chromatogr. A, 925 (2001) 251.
333. C. Ericson, J.-L. Liao, K. Nakazato, S. Hjertén, J. Chromatogr. A, 767 (1997) 33.
334. A.H. Que, A. Palm, A.GF. Baker, M. Novotny, J. Chromatogr. A, 887 (2000) 379.
335. C. Ericson, J. Holm, T. Ericson, S. Hjertén, Anal. Chem., 72 (2000) 81.
336. C. Fujimoto, J. Kino, H. Sawada, J. Chromatogr. A, 716 (1995) 107.
337. J.J. Pesek, M.T. Matyska, S. Menezes, J. Chromatogr. A, 853 (1999) 151.
338. A. Palm, M. Novotny, Anal. Chem., 69 (1997) 4499.
339. D. Hoegger, R. Freitag, J. Chromatogr. A, 914 (2001) 211.
340. S. Hjertén, Ind. Eng. Chem. Res., 38 (1999) 1205.
341. A.H. Que, V. Kahle, M. Novotny, J. Microcolumn Sep., 12 (2000) 1.
342. T. Jiang, J. Jiskra, H.A. Claessens, C.A. Cramers, J. Chromatogr. A, 923 (2000) 215.
343. S. Zhang, X. Huang, J. Zhang, Cs. Horváth, J. Chromatogr. A, 887 (2000) 465.
344. S. Zhang, J. Zhang, Cs. Horváth, J. Chromatogr. A, 914 (2001) 189.
345. M. Lämmerhofer, F. Svec, J.M.J. Frechét, W. Lindner, Anal. Chem., 72 (2000), 4623.
346. T. Koide, K. Ueno, J. High Resolut. Chromatogr., 23 (2000) 59-.
347. Á. Végvári, A. Földesi, C. Hetényi, O. Kocnegarova, M. Schmid, V. Kudirkaite, S.
Hjertén, Electrophoresis, 21 (2000) 3116.
348. M. Lämmerhofer, F. Svec, J.M.J. Fréchet, W. Lindner, J. Chromatogr. A, 925 (2001)
265.
349. T. Koide, K. Ueno, J. Chromatogr. A, 909 (2001) 305.
350. E.C Peters, K. Lewandowski, M. Petro, F. Svec, J.M.J. Fréchet, Anal. Commun., 35
(1998) 83.
351. M. Schmid, N. Grobuschek, C. Tuscher, G. Guebitz, Á. Végvári, A. Maruska, S.
Hjertén, Electrophoresis, 21 (2000) 3141.
352. L. Schweitz, L.I. Andersson, S. Nilsson, J. Chromatogr. A, 792 (1997) 401.
353. L. Schweitz, L.I. Andersson, S. Nilsson, Anal. Chem., 69 (1997) 1179.
354. J.-M. Lin, T. Nakagama, K. Uchiyama, T. Hobo, Biomed. Chromatogr., 11 (1997) 298.
355. Z.J. Tan, V.T. Remcho, Electrophoresis, 19 (1998) 2055.

Stationary and Mobile Phases in CEC - 61 -
356. J.-M. Lin, T. Nakagama, K. Uchiyama, T. Hobo, J. Pharm. Biomed. Anal., 15 (1997)
1351.
357. J.-M. Lin, T. Nakagama, K. Uchiyama, T. Hobo, J. Liq. Chromatogr. Relat. Technol.,
20 (1997) 1489.
358. J. Saevels, M. Wuyts, A. Van Schepdael, J. Hoogmartens, Biomed. Chromatogr., 12
(1998) 149.
359. B. Xiong, L. Zhang, Y. Zhang, H. Zou, J. Wang, J. High Resolut. Chromatogr., 23
(2000) 67.
360. Y. Liu, D.J. Pietrzyk, J. Chromatogr. A, 920 (2001) 367.
361. X. Huang, J. Zhang, Cs. Horváth, J. Chromatogr. A, 858 (1999) 91.
362. I. Gusev, X. Huang, Cs. Horváth, J. Chromatogr. A, 855 (1999) 273.
363. K. Hosoya, H. Ohta, K. Yoshizako, K. Kimata, T. Ikegami, N. Tanaka, J. Chromatogr.
A, 853 (1999) 11.
364. M.C. Breadmore, M. Macka, P.R. Haddad, Electrophoresis, 20 (1999) 1987.
365. K. Jinno, J. Wu, H. Sawada, Y. Kiso, J. High Resolut. Chromatogr., 21 (1998) 617.
366. R. Alicea-Maldonando, L.A. Colón, Electrophoresis, 20 (1999) 37.
367. C. Fujimoto, M. Sakurai, Y. Muranaka, J. Microcolumn Sep., 11 (1999) 693.
368. S. Kitagawa, T. Tsuda, Anal. Sciences, 14 (1998) 571.
369. S. Kitagawa, A. Tsuji, H. Watanabe, M. Nakashima, T. Tsuda, J. Microcolumn Sep., 9
(1997) 347.
370. S. Kitagawa, H. Watanabe, T. Tsuda, Electrophoresis, 20 (1999) 9.
371. W.-H. Chen, S.-Y. Lin, C.-Y. Liu, Anal. Chim. Acta, 410 (2000) 25.
372. K. D. Cole, H. Cabezas, Jr., J. Chromatogr. A, 760 (1997), 259.
373. M.C. Boyce, M.C. Breadmore, M. Macka, P. Doble, P.R. Haddad, Electrophoresis, 21
(2000) 3073.
374. M.C. Breadmore, M.C. Boyce, M. Macka, N. Avdalovic, P.R. Haddad, J. Chromatogr.
A, 892 (2000) 303.
375. E.F. Hilder, C.W. Klampfl, P.R. Haddad, J. Chromatogr. A, 890 (2000) 337.
376. K. Krause, B. Chankvetadze, Y. Okamoto, G. Blaschke, Electrophoresis, 20 (1999)
2772.
377. C. Karlsson, L. Karlsson, D.W. Armstrong, P.K. Owens, Anal. Chem., 72 (2000) 4394.
378. Y. Guo, L.A. Colón, Anal. Chem., 67 (1995) 2511.
379. Q. Tang, N. Wu, M. Lee, J. Microcolumn Sep., 11 (1999) 550.

- 62 - Chapter 2
380. D.H. Thomas, D.J. Rakestraw, J.S. Schoeniger, V. Lopez-Avila, J. Van Emon,
Electrophoresis, 20 (1999) 57.
381. C. Wolf, P.L. Spence, W.H. Pirkle, D.M. Cavender, E.M. Derrico, Electrophoresis, 21
(2000) 917.
382. M.C. Breadmore, M. Macka, N. Avdalovic, P.R. Haddad, Analyst, 125 (2000) 1235.
383. H. Sawada, K. Jinno, Electrophoresis, 20 (1999) 24.
384. M.R. Schure, R.E. Murphy, W.L. Klotz, W. Lau, Anal. Chem., 70 (1998) 4985.
385. S. Kitagawa, T. Tsuda, J. Microcolumn Sep., 6 (1994) 91.
386. N. Ishizuka, H. Minakuchi, K. Nakanishi, N. Soga, H. Nagayama, K. Hosoya, N.
Tanaka, Anal. Chem., 72 (2000) 1275.
387. M. Gilar, A. Belenky, A.S. Cohen, Electrophoresis, 21 (2000) 2999-3009
388. M. C. Breadmore, E.F. Hilder, M. Macka, N. Avdalovic, P.R. Haddad, Electrophoresis,
22 (2001) 503.
389. T. Sakaki, S. Kitagawa, T. Tsuda, Electrophoresis, 21 (2000) 3088.
390. B. Xin, M. Lee, Electrophoresis, 20 (1999) 67.
391. H. Jakubetz, H. Czesla, V. Schurig, J. Microcolumn Sep., 9 (1997) 421.
392. J.-R. Chen, M.T. Dulay, R.N. Zare, F. Svec, E.C. Peters, Anal. Chem., 72 (2000) 1224.
393. J.-M. Lin, T. Nakagama, X.-Z. Wu, U. Katsami, T. Hobo, Fresenius’ J. Anal. Chem.,
357 (1997) 130.
394. J.-M. Lin, K. Uchiyama, T, Hobo, Chromatographia, 47 (1998) 625.
395. S. Lüdtke, T. Adam, K.K. Unger, J. Chromatogr. A, 786 (1997) 229.
396. X. Zhang, F. Regnier, J. Chromatogr. A, 869 (2000) 319.
397. T. Tsuda, Y. Muramatsu, J. Chromatogr., 515 (1990) 645.
398. G. Chirica, V.T. Remcho, Anal. Chem., 72 (2000) 3605.
399. N. Gottschlich, S.C. Jacobson, C.T. Culbertson, J.M. Ramsey, Anal. Chem., 73 (2001)
2669.
400. E. Venema, J.C. Kraak, H. Poppe, R. Tijssen, Chromatographia, 48 (1998) 347.
401. T. Tsuda, Anal. Chem., 60 (1988) 1677.
402. C. Schwer, E. Kenndler, Anal. Chem., 63 (1991) 1801.
403. P. Gfrörer, J. Schewitz, K. Pusecker, E. Bayer, Anal. Chem., (1999) 315A.
404. N. Ishizuka, H. Minakuchi, K. Nakanishi, N. Soga, H. Nagayama, K. Hosoya, N.
Tanaka, Anal. Chem., 72 (2000) 1275.
405. H. Sawada, K. Jinno, Electrophoresis, 20 (1999) 24.

Stationary and Mobile Phases in CEC - 63 -
406. Y. Li, H. Liu, X. Ji, J. Li, Electrophoresis, 21 (2000) 3109.
407. M.R. Euerby, D. Gilligan, C.M. Johnson, S.C.P. Roulin, P. Myers, K.D. Bartle, J.
Microcolumn Sep., 9 (1997) 373.
408. T. Adam, K.K. Unger, J. Chromatogr. A, 894 (2000) 241.
409. A. Cavazza, K.D. Bartle, P. Dugo, L. Mondello, Chromatographia, 53 (2001) 57.
410. S. Dube, R.M. Smith, Chromatographia, 53 (2001) 51.
411. D.B. Strickmann, B. Chankvetadze, G. Blaschke, C. Desiderio, S. Fanali, J.
Chromatogr. A, 887 (2000) 393.
412. A.H. Que, T. Konse, A.G. Baker, M.V. Novotny, Anal. Chem., 72 (2000) 2703.
413. Q. Tang, M.L. Lee, J. Chromatogr. A, 887 (2000) 265.
414. J.P.C. Vissers, H.A. Claessens, P. Coufal, C.A. Cramers, J. High Resolut. Chromatogr.,,
18 (1995) 540.
415. J. Ding, P. Vouros, J. Chromatogr. A., 887 (2000) 103.
416. M. Lämmerhofer, F. Svec, J.M.J. Fréchet, W. Lindner, TrAC, Trends Anal. Chem., 19
(2000) 676.
417. M.J. Hilhorst, G.W. Somsen, G.J. de Jong, J. Chromatogr. A, 872 (2000) 315.
418. M. Meyring, B. Chankvetadze, G. Blaschke, J. Chromatogr. A, 876 (2000) 157.
419. K.W. Whitaker, M.J. Sepaniak, Electrophoresis, 15 (1994) 1341.

- 64 - Chapter 2

- 65 -
CHAPTER 3 3 CHROMATOGRAPHIC PROPERTIES OF REVERSED
PHASE STATIONARY PHASES UNDER PRESSURE AND
ELECTRO DRIVEN CONDITIONS; EFFECT OF
ORGANIC MODIFIER
Summary
Seven different reversed-phase (RP) stationary phases were examined under pressure- viz.
liquid chromatographic and electro-driven viz. capillary electrochromatographic
conditions. Characterization of the stationary phases was performed following well-
established test procedures providing a number of distinct column descriptors –
hydrophobicity, hydrophobic selectivity and silanol activity. These parameters were used
to describe the behaviour of the RP-columns under both pressure- and electro-driven
conditions. It is shown that chromatographic characteristics of porous RP-phases
substantially depend on the mode of operation. In contrast column descriptors of a non-
porous viz. solid RP-phase material hardly differed under pressure- and electro-driven
conditions.
This chapter has been published: J. Jiskra, C.A. Cramers, M. Byelik, H.A. Claessens, J. Chromatogr. A, 862 (1999) 121.
3.1 Introduction Capillary electrochromatography (CEC) is a recently developed separation technique
combining the excellent efficiency usually achieved in electrophoretic separation techniques
and the high selectivity which is characteristic for high-performance liquid chromatography

- 66 - Chapter 3
(HPLC) [1, 2]. At present CEC is considered as a potential alternative technique for micro-
HPLC which latter technique has been already established for longer time [3-7]. Many
papers have been published recently on the theory and practical aspects in
electrochromatography [8-22]. A number of these reports start from the theoretical
concepts originating from capillary electrophoresis (CE) explaining the high efficiencies
from the plug-like velocity profiles obtained in these techniques [20-22]. Yan et al. [23]
compared the efficiencies that can be achieved in CEC and in micro-HPLC of 50 µm I.D.
columns packed with 3 µm Hypersil ODS. They found significantly higher efficiency for
the column under electro-driven conditions. As discussed in [24], in CEC the flow velocity
and the plug-like velocity profile are not dependent on the particle size down to
approximately 0.5 µm or even lower as long as no double-layer overlapping occurs [24-26].
Opposite to HPLC where the use of smaller particles is seriously limited by pressure drop
limitations, in CEC such small particles can be easily used. This makes CEC potentially a
highly efficient technique compared to HPLC. Furthermore, based on detection
developments in the field of micro-HPLC, on-column fluorescence detection was recently
introduced into CEC, too and provides additional increase in efficiency [27-28]. At present
the introduction of CEC is hampered by two major problems. First the technical difficulties
encountered in the manufacturing of suitable and reliable CEC columns are still substantial.
In addition the achievement of a sufficient and stable electroosmotic flow (EOF) and the
mechanical stability of the packed bed in CEC-columns are still problematic. Secondly there
remains a number of major questions on the backgrounds of retention and selectivity in
CEC. In that framework the eventual changes in physico-chemical properties of HPLC
stationary phases under electrically driven conditions is an issue of great interest. For
instance Vissers et al. [29] earlier showed that using the same stationary phase the retention
for neutral compounds in CEC is about 20% higher than under micro-HPLC mode. In
contrast Eimer et al. [30] found that for more hydrophobic analytes the retention factors
were 36-40% lower in pressurized electrochromatography (PEC) than in capillary LC. They
concluded that this might be attributed to the higher polarity of the stationary phase under
electric field conditions. Using RP columns Wei et al. [31] used solvatochromic parameters
to study retention in CEC and found that the retention behaviour under pressure- and
electro-driven conditions is very dissimilar for these columns. It appeared that the hydrogen
bond acidity and dipolarity/polarizibity of solutes play a more dominant role in CEC than

Chromatographic Properties of Reversed Phase … - 67 -
in HPLC. Furthermore they conclude that the effects of solute size and hydrogen bond
basicity on retention are similar in both separation modes. Djordjevic et al. [32] compared
the retention mechanism of neutral solutes under CEC and HPLC conditions and observed
lower retention factors for the former mode on a column packed with CEC Hypersil C18 3
µm. They attributed the differences to the heat generation in CEC which causes significant
differences between the set and the actual column temperature. Opposite to the findings
reported above Zhang et al. [33] found the retention behaviour in CEC comparable to that
in HPLC and obtained similar linear energy equations in CEC, PEC and HPLC using linear
solvatation energy relationship analysis. In another report it has also been shown that
HPLC methods for neutral compounds can be easily transferred to CEC [34]. Applying
further identical conditions the comparison of stationary phases in the pressure- and
electro-driven mode may reveal an answer for these partly contradictory findings.
Following this approach this paper seeks to characterize and to compare a number of
reversed-phase stationary phases under pressure versus electrically driven conditions. The
characterization of the columns in both modes was performed using a well-defined
standard test mixture and test procedure described by Galushko [35]. In addition also other
tests were performed for column evaluation.
3.2 Experimental 3.2.1 Columns The columns used in this study are listed in Table 3.1 together with relevant data provided
by the manufacturer. The column packed bed was 25 cm, and 33.5 cm total length. Prior
to use in CEC, the columns were conditioned. This was accomplished by applying 10 bar
pressure on both sides of the column and increasing the voltage from 0-25 kV in 5 kV
steps per 10 min. After that the pressure was increased to 12 bar and a 30 kV voltage was
applied for 10 min. For the micro-HPLC experiments, the columns were conditioned
until the column pressure was stabilized (approx. 1 h). Note that in these experiments the
same columns were tested under pressure- and electro-driven conditions using the same
batches of eluents. All columns were tested preferably in order CEC, HPLC to ensure the
same flow velocity size.

- 68 - Chapter 3
Table 3.1 List of investigated columns.
Column/Stationary phase
Column Diameter
Average Particle size
Nominal Pore Size
Å
Hypersil ODS 75 µm 3 µm 120
CEC Hypersil C18 75 µm 3 µm 120
CEC Hypersil C18 (1) 100 µm 2.5 µm 120
CEC Hypersil C18 (2) 100 µm 2.5 µm 120
Unimicro C18 75 µm 3 µm 300
Unimicro C8 75 µm 3 µm 300
Unimicro Phenyl 75 µm 3 µm 300
Micra NPS ODS 75 µm 3 µm Non-porous
(1), (2) = home-packed columns.
3.2.2 Instrumentation All CEC chromatograms were obtained on an Agilent Technologies 3DCE (Agilent
Technologies GmbH, Waldbronn, Germany) instrument equipped with a pressure facility
of up to 12 bar at the outlet and/or inlet vial. This pressurization option of the instrument
was used to prevent bubble formation in the capillaries. Samples were injected
electrokinetically (5 kV for 2-15 s). For each run a voltage of 20 kV (600 V.cm-1 electric
field strength) was applied with 10 bar pressure on both ends of a capillary. The detection
wavelengths were 210 and/or 254 nm. High voltage was applied as 6-s time ramp to avoid
column stress. The column cassette temperature was maintained at 20ºC.
Micro HPLC separations were carried out on a system consisting of a Phoenix 20 CU
syringe pump (Carlo Erba Instruments, Milan, Italy), a microUVIS20 ultraviolet/visible
absorbance detector (Carlo Erba Instruments, Milan, Italy) operating at 210 or 254 nm, and
an injector with a 200 nL loop (VICI-AG Valco Europe, Schenkon, Switzerland). The flow-
rate was approx. 0.2-0.3 µL/min using a 1/100-flow splitter. The experiments were
performed at air-conditioned laboratory temperature (±21ºC) without additional
thermostating.

Chromatographic Properties of Reversed Phase … - 69 -
3.2.3 Chemicals The buffer consisted of di-sodium tetraborate decahydrate (Merck, Darmstadt, Germany),
dissolved in deionized water and adjusted to pH=8.0 using concentration hydrochloric acid
(Merck, Darmstadt, Germany). Acetonitrile (ACN) and methanol (MeOH) were used as
organic modifiers and were of HPLC supra gradient-grade purity (both from Biosolve,
Valkenswaard, Netherlands). The eluents were prepared by mixing the tetraborate buffer
with an appropriate amount of the organic modifier and degassed (5 min) with helium prior
to use. The same batch of eluent was used to test a specific column in both separation
modes. Ionic strength in the eluent was kept constant at a tetraborate concentration of
1.5 mmol.L-1. The test sample comprised the following compounds: thiourea (t0), phenol,
aniline, benzene, toluene, p-ethylaniline, N,N-dimethylaniline, ethylbenzoate, ethylbenzene,
biphenyl, naphthalene, fluorene, anthracene (all from Merck, Darmstadt, Germany).
Samples were prepared by dissolving these compounds in the mobile phase or in the pure
organic modifier and then diluted with the tetraborate buffer.
3.2.4 Test procedure For the characterization of the RPLC stationary phases under CEC and HPLC conditions
a test procedure described by Galushko, was applied [35]. Opposite to the aqueous
methanol eluents used in the original test in our experiments we applied a tetraborate
buffer pH=8.0 (to guarantee a sufficient electroosmotic flow velocity for all tested
columns together with minimal packing degradation [50]) instead of water. Furthermore,
besides methanol also acetonitrile was used as another organic modifier in these column
tests. Both modifiers were used at various concentrations in the eluents. Unless otherwise
noted the standard test conditions were the following:
Eluent: methanol/aqueous tetraborate buffer pH=8.0 60/40 V/V
Temperature: 20ºC
Test compounds: thiourea (t0), aniline, phenol, benzene, and toluene.
Column descriptors were obtained using the software ChromLife (Merck, Darmstadt,
Germany) and comprised of following parameters:
1. Hydrophobicity (H) = (kbenzene + ktoluene)/2

- 70 - Chapter 3
2. Hydrophobic (methylene) selectivity (HS); retention data of benzene, toluene and
phenol are used to calculate capacity factors of ethylbenzene and propylbenzene
as described [35].
(HS)=kpropylbenzene/kethylbenzene
3. Silanol activity (NI) =1+3×[kaniline/kphenol - 1]
k = retention factor
To preserve a sufficient wetted state of the stationary phase ligands column tests were
performed not below 20% organic modifier. Table 3.2 further summarizes retention times
of thiourea in CEC as a t0 marker for all columns and all mobile phase compositions. Flow
velocity in HPLC mode for a given condition was adjusted to that in CEC mode.
Table 3. 2 Retention times of thiourea in CEC as a t0 marker for all columns measured at several
percentages of methanol and acetonitrile as organic modifier; test compound: thiourea (t0); eluent:
mixtures of methanol or acetonitrile and tetraborate buffer (1.5 mM in total); for other
experimental conditions see text; (-) = data not available ACN (%) MeOH (%) Column
30 40 50 60 70 80 50 60 65 70 75 80
Hypersil ODS
3 µµµµm
4.049
±0.024
3.186
±0.013
3.504
±0.010
3.010
±0.010
2.714
±0.022
- 5.676
±0.029
5.965
±0.023
5.699
±0.014
5.714
±0.010
5.023
±0.017
-
CEC Hypersil C18
3 µµµµm
- 2.048
±0.021
2.085
±0.011
2.340
±0.017
2.318
±0.020
2.400
±0.004
- - - - - -
CEC Hypersil C18
2.5 µµµµm (1)
4.467
±0.025
4.118
±0.024
3.915
±0.015
3.875
±0.013
3.579
±0.021
3.510
±0.015
7.721
±0.027
8.475
±0.039
8.396
±0.033
8.249
±0.036
8.043
±0.035
-
CEC Hypersil C18
2.5 µµµµm (2)
4.065
±0.027
3.582
±0.020
3.604
±0.009
3.603
±0.001
3.444
±0.010
3.285
±0.003
- - - - - -
Unimicro C18
3 µµµµm
- 5.379
±0.013
5.183
±0.006
4.955
±0.018
4.744
±0.024
4.616
±0.012
- 13.014
±0.009
12.880
±0.008
13.078
±0.012
15.588
±0.011
12.106
±0.010
Unimicro C8
3 µµµµm
- 3.374
±0.004
2.269
±0.002
3.149±
0.007
3.119
±0.007
3.047
±0.005
- 15.601
±0.007
15.371
±0.012
15.125
±0.019
14.086
±0.016
13.694
±0.025
Unimicro Phenyl
3 µµµµm
- 4.029
±0.014
4.058
±0.018
3.871
±0.009
3.758
±0.015
3.410
±0.012
9.292
±0.013
9.308
±0.012
9.098
±0.009
8.899
±0.023
8.633
±0.019
8.472
±0.022
Micra NPS ODS
3 µµµµm
5.310
±0.001
5.162
±0.003
5.133
±0.002
- - - 11.075
±0.009
13.004
±0.006
14.149
±0.008
- - -

Chromatographic Properties of Reversed Phase … - 71 -
For details about this test method the reader is referred to paper [35] and references
therein. The other test compounds (PAHs, p-ethylaniline, N,N-dimethylaniline) were used
for additional tests of the RP stationary phases under study. Under all conditions all the
solutes are supposed to behave as neutral compounds. None of them is subjected to
electrophoretic mobility, which has been proved by capillary zone electrophoresis
experiments.
3.3 Results and discussion 3.3.1 Column hydrophobicity and hydrophobic selectivity As an example in Fig. 3.1a and Fig. 3.1b hydrophobic selectivities (HS) obtained on the
Unimicro C18 3 µm and Unimicro Phenyl 3 µm columns under pressure-driven (HPLC)
and electro-driven (CEC) conditions are plotted. Under HPLC conditions for RP-phases of
similar ligand length generally the selectivity of specific increments (e.g. CH2-group) is fairly
constant under constant experimental conditions and decreases with increasing portions of
organic modifier in the eluent [36-38].
1.1
1.2
1.3
1.4
1.5
1.6
1.7
0 10 20 30 40 50 60 70 80 90 100
ACN (%)
HS
(hyd
roph
obic
sel
ectiv
ity)
CEC
HPLC
Figure 3.1a
Hydrophobic selectivity (HS) values for the Unimicro C18 3 µm column under pressure-
and electro-driven conditions; eluent: tetraborate buffer (1.5 mM in total), pH=8.0 and
acetonitrile, detection: 254 nm; test compounds: thiourea (t0), phenol, benzene, toluene; for
other experimental conditions see section 3.2.2 Instrumentation.

- 72 - Chapter 3
In addition, ideally under further similar conditions stationary phases behaving identical
under both HPLC and CEC eluent-drive conditions will show equal to one ratios of
specific chromatographic properties e.g. hydrophobicity or hydrophobic selectivity.
1.1
1.2
1.3
1.4
1.5
1.6
1.7
0 10 20 30 40 50 60 70 80 90 100
ACN (%)
HS
(hyd
roph
obic
sel
ectiv
ity)
CEC
HPLC
Figure 3.1b
Hydrophobic selectivity (HS) values for the Unimicro Phenyl 3 µm column under pressure-
and electro-driven conditions; eluent: tetraborate buffer (1.5 mM in total), pH=8.0 and
acetonitrile, detection: 254 nm; test compounds: thiourea (t0), phenol, benzene, toluene; for
other experimental conditions see section 3.2.2 Instrumentation.
The HS-values on the Unimicro C18 3 µm column (Fig. 3.1a) are in good agreement with
data usually obtained under HPLC conditions on RP-columns. Furthermore, the HS-values
obtained under HPLC and CEC conditions on this column differ not much if at all,
suggesting a similar behaviour of this stationary phase for both separation modes. In
contrast the HS-values obtained at 70 and 80% organic modifier on the Unimicro Phenyl
3 µm column differ significantly up to 23%.
In Fig. 3.2 the CH2-selectivity ratios HSHPLC/HSCEC of all columns are presented together
with the ideal line HSHPLC/HSCEC=1; HSHPLC and HSCEC represent hydrophobic selectivity
obtained in the HPLC and CEC modes, respectively, under further similar experimental
conditions.

Chromatographic Properties of Reversed Phase … - 73 -
0.8
0.85
0.9
0.95
1
1.05
1.1
1.15
0 10 20 30 40 50 60 70 80 90 100
Concentration of org. modifier (%)
HS H
PLC/H
S CEC
Hypersil ODS 3 µm (ACN) Hypersil ODS 3 µm (MeOH) Hypersil CEC ODS 3 µm (ACN)Hypersil CEC ODS 2.5 µm (ACN) -1 Hypersil CEC ODS 2.5 µm (MeOH) -1 Hypersil CEC ODS 2.5 µm (ACN)- 2Unimicro C18 3 µm (ACN) Unimicro C18 3 µm (MeOH) Unimicro C8 3 µm (ACN)Unimicro C8 3 µm (MeOH) Unimicro Phenyl 3 µm (ACN) Unimicro Phenyl 3 µm (MeOH)NPS ODS II 3 µm (ACN) NPS ODS II 3 µm (MeOH)
Figure 3.2 Ratios of CH2-selectivities under pressure- and electro-driven conditions HSHPLC/HSCEC
for all columns for methanol and acetonitrile as organic modifier; eluent: tetraborate buffer
(1.5 mM in total) pH=8.0 and organic modifier (for each column indicated in brackets);
detection: 254 nm; test compounds: thiourea (t0), phenol, benzene, toluene; for other
experimental conditions see section 3.2.2 Instrumentation. ()=HSHPLC/HSCEC=1.
In addition somewhat lower deviations in HS-ratios of up to –8% for the Hypersil ODS
3 µm (ACN), more polar phases such as the CEC Hypersil C18 2.5 µm -2 (ACN),
Unimicro Phenyl 3 µm (MeOH), Unimicro C8 3 µm (ACN and MeOH), and one of the
self-packed CEC Hypersil C18 2.5 µm – No. 2 (ACN), showed deviations in HSHPLC/HS-
CEC-ratios of up to ±10%. Unimicro C8 3 µm column for both acetonitrile and methanol as
organic modifier, and ±6% for the Hypersil ODS 3 µm (ACN) columns were obtained. An
unexplained exception is the 5% and the 23% deviation found for the Unimicro Phenyl
3 µm column using 70 and 80% of acetonitrile, respectively. At all other modifier
concentrations for this column the HS-ratio deviation is maximally 5%. All other columns
showed only moderate deviations of a few percents in their HSHPLC/HSCEC ratios. More
specifically the changes were up to 1.7%, 4% and -2% for the CEC Hypersil C18 3 µm
under ACN-conditions, the NPS ODS 3 µm and the Hypersil ODS 3 µm, respectively,

- 74 - Chapter 3
used with methanol as the organic modifier. Hydrophobicity and hydrophobic selectivity
are related to length, ordering and orientation of the ligands on a substrate’s surface [39,40].
More particularly orientation and ordering will also depend on ligand coverage density and
the nature and concentration of the organic modifier [41]. Since the column tests only
differed in the mode of application (CEC vs. HPLC), we speculate that the observed
deviations in HSHPLC/HSCEC ratios must be attributed to stationary phase changes under
electrical field conditions. This is in agreement with findings of others like Eimer et al. [30],
Wei et al. [31], and Angus et al. [42], who also observed dissimilarities in stationary phase
properties under HPLC and CEC conditions. Obviously, even not all nominally identical
stationary phases respond in a similar way to the application of an electrical field. For
instance, the HS-values of the CEC Hypersil C18 2.5 µm and the CEC Hypersil C18
2.5 µm (No. 2) both under acetonitrile conditions are 10 and 2%, respectively.
In contrast to these relatively small deviations in HS-ratios, much larger differences in
hydrophobicity (H) properties were found. As an example in Fig. 3.3 the hydrophobicity
(H) values obtained under HPLC and CEC conditions for CEC Hypersil C18 3 µm for
acetonitrile as organic modifier are presented. Obviously, for this column hydrophobicity
significantly differs under both these conditions. In addition, column hydrophobicity in the
CEC mode is in all cases smaller than in the HPLC mode under further similar
experimental conditions. This finding is in accordance with earlier results of Eimer et al. [30]
who reported an average decrease of approximately up to 40% in hydrophobicity, when
applying an RP-column under PCEC (pressure-driven CEC) conditions. Furthermore, for
this column the hydrophobicity under HPLC conditions increases relatively more
compared to CEC conditions at decreasing fraction of acetonitrile in the eluent.
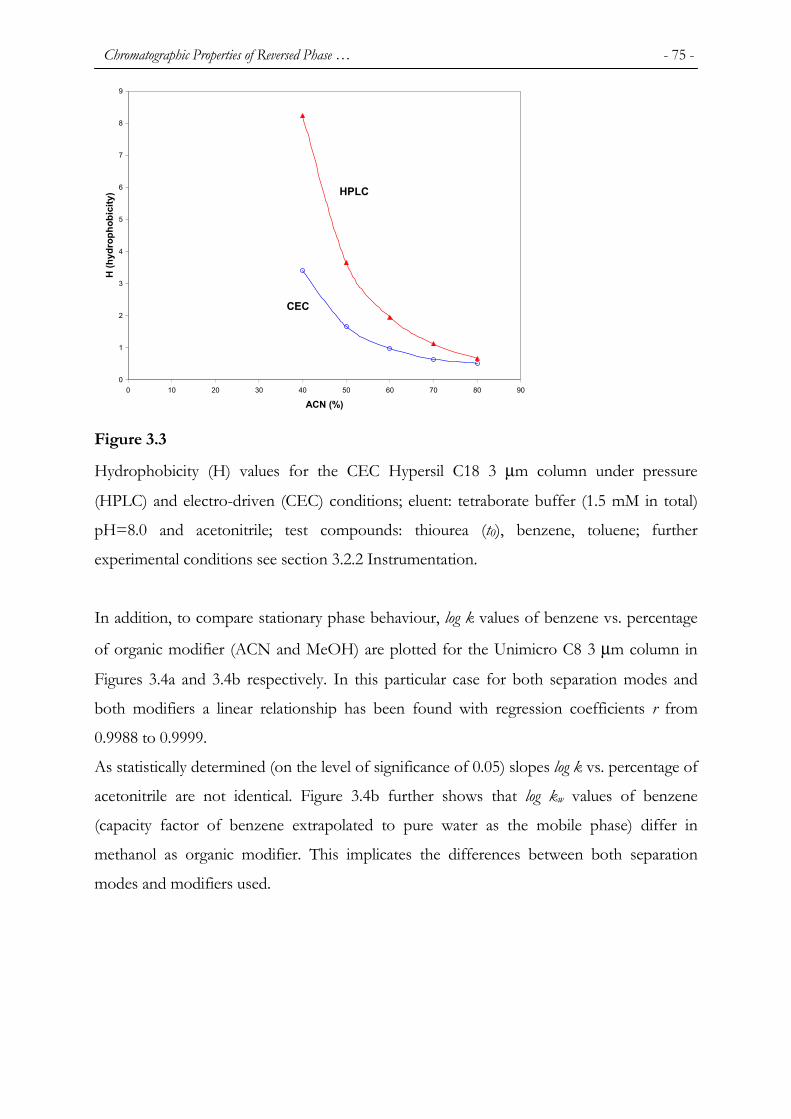
Chromatographic Properties of Reversed Phase … - 75 -
0
1
2
3
4
5
6
7
8
9
0 10 20 30 40 50 60 70 80 90
ACN (%)
H (h
ydro
phob
icity
) HPLC
CEC
Figure 3.3
Hydrophobicity (H) values for the CEC Hypersil C18 3 µm column under pressure
(HPLC) and electro-driven (CEC) conditions; eluent: tetraborate buffer (1.5 mM in total)
pH=8.0 and acetonitrile; test compounds: thiourea (t0), benzene, toluene; further
experimental conditions see section 3.2.2 Instrumentation.
In addition, to compare stationary phase behaviour, log k values of benzene vs. percentage
of organic modifier (ACN and MeOH) are plotted for the Unimicro C8 3 µm column in
Figures 3.4a and 3.4b respectively. In this particular case for both separation modes and
both modifiers a linear relationship has been found with regression coefficients r from
0.9988 to 0.9999.
As statistically determined (on the level of significance of 0.05) slopes log k vs. percentage of
acetonitrile are not identical. Figure 3.4b further shows that log kw values of benzene
(capacity factor of benzene extrapolated to pure water as the mobile phase) differ in
methanol as organic modifier. This implicates the differences between both separation
modes and modifiers used.

- 76 - Chapter 3
Figure 3.4
Log k values of benzene for the Unimicro C8 3 µm column under pressure (HPLC) and
electro-driven (CEC) conditions; eluent: tetraborate buffer (1.5 mM in total) pH=8.0 and a)
acetonitrile or b) methanol; test compound: benzene; further experimental conditions see
section 3.2.2 Instrumentation.
In Fig. 3.5 the hydrophobicity ratios HHPLC/HCEC for all columns are presented together
with the ideal line HHPLC/HCEC=1. From these results it is obvious that significant
differences in hydrophobicity occur depending on whether a column is used under HPLC
or CEC conditions. Besides the specific properties of the stationary phase, this also appears
to depend on the nature and concentration of the applied organic modifier. For instance,
deviations in column HHPLC/HCEC ratios are up to 47% for Hypersil ODS 3 µm and -59%
for CEC Hypersil C18 3 µm for acetonitrile as the organic modifier in the buffer. In
addition, deviations in HHPLC/HCEC ratios of up to –25% in ACN and also in MeOH for
the Unimicro C18 3 µm, 31% for the Unimicro C8 3 µm column and up to 22% for CEC
Hypersil C18 2.5 µm (No. 2) both for acetonitrile were observed. Note that these Hypersil
and Unimicro packings have nominal pore sizes of 120 Å and 300 Å, respectively. Within
this limited number of packing materials no clear influence of pore size on HHPLC/HCEC
ratios could be observed. The smallest deviations were found for the CEC Hypersil C18
2.5 µm column (No. 1) (up to 5%) and NPS ODS 3 µm (± 5%for both ACN and MeOH).
log k = -0.0279φ + 1.5843 r = -0.9998
log k = -0.0279φ + 1.6414 r = -0.9999
-1.3
-1.1
-0.9
-0.7
-0.5
-0.3
-0.1
0.1
0.3
0.5
0 10 20 30 40 50 60 70 80 90 100
Concentration of methanol (%)
Log
k(be
nzen
e)
HPLC
CEC
log k = -0.0223φ + 1.1149 r = -0.9988
log k = -0.0237φ + 1.1058 r = -0.9994
-1.5
-1.3
-1.1
-0.9
-0.7
-0.5
-0.3
-0.1
0.1
0.3
0.5
0 10 20 30 40 50 60 70 80 90 100
Concentration of acetonitrile (%)
Log
k(be
nzen
e)
HPLC
CEC
a) b)

Chromatographic Properties of Reversed Phase … - 77 -
0
0.5
1
1.5
2
2.5
0 10 20 30 40 50 60 70 80 90 100
Concentration of org. modifier (%)
HHPLC/HCEC
Hypersil ODS 3 µm (ACN) Hypersil ODS 3 µm (MeOH) Hypersil CEC ODS 3 µm (ACN)Hypersil CEC ODS 2.5 µm (ACN) -1 Hypersil CEC ODS 2.5 µm (MeOH) -1 Hypersil CEC ODS 2.5 µm (ACN)- 2Unimicro C18 3 µm (ACN) Unimicro C18 3 µm (MeOH) Unimicro C8 3 µm (ACN)Unimicro C8 3 µm (MeOH) Unimicro Phenyl 3 µm (ACN) Unimicro Phenyl 3 µm (MeOH)NPS ODS II 3 µm (ACN) NPS ODS II 3 µm (MeOH)
Figure 3.5 Ratios of hydrophobicities HHPLC/HCEC of the columns under pressure- and electro-driven
conditions using methanol and acetonitrile as organic modifier (for each column indicated
in brackets); ()=HHPLC/HCEC=1; further experimental conditions see section 3.2.2
Instrumentation.
With an exception of CEC Hypersil ODS 2.5 µm (No. 2) HHPLC/HCEC-ratios of the porous
packing materials generally are much closer to one for methanol than acetonitrile as the
organic modifier. These modifiers significantly differ in their hydrogen bond donor capacity
(MeOH; 0.43 vs. 0.15 for ACN) and polarity/polarizability (0.60 for ACN and 0.28 for
methanol) [43]; (normalized values).
These differences in the physico-chemical properties between both these modifiers are
responsible for different state of wettability and interphase layer of the ligands under
normal HPLC conditions [41,44-45]. We assume that in addition to these effects the
application of an electrical field may cause different ligand orientation in the interphase
resulting in the observed differences in HHPLC/HCEC-ratios. An alternative explanation
might be found in the phase ratios of CEC columns under HPLC and CEC conditions. As

- 78 - Chapter 3
earlier discussed by Antle and Ying and co-workers [39, 40] the various phase ratios of RP-
columns often count significantly for the major part of the observed differences in
hydrophobicities between columns rather than differences in distribution coefficients.
Rathore and Horváth discussed the phenomenon of “electroosmotic whirlwind” around
particles and pores [46] of packings under CEC-conditions. It is worthwhile mentioning
that measurining actual phase ratio of columns under different eluent driven conditions in
rather impossible.
These effects may cause limited access of test probes to the stationary phase internal pore
volume contributing to virtually different phase ratios.
It seems likely to assume that this effect will a.o. depends on the mean pore size and more
particularly, on the pore size distribution (fraction micropores versus macropores) in a
specific packing material. Further support for this assumption is found in the close to one
HHPLC/HCEC values observed for the non-porous (NPS) stationary phase in this study. For
this latter type of packing and for both organic modifiers these ratios are 0.95-1.02 over the
entire range of the modifier concentration. We assume that the nearly complete absence of
pores of this NPS phase prevents the occurrence of different phase ratio values, in turn
causing the constant HHPLC/HCEC ratios found.
3.3.2 Silanol activity Silanol activity of RP-columns is a rather empirical term and may include a number of van
der Waals and ion exchange solute to stationary phase interactions [47]. In the Galushko
test applied here, silanol activity is based on the measurement of the ratio of retention
factors of aniline and phenol.
Silanol activity data were calculated as a function of the nature and percentage of organic
modifier and results are summarized in Table 3.3.

Chromatographic Properties of Reversed Phase … - 79 -
Table 3.3 Silanol activity results for all columns measured at several percentages of methanol and
acetonitrile as organic modifier; test compounds: thiourea (t0), aniline, phenol; eluent: mixtures of
methanol or acetonitrile and tetraborate buffer (1.5 mM in total); for other experimental conditions
see text; (-) = data not available ACN (%) MeOH (%) Column Mode
30 40 50 60 70 80 50 60 65 70 75 80
HPLC 0.64 1.02 1.30 1.33 1.63 - 0.04 0.01 0.07 0.24 - - Hypersil ODS
3 µµµµm CEC 0.65 0.75 0.97 1.00 1.00 - 0.02 0.08 0.07 0.26 - -
HPLC - 1.47 1.52 1.97 2.19 2.48 - - - - - - CEC Hypersil C18
3 µµµµm CEC - 2.05 2.46 1.59 2.27 2.87 - - - - - -
HPLC - 1.51 1.76 1.96 2.25 3.00 - 1.26 1.24 - 1.51 - CEC Hypersil C18
2.5 µµµµm (1) CEC - 1.72 1.87 2.12 4.28 3.06 - 2.24 1.96 1.83 1.87 -
HPLC 1.38 1.60 1.82 2.09 2.41 2.94 - - - - - CEC Hypersil C18
2.5 µµµµm (2) CEC 1.16 1.71 1.73 1.67 2.73 2.41 - - - - - -
HPLC - 1.00 1.19 1.53 1.68 1.98 2.18 1.00 1.00 1.00 1.00 1.00 Unimicro C18
3 µµµµm CEC - 1.05 1.32 1.52 1.83 2.30 2.07 0.67 0.83 0.34 1.00 -0.82
HPLC - 1.23 1.54 2.09 2.27 2.73 - 1.00 1.00 -0.06 1.00 1.00 Unimicro C8
3 µµµµm CEC - 1.00 1.37 1.66 2.17 6.87 - 0.53 0.71 1.00 1.00 1.00
HPLC - 1.50 1.81 2.56 5.35 1.00 1.51 1.93 2.54 2.94 3.39 4.42 Unimicro Phenyl
3 µµµµm CEC - 1.59 1.93 2.79 10.27 10.39 5.81 6.90 7.98 15.70 16.18 19.57
HPLC 1.00 1.00 1.00 - - - 1.00 1.00 1.00 - - - Micra NPS ODS
3 µµµµm CEC 1.00 1.00 1.00 - - - 1.00 1.00 1.00 - - -
In Fig. 3.6 the ratios of silanol activities NI(HPLC)/NI(CEC) measured on each column
are plotted together with the ideal line NI(HPLC/NI(CEC) = 1. From these results it can
immediately be seen that for some columns the silanol activity ratios vary substantially as
a function of the nature and fraction of the organic modifier in the buffer. For instance,
the NIHPLC/NICEC-ratios of Hypersil ODS 3 µm and Unimicro C18 and C8 3 µm with
methanol vary substantially over the investigated concentration range. In contrast for

- 80 - Chapter 3
these columns under acetonitrile conditions these ratios are smoother and less
pronounced. Note that from these columns under acetonitrile conditions the Hypersil
ODS 3 µm shows an NIHPLC/NICEC-ratio > 1. In all other cases depending on nature and
concentration of the modifier NI-ratios larger or smaller than one were found. In contrast
to the findings mentioned above other columns in this set showed for both modifiers
smoother and much less pronounced NIHPLC/NICEC-ratios over the investigated modifier
concentration range. E.g. for Unimicro phenyl 3 µm and Hypersil CEC ODS 2.5 µm (1)
for both modifiers rather smooth and constant ratios were found. This with an exception
for Unimicro Phenyl 3 µm in the 60-80% acetonitrile range. Note that the NIHPLC/NICEC-
ratio is < 1 under all conditions for the latter column.
-1.5
-1
-0.5
0
0.5
1
1.5
2
2.5
3
3.5
0 10 20 30 40 50 60 70 80 90 100
Concentration of org. modifier (%)
NI HPLC/NI CEC
Hypersil ODS 3 µm (ACN) Hypersil ODS 3 µm (MeOH) Hypersil CEC ODS 3 µm (ACN)Hypersil CEC ODS 2.5 µm (ACN) -1 Hypersil CEC ODS 2.5 µm (MeOH) -1 Hypersil CEC ODS 2.5 µm (ACN)- 2Unimicro C18 3 µm (ACN) Unimicro C18 3 µm (MeOH) Unimicro C8 3 µm (ACN)Unimicro C8 3 µm (MeOH) Unimicro Phenyl 3 µm (ACN) Unimicro Phenyl 3 µm (MeOH)NPS OD II 3 µm (ACN) NPS ODS II 3 µm (MeOH)
Figure 3.6 Ratios of silanol activity values NI(HPLC)/NI(CEC) of the columns under pressure- and
electro-driven conditions using methanol and acetonitrile as organic modifier (for each
column indicated in brackets); ()=NI(HPLC)/NI(CEC)=1, further experimental
conditions see section 3.2.2 Instrumentation.
For NPS ODS no difference in retention of aniline and phenol was found for both
modifiers. Consequently NIHPLC/NICEC-ratios were one over the entire modifier
concentration range. Obviously the silanol activity of this latter column type is rather

Chromatographic Properties of Reversed Phase … - 81 -
independent from the modifier nature (acetonitrile vs. methanol) and operating
conditions (HPLC vs. CEC).
From the results reported in Table 3.3 and Fig. 3.6 it is clear that for porous RP-packing
materials silanol activity generally is not independent of the mode of operation and the
applied modifier. For example, for the Unimicro Phenyl column under 50% methanol
conditions silanol activity is 1.51 and 5.81 under HPLC and CEC conditions, respectively.
In addition, for the same column substantially different silanol activities of 1.81 and 1.51
for 50% acetonitrile and methanol, respectively, under the same HPLC-mode can be
observed.
Earlier studies have shown that under pressure-driven conditions silanol activity of
porous RP columns may depend substantially on the nature of the modifier, e.g. whether
methanol or acetonitrile is used in the eluent [48,49 and refs. citated therein]. Our results
from the present study are in agreement with these earlier findings. In addition the same
appears to be true for porous packing materials under CEC-conditions.
Similar as for hydrophobicity in the Galushko test silanol activity is determined from
retention factors of two different compounds (see section 3.2.4). Referring to the
previous section on column hydrophobicity, we believe that the observed differences in
silanol activity for porous packings must also be attributed to:
i. Apparent differences in phase ratios under HPLC and CEC-conditions caused by
electroosmotic whirlwind effects.
ii. Different ligand orientation and thus silanol accessibility under both HPLC and
CEC modes.
Furthermore note that for porous packings from the results in Fig. 3.6 and Table 3.3 it
can be concluded that the differences and changes in silanol activity under CEC and
HPLC conditions are much more pronounced for methanol rather than acetonitrile.
In contrast to the observations for porous stationary phases the non-porous NPS ODS
3 µm packing showed remarkably different silanol activity behaviour. Irrespective of the
modifier (methanol or acetonitrile) or the applied mode (HPLC vs. CEC) silanol activity
values of one were observed for all experiments. Again this might be taken as evidence
that the absence of electroosmotic whirlwind effects in these solid packings are
responsible for the more similar behaviour under different conditions (modifier and mode
of operation) compared to porous packing materials. In Table 3.4 two parameters, USP
tailing factor and plate number of aniline, are given both separation modes and eluent

- 82 - Chapter 3
containing 70% of acetonitrile as the organic modifier (40% of acetonitrile for the NPS
ODS 3 µm column).
Table 3.4 USP tailing factor and plate numbers of aniline in CEC and HPLC for all columns
measured at 70 percent (40 percent for the NPS ODS 3 µm column) acetonitrile as organic
modifier; test compound: aniline; eluent: 70 percent of acetonitrile and tetraborate buffer (1.5 mM
in total); for other experimental conditions see text.
Column Mode USP Tailing factor
Plate Number /column (half-width method)
HPLC 1.206 13115 Hypersil ODS
3 µµµµm CEC 1.208 19800
HPLC 1.225 14602 CEC Hypersil C18
3 µµµµm CEC 1.257 18878
HPLC 1.155 12025 CEC Hypersil C18
2.5 µµµµm (1) CEC 1.329 22281
HPLC 1.198 12601 CEC Hypersil C18
2.5 µµµµm (2) CEC 1.311 22239
HPLC 1.258 16052 Unimicro C18
3 µµµµm CEC 1.205 36532
HPLC 1.229 10571 Unimicro C8
3 µµµµm CEC 1.075 26323
HPLC 1.092 17776 Unimicro Phenyl
3 µµµµm CEC 1.390 30157
HPLC 1.067 23205 Micra NPS ODS
3 µµµµm CEC 1.087 28590
Special attention has been made to the comparison of the electroosmotic flow (EOF)
(Table 3.2) and the chromatographic behaviour of the silanol sensitive compound
(aniline) as long as remaining silanol groups of stationary phase packing are responsible
for the EOF. It can be concluded that columns under this particular condition generating
lower EOF gave higher efficiencies (the Unimicro C18 3 µm, the Unimicro Phenyl 3 µm
and NPS ODS 3 µm columns). No direct relationship between EOF and USP tailing
factor of aniline can be drawn, which is with the exception of the Unimicro C18 3 µm and

Chromatographic Properties of Reversed Phase … - 83 -
the Unimicro C8 3 µm columns higher in CEC mode. Finally, no clear relationship
between silanol activity, average pore diameter and EOF [51] of the packing could be
derived from the present results.
3.4 Conclusions Under pH = 8 condition and using methanol and acetonitrile as modifiers eight columns
packed with seven different RP-phases have been tested under electro- and pressure driven
conditions. With an exception for the Unimicro Phenyl column methylene (hydrophobic)
selectivity differed not substantially between both modes: maximally 10% for the CEC
Hypersil C18 2.5 µm (No. 2) column. The limited ligand chain length can easily explain the
strongly deviating results for the former column.
In contrast for porous stationary phases substantial differences in the major column
descriptors, hydrophobicity and silanol activity, were found between the HPLC- and CEC-
modes. In addition, these differences were also a function and for some cases strongly
dependent on the nature and concentration of the applied modifier. These observations can
probably be explained from different ligand orientations caused by the conditions of both
eluent-driven modes. Alternative explanation of these findings may be found in the
occurrence of electroosmotic whirlwind effects in porous packing causing different phase
ratios under batch mode conditions.
Contrasting for the non-porous stationary phase for the HPLC and CEC eluent driven
mode nearly similar hydrophobicity and silanol activity data were measured. This has also
been taken as additional evidence for the electroosmotic whirlwind effect in porous
packings. The results of the present study confirmed the differences usually found in silanol
activity between methanol and acetonitrile as the organic modifier under HPLC condition.
These effects, however, appeared to be more manifest under CEC conditions. It was also
found that generally the use of acetonitrile delivered smoother HPLC/CEC ratio curves
versus percentage of modifier than methanol.
Finally, the results of this study clearly show that at least for porous stationary phases the
transfer of existing HPLC methods to CEC analysis protocols is not straightforward.
- 84 - Chapter 3
REFERENCES 1. J.H. Knox, I.H. Grant, Chromatographia, 32 (1991) 317.
2. M.M. Dittmann, G.P. Rozing, J. Microcolumn Sep., 9 (1997) 399.
3. V.L. McGuffin, M. Novotný, J. Chromatogr., 255 (1983) 381.
4. A. Berloni, A. Cappiello, G. Famiglini, P. Palma, Chromatographia, 39 (1994) 279.
5. J.P. Chervet, M. Ursem, J.P. Salzmann, R.W. Vannoort, J. High. Resolut. Chromatogr.,
12 (1989) 278.
6. J. Vissers, J.P. Chervet, J.P. Salzmann, Int. Lab., 26 (1996) 12A.
7. J.P.C. Vissers, H.A. Claessens, C.A. Cramers, J. Chromatogr. A, 779 (1997) 1.
8. M.R. Euerby, C.M. Johnson, K.D. Bartle, LC-GC Int., 11 (1998) 39.
9. I.H. Grant, in: Methods Molecular Biology, Vol. 52, K. Altria (ed), Humana Press Inc.,
Totowa, NJ 1996, p. 197-209.
10. R.J. Boughtflower, T. Underwood, C.J. Peterson, Chromatographia, 40 (1995) 329.
11. N.W. Smith, M.B. Evans, Chromatographia, 38 (1994) 649.
12. A.S. Lister, J.G. Dorsey, D.E. Burton, J. High. Resolut. Chromatogr., 20 (1997) 523.
13. T. Hanai, H. Hatano, N. Nimura, T. Kinoshita, J. High. Resolut. Chromatogr., 14
(1991) 481.
14. J.W. Jorgenson, K.D. Lukacs, J. Chromatogr., 218 (1981) 209.
15. M.M. Dittmann, K. Wienand, F. Bek, G.P. Rozing, LC-GC, 13 (1995) 800.
16. B. Behnke, E. Bayer, J. Chromatogr. A, 680 (1994) 93.
17. N.W. Smith, M.B. Evans, Chromatographia, 41 (1995) 197.
18. C. Yan, R. Dadoo, R.N. Zare, D.J. Rakestraw, D.S. Anex, Anal Chem., 68 (1996) 2726.
19. M.R. Euerby, C.M. Johnson, K.D. Bartle, P. Myers, S.C.P. Roulin, Anal. Commun., 33
(1996) 403.
20. V. Pretorius, B.J. Hopkins, J.D. Schieke, J. Chromatogr., 99 (1974) 23.
21. T.S. Stevens, H.J. Cortes, Anal. Chem., 55 (1983) 1365.
22. J.H. Knox, I.H. Grant, Chromatographia, 24 (1987) 135.
23. C. Yan, D. Schaufelberger, F. Erni, J. Chromatogr. A, 670 (1994) 15.
24. G. Ross, M. Dittmann, F. Bek, G. Rozing, Am. Lab. (Shelton, Conn.), 28 (1996) 34.
25. S. Lüdtke, T. Adam, K.K. Unger, J. Chromatogr. A, 786 (1997) 229.
26. C.L. Rice, R. Whithead, J. Phys. Chem., 69 (1965) 4017.
27. R. Dadoo, C. Yan, R.N. Zare, D.S. Anex, D.J. Rabestraw, G.A. Hux, LC-GC, 15 (1997)
630.

Chromatographic Properties of Reversed Phase … - 85 -
28. M.M. Dittmann, G.P. Rozing, J. Chromatogr. A, 744 (1996) 63.
29. J.P.C. Vissers, H.A. Claessens, P. Coufal, J. High Resolut. Chromatogr., 18 (1995) 540.
30. T. Eimer, K.K. Unger, J. van der Greef, TrAC, Trends Anal. Chem., 15 (1996) 463.
31. W. Wei, Y.M. Wang, G.A. Luo, R.J. Wang, Y.H. Guan, C. Yan, J. Liq. Chromatogr.
Relat. Technol, 21 (1998) 1433.
32. N.M. Djordjevic, P.W.J. Fowler F. Houdiere, G. Lerch, J. Liq. Chromatogr. Relat.
Technol., 21 (1998) 2219.
33. Y. Zhang, W. Shi, L. Zhang, H. Zou, J. Chromatogr. A, 802 (1998) 59.
34. G. Ross, M.M. Dittmann, G.P. Rozing, publication number 5965-9031E 1997,
Hewlett-Packard, Waldbronn, Germany.
35. S.V. Galushko, Chromatographia, 36 (1993) 39.
36. R.M. Smith (Ed.), Retention and Selectivity in Liquid Chromatography; Prediction,
Standardization and Phase Comparison, Chapter 8, J. Chromatogr. Libr., 57, Elsevier,
Amsterdam, 1995.
37. H. Figge, A. Deege, J. Köhler, G. Schomburg, J. Chromatogr., 351 (1986) 393.
38. Cs. Horváth, High Performance Liquid Chromatography, Advances and Perspectives,
Vol. 2, Academic Press, New York, 1980.
39. P. Antle, A.P. Goldberg, L.R. Snyder, J. Chromatogr., 321 (1985) 1.
40. P.T. Ying, J.G. Dorsey, Talanta, 38 (1991) 237.
41. K.B. Sentell, J.G. Dorsay, Anal. Chem., 61 (1989) 930.
42. P.D.A. Angus, E. Victorino, K.M. Payne, C.W. Demarest, T. Catalano, J.F. Stobaugh,
Electrophoresis, 19 (1998) 2073.
43. L.R. Snyder, P.W. Carr, S.C. Rutan, J. Chromatogr. A, 656 (1993) 537.
44. U.D. Neue, HPLC columns, theory, technology and practice, Wiley-VCH, Inc., New
York 1997.
45. J.G. Dorsey, K.A. Dill, Chem. Rev., 89 (1989) 331.
46. A.S. Rathore, Cs. Horváth, J. Chromatogr. A, 781 (1997) 185.
47. J. Nawrocki, J. Chromatogr. A, 779 (1997) 29.
48. H.A. Claessens, E.A. Vermeer, C.A. Cramers, LC-GC Eur., 6 (1993) 692.
49. D.V. McCalley, R.G. Brereton, J. Chromatogr. A, 828 (1998) 407.
50. H.A. Claessens, M.A. van Straten, J.J. Kirkland, J. Chromatogr. A, 728 (1996) 259.
51. M.G. Cikalo, K.D. Bartle, P. Myers, J. Chromatogr. A, 836 (1999) 35.

- 86 - Chapter 3

- 87 -
CHAPTER 4 4 CHROMATOGRAPHIC PROPERTIES OF REVERSED
PHASE STATIONARY PHASES UNDER PRESSURE AND
ELECTRO DRIVEN CONDITIONS; EFFECT OF BUFFER
COMPOSITION
Summary
Four different reversed-phase (RP) stationary phases (CEC Hypersil C18, Zorbax Rx SIL
C18, Zorbax 300 Rx SIL C18 and Zorbax PSM1000/C18) were examined under high-
performance liquid chromatographic (pressure-driven, HPLC), and capillary
electrochromatographic (electro-driven, CEC) conditions using an acetonitrile mobile
phase combined with twenty different buffer systems (different cations, anions, pH
and/or ionic strengths). Chromatographic performance tests under HPLC and CEC
conditions were carried out using acidic, basic and neutral polar/non-polar compounds.
Parameters such as plate number, retention factor and asymmetry were used to describe
the behaviour of the RP-columns under both HPLC and CEC conditions. The buffer
systems differently influence chromatographic characteristics of porous RP-phases under
CEC and HPLC conditions. Thus the choice of an appropriate buffer can be critical for
an application applied on an entire system.
This chapter has been published: T. Jiang, J. Jiskra, H.A. Claessens, C.A. Cramers, J. Chromatogr. A, 923 (2001) 215.

- 88 - Chapter 4 4.1 Introduction Occurrence and stability of the electroosmotic flow (EOF) strongly depend on the nature
and composition of the applied buffer. Moreover, in both modes capillary
electrochromatography (CEC) as well as in high-performance liquid chromatography
(HPLC) chromatographic properties and the analysis results are also strongly and in a
different way determined by the buffer properties. Therefore, apart from the organic
modifier [1], also the buffer composition must be critically considered, e.g. its nature, ionic
strength, buffering capacity and stability (depletion). However, several additional problems
encountering in CEC systems should be considered, too:
i. most RP stationary phases are not able to generate sufficient and/or stable EOF
since the residual amount of free silanol groups is limited
ii. effect of Joule heating limits the use of more concentrated buffer solutions
iii. use of low concentration buffers causes problems with buffering capacity, double
layer overlap and buffer depletion.
These problems mentioned above can be solved in principle by (i) development of new
stationary phases [2-21] or (ii) by use of organic buffers that have low ionic mobilities
(lower current and/or lower Joule heating) compared to inorganic buffers. This makes
especially zwitterionic buffers as e.g. 2-(N-morpholino)ethanesulonic acid (MES) attractive
for CEC eluents [19,22-31]. However, tris(hydroxymethyl) aminomethane (Tris), one of the
most used buffers, should not be included into the group of zwitterionic buffers because of
its insignificant dissociation constant of CH2-OH group in water containing systems. Tris
has been reported as a base [32,33] and has been misinterpreted as zwitterionic in e.g.
[24,34]. In case of mass spectrometry detection volatile organic buffers as ammonium
acetate, triethylammonium (TEA) acetate, acetic and formic acid are usually applied [35-46].
Ammonium acetate, lithium acetate together with MES are particularly used in non-
aqueous CEC as long as they are sufficiently soluble in non-aqueous media [25-26,47-48].
Furthermore, to prevent and to suppress tailing effects, nitrogen-containing buffers with
their ability of shielding silanol groups are used in separation of nitrogen containing
compounds e.g. pharmaceuticals [49-51], amino acids, peptides and proteins [22,35,52-57]
and nucleosides [58]. Among all inorganic buffers, tetraborate and phosphate buffers are
most often used [e.g. 28-29,59-72,78]. They are widely applied at least for the reason that
the buffers are often based on HPLC protocols and used for CE methods. They suffer
from problems pointed out in (i), (ii) and (iii); phosphate is also known as a factor

Chromatographic Properties of Reversed Phase … - 89 -
promoting degradation of silica supports substantially. However, formation of the complex
of phosphate with silanols is taken also as an advantage in CE separations [73]. Other
additives in mobile phases in CEC comprise aminoacids (β-alanine, γ-aminobutyric acid),
chiral selectors (cyclodextrins such as HPβCD) [74] and EOF modifiers/stabilizers (sodium
dodecylsulfate, SDS) [75-78].
4.2 Experimental 4.2.1 Columns The columns used in this study are listed in Table 4.1 together with relevant data provided
by the manufacturer. The column packed bed was 25 cm, and 33.5 cm total length.
Prior to use in the CEC mode, the columns were conditioned. This was accomplished by
applying 10 bar pressure on both sides of the column and increasing the voltage from 0 to
25 kV in 5 kV steps per 10 min. Next to that the pressure was increased to 12 bar and a
30 kV voltage was applied for 10 min. For the micro-HPLC experiments, the columns
were conditioned until the column pressure was stabilized (approximately 1 h). Note that
in these experiments the columns were tested under pressure- and electro-driven
conditions using the same batches of eluents.
Table 4.1 List of investigated columns; each column diameter was 100 µm
Column Average Particle
Size
Pore Size
Pore Volume
Surface Area
Carbon Load
CEC Hypersil C18
3 µm 130 Å 0.65 cm3.g-1 170 m2.g-1 8.5%
Zorbax Rx SIL C18
5 µm 80 Å 0.45 cm3.g-1 180 m2.g-1 12.4%
Zorbax 300 Rx SIL C18
5 µm 300 Å 0.42 cm3.g-1 45 m2.g-1 3.6%
Zorbax PSM1000/C18
5 µm 800 Å 0.38 cm3.g-1 15 m2.g-1 1.2%

- 90 - Chapter 4 All columns were supplied in double (same batch) and tested simultaneously in CEC and
HPLC. HPLC experiments were adjusted to similar flow velocities as obtained in CEC. As
a consequence the HPLC experiments are not optimized with respect to plate height.
4.2.2 Instrumentation All CEC chromatograms were obtained on an Agilent Technologies 3DCE (Agilent
Technologies GmbH, Waldbronn, Germany) instrument equipped with a pressure facility
of up to 12 bar at the outlet and/or inlet vial. This pressurization option of the instrument
was used to prevent bubble formation in the capillaries. Samples were injected
electrokinetically (5 kV for 2-15 s). For each run a voltage of 20 kV (600 V.cm-1 electrical
field strength) was applied with 10-bar pressure on both ends of a capillary. The detection
wavelength was 210 nm. High voltage was applied as 6-s time ramp to avoid column stress.
The column cassette temperature was maintained at 20ºC.
Micro HPLC separations were carried out on a system consisting of a Phoenix 20 CU
syringe pump (Carlo Erba Instruments, Milan, Italy), a microUVIS20 ultraviolet/visible
absorbance detector (Carlo Erba Instruments, Milan, Italy) operating at 210 nm, and an
injector with a 200 nL loop (VICI-AG Valco Europe, Schenkon, Switzerland). The flow-
rate was approx. 0.2-0.3 µL/min using a 1/100-flow splitter (VICI-AG Valco Europe,
Schenkon, Switzerland). The experiments were performed at air-conditioned laboratory
temperature (about 2 ºC) without additional thermostating.
4.2.3 Chemicals Buffers used in the experiments are listed in Table 4.2 providing data of the manufacturer
and concentrations and/or pHs used. All compounds were of analytical purity grade.
Acetonitrile (ACN) of HPLC supra gradient-grade purity was used as organic modifier
(Biosolve, Valkenswaard, Netherlands). The eluents were prepared by mixing
corresponding buffer system with an appropriate amount of the organic modifier and
degassed ultrasonically for 15 min prior to use. The same batch of eluent was used to test a
specific column in both separation modes. The test sample comprised the following
compounds: thiourea (t0), phenol, aniline, benzene, toluene, dimethyl phthalate, diethyl
phthalate, biphenyl and o-terphenyl (Merck, Darmstadt, Germany and Aldrich, Steinheim,

Chromatographic Properties of Reversed Phase … - 91 -
Germany). Samples were prepared by dissolving these compounds in the mobile phase or
in the pure organic modifier and then diluted with water.
Table 4.2 List of buffers used.
Inorganic buffers Organic buffers
Name Specifications Name Specifications
Ammonium tetraborate (Sigma-Aldrich, Milwaukee, USA)
0.5 mM, pH=8.0 Ammonium acetate (Merck, Darmstadt, Germany)
1 mM, pH=7.0
Lithium tetraborate (Merck, Darmstadt, Germany)
0.5 mM, pH=8.0 Citric acid, sodium salt (Merck, Darmstadt, Germany)
1 mM, pH=7.0
Potassium tetraborate (Sigma-Aldrich, Milwaukee, USA)
0.5 mM, pH=8.0 Glycine, sodium salt (Merck, Darmstadt, Germany)
1 mM, pH=8.5
Sodium carbonate (Merck, Darmstadt, Germany)
1 mM, pH=8.0 2-(N-Morpholino)-ethanesulfonic acid (MES) (Serva, Heidelberg, Germany)
1 mM, pH=6.0
Sodium phosphate (Merck, Darmstadt, Germany)
1 mM, pH=8.0,
7.0, 6.0
Triethylamine acetate (Fluka, Buchs, Switzerland)
1 mM, pH=7.0
Sodium tetraborate (Merck, Darmstadt, Germany)
0.1 mM, 0.2 mM,
0.5 mM and
1 mM, pH=8.0
Tris(hydroxymethyl)- aminomethane (TRIS) (Merck, Darmstadt, Germany)
0.5 mM, 1 mM,
5 mM and 10
mM, pH=8.0

- 92 - Chapter 4 4.2.4 Test procedure Characterization of RP-stationary phases was carried out using acetonitrile as the organic
modifier combined with twenty different buffer systems (different type, pH, ionic strength).
Chromatographic performance under HPLC and CEC conditions was measured using
acidic, basic and polar/non-polar compounds as test samples. Parameters such as retention
factor, plate number or peak asymmetry were recorded in order to compare the behaviour
of RP-columns under both HPLC and CEC conditions.
Under all conditions all solutes are supposed to behave as non-charged compounds.
Thus, none of them is subjected to electrophoretic mobility, which has been confirmed
by capillary zone electrophoresis experiments.
4.3 Results and discussion 4.3.1 Polar compounds Silica based RP-stationary phases are the most used phases in HPLC analysis. Depending
on the manufacturing procedure, the remaining silanol groups can provide sufficient
electroosmotic flow for CEC. As known from HPLC, undesired interactions of the silica
support with polar compounds such as organic bases (pharmaceuticals etc.) could also be a
great drawback in capillary electrochromatography. It has been found out that isolated
silanol groups are mainly responsible for strong interactions with basic compounds. In
order to suppress such interferences e.g. the influence of buffer system has been thoroughly
studied in HPLC analysis of basic compounds [79]. In contrast, most of the residual silanol
groups are believed to be hydrogen bonded and claimed to be not effective in peak
deterioration viz. tailing processes. However, the behaviour of these silanols under electrical
field conditions may be different compared to their properties under pressure-driven
conditions. Under CEC conditions the choice of an appropriate buffer system, its
concentration and/or pH are critical parameters in the development of reliable analysis
protocols for CEC. In Table 4.3 the silanol activities of the columns measured in different
concentrations of sodium tetraborate buffer under CEC and HPLC conditions are
presented.

Chromatographic Properties of Reversed Phase … - 93 -
Table 4.3 Values of silanol activities (NI =1+3×[kaniline/kphenol - 1]) [82] measured for the
columns in different concentrations of sodium tetraborate buffer (values given are total
concentrations) and acetonitrile as organic modifier (30/70 V/V).
Columns Mode 0.1 mM Na2B4O7
0.2 mM Na2B4O7
0.5 mM Na2B4O7
1 mM Na2B4O7
Silanol activity value
CEC 14.17 3.58 3.06 2.74 CEC Hypersil C18 HPLC 2.20 2.23 2.29 2.37
CEC 1.73 1.65 1.56 1.44 Zorbax Rx SIL C18 HPLC 1.64 1.58 1.61 1.64
CEC 1.33 1.39 1.63 1.13 Zorbax 300 Rx SIL C18
HPLC 1.43 1.46 1.39 1.42
CEC 1.07 1.57 1.49 1.05 Zorbax PSM1000/C18
HPLC 1.07 1.23 1.17 1.38
The implications of the buffer systems are demonstrated in Figure 4.1.
For the 0.5 mM buffer a substantial shift of the aniline peak in CEC can be observed. In
addition, severe tailing of the peak of aniline occurs at the lower buffer concentration, too,
suggesting that the active places on the silica surface are not fully shielded by the buffer. In
contrast, Joule heating strongly influences efficiency of apolar compounds in the CEC
mode. The plate number for the benzene peak is 32 000 plates/ column in 0.5 mM sodium
tetraborate buffer but only 23 000 plates/column in 1 mM tetraborate concentration.
Under HPLC conditions the observed drop in plate number going from the 1 mM to
0.5 mM buffer concentration was less than 1% (15 500 plates/column for 1 mM sodium
tetraborate and 17 500 plates/column for 0.5 mM sodium tetraborate, respectively).

- 94 - Chapter 4
0
2
4
6
8
10
12
0 2 4 6 8 10 12 14
Time (min)
Res
pons
e
CEC
HPLC
Thiourea
Phenol
Aniline
Benzene
Toluene
a)
0
2
4
6
8
10
12
14
16
0 2 4 6 8 10 12
Time (min)
Res
pons
e
CEC
HPLC
Thiourea
Phenol
Aniline
Benzene
Toluene
b)
Figure 4.1 Chromatograms of test mixture containing thiourea, aniline, phenol, benzene and toluene
under HPLC and CEC mode using the CEC Hypersil C18 stationary phase and acetonitrile
mobile phase with different ionic strength, a) 1 mM and b) 0.5 mM sodium tetraborate
buffer, respectively.
Similarly to ionic strength also the selection of the buffer cation may influence the activity
of silanols. To illustrate the effect, in Figure 4.2 the ratios of retention factors in HPLC vs.
CEC for several cations are presented.

Chromatographic Properties of Reversed Phase … - 95 -
Li+Na+
K+NH4+
CEC Hypersil C18
Zorbax PSM1000/C18
Zorbax 300 Rx SIL
Zorbax Rx SIL C18
0.6
0.7
0.8
0.9
1
1.1
1.2
k(HPLC)/k(CEC)
0.5 mM tetraborate
Figure 4.2 Ratios of retention factors of aniline kHPLC/kCEC of the columns under HPLC and CEC
conditions using acetonitrile as organic modifier and 0.5 mM tetraborate buffer (70/30,
V/V) with different cations.
The retention decreasing power of cations in CEC is in the order Li+<Na+<K+< +4NH .
From the same data it can be further concluded that ammonium salts generally show the
best silanol shielding potential power. This because ammonium ions can easily interact with
silanols either due to ion exchange, hydrogen-bonding or hydrophobic forces (for primary,
secondary, tertiary or quaternary ammonium salts) [80]. However, not all nitrogen-
containing buffers show the same shielding effects. For example as presented in Figure 4.3,
the adsorption of zwitterionic buffers such as glycine onto the stationary phase can even
cause dissimilar effects.
The data suggest that this behaviour might originate from the adsorption on the polarized
silica surface and the exposure of the acidic part of the buffer molecule to the analyte as
schematically depicted in Figure 4.4.

- 96 - Chapter 4
-2
0
2
4
6
8
10
12
0 2 4 6 8 10 12
Time (min)
Res
pon
se
Thiourea
Phenol
Aniline
Benzene Toluene
Figure 4.3 Capillary electrochromatography of mixture containing thiourea (t0), phenol, aniline,
benzene and toluene. Mobile phase: acetonitrile/1 mM (total conc.) glycine buffer pH=8.5
(70/30, V/V).
Figure 4.4
Possible adsorption of the zwitterionic
buffers on the silica surface and their
influence on the chromatographic
performance of the basic compounds, a)
C8 modified silica surface, b) C8
modified silica surface with adsorbed
glycine, c) C8 modified silica surface
with adsorbed 2-(N-morpholino)-
ethanesulfonic acid.
4.3.2 Apolar compounds The chromatographic behaviour of apolar compounds under CEC conditions with no
acidic or basic centers in the molecule was also investigated. The partitioning and/or
adsorption mechanisms on bonded phases in CEC are still poorly understood. At a first
SiOO
O
OSi
Si
Si
H3N+ COO-
SiOO
O
OSi
Si
Si
SiOO
O
OSi
Si
Si
N+
O
H
SO3-
a) b)
c)

Chromatographic Properties of Reversed Phase … - 97 -
glance, we may assume similar separation mechanisms as in HPLC. On the other hand the
occurrence of electroosmosis causing through-pore flows may suggest that on particular
RP-phases different separation mechanisms are present. In addition, another consideration
may be the consequent differences in the phase ratios occurring under pressure- and
electro-driven conditions. As an example, Figure 4.5 illustrates the influence of eight buffer
systems (organic and inorganic) on the chromatographic behaviour of o-terphenyl. Under
CEC and HPLC conditions the ratios of retention factors are plotted against the buffer
systems for all four columns under investigation.
1 mM N
a tetr
abora
te
1 mM N
a carb
onate
1 mM N
a citra
te
1 mM TRIS
1 mM N
H4 ace
tate
1 mM TEAC
1 mM M
ES
1 mM gl
ycine
CEC Hypersil C18 Zorbax PSM1000/C18
Zorbax 300 Rx SIL Zorbax Rx SIL C18 0
0.2
0.4
0.6
0.8
1
1.2
1.4
k(HPLC)/k(CEC)
Figure 4.5 Ratios of retention factors of o-terphenyl kHPLC/kCEC of the columns under HPLC and
CEC conditions using acetonitrile as organic modifier and different organic and inorganic
buffers mixed in ratio 70/30 (V/V). Total concentration of the buffers is given in the plot.
For each column, much smaller variations of kHPLC/kCEC values for non-polar than for
polar compounds within the column are observed (relative standard deviation or RSD for
the CEC Hypersil C18, Zorbax Rx SIL C18 and Zorbax 300 Rx SIL columns is up to 1.5%
and for the Zorbax PSM1000/C18 column is 5%, respectively).

- 98 - Chapter 4 In contrast to polar compounds, zwitterionic buffers have nearly no influence on the
chromatographic behaviour of apolar compounds in electrochromatography. Similar
findings were also observed for other apolar compounds as benzene and toluene present in
the test mixture. However, the kHPLC/kCEC values differ significantly between the columns.
We assume that this may be attributed to phase ratios differences due to CEC effects in the
pores [81].
Based on the discussion in the section 4.3.1 on ammonium salts it might be expected that
all three factors (ion exchange, hydrogen-bonding or hydrophobic forces) may contribute
to the adsorption on to the stationary phase. If we presume that the stationary phase
becomes more polar in CEC due to the alteration in silanols, even more triethylammonium
can be loaded to the stationary phase. As a consequence this might further contribute to the
changes in partitioning of apolar compounds in the CEC mode. The same is true if the
concentration of nitrogen containing buffers in the mobile phase is increased. Figure 4.6
illustrates for several concentrations of the Tris buffer and toluene as the test compound.
0.5 mM1 mM
5 mM10 mM
CEC Hypersil C18
Zorbax PSM1000/C18
Zorbax 300 Rx SIL
Zorbax Rx SIL C18
0.9
0.95
1
1.05
1.1
1.15
1.2
k(HPLC)/k(CEC)
c(Tris)
Figure 4.6 Ratios of retention factors of toluene kHPLC/kCEC of the columns under HPLC and CEC
conditions using acetonitrile as organic modifier and Tris buffer (70/30, V/V) in different
total concentration.
Obviously, a general trend of increasing ratios of retention factor in HPLC vs. CEC as a
function of higher buffer concentration can be observed. The greatest change is observed

Chromatographic Properties of Reversed Phase … - 99 -
on the high-porous Zorbax PSM 1000/C18 stationary phase where the ratio of retention
factors (kHPLC/kCEC) increases from 1.0 for 0.5 mM Tris buffer concentration to 1.1 for
10 mM Tris, respectively.
The typical influence of organic buffers on the efficiency of the biphenyl peak is given in
Table 4.4.
Table 4.4 Reduced plate heights calculated from biphenyl peak. Columns Mode 1 mM
Na2B4O7 1 mM
phosphate, pH=7.0
1 mM Tris 5 mM Tris 1 mM sodium citrate
Reduced plate height
CEC 3.5 3.8 3.5 3.1 3.6 CEC Hypersil C18 HPLC 4.5 4.3 3.9 4.3 4.1
CEC 2.8 3.0 2.8 2.6 2.9 Zorbax Rx SIL C18 HPLC 5.1 5.7 5.6 5.6 5.6
CEC 5.0 4.4 3.9 4.0 4.1 Zorbax 300 Rx SIL C18 HPLC 4.5 4.6 4.1 4.0 4.5
CEC 2.9 2.2 3.8 2.5 3.2 Zorbax PSM1000/C18 HPLC 4.0 3.6 4.2 4.0 3.5
The mean values of efficiency (as reduced plate heights) of three consecutive injections are
presented (RSD less then 4%). Generally, similar or higher efficiencies under the CEC
mode have been found for organic buffers, this particularly on stationary phases with lower
porosity (the CEC Hypersil C18 and Zorbax Rx SIL C18 stationary phases). This finding
was observed also for other organic buffers and apolar solutes used. However, the high
porous Zorbax PSM1000/C18 showed better efficiency under the CEC mode when
inorganic buffers were applied.
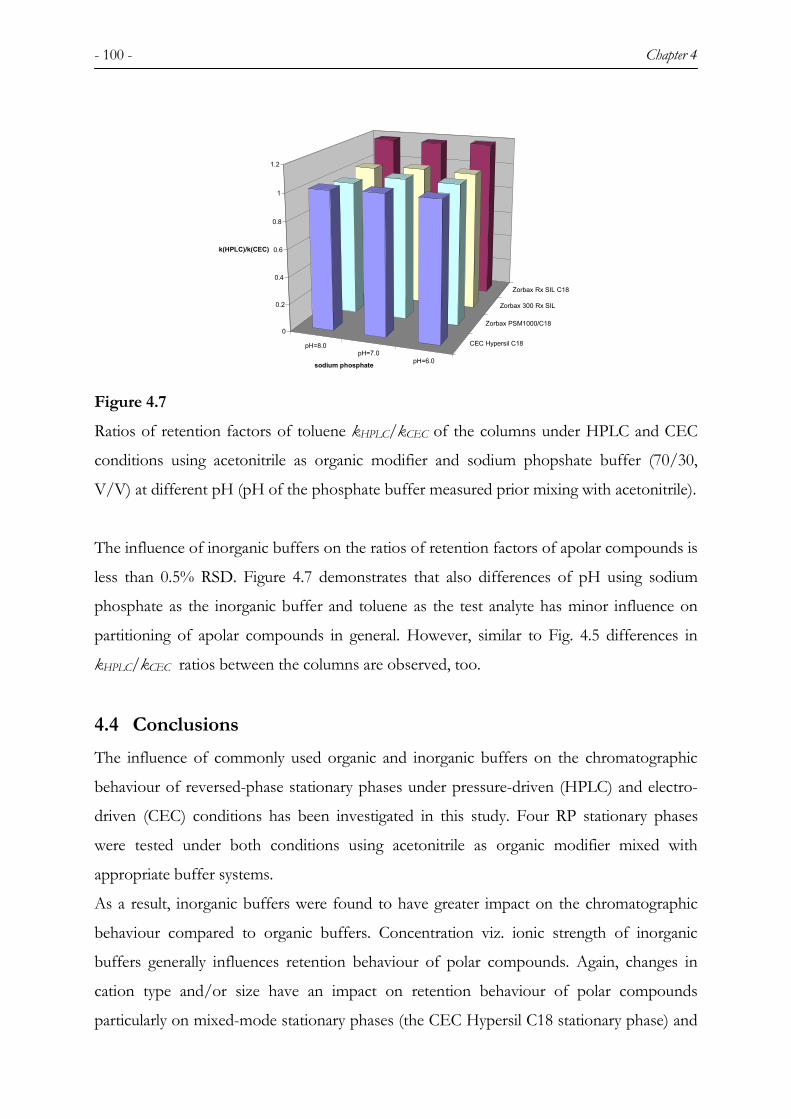
- 100 - Chapter 4
pH=8.0pH=7.0
pH=6.0
CEC Hypersil C18
Zorbax PSM1000/C18
Zorbax 300 Rx SIL
Zorbax Rx SIL C18
0
0.2
0.4
0.6
0.8
1
1.2
k(HPLC)/k(CEC)
sodium phosphate
Figure 4.7 Ratios of retention factors of toluene kHPLC/kCEC of the columns under HPLC and CEC
conditions using acetonitrile as organic modifier and sodium phopshate buffer (70/30,
V/V) at different pH (pH of the phosphate buffer measured prior mixing with acetonitrile).
The influence of inorganic buffers on the ratios of retention factors of apolar compounds is
less than 0.5% RSD. Figure 4.7 demonstrates that also differences of pH using sodium
phosphate as the inorganic buffer and toluene as the test analyte has minor influence on
partitioning of apolar compounds in general. However, similar to Fig. 4.5 differences in
kHPLC/kCEC ratios between the columns are observed, too.
4.4 Conclusions The influence of commonly used organic and inorganic buffers on the chromatographic
behaviour of reversed-phase stationary phases under pressure-driven (HPLC) and electro-
driven (CEC) conditions has been investigated in this study. Four RP stationary phases
were tested under both conditions using acetonitrile as organic modifier mixed with
appropriate buffer systems.
As a result, inorganic buffers were found to have greater impact on the chromatographic
behaviour compared to organic buffers. Concentration viz. ionic strength of inorganic
buffers generally influences retention behaviour of polar compounds. Again, changes in
cation type and/or size have an impact on retention behaviour of polar compounds
particularly on mixed-mode stationary phases (the CEC Hypersil C18 stationary phase) and

Chromatographic Properties of Reversed Phase … - 101 -
phases with medium porosity. Using sodium phosphate buffer systems adjusted to different
pHs, the well-known influence on electroosmotic flow has been observed. Moreover, peak
asymmetries of polar compounds were closer to one with a phosphate buffer of pH=7.0.
In the field of organic buffers, zwitterionic buffers showed exceptional behaviour. Their
acido-basic moieties have a great effect on behaviour of electron-donor compounds as
amines. Further, the efficiencies were found better in organic buffer systems compared with
inorganic buffers of the same concentration on stationary phases with lower porosity (the
CEC Hypersil C18 and Zorbax Rx SIL C18 stationary phases). In contrast, the high porous
Zorbax PSM1000/C18 stationary phase showed much higher efficiencies with inorganic
buffers and organic buffers of higher ionic strength.
Finally, as a consequence of these above-mentioned findings a proper choice of buffer
systems for capillary electrochromatography is a critical step in CEC analysis.
Acknowledgement The authors gratefully acknowledge Dr. G. Rozing from Agilent Technologies, Germany
for providing the Zorbax columns.
REFERENCES 1. A. Dermaux, P. Sandra, Electrophoresis, 20 (1999) 3027.
2. I. Gusev, X. Huang, Cs. Horváth, J. Chromatogr. A, 855 (1999) 273.
3. J.J. Pesek, M.T. Matyska, C.A. Kein, Spec. Publ. - R. Soc. Chem., 235 (1999) 97.
4. J. Liu, H. Zou, J.Y. Ni, Y. Zhang, Anal. Chim. Acta, 378 (1999) 73.
5. C. Fujimoto, Anal. Chem., 67 (1995) 2050.
6. J.-L. Liao, N. Chen, C. Ericson, S. Hjertén, Anal. Chem., 68 (1996) 3468.
7. E.C. Peters, M. Petro, F. Svec, J.M.J. Fréchet, Anal. Chem., 69 (1997) 3646.
8. E.C. Peters, M. Petro, F. Svec, J.M.J. Fréchet, Anal. Chem., 70 (1998) 2296.
9. M.T. Dulay, R.P. Kulkarni, R.N. Zare, Anal. Chem., 70 (1998) 5103.
10. M. Zhang, C. Yang, Z. El Rassi, Anal. Chem., 71 (1999) 3277.
11. M.T. Matyska, Chem. Anal. (Warsaw), 43 (1998) 637.
12. M. Zhang, Z. El Rassi, Electrophoresis, 19 (1998) 2068.
13. H. Sawada, K. Jinno, Electrophoresis, 20 (1999) 24.
14. C. Yang, Z. El Rassi, Electrophoresis, 20 (1999) 18.

- 102 - Chapter 4 15. R. Alicea-Maldonando, L.A. Colón, L.A. Electrophoresis, 20 (1999) 37.
16. K. Jinno, J. Wu, H. Sawada, Y. Kiso, J. High Resolut. Chromatogr., 21 (1998) 617.
17. Z.J. Tan, V.T. Remcho, J. Microcolumn Sep., 10 (1998) 99.
18. Q. Tang, N. Wu, M. Lee, J. Microcolumn Sep., 11 (1999) 550.
19. J.J. Pesek, M.T. Matyska, S. Cho, J. Chromatogr. A, 845 (1999) 237.
20. Q. Tang, B. Xin, M. Lee, J. Chromatogr. A, 837 (1999) 35.
21. K. Hosoya, H. Ohta, K. Yoshizako, K. Kimata, T. Ikegami, N. Tanaka, J. Chromatogr.
A, 853 (1999) 11.
22. K.D. Altria, N.W. Smith, C.H. Turnbull, J. Chromatogr. B, 717 (1998) 341.
23. C.G. Bailey, C. Yan, Anal. Chem., 70 (1998) 3275.
24. R.J. Boughtflower, T. Underwood, C.J. Paterson, Chromatographia, 40 (1995) 329.
25. A. Dermaux, P. Sandra, V. Ferraz, Electrophoresis, 20 (1999) 74.
26. A. Dermaux, P. Sandra, M. Ksir, K. Fellat, F. Zarrouck, J. High Resolut. Chromatogr.,
21 (1998) 545.
27. M.M. Dittmann, G.P. Rozing, J. Chromatogr. A, 744 (1996) 63.
28. M.M. Dittmann, G.P Rozing, J. Microcolumn Sep., 9 (1997) 399.
29. M.R. Euerby, C.M. Johnson, S.F. Smyth, N.C. Gillot, D.A Barrett, P.N. Shaw, J.
Microcolumn Sep., 11 (1999) 305.
30. J.P.C. Vissers, H.A. Claessens, P. Coufal, J. High Resolut. Chromatogr., 18 (1995) 540.
31. C. Wolf, P.L. Spence, W.H. Pirkle, E.M. Derrico, D.M. Cavender, G.P. Rozing, J.
Chromatogr. A, 782 (1997) 175.
32. R.G. Bates, H.B. Hetzer, J. Phys. Chem., 65 (1961) 667.
33. J.H. Fossum, P.C. Markunas, J.A. Riddick, Anal. Chem., 23 (1951) 491.
34. K.D. Altria, I.H. Grant, LC-GC Intl., 1998, 588.
35. G. Choudhary, Cs. Horváth, J.F. Banks, J. Chromatogr. A, 828 (1998) 469.
36. J. Ding, P. Vouros, Anal. Chem., 69 (1997) 379.
37. J. Ding, T. Barlow, A. Dipple, P. Vouros, J. Am. Soc. Mass Spectrom., 9 (1998) 823.
38. M. Hugener, A.P. Tinke, W.M.A. Niessen, U.R. Tjaden, J. van der Greef, J.
Chromatogr., 647 (1993) 375.
39. S.J. Lane, A. Pipe, Rapid Commun. Mass Spectrom., 12 (1998) 667.
40. G.A. Lord, D.B. Gordon, P. Myers, B.W. King, J. Chromatogr. A, 768 (1997) 9.
41. G.A Lord, D.B Gordon, L.W. Tetler, C.M.J. Carr, J. Chromatogr. A, 700 (1995) 27.

Chromatographic Properties of Reversed Phase … - 103 -
42. C.J. Paterson, R.J. Boughtflower, D. Highton, E. Palmer, Chromatographia, 46 (1997)
599.
43. C. Rentel, P. Gfrörer; E. Bayer, Electrophoresis, 20 (1999) 2329.
44. K. Schmeer, B. Behnke, E. Bayer, Anal. Chem., 67 (1995) 3656.
45. V. Spikmans, S.J. Lane, U.R. Tajden, J. van der Greef, Rapid Commun. Mass
Spectrom., 13 (1999) 141.
46. R.N. Warriner, A.S. Craze, D.E. Games, S.J. Lane, Rapid Commun. Mass Spectrom.,
12 (1998) 1143.
47. P. Sandra, A. Dermaux, V. Ferraz, M.M. Dittmann, G.P. Rozing, J. Microcolumn Sep.,
9 (1997) 409.
48. L. Roed, E. Lundanes, T. Greibrokk, Electrophoresis, 20 (1999) 2373.
49. N.C. Gillot, M.R. Euerby, C.M. Johnson, D.A Barrett, P.N. Shaw, Anal. Commun., 35
(1998) 217.
50. I.S. Lurie, T.S. Conver, V.L. Ford, Anal. Chem., 70 (1998) 4563.
51. J. Reilly, M. Saees, J. Chromatogr. A, 829 (1998) 175.
52. P. Huang, J.-T. Wu, D.M. Lubman, Anal. Chem., 70 (1998) 3003.
53. M. Lämmerhofer, W. Lindner, J. Chromatogr. A, 829 (1998) 115.
54. M. Lämmerhofer, W. Lindner, J. Chromatogr. A, 839 (1998) 167.
55. J.-M. Lin, T. Nakagama, K. Uchiyama, T. Hobo, J. Pharm. Biomed. Anal., 15 (1997)
1351.
56. J.J. Pesek, M.T. Matyska, L. Mauskar, J. Chromatogr. A, 763 (1997) 307.
57. J.J. Pesek, M.T. Matyska, S. Swedberg, S. Udivar, Electrophoresis, 20 (1999) 2343.
58. T. Helboe, S.H. Hansen, J. Chromatogr. A, 836 (1999) 315.
59. R. Asiaie, X. Huang, D. Farnan, Cs. Horváth, J. Chromatogr. A, 806 (1998) 251.
60. M.G. Cikalo, K.D. Bartle, P. Myers, J. Chromatogr. A, 836 (1999) 35.
61. H. Engelhardt, S. Lamotte, F.-T. Hafner, Am. Lab. (Shelton, Conn.), 30 (1998) 40.
62. C.G. Huber, G. Choudhary, Cs. Horváth, Anal. Chem., 69 (1997) 4429.
63. H. Jakubetz, H. Czesla, V. Schurig, J. Microcolumn. Sep., 9 (1997) 421.
64. D. Li, V.T. Remcho, J. Microcolumn. Sep., 9 (1997) 389.
65. V. Lopez-Avila, J. Bedenedicto, C. Yan, J. High Resolut. Chromatogr., 20 (1997) 615.
66. S. Mayer, V. Schurig, J. High Resolut. Chromatogr., 15 (1992) 129.
67. H. Rebscher, U. Pyell, Chromatographia, 38 (1994) 737.

- 104 - Chapter 4 68. M.M. Robson, S.C.P. Roulin, S.M. Shariff, M.W. Raynor, K.D. Bartle, A.A. Clifford, P.
Myers, M.R. Euerby, C.M. Johnson, Chromatographia, 43 (1996) 313.
69. M.R. Schure, R.E. Murphy, W.L. Klotz, W. Lau, Anal. Chem., 70 (1998) 4985.
70. N.W. Smith, M.B. Evans, Chromatographia, 38 (1994) 649.
71. Q.-H. Wan, J. Chromatogr. A, 782 (1997) 181.
72. C. Yan, R. Dadoo, H. Zhao, R.N. Zare, D.J. Rakestraw, Anal. Chem., 67 (1995) 2026.
73. P. Jandik, G. Bonn, Capillary Electophoresis of Small Molecules and Ions, VCH
Publishers, 1993.
74. W. Wei, G.A Luo, R. Xiang, C. Yan, J. Microcolumn Sep., 11 (1999) 263.
75. R.M. Seifar, S. Heemstra, W.T. Kok, J.C. Kraak, H. Poppe, Biomed. Chromatogr., 12
(1998) 140.
76. R.M. Seifar, W.T. Kok, J.C. Kraak, H. Poppe, Chromatographia, 46 (1997) 131.
77. R.M. Seifar, J.C. Kraak, H. Poppe, W.T. Kok, J. Chromatogr. A, 832 (1999) 133.
78. R.M. Seifar, J.C. Kraak, W.T. Kok, H. Poppe, J. Chromatogr. A, 808 (1998) 71.
79. S.H. Hansen, P. Helboe, M. Thomsen, J. Chromatogr., 544 (1991) 53.
80. J. Nawrocki, J. Chromatogr. A, 799 (1997) 29.
81. U. Tallarek, E. Rapp, T. Scheenen, E. Byer, H. van As, Anal. Chem., 72 (2000) 2292.
82. S.V. Galushko, Chromatographia, 36 (1993) 39.

- 105 -
CHAPTER 5 5 PREPARATION AND CHARACTERIZATION OF
MONOLITHIC POLYMER COLUMNS FOR CAPILLARY
ELECTROCHROMATOGRAPHY
Summary
A series of micro-monolithic columns with different porosities were prepared for capillary
electrochromatography (CEC) by in-situ copolymerization of butyl methacrylate, ethylene
glycol dimethacrylate, and 2-acrylamido-2-methyl-1-propanesulfonic acid in the presence
of a porogen in fused silica capillaries of 100 µm I.D. Different column porosities were
obtained by changing the ratios of monomers to porogenic solvents. Columns were
investigated and evaluated under both pressure-driven (high-performance liquid
chromatography, HPLC) and electro-driven (capillary electrochromatography, CEC)
conditions. Each column exhibited different efficiency and dependency on flow velocity
under electro-driven conditions. Abnormally broad peaks for some relatively bulky
molecules were observed. Possible explanations are discussed. The differences in column
efficiency and retention behaviour between the two eluent-driven modes were studied in
detail. In addition, other column properties, such as morphology, porosity, stability and
reproducibility, were extensively tested.
This chapter has been published: J. Jiskra, T. Jiang, H.A. Claessens, C.A. Cramers, J. Microcolumn Sep., 12 (2000) 530.

- 106 - Chapter 5 5.1 Introduction Capillary electrochromatography (CEC) has emerged as a promising micro-separation
technique that combines chromatographic selectivity with high efficiency and
miniaturization potential of capillary electrophoresis (CE) [1-6]. To date, a number of
papers have been published on the theoretical and practical aspects of CEC [3, 7-30].
However, some technical problems including column preparation have slowed down its
development and widespread implementation [31-32]. Most columns used nowadays in
CEC are packed in a similar way as in micro-HPLC. High experimental skill and
experience is required to reproducibly pack micron-sized particles into a narrow-bore
tube and to prepare a solid and stable frit at both ends of the column. Additionally, it is
extremely difficult to avoid side effects arising from frits [17], i.e., bubble formation and
heterogeneity of the electrical field across the column. Furthermore, there are only a few
commercially available stationary phases dedicated for CEC which are expected to
provide sites for the required interactions as well as the charged group for generation of
the electroosmotic flow, EOF [30]. All these technical problems have stimulated the
development of various alternative approaches [33-48]. Among these, one competing
strategy is to prepare monolithic media by in-situ polymerization within the confine of a
mold. This approach has recently attracted substantial attention in view of its capability to
eliminate the difficulties described above for making packed columns [37-49]. Presently,
there exist two main types of monolithic materials, silica sol-gels [37-40] and porous
organic polymers. In principle, the polymeric approach exhibits more potential
advantages and a more promising future compared to its silica based counterparts. This is
due to the simpler preparation process, higher efficiency, easier pore size control, and
more facile adaptability to adjust column selectivity, as well as the direction and the speed
of the electro-osmotic flow (EOF) offered by polymer rods. Several groups have spent
considerable effort in this field [41-49]. However, this technique is still virtually in its
infancy. Until now, most applications have concentrated on simple small neutral
compounds. Moreover, the physico-chemical properties of these porous polymers under
electric field conditions are still not straightforward to be explained.
In this study, we prepared a series of poly-alkylmethacrylate based monolithic capillary
columns with different permeabilities. The column performances under both CEC
(electro-driven, ED) and HPLC (pressure-driven, PD) were evaluated and compared in
detail. In addition, the micropore size distributions in these polymeric monoliths

Preparation and Characterization of Monolithic … - 107 -
were investigated, and some practical and theoretical problems associated with these types
of rods are also discussed.
5.2 Experimental 5.2.1 Chemicals Butyl methacrylate (BMA), ethylene glycol dimethacrylate (EGDMA), 2-acrylamido-2-
methyl-1-propanesulfonic acid (AMPS) and 3-(trimethoxysilyl)propyl methacrylate were
obtained from Aldrich. Acetonitrile (ACN) and tetrahydrofuran (THF) with HPLC grade
purity were from Biosolve (Valkenswaard, the Netherlands). Polystyrene standards were
obtained from DuPont (Wilmington, DE) and all the analytes and other chemicals were
from Merck (Darmstadt, Germany). Fused-silica tubing (100 µm I.D.) was purchased from
Polymicro Technologies (Phoenix, AZ, USA). The mobile phase was composed of 20%
(V/V) sodium phosphate buffer (5 mM, pH 7) and 80% (V/V) ACN. It was degassed by
ultrasonication and filtered through a filter (pore size = 0.45 µm) before use.
5.2.2 Column preparation The monomers (60.0 wt% BMA, 39.7 wt% EGDMA and 0.3 wt% AMPS),
azobisisobutyronitrile (AIBN) used as a polymerization initiator (1 wt% with respect to the
total monomer amount) and porogen (1-propanol, 1,4-butanediol and 10 wt% water) were
mixed ultrasonically into a homogenous solution [50-52]. For different columns, different
porogen concentrations and volume fractions were used, as detailed in Table 5.1.
Subsequently, the reactant solution was purged with nitrogen for 3 min before a small part
of the reactant mixture was introduced into a capillary (unmodified or silanized) by a 10 µL
syringe. The capillary was either filled completely or to a certain distance from one end.
After both ends of the capillary were sealed in a micro-connector, it was kept at 60°C in an
oven for 24 h. All columns were conditioned by mobile phase using a syringe pump prior
to HPLC and CEC experiments.

- 108 - Chapter 5 Table 5.1 Characteristics of different columns.
Column Porogen
fraction (vol%)1)
Conc. of 1-propanol in porogen
(wt%)
Capillary Globule size
(nm)2)
Porosity
(εεεεT)3)
C%4) H in CEC
(µµµµm) 5)
a 47 62 unmodified 150 0.50 0.0 6.7
b 52 62 unmodified 250 0.56 0.0 8.3
c 57 62 unmodified 300 0.61 0.3 10.0
d 62 62 unmodified 800 0.67 2.0 11.0
e 67 62 unmodified 1200 0.72 3.2 33.3
f 62 60 unmodified 1200 NM NM 30.0
g 62 63 unmodified 450 NM NM 12.0
h 57 62 modified 300 NM 0.1 10.0
1) Porogen volume fraction in reactant solution. 2) Microglobule size estimated from SEM pictures. 3) NM: not measured 4) Compressibility, C%= 100× (L0-L1)/L0. L0: initial column length; L1: column
length after high pressure was applied. 5) Plate height (H) under CEC conditions. Column efficiency was calculated by half
peak-width method.
To investigate eventual wall effects, the inner wall of some capillaries was modified before
the introduction of the reactant mixture [53]. The procedure was as follows: the
unmodified fused silica capillary was first washed then filled with 1M sodium hydroxide
solution, both ends were put in a sealed vial filled with sodium hydroxide solution, and the
capillary was then kept at 95°C for 2 h in an oven. Thereafter, the capillary was washed with
ca. 60 column volumes of deionized water and then with the same volume of acetone. The
capillary was dried at 60°C under purging nitrogen for 1 h, followed by rinsing with ten
column-volumes of a silanizing solution, a solution of 50% (V/V) of 3-
(trimethoxysilyl)propyl methacrylate in N,N-dimethylformamide (DMF) containing 0.02%
(w/V) of hydroquinone (an inhibitor). After both ends of the capillary were sealed, it was

Preparation and Characterization of Monolithic … - 109 -
heated in an oven at 100°C for about 8 h, and then washed with DMF and acetone. Finally,
the capillary was again dried with a nitrogen stream.
5.2.3 Instrumentation
CEC experiments were performed on a 3DCE system (Agilent Technologies, Waldbronn,
Germany) equipped with a DAD 1050 UV detector and an external pressure device for
CEC. Control of the chromatographic system and data acquisition were carried out by a
ChemStation system. Samples were injected electrokinetically. The cassette temperature was
set at either 21 or 30°C. The detection wavelength was 205 nm. During each run 8 bar
pressure was applied at two ends of the column.
The µ-HPLC system was composed of an ISCO model 100 DM syringe pump (Isco, Inc.,
Lincoln, NE, USA), a microUV-Vis SSI 500 detector (Scientific Systems, Inc., State
College, PA, USA) and a Rheodyne injector (VICI AG, Valco Europe, Schenkon,
Switzerland) with a 100 nL internal loop. A TEE-piece after injector with a 1 m × 25 µm
(I.D.) capillary was used as a splitter. The split ratio was typically 100:1. All the
experiments were performed at room temperature (ca. 21°C).
The column morphology was studied by a Model JSM-840A scanning electron microscope
(SEM) (JEOL, Inc., Tokyo, Japan). Samples of 5-mm long rod pieces were cut from the
columns, placed on an aluminium stub via a double-sided carbon tape, and sputter-coated
with a gold/palladium alloy using SPI Sputter for 4 min at 30 mA. The measurements were
carried out at 10 kV at a filament current of 40 mA. According to SEM pictures the
macropore sizes in the capillary rods were estimated. The micropore size distribution of the
polymer was measured by BET nitrogen sorption method on an ASAP 2010 instrument
(Micromeritis, Morcross, GA, USA). The equilibrium interval was 30 s, and the low-
pressure dose was 0.5 g/cm3 STP. The calculation for the micropore size is based on the
slit pore model. The samples were polymers made in a 2 mL bottle by the same
polymerization process as used for the corresponding columns. Before measurement, the
bulk polymer was cut into small pieces, Soxhlet-extracted with methanol for 12 h, vacuum-
dried for 2 days and degassed for 5 h at 65°C.

- 110 - Chapter 5 5.3 Results and discussion 5.3.1 Column efficiency in CEC The lowest plate height (H) at the test alkyl benzenes for each column is presented in Table
5.1. From comparing the efficiencies of columns d, f and g with different 1-propanol
content but the same porogen volume fraction, it is clearly shown that column efficiency is
very sensitive to the amount of 1-propanol. This is consistent with earlier reported results
[50-52]. The column with 62 wt% 1-propanol provided the highest efficiency. Therefore,
for all other columns in this study, the porogen with 62 wt% of 1-propanol was chosen.
Figure 5.1 shows the plots of plate height as a function of eluent velocity for alkyl benzene
compounds on columns a~e prepared by using different porogen volume fractions. As
porogen volume fraction decreases from 67% (column e) to 47% (column a), the column
efficiency increases from about 30,000 to 150,000 plates/m (Table 5.1), the steepness of all
plots decreases, and the optimal flow velocity increases from less than 1 to about 6
cm/min. In addition, it is interesting to note that, for columns a and b with a lower porogen
content, the column efficiency remains almost constant, regardless of the different retention
factors (k) for all of the test compounds with retention factor (k) up to 6.5. This suggests
that with such columns rapid separations can be obtained without loss in resolution.
In order to understand the differences in column efficiency in columns a~e, the polymer
morphology in the capillaries was examined by scanning electron microscope (SEM). As an
example, some SEM photos are shown in Figure 5.2. According to the SEM pictures, the
connecting microglobule size of the polymer were estimated, and presented in Table 5.1.
The structures of the various monolithic columns differ significantly, and strongly depend
on the porogen content in the reactant solutions. With the decrease of the porogen content,
the microglobules become smaller (from about 1 µm for column e down to 150 nm for
column a), and the globule stacking and the channel distribution become more uniform.
Obviously, for the columns with lower porogen concentration, the Eddy diffusion is
smaller and the mass transfer is faster, resulting in higher efficiencies and less steep Van
Deemter curves.
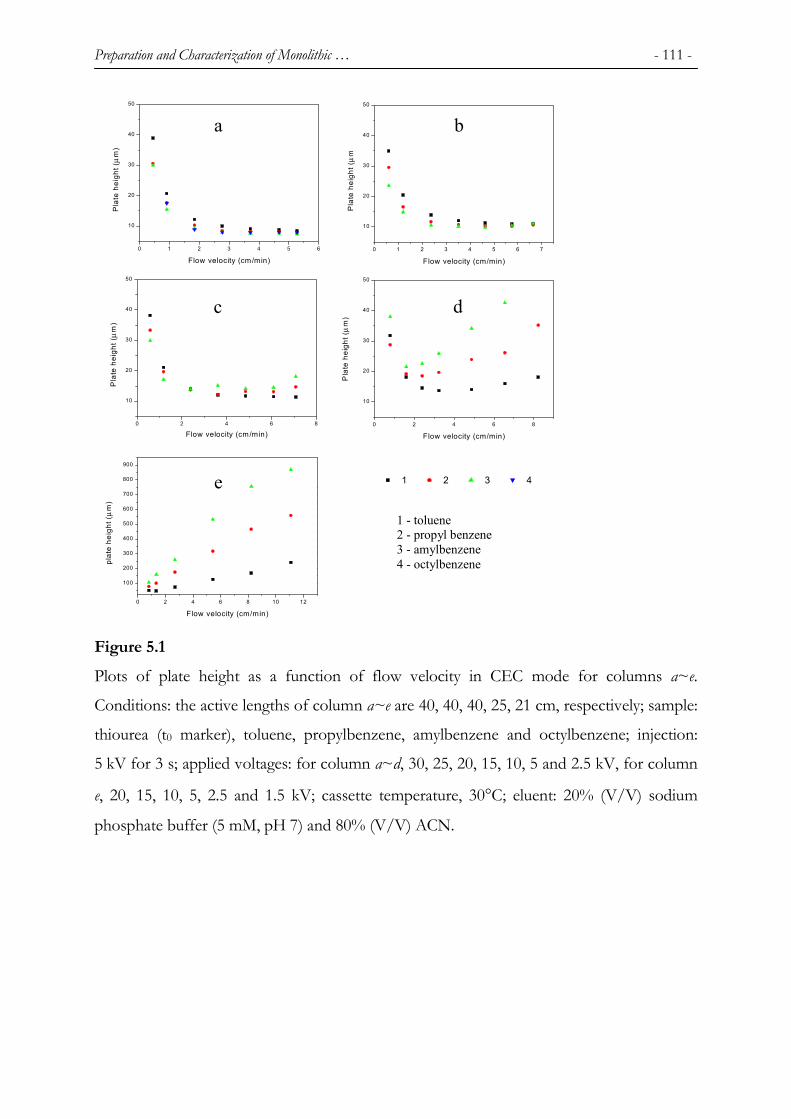
Preparation and Characterization of Monolithic … - 111 -
0 2 4 6 8 10 12
100
200
300
400
500
600
700
800
900
plat
e he
ight
(µ
m)
Flow velocity (cm/min)
0 2 4 6 8
10
20
30
40
50
Pla
te h
eigh
t (µ
m)
Flow velocity (cm/min)
0 2 4 6 8
10
20
30
40
50
Pla
te h
eigh
t (µ
m)
Flow velocity (cm/min)
0 1 2 3 4 5 6 7
10
20
30
40
50
Pla
te h
eigh
t (µ
m
Flow velocity (cm/min)
0 1 2 3 4 5 6
10
20
30
40
50
Pla
te h
eigh
t (µ
m)
Flow velocity (cm/min)
d
b
c
e 1 2 3 4
a
1 - toluene 2 - propyl benzene 3 - amylbenzene 4 - octylbenzene
Figure 5.1 Plots of plate height as a function of flow velocity in CEC mode for columns a~e.
Conditions: the active lengths of column a~e are 40, 40, 40, 25, 21 cm, respectively; sample:
thiourea (t0 marker), toluene, propylbenzene, amylbenzene and octylbenzene; injection:
5 kV for 3 s; applied voltages: for column a~d, 30, 25, 20, 15, 10, 5 and 2.5 kV, for column
e, 20, 15, 10, 5, 2.5 and 1.5 kV; cassette temperature, 30°C; eluent: 20% (V/V) sodium
phosphate buffer (5 mM, pH 7) and 80% (V/V) ACN.

- 112 - Chapter 5
Figure 5.2 Scanning electron microscope (SEM) pictures of the columns a, d and e.
5.3.2 Selectivity and retention in CEC Apart from column efficiency, column selectivity and the retention mechanism for columns
a~e were investigated as well. The retention mechanism of reversed-phase liquid
chromatography (RPLC) of benzene derivatives for these polymer monoliths has been
described in literature [50-52]. In the first instance, reversed-phase retention of neutral
compounds is determined by the hydrophobicity of the stationary phase, which can be
estimated by the intercept of the linear plot of carbon numbers of alkyl substitutes of
alkylbenzenes as their log k values under similar eluent conditions. For example from Figure
5.3 column a clearly is more hydrophobic compared to column b. Furthermore, in Figure
5.3, the plots for all columns have the same slope, suggesting that all the columns made
from different ratio of porogen to monomers show similar CH2- selectivity [54].
a d e

Preparation and Characterization of Monolithic … - 113 -
0 2 4 6 8 10-0.4
0.0
0.4
0.8
abcde
log
k
Carbon number of alkyl in alkylbenzene
Figure 5.3 Plots of the carbon numbers of the alkyl substitutes of alkylbenzene vs. their log k-values
for the columns a-e. Applied separation voltage is 25 kV. Other conditions same as in
Figure 5.1.
Figure 5.4 presents the effect of porogen content on the distribution constant (K) of each
test compound on the different columns. K-values were calculated by using the
experimentally obtained retention factors and the phase ratios (β) of the columns (K = kβ,
β-values were calculated from column porosity, εT). Obviously, the tested mono-substituted
benzene derivatives have similar Ks on the different columns. As a result, the retention
mechanism for these mono-substituted benzene compounds is the same. In contrast, for
multi-substituted benzenes, especially with bulky groups, e.g., 1,3,5-triisopropylbenzene
(TIPB, compound No. 7), big difference in retention between column e and columns a~d is
observed. On column e, TIPB is eluted extremely fast, even earlier than benzene; 1,3-
diisopropylbenzene (DIPB) also is earlier eluted in comparison with the other columns. It
appears that, besides the reversed-phase retention, column e simultaneously exhibits size
exclusion retention for relatively bulky compounds.

- 114 - Chapter 5
0
1
2
3
4
45 50 55 60 65
Porogen volume fraction (%)
Dis
tribu
tion
cons
tant
(K)
1 2 3 4 5 6 7
a b c d e
Compounds:
Figure 5.4. Effect of porogen content on the distribution constant (K) of each test compound. Solutes
are thiourea, benzylalcohol (1), benzene (2), propylbenzene (3), butylbenzene (4), 1,3-
diisopropylbenzene (5), amylbenzene (6) and 1,3,5-triisopropylbenzene (7). Phase ratios
were calculated from: β = εT/(1-εT) where εT is porosity, see Table 5.1. Other conditions
same as in Figure 5.1.
The micropore size distribution of the polymers was investigated by BET nitrogen sorption
method as described in the experimental section. As shown in Figure 5.5, the size range of
micropores is similar for columns a~d, around 10 Å.

Preparation and Characterization of Monolithic … - 115 -
0
0,0004
0,0008
0,0012
0,0016
0 5 10 15 20 25 30 35 40 45 50
Pore diameter (Å)
Diff
eren
tial p
ore
volu
me
(cm
3 .g-1
.Å-1
)abcde
Figure 5.5 Micropore size distribution for columns a~e measured by BET nitrogen sorption; slit pore
model is used for micropore calculation.
Column e, however, has a wider range of pore size distribution ranging from 8 to 30 Å.
Furthermore, the total amount of micropores in columns a~e is significantly different.
Generally, at higher porogen contents a less amount of micropores is formed. For example,
from Figure 5.5, column a contains the highest amount of micropores while column e has
almost no micropores and its surface area is only 4.6 m2/g (column a 41.3 m2/g; column b
33.9 m2/g; column c 13.6 m2/g column d 5.4 m2/g). Theoretically, micropores in monolithic
column have the same function as the inner pores in conventional porous packing particles,
viz. they are the main areas where chromatographic retention occurs. However, if the
analytes are relatively large compared to the micropores, such as TIPB with sizes of
9×9×4.5 Å, the probability of these compounds to enter micropores becomes smaller due
to steric hindrance and thus bulky analytes are prone to partial exclusion, which is more
obvious on columns with lower amount of micropores. To illustrate this, on column e,
TIPB is eluted much earlier than on the other more micropores containing columns (Fig.
5.4). Considering that the polymers in the measurements of BET nitrogen sorption were in
the dry state, size exclusion liquid chromatography (SEC) was used to further investigate
the size exclusion behaviours of compounds such as TIPB and DIPB by using

- 116 - Chapter 5 tetrahydrofuran (THF) as the mobile phase. In Figure 5.6 ∆t-values of various analytes are
studied where ∆t equals the value of t-te where t is the retention time of a specific analyte
and te is the retention time of polystyrene with a molecular weight of 2,700,000. Apparently,
due to size exclusion, the ∆t values of TIPB and DIPB are smaller than these of
comparable small molecules. Obviously from Figure 5.6, on columns with decreasing
porogen content (columns e>d>c>b>a), ∆t becomes larger and the resolution for the test
compounds is somewhat better.
0
1
2
3
4
5
6
7
8
0 2 4 6 8 10
∆t (min)
Com
poun
d nu
mbe
r
b c d eColumns:
Figure 5.6
∆t-values (retention time of analyte minus the retention time of polystyrene MW 2.700.000,
t-te) for different analytes under SEC conditions on columns b~e. Samples: 1. polystyrene
(MW, 540); 2. TIPB; 3. o-terphenyl; 4. DIPB; 5. triphenylene; 6. biphenyl; 7. 1,3,5-
trimethylbenzene. Mobile phase: THF.
This results from the gradually larger number of micropores of these columns, which also is
in good agreement with the BET results. Additionally, from the larger ∆t value of TIPB
(9×9×4.5 Å) compared to triphenylene (9.2×9.2×2 Å), it can be concluded that the

Preparation and Characterization of Monolithic … - 117 -
micropores in the polymer rods are of a slit rather than a cylinder type of shape. Therefore,
the slit model was chosen to calculate micropore size of our rod columns.
As discussed above, columns a~d primarily show a reversed-phase retention mechanism.
As an example, a chromatogram of alkylbenzenes on column c is given in Figure 5.7.
Interestingly, abnormally broad peaks for DIPB and especially TIPB were obtained; similar
broad peaks were also observed on columns a, b and d (plate height of TIPB: column a, 24
µm; column b, 39 µm and column d, 11500 µm).
-5
5
15
25
35
45
55
65
75
0 5 10 15 20 min
8
1
2 3
4
5
6
7
Figure 5.7 CEC chromatogram on column c. Sample is composed of thiourea (1), benzene (2), toluene
(3), ethylbenzene (4), propylbenzene (5), DIPB (6), TIPB (7) and heptylbenzene (8).
Applied voltage, 30 kV. Other conditions are the same as in Figure 5.1.
To illustrate this in more detail, in Figure 5.8 the plate height vs. flow velocity for TIPB,
DIPB and heptylbenzene are plotted. The Van Deemter C-term values for these
compounds are 109.1, 6.4 and 2.4×10⁻⁴ min, respectively, which were calculated from the
fitted curve. TIPB shows an extremely slow mass transfer, which leads to a substantial
dependence of H on flow velocity of these compounds. On the contrary, small molecule
heptylbenzene shows very low velocity dependence. As a consequence, H values are
satisfactory and between 21 and 35 µm in the optimal velocity span. Similar plate height
function was also observed on the other columns. We assume that the slow mass transfer
of TPIB results from the small micropores (ca. 1 nm) in the polymer rod that are too small
for TIPB to easily enter and exit.

- 118 - Chapter 5
0 2 4 6 80
200
400
600
800
1000
1,3,5-Triisopropylbenzene 1,3-Diisopropylbenzene Heptylbenzene
Plat
e he
ight
(µm
)
Flow velocity (cm.min-1)
Figure 5.8. Plots of plate height as a function of flow velocity for column c. Sample consists of TIPB
(1), DIPB (2) and heptylbenzene (3). Other conditions are the same as in Figure 5.1.
Further evidence can be obtained from Figure 5.9 of the plots of plate height vs.
temperature. For TIPB, there is a strong dependency of the plate height (H) on
temperature: H decreases dramatically with the increasing temperature, and the plate height
of DIPB also shows similar tendency. However, the temperature dependency of H, for the
small compounds, is very small. It must be emphasized here that the linear relationship
between voltage and current suggests that Joule heating is negligible (Fig. 5.10). We believe
that Joule heating affects both bulky and small compounds to the same extend. Therefore,
in our opinion Joule heating did not cause the abnormal broadening peaks of bulky
molecules.

Preparation and Characterization of Monolithic … - 119 -
0
100
200
300
400
500
15 25 35 45 55
Temperature ( ºC)
Plat
e he
ight
(µm
)
4
3
2 1
Figure 5.9 Effect of temperature on plate height for column c. Solutes: 1. thiourea; 2. propylbenzene;
3. DIPB; 4. TIPB. Other conditions are the same as in Figure 5.1.
As a result, it is obvious that for bulky molecules mass transfer is the predominant factor to
plate height. Under high temperature, the mass transfer can be greatly speeded up by the
increase of their diffusion coefficients, and consequently the column efficiency can be
enhanced substantially.

- 120 - Chapter 5
0
5
10
15
20
25
30
0 1 2 3 4 5 6 7 8
Current (µµµµA)
Volta
ge (k
V)
Figure 5.10 Plot of current versus voltage (absolute values) for column d. Conditions are the same as in
Figure 5.1.
5.3.3 Comparison between HPLC and CEC Columns were also investigated under pressure-driven mode. Figure 5.11 shows the Van
Deemter curves for thiourea under both CEC and µ-HPLC conditions on column c. The
calculated Van Deemter parameters A and C are 6.0 µm, 5.7×10⁻⁴ min under pressure- and
5.6 µm, 1.7×10⁻⁴ min under electro-driven conditions, respectively. As expected, the plate
height under electro-driven conditions is much lower than that in the pressure mode.
Furthermore, the plate height differences between two modes become larger with the
increase of the flow rate due to the flat flow profile under electro-driven mode.

Preparation and Characterization of Monolithic … - 121 -
0 1 2 3 4 5 6 7 80
10
20
30
40
50
60
CEC
HPLC
Plat
e he
ight
(µm
)
Linear flow velocity (cm.min-1)
Figure 5.11 Comparison of Van Deemter curves under electro- and pressure-driven conditions on
column c. Column c: 41.5 cm (8.5 cm from detection window to outlet); sample, thiourea;
temperature, 21 °C; other conditions are the same as in Figure 5.1.
As an example, a comparison of chromatograms on column c for various test compounds
under both modes is shown in Figure 5.12. From the peak widths, the difference in
column efficiency obtained under two eluent driven modes can be easily seen. The plate
number under electro-driven conditions in Figure 5.12A is more than twice of that in the
pressure-driven mode.
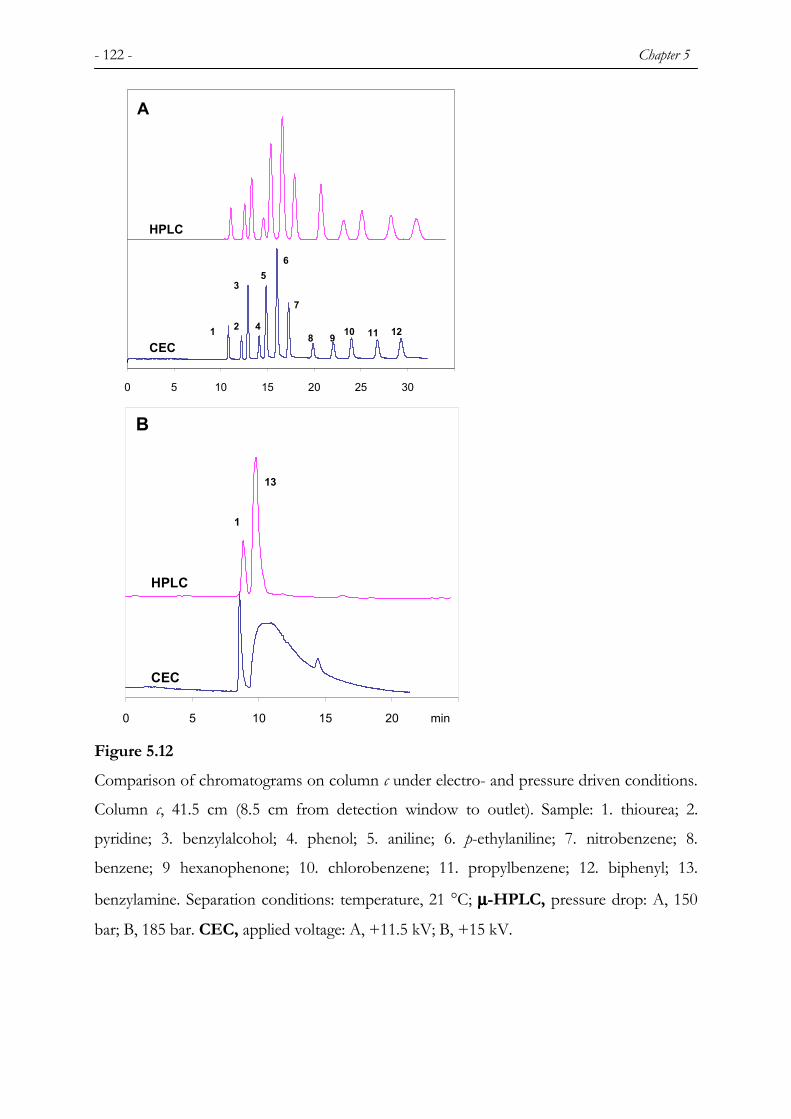
- 122 - Chapter 5
0 5 10 15 20 25 30 35
HPLC
CEC1 2
3
4
56
7
8 9 10 1211
A
0 5 10 15 20 25
1
13
HPLC
CEC
B
min Figure 5.12 Comparison of chromatograms on column c under electro- and pressure driven conditions.
Column c, 41.5 cm (8.5 cm from detection window to outlet). Sample: 1. thiourea; 2.
pyridine; 3. benzylalcohol; 4. phenol; 5. aniline; 6. p-ethylaniline; 7. nitrobenzene; 8.
benzene; 9 hexanophenone; 10. chlorobenzene; 11. propylbenzene; 12. biphenyl; 13.
benzylamine. Separation conditions: temperature, 21 °C; µµµµ-HPLC, pressure drop: A, 150
bar; B, 185 bar. CEC, applied voltage: A, +11.5 kV; B, +15 kV.

Preparation and Characterization of Monolithic … - 123 -
Typical values for the plate numbers (plates per meter) of peaks 2 to 12 are 40,000 under
HPLC and 105,000 under CEC conditions. The retention factors of each compound in
CEC (kCEC) and µ-HPLC (kHPLC) and their ratios (kHPLC/kCEC) are listed in Table 5.2.
Table 5.2 Values of kHPLC, kCEC and kHPLC/kCEC of the test compounds in Figure 5.12.
Compounds 2 3 4 5 6 7 8 9 10 11 12 13
kHPLC 0.14 0.20 0.32 0.38 0.50 0.62 0.87 1.08 1.26 1.54 1.79 0.11
kCEC 0.13 0.19 0.30 0.37 0.48 0.60 0.84 1.04 1.22 1.48 1.72 0.20
kHPLC/kCEC 1.05 1.04 1.04 1.03 1.04 1.04 1.04 1.04 1.03 1.04 1.04 0.55
For the apolar and polar compounds in the test (Figure 5.12A), the kHPLC/kCEC and the
peak symmetry values (not shown) are close to one. These compounds show similar
retention behaviours under both HPLC and CEC conditions. For compounds, however,
with higher polarity, e.g. benzylamine in Figure 5.12B, the columns show completely
different performance under the two eluent driven modes. Under CEC conditions, the
benzylamine peak is extremely broad and tailing and it elutes later than under HPLC
conditions. It is noteworthy to see that under the same conditions the other basic
compounds such as pyridine and p-ethylaniline show high-efficient and symmetric peaks
(Figure 5.12A). Clearly, this must be attributed to the pKa values of these compounds. The
pKa values of p-ethylaniline and pyridine are approximately 5; the pKa value of benzylamine
is significantly larger (9.3). In the mobile phase of 80% acetonitrile and 20% phosphate
buffer of pH 7 benzylamine is partly positively charged, which has been verified by capillary
zone electrophoresis (CZE) experiments. Due to its electrophoretic mobility
superimposition on the liquid chromatographic elution, benzylamine was expected to leave
the column earlier under CEC condition compared to HPLC mode. However, this was not
observed in our experiments. We speculate that charged groups on the polymer were
polarized and orientated in the electrical field. Under such a condition, the polymer may
become more polar, and the interaction between benzylamine and polymeric stationary
phase may be much stronger.

- 124 - Chapter 5 Table 5.3 shows the retention factor values of benzylamine on different columns under
CEC and µ-HPLC.
Table 5.3 Retention factors kHPLC and kCEC of benzylamine in CEC and micro-HPLC of
some columns b, c, d and e from Table 5.1.
type b c d e Column
phase ratio 1.27 1.56 2.03 2.57
kHPLC 0.14 0.11 0.08 0.05
kCEC 0.30 0.20 elutes before t0
For columns d and e with higher phase ratios, the retention factor values are negative under
CEC conditions; the higher the phase ratio, the smaller the retention factor. In contrast, on
columns b and c with lower phase ratios, benzylamine has a positive retention factor and
kCEC is larger for the column with a smaller phase ratio. As discussed above, under the
conditions used in this study benzylamine exists predominantly as a cation, so its retention
is expected to be determined by both the electrophoretic migration and the interaction with
the chromatographic stationary phase. On columns with a higher phase ratio, the retention
of benzylamine is controlled by the electrophoretic effect but not by chromatographic
influences; cations elute faster. In contrast, on columns with lower phase ratios, the
retention of benzylamine is mainly attributed to reversed-phase chromatographic effects.
Obviously, the strong interaction of benzylamine with polymer is responsible for the longer
retention of benzylamine on columns b and c under CEC conditions.
5.3.4 Porosity
Total porosity (εT) is another important parameter for column evaluation. Various methods
are available to measure εT, such as the flow method [55], applying chromatographic
pressure-driven conditions, the conductivity method using electro-driven conditions [56],
and the gravimetric method [57]. In this study, the flow method was used to measure εT
values. The calculation of εT was based on a following equation: εT = 4Fto/(d2π L), where F
is the volumetric flow rate, to the retention time of an unretained marker (thiourea), d the

Preparation and Characterization of Monolithic … - 125 -
column inner diameter, and L the column length. The average εT values at different flow
rates are given in Table 5.1. Considering the possible compressibility of some columns (see
next section), a flow rate lower than 0.5 µL/min was applied for εT-measurements. The
relative standard deviation (RSD) of the measurement was less than 1.5%. Ideally, the
porosity of a column is equal to the porogen volume fraction in the reaction solution.
However, it is possible that some monomers may remain unreacted, some small polymer
pieces may be soluble, and normally after polymerization the volume of highly cross-linked
polymer may be smaller than the volume of the starting monomers. As a result, the real εT
is larger than the porogen volume fraction.
5.3.5 Reproducibility and stability Reproducibility of various column parameters is a critical consideration in the field of
preparation and application of rod columns. Therefore, a number of important parameters
such as EOF, efficiency and retention factors were determined to te t column-to-column as
well as batch-to-batch reproducibility. The results of the reproducib
by the retention time of thiourea, the retention factor (k), and the
summarized in Table 5.4.
Table 5.4 Reproducibility of electrochromatographic properties of
RSD%
Variable n EOF k (0.8-2.1
Run-to-run 10 0.26 < 0.35 Single column Day-to-day 6 0.78 < 0.85
One batch 6 0.76 < 3.90 Different columns
Different
batches 4 1.28 < 1.84
The day-to-day reproducibility of one column and the reproducibili
were averaged from the results of 10 continuously repeating injec
Table 5.4, the reproducibility for both the EOF and the retention
addition, the RSD values for column efficiency are acceptable, e
different batches. However, to apply these columns in daily r
improvements to decrease variation in plate number should be made
s
ility of EOF evaluated
column efficiency are
column c.
) Column efficiency
< 1.52
< 3.54
< 7.87
< 4.07
ty of different columns
tions. Obviously, from
factor is satisfactory. In
ither for one batch or
outine practice further
.

- 126 - Chapter 5 The mechanical stability of the columns was also studied. After using the columns for
longer than one week, about 1 mm long empty parts at both ends of the column were
observed. This was more obvious for columns prepared by using high porogen content.
Possible factors, such as EOF, pressure, and shrinkage that may affect the length of the
polymer rod were systematically examined. It was found that the shrinkage of a polymer
itself and the pressure might cause the polymer bed to become shorter. Under high
pressure (up to 300 bar), columns with a porogen volume fraction of higher than 57% are
compressible (see Table 5.1). As can be concluded from the linear relationship between
pressure drop and flow rate, the polymer bed remains stable after column equilibration
under high pressure. The column efficiency, however, decreases drastically after a column is
compressed (Table 5.1). For columns d and e, the ratios of column efficiency after and
before compression are 0.78 and 0.45, respectively. Hence, it is worthwhile to notice that a
low flow rate should be applied for conditioning these CEC columns if a pump is used.
However, when a modified fused silica capillary pre-treated with acrylic double bond on the
inner wall is used, both shrinkage and compressibility of the columns can be overcome. As
seen in the SEM photo in Figure 5.13, the polymer monolith in this column is covalently
bounded to the inner wall of the capillary. There is no cleft between the polymer rod and
the inner wall, which significantly differs from the SEM photos in Figure 5.2. Therefore,
modified capillaries may be a better alternative than unmodified fused silica capillaries in
preparation of monolithic columns.
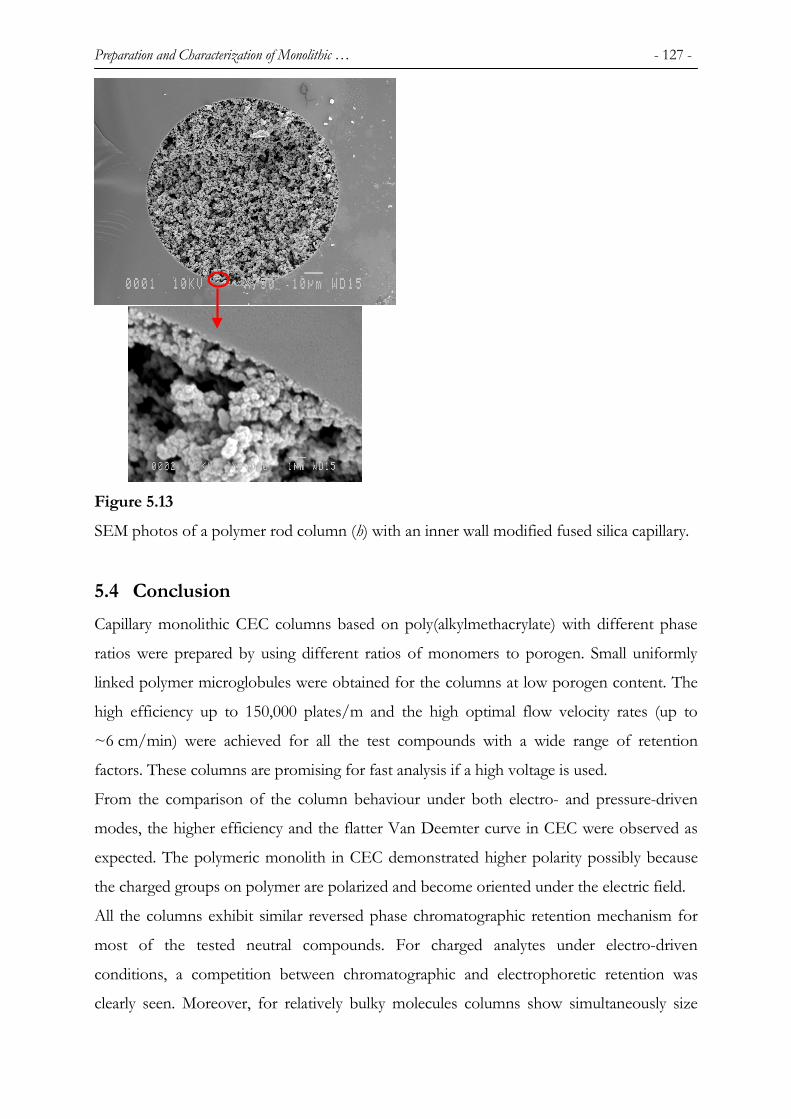
Preparation and Characterization of Monolithic … - 127 -
Figure 5.13 SEM photos of a polymer rod column (h) with an inner wall modified fused silica capillary.
5.4 Conclusion Capillary monolithic CEC columns based on poly(alkylmethacrylate) with different phase
ratios were prepared by using different ratios of monomers to porogen. Small uniformly
linked polymer microglobules were obtained for the columns at low porogen content. The
high efficiency up to 150,000 plates/m and the high optimal flow velocity rates (up to
~6 cm/min) were achieved for all the test compounds with a wide range of retention
factors. These columns are promising for fast analysis if a high voltage is used.
From the comparison of the column behaviour under both electro- and pressure-driven
modes, the higher efficiency and the flatter Van Deemter curve in CEC were observed as
expected. The polymeric monolith in CEC demonstrated higher polarity possibly because
the charged groups on polymer are polarized and become oriented under the electric field.
All the columns exhibit similar reversed phase chromatographic retention mechanism for
most of the tested neutral compounds. For charged analytes under electro-driven
conditions, a competition between chromatographic and electrophoretic retention was
clearly seen. Moreover, for relatively bulky molecules columns show simultaneously size

- 128 - Chapter 5 exclusion retention and chromatographic retention. In such a case, as long as the
chromatographic partitioning is the leading force in the chromatographic process, the peaks
are abnormally broad because of the slow mass transfer of bulky molecules, resulting from
the steric resistance of micropores (< 2 nm). This type of monolith is suitable for the
analysis of very small molecules or macromolecules. In order to expand application of these
columns, it seems critical to enlarge the micropores to mesopore size similar to the inner
pores of normal silica based packing particles. Applications for the analysis of
macromolecules and the preparation of new monoliths with mesopores are under
development.
Acknowledgements
The authors are grateful to Mr. N. Lousberg for SEM experiments and to Mr. A.P.B.
Sommen for his assistance with micropore size measurements. We also acknowledge Dr.
X.W. Lou and Dr. W. H. Ming for their beneficial discussions.
REFERENCES 1. J.H. Knox, I.H. Grant, Chromatographia, 24 (1987) 135.
2. J.H. Knox, I.H. Grant, Chromatographia, 32 (1991) 317.
3. M.M. Dittmann, G.P. Rozing, J. Chromatogr. A, 744 (1996) 63.
4. N.W. Smith, M.B. Evans, Chromatographia, 38 (1994) 649.
5. V. Pretorius, B.J. Hopkins, J.D. Schieke, J. Chromatogr., 99 (1974) 23.
6. C. Yan, D. Schaufelberger, F. Erni, J. Chromatogr., A 670 (1994) 15.
7. R. Stol, H. Poppe, W. Th. Kok, J. Chromatogr. A, 887 (2000) 199.
8. A.S. Rathore, Cs. Horváth, J. Chromatogr. A, 781 (1997) 185.
9. G. Choudhary, Cs. Horváth, J. Chromatogr. A, 781 (1997) 161
10. A.S. Rathore, E. Wen, Cs. Horváth, Anal. Chem., 71 (1999) 2633.
11. M.M. Dittmann, G.P. Rozing, J. Microcolumn Sep., 9 (1997) 399.
12. S.R. Witowski, R.T. Kennedy, J. Microcolumn Sep., 11 (1999) 723.
13. R. Stol, W. Th. Kok, H. Poppe, J. Chromatogr. A, 853 (1999) 45.
14. Y. Zhang, W. Shi, L. Zhang, H. Zou, J. Chromatogr. A, 802 (1998) 59.
15. D. Li, V.T. Remcho, J. Microcol. Sep., 9 (1997) 389.
16. U. Tallarek, E. Rapp, T. Scheenen, E. Bayer, H. van As, Anal. Chem., 72 (2000) 2292.

Preparation and Characterization of Monolithic … - 129 -
17. R.A. Carney, M.M. Robson, K.D. Bartle, P. Myers, J. High Resolut. Chromatogr., 22
(1999) 29.
18. M.G. Cikalo, K.D. Bartle, M.M. Robson, P. Myers, M.R. Euerby, Analyst, 123 (1998)
87R.
19. J.S. Kowalczyk, Chem. Anal. (Warsaw), 41 (1996) 157.
20. R. Stevenson, K. Mistry, I.S. Krull, Int. Lab., 11 (1998) 11C.
21. L.A. Colón, Y. Guo, A. Fermier, Anal. Chem., 8 (1997) 461A.
22. T. Tsuda, Analusis, 26 (1998) M48.
23. L.A. Colón, K.J. Reynolds, R.A. Maldonado, A.M. Fermier, Electrophoresis, 18 (1997)
2162.
24. K.D. Altria, N.W. Smith, C.H. Turnbull, Chromatographia, 46 (1997) 664.
25. C. Fujimoto, TrAC, Trend Anal. Chem., 18 (1999) 291.
26. S. Krull, A. Sebag, R. Stevenson, J. Chromatogr. A, 887 (2000) 137.
27. U. Pyell, J. Chromatogr. A, 892 (2000) 257.
28. F. Steiner, B. Scherer, J. Chromatogr. A, 887 (2000) 55.
29. C.A. Rimmer, S.M. Piraino, J.G. Dorsey, J. Chromatogr. A, 887 (2000) 115.
30. M. Pursch, C. Sander, J. Chromatogr. A, 887 (2000) 313.
31. K. Schmeer, B. Behnke, E. Bayer, Anal. Chem., 67 (1995) 3656.
32. B. Boughtflower, T. Underwood, Chromatographia, 38 (1995) 329.
33. M.M. Dittmann, G.P. Rozing, G. Ross, T. Adam, K.K. Unger, J. Capillary
Electrophor., 4 (1997) 201.
34. M.T. Dulay, R.P. Kulkarni, R.N. Zare, Anal. Chem., 70 (1998) 5103.
35. G. Chirica, V.T. Remcho, Electrophoresis, 20 (1999) 50.
36. O.L. Tang, B.M. Xin, M.L. Lee, J. Chromatogr. A, 837 (1999) 35.
37. N. Ishizuka, H. Minakuchi, K. Nakanishi, N. Soga, H. Nagayama, K. Hosoya, N.
Tanaka, Anal. Chem., 72 (2000) 1275.
38. N. Minakuchi, K. Nakanishi, K.N. Soga, N. Ishizuka, N. Tanaka, Anal. Chem., 68
(1996) 3498.
39. S.M. Fields, Anal. Chem., 68 (1996) 2709.
40. N. Ishizuka, H. Minakuchi, K. Nakanishi, N. Soga, K. Hosoya, N. Tanaka, J. High
Resolut. Chromatogr., 21 (1998) 477.
41. F. Svec, E.C. Peters, D. Sýkora, C. Yu, J.M.J. Fréchet, J. High Resolut. Chromatogr., 23
(2000) 3.

- 130 - Chapter 5 42. Gusev, X. Huang, Cs. Horváth, J. Chromatogr., 855 (1999) 273.
43. Palm, M.V. Novotný, Anal. Chem., 69 (1997) 4499.
44. L. Schweitz, L.I. Andersson, S. Nilsson, J. Chromatogr. A, 817 (1998) 5.
45. Maruška, C. Ericson, A. Vegvari, S. Hjertén, J. Chromatogr. A, 837 (1999) 25.
46. Ericson, S. Hjertén, Anal. Chem., 71 (1999) 1621.
47. Ericson, J. Holm, T. Ericson, S. Hjertén, Anal. Chem., 72 (2000) 81.
48. Ericson, J.-L. Liao, K. Nakazato, S. Hjertén, J. Chromatogr. A, 767 (1997) 33.
49. C. Fujimoto, J. Kino, H. Sawada, J. Chromatogr. A, 716 (1995) 107.
50. E.C. Peters, M. Petro, F. Svec, J.M.J. Fréchet, Anal. Chem., 70 (1998) 2288.
51. E.C. Peters, M. Petro, F. Svec, J.M.J. Fréchet, Anal. Chem., 70 (1998) 2296.
52. E.C. Peters, M. Petro, F. Svec, J.M.J. Fréchet, Anal. Chem., 69 (1997) 3646.
53. X. Huang, Cs. Horváth, J. Chromatogr. A, 788 (1997) 155.
54. H.A. Claessens, Characterization of Stationary Phases for Reversed-Phase Liquid
Chromatography: Column Testing, Classification and Chemical Stability, Ph.D. Thesis,
Eindhoven University of Technology, The Netherlands, 1999, p. 151.
55. Cs. Horváth, H.J. Lin, J. Chromatogr., 126 (1976) 401.
56. J. Bear, Dynamics of Fluids in Porous Media, Dover Publications, New York, 1988,
p.113.
57. K.K. Unger, Porous Silica, Its properties and Use as Support in Columns Liquid
Chromatography, Elsevier, Amsterdam, 1979, p. 171.

- 131 -
CHAPTER 6
6 QUANTITATIVE STRUCTURE RETENTION
RELATIONSHIPS IN COMPARATIVE STUDIES OF
BEHAVIOUR OF STATIONARY PHASES UNDER HIGH-PERFORMANCE LIQUID CHROMATOGRAPHY AND
CAPILLARY ELECTROCHROMATOGRAPHY
CONDITIONS
Summary
Quantitative structure-retention relationships (QSRR) have been employed to study
molecular mechanism of chromatographic separations under pressure- (HPLC) and
electro-driven (CEC) conditions. Logarithms of retention factors corresponding to zero
percent of organic modifier in aqueous eluent, log kw, were determined on eight reversed-
phase stationary phases under both HPLC and CEC conditions at similar eluent flow
velocities. QSRR equations describing log kw in terms of linear solvation energy
relationship (LSER) parameters of analytes, in terms of simple structural descriptors
acquired by calculation chemistry, and in terms of logarithms of n-octanol-water partition
coefficients, were derived. Parameters of corresponding QSRR equations for individual
stationary phases were compared for both HPLC and CEC modes and the resulting
similarities and differences in retention mechanisms were discussed. It has been
This chapter has been submitted for publication in Journal of Chromatography A.

- 132 - Chapter 6 concluded that at least in the case of regular neutral analytes the specific inputs to
separation mechanism due to the electric field in CEC are of secondary importance.
6.1 Introduction Over two decades of development of capillary electrochromatography (CEC) many articles
have been published on the underlaying theory [1-10]. As a highly efficient separation
technique CEC was proposed mainly for analysis of steroids, peptides and proteins [11-16].
Much effort was devoted to column technology, development of stationary phases and to
specific column design.
CEC, combining the theory and practice of capillary electrophoresis (CE) and capillary
high-performance liquid chromatography (HPLC), attracted special attention from the
point of view of the molecular mechanism of retention. The retention behavior of test
analytes has been studied by a number of authors, who usually compared retention factors
or plate numbers of neutral compounds under both HPLC and CEC conditions. Recently,
model-based methods have been employed, in these comparative studies. Among them the
Galushko model [17,18] or models based on structural descriptors of analytes from
molecular modeling or from linear solvation energy relationships (LSER) [19-25] are
probably best known. The latter models have successfully been used in HPLC to
differentiate reversed-phase (RP) stationary phases and to predict retention of analytes.
The simplest quantitative structure-retention relationship (QSRR) model used in
comparative studies of stationary phases relates log kw to logarithm of n-octanol- water
partition coefficient, log P:
Pkkkw loglog 21 += (6.1)
where log kw is retention factor extrapolated to a pure water (buffer) mobile phase, the
coefficients k1 and k2 are characteristics of the systems representing differences in the
individual properties between the mobile and the stationary phase.
The following model relates log kw to structural descriptors of analytes provided by
molecular modeling:
SASkkkkkw'4
2'3min
'2
'1log +++= µδ (6.2)
where minδ is the largest atomic excess of electrons, 2µ is square of total dipole moment and
SAS is van der Waals surface area of a molecule that is accessible to a molecule of water,
Quantitative Structure Retention Relationships … - 133 -
the coefficients '1k , '
2k , '3k and '
4k are characteristics of the systems representing differences
in the individual properties between the mobile and the stationary phase.
The LSER model of QSRR is characterized by the following general equation:
xHHH
w VkkkkRkkk ''62
''52
''42
''32
''2
''1log +++++= βαπ (6.3)
where R2 is excess molar refraction, H2π is dipolarity/polarizability, H
2α is hydrogen-bond
acidity, H2β is hydrogen-bond basicity and Vx is characteristic volume of McGowan, the
coefficients ''1k , ''
2k , ''3k , ''
4k , ''5k and ''
6k are characteristics of the systems representing
differences in the individual properties between the mobile and the stationary phase.
Wei et al. [26] applied LSER in a comparative study of 3 µm ODS particles. They used 70%
ACN:30% aqueous buffer (2 mM Tris/HCl) as a mobile phase and found out that QSRR
parameters referring to CEC conditions differed from those obtained at RP-HPLC
conditions. Unlike in RP-HPLC, hydrogen-bond basicity of a solute ( H2β ) was statistically
significant in CEC. The parameters Vx, H2π , H
2α and H2β were all of similar significance in
CEC. On the other hand, in HPLC the most significant were Vx and H2β parameters;
actually, H2π was statistically significant at 95% significance level but it was of lesser
importance for retention description.
Employing LSER Liu et al. [27] discussed the role of organic modifier in RP-HPLC and in
CEC. The same group [28] studied also behavior of Spherisorb ODS II stationary phase in
CEC, pressurized electrochromatography (PEC) and HPLC. For acetonitrile as an organic
modifier, the reported LSER equations obtained under CEC, PEC and HPLC conditions
were closely similar. In the view of limited and rather fragmental actual knowledge it
appeared worthwhile to systematically study the molecular mechanism of separations in
analogous chromatographic systems operated at CEC and HPLC conditions employing the
QSRR approach. For that purpose eight RP stationary phases were subjected to a study
under both HPLC and CEC conditions using acetonitrile as organic modifier.
6.2 Experimental 6.2.1 Columns The columns used in this study are listed in Table 6.1 together with relevant data provided
by the manufacturer. The column packed bed and the total length was 25 cm and 33.5
cm, respectively.

- 134 - Chapter 6 Prior to use in the CEC mode, the columns were conditioned. This was accomplished by
applying 10 bar pressure on both sides of the column and increasing the voltage from 0 to
25 kV in 5 kV steps for 10 min. Next, the pressure was increased to 12 bar and a 30 kV
voltage was applied for 10 min. For the micro-HPLC experiments, the columns were
conditioned until the column pressure was stabilized (about 1 h).
Table 6.1 List of investigated columns; each column diameter: 100 µm; average particle
size, 3 µm.
Column Pore Size
[Å] Pore
Volume [cm3/g]
Surface Area
[m2/g]
Carbon Load [%]
CEC Hypersil C18
130 0.65 170 8.5
Hypersil C8 120 0.65 170 6.5
Hypersil Phenyl 120 0.65 170 5
Spherisorb ODS 80 0.50 200 6.2
Spherisorb C8 80 0.50 200 5.8
Unimicro C18 Data not available
Unimicro C8 Data not available
Unimicro Phenyl
Data not available
The columns were tested under pressure- and electro-driven conditions using the same
batches of eluents. All the columns were supplied in duplicate (the same batch with
maximum 2% RSD in retention factor under HPLC conditions). The requirement was
met for analysis of up to 1% RSD in retention factor under CEC conditions and of up to
0.5% RSD under HPLC conditions; each for six consecutive injections. Hold-up time (t0)
was measured using thiourea added to the solutions of the analytes and varied between 3-7
minutes depending on column and percentage of organic modifier. t0 time in HPLC was adjusted

Quantitative Structure Retention Relationships … - 135 -
to the obtained t0 time in CEC for particular column and particular mobile phase composition.
HPLC conditions were adjusted to similar flow velocities as obtained in CEC. As a
consequence, the HPLC experiments were not optimized with respect to the plate height.
6.2.2 Instrumentation All the CEC chromatograms were obtained on a 3DCE instrument (Agilent Technologies
GmbH, Waldbronn, Germany) equipped with a pressure facility of up to 12 bar at the
outlet and/or inlet vial. This pressurization option of the instrument was used to prevent
bubble formation in the capillaries. Samples were injected electrokinetically (5 kV for 2-
15 s). For each run a voltage of 20 kV (600 Vcm-1 electric field strength) was applied with
10 bar pressure at both ends of a capillary. The detection wavelength was 210 nm. High
voltage was applied as a 6 s time ramp to avoid column stress. The column cassette
temperature was maintained at 20ºC.
Micro HPLC separations were carried out on a system consisting of a Phoenix 20 CU
syringe pump and microUVIS20 ultraviolet/visible absorbance detector operated at 210 nm
both from (Carlo Erba Instruments, Milan, Italy), and an injector with a 200 nL loop
(VICI-AG Valco Europe, Schenkon, Switzerland). The flow-rate was adjusted to that in
CEC experiments (approx. 0.2-0.3 µL/min) using a VICI-AG 1/100-flow splitter. The
experiments were performed at air-conditioned laboratory conditions (temperature about
21ºC) without additional thermostating.
6.2.3 Chemicals Acetonitrile (ACN) of HPLC supra gradient-grade purity (Biosolve, Valkenswaard,
Netherlands) was used as the organic modifier in various concentrations. The eluents were
prepared by mixing phosphate buffer (pH 7.0, final concentration 1 mmol/L) with an
appropriate amount of the organic modifier and degassed ultrasonically for 15 min prior to
use. The same batch of eluent was used to test a given column at both separation modes.
The set of test analytes is listed in Table 6.2 together with their structural descriptors. The
series of analytes was taken as previously designed [29] with the well-defined hydrogen-
bond capacity descriptors derived from the complexation scale of Abraham [25,26].
Samples were prepared by dissolving the analytes in the mobile phase or in the pure organic
modifier and then diluting with phosphate buffer.

- 136 - Chapter 6 Table 6.2 Structural descriptors of test analytes used in QSRR equations. No. Solute log P R2 H
2π H2α H
2β Vx minδ 2µ SAS
1 n-Hexylbenzene 5.52 0.591 0.50 0.00 0.15 1.562 -0.2104 0.03880 415.40
2 1,3,5-Triisopropylbenzene 6.36 0.627 0.40 0.00 0.22 1.985 -0.2057 0.00624 478.27
3 1,4-Dinitrobenzene 1.47 1.130 1.63 0.00 0.41 1.065 -0.3418 0.00012 312.07
4 3-Trifluoromethylphenol 2.95 0.425 0.87 0.72 0.09 0.969 0.2454 4.39321 302.54
5 3,5-Dichlorophenol 3.62 1.020 1.10 0.83 0.00 1.020 0.2434 1.98246 306.77
6 4-Cyanophenol 1.60 0.940 1.63 0.79 0.29 0.930 -0.2440 10.9693 290.61
7 4-Iodophenol 2.91 1.380 1.22 0.68 0.20 1.033 -0.3021 2.51856 301.47
8 Anisole 2.11 0.708 0.75 0.00 0.29 0.916 -0.2116 1.56000 288.13
9 Benzamide 0.64 0.990 1.50 0.49 0.67 0.973 -0.4334 12.8450 293.30
10 Benzene 2.13 0.610 0.52 0.00 0.14 0.716 -0.1301 0.00000 244.95
11 Chlorobenzene 2.89 0.718 0.65 0.00 0.07 0.839 -0.1295 1.70824 269.49
12 Cyclohexanone 0.81 0.403 0.86 0.00 0.56 0.861 -0.2944 8.83278 269.31
13 Dibenzothiophene 4.38 1.959 1.31 0.00 0.18 1.379 -0.2709 0.27457 364.54
14 Phenol 1.47 0.805 0.89 0.60 0.30 0.775 -0.2526 1.52028 256.72
15 Hexachlorobutadiene 4.78 1.019 0.85 0.00 0.00 1.321 -0.0750 0.06708 352.14
16 Indazole 1.77 1.180 1.25 0.54 0.34 0.905 -0.2034 2.39011 285.46
17 Caffeine -0.07 1.500 1.60 0.00 1.35 1.363 -0.3620 13.3298 367.02
18 4-Nitrobenzoic acid 1.89 0.990 1.07 0.62 0.54 1.106 -0.3495 11.7786 321.77
19 N-Methyl-2- pyrrolidinone -0.38 0.491 1.50 0.00 0.95 0.820 -0.3532 12.9168 270.53
20 Naphthalene 3.30 1.340 0.92 0.00 0.20 1.085 -0.1277 0.00000 313.25
21 4-Chlorophenol 2.39 0.915 1.08 0.67 0.20 0.898 -0.2482 2.18448 280.38
22 Toluene 2.73 0.601 0.52 0.00 0.14 0.716 -0.1792 0.06916 274.50
23 Benzonitrile 1.56 0.742 1.11 0.00 0.33 0.871 -0.1349 11.1222 277.91
24 Benzoic acid 1.87 0.730 0.90 0.59 0.40 0.932 -0.3651 5.85156 288.00
25 1,3-Diisopropylbenzene 4.90 0.605 0.46 0.00 0.20 1.562 -0.2055 0.08820 399.79
log P = logarithm of n-octanol-water partition coefficient; R2 = excess molar refraction; H2π = dipolarity/polarizability; H
2α = hydrogen-bond acidity; H2β = hydrogen-bond
basicity; Vx = characteristic volume of McGowan; minδ = highest electron excess charge on
an atom in the analyte molecule (in electrons); 2µ = square of total dipole moment (in
Debyes); SAS = solvent (water)-accessible molecular surface area (in Å2).
6.2.4 Test procedure Analytes were chromatographed with mobile phases being mixtures of organic modifier
with an aqueous buffer of composition ranging from 90/10 (V/V) to 40/60 (V/V). Based
on the linear relationship between the logarithm of retention factor (log k) and the
percentage of organic modifier in the mobile phase, the values of log kw corresponding to

Quantitative Structure Retention Relationships … - 137 -
100% aqueous eluent were obtained by extrapolation. The data are summarized in Table
6.3.
6.3 Results and discussion Table 6.3 summarizes values of log kw (retention factor extrapolated to 100% aqueous
mobile phase) for all the columns under both HPLC and CEC conditions. It is evident that
both Spherisorb stationary phases (ODS and C8) show retention patterns different than the
remaining phases. Values of log kw of polar compounds, such as 1,4-dinitrobenzene, 3,5-
dichlorophenol, 4-cyanophenol or cyclohexanone, are much higher than the corresponding
data determined on Hypersil or Unimicro stationary phases. Principal component analysis
(PCA) clearly distinguishes the Spherisorb C18 stationary phase under both HPLC and
CEC conditions as an outlier as regards the retention mechanism (Fig. 6.1a). PCA done for
the columns remaining after excluding Spherisorb C18 evidences that behaviour of the
Spherisorb C8 stationary phase also differs from the other phases though the difference is
not as pronounced as for the Spherisorb C18 stationary phase (Fig. 6.1b).
Comparing the data on the stationary phases given in Table 6.1 one may notice that, for
example, Hypersil columns have a higher carbon load and a lower surface area than
Spherisorb. The differences in log kw on those phases are remarkable. Most probably, they
are to some extent also due to the differences in column dipolarity/polarizibility. Spherisorb
stationary phases are based on a type of silica substrate that is apparently different than in
the case of other phases studied as the selectivity differences for the phases based on similar
substrate are usually minor [30].

- 138 - Chapter 6
25 24 23 22 21 20 19 18 17 16 15 14 13 12 11 10 9 8 7 6 5 4 3 2 1 N
o.
1,3-Diisopropylbenzene
Benzoic acid Benzonitrile Toluene 4-Chlorophenol N
aphthalene n-M
ethyl-2- pyrrolidinone 4-N
itrobenzoic acid Caffeine Indazole H
exachlorobutadiene Phenol D
ibenzothiophene Cyclohexanone Chlorobenzene Benzene Benzam
ide Anisole 4-Iodophenol 4-Cyanophenol 3,5-D
ichlorophenol 3-T
rifluoromethylphenol
1,4-Dinitrobenzene
1,3,5-Triisopropylbenzene n-H
exylbenzene
Analyte
6.2297 N
/A
2.4781 3.6731 2.8017 4.4222 -1.5731 N
/A
-1.117 1.4766 5.8905 1.8713 5.288 0.578 3.7446 2.9563 -0.0636 2.9818 3.1399 2.4421 3.7453 3.3498 3.3307 7.5969 6.8896 H
PLC
6.1735 N
/A
2.5528 3.7153 2.801 4.4403 -1.5032 N
/A
-1.0608 1.5621 5.807 1.9034 5.2275 0.9771 3.8149 3.0568 0.0284 3.031 3.1695 2.2699 3.82
3.4113 3.328 7.4694 6.7875 CE
C H
ypersil C18
6.4277 N
/A
2.7396 4.1474 2.9211 4.883
-2.1933 N
/A
-1.5547 1.586 5.9595 1.8566 6.0893 0.9234 4.2018 3.3792 0.1706 3.3711 3.4818 1.9323 4.1998 3.8029 3.5104 7.8589 6.8952 H
PLC
6.308 N
/A
2.7173 4.1025 2.8923 4.7714 -2.1923 N
/A
-1.4163 1.5356 5.8911 1.8303 5.921 0.9817 4.1603 3.3502 0.1214 3.0874 3.3882 1.7582 4.116 3.7493 3.4699 7.634 6.7579 CE
C H
ypersil C8 MO
S
5.7691 N
/A
2.2436 3.2389 2.5838 3.9157 -1.5955 N
/A
-0.9153 1.4586 5.3608 1.8956 4.8632 0.6586 3.3607 2.6257 0.3093 2.839 2.9769 2.1608 3.617 3.5055 3.1718 7.0597 6.1838 H
PLC
5.7907 N
/A
2.3027 3.298 2.5305 3.9475 -1.3497 N
/A
-1.3497 1.3001 5.4501 1.6201 4.9205 0.6516 3.3741 2.7196 0.056 2.8745 2.9368 1.8683 3.0982 3.2564 3.0677 6.4122 6.2189 CE
C H
ypersil Phenyl
5.798 N
/A
3.2451 4.0619 4.1911 4.4095 -2.0614 N
/A
-1.8807 3.3165 5.6157 7.336 5.1093 3.2235 3.7416 3.4653 1.4421 3.8934 4.8794 8.0989 5.4174 6.3703 6.3164 7.0826 6.4547 H
PLC
6.0112 N
/A
3.6883 4.0697 4.274 4.4376 -1.7704 N
/A
-1.3489 1.9024 5.6734 4.5947 5.1538 1.7929 4.0986 3.7403 0.3557 3.7837 4.1149 6.8314 4.3205 5.2672 5.0714 7.0962 6.4859 CE
C Spherisorb O
DS
log kw
Table 6.3 Logarithm
s of retention factors extrapolated to 100% aqueous eluent in individual chrom
atographic systems.

Quantitative Structure Retention Relationships … - 139 -
CEC
6.24
9 7.
0719
3.
2227
3.
5613
3.
6621
2.
0727
3.
1233
2.
9127
0.
4501
2.
8514
3.
4757
1.
1013
4.
8745
1.
8713
5.
43
1.65
64
-0.7
478
N/A
-1
.547
1 4.
0112
2.
7058
3.
4061
2.
5092
N
/A
5.86
01
Uni
mic
ro P
heny
l H
PLC
6.39
47
7.22
21
3.61
97
3.85
37
3.94
54
2.85
3.
4974
3.
1488
0.
6348
3.
1787
3.
7288
1.
3878
5.
0753
2.
2888
5.
5756
2.
0131
-0
.949
6 N
/A
-1.0
976
4.22
94
3.11
5 3.
6116
2.
8172
N
/A
5.99
79
CEC
6.85
42
7.75
46
3.83
64
4.06
52
3.94
84
2.09
86
3.68
96
3.60
88
0.57
27
3.64
99
4.39
96
1.53
65
6.01
55
2.22
12
6.36
57
1.90
67
-0.9
13
N/A
-1
.616
1 4.
9618
3.
2502
4.
3017
3.
0946
N
/A
6.46
77
Uni
mic
ro C
8 H
PLC
6.86
34
7.81
04
3.81
15
4.09
09
4.11
8 2.
4349
3.
7421
3.
5924
0.
434
3.60
33
4.37
73
1.44
93
5.59
09
2.18
19
6.39
09
1.89
58
-1.0
928
N/A
-1
.785
2 4.
9962
3.
2379
4.
2957
3.
0572
N
/A
6.44
94
CEC
6.12
51
6.83
85
2.59
97
2.86
41
3.28
12
1.09
09
2.59
82
2.50
52
-0.6
775
2.54
78
3.35
22
0.28
06
4.82
39
1.00
19
5.06
92
0.76
94
-1.9
089
N/A
-2
.513
2 4.
035
2.09
93
3.29
24
1.87
47
N/A
5.
461
Uni
mic
ro C
18
HPL
C 6.
2938
7.
0644
2.
6063
2.
9729
3.
2747
1.
362
2.66
73
2.54
16
-0.5
647
2.56
75
3.39
84
0.38
47
4.93
06
1.06
6 5.
2663
0.
8925
-1
.998
8 N
/A
-2.6
003
4.10
2 2.
121
3.32
56
1.91
4 N
/A
6.03
03
CEC
6.40
09
7.32
78
4.14
11
4.31
5 3.
7131
2.
8712
3.
5546
3.
1648
0.
264
3.15
17
3.83
96
1.14
57
5.37
76
2.29
26
5.66
2 1.
6479
-1
.174
5 N
/A
-1.6
597
4.39
66
3.35
69
3.79
65
2.76
94
N/A
6.
2742
log
k w
Sphe
risor
b C8
H
PLC
6.85
24
7.98
65
4.66
3 4.
1665
4.
4597
2.
1452
3.
8838
3.
3855
0.
567
3.25
08
3.93
58
1.53
05
5.68
67
2.60
05
6.01
37
1.97
49
-1.2
51
N/A
-1
.686
7 4.
642
3.15
46
4.00
61
2.71
84
N/A
6.
2177
Ana
lyte
n-H
exyl
benz
ene
1,3,5
-Trii
sopr
opyl
benz
ene
1,4-D
initr
oben
zene
3-
Trif
luor
omet
hylp
heno
l 3,
5-D
ichl
orop
heno
l 4-
Cyan
ophe
nol
4-Io
doph
enol
An
isole
Be
nzam
ide
Benz
ene
Chlo
robe
nzen
e Cy
cloh
exan
one
Dib
enzo
thio
phen
e Ph
enol
H
exac
hlor
obut
adie
ne
Inda
zole
Ca
ffein
e 4-
Nitr
oben
zoic
aci
d n-
Met
hyl-2
- pyr
rolid
inon
e N
apht
hale
ne
4-Ch
loro
phen
ol
Tolu
ene
Benz
onitr
ile
Benz
oic
acid
1,3
-Diis
opro
pylb
enze
ne
No.
1 2 3 4 5 6 7 8 9 10
11
12
13
14
15
16
17
18
19
20
21
22
23
24
25
Tabl
e 6.
3 (c
ontin
ued)

- 140 - Chapter 6
Plot of Component Weights
Component 1
Com
pone
nt 2
SpheriODSCEC
SpheriODSHPLC
0.19 0.21 0.23 0.25 0.27-0.14
0.06
0.26
0.46
0.66
0.86
HypC8CEC UniC8CEC
Plot of Component Weights
Component 1
Com
pone
nt 2
HypC18CEC
HypC18HPLC
HypC8HPLC HypPhenCEC
HypPhenHPLC
SpheriC8CEC
SpheriC8HPLC
UniC18CEC
UniC18HPLC
UniC8HPLC
UniPhenCEC
UniPhenHPLC
266 266.3 266.6 266.9 267.2 267.5 267.8(x 0.001)
-0.35
-0.15
0.05
0.25
0.45
0.65
UniC8CEC
HypC8CEC
Figure 6.1 Plot of first two component weights resulting from principal component analysis of log kw
data determined in a) all the separation systems studied b) with Spherisorb ODS stationary
phases excluded. SpheriODS=Spherisorb ODS, SpheriC8=Spherisorb C8,
HypC18=Hypersil C18, HypC8=Hypersil C8, HypPhen=Hypersil Phenyl,
UniC18=Unimicro C18, UniC8=Unimicro C8, UniPhen=Unimicro Phenyl; symbols CEC
and HPLC after the name of the column indicate performed under CEC conditions or
HPLC conditions, respectively.
Results of QSRR analysis of retention data for test series of solutes are collected in Tables
6.4-6.6.
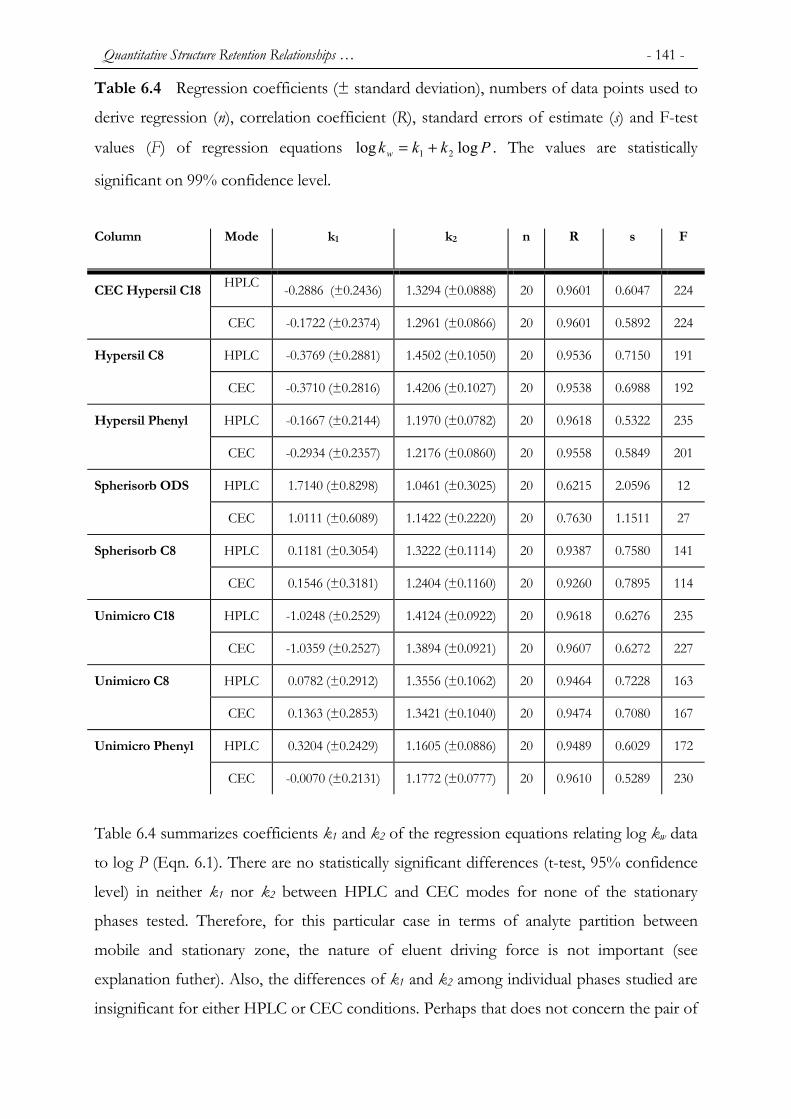
Quantitative Structure Retention Relationships … - 141 -
Table 6.4 Regression coefficients (± standard deviation), numbers of data points used to
derive regression (n), correlation coefficient (R), standard errors of estimate (s) and F-test
values (F) of regression equations Pkkkw loglog 21 += . The values are statistically
significant on 99% confidence level.
Column Mode k1 k2 n R s F
HPLC -0.2886 (±0.2436) 1.3294 (±0.0888) 20 0.9601 0.6047 224 CEC Hypersil C18
CEC -0.1722 (±0.2374) 1.2961 (±0.0866) 20 0.9601 0.5892 224
HPLC -0.3769 (±0.2881) 1.4502 (±0.1050) 20 0.9536 0.7150 191 Hypersil C8
CEC -0.3710 (±0.2816) 1.4206 (±0.1027) 20 0.9538 0.6988 192
HPLC -0.1667 (±0.2144) 1.1970 (±0.0782) 20 0.9618 0.5322 235 Hypersil Phenyl
CEC -0.2934 (±0.2357) 1.2176 (±0.0860) 20 0.9558 0.5849 201
HPLC 1.7140 (±0.8298) 1.0461 (±0.3025) 20 0.6215 2.0596 12 Spherisorb ODS
CEC 1.0111 (±0.6089) 1.1422 (±0.2220) 20 0.7630 1.1511 27
HPLC 0.1181 (±0.3054) 1.3222 (±0.1114) 20 0.9387 0.7580 141 Spherisorb C8
CEC 0.1546 (±0.3181) 1.2404 (±0.1160) 20 0.9260 0.7895 114
HPLC -1.0248 (±0.2529) 1.4124 (±0.0922) 20 0.9618 0.6276 235 Unimicro C18
CEC -1.0359 (±0.2527) 1.3894 (±0.0921) 20 0.9607 0.6272 227
HPLC 0.0782 (±0.2912) 1.3556 (±0.1062) 20 0.9464 0.7228 163 Unimicro C8
CEC 0.1363 (±0.2853) 1.3421 (±0.1040) 20 0.9474 0.7080 167
HPLC 0.3204 (±0.2429) 1.1605 (±0.0886) 20 0.9489 0.6029 172 Unimicro Phenyl
CEC -0.0070 (±0.2131) 1.1772 (±0.0777) 20 0.9610 0.5289 230
Table 6.4 summarizes coefficients k1 and k2 of the regression equations relating log kw data
to log P (Eqn. 6.1). There are no statistically significant differences (t-test, 95% confidence
level) in neither k1 nor k2 between HPLC and CEC modes for none of the stationary
phases tested. Therefore, for this particular case in terms of analyte partition between
mobile and stationary zone, the nature of eluent driving force is not important (see
explanation futher). Also, the differences of k1 and k2 among individual phases studied are
insignificant for either HPLC or CEC conditions. Perhaps that does not concern the pair of

- 142 - Chapter 6 phases: Hypersil C8 and Spherisorb ODS. An evidently lower regression coefficient k2 at
log P term in Eqn. 6.1, observed for Spherisorb ODS, indicates a lower lipophilicity of that
phase which may arise from the specific properties of the silica substrate.
The observed similarity of partition properties of the stationary phases studied is not
surprising because all of them are modern bonded-silica reversed-phase materials designed
to maximally reduce specific, hard to control contributions to retention. It can be
concluded that the log P parameter of analytes is not sensitive enough to clearly distinguish
possible differences in retention properties of modern materials.
Lipophilicity (or hydrophobicity) parameters, like log P, are complex net measures of
various intermolecular interactions between analyte, on one hand, and components of a
given partition system, on the other hand. Two main types of intermolecular interactions
are distinguished as governing both slow-equilibrium and chromatographic separations:
non-specific ones, i.e., molecular-bulkiness-related, dispersive, London’s interactions and
structurally specific, polar interactions including dipole-dipole, dipole-induced dipole,
hydrogen bonding and electron pair donor-electron pair acceptor interactions [19].

Quantitative Structure Retention Relationships … - 143 -
Table 6.5 Regression coefficients (± standard deviation), numbers of data points used
to derive regression (n), correlation coefficient (R), standard errors of estimate (s) and F-
test values (F) of regression equations SASkkkkkw'4
2'3min
'2
'1log +++= µδ . The values are
significant on 99% confidence level; the values (-) are statistically not significant on 99%
confidence level.
Column Mode '1k
'2k
'3k
'4k n R s F
HPLC -0.5592
(±1.1657)
8.3868
(±2.5836)
-0.2273
(±0.0471)
0.0209
(±0.0034)
22 0.9388 0.8691 47 CEC Hypersil C18
CEC -0.2529
(±1.1329)
8.1938
(±2.5108)
-0.2252
(±0.0458)
0.0198
(±0.0033)
22 0.9389 0.8497 47
HPLC 0.1180
(±1.3471)
8.3014
(±2.9857)
-0.2717
(±0.0544)
0.0198
(±0.0039)
22 0.9293 1.0045 40 Hypersil C8
CEC 0.1451
(±1.3015)
8.2231
(±2.8846)
-0.2653
(±0.0526)
0.0194
(±0.0038)
22 0.9307 0.9705 41
HPLC -0.6564
(±1.1067)
6.6522
(±2.4528)
-0.2135
(±0.0447)
0.0190
(±0.0032)
22 0.9325 0.8252 42 Hypersil Phenyl
CEC -0.1301
(±1.1256)
7.3085
(±2.4947)
-0.2163
(±0.0455)
0.0176
(±0.0033)
22 0.9298 0.8393 40
HPLC 5.5476
(±0.5476)
- -0.3160
(±0.0886)
- 22 0.6144 2.0510 13 Spherisorb ODS
CEC 5.1352
(±0.4690)
- -0.3205
(±0.0758)
- 22 0.6779 1.7566 18
HPLC -0.5645
(±1.3180)
- -0.3378
(±0.0460)
0.0172
(±0.0040)
22 0.9084 1.0316 47 Spherisorb C8
CEC 0.4576
(±1.3565)
6.6421
(±3.0065)
-0.2417
(±0.0548)
0.0172
(±0.0039)
22 0.9072 1.0115 29
HPLC -0.8682
(±1,2422)
9.0435
(±2.7532)
-0.2461
(±0.0502)
0.0209
(±0.0036)
22 0.9374 0.9262 46 Unimicro C18
CEC -0.6761
(±1.1792)
8.7647
(±2.6134)
-0.2456
(±0.0476)
0.0198
(±0.0034)
22 0.9403 0.8792 48
HPLC 0.7885
(±1.2607)
8.7656
(±2.7941)
-0.2459
(±0.0509)
0.0184
(±0.0035)
22 0.9284 0.9400 41 Unimicro C8
CEC 0.6595
(±1.2235)
8.1854
(±2.7118)
-0.2485
(±0.0494)
0.0184
(±0.0035)
22 0.9325 0.9123 42
HPLC 0.4209
(±1.1894)
6.8211
(±2.6361)
-0.2102
(±0.0481)
0.0169
(±0.0034)
22 0.9169 0.8869 33 Unimicro Phenyl
CEC -0.3641
(±1.0831)
6.8911
(±2.4005)
-0.2076
(±0.0438)
0.0186
(±0.0031)
22 0.9332 0.8076 43

- 144 - Chapter 6 Unlike the rather crude analyte property descriptor, log P, in Eqn. 6.1, in QSRR equations
of the form of Eqns. 6.2 and 6.3, the terms are present which should account for
differences in specific intermolecular interactions if such were to manifest themselves in
CEC with respect to HPLC or among the individual stationary phases operated in a given
separation mode. Table 6.5 summarizes parameters characterizing QSRR equations
describing log kw in terms of structural descriptors of analytes that are easily acquired by
standard computational chemistry programs (Eqn. 6.2). Again, for none of the eight
stationary phases under study any statistically significant difference in regression coefficients
k k1'
4'− (t-test, 95% confidence level) was found between the HPLC and the CEC modes.
On the other hand, when comparing respective QSRR equations for individual stationary
phase materials one can distinguish Spherisorb C18 (both in HPLC and CEC mode). In
QSRR equations in Table 6.5 for Spherisorb C18 the terms related to the highest electron
excess on an atom in analyte molecule, δmin, and to a water accessible van der Waals surface,
SAS, are insignificant. Instead, significant are the square of the total dipole moment, µ2,
and the free term k1’ which is very large.

Quantitative Structure Retention Relationships … - 145 -
Table 6.6 Regression coefficients (± standard deviation), numbers of data points used to
derive regression (n), correlation coefficient (R), standard errors of estimate (s) and F-test
values (F) of regression equations xHHH
w VkkkkRkkk ''62
''52
''42
''32
''2
''1log +++++= βαπ . The
values are significant on 99% confidence level, the values (-) are statistically not significant
on 99% confidence level.
Column Mode ''1k
''4k ''
5k ''6k n R s F
HPLC 0.9181 (±0.3237)
-1.2948 (±0.2504)
-5.8859 (±0.2536)
4.1017 (±0.2243)
22 0.9792 0.3640 298 CEC Hypersil C18
CEC 1.15623 (±0.2840)
-1.3581 (±0.2197)
-5.7990 (±0.2225)
3.89315 (±0.2243)
22 0.9831 0.3194 368
HPLC 1.5178 (±0.3423)
-1.5598 (±0.2648)
-6.6188 (±0.2681)
3.9963 (±0.2703)
22 0.9799 0.3849 309 Hypersil C8
CEC 1.5081 (±0.3458)
-1.5662 (±0.2675)
-6.4638 (±0.2709)
3.8934 (±0.2731)
22 0.9785 0.3889 289
HPLC 0.6970 (±0.2769)
-0.9110 (±0.2142)
-5.2908 (±0.2169)
3.8519 (±0.2187)
22 0.9814 0.3114 335 Hypersil Phenyl
CEC 1.1717 (±0.2877)
-1.3617 (±0.2226)
-5.4672 (±0.2254)
3.4641 (±0.2272)
22 0.9799 0.3235 309
HPLC 6.3256 (±0.4942)
- -6.3134 (±1.1162)
- 22 0.6037 1.6364 32 Spherisorb ODS
CEC 2.9499 (±0.8434)
-- -6.0670 (±0.7376)
2.6854 (±0.7248)
22 0.8050 0.6920 41
HPLC 1.5344 (±0.4041)
-1.0892 (±0.3126)
-6.0795 (±0.3166)
3.8866 (±0.3191)
22 0.9678 0.4544 190 Spherisorb C8
CEC 1.5686 (±0.4287)
-0.9786 (±0.3316)
-5.8186 (±0.3358)
3.5986 (±0.3385)
22 0.9598 0.4821 151
HPLC 0.6178 (±0.2806)
-1.5986 (±0.2171)
-6.3602 (±0.2198)
4.0938 (±0.2216)
22 0.9859 0.3156 444 Unimicro C18
CEC 0.7257 (±0.2881)
-1.6406 (±0.2229)
-6.2226 (±0.2257)
3.8737 (±0.2275)
22 0.9843 0.3240 396
HPLC 1.9426 (±0.3179)
-1.4767 (±0.2459)
-6.2899 (±0.2490)
3.6846 (±0.2510)
22 0.9804 0.3575 317 Unimicro C8
CEC 1.9832 (±0.3126)
-1.6537 (±0.2418)
-6.1486 (±0.2449)
3.6645 (±0.2468)
22 0.9807 0.3515 321
HPLC 1.4823 (±0.2669)
-0.8489 (±0.2065)
-5.3637 (±0.2091)
3.4852 (±0.2107)
22
0.9818 0.3001 341 Unimicro Phenyl
CEC 0.9686 (±0.2620)
-1.0362 (±0.2026)
-5.2434 (±0.2052)
3.7126 (±0.2068)
22 0.9828 0.2946 363
Table 6.6 summarizes statistical parameters of QSRR equations based an analyte descriptors
from linear solvation energy relationship theory (Eqn. 6.3). With the series of test analytes

- 146 - Chapter 6 employed, the LSER-based analyte descriptors R2 and π2 appeared insignificant in case of
each stationary phase and the separation mode studied.
QSRR equations based on LSER descriptors also do not prove actual difference in
molecular mechanism of separation between the two modes compared, i.e., between HPLC
and CEC. There are no statistically significant differences (t-test, 95% confidence level)
between the k4'' , k5
'' and k6" coefficients in HPLC and CEC. The lack of the significance of
term corresponding to McGowan volume, Vx, in QSRR for Spherisorb C18 operated at
HPLC conditions, whereas it is significant at CEC conditions, may not be conclusive.
Furthermore, there has been no explanation found on low correlation coefficient for this particular
stationary phase for all three QSRR methods. On the other hand, there seems to be a systematic
trend in coefficients collected in Table 6.6 when comparing analogous QSRR equations for HPLC
and CEC. Namely, k6" and k5
" (negative sign) tend to be higher whereas k4" (negative sign)
tends to be lower in case of CEC. Physical meaning of that observation, if any, may better
be checked if data given in Table 6.6 will be related to those Table 6.5. That can be done
because the QSRR equations of general form Eqns. 6.2 and 6.3 are mutually related. If one
compares the ordering of separation systems on the plot of k6" in Eqn. 6.3 vs. k4
" in Eqn.
6.2 (Figure 6.2), i.e., according to the regression coefficients at the volume of the analyte
(Vx) and at its van der Waals surface area that is accessible to water (SAS), one will notice a
clear trend. Namely, the higher coefficients stand at the C18 compared to the C8 stationary
phases. It is rational because the C18 phases have a larger surface area of the hydrocarbon
ligand that is accessible to the analyte. The same phases under CEC conditions have lower
values of both k6'' and k4
' coefficients than under HPLC conditions. That finding seems to
be reasonable in view of a previous study report by Jiskra et al. [31]. Those authors
suggested that generating electroosmotic flow on the stationary phase under CEC
conditions causes reordering of hydrocarbon chains of the ligand. That reordering may lead
to a decrease of the overall contact of the solute with the hydrocarbonaceous stationary
phase. Euerby et al. [34] used the CEC Hypersil C18, Hypersil C8 and Hypersil Phenyl for
separation of barbiturates. The authors observed increase in retention on the Hypersil C8
stationary phase compared to the CEC Hypersil C18 stationary phase under CEC
conditions while only minimum increase has been observed under HPLC conditions [35].
However, the separation order remained the same. This confirms further findings of this
group [e.g. 36] and others [e.g. 37-38]. Wen et al. [39] found linear relationship between

Quantitative Structure Retention Relationships … - 147 -
kHPLC and kCEC for neutral small molecules on the Spherisorb ODS (300 Å) and Zorbax
ODS (80 and 300 Å). However, the slope of this relationship differed from one (namely
1.12). In this paper, the authors further focused on the Van Deemter parameters A (eddy
diffusion term) and C (mass transfer resistance). It has been found that the value of both
parameters was by a factor of two to four lower in HPLC compared to CEC due to the
peculiarities of the EOF flow profile in the interstitial space and the generation of
intraparticle EOF inside the porous particles of the column packing.
3.4
3.5
3.6
3.7
3.8
3.9
4
4.1
4.2
0.015 0.016 0.017 0.018 0.019 0.02 0.021 0.022 0.023
k4'
k 6''
CEC Hypersil C18-HPLC
CEC Hypersil C18-CEC
Hypersil C8-HPLC
Hypersil C8-CEC
Hypersil Phenyl-HPLC
Hypersil Phenyl-CEC
Spherisorb C8-HPLC
Shperisorb C8-CEC
Unimicro C18-HPLC
Unimicro C18-CEC
Unimicro C8-HPLC
Unimicro C8-CEC
Unimicro Phenyl-HPLC
Unimicro Phenyl-CEC
Stationary phases with most developed surface
Stationary phases with least developed surface
Spherisorb C8
Spherisorb C8 CEC Hypersil C18 (CEC) + Unimicro C18 (CEC)
CEC Hypersil C18 (HPLC) + Unimicro C18 (HPLC)
Unimicro C8 (HPLC + CEC)
Hypersil C8 (HPLC + CEC)
Figure 6.2 Ordering of stationary phases according to their non-specific retentivity due to dispersion
interaction characterized by the coefficient ''6k for the Vx variable in Eq. 6.4 and the
coefficient '4k for the SAS variable in Eq. 6.3.
Coefficients k5" in Eqn. 6.3 and k3
' in Eqn.6.2 (Tables 6.5 and 6.6), may both be related to
the amount and activity of free silanol groups which are accessible to analytes. That would
explain a correlation between the coefficients (Fig. 6.3). Similarly as in Fig. 6.2, the
stationary phases having a less negative value are the phases with higher amount/activity of
free silanols (therefore, these phases compete more effectively for analytes with strongly
polar eluents). Typically, the phenyl stationary phases show higher silanol activity whereas
the C8 and C18 phases lower values. The exception is CEC Hypersil C18 stationary phase

- 148 - Chapter 6 under both CEC and HPLC conditions. This is not surprising, as this particular stationary
phase has been designed for use in CEC as possessing higher amount of free silanols. The
outliers are Spherisorb C18, Spherisorb C8 and Unimicro Phenyl stationary phases. In
general, there is a trend that the stationary phases exhibit a higher silanol activity under
CEC conditions (open symbols) than under HPLC conditions. That confirms previous
reports [31-33].
-6,8
-6,6
-6,4
-6,2
-6
-5,8
-5,6
-5,4
-5,2
-5-0,35 -0,33 -0,31 -0,29 -0,27 -0,25 -0,23 -0,21 -0,19 -0,17 -0,15
k3'
k 5''
CEC Hypersil C18-HPLCCEC Hypersil C18-CECHypersil C8-HPLC
Hypersil C8-CEC
Hypersil Phenyl-HPLCHypersil Phenyl-CEC
Spherisorb ODS-HPLCSpherisorb ODS-CECSpherisorb C8-HPLC
Spherisorb C8-CEC
Unimicro C18-HPLC
Unimicro C18-CEC
Unimicro C8-HPLC
Unimicro C8-CEC
Unimicro Phenyl-HPLCUnimicro Phenyl-CEC
Phenyl stationary phases
CEC –C18 stationary phase
C8 + C18 stationary phases
Outliers
Figure 6.3 Ordering of stationary phases according to their hydrogen-bond donor activity
characterized by the coefficient ''5k for the H
2β variable in Eq. 6.4 and the coefficient '3k for
the 2µ variable in Eq. 6.3.
Figure 6.4 depicts a plot of stationary phase hydrogen-bond basicity, k5" in Table 6.6, under
CEC conditions vs. that under HPLC conditions. Ideal line (tag α = 1) and the regression
line for all the stationary phases are given. Similarly as in Fig. 6.3 one can see separate
clusters of the phenyl, the C8 (except Hypersil C8) and the C18 stationary phases. Except
the Hypersil Phenyl stationary phase, all the other stationary phases find themselves above
the ideal line. In other words, under CEC conditions most of the tested stationary phases
exhibit a higher activity of free silanols that at HPLC conditions. In the linear CEC-HPLC
relationship the intercept is statistically different from zero according to the t-test value.

Quantitative Structure Retention Relationships … - 149 -
That means that the activity of free silanol groups under CEC conditions is different from
that under HPLC conditions.
-7
-6,8
-6,6
-6,4
-6,2
-6
-5,8
-5,6
-5,4
-5,2
-5
-7 -6,8 -6,6 -6,4 -6,2 -6 -5,8 -5,6 -5,4 -5,2 -5
HPLC
CEC
Hypersil C8
Unimicro C18
Unimicro C8
Spherisorb C18
Spherisorb C8Hypersil C8
Unimicro Phenyl
Hypersil Phenyl
Hydrogen bond basicityy=-1.16+0.78xConfidence interval for the slope:L1,2=0.78±0.19Test of the intercept:t=1.16/0.59=1.95 > tcritical
CEC=HPLC, tg αααα
= 1
Figure 6.4
Plot of regression coefficients at the hydrogen-bond basicity variable ( H2β ) in QSRR
equations derived for HPLC and CEC modes. Error bars and the ideal line tag α = 1 are
given. The critical t-value is a value corresponding to 90% confidence level.
In the same way as for hydrogen-bond basicity one can test regression coefficients at the
hydrogen-bond acidity parameters of analytes, k4" in Table 6.6 (Fig. 6.5). That term
describes the ability of an analyte to donate a proton to form a solute-solvent and/or
solute-stationary phase hydrogen bond. In Fig. 6.5 the majority of stationary phases are
below the ideal line of tag α = 1. The exception is the Spherisorb C8 stationary phase. The
Spherisorb C18 stationary phase could not be included in the plot because for this phase
the values of the coefficient of the solute hydrogen-bond acidity were not statistically
significant. The clustering of stationary phases (especially C8 and C18) is not that evident as
in the case of the coefficients of the solute hydrogen-bond basicity. The intercept in Fig. 6.5
differs significantly from zero implying differences in behaviour under HPLC and CEC
conditions.

- 150 - Chapter 6
-1,9
-1,7
-1,5
-1,3
-1,1
-0,9
-0,7
-1,9 -1,7 -1,5 -1,3 -1,1 -0,9 -0,7
HPLC
CEC
Unimicro C18
Unimicro C8
Hypersil C8
Hypersil C18 Hypersil Phenyl
Unimicro Phenyl
Spherisorb C8
Hydrogen bond acidityy=-0.52+0.69xConfidence interval for the slope:L1,2=0.69±0.38Test of the intercept:t=0.52/0.25=2.08 > tcritical
CEC=HPLC, tg αααα
= 1
Figure 6.5
Plot of regression coefficients at the hydrogen-bond acidity variable ( H2α ) in QSRR
equations derived for HPLC and CEC modes. Error bars and the ideal line tag α = 1 are
given. The critical t-value is a value corresponding to 90% confidence level.
Positive values of the coefficient of the McGowan parameter of analytes, k6" in Table 6.6,
means that the dispersive interactions of the analyte with the hydrocarbonaceous stationary
phase are stronger than analogous interactions with the mobile phase. This explains the
higher values of k6'' observed for the C8 and C18 stationary phases than for the phenyl
stationary phases as the former phases contain more hydrocarbon ligand. When comparing
k6’’ values for the same phase under both HPLC and CEC mode one notes that, with
exception of the Unimicro Phenyl stationary phase, the values obtained in HPLC are
generally higher than those found under CEC conditions.

Quantitative Structure Retention Relationships … - 151 -
3,2
3,4
3,6
3,8
4
4,2
4,4
3,2 3,4 3,6 3,8 4 4,2 4,4HPLC
CEC Unimicro C18Hypersil C8
Hypersil C18
Spherisorb C8
Hypersil Phenyl
Unimicro C8
Unimicro Phenyl
McGowan volumey=2.20+0.39xConfidence interval for the slope:L1,2=0.39±0.60Test of the intercept:t=2.20/1.17=1.88 < tcritical
CEC=HPLC, tg αααα
= 1
Figure 6.6 Plot of regression coefficients at the McGowan volume variable (Vx) in QSRR equations
derived for HPLC and CEC modes. Error bars and the ideal line tag α = 1 are given. The
critical t-value is a value corresponding to 90% confidence level.
It means that either dispersive interactions between analyte and the hydrocarbonaceous
phase are stronger under HPLC mode than under CEC mode or the interaction between
the analyte and the mobile phase is stronger under the applied electric field (CEC), or a
combination of both. As discussed in the previous paper [31], it may be that due to the
different orientation of hydrocarbonaceous chains under CEC conditions the interaction of
an analyte with the stationary phase is weaker than under HPLC conditions. The t-test
analysis demonstrated that t-value is lower than critical and the intercept in Fig. 6.6 is
therefore statistically not significantly different from zero.
6.4 Conclusions The QSRR models provide rational interpretation of differences and/or similarities in the molecular
mechanism of chromatographic separations between HPLC and CEC reversed-phase systems. The
models can be of help in objective comparison of separation properties of modern stationary
phases.

- 152 - Chapter 6 Three models of QSRR relating standardized retention parameters as obtained on eight
modern reversed-phase materials, demonstrated the lack of substantial differences in
molecular mechanism of separation which would depend on the nature of the eluent
driving force, i.e., high pressure in the HPLC mode or electroosmotic flow in the CEC
mode. Neither the partition coefficient of analytes, nor their molecular size or polarity
related structural descriptors from molecular modelling or from LSER theory clearly
distinguished separation patterns on the same phase at HPLC and CEC conditions.
Detailed comparative QSRR analysis supplied evidences of stronger non-specific dispersive
interactions attracting analytes to the hydrocarbonaceous stationary phase in the HPLC
mode as related to the CEC mode and a higher activity of free silanols under CEC
conditions with respect to HPLC. These differences do not manifest themselves strongly
enough to substantially change the mechanism of retention in the two modes, however. On
the other hand, these differences are significant enough to distinguish some reversed-phase
materials from the other.
In view of this work there is a rather limited chance that replacing high pressure with
electroosmotic force will result in a dramatic improvement of separations. There are
advantages of CEC over HPLC, like high peak capacity or different selectivity for complex
analytes. On the other hand, CEC implies rather sophisticated technical solutions.
Therefore, a question remains to be answered whether further development of CEC may
result in a cost/effectiveness ratio that will be acceptable from the point of view of practical
analytical applications.
REFERENCES 1. J.W. Jorgenson, K.D. Lukacs, J. Chromatogr., 218 (1981) 209.
2. M.M. Dittmann, K. Wienand, F. Bek, G.P. Rozing, LC-GC, 13 (1995) 800.
3. B. Behnke, E. Bayer, J. Chromatogr. A, 680 (1994) 93.
4. N.W. Smith, M.B. Evans, Chromatographia, 41 (1998) 197.
5. J.H. Knox, I.H. Grant, Chromatographia, 24 (1987) 135.
6. B.A. Grines, J.J. Meyers, A.I. Liapis, J. Chromatogr. A, 890 (2000) 61.
7. R. Stol, H. Poppe, W.Th. Kok, J. Chromatogr. A, 887 (2000) 199.
8. J. Ståhlberg, J. Chromatogr. A, 892 (2000) 291.
9. M.G. Cikalo, K.D. Bartle, P. Myers, Anal. Chem., 71 (1999) 1820.

Quantitative Structure Retention Relationships … - 153 -
10. K.D. Bartle, R.A. Carney, A. Cavazza, M. Cikalo, P. Myers, M.M. Robson, S.C.P.
Roulin, K. Sealey, J. Chromatogr. A, 892 (2000) 279.
11. S.J. Lane, R. Boughtflower, C. Paterson, M. Morris, Rapid Commun. Mass Spectr., 10
(1996) 733.
12. M.R. Euerby, C.M. Johnson, K.D. Bartle, P. Myers, S.C. Roulin, Anal. Commun., 33
(1996) 403.
13. K. Walhagen, K.K. Unger, M.T. Hearn, J. Chromatogr. A, 893 (2000) 401.
14. P. Huang, X. Jin, Y. Chen, J.R. Srinivasan, D.M. Lubman, Anal. Chem., 71 (1999)
1786.
15. J. Zhang, X. Huang, S. Zhang, Cs. Horváth, Anal. Chem., 72 (2000) 3022.
16. X. Huang, J. Zhang, Cs. Horváth, J. Chromatogr. A, 858 (1999) 91.
17. S.V. Galushko, Chromatographia, 36 (1993) 39.
18. S.V. Galushko, A.A. Kamenchuk, G.L. Pit, J. Chromatogr. A, 660 (1994) 47.
19. R. Kaliszan, Structure and Retention in Chromatography. A Chemometric Approach,
Harwood Academic Publishers, Amsterdam, 1997.
20. R. Kaliszan, Anal. Chem., 64 (1992) 619A.
21. P.C. Sadek, P.W. Carr, R.M. Doherty, M.J. Kamlet, R.W. Taft, M.H. Abraham, Anal.
Chem., 57 (1985) 2971.
22. P.W. Carr, Microchem. J., 48 (1993) 4.
23. P.W. Carr, R.M. Doherty, M.J. Kamlet, R.W. Taft, W. Melander, Cs. Horváth, Anal.
Chem., 58 (1986) 2674.
24. L.C. Tan, P.W. Carr, M.H. Abraham, J. Chromatogr. A, 752 (1996) 1.
25. M.H. Abraham, M. Ross, C.F. Poole, S.K. Poole, J. Phys. Org. Chem., 10 (1997) 358.
26. W. Wei, Y.M. Wang, G.A. Luo, R.J. Wang, Y.H. Guan, C. Yan, J. Liq. Chromatogr.
Relat. Technol., 21 (1998) 1433.
27. Z. Liu, H. Zou, M. Ye, J. Ni, Y. Zhang, J. Chromatogr. A, 863 (1999) 69.
28. Y. Zhang, W. Shi, L. Zhang, H. Zou, J. Chromatogr. A, 802 (1998) 59.
29. R. Kaliszan, M.A van Straten, M. Markuszewski, C.A. Cramers, H.A. Claessens, J.
Chromatogr. A, 855 (1999) 455.
30. L.C. Sander, S.A. Wise, Adv. Chromatogr., 25 (1986) 139.
31. J. Jiskra, M. Byelik, C.A. Cramers, H.A. Claessens, J. Chromatogr. A, 862 (1999) 121.
32. J. Jiskra, T. Jiang, H.A. Claessens, C.A. Cramers, J. Microcolumn Sep., 12 (2000) 530.
33. T. Eimer, K. Unger, J. van der Greef, TrAC, Trends Anal. Chem., 15 (1996) 463.
- 154 - Chapter 6 34. M.R. Euerby, C.M. Johnson, S.F. Smyth, N. Gillot, D.A. Barrett, P.N. Shaw, J.
Microcolumn Sep., 11 (1999) 305.
35. D.A. Barrett, V.A. Brown, P.N. Shaw, M.C. Davies, H.J. Ritchie, P.J. Ross, J.
Chromatogr. Sci., 34 (1996) 146.
36. M.R. Euerby, D. Gilligan, C.M. Johnson, S.C.P. Roulin, P. Myers, K.D. Bartle, J.
Microcolumn Sep., 9 (1997) 373.
37. M.M. Dittmann, G.P. Rozing, J. Microcolumn Sep., 9 (1997) 399.
38. F. Moffatt, P.A. Cooper, K.M. Jessop, J. Chromatogr. A, 855 (1999) 215.
39. E. Wen, R. Asiaie, Cs. Horváth, J. Chromatogr. A, 855 (1999) 349.
- 155 -
CHAPTER 7
7 THERMODYNAMIC BEHAVIOUR IN CAPILLARY
ELECTROCHROMATOGRAPHY
Summary
The thermodynamic behaviour of solutes was examined on four reversed-phase (RP)
stationary phases under pressure-driven (viz. high performance liquid chromatography,
HPLC) and electro-driven (viz. capillary electrochromatography, CEC) conditions.
Thermodynamic constants as standard enthalpy, entropy and Gibbs free energy were
compared for both separation modes. Differences and/or similarities observed were used
as a tool in better understanding of the separation mechanism in CEC compared to HPLC.
In addition, temperature effects on the magnitude of electroosmotic flow (EOF) are
explained in detail.
7.1 Introduction Optimization of separation in both pressure-driven (viz. high-performance liquid
chromatography, HPLC) and electro-driven chromatography (viz. capillary
electrochromatography, CEC) is a challenging task. In HPLC and CEC, solvent (mobile
phase) strength programming (isocratic or gradient) is usually the best choice to arrive at
optimal separation condition because solvent programming offers large possibilities to
adjust selectivity, analysis time and efficiency [1]. Besides that, most of
This chapter has been accepted for publication in Journal of Separation Science.

- 156 - Chapter 7 HPLC and CEC separations, however, are also carried out at ambient or at constant
elevated temperatures. Wider use of temperature programming is restricted in practice by
the following reasons:
a) many samples e.g. biological samples do not allow analysis at higher temperatures
b) higher temperatures may negatively influence column lifetime.
The major effects of increasing temperature are decrease of retention times and improved
kinetics of the separation [2]. These advantages have also been introduced into CEC.
Jakubetz et al. [3] studied the influence of temperature on resolution and efficiency in
enantiomeric separation by open-tubular (OT) LC and CEC and found that the
temperature effects were less pronounced in OTLC compared to OTCEC. Thiam et al. [4]
applied elevated temperatures in the separation of cholesterol and its derivatives. Analysis
time could be reduced by 50% at 60ºC, however, the resolution deteriorated at
temperatures higher than 40ºC. Dabek-Zlotorzynska et al. [5] reached 45% reduction in
analysis time in the separation of carbonyl 2,4-dinitrophenylhydrazones in CEC using
higher temperature. Djordjevic et al. [6] investigated separations of mixtures of cortisones
and benzenes exhibiting a wide range of retention factor (0.41<k<11.65). Optimised
separation was performed using temperature programming from 25ºC to 60ºC with a rate
of 3ºC/min. Wolf et al. [7] investigated the resolution of enantiomers on brush-type chiral
stationary phases. They studied the dependence of retention factor on temperature. Lin et
al. [8] studied the temperature effects on chiral recognition of some amino acids with
molecular imprinted polymer as stationary phase. Higher temperatures for enantiomeric
separations by CEC using a macrocyclic antibiotic chiral stationary phase was employed
by group of Carter-Finch [9]. Extensive studies of temperature effects on the separation
of retinyl esters in non-aqueous CEC were performed by Roed et al. [10-12] on the
Hypersil ODS and home made C30 stationary phase. Recently from the same group,
Greibrokk and Andersen [13] summarized temperature programming in liquid
chromatography including electrochromatography.
In many chromatographic systems, a linear relationship (Van ‘t Hoff plots) is found
between logarithm of retention factor (k) and reciprocal value of (absolute) temperature
according to the following equation:
φlnln +∆+∆−=RS
RTHk
��
(7.1)
Thermodynamic Behaviour in CEC - 157 -
where �H∆ is the standard enthalpy of transfer of a solute from the mobile phase to the
stationary phase, �S∆ is the standard entropy of transfer of a solute from the mobile
phase to the stationary phase, φ is the phase ratio, R is the gas constant and T is the
absolute temperature. Discontinuities in linearity are typically caused by:
i) retention by a mixed mechanism
ii) change in solute conformation
iii) existence of more forms of the solute having different retention properties
iv) conformation changes in hydrocarbonaceous phase of the stationary phase [14]
Roulin et al. [15] studied Van ‘t Hoff plots for capsaicin and found above described linear
relationship. Wen et al. [16] extensively studied dynamics in capillary
electrochromatography and found linear Van ‘t Hoff plot for the Spherisorb ODS
column; electroosmotic flow (EOF) increased with temperature as a result of the decrease
of viscosity of the mobile phase. Cahours et al. [17] studied the performance of
benzodiazepines in CEC on phenyl silica stationary phases and also found linear
relationship as described by the Eqn. 7.1. Zhang et al. [18] studied rapid separation of
peptides and proteins by isocratic CEC at elevated temperatures and found linear
relationships of logarithm k vs. 1/T and velocity of EOF vs. 1/T. On the contrary,
Walhagen et al. [19] found discontinuation in the linear relationship of Van ‘t Hoff plot
between 30 and 40ºC by studying temperature influence on the behaviour of small
peptides (enkephalins) in CEC. These latter authors attribute the change to the
reorganization of n-octadecyl chains bonded to the silica surface. Furthermore, Walhagen
et al. also found a linear relationship of the velocity of EOF vs. T . Djordjevic et al. [20]
used thermodynamic data to compare retention mechanisms of neutral solutes between
CEC and HPLC. The authors found retention factors on the Hypersil C18 column to be
lower under CEC conditions than under HPLC conditions. Moreover, retention
enthalpies were also lower in CEC than in HPLC and in the CEC mode �G∆ (free energy
of transfer of a solute from the mobile phase to the stationary phase) values were positive
while in HPLC mode negative values were obtained. This shows that solute transfer from
the mobile phase to the stationary phase in CEC is less favourable than in HPLC. These
authors attribute these differences, in part, to the self-heating (Joule heating) which occurs
in electro-driven systems. Joule heating and influence of temperature on retention and
- 158 - Chapter 7 resolution in columns packed with a supercritical fluid carrier was also reviewed by
Robson et al. [21].
This study evaluates temperature effects on retention, standard enthalpy, entropy, Gibbs
energy and electroosmotic flow under pressure and electro-driven conditions on four
reversed-phase stationary phases. Findings in solute transfer differences help in deeper
understanding of molecular retention mechanism in pressure- and electro-driven
chromatography.
7.2 Experimental 7.2.1 Chemicals Acetonitrile (ACN) with HPLC grade purity was from Biosolve (Valkenswaard, the
Netherlands); tris(hydroxymethyl)aminomethane (Tris) and hydrochloric acid (fuming,
37%) of analytical purity was from Merck (Darmstadt, Germany). Thiourea, 4-cyanophenol
(4-hydroxybenzonitrile), caffeine, N,N-dimethylaniline, N-methyl-2-pyrrolidinone (1-
methylpyrrolidin-2-one), 4-iodophenol, hexachlorobutadiene, dibenzothiophene, n-
hexylbenzene, 1,3,5-triisopropylbenzene and naphthalene were obtained from recognized
laboratory chemicals suppliers. Samples were prepared by dissolving these compounds in
the mobile phase or in the pure organic modifier and then diluted with water. The mobile
phase was composed of 70% acetonitrile:30% aqueous Tris buffer, 5 mM total
concentration (V/V), filtered through a filter (pore size = 0.45 µm) and degassed by
ultrasonication before use.
7.2.2 Columns The columns used in this study are listed in Table 7.1 together with relevant data provided
by the manufacturer. The column packed bed was 25 cm, and 33.5 cm total length. Prior
to use in the CEC mode, the columns were conditioned. This was accomplished by
applying 10 bar pressure on both sides of the column and increasing the voltage from 0-
25 kV in 5 kV steps per 10 min. Next to that the pressure was increased to 12 bar and a
30 kV voltage was applied for 10 min.

Thermodynamic Behaviour in CEC - 159 -
Table 7.1 List of columns; each column diameter, 100 µm; average particle size, 3 µm;
note that the Unimicro columns contains 10% of pure silica to provide stable EOF [36]
Column Pore Size Pore Volume
Surface Area
Carbon Load
CEC Hypersil C18
130 Å 0.65 cm3/g 170 m2/g 8.5%
Hypersil C8
120 Å 0.65 cm3/g 170 m2/g 6.5%
Unimicro C18
Data not available
Unimicro C8
Data not available
For the micro-HPLC experiments, the columns were conditioned until the column pressure
was stabilized (approx. 1 h). Note that in these experiments the columns were tested under
pressure- and electro-driven conditions using the same batches of eluents. HPLC
experiments were adjusted to similar flow velocities as obtained in CEC. As a consequence
the HPLC experiments are not optimized with respect to plate height.
7.2.3 Instrumentation All CEC chromatograms were obtained on an Agilent Technologies 3DCE (Agilent
Technologies GmbH, Waldbronn, Germany) instrument equipped with a pressure facility
of up to 12 bar at the outlet and/or inlet vial. This pressurization option of the instrument
was used to prevent bubble formation in the capillaries. Samples were injected
electrokinetically (5 kV for 2-15 s). For each run a voltage of 20 kV (600 V.cm-1 electrical
field strength) was applied with 10-bar pressure on both ends of a capillary. The detection
wavelength was 210 nm. High voltage was applied as 6-s time ramp to avoid column stress.
The column cassette temperature was maintained at various temperatures from 7.5 to 60ºC.
Micro HPLC separations were carried out on a system consisting of a Phoenix 20 CU

- 160 - Chapter 7 syringe pump (Carlo Erba Instruments, Milan, Italy), a microUVIS20 ultraviolet/visible
absorbance detector (Carlo Erba Instruments, Milan, Italy) operating at 210 nm, and an
injector with a 200 nL loop (VICI-AG Valco Europe, Schenkon, Switzerland). The flow-
rate was approximately 0.2-0.3 µL/min using a 1/100-flow splitter (VICI-AG Valco
Europe, Schenkon, Switzerland). The column temperature was maintained at various
temperatures from 7.5 to 60ºC using a water bath (Thermo NESLAB, Portsmouth, NH).
7.2.4 Test procedure Columns were tested under both CEC and HPLC conditions using the same batch of
eluent and the sample mixture containing thiourea, caffeine, 4-cyanophenol, N-methyl-3-
pyrrolidinone, 4-iodophenol, N,N-dimethylaniline, naphthalene, dibenzothiophene,
hexachlorobutadiene, n-hexylbenzene and 1,3,5-triisopropylbenzene. The temperature of
the capillaries was controlled by air circulation (CEC experiments, 0.1ºC accuracy) and
water circulation (HPLC experiments, 0.1ºC accuracy). Please, note that the same portions
of the capillary have been controlled under both separation modes; here, 80% of the
packed section (with respect to the commercial instrumentation). The flow under HPLC
conditions was measured by a 10 µL syringe.

Thermodynamic Behaviour in CEC - 161 -
Table 7.2 Structural descriptors and constants of test analytes.
No. Solute M.W. log P pKa Vx SAS
1 4-Cyanophenol 119.12 1.60 7.97 0.930 290.61
2 Caffeine 194.19 -0.07 14.00 1.363 367.02
3 N-Methyl-2-pyrrolidinone 99.13 -0.38 - 0.820 270.53
4 N,N-Dimethylaniline 121.18 2.31 5.15 - -
5 4-Iodophenol 220.01 2.91 9.21 1.033 301.47
6 Naphthalene 128.18 3.30 - 1.085 313.25
7 Dibenzothiophene 184.26 4.38 - 1.379 364.54
8 Hexachlorobutadiene 260.76 4.78 - 1.321 352.14
9 n-Hexylbenzene 162.28 5.52 - 1.562 415.40
10 1,3,5-Triisopropylbenzene 204.36 6.36 - 1.985 478.27
M.W.=molecular weight (g/mol); log P = logarithm of n-octanol-water partition coefficient;
Vx = characteristic volume of McGowan; pKa=dissociation constant; SAS = solvent
(water)-accessible molecular surface area (in Å2). (-) – data not available
7.3 Results and discussion 7.3.1 Effect of temperature on the electroosmotic flow The relationship between the temperature and the velocity of the electroosmotic flow can
be described as follows [22]:
ηζεε Ev r
EOF0= (7.2)
while for a monovalent electrolyte the zeta potential (ζ) can be expressed by the following
equation:
21
202
=
cFRT
rεεσζ (7.3)
where vEOF is the velocity of the electroosmotic flow, σ the superficial excess charge
density, ε0 the permittivity of vacuum, εr the relative permittivity, R the gas constant, T the
absolute temperature, c the molar concentration, F the Faraday constant, E the electric field

- 162 - Chapter 7 strength and η the viscosity. The viscosity is also temperature dependent and can be
described by the equation [23]: 2
10log DTCTTBAL +++=η (7.4)
where A, B, C and D are constants and T is the absolute temperature. The temperature
effect on permittivity can be expressed by the following equation (abbreviated form) [24]: 2)( cTbTaTr ++=ε (7.5)
where a, b and c are constants for given temperature range and T is the absolute
temperature. Walhagen et al. [19] plotted the velocity of EOF against T and found a
linear relationship with regression coefficient up to 0.9988. The authors claim that decrease
in viscosity with increasing temperature has little effect on EOF compared to the impact of
temperature on zeta potential resulting in a linear relationship of the EOF value vs. T . It
is of interest to note that changes in temperature from 10 to 60ºC results in a change of
T from 16.83 to 18.25 (theoretical increase of veof by 8%) while viscosity (e.g. for ACN)
changes from 0.40 to 0.26 mPa.s (theoretical increase of veof by 54%) and relative
permittivity (e.g. for ACN) from 39.2 to 31.3 (theoretical decrease of veof by 11%). In this
particular case, the increase of veof was 60%; note that values of viscosity and relative
permittivity vary a lot for acetonitrile-water mixtures [e.g. 25]. Zhang et al. [18] and
Djordjevic et al. [6] found linear relationship for 1/T as a result of viscosity change. As can
be seen from Figures 7.1a), 7.1b) and 7.1c), electroosmotic flow dependence for the CEC
Hypersil C18 stationary phase is linearly related to both T (regression coefficient 0.9998),
1/T (regression coefficient 0.9994) as well as logarithm of the velocity of EOF against 1/T
(regression coefficient 0.9989); in fact also dependency of veof on T is linear (regression
coefficient of 0.9996; plot not shown). This is rather surprising considering the fact that the
dependency of the velocity of EOF on temperature is rather complicated (see Eqns. 7.2-
7.5).

Thermodynamic Behaviour in CEC - 163 -
Figure 7.1
Relationship of velocity of electroosmotic flow on a) T , b) 1/T, and c) the relationship of
logarithm of the velocity of electroosmotic flow on 1/T, where T is temperature in K.
Experimental conditions; mobile phase: 70% ACN/30% Tris buffer (5 mM as a total
concentration), column: CEC Hypersil C18, voltage: 20 kV, EOF marker: thiourea.
y = 0.433x - 6.2662
0.8
0.9
1
1.1
1.2
1.3
1.4
1.5
1.6
1.7
1.8
16.5 16.7 16.9 17.1 17.3 17.5 17.7 17.9 18.1 18.3 18.5
T1/2 (K)
vEO
F (
mm
/s)
a)
b)
y = -1152.3x + 5.083
0.5
0.7
0.9
1.1
1.3
1.5
1.7
1.9
0.0028 0.0029 0.003 0.0031 0.0032 0.0033 0.0034 0.0035 0.0036 0.0037
1/T (K-1)
vEO
F (m
m/s
)
c)
y = -901.65x + 3.2086
-0.1
0
0.1
0.2
0.3
0.4
0.5
0.6
0.0029 0.003 0.0031 0.0032 0.0033 0.0034 0.0035 0.0036 0.0037
1/T (K-1)
ln v
EOF

- 164 - Chapter 7 7.3.2 Van ‘t Hoff plots The proper understanding of retention mechanism in capillary electrochromatography is a
fundamental problem for this recently developed separation technique. At first, it is
believed that partitioning of neutral solutes on the reversed-phase CEC is identical or at
least very similar to reversed-phase HPLC. However, many articles have been published
revealing dissimilarities in retention [26-34]. Retention of neutral solutes (excluding
electrophoretic mobility from retention) in both HPLC and CEC is related to the
concentration of a solute in the stationary (s) and mobile (m) phase:
φKk = (7.6)
where K is a distribution coefficient characterizing portion (concentration, c) of a solute in
the mobile and stationary phase ( sm ccK = ) and φ is phase ratio ( ms VV ). Solute
concentration in each phase (K) is determined thermodynamically by the Gibbs (free)
energy of transfer of a solute from the mobile phase to the stationary phase:
KRTG ln−=∆ � (7.7) ��� STHG ∆−∆=∆ (7.8)
The combination of Eqns. 7.6, 7.7 and 7.8 leads to Eqn. 7.1. It is obvious that the study of
the thermodynamic behaviour ( �H∆ and �S∆ of solute transfer) is a very useful tool for a
deeper understanding of the retention mechanism (mechanism of solute interaction with
bonded stationary phase) in CEC and HPLC. As known from previous studies [26-27] and
other literature [28-34], retention behaviour of uncharged polar and non-polar compounds
may differ from that in HPLC. For the non-polar compound the retention on the same
column is lower under CEC conditions than under HPLC conditions. The reverse is true
for the polar compound. Furthermore, both slopes and intercepts (viz. �H∆ and �S∆ of
solute transfer) clearly differ for both compounds and both eluent-driven modes. Tables 7.3
a), b) summarize �H∆ and �S∆ values for all columns and compounds; correlations
coefficients of the relationship o ln k vs. 1/T are given, too; the phase ratio needed for �S∆
was calculated using flow measurements and capillary parameters. The values, varying from
0.327 for the Hypersil C8 columns to 0.404 for the Hypersil C18 column, are in agreement
with other literature values [34].

Thermodynamic Behaviour in CEC - 165 -
Figure 7.2
Relationship between ln k and reciprocal temperature for a) dibenzothiophene on the CEC
Hypersil C18 stationary phase and b) N-methyl-2-pyrrolidinone on the Hypersil C8
stationary phase. Experimental conditions: see text.
ln k= 902.07/T - 2.4482
ln k = 1050.2/T - 3.0023
-0.1
0.1
0.3
0.5
0.7
0.9
0.0029 0.003 0.0031 0.0032 0.0033 0.0034 0.0035 0.0036
1/T (K-1)
ln k
CEC
HPLC
a)
b)
ln k= 612.28/T - 3.4233
ln k= 653.41/T - 3.4945
-2
-1.9
-1.8
-1.7
-1.6
-1.5
-1.4
-1.3
-1.2
-1.1
-1
0.0029 0.003 0.0031 0.0032 0.0033 0.0034 0.0035 0.0036
1/T (K-1)
ln k
CEC
HPLC
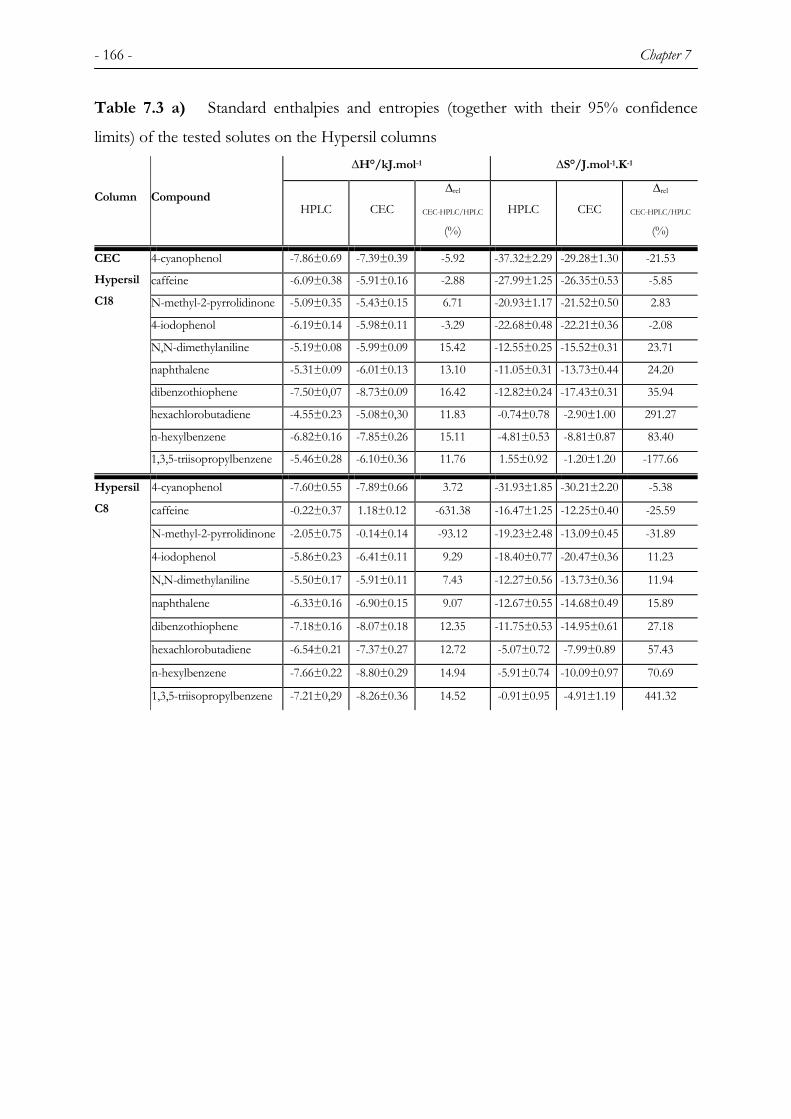
- 166 - Chapter 7 Table 7.3 a) Standard enthalpies and entropies (together with their 95% confidence
limits) of the tested solutes on the Hypersil columns ∆H°/kJ.mol-1 ∆S°/J.mol-1.K-1
Column Compound HPLC CEC
∆rel
CEC-HPLC/HPLC
(%)
HPLC CEC
∆rel
CEC-HPLC/HPLC
(%)
4-cyanophenol -7.86±0.69 -7.39±0.39 -5.92 -37.32±2.29 -29.28±1.30 -21.53
caffeine -6.09±0.38 -5.91±0.16 -2.88 -27.99±1.25 -26.35±0.53 -5.85
N-methyl-2-pyrrolidinone -5.09±0.35 -5.43±0.15 6.71 -20.93±1.17 -21.52±0.50 2.83
4-iodophenol -6.19±0.14 -5.98±0.11 -3.29 -22.68±0.48 -22.21±0.36 -2.08
N,N-dimethylaniline -5.19±0.08 -5.99±0.09 15.42 -12.55±0.25 -15.52±0.31 23.71
naphthalene -5.31±0.09 -6.01±0.13 13.10 -11.05±0.31 -13.73±0.44 24.20
dibenzothiophene -7.50±0,07 -8.73±0.09 16.42 -12.82±0.24 -17.43±0.31 35.94
hexachlorobutadiene -4.55±0.23 -5.08±0,30 11.83 -0.74±0.78 -2.90±1.00 291.27
n-hexylbenzene -6.82±0.16 -7.85±0.26 15.11 -4.81±0.53 -8.81±0.87 83.40
CEC Hypersil C18
1,3,5-triisopropylbenzene -5.46±0.28 -6.10±0.36 11.76 1.55±0.92 -1.20±1.20 -177.66
4-cyanophenol -7.60±0.55 -7.89±0.66 3.72 -31.93±1.85 -30.21±2.20 -5.38
caffeine -0.22±0.37 1.18±0.12 -631.38 -16.47±1.25 -12.25±0.40 -25.59
N-methyl-2-pyrrolidinone -2.05±0.75 -0.14±0.14 -93.12 -19.23±2.48 -13.09±0.45 -31.89
4-iodophenol -5.86±0.23 -6.41±0.11 9.29 -18.40±0.77 -20.47±0.36 11.23
N,N-dimethylaniline -5.50±0.17 -5.91±0.11 7.43 -12.27±0.56 -13.73±0.36 11.94
naphthalene -6.33±0.16 -6.90±0.15 9.07 -12.67±0.55 -14.68±0.49 15.89
dibenzothiophene -7.18±0.16 -8.07±0.18 12.35 -11.75±0.53 -14.95±0.61 27.18
hexachlorobutadiene -6.54±0.21 -7.37±0.27 12.72 -5.07±0.72 -7.99±0.89 57.43
n-hexylbenzene -7.66±0.22 -8.80±0.29 14.94 -5.91±0.74 -10.09±0.97 70.69
Hypersil C8
1,3,5-triisopropylbenzene -7.21±0,29 -8.26±0.36 14.52 -0.91±0.95 -4.91±1.19 441.32

Thermodynamic Behaviour in CEC - 167 -
Table 7.3 b) Standard enthalpies and entropies (together with their 95% confidence
limits) of the tested solutes on the Unimicro columns ∆H°/kJ.mol-1 ∆S°/J.mol-1.K-1
Column Compound HPLC CEC
∆rel
CEC-HPLC/HPLC
(%)
HPLC CEC
∆rel
CEC-HPLC/HPLC
(%)
4-cyanophenol - -15.34±2.15 - -61.09±7.19 -
caffeine - -2.08±0.23 - - -25.25±0.77 -
N-methyl-2-pyrrolidinone - 0.41±0.84 - - 13.85±19.90 -
4-iodophenol -8.65±1.04 -5.86±0.11 -32.31 -39.67±3.49 -26.92±0.38 -32.14
N,N-dimethylaniline -4.51±0.24 -5.01±0.06 11.16 -17.35±0.82 -17.72±0.20 2.14
naphthalene -5.04±0.14 -5.44±0.06 7.87 -16.36±0.48 -16.74±0.20 2.38
dibenzothiophene -8.17±0.22 -8.60±0.05 5.35 -20.67±0.72 -22.01±0.19 6.46
hexachlorobutadiene -3.91±0.22 -4.43±0.23 13.25 -3.32±0.74 -4.50±0.77 35.54
n-hexylbenzene -7.44±0.11 -7.82±0.14 5.09 -10.84±0.36 -12.30±0.46 13.40
Unimicro C18
1,3,5-triisopropylbenzene -5.32±0,24 -6.09±0.33 14.62 -1.62±0.81 -4.31±1.10 166.73
4-cyanophenol - -4.67±0.66 - - -19.45±2.19 -
caffeine -5.00±0.69 -0.06±0.21 -98.74 -24.19±2.29 -10.59±0.69 -56.23
N-methyl-2-pyrrolidinone -3.05±1.05 -1.81±0.14 -40.74 -13.06±3.51 -12.14±0.48 -7.07
4-iodophenol -4.34±0.63 -4.88±0.11 12.56 -11.43±2.11 -14.75±0.36 29.03
N,N-dimethylaniline -4.37±0.37 -4.78±0.11 9.43 -6.81±1.40 -9.09±0.38 33.40
naphthalene -4.85±0.39 -5.29±0.13 8.99 -8.09±1.28 -8.86±0.43 9.63
dibenzothiophene -5.57±0.33 -6.08±0.16 9.13 -5.89±1.11 -8.34±0.53 41.58
hexachlorobutadiene -5.17±0.35 -5.54±0.22 7.18 -0.37±1.15 -2.00±0.74 440.00
n-hexylbenzene -5.97±0.34 -6.54±0.25 9.57 -0.73±1.11 -3.18±0.82 338.09
Unimicro C8
1,3,5-triisopropylbenzene -5.71±0.39 -6.03±0.31 5.53 3.55±1.28 1.85±1.04 -47.78
Obviously, substantial differences in �H∆ and �S∆ values are observed. Analyzing data for
non-polar compounds, it can be calculated that �H∆ in CEC has always a more negative
value compared to HPLC. It means that differences in bonding energy between solute-
stationary phase and solute-mobile phase are greater under CEC conditions. The difference
between HPLC and CEC modes in terms of �H∆ for tested compounds fluctuate from
5.09% for n-hexylbenzene on the Unimicro C18 columns up to 16.42% for
dibenzothiophene on the CEC Hypersil C18 column. Clearly, from Fig. 7.2a) lower
retention of these compounds under CEC conditions and higher negative value of standard
enthalpy causes higher differences of retention at higher temperatures than at lower
temperatures. The situation is different for polar compounds. N,N-Dimethylaniline

- 168 - Chapter 7 typically follows retention trends of non-polar compounds as known from HPLC [35].
Other polar compounds tested reveal higher values of �H∆ under CEC conditions with the
exception of 4-cyanophenol on the Hypersil C8 columns, 4-iodophenol on the Hypersil C8
and the Unimicro C8 column and N-methyl-2-pyrolidinone on the CEC Hypersil C18
column. Caffeine on the Hypersil C8 column and N-methyl-2-pyrrolidinone on the
Unimicro C18 column have positive values of standard enthalpy of transfer under CEC
condition. Apparently, their bonding energy with the mobile phase is stronger than with the
stationary phase. There is a clear correlation of the �H∆ values of caffeine and N-methyl-2-
pyrrolidinone to their negative log P (partition coefficient between n-octanol and water)
values (Table 7.2). Other factors such as entropy contributes to the retention of theses
solutes on reversed-phase stationary phases. It is also interesting to analyze �S∆ values.
Negative values of �S∆ means that a solute is more ordered on the stationary phase than in
the mobile phase. In CEC (Tables 7.3a) and b)), with the exception of some polar
compounds, most of the �S∆ values are more negative compared with HPLC. This can be
explained by two assumptions:
1) origin of the electroosmotic flow on the silica support increases ordering of the
hydrocarbonaceous chains of the stationary phase and thus increases ordering of the
solutes on the stationary phase
2) mobile phase structure (uniformity) gets more organized under applied electric field
and thus more disturbed by solute cavity.
The second assumption explains the higher �S∆ values in CEC for polar compounds as
they can easier penetrate into the mobile phase structure with e.g. hydrogen bonds.
Increased organization of hydrocarbonaceous chains on the stationary phase also confirms
more negative values of enthalpy under CEC conditions and thus better contact of solutes
with the stationary phase. Interestingly, for 1,3,5-triisopropylbenzene the �S∆ values on the
Unimicro C8 column are positive for both HPLC and CEC. This indicates superior
ordering of the solute in the mobile phase than on the stationary phase. Comparing �H∆
and �S∆ (or T �S∆ as in Eqn. 7.6) values, we can see that �S∆ values play more important
role in retention of polar rather than non-polar compounds. The �G∆ values are
summarized in Table 7.4 and valid for the temperature of 293.15 K (20°C). The values
reveal that for the majority of solutes on the Hypersil C18, Hypersil C8 and Unimicro C8

Thermodynamic Behaviour in CEC - 169 -
stationary phases the solute transfer from the mobile phase to the stationary phase is
thermodynamically less favourable under CEC conditions that under HPLC conditions.
The exception is the Unimicro C18 column where this conclusion is valid only for two
most hydrophobic compounds (n-hexylbenzene and 1,3,5-triisopropylbenzene). This
finding is in agreement with finding of the group of Djordjevic et al. [20]. The explanation
can be found in differences of separation mechanism, which implicates that the overall
thermodynamic behaviour of compounds is dependent of the type of eluent driven mode.
Table 7.4 Gibbs energy of transfer at 293.15 K.
∆G°/kJ.mol-1 (at 293.15 K)
Column
CEC Hypersil
C18 Hypersil C8 Unimicro C18 Unimicro C8
Compound
HPLC CEC HPLC CEC HPLC CEC HPLC CEC
4-cyanophenol 3.08 1.19 1.76 0.97 - 2.57 - 1.03
caffeine 2.11 1.81 4.61 4.77 - 5.32 2.10 3.04
N-methyl-2-pyrrolidinone 1.04 0.88 3.58 3.70 - 4.47 0.78 1.75
4-iodophenol 0.46 0.53 -0.47 -0.41 2.98 2.04 -0.99 -0.56
N,N-dimethylaniline -1.51 -1.44 -1.90 -1.88 0.58 0.19 -2.37 -2.12
naphthalene -2.07 -1.98 -2.61 -2.60 -0.25 -0.53 -2.48 -2.69
dibenzothiophene -3.74 -3.62 -3.73 -3.68 -2.11 -2.15 -3.84 -3.63
hexachlorobutadiene -4.33 -4.23 -5.05 -5.02 -2.94 -3.11 -5.06 -4.95
n-hexylbenzene -5.41 -5.26 -5.92 -5.84 -4.26 -4.21 -5.76 -5.61
1,3,5-triisopropylbenzene -5.91 -5.74 -6.94 -6.82 -4.84 -4.83 -6.75 -6.57
7.4 Conclusions Thermodynamic studies in capillary electrochromatography reveal that thermodynamic
constants of solutes obtained under CEC conditions significantly differ from those
obtained under HPLC conditions. Results on temperature dependence of electroosmotic
flow do not confirm that Joule heating causes differences in thermodynamic behaviour of
solutes in electrochromatographic systems. As a consequence, structural changes within the

- 170 - Chapter 7 stationary phase and the mobile phase such as increased organization of
hydrocarbonaceous chains on the stationary phase and increased mobile phase structure are
the most probable influence in CEC. Moreover, there exist statistically significant
dissimilarities in thermodynamic behaviour between polar and non-polar solutes when
compared under both eluent-driven modes. The results show that for the enthalpy values,
non-polar compounds show more negative values under CEC conditions rather than under
HPLC conditions. The reverse is true for polar compounds with the exception of 4-
cyanophenol on the Hypersil C8 columns, 4-iodophenol on the Hypersil C8 and the
Unimicro C8 column and N-methyl-2-pyrolidinone on the CEC Hypersil C18 column.
Similarly, increased organization of the stationary phase possibly causes better organization
of non-polar solutes in the stationary phase under CEC conditions (more negative values of
entropy) than under HPLC conditions. While for polar compounds higher organization
structure of the mobile phase increases organization of the solutes in the mobile phase
under CEC conditions. Based on these findings, we conclude that for neutral, uncharged
solutes the retention mechanism under electro-driven conditions statistically significant
differ from the retention mechanism under pressure-driven conditions.
REFERENCES
1. L.R. Snyder, J.W Dolan, Chem. Anal. (Warsaw), 43 (1998) 495.
2. J.H. Knox, Chromatographia, 26 (1988) 329.
3. H. Jakubetz, H. Czesla, V. Schurig, J. Microcolumn Sep., 11 (1999) 421.
4. S. Thiam, S.A. Shamsi, C.W. Henry III, J.W. Robinson, I.M. Warner, Anal. Chem., 72
(2000) 2541.
5. E. Dabek-Zlotorzynska, E.P.C. Lai, J. Chromatogr. A, 853 (1999) 487.
6. N.M. Djordjevic, F. Fitzpatrick, F. Houdiere, G. Lerch, G. Rozing, J. Chromatogr. A,
887 (2000) 245.
7. C. Wolf, P.L. Spence, W.H. Pirkle, D.M. Cavender, E.M. Derrico, Electrophoresis, 21
(2000) 917.
8. J.-M. Lin, T. Nakagama, K. Uchiyama, T. Hobo, Biomed. Chromatogr., 11 (1997) 298.
9. A.S. Carter-Finch, N.W. Smith, J. Chromatogr. A, 848 (1999) 375.
10. L. Roed, E. Lundanes, T. Greibrokk, J. Microcolumn Sep., 11 (1999) 421.
11. L. Roed, E. Lundanes, T. Greibrokk, J. Microcolumn Sep., 12 (2000) 561.

Thermodynamic Behaviour in CEC - 171 -
12. L. Roed, E. Lundanes, T. Greibrokk, J. Sep. Sci., 24 (2001) 435.
13. T. Greibrokk, T. Andersen, J. Sep. Sci., 24 (2001) 899.
14. R.K. Gilpin, P. Kasturi, J. Microcolumn Sep., 12 (2000) 236.
15. S.P. Roulin, K.D. Bartle, P. Myers, M.R. Euerby, unpublished results.
16. E. Wen, R. Asiaie, Cs. Horváth, J. Chromatogr. A, 855 (1999) 349.
17. X. Cahours, Ph. Morin, M. Dreux, J. Chromatogr. A, 845 (1999) 203.
18. S. Zhang, J. Zhang, Cs. Horváth, J. Chromatogr. A, 914 (2001) 189.
19. K. Walhagen, K.K. Unger, M.T.W Hearn, J. Chromatogr. A, 893 (2000) 401.
20. N.M. Djordjevic, P.W.J. Fowler, F. Houdiere, G. Lerch, J. Liq. Chromatogr. Relat.
Technol., 21 (1998) 2219.
21. M.M Robson, S. Roulin, S.M. Shariff, M.W. Raynor, K.D. Bartle, A.A. Clifford, P.
Myers, M.R. Euerby, C.M. Johnson, Chromatographia, 43 (1996) 313.
22. M.M. Dittmann, K. Wienand, F. Bek, G.P. Rozing, LC-GC, 13 (1995) 800.
23. C.L. Yaws, Handbook of Viscosity, Gulf Publishing Company, Houston, Texas, 1995.
24. D.L. Ride, CRC Handbook of Chemistry and Physics, 82nd Edition, CRC Press, Boca
Raton, 2001.
25. C. Moreau, G. Douhéret, Thermochim. Acta, 13 (1975) 385.
26. J. Jiskra, M. Byelik, C.A. Cramers, H.A. Claessens, J. Chromatogr. A, 862 (1999) 121.
27. J. Jiskra, T. Jiang, H.A. Claessens, C.A. Cramers, J. Microcolumn Sep., 12 (2000) 530.
28. T. Eimer, K. Unger, J. van der Greef, TrAC, Trends Anal. Chem., 15 (1996) 463.
29. J.P.C. Vissers, H.A. Claessens, P. Coufal, J. High Resolut. Chromatogr., 18 (1995) 540.
30. N. Ishizuka, H. Minakuchi, K. Nakanishi, N. Soga, H. Nagayama, K. Hosoya, N.
Tanaka, Anal. Chem., 72 (2000) 1275.
31. W. Wei, Y.M. Wang, G.A. Luo, R.J. Wang, Y.H. Guan, C. Yan, J. Liq. Chromatogr.
Relat. Technol., 21 (1998) 1433.
32. C. Chaiyasut, T. Tsuda, S. Kitagawa, H. Walda, T. Monde, Y. Nakabeya, J.
Microcolumn Sep., 11 (1999) 590.
33. T. Jiang, J. Jiskra, H.A. Claessens, C.A. Cramers, J. Chromatogr. A 923 (2000) 215.
34. L.C. Sander, L.R. Field, Anal. Chem., 52 (1980) 2009.
35. S.J. Schmitz, R. Zwanziger, H. Engelhardt, J. Chromatogr., 544 (1991) 381.
36. M.T. Dulay, C. Yan, D.J. Rakestraw, R.N. Zare, J. Chromatogr. A, 725 (1996) 361.

- 172 - Chapter 7
- 173 -
CHAPTER 8 8 METHOD DEVELOPMENT FOR THE SEPARATION OF
STEROIDS BY CAPILLARY
ELECTROCHROMATOGRAPHY
Summary
A rapid capillary electrochromatography (CEC) method was developed to separate five
structurally related steroid compounds from the production line of steroid hormones. The
separation was performed on a Hypersil C8 MOS and Unimicro C18 stationary phases
using acetonitrile (ACN), methanol (MeOH) and tetrahydrofuran (THF) as organic
modifiers and tris(hydroxymethyl)aminomethane (Tris) as buffer additive. The Hypersil
C8 MOS stationary phases performed best together with ACN as organic modifier and
Tris buffer. The method was extensively tested on ruggedness with respect of sensitivity
to temperature, ACN composition, pH change, concentration of Tris buffer, injected plug
length and run-to-run and day-to-day repeatability. The minimal detectable concentration
and amount were investigated for quantification purposes. The developed CEC method
was shown to be fast, rugged and well suited for quantification of the steroids under
study.
This chapter has been accepted for publication in Journal of Separation Science.
8.1 Introduction Steroids are compounds possessing the skeleton of cyclopenta[a]phenanthrene or a
skeleton therefrom by one or more bond scissions or ring expansion or contraction [1].
Steroids play an important role in human life – cholesterol is one of the main components

- 174 - Chapter 8 of cell membranes; testosterone, progesterone, cortisole, estradiol are important steroid
hormones, cholic acids assure absorption of fats e.g. during digestion; vitamin D is
important for proper body formation; many synthetic steroids found their use in
medicine. Capillary electrochromatography (CEC) as a separation technique offers high
efficient, fast and very often baseline separations in pharmaceutical analysis such as the
analyses of steroids also providing high peak capacity. Steroids are in many cases neutral,
lipophilic or very lipophilic compounds whereas the high-performance liquid
chromatography (HPLC) protocols may be easily transferred to CEC.
Thiam et al. [2] employed CEC in separation of cholesterol and its ester derivatives. The
effects of acid modifier, buffer concentration, mobile phase composition, applied voltage,
temperature and pseudostationary phase were thoroughly studied. Stead et al. [3], Seifar et
al. [4,5] studied the CEC analyses of endogenous steroids such as testosterone and
progesterone; Que et al. [6] used a macroporous acrylic monolithic stationary phase for
isocratic and gradient analysis of endogenous steroids and their derivatives in CEC with
laser-induced fluorescence (LIF) and electrospray ionization (ESI) mass spectrometry
(MS) detection; Taylor et al. [7] showed application of CEC in the analysis of
corticosteroids. Wang et al. [8] applied CEC in the analysis of norgestimate and its
potential degradation products and reached detection limits as low as 0.01% for
degradation impurities. Lord et al. [9] investigated the use of tapered and narrow restrictor
capillaries for use in CEC and demonstrated their use in on-line CEC-MS separation of
steroids such as bufalin and digitoxigenin. Euerby et al. [10-12] extensively studied use of
CEC in pharmaceutical analysis e.g. analysis of tipredane and related substances or
analysis of tipredane and its C-17 diastereoisomer or very fast analysis of three
pharmaceutically active steroids using short-end injection technique. Smith et al. [13] used
CEC for the separation of Fluticasone propionate from a steroid test mixture.
This article deals with the development of a method and the establishment of the
protocol for the separation of five closely related pharmaceutically active steroids by
capillary electrochromatography.

Method Development for the Separation … - 175 -
8.2 Experimental 8.2.1 Chemicals Acetonitrile (ACN), methanol (MeOH) and tetrahydrofuran (THF) with HPLC grade
purity were obtained from Biosolve (Valkenswaard, the Netherlands);
tris(hydroxymethyl)aminomethane (Tris) and hydrochloric acid (37% w/w) of analytical
purity were purchased from Merck (Darmstadt, Germany). Steroid samples were kindly
supplied by Organon (Oss, the Netherlands). The stock concentration of the steroids was 1
mg/mL of the mobile phase, for the limit of detection the concentration range varied from
1 mg/mL down to 0.01 mg/mL of the mobile phase. Structures of the steroids are depicted
in Figure 8.1. The mobile phases were composed of different amounts of ACN, MeOH or
THF and buffered with Tris buffer (5 mmol.L-1) at pH 8.0. Tris concentration and pH were
varied during the validation procedure. All mobile phases were filtered through a filter (pore
size = 0.45 µm) and degassed by ultrasonication before use. As an EOF marker (t0),
thiourea (Sigma-Aldrich, Steinheim, Germany) has been used in concentration of 1 mg/mL
in water.

- 176 - Chapter 8
O
H H
OH
OH
H HO
H H
OH
H
O
H H
OH
H HO
OO
H
H
OH
O
H H
OH
H H
#1 = Org 38585 #2 = Org 41423
#3 = Org 2761 #4 = Org 34517
#5 = Org 41634 Figure 8.1 Structures of the tested steroids.
8.2.2 Columns Two columns were chosen for the investigation: a Unimicro C18 (Unimicro Technologies,
Pleasanton, CA), column dimensions: 100 µm I.D. × 40 cm total length (31.5 cm effective)
and a Hypersil MOS C8 (Thermo Hypersil-Keystone, Runcorn, UK), column dimensions:
100 µm I.D. 33.5 cm total length (25 cm effective). All columns were conditioned by
mobile phase using a syringe pump and then in the CEC mode by applying 10 bar pressure
on both sides of the column and increasing the voltage from 0-25 kV in 5 kV steps per 10
min.

Method Development for the Separation … - 177 -
8.2.3 Instrumentation All CEC chromatograms were obtained on an Agilent Technologies 3DCE (Agilent
Technologies GmbH, Waldbronn, Germany) instrument equipped with a pressure facility
of up to 12 bar at the outlet and/or inlet vial. This pressurization option of the instrument
was used to prevent bubble formation in the capillaries. Samples were injected
electrokinetically (5 kV for 2-15 s). For each run a voltage of 20 kV was applied with 10-bar
pressure on both ends of the capillary. The detection wavelength was 210 nm. High voltage
was applied as 6-s time ramp to avoid column stress. The column cassette temperature was
maintained at 20ºC.
8.2.4 Prediction software Based on the relationship between CEC and HPLC, Chromsword® HPLC optimization
software (Merck GmbH, Darmstadt, Germany) was employed for preliminary experiments
to estimate starting CEC conditions. This program software contains a set of stationary
phases tested in acetonitrile (ACN) and methanolic (MeOH) mobile phases and also allows
drawing a structure of analytes to be tested. The program further calculates certain
structural parameters such as molecular volume and predicts the best separation on the set
of the columns or on a specific one. The result on the closest possible stationary phase, the
Hypersil C18 stationary phase, using 70% aqueous acetonitrile as mobile phase can be seen
on Figure 8.2.
#1
#2
#3 #4 #5
Figure 8.2 Simulated chromatogram of the tested steroids on the Hypersil ODS stationary phase using
ChromSword® software, mobile phase: acetonitrile/water 70/30 (V/V).

- 178 - Chapter 8 Table 8.1 Steroid parameters generated by Chromsword® software.
Steroid Parameter
#1 #2 #3 #4 #5
Molecular volume (cm3.mol-1)
220.5 209.4 231.2 320.3 299.50
Molecular surface (cm2.mol-1)
176.5 170.5 182.2 226.4 216.5
Molecular mass (g.mol-1)
324.42 310.39 310.44 430.54 388.55
∆G (kJ.mol-1) -205.0 -179.6 -147.9 -189.6 -171.6
The data of the steroids calculated by Chromsword® are summarized in Table 8.1. The
prediction accuracy of this program is limited [14], however, it remains a useful tool that
safes time in method development.
8.3 Results and discussion 8.3.1 Preliminary experiments Two columns were chosen for CEC experiments – the Unimicro C18 stationary phase and
the Hypersil C8 MOS stationary phase – and mobile phase containing 70% acetonitrile and
30% Tris buffer (5 mmol.L-1 as total concentration). The initial chromatograms are shown
in Figure 8.3. The Unimicro C18 stationary phase offered similar selectivity as the Hypersil
C8 MOS stationary phase, however, the latter one exhibits higher silanol activity providing
a higher and more stable electroosmotic flow (EOF). Therefore, the Hypersil C8 MOS was
further used in the method development.

Method Development for the Separation … - 179 -
-5
10
25
40
55
0 2 4 6 8 10 12 14 16 18 20Time (min)
Resp
onse
(m
AU)
t0
O
H H
OH
OH
H H
O
H H
OH
H H
O
H H
OH
H H1
2
3
1
2
3
Conditions:70 / 30 ACN / 5 mM Tris
column: Unimicro C18
length: 40 cm
Voltage: 25 kV
O
H H
OH
H
O
OO
H
H
OH
-5
10
25
40
55
0 2 4 6 8 10Time (min)
Resp
onse
(m
AU
)
t0
O
H H
OH
OH
H H
O
H H
OH
H H
O
H H
OH
H H
1
2
31
2
3
Conditions:70 / 30 ACN / 5 mM Tris
column: Hypersil C8 MOS
length: 25 cm
Voltage: 20 kV
O
H H
OH
H
O
OO
H
H
OHB)
A)
Figure 8.3 CEC chromatograms of tested steroids on A) the Unimicro C18 stationary phase, B) the
Hypersil C8 MOS stationary phase using 70% ACN/5mM Tris buffer (V/V) as the mobile
phase.
8.3.2 Selectivities
The selectivity (as separation factor α) and overall separation performance on the
Hypersil C8 MOS stationary phase was compared for three organic modifiers –
acetonitrile, methanol and tetrahydrofuran. The starting mobile phase used contained
30% Tris buffer and 70% ACN or isoeluotropic amount of other organic modifiers
resulting in the same solvent strength {86% MeOH (V/V) or 50% THF (V/V) in the
mobile phase} as shown in Figures 8.4 A and B.

- 180 - Chapter 8
-2
13
28
0 2 4 6 8 10 12 14 16Time (min)
Resp
onse
(m
AU)
t0
O
H H
OH
OH
H H
O
H H
OH
H H
O
H H
OH
H H
1
2
3
1
2
3
Conditions:86 / 14 MeOH / 5 mM Tris
column: Hypersil C8 MOS
length: 25 cm
Voltage: 20 kV
O
H H
OH
H
O
OO
H
H
OH
-3
12
27
42
57
0 5 10 15 20 25 30Time (min)
Resp
onse
(m
AU)
t0
O
H H
OH
OH
H H
O
H H
OH
H H
O
H H
OH
H H
1
2
1
2
Conditions:50 / 50 THF / 5 mM Tris
column: Hypersil C8 MOS
length: 25 cm
Voltage: 20 kV
O
H H
OH
H
O
OO
H
H
OH
A)
B)
Figure 8.4 CEC chromatograms of tested steroids on the Hypersil C8 MOS stationary phase using
A) 86% MeOH/5 mM Tris buffer (V/V), B) 50% THF/5 mM Tris buffer (V/V) as the
mobile phase
Table 8.2 summarizes retention factors and selectivity data. It is well known that
acetonitrile containing mobile phases exhibit higher ratio of ε/η where ε is the
permittivity and η the solvent viscosity. This ratio influences electroosmotic flow in the
electrodriven system according to the following equation:
ηεζEvEOF = (8.1)
where ε is the permittivity, ζ the zeta potential, E the electric field strength and η the
solvent viscosity. It is obvious that the separation of the steroids is faster in mobile phases
containing acetonitrile.

Method Development for the Separation … - 181 -
Table 8.2 Retention factors of tested steroids in different mobile phases with the same
solvent strength on the Hypersil C8 MOS stationary phase.
Steroid
#1 #2 #3 #4 #5
Organic modifier
t0
min
k α k α k α k α k α
ACN (70%)
3.8 0.11 - 0.43 3.91 0.52 1.21 0.72 1.38 1.50 2.08
MeOH (86%)
8.7 0.05 - 0.20 4.00 0.24 1.20 0.35 1.46 0.60 1.71
THF (50%)
11.9 0.30 - 0.60 2.00 0.67 1.12 0.84 1.25 1.63 1.94
k=retention factor; α=separation factor
The separation time for ACN-containing phase is about 10 min, however, under the same
conditions the separation time is about 15 min for the MeOH-containing mobile phase and
32 min for THF-containing mobile phase (Table 8.2). The separation performance was
further compared for 3 concentrations of acetonitrile in the mobile phase (60, 70 and 80%,
Table 8.3). The electroosmotic flow decreases with decreasing portion of ACN in the
mobile phase. Even greater effects are seen with respect of the retention factor (k). The
retention factor of steroid #5 increases from 0.73 at 80% ACN to 3.09 at 60% ACN. The
retention and selectivity data are summarized in Table 8.3.

- 182 - Chapter 8 Table 8.3 Retention factors (k) of tested steroids in different ACN-compositions of
mobile phase on the Hypersil C8 MOS stationary phase.
Steroid
#1 #2 #3 #4 #5
ACN composition
t0
min
k α k α k α k α k α
60% 4.6 0.20 - 0.74 3.70 0.89 1.20 1.38 1.55 3.09 2.24
70% 3.8 0.11 - 0.43 3.91 0.52 1.21 0.72 1.38 1.50 2.08
80% 3.5 0.06 - 0.25 4.17 0.31 1.24 0.38 1.23 0.73 1.92
It was found that the separation time at 80% ACN is 7 min with complete baseline
resolution. Therefore, acetonitrile at a concentration of 80% was used in the subsequent
validation of the method.
8.3.3 Effect of acetonitrile composition Retention factors are influenced by the change of acetonitrile compositions according to
the linear or fairly linear dependence of retention factor on the concentration of organic
modifier in the mobile phase:
ϕSkk += 0lnln (8.2)
where k is the retention factor, k0 the retention factor extrapolated to 100% aqueous
mobile phase, S the slope of the dependence function and φ the volume fraction of organic
modifier in the mobile phase. From Figure 8.5A it can be calculated that a change of 1% in
the ACN-composition causes a change in retention of factor of up to 5%. The effect on the
plate number is smaller, overall change in concentration from 76% (V/V) to 80% (V/V) as
depicted in Figure 8.5B doesn’t cause significant changes in the plate number of the peaks,
a further increase causes a light drop in the plate number. In a similar way as retention
factors, also the resolution is affected by a change of acetonitrile composition. This
according to the following equation:
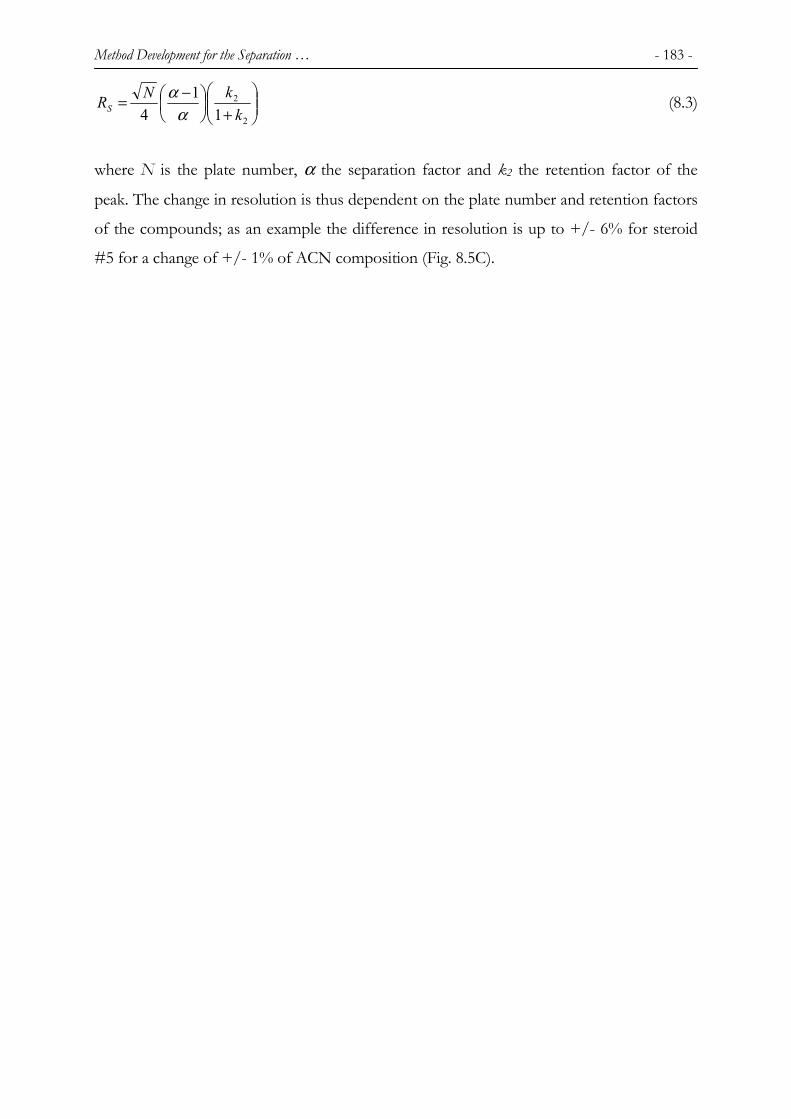
Method Development for the Separation … - 183 -
+
−=2
2
11
4 kkNRS α
α (8.3)
where N is the plate number, α the separation factor and k2 the retention factor of the
peak. The change in resolution is thus dependent on the plate number and retention factors
of the compounds; as an example the difference in resolution is up to +/- 6% for steroid
#5 for a change of +/- 1% of ACN composition (Fig. 8.5C).

- 184 - Chapter 8
ACN composition
-25-20-15-10-505
1015202530
74 76 78 80 82 84 86
ACN (%)
∆ k
(%)
#1#2#3#4#5
ACN composition
0
5000
10000
15000
20000
25000
30000
35000
40000
74 76 78 80 82 84 86
ACN (%)
Plat
e nu
mbe
r (pe
r col
umn)
#1#2#3#4#5
ACN composition
-40
-30
-20
-10
0
10
20
30
40
74 76 78 80 82 84 86
ACN (%)
∆ R
(%)
#1#2#3#4#5
A)
B)
C)
Figure 8.5 Influence of the ACN composition on A) retention factor (k), B) plate number (N) and C)
resolution of the tested steroids (R, calculated as resolution of steroid #n and steroid #n-1
or thiourea for steroid #1).

Method Development for the Separation … - 185 -
8.3.4 Effect of pH of Tris buffer It is well known that pH has a major influence on the electroosmotic flow in CEC. Here,
we focus on the retention parameters of the separation process. Fig. 8.6A shows influence
of pH on the change of retention factor. It is interesting to see that there’s small influence
of pH on retention factor of neutral compounds (up to 0.2% for steroid #5 by change of
pH by 0.1 unit). It has been discussed in previous articles [e.g. 15] that EOF originating on
the stationary phase may influence ordering of hydrocarbonaceous chains and therefore the
separation process. The influence of pH on plate number is minimal (Fig. 8.6B). However,
the resolution change by change of pH by 0.1 unit is remarkable, e.g. for steroid #3 is up to
4% (Fig. 8.6C); this due to added effects of plate number and retention factor differences
(see Eq. 8.3, and conclusions further).
8.3.5 Effect of Tris concentration A higher concentration of Tris buffer in the mobile phase decreases retention. It seems
that adsorption of Tris buffer as a low hydrophilic buffer decreases slightly
hydrophobicity of the stationary phase. The overall change in retention factor is up to 2%
for the change by 2 mM (Fig. 8.7A), for change by 1 mM from the starting conditions
(5 mM Tris) the change is from +0.4% to –1% for steroid #1. Other steroids show
similar behaviour. Also, with increasing concentration of Tris buffer the plate numbers
increase (Fig. 8.7B). This is in agreement with findings of other authors [e.g. 16].
Summarizing as an example, with an increase of Tris buffer concentration by 1 mM we
obtained a gain in resolution up to 13% for steroid #5 (Fig. 8.7C).

- 186 - Chapter 8
pH
-0,6
-0,4
-0,2
0
0,2
0,4
0,6
0,8
1
1,2
7,4 7,6 7,8 8 8,2 8,4 8,6
pH
∆ k
(%)
#1#2#3#4#5
pH
0
5000
10000
15000
20000
25000
30000
35000
40000
7,4 7,6 7,8 8 8,2 8,4 8,6
pH
Plat
e nu
mbe
r (pe
r col
umn)
#1#2#3#4#5
pH
-25
-20
-15
-10
-5
0
5
7,4 7,6 7,8 8 8,2 8,4 8,6
pH
∆R (%
)
#1#2#3#4#5
B)
A)
C)
Figure 8.6 Influence of pH of Tris buffer on A) retention factor (k), B) plate number (N) and C)
resolution of the tested steroids (R, calculated as resolution of steroid #n and steroid #n-1
or thiourea for steroid #1).

Method Development for the Separation … - 187 -
TRIS concentration
-2
-1,5
-1
-0,5
0
0,5
1
1,5
2
0 2 4 6 8
c(TRIS)/mM
∆ k
(%)
#1#2#3#4#5
TRIS concentration
05000
1000015000200002500030000350004000045000
0 2 4 6 8
c(TRIS)/mM
Palte
num
ber #1
#2#3#4#5
TRIS concentration
-20
-15
-10
-5
0
5
10
15
20
25
0 2 4 6 8
c(TRIS)/mM
∆ R
(%)
#1#2#3#4#5
B)
A)
C)
Figure 8.7 Influence of concentration of Tris buffer composition on A) retention factor (k), B) plate
number (N) and C) resolution of the tested steroids (R, calculated as resolution of steroid
#n and steroid #n-1 or thiourea for steroid #1).

- 188 - Chapter 8 8.3.6 Effect of temperature
Temperature has large effect on both, the chromatographic process and capillary
electrophoretic parameters. The influence on retention factor can be seen in Figure 8.8A.
Generally, the Agilent 3DCE instrument is able to maintain temperature of the cassette
within a range of +/- 0.1°C. Under these conditions, such fluctuation can cause changes up
to 0.15% in retention factor or a change in resolution of about 1%. However, the influence
on the plate number exhibits no specific trend within the temperature range tested (Fig.
8.8B).
8.3.7 Effect of injected plug width
Overall increase and/or decrease of retention factor was found up to 2%, caused by change
in injection time from 10 to 20 s or from 10 to 2.5 s, respectively (Fig. 8.9A). Steroid #1
with low retention exhibits changes up to 1.1% upon a change of 1 s from the starting
condition (injection time=10 s). There is no obvious influence of the plug length on plate
number as well as resolution of the steroids (Fig. 8.9B and C) within the investigated
injection range. Pyell et al. [17] investigated the influence of sample plug width on band
broadening in CEC in detail. According to the theory, the optimum injection time can be
calculated as 3.2 s for our conditions. Higher injection times negatively influence peak
broadening. However, we found no obvious influence of the plug length on the plate
number in the studied injection range. Resolution was affected up to +/- 2% when
changing the injection time by 1 s.

Method Development for the Separation … - 189 -
Temperature
-8
-6
-4
-2
0
2
4
6
8
10 15 20 25 30
Temperature (ºC)
? k
(%
)
#1#2#3#4#5
Temperature
05000
1000015000200002500030000350004000045000
10 15 20 25 30
Temperature (ºC)
Plat
e nu
mbe
r (pe
r col
umn)
#1#2#3#4#5
A)
B)
C) Temperature
-15
-10
-5
0
5
10
15
10 15 20 25 30
Temperature (ºC)
? R
(%)
#1#2#3#4#5
Figure 8.8
Influence of temperature on A) retention factor (k), B) plate number (N) and C) resolution
of the tested steroids (R, calculated as resolution of steroid #n and steroid #n-1 or thiourea
for steroid #1).

- 190 - Chapter 8
Plug length
-8
-6
-4
-2
0
2
4
6
0 5 10 15 20 25
Injection (s)
∆ k
(%)
#1#2#3#4#5
Plug length
0
5000
10000
15000
20000
25000
30000
35000
40000
0 5 10 15 20 25
Injection (s)
Plat
e nu
mbe
r (pe
r col
umn)
#1#2#3#4#5
B)
A)
C) Plug length
-20
-15
-10
-5
0
5
10
0 5 10 15 20 25
Injection (s)
∆ R
(%)
#1#2#3#4#5
Figure 8.9
Influence of injected plug legth on A) retention factor (k), B) plate number (N) and C)
resolution of the tested steroids (R, calculated as resolution of steroid #n and steroid #n-1
or thiourea for steroid #1).
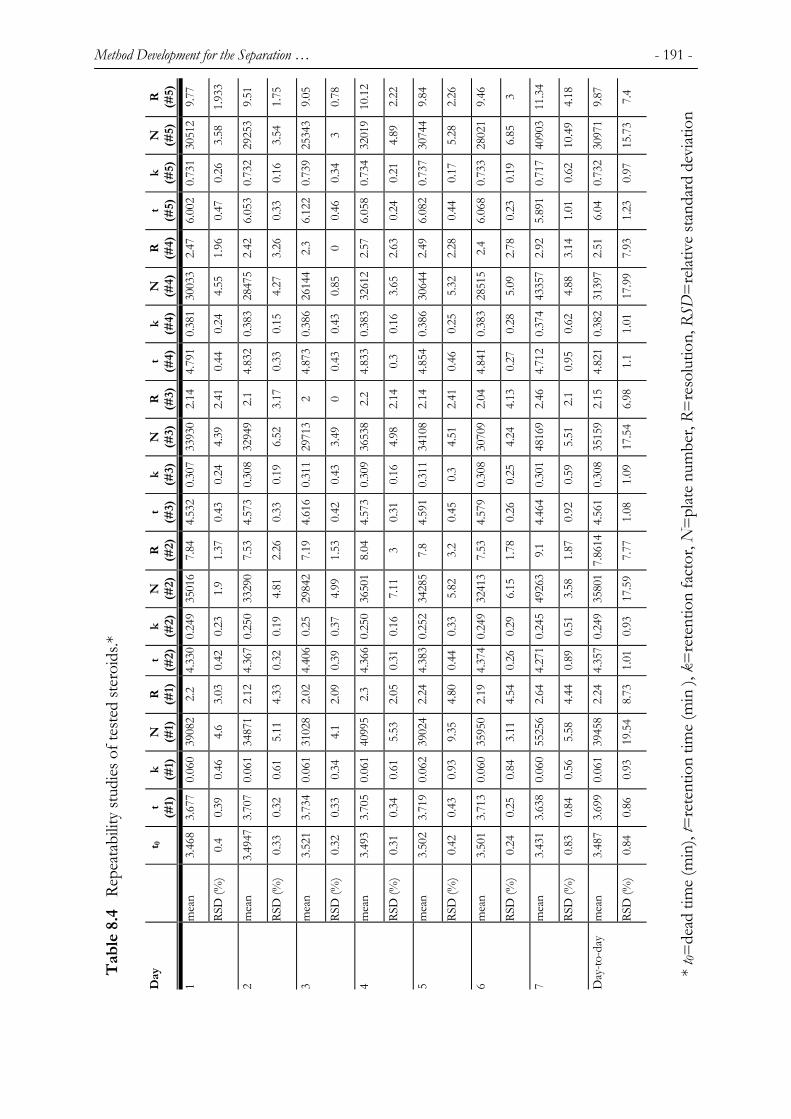
Method Development for the Separation … - 191 -
R (#5)
9.
77
1.93
3
9.51
1.75
9.05
0.78
10.1
2
2.22
9.84
2.26
9.46
3
11.3
4
4.18
9.87
7.4
N
(#5)
30
512
3.58
2925
3
3.54
2534
3
3
3201
9
4.89
3074
4
5.28
2802
1
6.85
4090
3
10.4
9
3097
1
15.7
3
k
(#5)
0.
731
0.26
0.73
2
0.16
0.73
9
0.34
0.73
4
0.21
0.73
7
0.17
0.73
3
0.19
0.71
7
0.62
0.73
2
0.97
t (#
5)
6.00
2
0.47
6.05
3
0.33
6.12
2
0.46
6.05
8
0.24
6.08
2
0.44
6.06
8
0.23
5.89
1
1.01
6.04
1.23
R
(#4)
2.
47
1.96
2.42
3.26
2.3 0 2.57
2.63
2.49
2.28
2.4
2.78
2.92
3.14
2.51
7.93
N
(#4)
30
033
4.55
2847
5
4.27
2614
4
0.85
3261
2
3.65
3064
4
5.32
2851
5
5.09
4335
7
4.88
3139
7
17.9
9
k
(#4)
0.
381
0.24
0.38
3
0.15
0.38
6
0.43
0.38
3
0.16
0.38
6
0.25
0.38
3
0.28
0.37
4
0.62
0.38
2
1.01
t (#
4)
4.79
1
0.44
4.83
2
0.33
4.87
3
0.43
4.83
3
0.3
4.85
4
0.46
4.84
1
0.27
4.71
2
0.95
4.82
1
1.1
R
(#3)
2.
1 4
2.41
2.1
3.17
2 0 2.2
2.14
2.14
2.41
2.04
4.13
2.46
2.1
2.15
6.98
N
(#3)
33
930
4.39
3294
9
6.52
2971
3
3.49
3653
8
4.98
3410
8
4.51
3070
9
4.24
4816
9
5.51
3515
9
17.5
4
k
(#3)
0.
307
0.24
0.30
8
0.19
0.31
1
0.43
0.30
9
0.16
0.31
1
0.3
0.30
8
0.25
0.30
1
0.59
0.30
8
1.09
t (#
3)
4.53
2
0.43
4.57
3
0.33
4.61
6
0.42
4.57
3
0.31
4.59
1
0.45
4.57
9
0.26
4.46
4
0.92
4.56
1
1.08
R
(#2)
7.
8 4
1.37
7.53
2.26
7.19
1.53
8.04
3 7.8
3.2
7.53
1.78
9.1
1.87
7.86
14
7.77
N
(#2)
35
016
1.9
3329
0
4.81
2984
2
4.99
3650
1
7.11
3428
5
5.82
3241
3
6.15
4926
3
3.58
3580
1
17.5
9
k
(#2)
0.
249
0.23
0.25
0
0.19
0.25
0.37
0.25
0
0.16
0.25
2
0.33
0.24
9
0.29
0.24
5
0.51
0.24
9
0.93
t (#
2)
4.33
0
0.42
4.36
7
0.32
4.40
6
0.39
4.36
6
0.31
4.38
3
0.44
4.37
4
0.26
4.27
1
0.89
4.35
7
1.01
R
(#1)
2.
2
3.03
2.12
4.33
2.02
2.09
2.3
2.05
2.24
4.80
2.19
4.54
2.64
4.44
2.24
8.73
N
(#1)
39
082
4.6
3487
1
5.11
3102
8
4.1
4099
5
5.53
3902
4
9.35
3595
0
3.11
5525
6
5.58
3945
8
19.5
4
k
(#1)
0.
060
0.46
0.06
1
0.61
0.06
1
0.34
0.06
1
0.61
0.06
2
0.93
0.06
0
0.84
0.06
0
0.56
0.06
1
0.93
t (#
1)
3.67
7
0.39
3.70
7
0.32
3.73
4
0.33
3.70
5
0.34
3.71
9
0.43
3.71
3
0.25
3.63
8
0.84
3.69
9
0.86
t 0
3.46
8
0.4
3.49
47
0.33
3.52
1
0.32
3.49
3
0.31
3.50
2
0.42
3.50
1
0.24
3.43
1
0.83
3.48
7
0.84
mea
n
RSD
(%)
mea
n
RSD
(%)
mea
n
RSD
(%)
mea
n
RSD
(%)
mea
n
RSD
(%)
mea
n
RSD
(%)
mea
n
RSD
(%)
mea
n
RSD
(%)
Day
1 2 3 4 5 6 7 Day
-to-d
ay
Tabl
e 8.
4 R
epea
tabi
lity
studi
es o
f tes
ted
stero
ids.*
* t 0=
dead
tim
e (m
in),
t=re
tent
ion
time
(min
), k
=re
tent
ion
fact
or, N
=pl
ate
num
ber,
R=re
solu
tion,
RSD
=re
lativ
e sta
ndar
d de
viat
ion

- 192 - Chapter 8 8.3.8 Repeatability Table 8.4 summarizes repeatability studies performed over 7 days. This table contains
results on retention times, retention factors, plate numbers and resolution of all the steroids
for 10 consecutive injections for 7 days. Relative standards deviation for retention factors of
steroids #2 - #5 within 10 consecutive injections (run-to-run) is below 0.5%, when
including the low-retained steroid #1 the relative standard deviation (RSD) is below 1%.
The day-to-day repeatability of the retention factor is below 1.1%. Run-to-run relative
standard deviation for plate numbers for the tested steroids is below 10%, day-to-day is
below 19.5%.
8.3.9 Detection limits
In the frame of the work it is important to test a system for detection limits [18]. The
production process always involves non-reacted products and by-products. Either of these
may be transferred in small or very small amounts to the final products or intermediates. In
order to detect these impurities, detection limits must be determined. Table 8.5 summarizes
detection limits – lowest detectable concentration (Cm) and lowest detectable amount (w0)
for all 5 steroids. Detection limits were determined by injecting sequentially diluted standard
mixtures of steroids of 1 mg/mL. Steroids of concentration as low as 10 µg/mL were easily
detectable (at least 5 times higher than detector noise level). Detection limits as low as
39.8 pg (steroid #1) to 119 pg (steroid #3) were found.
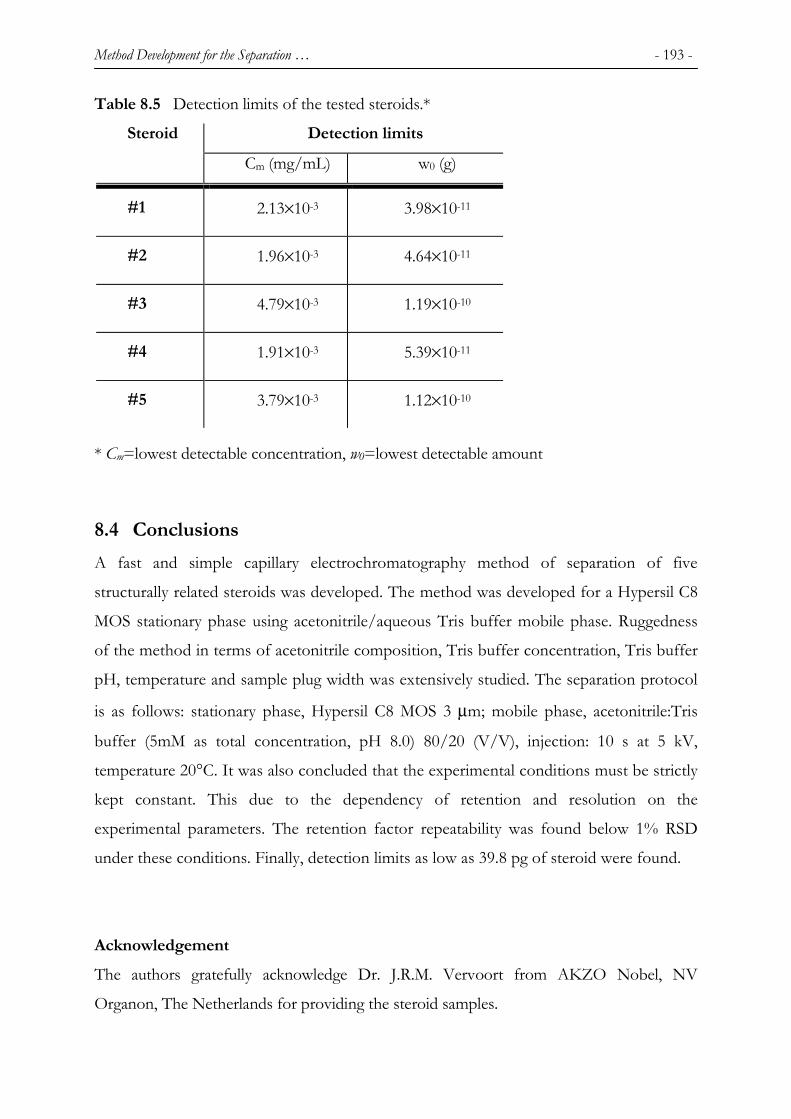
Method Development for the Separation … - 193 -
Table 8.5 Detection limits of the tested steroids.*
Detection limits Steroid
Cm (mg/mL) w0 (g)
#1 2.13×10⁻³ 3.98×10⁻¹¹
#2 1.96×10⁻³ 4.64×10⁻¹¹
#3 4.79×10⁻³ 1.19×10⁻¹⁰
#4 1.91×10⁻³ 5.39×10⁻¹¹
#5 3.79×10⁻³ 1.12×10⁻¹⁰
* Cm=lowest detectable concentration, w0=lowest detectable amount
8.4 Conclusions A fast and simple capillary electrochromatography method of separation of five
structurally related steroids was developed. The method was developed for a Hypersil C8
MOS stationary phase using acetonitrile/aqueous Tris buffer mobile phase. Ruggedness
of the method in terms of acetonitrile composition, Tris buffer concentration, Tris buffer
pH, temperature and sample plug width was extensively studied. The separation protocol
is as follows: stationary phase, Hypersil C8 MOS 3 µm; mobile phase, acetonitrile:Tris
buffer (5mM as total concentration, pH 8.0) 80/20 (V/V), injection: 10 s at 5 kV,
temperature 20°C. It was also concluded that the experimental conditions must be strictly
kept constant. This due to the dependency of retention and resolution on the
experimental parameters. The retention factor repeatability was found below 1% RSD
under these conditions. Finally, detection limits as low as 39.8 pg of steroid were found.
Acknowledgement The authors gratefully acknowledge Dr. J.R.M. Vervoort from AKZO Nobel, NV
Organon, The Netherlands for providing the steroid samples.

- 194 - Chapter 8 REFERENCES 1. International Union of Pure and Applied Chemistry, Nomenclature of Organic
Chemistry, Sections A, B, C, D, E, F and H, 1979 Edition, Pergamon Press, Oxford,
1979.
2. S. Thiam, S.A. Shamsi, C.W. Henry III, J.W. Robinson, I.M. Warner, Anal. Chem., 72
(2000) 2541.
3. D.A Stead, R.G. Reid, R.B. Taylor, J. Chromatogr. A, 798 (1998) 259.
4. R.M. Seifar, W. Th. Kok, J.C. Kraak, H. Poppe, Chromatographia, 46 (1997) 131.
5. R.M. Seifar, S. Heemstra, W. Th. Kok, J.C. Kraak, H. Poppe, J. Microcolumn Sep., 10
(1998) 41.
6. A.H. Que, A. Palm, A.G. Baker, M.V. Novotny, J. Chromatrogr. A, 887 (2000) 379.
7. M. R. Taylor, P. Teale, S.A. Westwood, D. Perrett, Anal. Chem., 69 (1997) 2554.
8. J. Wang, D.E. Schaufelberger, N.A. Guzman, J. Chromatogr. Sci., 36 (1998) 155.
9. G.A. Lord, D.B. Gordon, P. Myers, B.W. King, J. Chromatogr. A, 768 (1997) 9.
10. M.R. Euerby, D. Gilligan, C.M. Johnson, S.C.P. Roulin, P. Myers, K.D. Bartle, J.
Microcolumn Sep., 9 (1997) 373.
11. M. R. Euerby, C.M. Johnson, K.D. Bartle, LC-GC Eur., 11 (1998) 39.
12. M.R. Euerby, C.M. Johnson, K.D. Bartle, P. Myers, S.C.P. Roulin, Anal. Commun., 33
(1996) 403.
13. N.W. Smith, M.B. Evans, Chromatographia, 41 (1995) 197.
14. T. Baczek, R. Kaliszan, H.A. Claessens, M.A. van Straten, LC-GC Int., 14 (2001) 304.
15. J. Jiskra, M. Byelik, C.A. Cramers, H.A. Claessens, J. Chromatogr. A, 862 (1999) 121.
16. A. Banholczer, U. Pyell, J. Chromatogr. A, 869 (2000) 363.
17. U. Pyell, H. Rebscher, A. Banholczer, J. Chromatogr. A, 779 (1997) 155.
18. C.F. Poole, S.K. Poole, Chromatography Today, Elsevier Science, Amsterdam, 1991.

- 195 -
CHAPTER 9 9 SEPARATION OF BASIC CENTRAL NERVOUS SYSTEM
DRUGS BY CAPILLARY ELECTROCHROMATOGRAPHY
Summary
This article describes the sample preparation and separation of three strongly basic central
nervous system (CNS) drugs by capillary electrochromatography. The separation was
developed on Hypersil C8 MOS and Hypersil Phenyl stationary phases using acetonitrile
(ACN) as organic modifier together with mobile phase additives, ammonia,
ethylenediamine or 1,3-diaminopropane. A successful, fast separation after a simple
derivatization procedure of the compound was achieved on the Hypersil Phenyl
stationary phase using ethylenediamine as mobile phase additive. The general approach to
method development for complex mixtures is discussed.
This chapter has been accepted for publication in Journal of Separation Science.
9.1 Introduction Development of drugs for central nervous system (CNS) disorders is one of the most
progressive areas of the pharmaceutical industry [1]. At present, Alzheimer’s disease drugs
account for 32% of total peak sales of CNS products. Furthermore, migraine, neurogenic
and opioid-resistant pain drugs have chance to contribute significantly to the expansion of
the CNS area. In current practice, high-performance liquid chromatography (HPLC) is
the preferred technique in analyses of pharmaceuticals. Capillary electrochromatography
(CEC), however, offers new separation potentials such as high peak capacity and different
selectivity. Since the introduction of capillary electrochromatography (CEC) in practice at

- 196 - Chapter 9 the end on 1980’s, only few applications were shown and particularly at the beginning
CEC analyses were limited to the analyses of polyaromatic hydrocarbons (PAHs). In spite
of the recent development in CEC, analyses of certain groups of solutes such as basic
compounds remain a problematic task. In this particular case, two contradictory items
arise:
i. the charged stationary phase (e.g from ionized silanol groups) is responsible for
electroosmotic flow (EOF) under CEC conditions
ii. as known from high-performance liquid chromatography, interactions between
the charged surface of the stationary phase (e.g. from ionized silanol groups)
cause deterioration in chromatographic performance of these solutes e.g. tailing
peaks [2]
At presence, three groups of basic analytes found their application field in the
electrochromatography of pharmaceuticals (incl. opiates) and other nitrogen-containing
compounds (e.g. primary amines). Gillott et al. [3-4] showed a successful separation of
basic pharmaceuticals such as procainamide and nortriptyline on a C18 stationary phase
and bare silica using competing bases, triethylamine (TEA) and triethanolamine (TEOA),
as mobile phase additives. The effects of mobile phase pH, concentration of competing
bases and acetonitrile (ACN) concentration were examined. Cahours et al. [5] used a
phenyl stationary phase for the analysis of benzodiazepines using ACN/aqueous Tris
buffered mobile phase. Lurie et al. [6] presented the separation of strongly, moderately
and weakly basic, acid and neutral solutes in a single run using a CEC Hypersil C18
stationary phase with a ACN/aqueous phosphate mobile phase containing n-hexylamine
as mobile phase additive (competing base) at low pH. Dittmann et al. [7] separated basic
pharmaceuticals as procaine, ambroxol and antipyrine on a variety of stationary phases,
Spherisorb ODS I, CEC Hypersil C18 and CEC Hypersil C8 using a “Lurie” [5] mobile
phase. The influence of several parameters including the concentration of the competing
base was thoroughly studied. Smith et al. [8] analyzed amitriptyline, imiprazine on
Spherisorb ODS I and Spherisorb Silica stationary phases using non-aqueous mobile
phase (acetonitrile/methanol) containing Tris buffer. These authors showed the
successful performance of the SymmetryShield RP-8 stationary phase using an
ACN/aqueous Tris buffer mobile phase; the possible mechanism of interactions of
solutes with the stationary phase is given. Strickmann et al. [9] applied LiChrospher 100

Separation of Basic CNS drugs … - 197 -
RP-18 stationary phase with ACN/aqueous ammonium formate mobile phase for analysis
of the drug etodolac using ESI-MS detection. Special purpose stationary phases such as
cholesteryl silica bonded phase (Jinno et al. [10]), continuous beds based on acrylamide
polymers (Enlund et al. [11]) or polysaccharide-type stationary phases (Meyring et al. [12])
used for the separation of basic pharmaceuticals- benzodiazepines [10], nortriptyline,
amitriptyline [11] or thalidomide and its hydroxylated metabolites [12]. Wei et al. [13]
separated cocaine, codeine and thebaine on bare silica stationary phase using
ACN/aqueous Tris mobile phase. Basic opiates (morphine, codeine, diacetylmorphine)
were separated by Lim et al. [14] on a non-porous ODS stationary phase with
ACN/aquesous Tris {tris(hydroxymethyl)aminomethane} mobile phase with sodium
dodecylsulfate (SDS) as mobile phase additive. Similarly, Wu at al [15] separated basics,
acids and neutrals on a monolithic capillary column using modifiers such as SDS and
CTAB (cetyl-trimethylammonium bromide). Koide et al. [16] analyzed twelve primary
amines on monolithic chiral stationary phases using ACN/aqueous boric acid mobile
phase with TEA as mobile phase additive. Lopez-Avila et al. [17] studied the
determination of selected heterocyclic compounds containing nitrogen, oxygen or sulfur
on a C18 bonded silica phase using ACN/aqueous sodium tetraborate mobile phase.
Klampfl and co-workers [18-20] extensively studied separations of aromatic nitrogen-
containing compounds (anilines, pyridines, pyrimidines) on phases that exhibit strong
cation-exchange (SCX) or strong anion-exchange (SAX) characteristics.
In this paper, we describe a method for the separation of three basic CNS drugs on two
stationary phases in CEC using basic mobile phase additives as silanol shielding agents
together with a simple active compound derivatization procedure. This paper discusses
the method development for the analysis of basic solutes under capillary
electrochromatography conditions.
9.2 Experimental 9.2.1 Chemicals Acetonitrile (ACN) with HPLC grade purity was obtained from Biosolve (Valkenswaard,
the Netherlands); ammonia solution (25%) of analytical purity was supplied by Merck
(Darmstadt, Germany), ethylenediamine, redistilled, 99.5+% and 1,3-diaminopropane
99+% were purchased from Aldrich (Steinheim, Germany), 1,5-diaminopentane (≥97%),

- 198 - Chapter 9 boron trifluoride in methanol (~10% in MeOH) was obtained from Fluka (Buchs,
Switzerland). CNS drug samples were kindly supplied by Organon (Oss, the Netherlands).
The structures of the drugs are depicted in Figure 9.1; drug #1 is the main component,
chemically 1-[6-chloro-5-(trifluoromethyl)pyridin-2-yl]piperazine; drugs #2 and #3 are
related substances, chemically 2-chloro-6-piperazine-1-ylnicotinic acid and 1-(6-
chloropyridine-2-yl)piperazine, respectively. Eluents: acetonitrile/water (70/30, V/V) with
added ammonia, ethylenediamine or 1,3-diaminopropane without pH additional
adjustment. The concentration of ammonia, ethylenediamine and 1,3-diaminopropane
varied throughout the procedure. All mobile phases were filtered through a filter (pore size
= 0.45 µm) and degassed by ultrasonication before use.
NNHN
CF3
Cl
NNHN
Cl
COOH
NNHN
Cl
. HCl
#1 = Org 12962
.CF3 COOH
#2 = Org 14229
. HCl
#3 = Org 14191 Figure 9.1 Structures of the tested CNS drugs.
9.2.2 Columns Two columns were investigated, Hypersil MOS C8 and Hypersil Phenyl (Thermo Hypersil-
Keystone, Runcorn, UK); column dimensions: 100 µm I.D. × 33.5 cm total length (25 cm
effective); particle size 3 µm; detection wavelength: UV, 254 nm. These columns differ
substantially in their hydrophobicity and silanol activity [24]. Both columns were
conditioned by the mobile phase using a syringe pump and then in the CEC mode by
applying 10 bar pressure on both sides of the column and increasing the voltage from 0-
25 kV in 5 kV steps per 10 min.

Separation of Basic CNS drugs … - 199 -
9.2.3 Instrumentation All CEC chromatograms were obtained on an Agilent Technologies 3DCE (Agilent
Technologies GmbH, Waldbronn, Germany) instrument equipped with a pressure facility
of up to 12 bar at the outlet and/or inlet vial. This pressurization option of the instrument
was used to prevent bubble formation in the capillaries. Samples were injected
electrokinetically (5 kV for 2-15 s). For each run a voltage of 20 kV (Hypersil C8 MOS) or
15 kV (Hypersil Phenyl) was applied with 10-bar pressure on both ends of the capillary.
The detection wavelength was 254 nm. High voltage was applied as a 6-s time ramp to
avoid column stress. The column cassette temperature was maintained at 20ºC.
9.3 Results and discussion 9.3.1 Preliminary experiments Based on the relationship of CEC and HPLC (high-performance liquid chromatography),
Chromsword® HPLC optimization software (Merck GmbH, Darmstadt, Germany) was
used for preliminary experiments to establish starting CEC conditions. The elution order of
the CNS drugs on the Hypersil C18 stationary phase using 70% acetonitrile/30% water
(V/V) was found to be as follows: #2, #3, #1. It is obvious that all drug compounds will
show partial charge under most CEC conditions and particularly drug #2 with zwitterionic
characteristic will thus deviate from the HPLC software generated chromatogram. For
charged compounds, retention in CEC may be expressed as follows [21]:
totid
eff
eof
r
LLV
t
kt µ+
+=1
)1( (9.1)
where tr is the retention time, k the retention factor, teof the dead time, µeff the electroosmotic
mobility, V the column volume, Lid the injector-to-detector length of the column and Ltot
the total length of the column. Figure 9.2 shows the CEC separation of all three drugs on
the Hypersil Phenyl stationary phase using 70% ACN and 30% aqueous ethylenediamine
adjusted with acetic acid to pH 7.0. In this case, the bases #1 and #3 elute before the t0
marker, proving that their electrophoretic mobilities contribute substantially to their
retention. Drug #2, which should have zero or negative charge under these conditions,
elutes after t0. Therefore it migrates after t0 due its lower mobility.
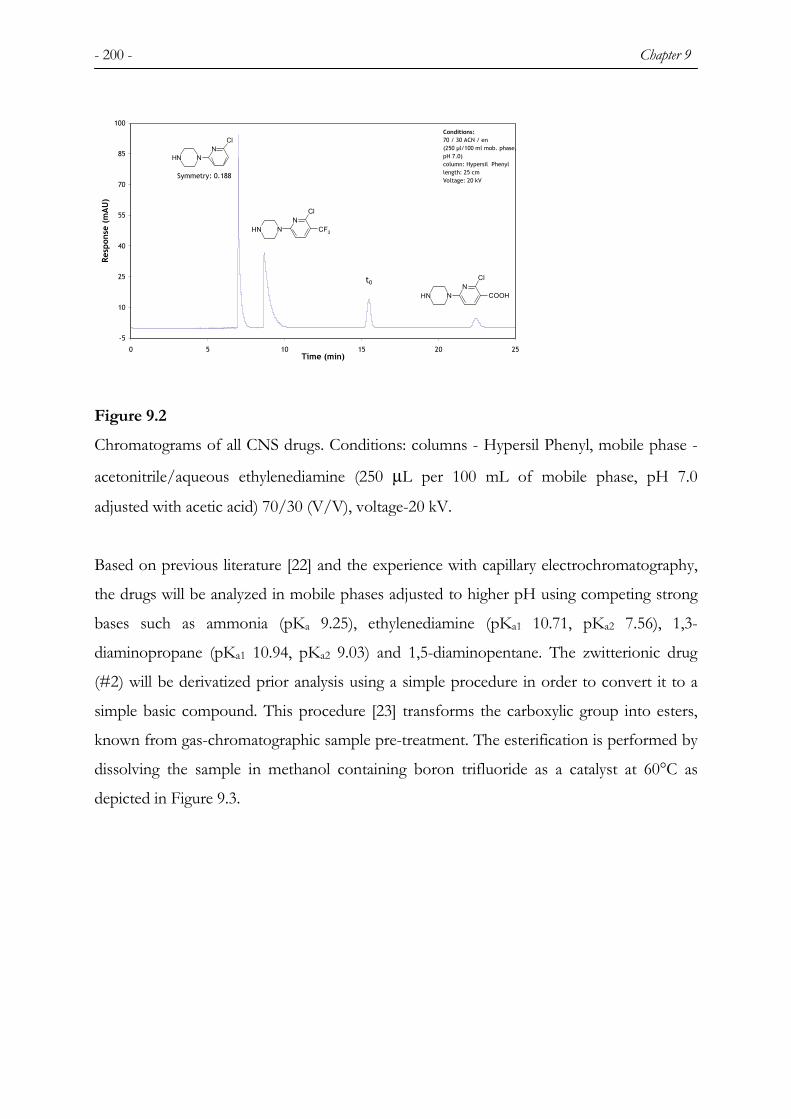
- 200 - Chapter 9
-5
10
25
40
55
70
85
100
0 5 10 15 20 25Time (min)
Resp
onse
(m
AU
)
t0
Conditions:70 / 30 ACN / en(250 µl/100 ml mob. phase, pH 7.0)column: Hypersil Phenyllength: 25 cmVoltage: 20 kV
NNHN
CF3
Cl
NNHN
Cl
Symmetry: 0.188
NNHN
Cl
COOH
Figure 9.2 Chromatograms of all CNS drugs. Conditions: columns - Hypersil Phenyl, mobile phase -
acetonitrile/aqueous ethylenediamine (250 µL per 100 mL of mobile phase, pH 7.0
adjusted with acetic acid) 70/30 (V/V), voltage-20 kV.
Based on previous literature [22] and the experience with capillary electrochromatography,
the drugs will be analyzed in mobile phases adjusted to higher pH using competing strong
bases such as ammonia (pKa 9.25), ethylenediamine (pKa1 10.71, pKa2 7.56), 1,3-
diaminopropane (pKa1 10.94, pKa2 9.03) and 1,5-diaminopentane. The zwitterionic drug
(#2) will be derivatized prior analysis using a simple procedure in order to convert it to a
simple basic compound. This procedure [23] transforms the carboxylic group into esters,
known from gas-chromatographic sample pre-treatment. The esterification is performed by
dissolving the sample in methanol containing boron trifluoride as a catalyst at 60°C as
depicted in Figure 9.3.

Separation of Basic CNS drugs … - 201 -
NNHN
Cl
COOH NNHN
Cl
COOCH3
CH3OH
BF3
Figure 9.3 Derivatization procedure of drug #2.
It is important to emphasize that a slower reaction occurs derivatizing the nitrogen of
piperazine. Using this derivatization procedure we can again simulate chromatograms using
the Chromsword® HPLC optimization software to revealing in the elution order: #2-
methyl ester, #3, #1.
9.3.2 Column and mobile phase modifier choice The selection the optimal column and mobile phase modifier will be demonstrated on the
separation of drugs #1 and #3.
9.3.3 Hypersil C8 MOS Ammonia was chosen for the comparative study of basic competing agents (mobile phase
modifiers) as the simplest one. Three experiments (Fig. 9.4 A, B and C) show the
improvement in the peak shape of both basic analytes upon increasing concentration of
ammonia in the mobile phase.

- 202 - Chapter 9
-10
5
20
0 2 4 6 8 10 12 14Time (min)
Resp
onse
(m
AU
)
t0
Conditions:70 / 30 ACN / ammonia(1 ml NH3/100 ml mob. phase)column: Hypersil C8 MOSlength: 25 cmVoltage: 20 kV
NNHN
CF3
Cl
NNHN
Cl
Symmetry: 0.091
-15
0
15
30
0 2 4 6 8 10 12 14Time (min)
Resp
onse
(m
AU
) t0
Conditions:70 / 30 ACN / ammonia(2 ml NH3/100 ml mob. phase)column: Hypersil C8 MOSlength: 25 cmVoltage: 20 kV
NNHN
CF3
Cl
NNHN
Cl
Symmetry: 0.126
-20
-5
10
25
40
0 2 4 6 8 10 12 14Time (min)
Resp
onse
(m
AU
)
t0
Conditions:70 / 30 ACN / ammonia(5 ml NH3/100 ml mob. phase)column: Hypersil C8 MOSlength: 25 cmVoltage: 20 kV
NNHN
CF3
Cl
NNHN
Cl
Symmetry: 0.255
A)
B)
C)
Figure 9.4 Chromatograms of all CNS drugs. Conditions: column - Hypersil C8 MOS, mobile phase
–70 % acetonitrile/30% (V/V) aqueous ammonia, A) 1 mL per 100 mL of mobile phase,
B) 2 mL per 100 mL of mobile phase, C) 5 mL per 100 mL of mobile phase, voltage-20
kV.
Three concentrations were chosen, 70% aqueous acetonitrile with 1 mL 25% ammonia
per 100 mL mobile phase (Fig. 9.4A), with 2 mL 25% ammonia (Fig. 9.4B) and 5 mL of

Separation of Basic CNS drugs … - 203 -
25% ammonia (Fig. 9.4C). The symmetry of the first peak (drug #3) improved from
0.091 (experiment A) to 0.126 (experiment B) and 0.255 (experiment C). Symmetry of the
peak is calculated using following equation:
43
21
mmmmsymmetry
++= (9.2)
where m1, m2, m3, m4 are the moments of the peak calculated by the integrator (peak
inflections and time slices on the baseline are calculated) [25]. Approximately, peak
asymmetry is the reciprocal value of above-mentioned symmetry. Further, much stronger
and more hydrophobic bases, ethylenediamine and 1, 3-diaminopropane, were compared
with respect to performance. Ethylenediamine in concentrations of 100 µL per 100 mL of
the mobile phase (70% aqueous ACN) (Fig. 9.5A), 250 µL per 100 mL of the mobile phase
(Fig. 9.5B) and 500 µL per 100 mL of the mobile phase (Fig. 5C) improved the peak
symmetry substantially. The peak symmetry of drug #3 improved from a value of 0.167
(experiment A) up to 0.285 (experiment C). Addition of 250 µL of the more hydrophobic
1,3-diaminopentane to the mobile phase further improved performance; a symmetry value
of 0.286 for drug #3 was reached. It appeared that improvement to more symmetric peaks
(close to the value=1) might be difficult even with more hydrophobic amines. The reason
may be found in accessibility of free silanols of the stationary phase by the shielding agents
(mobile phase additives).

- 204 - Chapter 9
-5
10
25
40
0 2 4 6 8 10 12 14Time (min)
Resp
onse
(m
AU
)
t0
Conditions:70 / 30 ACN / en(100 µl/100 ml mob. phase)column: Hypersil C8 MOSlength: 25 cmVoltage: 20 kV
NNHN
CF3
Cl
NNHN
Cl
Symmetry: 0.167
-5
10
25
40
55
70
0 2 4 6 8 10 12 14Time (min)
Resp
onse
(m
AU
)
t0
Conditions:70 / 30 ACN / en(250 µl/100 ml mob. phase)column: Hypersil C8 MOSlength: 25 cmVoltage: 20 kV
NNHN
CF3
Cl
NNHN
Cl
Symmetry: 0.220
-5
10
25
40
55
70
85
0 2 4 6 8 10 12 14Time (min)
Resp
onse
(m
AU
)
t0
Conditions:70 / 30 ACN / en(500 µl/100 ml mob. phase)column: Hypersil C8 MOSlength: 25 cmVoltage: 20 kV
NNHN
CF3
Cl
NNHN
Cl
Symmetry: 0.285
A)
B)
C)
Figure 9.5 Chromatograms of all CNS drugs. Conditions: column - Hypersil C8 MOS, mobile phase –
70 % acetonitrile/30% (V/V) aqueous ethylenediamine, A) 100 µL per 100 mL of mobile
phase, B) 250 µL per 100 mL of mobile phase, C) 500 µL per 100 mL of mobile phase,
voltage-20 kV.

Separation of Basic CNS drugs … - 205 -
9.3.4 Hypersil Phenyl
Ammonia as the mobile phase additive in concentrations of 100 µL per 100 mL 70%
aqueous acetonitrile was used for studying the initial performance (Fig. 9.6)
-5
10
25
40
0 5 10 15 20 25 30Time (min)
Resp
onse
(m
AU
)
t0
Conditions:70 / 30 ACN / ammonia(100 µl/100 ml mob. phase)column: Hypersil Phenyllength: 25 cmVoltage: 15 kV
NNHN
CF3
ClNNH
NCl
Figure 9.6 Chromatogram of CNS drugs #1 and #2. Conditions: columns - Hypersil Phenyl, mobile
phase - acetonitrile/aqueous ammonia (100 µL per 100 mL of mobile phase) 70/30 (V/V),
voltage - 15 kV.
Non separated peaks with poor peak shape were achieved. As expected, addition of 100 mL
of ethylenediamine improved peak shape, however, the analytes were not baseline separated
(Fig. 9.7A). This goal was finally achieved by addition of 250 µL of ethylenediamine to the
mobile phase. A peak symmetry of drug #3 of 0.580 and a resolution of 2.1 was reached
(Fig. 9.7B).

- 206 - Chapter 9
-5
10
25
40
55
70
0 2 4 6 8 10 12 14Time (min)
Resp
onse
(m
AU)
t0
Conditions:70 / 30 ACN / ethylenediamine(100 µl/100 ml mob. phase)column: Hypersil Phenyllength: 25 cmVoltage: 15 kV
NNHN
CF3
Cl
NNHN
Cl
-2
13
28
0 2 4 6 8 10 12 14Time (min)
Resp
onse
(m
AU)
t0
Conditions:70 / 30 ACN / ethylenediamine(250 µl/100 ml mob. phase)column: Hypersil Phenyllength: 25 cmVoltage: 15 kV
NNHN
CF3
Cl
NNHN
Cl
Symmetry: 0.580
A)
B)
Figure 9.7 Chromatograms of CNS drugs #1 and #3. Conditions: column - Hypersil Phenyl, mobile
phase –70 % acetonitrile/30% aqueous ethylenediamine (no pH adjustment), A) 100 µL
per 100 mL of mobile phase, B) 250 µL per 100 mL of mobile phase, voltage - 15 kV.
When comparing the results with more hydrophobic amines as mobile phase additives, 1,3-
diaminopropane and 1,5-diaminopentane, more symmetric peaks of basic solutes were
achieved (symmetry of 0.692 and 0.760, respectively), however, the resolution decreased
(Fig. 9.8 A and B). Obviously, there is a link between amount of remaining silanols,
hydrophobicity of the stationary phase (due to adsorbed hydrophobic amines) and
resolution of basic analytes.

Separation of Basic CNS drugs … - 207 -
-5
10
25
40
55
0 2 4 6 8 10 12 14Time (min)
Resp
onse
(m
AU)
t0
Conditions:70 / 30 ACN / propylenediamine(250 µl/100 ml mob. phase)column: Hypersil Phenyllength: 25 cmVoltage: 15 kV
NNHN
CF3
Cl
NNHN
Cl
Symmetry: 0.760
-5
10
25
40
55
70
85
0 2 4 6 8 10 12 14Time (min)
Resp
onse
(m
AU)
t0
Conditions:70 / 30 ACN / 1,5-diaminopentane(250 µl/100 ml mob. phase)column: Hypersil Phenyllength: 25 cmVoltage: 15 kV
NNHN
CF3
Cl
NNHN
Cl
Symmetry: 0.692
A)
B)
Figure 9.8 Chromatograms of CNS drugs #1 and #3. Conditions: column - Hypersil Phenyl, mobile
phase –70 % acetonitrile/30% aqueous A) 1,3-diaminopropane, 250 µL per 100 mL of
mobile phase, B) 1,5-diaminopentane, 250 µL per 100 mL of mobile phase, voltage - 15 kV.
Successful separation at 70% aqueous ACN containing 250 µL ethylenediamine in the
mobile phase was used to monitor the derivatization of drug #2 (Fig. 9.9), a small later
eluting peak from the extensive derivatization is supposed to be corresponding to the N-
methyl analog. For further purpose, the derivatization has been optimized to minimize
further methylation of the steroid #2. All three substances were subsequently analyzed
under the same conditions resulting in a satisfactory baseline separation with symmetrical
peaks of the drugs as demonstrated in Fig. 9.10.

- 208 - Chapter 9
-2
13
28
0 2 4 6 8 10 12 14Time (min)
Resp
onse
(m
AU
)
t0Conditions:70 / 30 ACN / ethylenediamine(250 µl/100 ml mob. phase)column: Hypersil Phenyllength: 25 cmVoltage: 15 kV
NNHN
Cl
COOH NNHN
Cl
COOCH3
CH3OH
BF3
Before derivatization
After derivatization
Figure 9.9 Monitoring of derivatization of CNS drug #2. Conditions same as in Fig. 9.7B
-2
3
8
13
0 2 4 6 8 10 12 14Time (min)
Resp
onse
(m
AU
)
t0
Conditions:70 / 30 ACN / ethylenediamine(250 µl/100 ml mob. phase)column: Hypersil Phenyllength: 25 cmVoltage: 15 kV
NNHN
CF3
Cl
NNHN
Cl
NNHN
Cl
COOCH3
Figure 9.10
Chromatograms of CNS drugs #1 and #3 and derivatized #2. Conditions: column -
Hypersil Phenyl, mobile phase –70 % acetonitrile/30% aqueous ethylenediamine, 250 µL
per 100 mL of mobile phase, voltage - 15 kV.
9.3.5 Repeatability, Influence of variables and Detection limits
Table 9.1 lists values of a repeatability test for all three basic drugs over three days. Run-to-
run repeatability in terms of retention times varied within 0.26% for ten consecutive

Separation of Basic CNS drugs … - 209 -
injections, for the retention factor the results were within 1.26%. Day-to-day repeatability
results were within 3.03% for retention times and 5.22% for retention factors.
Table 9.1 Repeatability of retention and retention factors.
Compound
#1 #2
(methyl ester)
#3
Day t0
(min)
tR
(min)
k tR
(min)
k tR
(min)
k
mean 6.08 9.00 0.48 7.69 0.26 8.23 0.35 1
RSD (%) 0.26 0.24 1.26 0.16 1.03 0.16 0.89
mean 6.16 9.29 0.51 7.89 0.28 8.48 0.38 2
RSD (%) 0.20 0.26 0.74 0.17 0.70 0.22 0.60
mean 6.27 9.56 0.53 8.07 0.29 8.72 0.39 3
RSD (%) 0.15 0.20 0.27 0.23 0.99 0.19 0.45
mean 6.17 9.29 0.50 7.88 0.28 8.48 0.37 Day-to-day RSD (%) 1.51 3.03 4.60 2.40 4.23 2.91 5.22
The effects of variables as temperature, acetonitrile composition and ethylenediamine
concentration in the mobile phase are summarized in Table 9.2. Evidently, the
ethylenediamine concentration has the greatest effect; retention factors vary up to 2%
(estimated) for drug #3 upon a change of 10 µL of ethylenediamine in the mobile phase.
Acetonitrile concentration ranging from 69-71% change the retention factor of drug #1 of
+/- 5%. For the same compound the change in temperature of 0.1°C (precision of the
instrument) causes a change in the retention factor of up to 0.2%.

- 210 - Chapter 9 Table 9.2 Influence of variables, temperature, ACN concentration and concentration of
ethylenediamine in the mobile phase.
Compound Variable
#1 #2-methyl ester #3
Temperature (ºC) ∆kvalue-mean (%)
15 4.62 2.68 4.21
17 2.19 1.48 2.03
18 1.49 0.93 1.31
19 0.47 0.30 0.42
20 (mean) 0 0 0
21 -1.91 -0.70 -1.57
22 -2.05 -0.42 -1.50
23 -2.85 -0.73 -2.17
25 -4.75 -1.85 -3.95
ACN composition (%)
66 23.17 17.02 17.07
68 9.78 7.53 7.20
70 (mean) 0 0 0
72 -9.67 -5.46 -6.82
74 -19.11 -8.34 -13.95
Ethylenediamine conc. (µµµµL)
100 33.04 27.72 45.20
200 6.75 10.12 8.35
250 (mean) 0 0 0
300 -5.79 -6.80 -6.65
Detection limits, lowest detectable concentration (Cm) and lowest detectable amount (w0) [2]
for all three drugs are summarized in Table 9.3. The detection limits for the zwitterionic

Separation of Basic CNS drugs … - 211 -
drug are approximate with a 50% derivatization yield. Detection limits as low as 670 pg
(drug #3) and 730 pg (drug #1) were found.
Table 9.3 Detection limits for tested CNS drugs.
Detection limits Compound
Cm (mg/mL) w0 (g)
#1 8.1×10⁻³ 7.3×10⁻¹⁰
#2 4×10⁻² 5×10⁻⁹
#3 8.6×10⁻³ 6.7×10⁻¹⁰
* Cm=lowest detectable concentration, w0=lowest detectable amount
9.4 Conclusions A capillary electrochromatography method was developed for the separation of three basic
drugs on reversed-phase stationary phases after a simple derivatization procedure of one of
the compounds. The best performance with respect of separation time and resolution was
achieved on the Hypersil Phenyl stationary phase using 70% acetonitrile/30% water with
250 µL of ethylenediamine as a mobile phase additive (per 100 mL of mobile phase). The
experimental conditions should be strictly kept constant due to the dependency of
chromatographic performance on the experimental parameters. Run-to-run retention factor
repeatability was below 1.26% RSD, day-to-day repeatability within 5.22% RSD. The
influence of acetonitrile composition, temperature and ethylenediamine concentration was
extensively studied. Detection limits as low as 670 pg of drug were found.
Acknowledgement The authors gratefully acknowledge Dr. J.R.M. Vervoort from AKZO Nobel, NV
Organon, The Netherlands for providing the basic analyte samples.
REFERENCES 1. D. Hughes, Pharm. Sci. Technol. Today, 1 (1998) 186.
2. C.F. Poole, S.K. Poole, Chromatography Today, Elsevier Science, 1991, p. 366.

- 212 - Chapter 9 3. N.C. Gillott, M.R. Euerby, C.M. Johnson, D.A. Barrett, P.N. Shaw, Anal. Commun.,
35 (1998) 217.
4. N.C. Gillott, M.R. Euerby, C.M. Johnson, D.A. Barrett, P.N. Shaw, Chromatographia,
51 (2000) 167.
5. X. Cahours, Ph. Morin, M. Dreux, J. Chromatogr. A, 845 (1999) 203.
6. I.S. Lurie, T.S. Conver, V.L. Ford, Anal. Chem., 70 (1998) 4563.
7. M.M. Dittmann, K. Masuch, G.P. Rozing, J. Chromatogr. A, 887 (2000) 209.
8. N.W. Smith, J. Chromatogr. A, 887 (2000) 233.
9. D.B. Strickmann, G. Blaschke, J. Chromatogr. B, 748 (2000) 213.
10. K. Jinno, H. Sawada, A.P. Catabay, H. Watanabe, N.B.H. Sabli, J.J. Pesek, M.T.
Matyska, J. Chromatogr. A, 887 (2000) 479.
11. A.M. Enlund, C. Ericson, S. Hjertén, D. Westerlund, Electrophoresis, 22 (2001) 511.
12. M. Meyring, B. Chankvetadze, G. Blaschke, J. Chromatogr. A, 876 (2000) 157.
13. W. Wei, G.A. Luo, G.Y. Hua, C. Yan, J. Chromatogr. A, 817 (1998) 65.
14. J.-T. Lim, R.N. Zare, C.B. Bailey, D.J. Rakestraw, C. Yan, Electrophoresis, 21 (2000)
737.
15. R. Wu, H. Zou, M. Ye, Z. Lei, J. Ni, Electrophoresis, 22 (2001) 544.
16. T. Koide, K. Ueno, J. Chromatogr. A, 909 (2001) 305.
17. V. Lopez-Avila, J. Benedicto, C. Yan, J. High Resolut. Chromatogr., 20 (1997) 615.
18. C.W. Klampfl, E.F. Hilder, P.R. Haddad, J. Chromatogr. A, 888 (2000) 267.
19. C.W. Klampfl, P.R. Haddad, J. Chromatogr. A, 884 (2000) 277.
20. C.W. Klampfl, W. Buchberger, P.R. Haddad, J. Chromatogr. A, 911 (2001) 277.
21. J.P.C. Vissers, H.A. Claessens, P. Coufal, J. High Resolut. Chromatogr., 18 (1995) 540.
22. M. J. Hilhorst, G. W. Somsen, G. J. de Jong, J. Chromatogr. A, 872 (2000) 315.
23. L.D. Metcalfe, A.A. Schmitz, Anal. Chem., 33 (1951) 363.
24. M.R. Euerby, C.M. Johnson, S.F. Smith, N. Gillot, D.A. Barrett, P.N. Shaw, J.
Microcolumn Sep. 11 (1999) 305.
25. Understanding Your ChemStation, Publication Number G2070-91114, Agilent
Technologies GmbH, Waldbronn, 2001.

- 213 -
SUMMARY
Analytical techniques such as electrophoresis and chromatography already have a long
tradition in science. The roots of electrophoresis originate from the end of the 18th century
with the formulation of Michael Faraday’s laws of electrophoresis. The first
chromatographic experiments were performed at the beginning of 20th century by Mikhail
Semenovich Tswett. Both separation techniques rapidly developed during the second half
of the 20th century and turned into high-performance separation techniques. Thus, capillary
electrochromatography (CEC) as a hybrid technique of high-performance liquid
chromatography and electrophoresis seemed to be a break-through in separation science.
The use of submicron particles to achieve very high efficiencies compared to high
performance liquid chromatography (HPLC) was only one of the most promising
properties of CEC. However, since the very beginning CEC has struggled with a number of
technical difficulties, which until now have hampered its widespread application in routine
analysis.
Chapters 1 and 2 provide a thorough overview of the present status of CEC, theoretical
considerations on electroosmosis, presently applied stationary and mobile phases and
developed applications. Furthermore, these chapters outline a number of related questions
and answers concerning the fundamentals in CEC and its relationship to HPLC and CE. It
can be concluded that CEC is a highly efficient separation technique. The use of
conventional stationary phases is limited due to their electroosmotic flow (EOF)
capabilities. New CEC stationary phases, however, have been developed to satisfy users’
demands. Submicron particles (< 1 µm) have been successfully used yielding high
efficiencies without loss of EOF. Until now, however, only very short columns have been
packed due to inherent packing problems. A variety of mobile phases can be applied in
CEC, though practically only acetonitrile and partly methanol as organic modifier in mobile
phases facilitate the generation of a substantial EOF. A number of applications has been
developed in CEC, though the requested robustness and ruggedness in comparison to
HPLC protocols have not been achieved, yet.

- 214 - Summary A number of fundamental aspects of CEC are discussed in Chapters 3 to 7. As described in
Chapter 3, column descriptors such as hydrophobicity and silanol activity may differ
substantially for the same stationary phase depending on whether the column is operated
under HPLC or CEC conditions. Moreover, these differences also are a function of the
nature and concentration of the organic modifier. It has been suggested that these
observations can be explained from different ligand orientations caused by the nature of the
eluent-driven modes, being either pressure or electro-driven. In addition, the observation
may also be due to the occurrence of electroosmotic whirlwind effects in porous packings
causing different phase ratios.
Furthermore, in Chapter 4 it is found that inorganic buffers have a great influence on the
chromatographic behaviour, while the impact of organic buffers is much lower. Generally,
cation/anion type and/or size have a specific impact on the retention behaviour of polar
compounds in CEC.
Chapter 5 describes the preparation of polymer monolithic CEC columns based on
poly(alkylmethacrylate). These columns were tested under HPLC and CEC conditions. All
columns showed reversed-phase characteristics of retention. Bulky molecules showed an
additional size-exclusion retention effect. Furthermore, using the basic compound
benzylamine as a test component, stationary phases showed higher silanol activity under
CEC conditions compared to HPLC.
Based on QSRR models, Chapter 6 compares the retention behaviour and the molecular
mechanism behind it under HPLC and CEC conditions in more detail. Detailed
comparative QSRR analysis revealed evidence for stronger non-specific dispersive
interactions between analytes and hydrocarbonaceous stationary phases in HPLC mode
compared to CEC conditions. In addition, higher silanol activity was observed under CEC
conditions compared to results obtained under HPLC conditions. Thermodynamic studies
in CEC in Chapter 7 reveal that structural changes within the stationary and the mobile
phase such as an increased organization of hydrocarbonaceous chains on the stationary
phase are imaginable under CEC conditions. Moreover, an increased mobile phase
organization in the CEC mode compared to the HPLC mode might be possible, too. This
was confirmed by the results of thermodynamic data obtained from non-polar and polar
solutes.

Summary - 215 -
Summarizing the retention mechanism in CEC, with respect to hydrophobicity, for the
same stationary and mobile phase combination in all cases this parameter is significantly
different under CEC compared to HPLC conditions. Concerning silanol activity, this
parameter also in most cases differs for a specific column and mobile phase combination
under CEC compared to HPLC conditions. These observations are confirmed by the
QSRR and thermodynamic results. In addition, different size exclusion effects for silica
based as well as organic monolithic columns have been observed between CEC and HPLC
conditions.
Chapters 8 and 9 focus on method development in CEC for two different groups of
compounds of different polarity viz. steroid hormones and basic central nervous system
drugs. Successful separations were developed and method protocols accessed. For steroids,
retention factor repeatabilities were found lower than 1% R.S.D. with detection limits as
low as 39.8 pg. For CNS drugs, run-to-run retention factor repeatabilities were found below
1.26% R.S.D with detection limits as low as 670 pg.
Finally, whether or not CEC will develop to a generally accepted routine analysis technique
strongly depends also on the development of a sufficient number of convinving
applications.

- 216 -

- 217 -
SAMENVATTING
Analytische technieken als elektroforese en chromatografie hebben reeds een lange traditie
in de wetenschap. De basis van de elektroforese vindt zijn oorsprong aan het eind van de
18e eeuw met de formulering van Michael Faraday's wetten van elektroforese. Daarnaast
werden de eerste chromatografische experimenten uitgevoerd aan het begin van de 20e
eeuw door Mikhail Semenowitch Tswett. Beide scheidingstechnieken ontwikkelden zich
snel gedurende de tweede helft van de 20e eeuw en hebben zich een plaats verworven als
hoogwaardige scheidingstechnieken. Daarom leek capillaire electrochromatografie (CEC)
als een hybride techniek van High Performance Liquid Chromatography (HPLC) en
Capillary Electrophoresis (CE) een doorbraak in de scheidingswetenschap te zijn. Het
gebruik van submicrondeeltjes om zeer hoge efficiencies te bereiken was in vergelijking tot
HPLC slechts één van de veelbelovende eigenschappen van CEC. Desondanks heeft de
toepassing van CEC vanaf het begin een aantal technische moeilijkheden opgeleverd, die
grootschalige toepassing in de routineanalyse belemmeren.
In hoofdstuk 1 en 2 wordt een grondig overzicht gegeven van de huidige status van CEC,
zoals theoretische overwegingen bij electro-osmose, huidige toepassing van stationaire en
mobiele fasen en ontwikkelde toepassingen. Verder worden in deze hoofdstukken een
aantal verwante vragen en antwoorden behandeld met betrekking tot de grondbeginselen
van CEC en de relatie hiervan met HPLC en CE. Geconcludeerd kan worden dat CEC een
hoog efficiënte scheidingstechniek is. Echter, het gebruik van conventionele stationaire
fasen in CEC is vanwege hun electro-osmotisch debiet (EOF) eigenschappen beperkt. De
nieuwe generatie stationaire fasen voor CEC is daarentegen ontwikkeld om meer tegemoet
te komen aan de huidige eisen. Submicrondeeltjes (< 1 µm) zijn met succes toegepast voor
het realiseren van hoge efficiencies zonder verlies van EOF. Wegens problemen, die
inherent zijn aan het pakkingproces, zijn tot nu toe echter slechts zeer korte kolommen
gepakt. In CEC kan een verscheidenheid aan mobiele fasen worden toegepast, hoewel tot
nu toe in de praktijk mobiele fasen, welke als organische modifier acetonitril en soms ook
methanol bevatten, een bevredigende EOF kunnen genereren. Er zijn inmiddels een aantal

- 218 - Samenvatting toepassingen in CEC ontwikkeld, echter de “robustness” en “ruggedness” van de
methoden blijven achter in vergelijking met HPLC methoden. Een aantal fundamentele
aspecten van CEC wordt besproken in hoofdstuk 3 tot 7.
Zoals beschreven in hoofdstuk 3 kunnen de karakteristieken van een kolom, zoals
hydrophobiciteit en silanolactiviteit, significant verschillen voor eenzelfde stationaire fase
afhankelijk of deze onder HPLC of CEC condities wordt gebruikt. Bovendien zijn deze
verschillen ook een functie van de aard en concentratie van de gebruikte organische
modifier. Mogelijke verschillende oriëntaties van de liganden aan de stationaire fase,
afhankelijk van het feit of de mobiele fase hydraulisch dan wel elektrisch voortbewogen
wordt, zijn aangevoerd als verklaring hiervoor. Deze waarnemingen kunnen ook verband
houden met het optreden van electro-osmotische wervelstromingen in poreuze stationaire
fasen, hetgeen eveneens de fasenverhouding kan beïnvloeden.
In hoofdstuk 4 wordt geconcludeerd dat anorganische buffers een grote invloed op het
chromatografische gedrag van CEC kolommen hebben, terwijl het effect van organische
buffers beduidend lager is. Over het algemeen hebben aard en/of afmetingen van de
kation/anion combinatie in de gebufferde mobiele fase een specifiek effect op het
retentiegedrag van polaire componenten in CEC.
In hoofdstuk 5 wordt de synthese van polymere monolithische CEC-kolommen op basis
van poly(alkylmethacrylaat) beschreven. Deze kolommen werden getest onder HPLC en
CEC condities. Alle kolommen vertoonden een significant reversed-phase retentiegedrag.
Grotere moleculen vertoonden bovendien ook een additioneel “size-exclusion” retentie-
effect. De silanolactiviteit gemeten voor de basische testcomponent benzylamine voor
stationaire fasen onder CEC condities is significant groter dan onder HPLC condities.
In hoofdstuk 6 worden retentiegedrag en het daarachter liggende moleculaire mechanisme
in CEC en HPLC met behulp van een QSRR-model beschreven. Gedetailleerde
vergelijkende QSRR-resultaten laten zien dat onder HPLC condities de niet-specifieke
interacties tussen componenten en apolaire stationaire fasen groter zijn onder HPLC dan
onder CEC condities. Bovendien blijkt de silanolactiviteit van de kolommen onder CEC
condities significant groter dan onder HPLC condities.
Thermodynamische studies, beschreven in hoofdstuk 7, laten zien dat er aanwijzigen voor
veranderingen in de ordering van stationaire en mobiele fasen onder CEC condities zijn. Er
zijn eveneens indicaties dat onder CEC condities een verhoogde ordering in de mobiele

Samenvatting - 219 -
fase kan optreden in vergelijking met HPLC. Resultaten van deze thermodynamische
studies bevestigen dat voor niet-polaire en polaire componenten.
De situatie met betrekking tot retentiemechanismen in CEC kan als volgt worden
samengevat: voor elke combinatie van stationaire en mobiele fasen is de hydrofobiciteit van
een kolom gemeten onder CEC-condities verschillend vergeleken met die bepaald onder
HPLC-condities. In vrijwel alle gevallen is dit ook van toepassing voor de silanolactiviteit
van deze combinaties van stationaire en mobiele fasen gemeten onder CEC- en HPLC-
condities. Deze waarnemingen worden bevestigd door de resultaten verkregen uit QSRR en
thermodynamische studies. Bovendien vertonen conventionele silica en ook organische
monolithische kolommen een verschillende sterische selectiviteit onder CEC- en HPLC-
condities.
De hoofdstukken 8 en 9 beschrijven de ontwikkeling van CEC methoden van de scheiding
van twee verschillende groepen componenten, steroïd hormonen en basische CNS
geneesmiddelen. Voor beide groepen componenten zijn methoden ontwikkeld en
protocollen vastgelegd. De herhaalbaarheid in de retentiefactor voor de steroïden bedraagt
minder dan 1% RSD en de detectielimiet 39,8 pg. Voor de CNS geneesmiddelen bedroeg
de herhaalbaarheid minder dan 1,26% RSD en de detectielimiet 670 pg.
De vraag tenslotte of CEC zich zal ontwikkelen tot een algemeen aanvaarde routinematige
analysetechniek zal mede sterk afhangen van het beschikbaar komen van een voldoende
aantal overtuigende toepassingen.

- 220 -

- 221 -
DANKWOORD
Graag breng ik een woord van dank uit aan prof.dr.ir. Carel A. Cramers voor de
gelegenheid die hij geboden heeft om mijn promotieonderzoek uit te voeren aan het
Laboratorium van Instrumentale Analyse aan de TU te Eindhoven. Mijn speciale dank
komt toe aan dr. Henk A. Claessens. Allereerst voor zijn stimulerende wijze van leiding
geven aan de afdeling waar ik mijn onderzoek verricht heb en de ondersteuning bij mijn
wetenschappelijk werk. Op de tweede plaats dank ik Henk graag voor zijn bereidwillige
ondersteuning aan het begin van de periode van mijn dagelijks leven in Nederland.
Tevens dank ik graag mijn collega's: Marion van Straten voor haar ondersteuning, zowel
binnen als buiten het laboratorium; Denise Tjallema-Dekker, speciaal voor haar
medewerking bij de druk van de artikelen en het proefschrift; en verder aan allen aan de
universiteiten van Tsjechië, Polen, Roemenië, Oekraïne en Frankrijk met wie ik een
vruchtbare en plezierige tijd heb doorgebracht.
Herewith I would like to thank Prof.dr.ir. Carel A. Cramers for giving me the opportunity
to perform post-graduate research at the Laboratory of Instrumental Analysis in
Eindhoven. My special thanks belong to dr. Henk A. Claessens for his leadership
throughout the years at TU Eindhoven and the good atmosphere I met there. I would like
to thank him particularly for kind help with my daily life in the Netherlands, with my
scientific work, with publication of scientific articles, for his good ideas that went further
than science only.
I would also like to thank my colleagues: Marion van Straten, for the great help in (and also
outside) the laboratory. I would like to thank Denise Tjallema-Dekker, especially for the
help with printing of the articles and the thesis and further all the colleagues from
universities from the Czech Republic, Poland, Rumania, Ukraine and France, I spent nice
moments with.

- 222 -

- 223 -
CURRICULUM VITAE
Jan Jiskra was born on January 1, 1973 in Turnov in the Czech Republic. In 1996 he
completed his Master degree study in analytical chemistry at the Charles University in
Prague, Czech Republic, with specialisation in high-performance liquid chromatography
and electrophoretic techniques. In the same year, he joined the group of Instrumental
Analysis of the Eindhoven University of Technology, The Netherlands.
At present, he works as a stability control officer at the pharmaceutical company Synthon in
Nijmegen, The Netherlands.

- 224 -

- 225 -
BIBLIOGRAPHY
1. V. Pacáková, K. Štulík, J. Jiskra, High-performance separations in the determination of
triazine herbicides and their residues, Journal of Chromatography A, 754 (1996) 17.
2. J. Jiskra, V. Pacáková, M. Tichá, K. Štulík, T. Barth, Use of capillary electrophoresis
and high-performance liquid chromatography for monitoring of glycosylation of the
peptides dalargin and desmopressin, Journal of Chromatography A, 761 (1997) 285.
3. M. Tichá, T. Trnka, V. Pacáková, J. Jiskra, L. Hauzerová, K. Ubik, T. Barth, Saccharide
derivatives of dalargin: physicochemical and biological evaluation of glycoconjugates,
Pept. 1996, Proc. Eur. Pept. Symp., 24th (1998), Meeting Date 1996, 827.
4. J. Jiskra, C. A. Cramers, M. Byelik and H. A. Claessens, Chromatographic properties of
reversed-phase stationary phases under pressure- and electro-driven conditions, Journal
of Chromatography A, 862 (1999) 121.
5. J. Jiskra, T. Jiang, H.A. Claessens, C.A. Cramers, Chromatographic properties of
reversed phase stationary phases under pressure and electro driven conditions. Effect
of buffer composition, Journal of Microcolumn Separations, 12 (2000) 530.
6. T. Jiang, J. Jiskra, H.A. Claessens, C.A. Cramers, Preparation and characterization of
monolithic polymer columns for capillary electrochromatography, Journal of
Chromatography A, 931 (2001) 215.
7. J. Jiskra, H.A. Claessens, C.A. Cramers, Thermodynamic behaviour in capillary
electrochromatography, accepted for publication in Journal of Separation Science.
8. J. Jiskra, H.A. Claessens, C.A. Cramers, Method development for the separation of
steroids by capillary electrochromatography, accepted for publication in Journal of Separation
Science.
9. J. Jiskra, H.A. Claessens, C.A. Cramers, Separation of basic central nervous system
drugs by capillary electrochromatography, accepted for publication in Journal of Separation
Science.
10. J. Jiskra, H.A. Claessens, C.A. Cramers, R. Kaliszan, Quantitative structure retention
relationships in comparative studies of behaviour of stationary phases under high-
performance liquid chromatography and capillary electrochromatography conditions,
submitted for publication in Journal of Chromatography A.

- 226 - 11. J. Jiskra, H.A. Claessens, C.A. Cramers, Stationary and Mobile Phases in Capillary
Electrochromatography, submitted for publication in Journal of Separation Science.


![Capillary thermostatting in capillary electrophoresis · Capillary thermostatting in capillary electrophoresis ... 75 µm BF 3 Injection: ... 25-µm id BF 5 capillary. Voltage [kV]](https://img.pdfslide.net/doc/110x75/5c176ff509d3f27a578bf33a/capillary-thermostatting-in-capillary-electrophoresis-capillary-thermostatting.jpg)