Embed Size (px)
Citation preview

Journal of Chromatography A, 895 (2000) 329–337www.elsevier.com/ locate /chroma
Capillary zone electrophoresis of a recombinant adenovirusa , a b a*Bruce Mann , Joseph A. Traina , Cynthia Soderblom , Peter K. Murakami ,
a a a a aElisabeth Lehmberg , Dennis Lee , John Irving , Eirik Nestaas , Erno Pungor Jr.aBerlex Laboratories, Inc., 15049 San Pablo Avenue, P.O. Box 4099, Richmond, CA 94804-0099, USA
bMassachusetts Institute of Technology, Cambridge, MA, USA
Abstract
Adenovirus preparations are used as vectors in a number of gene therapy clinical development programs. The success ofcommercial production of adenovirus will strongly depend on the development of methods to define the recombinant virusproduct by analysis as opposed to being defined by the manufacturing process. While most analytical techniques examineportions of the virus, e.g. proteins or DNA, ion-exchange chromatography has been used to separate intact virus at lowefficiency. A free zone capillary electrophoretic method was developed for high-efficiency separations of adenovirus 5.Experimental conditions such as buffer pH and concentration were explored which produced a high-efficiency separation inless than 20 min. The virus band was identified by collection of CE fractions and examination using a cell based assay.Initially, a single virus peak is found in fresh virus samples. After as little as one freeze–thaw in 13phosphate-bufferedsaline with 2% sucrose, the active virus migrates as a regular series of peaks. The nature of the virus modification leading tothe differing electrophoretic mobilities is presently under investigation. 2000 Elsevier Science B.V. All rights reserved.
Keywords: Adenovirus; Particle analysis; Buffer composition; Coated capillaries
1. Introduction the manufacturing process (process optimization,scale up, etc.) that potentially may affect product
Recombinant adenovirus preparations are used for quality. Ultimately, the recombinant adenovirusgene delivery in a growing number of clinical products are expected to reach the ‘‘well character-development programs in gene therapy. In support of ized–understood biologic product’’ regulatory statusthe anticipated commercial scale production of re- similar to the therapeutic proteins.combinant adenovirus, analytical tools have to be The adenovirus particle consists of a doubledeveloped to define the virus product. The goal of stranded 36 kilobase pair DNA molecule and at leastthe analytical improvements is to allow demonstra- 11 distinct structural proteins present in multipletion of product equivalency (comparability) by copies. The total number of protein molecules in thechemical, biochemical and in vitro biological meth- virus is estimated to be 2500, and they are heldods without (or with minimum) additional human together by non-covalent interactions [1–3]. A sys-clinical comparison studies. Such product equiva- tematic analysis should characterize the intact viruslency has to be demonstrated following changes in as well as its individual protein and DNA con-
stituents. The characterization of the intact virusrepresents a major analytical challenge due to its*Corresponding author. Tel.: 11-510-669-4945; fax: 11-510-complexity and its fragile nature. Intact viruses669-4920.
E-mail address: bruce [email protected] (B. Mann). (having icosahedral shape and diameter of approxi-]
0021-9673/00/$ – see front matter 2000 Elsevier Science B.V. All rights reserved.PI I : S0021-9673( 00 )00755-X

330 B. Mann et al. / J. Chromatogr. A 895 (2000) 329 –337
mately 90 nm) have been extensively studied by tained from Agilent Technologies (Palo Alto, CA,electron microscopy, crystallography [4–6] and by USA) and fitted into a 1003800 mm apertureimmunological methods to detect /verify surface Beckman cartridge. The capillary was 57 cm (effec-antigens on the virus [7,8]. There is, however, a lack tive length 50 cm)350 mm I.D. The temperature ofof physical and physicochemical methodologies to the capillary was controlled at 208C. Unless other-detect changes in the surface characteristics of the wise noted, the electrophoresis buffer was 25 mMvirus caused by post-translational and manufacturing sodium phosphate, pH 7.0 and the samples wererelated modifications, including denaturation, oxida- injected by applying 3.4 kPa pressure to the inlet vialtion, deamidation of proteins, proteolysis, changes in for 30 s. Reverse polarity at 29.5 kV (518 V/cm) wascarbohydrate structures, etc. used for the separations, the detector was at the
Capillary zone electrophoresis (CZE) has become anodic end of the capillary. Typical current duringa routinely used high resolution separation tool for separation was approximately 30–35 mA. The detec-proteins, peptides and DNA. The potential of CZE to tor signal at 214 nm was recorded and processed byanalyze macrobiologicals such as virus, bacteria [9] the P/ACE Station Software (Beckman Coulter)and red blood cells [10] was demonstrated a decade package.ago, but has not been exploited until recently [11–13]. The most significant problems to overcome in 2.2. Reagentsvirus analysis by CZE are adsorption of the virusparticles to the capillary and the positive identifica- 2-Amino-2-hydroxymethyl-1,3-propanediol (Tris),tion of the viral peaks in the electropherogram. tricine, HCl, sodium phosphate tribasic decahydrateThese problems were solved for Rhinovirus by and sodium phosphate monobasic monohydrate foradding detergents to the electrophoresis buffer and CZE separations were obtained from J.T. Bakeridentifying peaks by indirect methods such as heat (Phillipsburg, NJ, USA). Amyloglucosidase proteindenaturation, enzymatic treatments and biospecific standard, 3-(N-morpholino)propanesulfonic acidreactions performed before CZE analysis [12]. The (MOPS) and N-(2-hydroxyethyl)piperazine-N9-(2-objective of the present study was to establish CZE ethanesulphonic acid) (HEPES) were obtained frommethod for the analysis of recombinant adenovirus Sigma. Water for all buffer and wash solutions wastype 5 (Ad5). We sought to develop a separation obtained from a Milli-Q water purification systemmethod without the use of additives (detergents) in (Millipore, Bedford, MA, USA). All electrophoresisthe separation buffers to avoid potential artifacts due buffers were filtered through an Anotop 25 type 0.1to virus-detergent interactions. We also decided to mm filter (Whatman, Maidstone, UK).approach the problem of peak identification through Recombinant Ad5 preparations with differentdirect methods: collecting the peaks and subjecting transgenes were prepared at Berlex Biosciencesthem to high-sensitivity analyses, including poly- using HEK 293 or PER.C6 packaging cells adaptedmerase chain reaction (PCR) and biological activity to serum free medium and suspension culture,assays, to provide conclusive evidence for the pres- purified by anion-exchange chromatography andence of functional virus. ultrafiltration. Unless otherwise noted, we used Ad5
with a growth factor (FGF-4) transgene in the CZEseparations. The concentration of purified adenovirus
10 112. Experimental was typically between 10 and 10 particles /ml, asmeasured by RP-HPLC [14]. The virus samples were
2.1. Apparatus stored frozen in phosphate-buffered saline (PBS)12% sucrose12 mM MgCl and thawed before the2
A Beckman model P/ACE 5510 (Beckman Coul- analysis.ter, Fullerton, CA, USA) capillary electrophoresissystem equipped with a standard UV detector was 2.3. Proceduresused for all CZE experiments. Polyvinyl alcohol(PVA) capillaries with a 33bubble cell were ob- A new capillary was conditioned by flushing with
B. Mann et al. / J. Chromatogr. A 895 (2000) 329 –337 331
water for 5 min. Between runs, the capillary was filters (Millipore), and the filtrates were used toflushed with 60 mM HCl for 4 min by applying 13.8 infect HEK 293 cells cultured in DMEM with 10%kPa pressure. FBS in 12-well (22 mm diameter) tissue culture
All samples were filtered with Nanosep MF 0.45 plates (Corning, New York, USA). When significantmm micro-concentrators (Pall Filtron, Northborough, CPE was observed the remaining attached cells wereMA, USA). Unless otherwise noted, the samples dislodged by repeated pipetting. The resulting cellwere then dialyzed into 10 mM phosphate, pH 7.0 suspensions were exposed to two freeze–thaw cyclesbefore CZE analysis using a 8000 M cutoff mem- (2708C, 378C), and used to infect HEK 293 cellsr
2brane in a Tube-O-Dialyzer (Geno Technology, St. cultured in 225 cm cell culture flasks (Costar).Louis, MO, USA) with a 10 000-fold or greater When CPE was significant, flasks were struck tovolume excess and with a minimum dialysis time of dislodge remaining attached cells. Cell suspensions1 h. were centrifuged at 1000 rpm for 5 min in a micro-
Electrophoresis buffer (200 ml) was placed into centrifuge. Supernatants were removed by aspiration,the exit vial for the CZE fraction collection. The cell pellets were washed with Dulbecco’s phosphate-timing of collection was corrected for the time buffered saline (DPBS) (Life Technologies), andneeded for the sample to reach the vial from the cells were pelleted by centrifugation as before.detector (approximately 1.14 times the migration Washes were removed by aspiration, cell pelletstime to the detector). In some cases, the voltage was were resuspended in phosphate buffered saline withreduced to 5 kV during the elution and collection of 2 mM MgCl , and 2% sucrose, and processed2
peaks. After collection, 20 ml 103PBS and 20% through two freeze–thaw cycles. The resulting cellsucrose was added to the vial. If the samples were lysates were then centrifuged at 1000 rpm for 5 min.
onot immediately used they were stored at 270 C. The virus in the supernatant was purified using anViral infectivity was determined in an endpoint analytical ion-exchange procedure [17]. In short, the
dilution (EPD) format [15,16]. In short, HEK 293 samples were loaded onto a 1 ml Resource Qcells were plated on a 96-well microtiter plate (Pharmacia Biotech, Uppsala, Sweden) column(Costar, Corning, NY, USA) at 5000 cells /well in 25 equilibrated in 50 mM HEPES, 300 mM NaCl, pHml of 10% fetal bovine serum (FBS) (Hyclone Labs., 7.5. The virus was eluted in a linear gradient to 50Logan, UT, USA) in Dulbecco’s Modified Eagle mM HEPES, 600 mM NaCl, pH 7.5. The virusMedium (DMEM) (Life Technologies, Grand Island, fractions (eluting between 400 and 500 mM NaCl)NY, USA). Typically, an initial dilution of virus was were collected.made based on expected titer followed by 10 twofold Quantitative PCR was performed using the Taq-dilutions. The virus dilutions (replicates of 8) were Man Gold PCR kit (PE/ABI, Foster City, CA, USA),introduced to the cell plate at 25 ml /well. The plates with the standard mix assembled according to manu-were placed in a 5% CO incubator at 378C. facturer’s instructions. PCR were run in duplicate on2
Additional 60 ml 10% FBS (Life Technologies) in an ABI 7700 Sequence Detection System (PE/ABI)D-MEM was added to the wells at 24 h and an with each reaction containing 2 ml of viral stockadditional 100 uL at 4–6 days. The wells were solution. The primer and fluorogenic probe combina-visually scored for cytopathic effect (CPE, cells tions were designed using Primer Express softwarerounded in appearance, some detached from surface) (PE/ABI) to the FGF-4 transgene inserted into Ad5.on day 10–12. The pattern of positive and negative The primers /probe sequences used for the FGF-4wells was converted to apparent infectivity in infecti- transgene were: forward 59-caagctctatggctcgccc-39,ous units per ml (IFU/ml) by statistical analysis reverse 59-ggcgttgtagttgttgggaag-39, and probe[15,16]. The assay has been validated for precision, 59FAM-accgatgagtgcacgttcaaggagattct-TAMRA 39.the standard deviation is 60.2 log , corresponding Reactions were run in a total volume of 50 ml, with10
to 158% to 237%. 10 pmol of each primer per reaction. ThermocyclingFor virus expansion, CZE peak fractions were was performed for 40 cycles at 958C for 15 s, 638C
collected and diluted in D-MEM supplemented with for 1 min, after an initial denaturation of the virus for10% FBS, then passed through 0.22 mm syringe 10 min at 958C. Analysis was performed using SDS

332 B. Mann et al. / J. Chromatogr. A 895 (2000) 329 –337
software and relative concentrations determined peak at approximately 9–10 min and the minor,using a standard curve constructed by sequential (‘‘series’’) peaks in the 7–9 min interval weredilutions of FGF-4 DNA standards. consistently present in all batches of Ad5 tested
independent of the transgenes present. The peak atapproximately 3 min was determined to be a ‘‘sys-
3. Results and discussion tem’’ peak. This was also present in the buffer blankruns. In some electropherograms we observed small,
3.1. Capillary Selection broad peaks at about 12 and 14 min.
A variety of CZE conditions were unsuccessfully 3.2. Recovery of adenovirus during CZEtried with bare silica capillaries. No peaks weredetected. The loss of virus was most likely due to The recovery of viral activity using the PVAadsorption to the silica surfaces. Using a PVA coated coated capillary, as measured by the infectivity titer,capillary, several peaks could be observed and was first determined in a separation experiment usingtherefore we selected this capillary type for further a 27 cm capillary, applying low pressure (3.4 kPa), adevelopment. Fig. 1 shows a typical electropherog- separation voltage in reverse polarity (555 V/cm)ram obtained with a PVA coated capillary. The major and collecting the anionic and neutral fractions. The
4injected sample contained 3.8?10 infectious units(IU), the anionic and the neutral fractions had
4infectivities of 4.8?10 IU (126% recovery) and 3.9?310 IU (10% recovery), respectively. Within the
error of the infectivity assay, these results suggestthat adsorption of the virus to the capillary inner wallis very low (negligible) under the experimentalconditions and that the anionic species are respon-sible for the infectious activity.
An experiment was conducted to assign viralactivity to the peak(s) in the electropherogram. EightCZE runs were performed using the same virussample and fractions were collected for variouslengths of time starting between 0 and 10 min. Fig. 2shows the trace of the cumulative viral activitysuperimposed upon the electropherogram. Viral ac-tivity was found between 7 and 10 min where mostof the UV peaks are located.
In an identical experiment, peaks in the 0–10 mininterval were tested for their DNA content. Thebiologically active fractions were subjected to aquantitative PCR amplification. 84% of the injectedviral DNA was recovered in the eluted fractions bythis assay. Again, the fractions showing the most UVpeaks contained viral DNA as determined by PCR.
11Fig. 1. Typical electropherogram of a recombinant adenovirus An adenovirus concentration of 10 particles /mltype 5 carrying FGF-4 transgene (Ad5FGF-4). Conditions: 57 cm is equivalent to 12.9 mg protein II /ml (720 copies /(50 cm to detector)350 mm PVA capillary with 33bubble cell; virus [3], 108 000 M , [18]) and to 21.5 mg totalrelectrophoresis in 25 mM sodium phosphate pH 7.0; 29.5 kV (518
protein /ml (protein II is approximately 60% of theV/cm) in reverse polarity; detection UV 214 nm; pressure10 protein content of the virus, [3]). We used the Ainjection for 30 s at 3.4 kPa; virus in 10 mM Tris pH 7, 5?10 214
particles /ml. corrected peak area of amyloglucosidase as a protein

B. Mann et al. / J. Chromatogr. A 895 (2000) 329 –337 333
indicating no detectable loss of virus. (Filtration wasrequired for most samples to remove particles whichresulted in noise spikes in the electropherograms.)We obtained a virus recovery of 87% for the dialysisstep using RP-HPLC [14] to measure virus con-centration.
These results indicate (a) high recovery of theintact virus during CZE with PVA coated capillary,including sample preparation and (b) separation ofpure virus peaks (virus isoforms) appearing in the7–10 min region of the electropherogram. Theelectropherogram did not show any major UV peakthat could not be associated with viral activity.
3.3. Optimization of the CZE separation
Several experiments were performed to establishoptimal pH and ionic strength of the electrophoresisbuffer and optimal sample buffer composition. Weevaluated peak efficiencies and corrected peak areas(relative recoveries).
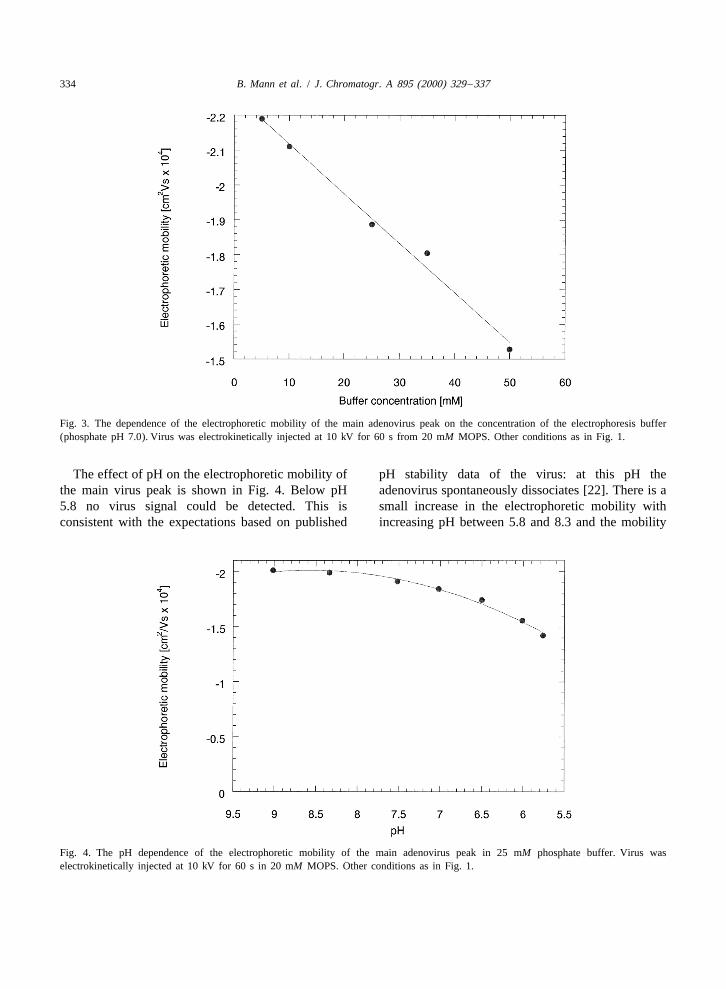
Electrophoresis buffer concentrations were variedFig. 2. Electropherogram of Ad5FGF-4 with superimposedcumulative viral activity of collected fractions. Separation con- from 5 to 50 mM at pH 7.0. We selected electro-ditions as in Fig. 1. Fractions collected and viral activity de- kinetic injection of virus from 20 mM MOPS, pH 7.0termined as given in section 2.3.
in order to eliminate the effect of varying sampleionic strength. Fig. 3 shows the expected linear
calibration standard to get an approximate quantita- relationship between the electrophoretic mobility oftion of the virus in the main peak and the ‘‘series’’ the main virus peak and buffer concentration. In-peaks. The absorbance of a protein at 214 nm is creasing ionic strength is expected to mask theprimarily determined by the number of amide bonds surface charge on the virus and to decrease mobility[19]. In this approximation, the contribution of some [20]. Since the inner wall is neutral, the endoosmoticamino acids and the viral DNA to the absorbance at flow is expected to be very low in this capillary.214 nm is omitted. The amyloglucosidase protein No change was observed in the pattern of the viralmigrates mainly as a single band at about 10.5 min peaks between buffer concentrations 5–35 mM,under the same experimental conditions as used for while significant peak broadening was observed at 50the virus. An adenovirus sample with a concentration mM (data not shown). This may be explained by the
10of 5?10 particles /ml, determined by a RP-HPLC detected increase in the separation current to 65–70analysis [14], was analyzed by CZE in triplicate. mA where Joule heating could become significant.Calculating the corrected peak areas (main and series The corrected peak area of the major peak increasedpeaks), the protein based estimates by the CZE for with increasing buffer concentration between 5 and
10 10the virus concentration were 5.9?10 , 2.4?10 and 25 mM and remained stable between 25 and 50 mM10 106.4?10 particles /ml (average 4.9?10 particles /ml, likely indicating adsorption of the virus to the
10standard deviation62.2?10 ). capillary wall at lower ionic strengths (data notThe recovery of the virus for the critical sample shown). This behavior is characteristic of large
preparation steps: filtration and dialysis was deter- proteins [21]. The recovery of the minor virus peaksmined independently. Virus peaks in the electro- as measured by the corrected peak areas showed thepherograms of filtered and unfiltered samples were same behavior as the main virus peak in response tofound to be indistinguishable (data not shown) the varying ionic strength (data not shown).
334 B. Mann et al. / J. Chromatogr. A 895 (2000) 329 –337
Fig. 3. The dependence of the electrophoretic mobility of the main adenovirus peak on the concentration of the electrophoresis buffer(phosphate pH 7.0). Virus was electrokinetically injected at 10 kV for 60 s from 20 mM MOPS. Other conditions as in Fig. 1.
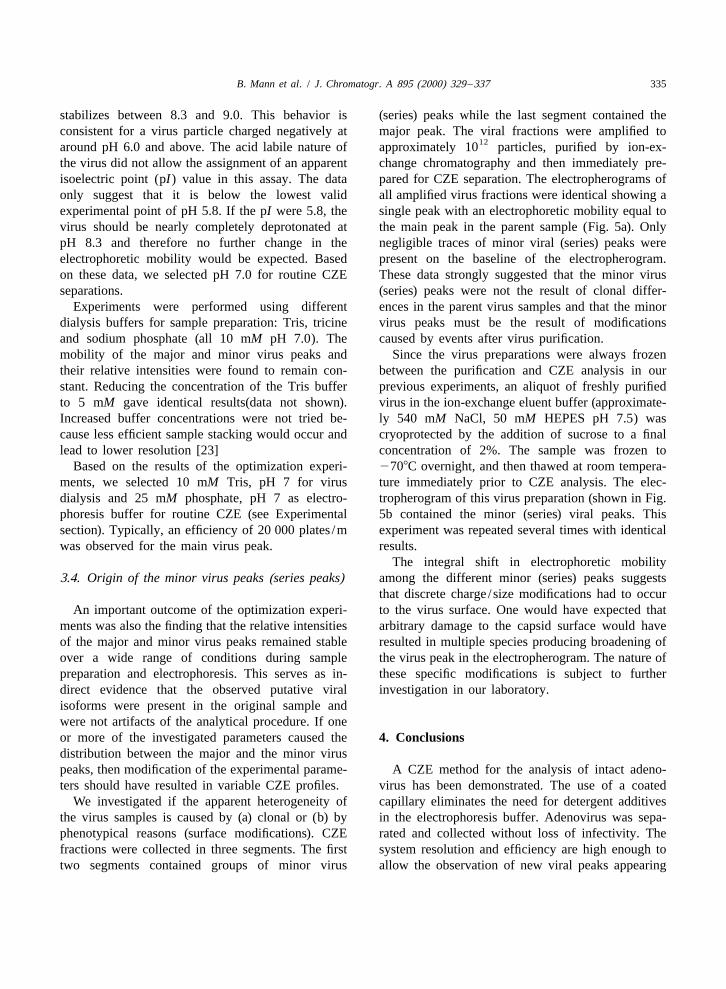
The effect of pH on the electrophoretic mobility of pH stability data of the virus: at this pH thethe main virus peak is shown in Fig. 4. Below pH adenovirus spontaneously dissociates [22]. There is a5.8 no virus signal could be detected. This is small increase in the electrophoretic mobility withconsistent with the expectations based on published increasing pH between 5.8 and 8.3 and the mobility
Fig. 4. The pH dependence of the electrophoretic mobility of the main adenovirus peak in 25 mM phosphate buffer. Virus waselectrokinetically injected at 10 kV for 60 s in 20 mM MOPS. Other conditions as in Fig. 1.
B. Mann et al. / J. Chromatogr. A 895 (2000) 329 –337 335
stabilizes between 8.3 and 9.0. This behavior is (series) peaks while the last segment contained theconsistent for a virus particle charged negatively at major peak. The viral fractions were amplified to
12around pH 6.0 and above. The acid labile nature of approximately 10 particles, purified by ion-ex-the virus did not allow the assignment of an apparent change chromatography and then immediately pre-isoelectric point (pI) value in this assay. The data pared for CZE separation. The electropherograms ofonly suggest that it is below the lowest valid all amplified virus fractions were identical showing aexperimental point of pH 5.8. If the pI were 5.8, the single peak with an electrophoretic mobility equal tovirus should be nearly completely deprotonated at the main peak in the parent sample (Fig. 5a). OnlypH 8.3 and therefore no further change in the negligible traces of minor viral (series) peaks wereelectrophoretic mobility would be expected. Based present on the baseline of the electropherogram.on these data, we selected pH 7.0 for routine CZE These data strongly suggested that the minor virusseparations. (series) peaks were not the result of clonal differ-
Experiments were performed using different ences in the parent virus samples and that the minordialysis buffers for sample preparation: Tris, tricine virus peaks must be the result of modificationsand sodium phosphate (all 10 mM pH 7.0). The caused by events after virus purification.mobility of the major and minor virus peaks and Since the virus preparations were always frozentheir relative intensities were found to remain con- between the purification and CZE analysis in ourstant. Reducing the concentration of the Tris buffer previous experiments, an aliquot of freshly purifiedto 5 mM gave identical results(data not shown). virus in the ion-exchange eluent buffer (approximate-Increased buffer concentrations were not tried be- ly 540 mM NaCl, 50 mM HEPES pH 7.5) wascause less efficient sample stacking would occur and cryoprotected by the addition of sucrose to a finallead to lower resolution [23] concentration of 2%. The sample was frozen to
Based on the results of the optimization experi- 2708C overnight, and then thawed at room tempera-ments, we selected 10 mM Tris, pH 7 for virus ture immediately prior to CZE analysis. The elec-dialysis and 25 mM phosphate, pH 7 as electro- tropherogram of this virus preparation (shown in Fig.phoresis buffer for routine CZE (see Experimental 5b contained the minor (series) viral peaks. Thissection). Typically, an efficiency of 20 000 plates /m experiment was repeated several times with identicalwas observed for the main virus peak. results.
The integral shift in electrophoretic mobility3.4. Origin of the minor virus peaks (series peaks) among the different minor (series) peaks suggests
that discrete charge /size modifications had to occurAn important outcome of the optimization experi- to the virus surface. One would have expected that
ments was also the finding that the relative intensities arbitrary damage to the capsid surface would haveof the major and minor virus peaks remained stable resulted in multiple species producing broadening ofover a wide range of conditions during sample the virus peak in the electropherogram. The nature ofpreparation and electrophoresis. This serves as in- these specific modifications is subject to furtherdirect evidence that the observed putative viral investigation in our laboratory.isoforms were present in the original sample andwere not artifacts of the analytical procedure. If oneor more of the investigated parameters caused the 4. Conclusionsdistribution between the major and the minor viruspeaks, then modification of the experimental parame- A CZE method for the analysis of intact adeno-ters should have resulted in variable CZE profiles. virus has been demonstrated. The use of a coated
We investigated if the apparent heterogeneity of capillary eliminates the need for detergent additivesthe virus samples is caused by (a) clonal or (b) by in the electrophoresis buffer. Adenovirus was sepa-phenotypical reasons (surface modifications). CZE rated and collected without loss of infectivity. Thefractions were collected in three segments. The first system resolution and efficiency are high enough totwo segments contained groups of minor virus allow the observation of new viral peaks appearing

336 B. Mann et al. / J. Chromatogr. A 895 (2000) 329 –337
Fig. 5. Electropherograms of Ad5FGF-4 (a) freshly isolated from cell lysate and (b) freeze–thawed from 2708C. Separation conditions as inFig. 1.
[5] P.L. Stewart, S.D. Fuller, R.M. Burnett, EMBO J. 12 (1993)after a freeze–thaw cycle indicating discrete (not yet2589.characterized) modifications to the viral surface. This
[6] D.J. Von Seggern, C.Y. Chiu, S.K. Fleck, P.L. Stewart, G.R.fingerprint, although not understood, is a useful toolNemerow, J. Virol. 73 (1999) 1601.
for the comparison of virus lots and the development [7] C.R. O’Riordan, A. Lachapelle, C. Delgado, V. Parkes, S.C.of new cryoprotectant formulations. Wadsworth, A.E. Smith, G.E. Francis, Hum. Gene Ther. 10
(1999) 1349.[8] W.-W. Zhang, R. Alemany, J. Wang, P.E. Koch, N.G.
Ordonez, J.A. Roth, Hum. Gene Ther. 6 (1995) 155.Acknowledgements[9] S. Hjerten, K. Elenbring, F. Kilar, J. Liao, A. Chen, C.
Siebert, M. Zhu, J. Chromatogr. 403 (1987) 47.The authors wish to thank Professor Csaba [10] A. Zhu, Y. Chen, J. Chromatogr. 470 (1989) 251.
´Horvath for his helpful suggestions. [11] U. Schnabel, F. Groiss, D. Blaas, E. Kenndler, Anal. Chem.68 (1996) 4300.
[12] V.M. Okun, B. Rohacher, D. Blaas, E. Kenndler, Anal.Chem. 71 (1999) 2028.
References [13] V.M. Okun, D. Blaas, E. Kenndler, Anal. Chem. 71 (1999)4480.
[1] J.V. Maizel Jr., D.O. White, M.D. Scharff,Virology 36 (1968) [14] E. Lehmberg, J.A. Traina, J.A. Chakel, R.-J. Chang, M.115. Parkman, M.T. McCaman, P.K. Murakami, V. Lahidji, J.W.
[2] R.M. Burnett, in: W. Chiu, R.M. Burnett, R.L. Garcea (Eds.), Nelson, W.S. Hancock, E. Nestaas, E. Pungor Jr., J. Chroma-Structural Biology of Viruses, Oxford University Press, togr. B 732 (1999) 411.Oxford, New York, 1997, p. 209. [15] L.K. Nielsen, G.K. Smyth, P.F. Greenfield, Cytotechnology 8
[3] J. van Oostrum, R.M. Burnett, J. Virol. 56 (1985) 439. (1992) 231.[4] P.L. Stewart, R.M. Burnett, M. Cyrklaff, S.D. Fuller, Cell 67 [16] N. Mittereder, K.L. March, B.C. Trapnell, J. Virol 70 (1996).
(1991) 145. [17] P.W. Shabram, D.D. Giroux, A.M. Gordeau, R.J. Gregory,
B. Mann et al. / J. Chromatogr. A 895 (2000) 329 –337 337
M.T. Horn, B.G. Huyghe, X. Liu, M.H. Nunnally, B.J. [21] K. Srinivasan, C. Pohl, N. Avdalovic, Anal. Chem. 69Sugarman, S. Sutjipto, Hum. Gene Ther. 8 (1997) 453. (1997) 2798.
[18] SWISS-PROT database (University of Geneva, http: [22] C. Nyberg-Hoffman, E. Aguilar-Cordova, Nature Med. 5/ /www.expasy.ch /sprot / sprot-top.html) accession number: (1999) 955.P04133. [23] S.F.Y. Li, Capillary Electrophoresis: Principles, Practice and
[19] R.R. Becklin, N.M. Desiderio, Anal. Lett. 12 (1995) 2175. Applications, Elsevier, Amsterdam, New York, 1993, p. 33.[20] E.C. Rickard, M.M. Strohl, R.G. Nielsen, Anal. Biochem.
197 (1991) 197.


![Capillary thermostatting in capillary electrophoresis · Capillary thermostatting in capillary electrophoresis ... 75 µm BF 3 Injection: ... 25-µm id BF 5 capillary. Voltage [kV]](https://img.pdfslide.net/doc/110x75/5c176ff509d3f27a578bf33a/capillary-thermostatting-in-capillary-electrophoresis-capillary-thermostatting.jpg)