Embed Size (px)
DESCRIPTION
t
Citation preview
Module-3
--------------------------------------------------UNIT 1 INVESTMENT DECISIONS---------------------------------------------------------------------------
Objectives
To identify long term investment decisions
To study the significance of Capital Budgeting
To torch on capital budgeting process
Unit outline
3.1.1 Introduction
Classification of investment decisions
Long-term investment decision or capital budgeting and
Short-term decision or Working capital decision.
Expenses comes under capital investment
3.1.2 Meaning of Capital Budgeting
3.1.3 Importance of Capital Budgeting
3.1.4 Capital Budgeting Process
--------------------------------------------------3.1.1 INTRODUCTION
---------------------------------------------------------------------------The investment decision is the most important of the firm's three major
decisions when it comes to the value creation. Investment decision relates to
the determination of total amount of assets to be held in the firm, the
composition of these assets like the amount of fixed assets, current assets
and the extent of business risk involved by the investors.
The investment decisions can be classified in to two groups: (1) Long-
term investment decision or capital budgeting and (2) Short-term decision or
Working capital decision.
In this module the long-term investment decision or capital budgeting is
discussed in detail. The capital budgeting decisions, require comparison of
cost against benefits over a long period. The investment made in capital
assets cannot be recovered in the short run. Such assets will generate
returns ranging from 2 to 20 years or more. Such investment decision
involve a careful consideration of various factors like profitability, safety,
liquidity and solvency etc. a business organisation has to face quite often the
problem of capital investment decisions. Capital investment refers to the
investment in projects whose results would generate revenue or earnings
from alter a year and it will continue for several numbers of years. The
following are the expenses which comes under capital investment are:
a) Replacements of old technology with new technology
ii) Expansion of production activity
iii) Diversification of products due to competition and for growth
iv) Research and Development expenditure
v) Miscellaneous expensed for installation of equipment, pollution control
equipment etc.
-------------------------------------------------- 3.1.2 MEANING OF CAPITAL BUDGETING ---------------------------------------------------------------------------
Capital budgeting is the process of making investment decisions in
capital expenditures. A capital expenditure refers to an expenditure whose
benefits are expected be received over period of time exceeding one year.
Charles T. Horngreen has defined capital budgeting as, "Capital
budgeting is long term planning for making and financing proposed capital
outlays".
Richard and Greenlaw have referred to capital budgeting as "acquiring
inputs with long-run return".
Lynch defines it as "Capital budgeting consists in planning
development of available capital for the purpose of maximising the long term
profitability of the concern."
-------------------------------------------------- 3.1.3 IMPORTANCE OF CAPITAL BUDGETING
---------------------------------------------------------------------------
A capital budgeting or investment decision involves huge capital on
capital assets of the concern. Any wrong decision in capital budgeting will
cost the organisation through its capital loss and also revenue loss of the
company. Hence this decision is so critical and important, the finance
manager should take special care in making these decisions. They are
a) It involves heavy funds. Capital budgeting decisions, generally,
involve large investment of limited funds. These funds are to be
invested properly. Hence it is important to plan and control these
funds.
b) These funds will have long term implications. Since the funds
are limited and also involves huge investments for long term or
permanent basis. Hence it involves more risks, it should be
properly managed.
c) Irreversible decisions. Once the investment is made on capital
assets, it is not possible to reverse the decisions without incurring
heavy losses.
d) Long term impact on profitability. Capital budgeting decisions
will have a long-term and significant effect on the profitability of a
concern. An unwise decision may prove disastrous and greater loss
to the organisation.
e) Difficulties of Investment decisions. The capital budgeting
decisions require an assessment of future events which are
uncertain, hence it is very difficult to estimate the probable events
it is very difficult to asses the probable costs, benefits accurately in
this dynamic environment.
f) It is national important. The investment decision taken by the
individual concern is of national importance because it generates
employment, economic activities and economic growth.
-------------------------------------------------- 3.1.4 CAPITAL BUDGETING PROCESS
---------------------------------------------------------------------------

Capital budgeting involves complex process because it involves
investment of current funds for achieving benefit in future and the future is
always uncertain. However, the following procedure may be adopted in the
process of capital budgeting:
1) Identification of Investment proposal. It is first and important stage in
the capital budgeting process. The proposal or the idea bout potential
investment opportunities may originate from top management or may
come from the any part of organisation structure. The ideas are
analysed by the departmental head in the light of the corporate
objectives and strategies.
2) Screening the proposals. Each proposal received by the department is
screened from various angles to see whether it is technically feasible,
amount of expenditure involved, returns generated, risks involved
etc.,
3) Evaluation of various proposals. the next stage is to evaluate the
various proposals received from the departments by using capital
budgeting techniques.
4) Fixing priorities. After evaluating various proposals, the unprofitable
or uneconomical proposals are rejected. Out of selected proposals
once again are listed on the basis of priorities after considering
urgency, risk and profitability of the proposal.
5) Final approval and preparation of capital expenditure budget. For the
approved proposal in the meeting the capital expenditure budget is
prepared. This budget lays down the amount of estimated expenditure
to be incurred on fixed assets during the budget period.
6) Implementing proposal. While implementing the project or proposal, it
is better to assign responsibilities for completing the project within the
given time frame and cost limit so as to avoid unnecessary delays and
cost over runs. Network techniques used in the project management
such as PERT and CPM can also be applied to control and monitor the
implementation of the projects.
7) Performance review. The last stage in the process of capital budgeting
is the evaluation of the performance of the project. The evaluation is
made through post completion audit by way of comparison of actual
expenditure on the project with the budgeted one. Any unfavourable
variances, if any should be looked into and the causes of the same be
identified so that corrective action may be taken in future.
--------------------------------------------------UNIT 2 METHODS OR TECHNIQUES OF CAPITAL BUDGETING
---------------------------------------------------------------------------
Objective
To understand the various techniques of Capital Budgeting
Unit outline
3.2.1 Technique that recognize Payback of Capital Employed:
Payback Period Method.
3.2.2 Techniques that use Accounting Profit for Project
evaluation:
a. Accounting Rate of Return method.
b. Earning Per Share.
3.2.3 Techniques that recognize Time Value of Money:
a. Net Present Value Method.
b. Internal Rate of Return Method.
c. Net Terminal Value Method.
d. Profitability Index Method.
e. Discounted Payback Period Method.
--------------------------------------------------UNIT 2 METHODS OR TECHNIQUES OF CAPITAL BUDGETING
---------------------------------------------------------------------------
Methods or techniques of capital budgeting or Investment
Appraisal Techniques
The techniques available for appraisal of investment proposal are classified
three heads:
I. Technique that recognize Payback of Capital Employed:
Payback Period Method.

II. Techniques that use Accounting Profit for Project evaluation:
c. Accounting Rate of Return method.
d. Earning Per Share.
III. Techniques that recognize Time Value of Money:
f. Net Present Value Method.
g. Internal Rate of Return Method.
h. Net Terminal Value Method.
i. Profitability Index Method.
j. Discounted Payback Period Method.
-------------------------------------------------------------------------------
3.2.1 Technique that recognize Payback of Capital Employed
---------------------------------------------------------------------------
Payback Period Method.
The term payback refers to the period in which the project will
generate the necessary cash to recover the initial investment. For example,
if a project requires Rs. 30,000 as initial investment and it will generate an
annual cash inflow of Rs. 6,000 for ten years, the pay back period will be 5
years, it is calculated as follows:
Initial InvestmentPay back period = -------------------
Annual Cash Inflow
Rs 30,000= ------------
Rs 6,000
Cash inflow is calculated by taking into profits from the project before depreciation and
after Tax.When the cash inflow is uneven then the payback period is calculated bu cumulative
cash inflows and by interpolation, the exact payback period can be calculated. For example, if
the project requires an initial investment of Rs. 40,000 and the annual cash inflows for 5 years
are Rs. 12,000, Rs, 10,000, Rs. 14,000, Rs. 11,000 and Rs. 9,000 respectively, the pay back
period will be calculated as follows:
Year Cash inflows
(in Rs)
Cumulative cash inflows
(in Rs)
1
2
3
4
5
12,000
10,000
14,000
11,000
9,000
12,000
22,000
36,000
47,000
56,000
From the above table we are clear that in 3 years Rs. 36,000 has been
recovered. Rs. 4,000 is left out of initial investment. In the fourth year the
cash inflow is Rs. 11,000. It means the pay back period is between three to
four years calculated as follows.
Amount to be recoveredPay back period = 3 years + -------------------------------------
Amount available in the next year.
= 3 + 4,000/ 11,000
= 3.33 years.
Advantages of Pay back period
a. The main advantage of this method is that it is simple to understand
and easy to calculate.
b. In this method, as a project with a shorter pay back period is
preferred to the one having a longer pay back period. Hence the
project of loss from quick obsolescence can be overcome from this
method.
c. This method gives an indication to the prospective investors
specifying when their funds are likely to be repaid.
d. This method is suitable when the future is very uncertain.
Disadvantages
a. This method does not take into account the cash inflows earned
after the pay back period and the true profitability of the projects
cannot be correctly assessed.
b. This method ignores the time value of money and does not
consider the magnitude and timing of cash in flows.
c. It does not take into consideration the cost of capital which is a
very important factor in making sound investment decisions.
d. It treats each asset individually in isolation with other assets which
is not feasible in real practice.
e. This method does not consider the salvage value of an investment.
---------------------------------------------------------------------------
3.2.2 Techniques that use Accounting Profit for Project evaluation
--------------------------------------------------------------------------
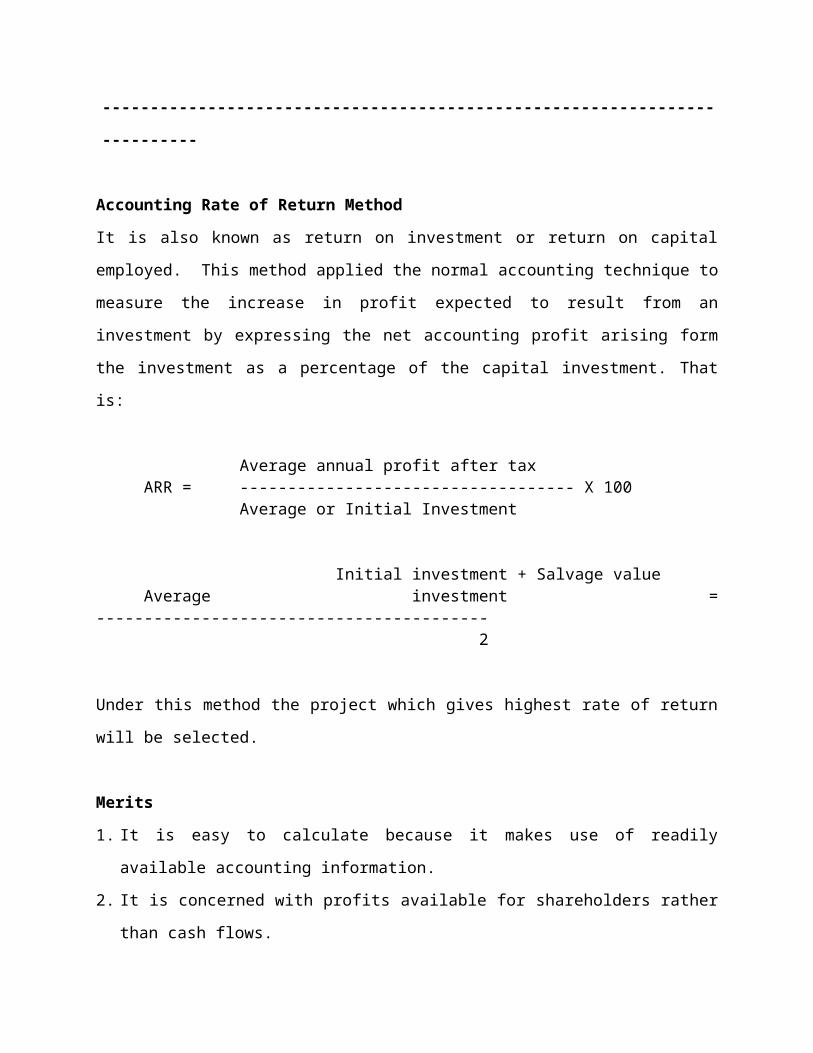
Accounting Rate of Return Method
It is also known as return on investment or return on capital employed. This
method applied the normal accounting technique to measure the increase in
profit expected to result from an investment by expressing the net
accounting profit arising form the investment as a percentage of the capital
investment. That is:

Average annual profit after taxARR = ----------------------------------- X 100
Average or Initial Investment
Initial investment + Salvage valueAverage investment = -----------------------------------------
2
Under this method the project which gives highest rate of return will be
selected.
Merits
1. It is easy to calculate because it makes use of readily available
accounting information.
2. It is concerned with profits available for shareholders rather than cash
flows.
3. This method takes into consideration all the years profit throughout its
life.
4. Quick decision of capital investment proposals is possible.
5. If high profits are required, this is certainly a way of achieving them.
Demerits
1. It does not take into account the time value of money.
2. It uses the straight line method of depreciation. Once this method is
changed the method will not be easy to use.
3. It is biased against short-term projects in the same way that payback is
biased against longer-term ones.
4. There are different methods for calculating the accounting rate of return
due to diverse concepts of investments as well as earnings. Each method
gives different results. This reduces the reliability of the method.
-------------------------------------------------------------------------------
3.2.3 Techniques that recognize Time Value of Money
--------------------------------------------------------------------------

Net present Value Method
This is generally considered to be the best method for evaluating the
capital investment proposals. In this method first cash inflows and cash
outflows associated with each project are worked out. The present value of
these cash inflows and outflows are then calculated at the rate of return
acceptable to the management. This rate of return is considered as the cut-
off rate and is generally determined on the basis of cost of capital adjusted
risk element in the project. The Net Present Value (NPV) is the difference
between the total present value of future cash inflows and the total present
value of future cash outflows.
The Net Present Value can be used as an 'accept or reject' criterion. In
case the NPV is positive the project should be accepted. If the NPV is
negative, the project should be rejected.
Merits
1. It recognises the time value of money and is suitable to be applied ina
situation with uniform or uneven cash inflows even at different periods of
time.
2. It takes into account the earnings over the entire life of the project and
the true profitability of the profit can be evaluated.
3. It takes into consideration the objective of maximum profitability.
Demerits
1. As compared to traditional method, the NPV method is more difficult to
understand and operate.
2. It is not easy to determine an appropriate discount rate.
3. The method is based on the presumption that cash inflow can be invested
at the discounting rate in the new projects. But this presumption does not
always hold good because it all depends upon the available investment
opportunities.
Internal Rate of Return (IRR)
Internal Rate of Return is that rate at which the sum of discounted
cash inflows equals the sum of discounted cash outflows. In other words, it is
the rate which discounts the cash flows to zero. It is also known as time
adjusted rate of return method or trial and error yield method.
Merits
It also takes into account the present value of money.
It considers the profitability of the project for its entire economic life and
hence enables evaluation of true profitability.
The determination of cost of capital is not a pre-requisite for the use of this
method and hence it is better than NPV method where the cost of capital
cannot be determined easily.
It provides for uniform ranking of various proposals due to the percentage
rate of return.
Demerits
1. It is difficult to understand and is the most difficult method of evaluation
of investment proposals.
2. This method is based upon the assumption that the earnings are
reinvested at the internal rate of return for the remaining life of the
project, which is not a justified assumption.
3. The results of NPV method and IRR method may differ when the projects
under evaluation differ in their size, life and timings of cash flows.
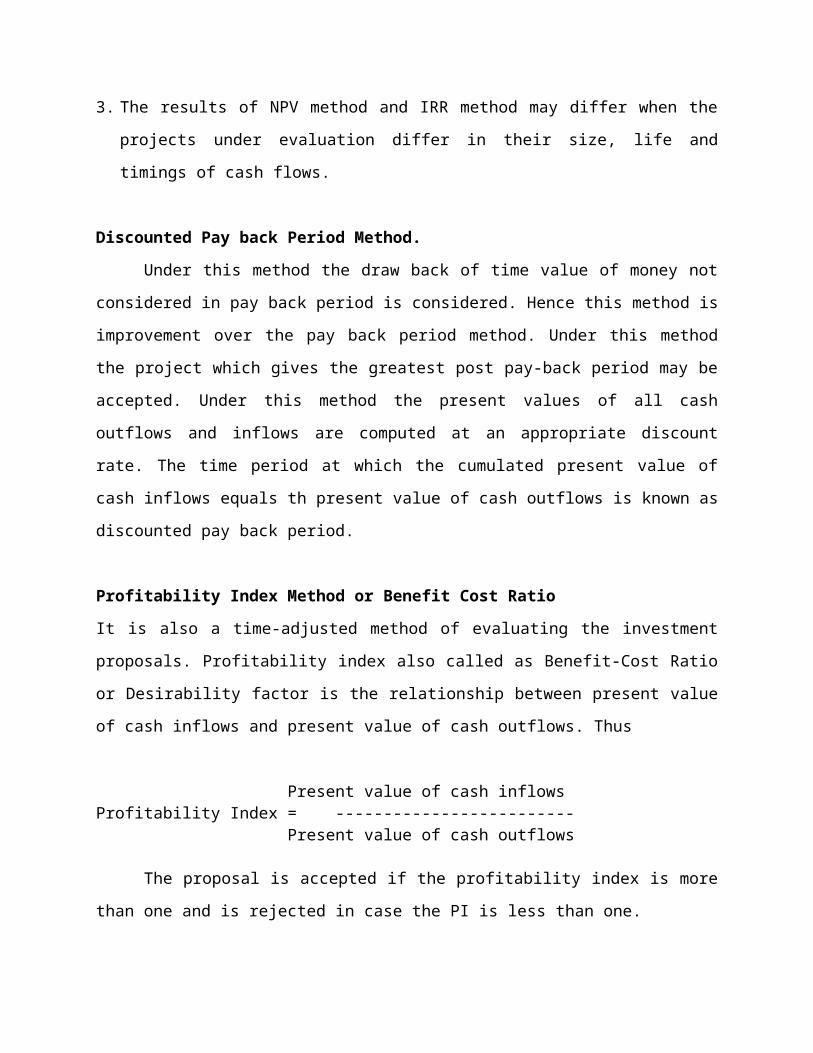
Discounted Pay back Period Method.
Under this method the draw back of time value of money not
considered in pay back period is considered. Hence this method is
improvement over the pay back period method. Under this method the
project which gives the greatest post pay-back period may be accepted.
Under this method the present values of all cash outflows and inflows are
computed at an appropriate discount rate. The time period at which the
cumulated present value of cash inflows equals th present value of cash
outflows is known as discounted pay back period.
Profitability Index Method or Benefit Cost Ratio
It is also a time-adjusted method of evaluating the investment proposals.
Profitability index also called as Benefit-Cost Ratio or Desirability factor is the
relationship between present value of cash inflows and present value of cash
outflows. Thus
Present value of cash inflowsProfitability Index = -------------------------
Present value of cash outflows
The proposal is accepted if the profitability index is more than one and
is rejected in case the PI is less than one.
--------------------------------------------------UNIT 3 PROBLEMS ON CAPITAL BUDGETING
---------------------------------------------------------------------------
Objectives
To give practical exposure to the working of capital budgeting
To help in decision making process, in selecting a best method of capital
budgeting
To know the working knowledge of these methods
Unit outline
3.3.1 Problems on capital budgeting
Payback period
Accounting Rate of Return
Net Present Value
Internal Rate of Return
Profitability index
-------------------------------------------------------------------------------
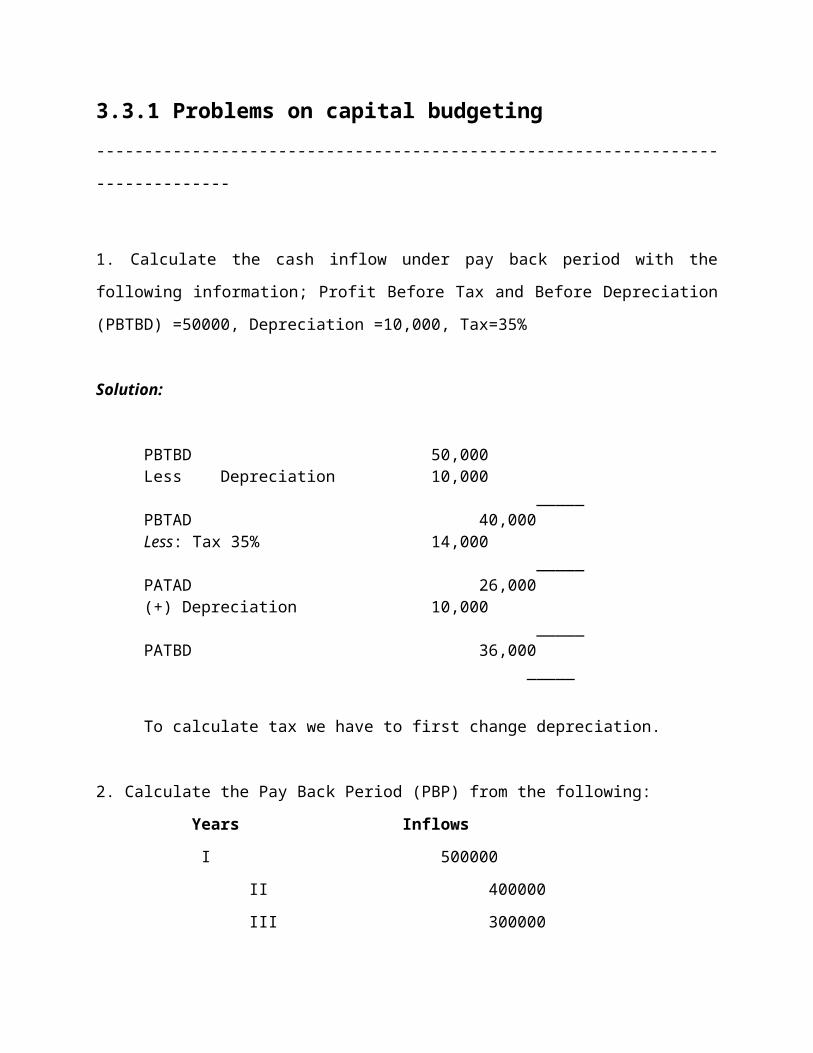
3.3.1 Problems on capital budgeting
-------------------------------------------------------------------------------
1. Calculate the cash inflow under pay back period with the following
information; Profit Before Tax and Before Depreciation (PBTBD) =50000,
Depreciation =10,000, Tax=35%
Solution:
PBTBD 50,000Less Depreciation 10,000
_____PBTAD 40,000Less: Tax 35% 14,000
_____PATAD 26,000(+) Depreciation 10,000
_____PATBD 36,000
_____
To calculate tax we have to first change depreciation.
2. Calculate the Pay Back Period (PBP) from the following:
Years Inflows
I 500000
II 400000

III 300000
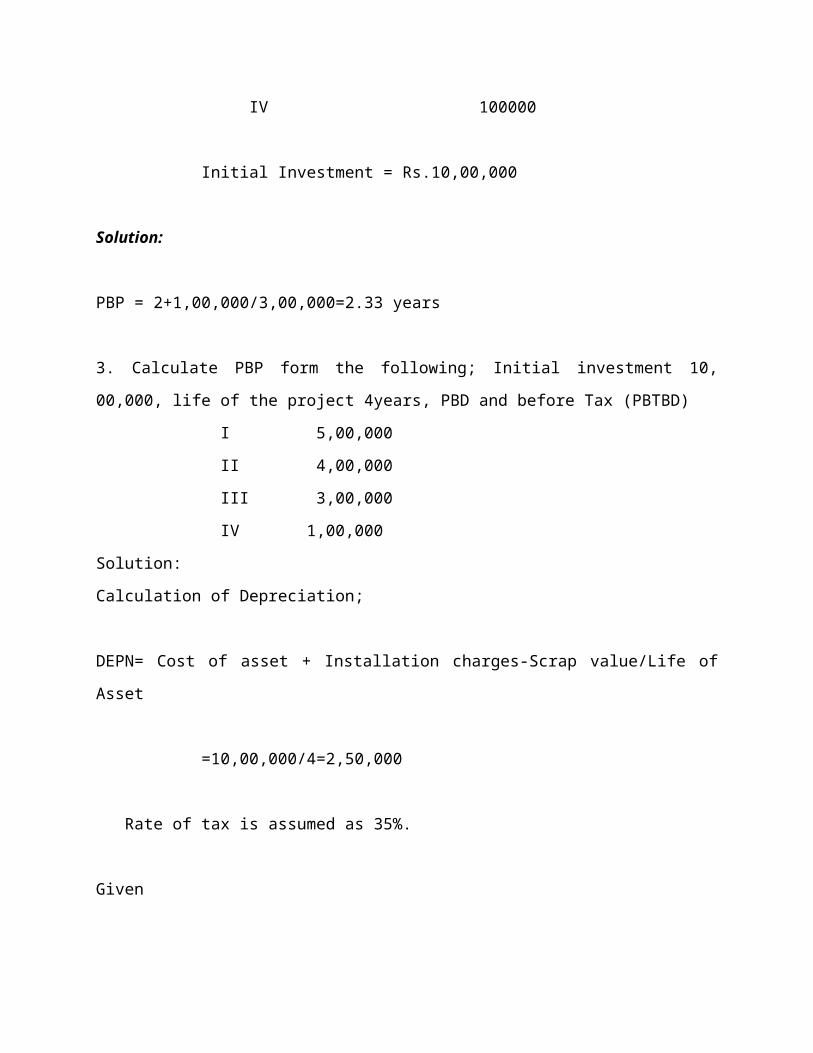
IV 100000
Initial Investment = Rs.10,00,000
Solution:
PBP = 2+1,00,000/3,00,000=2.33 years
3. Calculate PBP form the following; Initial investment 10, 00,000, life of the
project 4years, PBD and before Tax (PBTBD)
I 5,00,000
II 4,00,000
III 3,00,000
IV 1,00,000
Solution:
Calculation of Depreciation;
DEPN= Cost of asset + Installation charges-Scrap value/Life of Asset
=10,00,000/4=2,50,000
Rate of tax is assumed as 35%.
Given
Year PBTBD (-) Depn. PBTAD (-) Tax 35% PATAD (+)Dep. PATBD
I 500000 250000 250000 87500 162500 250000 412500
II 400000 250000 150000 52500 97500 250000 347500
III 300000 250000 50000 17000 32500 250000 282500
IV 100000 250000 (150000) - (150000) 250000 100000
PBP=2+2,40,000/2,82,500 (2,40,000=10,00,000-7,60,000)
= 2.85 Years
4. A Project involves the investment of Rs. 500000 which yields PADAT as
stated below:
Years PATAD
I 25000
II 37500
III 62500
IV 65000
V 40000
At the end of 5 years the machinery in the project can be sold for 40,000.
The cut-off rate is 8%. Suggest the management whether or not to accept
the proposal based on ARR.
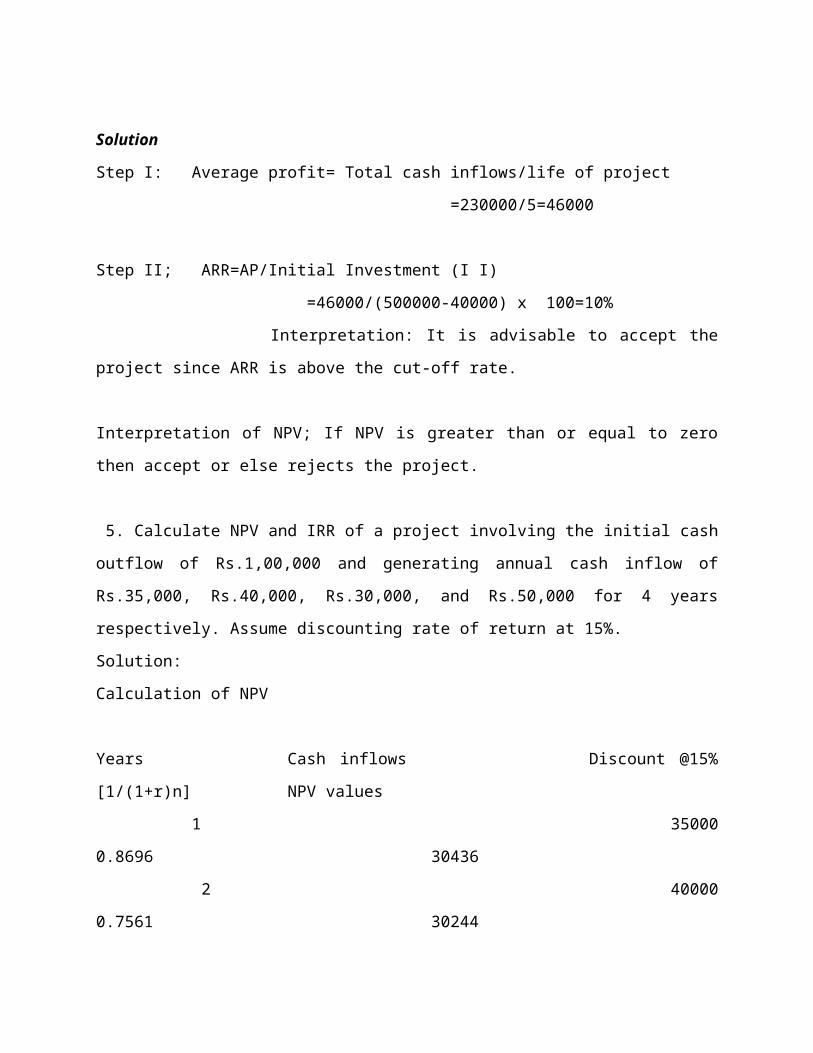
Solution
Step I: Average profit= Total cash inflows/life of project
=230000/5=46000
Step II; ARR=AP/Initial Investment (I I)
=46000/(500000-40000) x 100=10%
Interpretation: It is advisable to accept the project since ARR is
above the cut-off rate.
Interpretation of NPV; If NPV is greater than or equal to zero then accept or
else rejects the project.
5. Calculate NPV and IRR of a project involving the initial cash outflow of
Rs.1,00,000 and generating annual cash inflow of Rs.35,000, Rs.40,000,
Rs.30,000, and Rs.50,000 for 4 years respectively. Assume discounting rate
of return at 15%.
Solution:
Calculation of NPV
Years Cash inflows Discount @15% [1/(1+r)n] NPV values
1 35000 0.8696 30436
2 40000 0.7561 30244
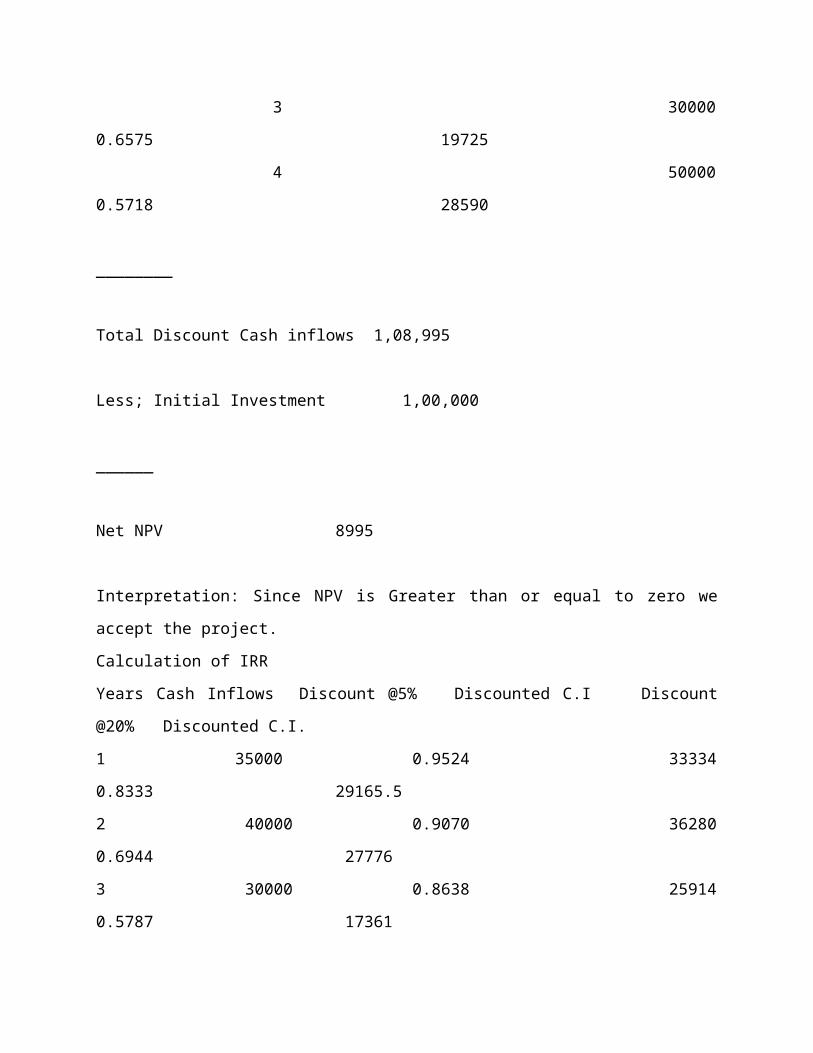
3 30000 0.6575 19725
4 50000 0.5718 28590
________
Total Discount Cash inflows 1,08,995
Less; Initial Investment 1,00,000
______
Net NPV 8995
Interpretation: Since NPV is Greater than or equal to zero we accept the
project.
Calculation of IRR
Years Cash Inflows Discount @5% Discounted C.I Discount @20% Discounted C.I.
1 35000 0.9524 33334 0.8333 29165.5
2 40000 0.9070 36280 0.6944 27776
3 30000 0.8638 25914 0.5787 17361
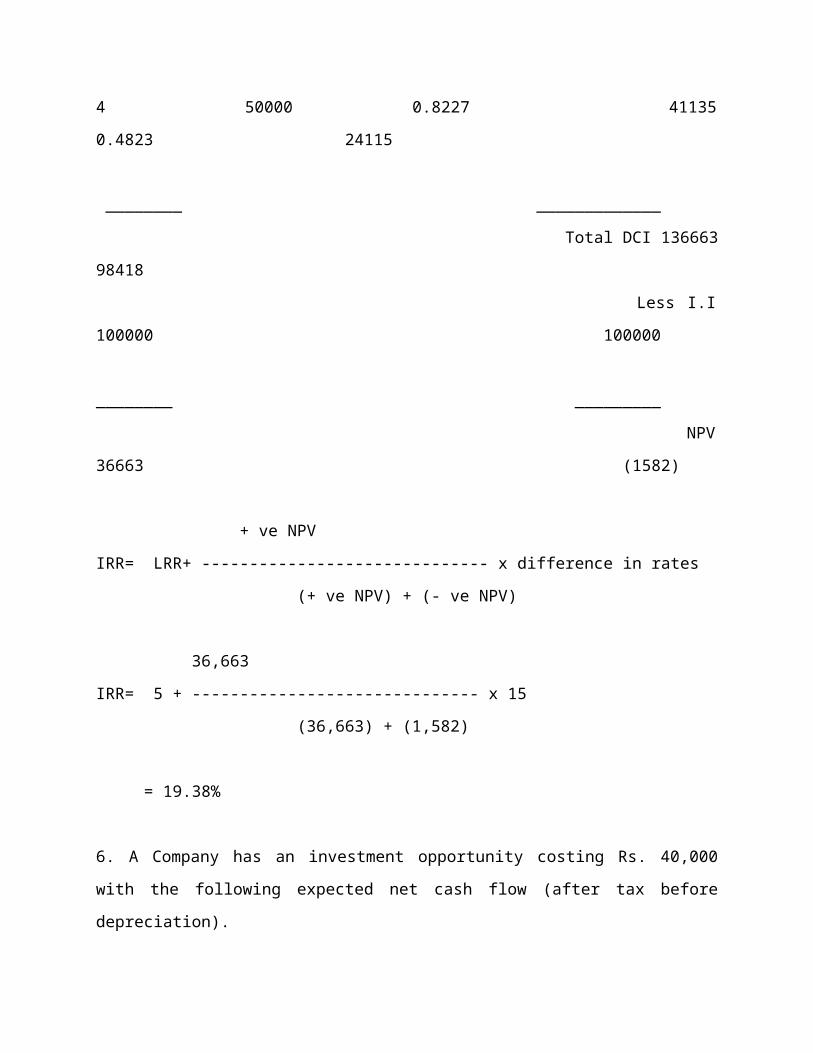
4 50000 0.8227 41135 0.4823 24115
________ _____________
Total DCI 136663 98418
Less I.I 100000 100000
________ _________
NPV 36663 (1582)
+ ve NPV
IRR= LRR+ ------------------------------ x difference in rates
(+ ve NPV) + (- ve NPV)
36,663
IRR= 5 + ------------------------------ x 15
(36,663) + (1,582)
= 19.38%
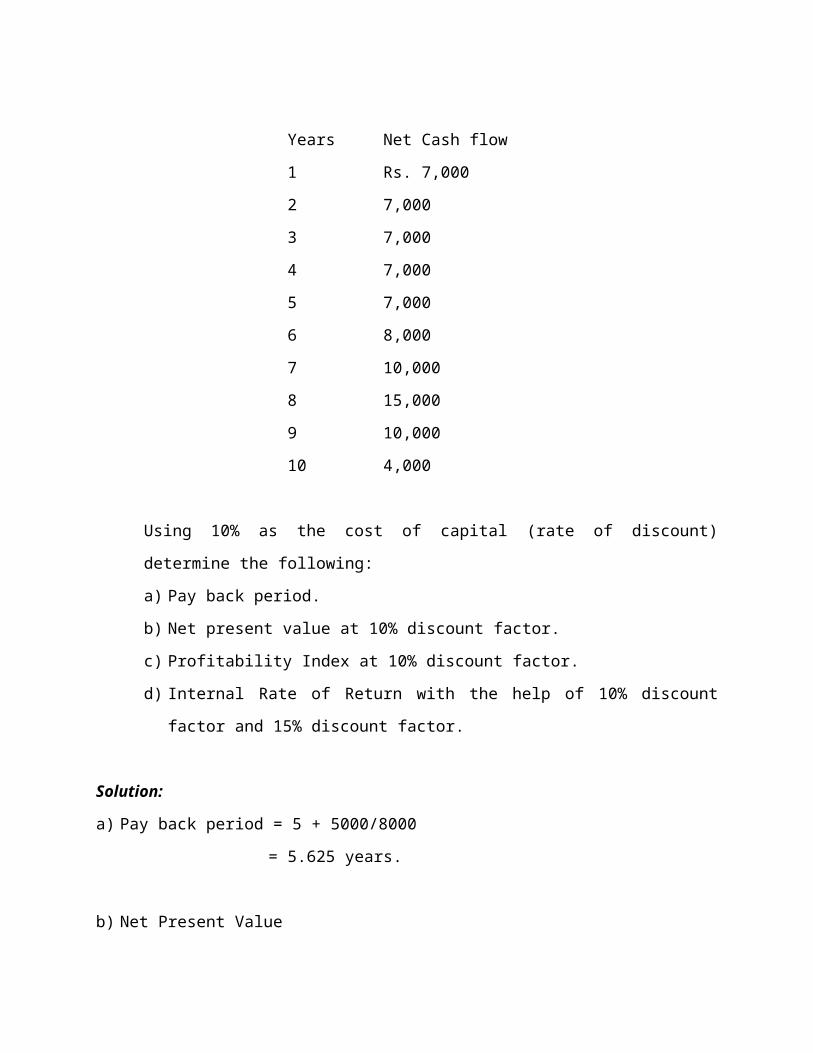
6. A Company has an investment opportunity costing Rs. 40,000 with the
following expected net cash flow (after tax before depreciation).
Years Net Cash flow
1 Rs. 7,000
2 7,000
3 7,000
4 7,000
5 7,000
6 8,000
7 10,000
8 15,000
9 10,000
10 4,000
Using 10% as the cost of capital (rate of discount) determine the
following:
a) Pay back period.
b) Net present value at 10% discount factor.
c) Profitability Index at 10% discount factor.
d) Internal Rate of Return with the help of 10% discount factor and
15% discount factor.
Solution:
a) Pay back period = 5 + 5000/8000
= 5.625 years.
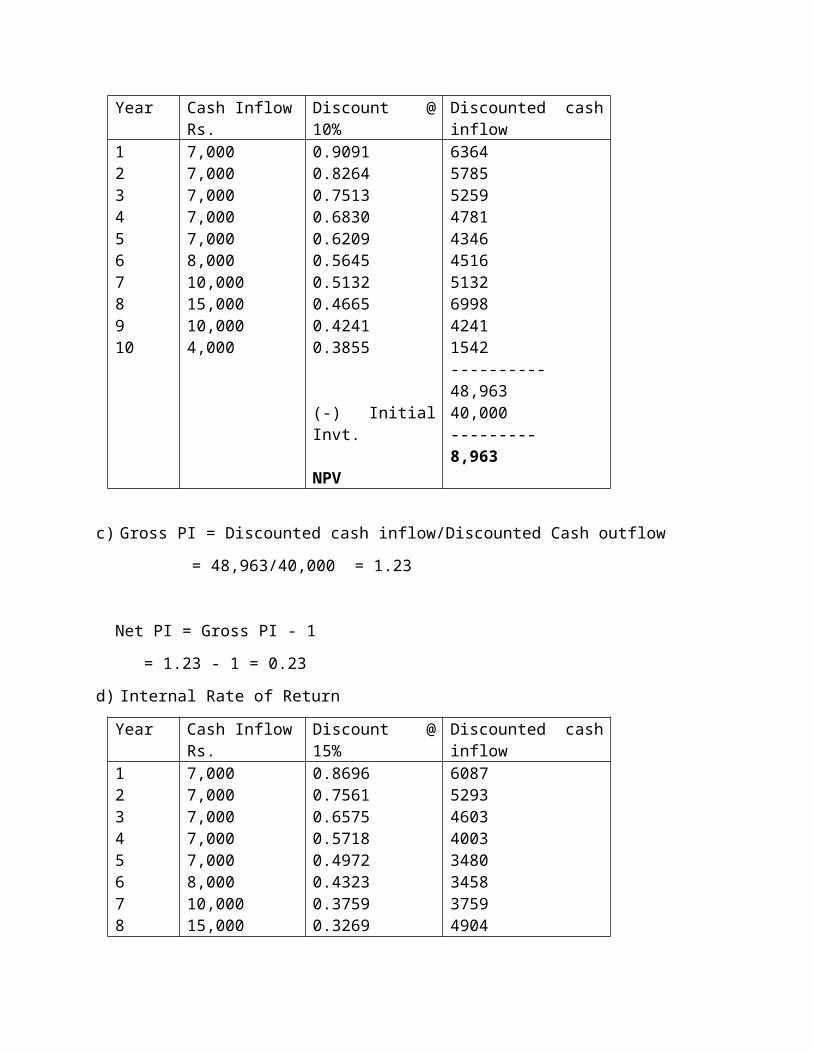
b) Net Present Value
Year Cash Inflow Rs.
Discount @ 10%
Discounted cash inflow
12345678910
7,0007,0007,0007,0007,0008,00010,00015,00010,0004,000
0.90910.82640.75130.68300.62090.56450.51320.46650.42410.3855
(-) Initial Invt.
NPV
6364578552594781434645165132699842411542----------48,96340,000---------8,963
c) Gross PI = Discounted cash inflow/Discounted Cash outflow
= 48,963/40,000 = 1.23
Net PI = Gross PI - 1
= 1.23 - 1 = 0.23
d) Internal Rate of Return
Year Cash Inflow Rs.
Discount @ 15%
Discounted cash inflow
1234567
7,0007,0007,0007,0007,0008,00010,000
0.86960.75610.65750.57180.49720.43230.3759
6087529346034003348034583759
8910
15,00010,0004,000
0.32690.28430.2472
Less Initial Invt.
(-)ve NPV
49042843989--------39,41840,000
--------(-) 582
+ ve NPV
IRR= LRR+ ------------------------------ x difference in rates
(+ ve NPV) + (- ve NPV)
8,963
IRR= 10 + ------------------------------ x (15 - 10)
8,963 + 582
= 14.695 %
7. The L Company Ltd, is considering the purchase of a new machine. Two
alternative machines (A&B0 have been suggested each costing Rs. 4,00,000.
Earnings after taxation but before depreciation are expected to be as
follows:
Year Machine A Machine B
1
2
3
4
5
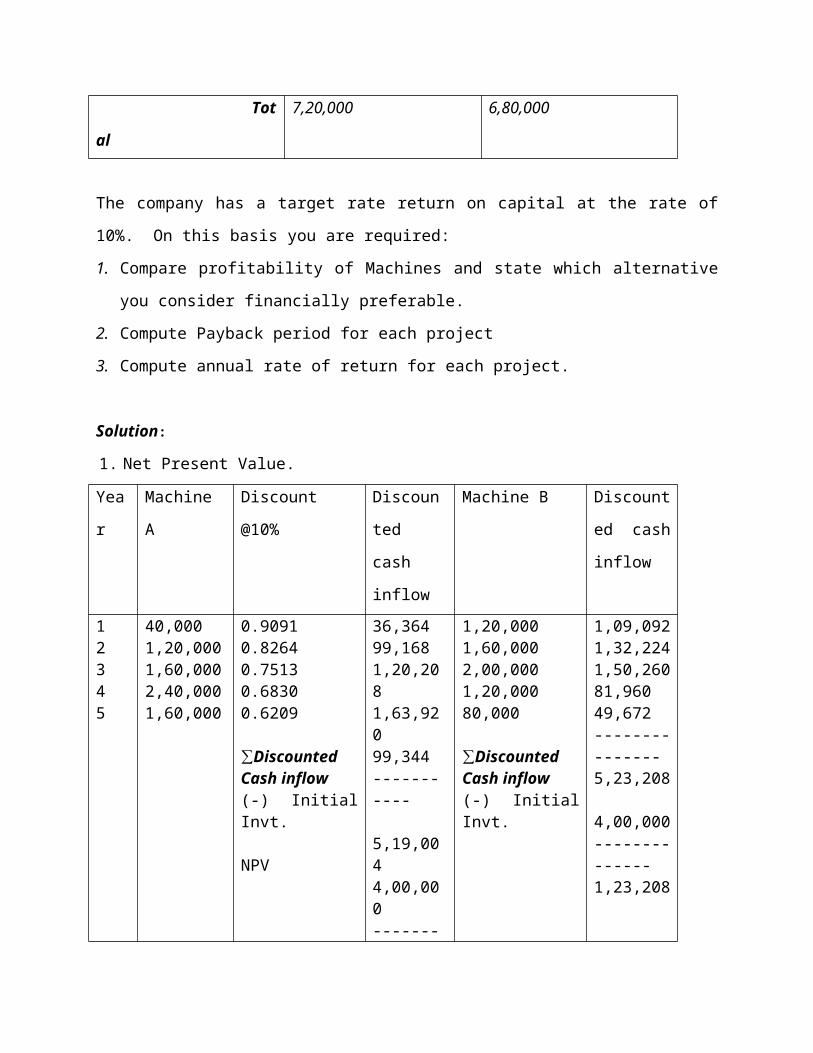
Total
40,000
1,20,000
1,60,000
2,40,000
1,60,000
7,20,000
1,20,000
1,60,000
2,00,000
1,20,000
80,000
6,80,000
The company has a target rate return on capital at the rate of 10%. On this
basis you are required:

1. Compare profitability of Machines and state which alternative you
consider financially preferable.
2. Compute Payback period for each project
3. Compute annual rate of return for each project.
Solution:
1. Net Present Value.
Yea
r
Machine
A
Discount
@10%
Discount
ed cash
inflow
Machine B Discount
ed cash
inflow
12345
40,0001,20,0001,60,0002,40,0001,60,000
0.90910.82640.75130.68300.6209
∑Discounted Cash inflow (-) Initial Invt.
NPV
36,36499,1681,20,2081,63,92099,344-----------
5,19,0044,00,000------------1,19,004
1,20,0001,60,0002,00,0001,20,00080,000
∑Discounted Cash inflow(-) Initial Invt.
1,09,0921,32,2241,50,26081,96049,672---------------5,23,208
4,00,000--------------1,23,208
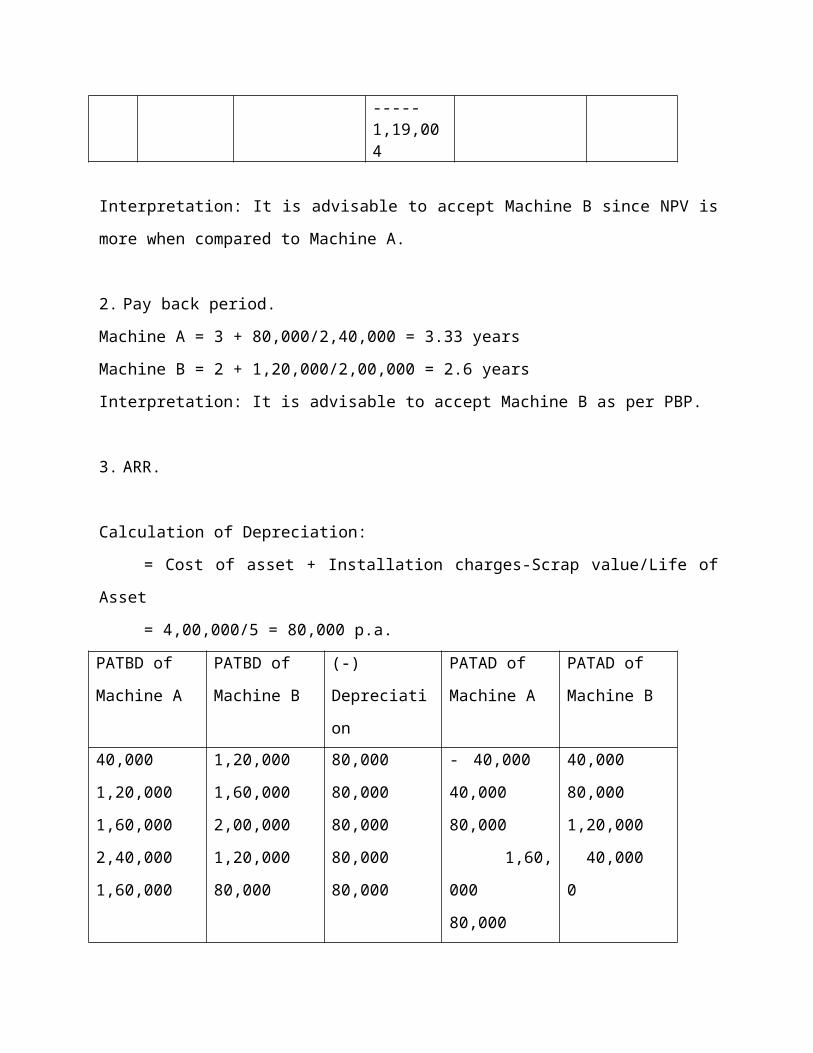
Interpretation: It is advisable to accept Machine B since NPV is more when
compared to Machine A.
2. Pay back period.
Machine A = 3 + 80,000/2,40,000 = 3.33 years
Machine B = 2 + 1,20,000/2,00,000 = 2.6 years
Interpretation: It is advisable to accept Machine B as per PBP.
3. ARR.
Calculation of Depreciation:
= Cost of asset + Installation charges-Scrap value/Life of Asset
= 4,00,000/5 = 80,000 p.a.
PATBD of
Machine A
PATBD of
Machine B
(-)
Depreciation
PATAD of
Machine A
PATAD of
Machine B
40,000
1,20,000
1,60,000
2,40,000
1,60,000
1,20,000
1,60,000
2,00,000
1,20,000
80,000
80,000
80,000
80,000
80,000
80,000
- 40,000
40,000
80,000
1,60,000
80,000
40,000
80,000
1,20,000
40,000
0
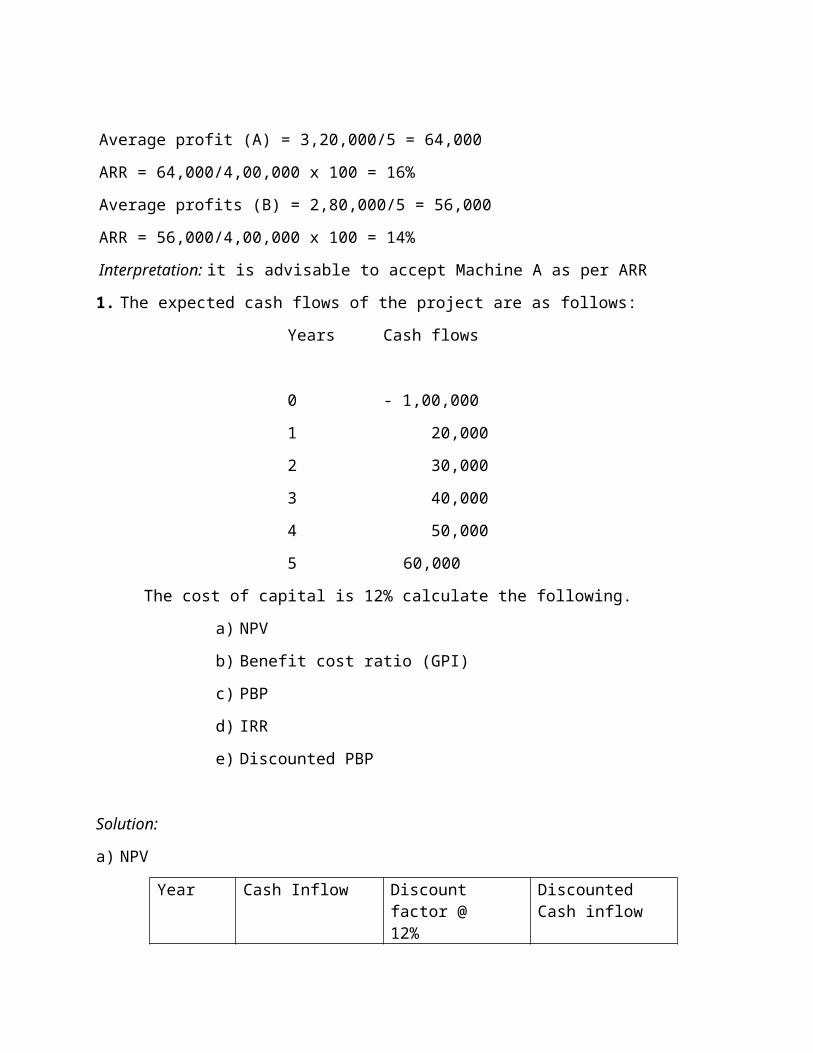
Average profit (A) = 3,20,000/5 = 64,000
ARR = 64,000/4,00,000 x 100 = 16%
Average profits (B) = 2,80,000/5 = 56,000
ARR = 56,000/4,00,000 x 100 = 14%
Interpretation: it is advisable to accept Machine A as per ARR
1. The expected cash flows of the project are as follows:
Years Cash flows
0 - 1,00,000
1 20,000
2 30,000
3 40,000
4 50,000
5 60,000
The cost of capital is 12% calculate the following.
a) NPV
b) Benefit cost ratio (GPI)
c) PBP
d) IRR
e) Discounted PBP
Solution:
a) NPV
Year Cash Inflow Discount factor @12%
Discounted Cash inflow
12345
20,00030,000 40,00050,00060,000
0.89290.79720.71180.63550.5674
∑ Cash inflow- Initial invt.
NPV
17,85823,91628,47231,77517,022------------1,19,0431,00,000------------19,043
b) Benefit cost ration (GPI)
= Discounted Cash inflow / Discounted Cash outflow
= 1,19,043 / 1,00,000
= 1.19
c) Pay Back period
= 3 + 10,000 / 50,000
= 3.2 years
d) IRR
Year Cash Inflow Discount factor @20%
Discounted Cash inflow
12345
20,00030,000 40,00050,00060,000
0.83330.69440.57870.48230.4019
∑ Cash inflow- Initial invt.
NPV
16,66620,83223,14824,11512,057------------ 96,8181,00,000------------- 3,182
+ ve NPV
IRR= LRR+ ------------------------------ x difference in rates
(+ ve NPV) + (- ve NPV)
19,043
IRR= 12 + ------------------------------ x (15 - 10)
19,043 + 3,182
= 18.85%
e) Discounted Pay Back period
= 3 + 29,754 / 31,775
= 3.9 years
-------------------------------------------------------------------------------
Unit 4 Risk and Uncertainty in Capital Budgeting -------------------------------------------------------------------------------
Objectives
The objectives of this unit are:
To bring clarity in the concepts of Risk and Uncertainty
To study the methods of accounting the risk in capital budgeting
Unit outline
3.4.1 Risk and Uncertainty in Capital Budgeting
The following methods are suggested for accounting for risk in capital
budgeting.
(i) General Techniques:
(a)Risk adjusted discount rate;
(b)Certainty equivalent coefficient.
(ii) Quantitative Techniques:
(a)Sensitivity analysis
(b)Probability assignment
(c) Standard deviation
(d)Coefficient of variation
(e) Decision tree analysis
-------------------------------------------------------------------------------
3.4.1 Risk and Uncertainty in Capital Budgeting
----------------------------------------------------------------------------
All the techniques of capital budgeting require the estimation of future
cash inflows and cash outflows. The future cash flows are estimated, based
on the following factors:
(1) Expected economic life of the project.
(2) Salvage value of the asset at the end of its life.
(3) Capacity of the project.
(4) Selling price of the product.
(5) Production cost
(6) Depreciation and tax rate
(7) Future demand for the product etc.,
But due to uncertainties about the future most of the above factors
cannot be exact. For example, the product becomes absolute, technology
becomes obsolescence, in these situations taking investment decisions
becomes difficult. But some allowances for the element of risk have to be
provided.
The following methods are suggested for accounting for risk in capital
budgeting.
(i) General Techniques:
(a)Risk adjusted discount rate;
(b)Certainty equivalent coefficient.
(ii) Quantitative Techniques:
(a)Sensitivity analysis
(b)Probability assignment
(c) Standard deviation
(d)Coefficient of variation
(e)Decision tree analysis
Risk adjusted discount rate
The risk adjusted discount rate is based on the presumption that
investors expect a higher rate of return on risky projects as compared to less
risky projects. The rate requires is determined by i) risk free rate and ii) risk
premium rate. Risk free rate is the rate at which the future cash inflows
should be discounted and there been no risk. Risk premium rate is the extra
return expected by the investor over the normal rate on account of the
project being risky. Therefore risk adjusted discount rate is a composite
discount rate that takes into account both the time and risk factors. A higher

discount rate will be used for more risky projects and lower rate for less risky
projects.
From the following data, state which project is better>
Year Cash inflows
Project X Project Y
0 -10,000 -10,000
1 5,000 6,000
2 4,000 6,000
3 2,000 4,000
Riskless discount rate is 5%. Project X is less risky as compared to
Project Y. the management considers risk premium rates at 5% and 10%
respectively appropriate for discounting the cash inflows.
Solution:
Project Risk adjusted discount rate
X 5% + 5% = 10%
Y 5% + 10% = 15%
Year Discounted Cash inflows
Project X Project Y
0 -10,000 -10,000
1 4,545 5,218
2 3,320 4,536
3 1,502 2,630
--------- ---------NPV - 633 2,384
--------- ---------
Project Y is superior to Project X. since NPV is positive it may be accepted.
Sensitivity analysis
Where cash inflows are very sensitive under different circumstances,
more than one forecast of the future cash inflows may be made. These
inflows may be regarded as 'Optimistic', 'Most Likely' and 'Pessimistic'.
Further cash inflows may be discounted to find out the NPV under these
three different situations. If the NPV under the three situations differ widely it
implies that there is a great risk in the project and the investor's decision to
accept or reject a project will depend upon his risk bearing abilities
Illustration
Mr. Tanu is considering tow mutually exclusive projects A and B. You
are required to advise him about the acceptability of the projects from the
following information.
Project A
Rs.
Project B
Rs.
Cost of the Investment
Forecast Cash Inflows per
annum for 5 years
Optimistic
Most Likely
Pessimistic
(The cut-off rate is 15%)
50,000
35,000
25,000
20,000
50,000
40,000
20,000
5,000
Solution
Computation of NPV of cash in flows at a Discount Rate of 15%
(Annuity of Re. 1 for 5 years)
Project A Project B
Annual
cash
inflow
Discou
nt
factor
@ 15%
Present
Value
NPV Annual
cash
inflow
Discou
nt
factor
@ 15%
Present
Value
NPV
Optimistic
Most Likely
35,000
25,000
3.3522
3.3522
1,17,327
83,805
67,327
33,805
40,000
20,000
3.3522
3.3522
1,34,088
67,044
84,088
17,044
Pessimistic 20,000 3.3522 67,044 17,044 5,000 3.3522 16,761 -33,239
The NPV calculated above indicate that Project B is more risky as compared
to Project A. at the same time during favorable conditions, it is more
profitable.
Probability Technique
A probability is a relative frequency with which an event may occur in
the future. When future estimates of cash inflows have different probabilities
the expected monetary values may be computed by multiplying cash inflow
with the probability assigned.
Illustration:
The ABC company Limited has given the following possible cash inflows fro
two of their projects X and Y out of which one they wish to undertake
together with their associated probabilities. Both the projects will require an
equal investment of Rs. 5,000.
You are required to give your considered opinion regarding the
selection of the project.
Project X Project Y
Possible
event
Cash inflows Probability Cash
inflows
Probabilit
y
A
B
C
D
E
4,000
5,000
6,000
7,000
8,000
.10
.20
.40
.20
.10
12,000
10,000
8,000
6,000
4,000
.10
.15
.50
.15
.10
Solution:
Computation of Expected Monetary values for Project X and Project Y
Project X Project Y
Cash Probabilit Expect Cash Probabili Expecte
inflows y ed
value
inflows ty d value
A
B
C
D
E
4,000
5,000
6,000
7,000
8,000
Total
.10
.20
.40
.20
.10
Rs. 400
1,000
2,400
1,400
800
6000
12,000
10,000
8,000
6,000
4,000
Total
.10
.15
.50
.15
.10
1,200
1,500
4,000
900
400
8,000
The expected monetary value of Project Y is higher than the expected
monetary value of Project X. Hence Project Y is preferable to project X.
Decision Tree Analysis
Decision tree anlysis is another technique which is helpful in tackling
risky capital investment proposals. Decision tree is a graphic display of
relationship between a present decision and possible future events, future
decisions and their consequences. The sequence of event is mapped out
over time in a format resembling branches of a tree. In other words, it is a
pictorial representation in tree form which indicates the magnitude,
probability and interrelationship of all possible outcomes.