Embed Size (px)
Citation preview

1
Monday, September 28, 2015 (Week 39)
1
Monday, September 28, 2015 (Week 39)
IN THE NEWS Latest Company News
Earnings Recap
CAPITAL MARKETS DATA Currencies, Commodities & Indices
Shipping Equities – Weekly Review
Dividend Paying Shipping Stocks
Weekly Equity Trading Statistics – by KCG
Global Shipping Company Bond Data
SHIPPING MARKETS Weekly Market Report – Allied Shipbroking Inc
Stifel Shipping Markets
Global Shipping Company Bond Profiles
Container Market – Weekly Highlights by Braemar ACM Shipbroking
Weekly Tanker Market Opinion, by Poten & Partners
Tanker Market - Weekly Highlights, by Charles R. Weber Company
Dry/Wet & TC Rates – Alibra Shipping
TERMS OF USE & DISCLAIMER
CONTENT CONTRIBUTORS
Capital Link Shipping
Weekly Markets Report

IN PARTNERSHIP WITH IN COOPERATION WITH REGISTER
AGENDA
ABOUT THE FORUM Capital Link welcomes you to the 8th Annual Shipping, Marine Services & Offshore Forum,
will take place on Wednesday, October 7, 2015 at One Moorgate Place in London, held in
cooperation with the London Stock Exchange and in partnership with Clarksons Platou
Securities. This event aims to provide investors with a comprehensive review and current
outlook of the various shipping, marine services and offshore markets and in addition,
cover topics of critical interest to shipping industry participants, financers and investors.
The Forum presents a unique opportunity to meet and network with a large and targeted
high-caliber audience in the industry. The event will be open to the buy and sell side
communities as well as the media. By attending, participants will gain a deeper
understanding of the current state of the shipping and marine services industry, the
subsequent effects on their investments, and a clear focus on the opportunities and
challenges ahead.
PANEL & PRESENTATION TOPICS
• London as Global Investment Destination • Global Shipbuilding – Sector Overview • Shipping & Bank Finance • Shipping & Capital Markets • Shipping, Private Equity & Alternative
Financing • The Dry Bulk Sector • The LNG Sector • The LPG Sector • Yield Investing in Shipping • The Tanker Sector
WHO TO ATTEND
Commercial and Investment Bankers • Charterers • Classification Societies • Commodity
and Energy Traders • Finance Providers • Financial Advisors • Financial and Trade Media •
Hedge Fund Managers • Institutional Investors • P&I Executives • Lawyers and Insurers •
Market Analysts and Consultants • Private Equity Firms • Risk Advisors • Ship Managers •
Ship Operators • Shipowners • Shipbrokers • Sovereign Wealth Funds • Venture Capital
Firms
Capital Link - New York - London - Athens - Oslo New York - 230 Park Avenue, Suite 1536, New York, NY, 10169 Tel.: +1 212 661 7566 Fax: +1 212 661 7526London - Longcroft House,2-8 Victoria Avenue, London, EC2M 4NS, U.K Tel. +44(0) 203 206 1320 Fax. +44(0) 203 206 1321 Athens - 40, Agiou Konstantinou Str, Suite A 5, 151-24 Athens, Greece Tel. +30 210 6109 800 Fax +30 210 6109 801 Oslo - Raadhusgaten 25 P.O. Box 1904 Vika N-0116 Oslo, Norway
www.capitallink.comwww.capitallinkforum.com
www.CapitalLinkShipping.comA web based resource that provides information on the major shipping and stock market
Investor Relations & Financial Advisory
indices, as well as on all shipping stocks. It also features an earnings and conference call calendar, industry reports from major industry participants and interviews with CEOs, analysts and other market participants.
www.CapitalLinkWebinars.comSector Forums & Webinars: Regularly, we organize panel discussions among CEOs, analysts, bankers and shipping industry participants on the developments in the various shipping sectors (containers, dry bulk, tankers) and on other topics of interest (such as Raising Equity in Shipping Today, Scrapping, etc).
Capital Link Investor Shipping ForumsIn New York, Athens and London bringing together investors, bankers, financial advisors, listed companies CEOs, analysts, and shipping industry participants.
www.MaritimeIndices.comCapital Link Maritime Indices: Capital Link developed and maintains a series of stock market maritime indices which track the performance of U.S. listed shipping stocks (CL maritime Index, CL Dry Bulk Index, CL Tanker Index, CL Container Index, CL LNG/LPG Index, CL Mixed Fleet Index, CL Shipping MLP Index – Bloomberg page: CPLI. The Indices are also distributed through the Reuters Newswires and are available on Factset.
Capital Link Shipping Weekly Markets ReportWeekly distribution to an extensive audience in the US & European shipping, financial and investment communities with updates on the shipping markets, the stock market and listed company news.
Operating more like a boutique investment bank rather than a traditional Investor Relations firm, our objective is to assist our clients enhance long term shareholder value and achieve proper valuation through their positioning in the investment community. We assist them to determine their objectives, establish the proper investor outreach strategies, generate a recurring information flow, identify the proper investor and analyst target groups and gather investor and analyst feedback and related market intelligence information while keeping track of their peer group. Also, to enhance their profile in the financial and trade media.
Capital Link is a New York-based Advisory, Investor Relations and Financial Communications firm. Capitalizing on our in-depth knowledge of the shipping industry and capital markets, Capital Link has made a strategic commitment to the shipping industry becoming the largest provider of Investor Relations and Financial Communications services to international shipping companies listed on the US and European Exchanges. Capital Link's headquarters are in New York with a presence in London and Athens.
In our effort to enhance the information flow to the investment community and contribute to improving investor knowledge of shipping, Capital Link has undertaken a series of initiatives beyond the traditional scope of its investor relations activity, such as:
...Linking Shipping and Investors Across the GlobeCapital Link Shipping

2
Monday, September 28, 2015 (Week 39)
Monday, September 21, 2015
Golden Ocean Group Limited 2015 Annual General Meeting
Golden Ocean Group Limited (the "Company") (NASDAQ: GOGL),
advises that the 2015 Annual General Meeting of the Shareholders
of the Company was held on September 18, 2015 at 11:20 a.m. at
the Elbow Beach Hotel, 60 South Shore Road, Paget PG04,
Bermuda. The audited consolidated financial statements for the
Company for the year ended December 31, 2014 were presented to
the Meeting.
http://www.goldenocean.no/?view=hugin_feed&menu=21&feed=http:
//cws.huginonline.com/G/132879/PR/201509/1953352.xml
SDRL - Minutes from the Annual General Meeting 2015
Seadrill Limited (the "Company") advises that the 2015 Annual
General Meeting of the Shareholders of the Company was held on
September 18, 2015 at 9:00 a.m. at the Elbow Beach Hotel, 60
South Shore Road, Paget PG04, Bermuda. The audited
consolidated financial statements for the Company for the year
ended December 31, 2014 were presented to the Meeting.
http://www.seadrill.com/investor-relations/news/pr-
story.aspx?ResultPageURL=http://cws.huginonline.com/S/135817/P
R/201509/1953323.xml
FRNT - 2015 Annual General Meeting
Frontline Ltd. (the "Company") advises that the 2015 Annual General
Meeting of the Shareholders of the Company was held on
September 18, 2015 at 10:15 a.m. at the Elbow Beach Hotel, 60
South Shore Road, Paget PG04, Bermuda. The audited
consolidated financial statements for the Company for the year
ended December 31, 2014 were presented to the Meeting.
http://www.frontline.bm/external_feed/external_feeds/view/8/press_r
elease/1953355?active=19
Euroseas Announces Results of Its Rights Offering
Euroseas Ltd. (NASDAQ: ESEA), an owner and operator of drybulk
and container carrier vessels and provider of seaborne
transportation for drybulk and containerized cargoes, announced
today the results of its previously announced rights offering to
shareholders of the Company.
http://www.euroseas.gr/press_releases.html?irp=pr2&relid=584897
Safe Bulkers, Inc. Enters Into a US$92.1 Million Sale and
Leaseback Agreement for four Kamsarmax Class Vessels
Safe Bulkers, Inc. (the “Company”) (NYSE: SB), an international
provider of marine drybulk transportation services, announced today
that it has entered into a sale and leaseback agreement with a bank,
regarding four existing Kamsarmax class vessels.
http://www.safebulkers.com/sbpr092115.pdf
Seanergy Maritime Holdings Corp. Sets Date for the Second
Quarter Ended June 30, 2015 Results, Conference Call and
Webcast
Seanergy Maritime Holdings Corp. (the “Company”) (NASDAQ:
SHIP) announced today that it will release its financial results for the
second quarter ended June 30, 2015 before the market opens in
New York, on Wednesday, September 23, 2015.
http://www.seanergymaritime.com/press/seanergy092115.pdf
Diana Containerships Inc. Announces the Sale of a Panamax
Container Vessel, the m/v Garnet
Diana Containerships Inc. (NASDAQ: DCIX), (the “Company”), a
global shipping company specializing in the ownership of
containerships, announced that it has signed today, through a
separate wholly-owned subsidiary, a Memorandum of Agreement to
sell to an unaffiliated third party the 1995-built vessel “Garnet”
(formerly “APL Garnet”) for demolition, with delivery due to the buyer
by the end of September 2015, for a sale price of approximately
US$7.85 million before commissions.
http://www.dcontainerships.com/investors/press-releases/news-
diana-containerships-inc-announces-the-sale-of-a-panamax-
container-vessel-the-m-v-garnet
Capital Product Partners L.P. Announces The Delivery Of The
M/V 'CMA CGM Uruguay'
Capital Product Partners L.P. (NASDAQ: CPLP) (the 'Partnership'),
an international diversified shipping company, announced today the
successful acquisition of the M/V 'CMA CGM Uruguay '.
http://www.capitalpplp.com/releasedetail.cfm?ReleaseID=932461
Tuesday, September 22, 2015
Globus Maritime Sets Date for the Release of Second Quarter
and First Half 2015 Results
Globus Maritime Limited (the “Company” or "Globus") (NASDAQ:
GLBS), a dry bulk shipping company, announced today that it will
release financial results for the quarter and six-month period ended
June 30, 2015 after the market closes in New York on Thursday,
September 24, 2015.
http://www.globusmaritime.gr/press/globuspr092215.pdf
Navios Maritime Holdings Inc. Declares Quarterly Dividend of
$0.546875 per American Depositary Share on Its Series G
Preferred Stock; Quarterly Dividend of $0.5390625 per American
Depositary Share on Its Series H Preferred Stock
Navios Maritime Holdings Inc. ("Navios Holdings" or the "Company")
(NYSE: NM) announced today that the Company has declared
quarterly dividend on its Series G and Series H Preferred Stock.
http://www.navios.com/InvestorRelations/default.asp
Hercules Offshore, Inc. Provides Fleet Status Report
Hercules Offshore, Inc. (OTC Pink: HEROQ) announced today that it
has published a Fleet Status Report ("the Report"). The Report
includes the Hercules Offshore Rig Fleet Status (as of September
22, 2015), which contains detailed contract information for each of
the Company's drilling rigs. The Report also includes the Hercules
Offshore Liftboat Fleet Status Report, which contains information by
liftboat class for August 2015, including revenue per day and
operating days. The Report can be found on the Company's website
at www.herculesoffshore.com, under the "Investor Relations" section
of the website.
http://ir.herculesoffshore.com/phoenix.zhtml?c=192573&p=irol-
newsArticle&ID=2089661
Latest Company News
IN THE NEWS
3
Monday, September 28, 2015 (Week 39)
Noble Corporation plc To Present At The 2015 Johnson Rice
Energy Conference
Noble Corporation plc (NYSE:NE) today announced that Jeffrey L.
Chastain, Vice President – Investor Relations and Corporate
Communications, Noble Drilling Services Inc., will present at the
2015 Johnson Rice Energy Conference in New Orleans, Louisiana,
on Tuesday, September 29, 2015, beginning at 10:00 a.m. U.S.
Central Daylight Time. A live webcast and presentation slides will be
available at the time of the presentation in the "Investor Relations"
section of the Company's Web site http://www.noblecorp.com. A
replay of the presentation will be available on our website
approximately three hours after the conclusion of the live
presentation and will be available for 30 days following the event.
http://phx.corporate-ir.net/phoenix.zhtml?c=98046&p=irol-
newsArticle&ID=2089579
SDRL - Seadrill Receives Notice of Contract Cancellation for the
West Mira
Seadrill Limited ("Seadrill" or "The Company""), has been notified by
Husky Oil Operations Limited ("Husky") of the cancellation of the
drilling contract for the West Mira ("The Unit").
In the fourth quarter of 2012 Seadrill was awarded a 5 year contract
for the West Mira with Husky for operations in Canada and
Greenland. The total estimated base revenue potential was
approximately $1 billion. As stated in the Company's second quarter
earnings report, due to the late delivery of the Unit, the Company
had tentatively agreed with Husky to reduce the dayrate on the West
Mira. The construction contract was subsequently cancelled by
Seadrill due to the Shipyard's inability to deliver the Unit within the
timeframe required under the contract.
http://www.seadrill.com/investor-relations/news/pr-
story.aspx?ResultPageURL=http://cws.huginonline.com/S/135817/P
R/201509/1953620.xml
Transocean Ltd. Provides Fleet Update Summary
Transocean Ltd. (NYSE: RIG) (SIX: RIGN) today issued a monthly
Fleet Update Summary, which includes new contracts, changes to
existing contracts, and changes in estimated planned out-of-service
time of 15 or more days since the August 19, 2015 Fleet Update
Summary.
http://www.deepwater.com/news?ID=2089640
Nordic American Tankers Limited (NYSE:NAT) Taking delivery
of its 23rd ship - enhancing the dividend and earnings capacity
In our press release July 27, 2015 Nordic American Tankers Limited
("NAT" or "the Company") announced that it had entered into an
agreement to acquire two 2010 built ships for delivery to NAT in
September and October 2015. The first of these vessels was taken
over today and has been renamed "Nordic Light".
http://www.nat.bm/IR/press_releases/1953692.html
Nordic American Tankers Limited (NYSE:NAT) takes delivery of
2010 built Suezmax tanker
In our press release July 27, 2015 Nordic American Tankers Limited
("NAT" or "the Company") announced that it had entered into an
agreement to acquire two 2010 built ships for delivery to NAT in
September and October 2015. The first of these vessels was taken
over today and has been renamed "Nordic Light".
http://www.nat.bm/IR/press_releases/1953781.html
SFL - 2015 Annual General Meeting
Ship Finance International Limited (the "Company") advises that the
2015 Annual General Meeting of the Shareholders of the Company
was held on September 18, 2015 at 11:00 a.m. at the Elbow Beach
Hotel, 60 South Shore Road, Paget PG04, Bermuda. The audited
consolidated financial statements for the Company for the year
ended December 31, 2014 were presented to the Meeting.
http://www.shipfinance.bm/index.php?id=462&pressrelease=195364
3.html
SFL - Sale of older Suezmax tanker
Ship Finance International Limited (NYSE: SFL) ("Ship Finance" or
the "Company"), today announced that it has agreed to sell the 1995
built Suezmax tanker Front Splendour to an unrelated third party.
The Company has simultaneously agreed to terminate the
corresponding charter party for the 20-year old crude oil carrier with
a subsidiary of Frontline Ltd. ("Frontline").
http://www.shipfinance.bm/index.php?id=462&pressrelease=195366
5.html
Wednesday, September 23, 2015
Seanergy Maritime Holdings Corp. Reports Financial Results for
the Second Quarter and Six Months Ended June 30, 2015
Seanergy Maritime Holdings Corp. (the “Company”)
(NASDAQ:SHIP) announced today its financial results for the second
quarter and six months ended June 30, 2015.
http://www.seanergymaritime.com/press/seanergy092315.pdf
Danaos Corporation Announces Formation of Joint Venture and
Acquisition of 3 Containerships
Danaos Corporation (NYSE: DAC), one of the world's largest
independent owners of containerships, announced today the
acquisition of three vessels through a newly-formed joint venture,
capitalizing on depressed asset prices in the resale market.
http://www.danaos.com/news-and-media/press-release-
details/2015/Danaos-Corporation-Announces-Formation-of-Joint-
Venture-and-Acquisition-of-3-Containerships/default.aspx
Thursday, September 24, 2015
Globus Maritime Limited Reports Financial Results for the
Quarter and Six-Month Period Ended June 30, 2015
Globus Maritime Limited ("Globus," the “Company," “we,” or “our”)
(NASDAQ: GLBS), a dry bulk shipping company, today reported its
unaudited consolidated operating and financial results for the quarter
and six month period ended June 30, 2015.
http://www.globusmaritime.gr/press/globuspr092415.pdf
Latest Company News
IN THE NEWS

4
Monday, September 28, 2015 (Week 39)
Scorpio Tankers Inc. Announces an Agreement to Sell STI
Highlander, Newbuilding Vessel Deliveries, and the Upsizing of
a Previously Announced Credit Facility
Scorpio Tankers Inc. (NYSE: STNG) (the "Company") announced
today an agreement to sell STI Highlander, newbuilding vessel
deliveries, and the upsizing of a previously announced credit facility.
http://ir.scorpiotankers.com/press-releases/scorpio-tankers-inc-
announces-an-agreement-to-sell-sti-highlander-newbuilding-v-nyse-
stng-1219082
Golar LNG Limited: 2015 AGM Results Notification
Golar LNG Limited (the "Company") advises that the 2015 Annual
General Meeting of the Company was held on September 23, 2015
at 9:00 a.m. at Rosewood Tucker's Point, 60 Tucker's Point Drive,
Hamilton Parish, Bermuda. The audited consolidated financial
statements for the Company for the year ended December 31, 2014
were presented to the Meeting.
http://www.golarlng.com/index.php?name=seksjon/Stock_Exchange
_Releases/Press_Releases.html&pressrelease=1954256.html
Golar LNG Partners L.P: 2015 AGM Results Notification
Golar LNG Partners LP (the "Partnership") advises that the 2015
Annual Meeting of the Limited Partners of the Partnership was held
on September 23, 2015 at 09:30 a.m. at Rosewood Tucker's Point,
60 Tucker's Point Drive, Hamilton Parish, Bermuda.
http://www.golarlngpartners.com/index.php?name=seksjon/Stock_Ex
change_Releases/Press_Releases.html&pressrelease=1954281.ht
ml
NewLead Holdings Ltd. Announces Time Charter and
Commercial Performance of Newlead Castellano
NewLead Holdings Ltd. (OTC: NEWL) ("NewLead" or the
"Company") announced today that it has entered into a time charter
contract for one of its dry bulk Eco-type Handysize vessels, the
Newlead Castellano, for two consecutive voyages, anticipated to be
completed by the end of November 2015, at a gross charter-out rate
of US $7,000 per day less a 6.25% commission paid to third parties.
The vessel was delivered to the charterers at the beginning of
September 2015.
http://www.newleadholdings.com/news2015.html
Friday, September 25, 2015
Transocean Ltd. Provides Brazil Information
A statement by Mr. Eduardo Costa Van Musa relating to the drilling
contract for the Petrobras 10000 was made public this week through
the Brazilian authorities investigating corrupt practices relating to
Petrobras. In his statement, Mr. Musa said he believed he received
payments from someone claiming to be a commercial representative
of Transocean even though Mr. Musa also asserted that no such
payments were necessary as Transocean had been awarded the
contract as it was the best technical and economic bidder in a
competitive process.
http://www.deepwater.com/news?ID=2090485
Latest Company News
IN THE NEWS

5
Monday, September 28, 2015 (Week 39)
IN THE NEWS
Seanergy Maritime Holdings Corp.
On September 23, 2015, Seanergy Maritime Holdings Corp.
(NASDAQ:SHIP) announced its financial results for the second
quarter and six months ended June 30, 2015.
Stamatis Tsantanis, the Company’s Chairman & Chief Executive
Officer, stated: “In the second quarter of 2015, Seanergy restored its
revenue-generation capacity through the acquisition of its first
vessel, the M/V Leadership, in March 2015. The Time Charter
Equivalent (“TCE”) rate earned by M/V Leadership during the
second quarter of 2015 amounted to $9,788, which compares very
favorably with the average rate of the 4 T/C routes of the Baltic
Capesize Index for the same period of $4,601. Going forward, we
expect our TCE rate to strengthen as the dry bulk market gradually
recovers.
“As recently announced, we entered into a purchase agreement to
acquire a fleet of seven modern dry bulk carriers for approximately
$183 million. The fleet consists of five Capesize and two Supramax
vessels with an average age of six years. Seanergy took delivery of
the first of these seven bulkers, the 2010 built Capesize M/V
Premiership, on September 11, 2015 and we expect the remaining
vessels to be delivered by November 30, 2015.
“The vessels will be employed in the spot market and the Company
will be expanding its revenue generation capacity upon delivery of
each vessel. Following completion of the remaining deliveries, our
fleet will reach eight quality vessels with a combined cargo-carrying
capacity of approximately 1.1 million DW. This acquisition is fully
consistent with our business plan and Seanergy will continue to
Earnings Recap pursue acquisition opportunities that we believe can further enhance
value for all our shareholders.”
For additional information, please refer to the company’s earnings
release
http://www.seanergymaritime.com/press/seanergy092315.pdf
Globus Maritime Limited
On September 24, 2015, Globus Maritime Limited (NASDAQ:
GLBS), a dry bulk shipping company, reported its unaudited
consolidated operating and financial results for the quarter and six-
month period ended June 30, 2015.
George Karageorgiou, President, Chief Executive Officer and Chief
Financial Officer of Globus Maritime Limited, stated: “In this
challenging environment, we maintained our focus on the
Company’s operational efficiency. Our voyage expenses dropped
64% to $0.4 million in the second quarter of 2015 from $1.1 million
during the same time period in 2014. Furthermore, our average daily
operating expenses declined 27% for the same periods.” He also
emphasized the following: “We improved the Company’s balance
sheet, utilizing the proceeds from the sale of m/v Tiara Globe to fully
repay the remaining loan balance of $5.0 million to Credit Suisse AG
in July 2015.”
For additional information, please refer to the company’s earnings
release http://www.globusmaritime.gr/press/globuspr092415.pdf
6
Monday, September 28, 2015 (Week 39)
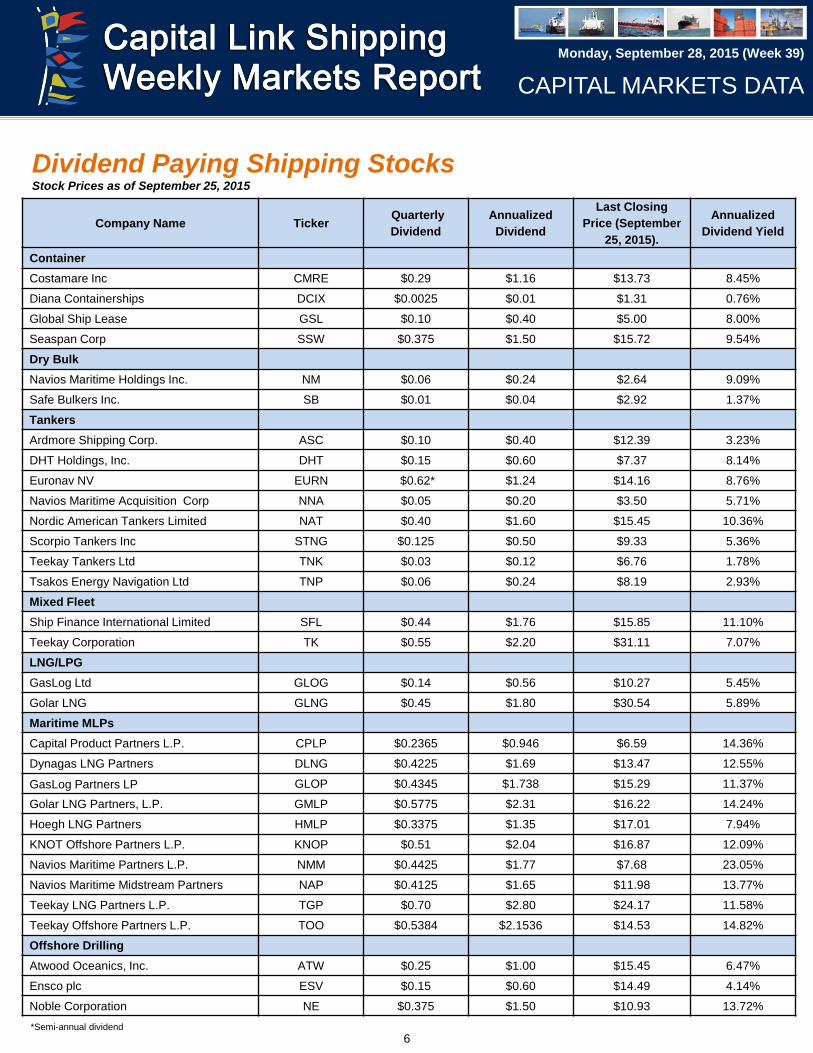
Dividend Paying Shipping Stocks Stock Prices as of September 25, 2015
CAPITAL MARKETS DATA
Company Name Ticker Quarterly
Dividend
Annualized
Dividend
Last Closing
Price (September
25, 2015).
Annualized
Dividend Yield
Container
Costamare Inc CMRE $0.29 $1.16 $13.73 8.45%
Diana Containerships DCIX $0.0025 $0.01 $1.31 0.76%
Global Ship Lease GSL $0.10 $0.40 $5.00 8.00%
Seaspan Corp SSW $0.375 $1.50 $15.72 9.54%
Dry Bulk
Navios Maritime Holdings Inc. NM $0.06 $0.24 $2.64 9.09%
Safe Bulkers Inc. SB $0.01 $0.04 $2.92 1.37%
Tankers
Ardmore Shipping Corp. ASC $0.10 $0.40 $12.39 3.23%
DHT Holdings, Inc. DHT $0.15 $0.60 $7.37 8.14%
Euronav NV EURN $0.62* $1.24 $14.16 8.76%
Navios Maritime Acquisition Corp NNA $0.05 $0.20 $3.50 5.71%
Nordic American Tankers Limited NAT $0.40 $1.60 $15.45 10.36%
Scorpio Tankers Inc STNG $0.125 $0.50 $9.33 5.36%
Teekay Tankers Ltd TNK $0.03 $0.12 $6.76 1.78%
Tsakos Energy Navigation Ltd TNP $0.06 $0.24 $8.19 2.93%
Mixed Fleet
Ship Finance International Limited SFL $0.44 $1.76 $15.85 11.10%
Teekay Corporation TK $0.55 $2.20 $31.11 7.07%
LNG/LPG
GasLog Ltd GLOG $0.14 $0.56 $10.27 5.45%
Golar LNG GLNG $0.45 $1.80 $30.54 5.89%
Maritime MLPs
Capital Product Partners L.P. CPLP $0.2365 $0.946 $6.59 14.36%
Dynagas LNG Partners DLNG $0.4225 $1.69 $13.47 12.55%
GasLog Partners LP GLOP $0.4345 $1.738 $15.29 11.37%
Golar LNG Partners, L.P. GMLP $0.5775 $2.31 $16.22 14.24%
Hoegh LNG Partners HMLP $0.3375 $1.35 $17.01 7.94%
KNOT Offshore Partners L.P. KNOP $0.51 $2.04 $16.87 12.09%
Navios Maritime Partners L.P. NMM $0.4425 $1.77 $7.68 23.05%
Navios Maritime Midstream Partners NAP $0.4125 $1.65 $11.98 13.77%
Teekay LNG Partners L.P. TGP $0.70 $2.80 $24.17 11.58%
Teekay Offshore Partners L.P. TOO $0.5384 $2.1536 $14.53 14.82%
Offshore Drilling
Atwood Oceanics, Inc. ATW $0.25 $1.00 $15.45 6.47%
Ensco plc ESV $0.15 $0.60 $14.49 4.14%
Noble Corporation NE $0.375 $1.50 $10.93 13.72%
*Semi-annual dividend
7
Monday, September 28, 2015 (Week 39)
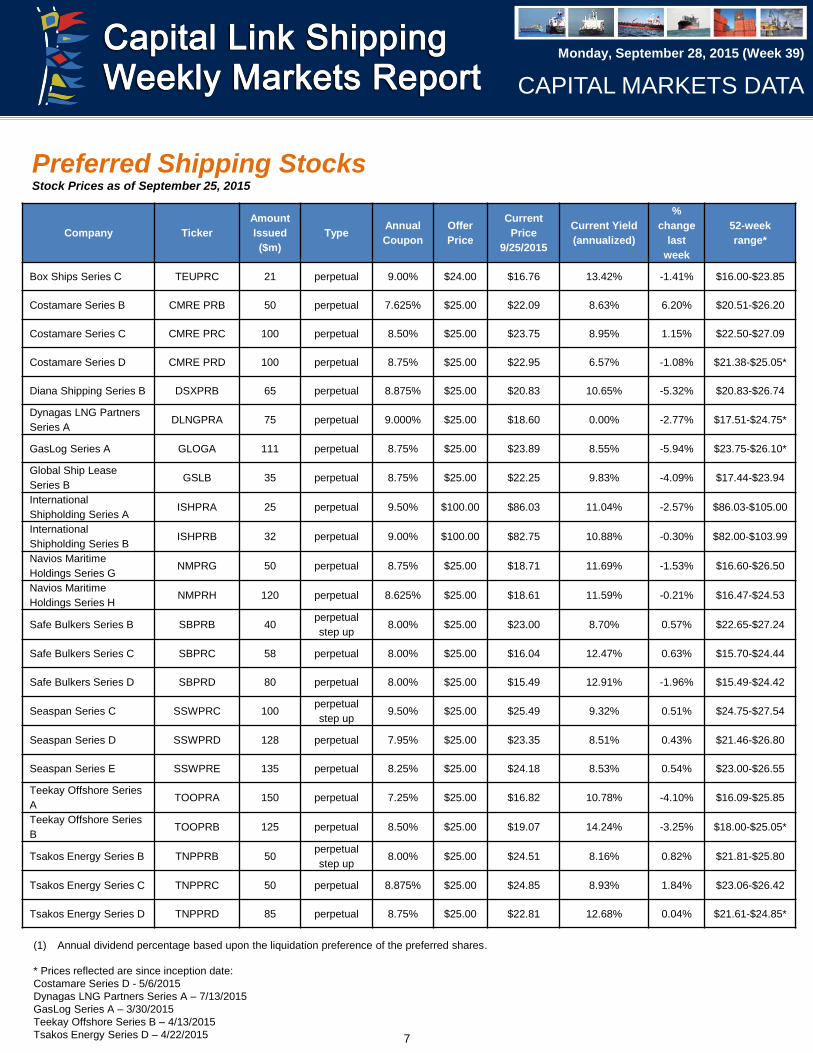
(1) Annual dividend percentage based upon the liquidation preference of the preferred shares.
* Prices reflected are since inception date:
Costamare Series D - 5/6/2015
Dynagas LNG Partners Series A – 7/13/2015
GasLog Series A – 3/30/2015
Teekay Offshore Series B – 4/13/2015
Tsakos Energy Series D – 4/22/2015
CAPITAL MARKETS DATA
Company Ticker
Amount
Issued
($m)
Type Annual
Coupon
Offer
Price
Current
Price
9/25/2015
Current Yield
(annualized)
%
change
last
week
52-week
range*
Box Ships Series C TEUPRC 21 perpetual 9.00% $24.00 $16.76 13.42% -1.41% $16.00-$23.85
Costamare Series B CMRE PRB 50 perpetual 7.625% $25.00 $22.09 8.63% 6.20% $20.51-$26.20
Costamare Series C CMRE PRC 100 perpetual 8.50% $25.00 $23.75 8.95% 1.15% $22.50-$27.09
Costamare Series D CMRE PRD 100 perpetual 8.75% $25.00 $22.95 6.57% -1.08% $21.38-$25.05*
Diana Shipping Series B DSXPRB 65 perpetual 8.875% $25.00 $20.83 10.65% -5.32% $20.83-$26.74
Dynagas LNG Partners
Series A DLNGPRA 75 perpetual 9.000% $25.00 $18.60 0.00% -2.77% $17.51-$24.75*
GasLog Series A GLOGA 111 perpetual 8.75% $25.00 $23.89 8.55% -5.94% $23.75-$26.10*
Global Ship Lease
Series B GSLB 35 perpetual 8.75% $25.00 $22.25 9.83% -4.09% $17.44-$23.94
International
Shipholding Series A ISHPRA 25 perpetual 9.50% $100.00 $86.03 11.04% -2.57% $86.03-$105.00
International
Shipholding Series B ISHPRB 32 perpetual 9.00% $100.00 $82.75 10.88% -0.30% $82.00-$103.99
Navios Maritime
Holdings Series G NMPRG 50 perpetual 8.75% $25.00 $18.71 11.69% -1.53% $16.60-$26.50
Navios Maritime
Holdings Series H NMPRH 120 perpetual 8.625% $25.00 $18.61 11.59% -0.21% $16.47-$24.53
Safe Bulkers Series B SBPRB 40 perpetual
step up 8.00% $25.00 $23.00 8.70% 0.57% $22.65-$27.24
Safe Bulkers Series C SBPRC 58 perpetual 8.00% $25.00 $16.04 12.47% 0.63% $15.70-$24.44
Safe Bulkers Series D SBPRD 80 perpetual 8.00% $25.00 $15.49 12.91% -1.96% $15.49-$24.42
Seaspan Series C SSWPRC 100 perpetual
step up 9.50% $25.00 $25.49 9.32% 0.51% $24.75-$27.54
Seaspan Series D SSWPRD 128 perpetual 7.95% $25.00 $23.35 8.51% 0.43% $21.46-$26.80
Seaspan Series E SSWPRE 135 perpetual 8.25% $25.00 $24.18 8.53% 0.54% $23.00-$26.55
Teekay Offshore Series
A TOOPRA 150 perpetual 7.25% $25.00 $16.82 10.78% -4.10% $16.09-$25.85
Teekay Offshore Series
B TOOPRB 125 perpetual 8.50% $25.00 $19.07 14.24% -3.25% $18.00-$25.05*
Tsakos Energy Series B TNPPRB 50 perpetual
step up 8.00% $25.00 $24.51 8.16% 0.82% $21.81-$25.80
Tsakos Energy Series C TNPPRC 50 perpetual 8.875% $25.00 $24.85 8.93% 1.84% $23.06-$26.42
Tsakos Energy Series D TNPPRD 85 perpetual 8.75% $25.00 $22.81 12.68% 0.04% $21.61-$24.85*
Preferred Shipping Stocks Stock Prices as of September 25, 2015

8
Monday, September 28, 2015 (Week 39)
Indices Week ending, Friday, September 25, 2015
CAPITAL MARKETS DATA
MAJOR INDICES
CAPITAL LINK MARITIME INDICES
America Symbol 9/25/2015 9/18/2015 % Change YTD % Change 2-Jan-15
Dow Jones INDU 16,314.67 16,384.58 -0.43 -8.51 17,832.99
Dow Jones Transp. TRAN 7,850.62 8,036.37 -2.31 -13.72 9,098.98
NASDAQ CCMP 4,686.50 4,827.23 -2.92 -0.85 4,726.81
NASDAQ Transp. CTRN 3,426.34 3,573.83 -4.13 -12.96 3,936.65
S&P 500 SPX 1,931.34 1,958.03 -1.36 -6.16 2,058.20
Europe Symbol 9/25/2015 9/18/2015 % Change YTD % Change 2-Jan-15
Deutsche Borse Ag DAX 9,688.53 9,916.16 -2.30 -0.78 9,764.73
Euro Stoxx 50 SX5E 3,113.16 3,157.30 -1.40 -0.84 3,139.44
FTSE 100 Index UKX 6,109.01 6,104.11 0.08 -6.70 6,547.80
Asia/Pacific Symbol 9/25/2015 9/18/2015 % Change YTD % Change 2-Jan-15
ASX 200 AS51 5,042.11 5,170.50 -2.48 -7.24 5,435.93
Hang Seng HSI 21,186.32 21,920.83 -3.35 -11.20 23,857.82
Nikkei 225 NKY 17,880.51 18,070.21 -1.05 2.46 17,450.77
Index Symbol 9/25/2015 9/18/2015 % Change 2-Jan-15 YTD % Change
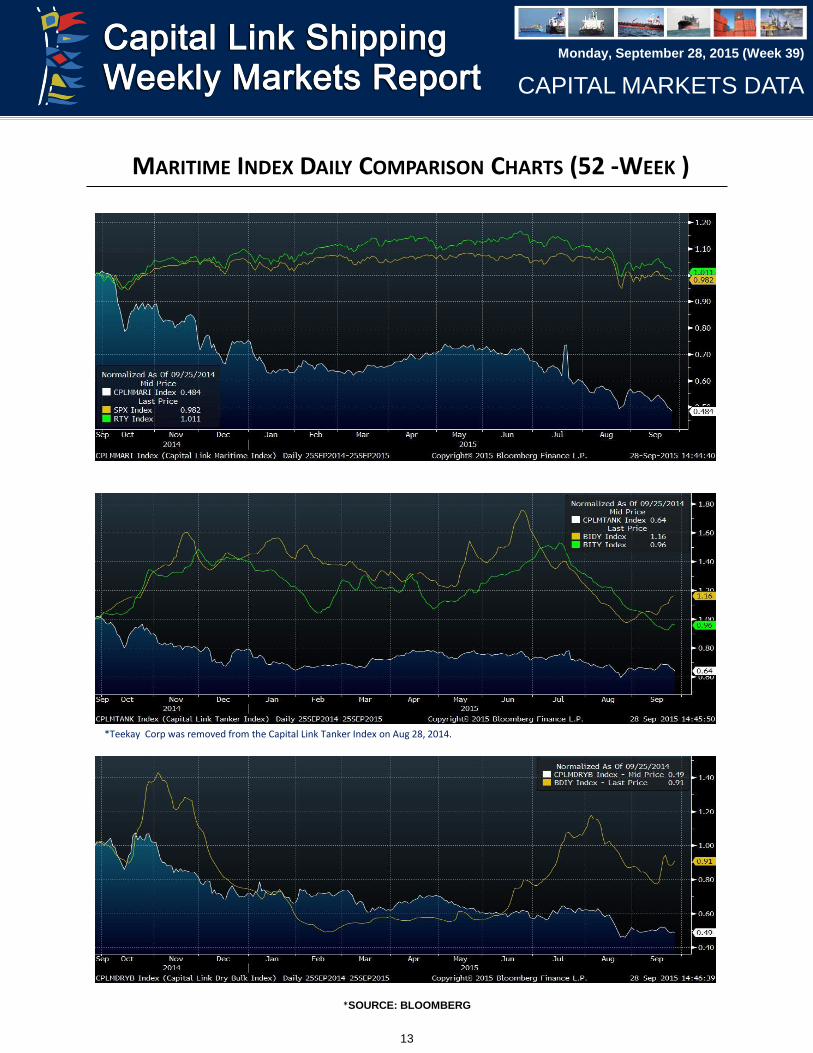
Capital Link Maritime Index CLMI 1,472.30 1,626.80 -9.50 2,270.00 -35.14
Tanker Index CLTI 1,083.35 1,160.19 -6.62 1,322.86 -18.11
Drybulk Index CLDBI 421.86 445.86 -5.38 622.45 -32.23
Container Index CLCI 1,209.61 1,289.71 -6.21 1,471.29 -17.79
LNG/LPG Index CLLG 2,087.02 2,335.20 -10.63 3,082.31 -32.29
Mixed Fleet Index CLMFI 1,236.78 1,330.57 -7.05 2,441.80 -49.35
MLP Index CLMLP 1,608.45 1,776.59 -9.46 2,882.73 -44.20
*The Capital Link Maritime Indices were updated recently to adjust for industry changes. Dorian LPG Ltd (NYSE:LPG) became a member of Capital
Link LNG/LPG Index, GasLog Partners L.P. (NYSE:GLOP) became a member of Capital Link LNG/LPG Index and Capital Link MLP Index, Navios
Maritime Midstream Partners (NYSE:NAP) became a member of Capital Link MLP Index, Euronav NV (NYSE: EURN) became a member of Capital
Link Tanker Index, and Gener8 Maritime (NYSE: GNRT) became a member of Capital Link Tanker Index. Additionally, Capital Link Dry Bulk Index
reflects the stock name change of Baltic Trading Ltd (NYSE: BALT) to Genco Shipping & Trading Limited (NYSE: GNK).

9
Monday, September 28, 2015 (Week 39)
CAPITAL MARKETS DATA
TRANSPORTATION STOCKS
DRYBULK TICKER 9/25/2015
Friday
9/18/2015
Friday
Change
%
52 week
high
52 week
low 1/2/2015
Three Month
Avg. Volume
Genco Shipping & Trading Ltd GNK $4.37 $4.75 -8.00% N/A N/A N/A 55,271
Diana Shipping Inc DSX $6.84 $6.81 0.44% $9.21 $6.02 $6.65 419,058
DryShips Inc DRYS $0.18 $0.23 -23.25% $2.52 $0.16 $1.13 4,824,917
Eagle Bulk Shipping Inc EGLE $6.45 $7.46 -13.54% $16.44 $0.68 $14.42 97,464
FreeSeas Inc FREE $0.15 $0.29 -48.45% $84.38 $0.14 $0.09 1,055,969
Globus Maritime Ltd GLBS $1.14 $1.12 1.64% $3.40 $0.98 $2.30 6,009
Golden Ocean Group GOGL $2.66 $3.13 -15.02% $9.03 $2.57 $4.27 371,501
Navios Maritime Holdings Inc NM $2.64 $2.82 -6.38% $6.25 $2.58 $4.09 727,977
Navios Maritime Partners LP NMM $7.68 $8.40 -8.57% $18.12 $6.96 $11.01 525,619
Paragon Shipping Inc PRGN $0.32 $0.36 -11.16% $4.16 $0.32 $2.66 92,474
Safe Bulkers Inc SB $2.92 $3.25 -10.15% $6.99 $2.83 $3.84 277,836
Scorpio Bulkers SALT $1.55 $1.66 -6.63% $6.06 $1.31 $1.95 2,620,386
Seanergy Maritime SHIP $0.77 $0.78 -2.00% $1.77 $0.55 $0.90 36,029
Star Bulk Carriers Corp SBLK $2.43 $2.38 2.10% $11.08 $2.09 $6.12 482,590
BALTIC INDICES
Index Symbol 9/25/2015 9/18/2015 % Change 2-Jan-15 YTD % Change
Baltic Dry Index BDIY 943 960 -1.77 771 22.31
Baltic Capesize Index BCIY 2,024 1,995 1.45 456 343.86
Baltic Panamax Index BPIY 744 753 -1.20 827 -10.04
Baltic Supramax Index BSI 733 762 -3.81 884 -17.08
Baltic Handysize Index BHSI 408 426 -4.23 488 -16.39
Baltic Dirty Tanker Index BDTI 706 666 6.01 885 -20.23
Baltic Clean Tanker Index BCTI 532 518 2.70 775 -31.35
TANKERS Ticker 9/25/2015 9/18/2015 Change % 52 wk
high
52 wk
low 1/2/2015
3-Month
Avg. Vol.
Ardmore Shipping Corp ASC $12.39 $12.91 -4.03% $14.66 $8.81 $12.00 235,557
Capital Product Partners LP CPLP $6.59 $7.11 -7.31% $9.98 $6.25 $7.97 436,177
DHT Holdings Inc DHT $7.37 $7.86 -6.23% $9.05 $5.30 $7.71 1,511,685
Euronav NV EURN $14.16 $14.72 -3.80% $16.32 $10.95 N/A 786,691
Frontline Ltd/Bermuda FRO $2.59 $2.90 -10.69% $4.63 $1.22 $2.51 2,121,639
Gener8 Maritime Inc GNRT $11.70 $12.07 -3.07% $14.37 $11.18 N/A 422,679
Knot Offshore Partners KNOP $16.87 $18.52 -8.91% $26.42 $13.20 $23.21 104,339
Navios Acquisition NNA $3.50 $3.92 -10.71% $4.33 $2.47 $3.76 453,317
Navios Midstream Partners NAP $11.98 $13.01 -7.92% $17.70 $11.50 $13.39 56,163
Nordic American NAT $15.45 $15.82 -2.34% $17.27 $7.19 $10.21 2,136,653
Scorpio Tankers Inc STNG $9.33 $9.94 -6.14% $11.55 $6.74 $8.54 2,458,503
Teekay Offshore Partners LP TOO $14.53 $16.73 -13.15% $33.91 $14.01 $26.00 352,693
Teekay Tankers Ltd TNK $6.76 $6.97 -3.01% $7.82 $3.38 $5.22 1,820,593
Top Ships TOPS $0.87 $1.02 -14.71% $1.99 $0.87 $1.11 34,601
Tsakos Energy Navigation Ltd TNP $8.19 $8.81 -7.04% $10.32 $4.99 $6.96 627,686

10
Monday, September 28, 2015 (Week 39)
CAPITAL MARKETS DATA
LPG/LNG Ticker 9/25/2015 9/18/2015 Change % 52 wk
high
52 wk
low 1/2/2015
3-Month
Avg. Vol.
Dynagas LNG Partners DLNG $13.47 $14.03 -3.99% $23.77 $12.05 $17.23 101,765
GasLog Ltd GLOG $10.27 $12.82 -19.89% $23.41 $9.31 $20.08 923,929
Gaslog Partners GLOP $15.29 $16.47 -7.16% $30.80 $14.51 $26.41 201,593
Golar LNG Ltd GLNG $30.54 $34.48 -11.43% $67.65 $26.01 $35.71 1,297,485
Golar LNG Partners LP GMLP $16.22 $18.85 -13.95% $37.78 $15.23 $31.93 246,389
Hoegh LNG Partners HMLP $17.01 $17.73 -4.06% $23.56 $16.54 $20.48 29,845
Navigator Gas NVGS $14.23 $15.51 -8.25% $28.59 $13.95 $20.19 180,745
StealthGas Inc GASS $4.22 $4.39 -3.87% $9.20 $4.12 $6.33 70,041
Teekay LNG Partners LP TGP $24.17 $26.25 -7.92% $43.56 $22.19 $42.91 297,859
MIXED FLEET Ticker 9/25/2015 9/18/2015 Change % 52 wk
high
52 wk
low 1/2/2015
3-Month
Avg. Vol.
Euroseas Ltd ESEA $4.85 $4.45 8.99% $11.30 $4.18 $7.53 6,666
Ship Finance International Ltd SFL $15.85 $16.50 -3.94% $17.39 $13.11 $14.67 596,584
Teekay Corp TK $31.11 $34.39 -9.54% $67.12 $29.28 $50.05 599,733
MLPs Ticker 9/25/2015 9/18/2015 Change % 52 wk
high
52 wk
low 1/2/2015
3-Month
Avg. Vol.
Capital Product Partners CPLP $6.59 $7.11 -7.31% $9.98 $6.25 $7.97 436,177
Dynagas LNG Partners DLNG $13.47 $14.03 -3.99% $23.77 $12.05 $17.23 101,765
GasLog Partners GLOP $15.29 $16.47 -7.16% $30.80 $14.51 $26.41 201,593
Golar LNG Partners LP GMLP $16.22 $18.85 -13.95% $37.78 $15.23 $31.93 246,389
Hoegh LNG Partners HMLP $17.01 $17.73 -4.06% $23.56 $16.54 $20.48 29,845
Knot Offshore Partners KNOP $16.87 $18.52 -8.91% $26.42 $13.20 $23.21 104,339
Navios Maritime Midstream NAP $11.98 $13.01 -7.92% $17.70 $11.50 $13.39 56,163
Navios Partners NMM $7.68 $8.40 -8.57% $18.12 $6.96 $11.01 525,619
Teekay Offshore TOO $14.53 $16.73 -13.15% $33.91 $14.01 $26.00 352,693
Teekay LNG Partners TGP $24.17 $26.25 -7.92% $43.56 $22.19 $42.91 297,859
OFFSHORE DRILL RIGS Ticker 9/25/2015 9/18/2015 Change % 52 wk
high
52 wk
low 1/2/2015
3-Month
Avg. Vol.
Atwood Oceanics ATW $15.45 $16.52 -6.48% $44.21 $14.70 $28.67 3,125,018
Diamond Offshore Drilling DO $18.34 $20.18 -9.12% $39.28 $17.78 $37.23 2,876,005
Ensco International ESV $14.49 $15.44 -6.15% $42.06 $14.02 $30.17 6,982,796
Noble Corp. NE $10.93 $11.47 -4.71% $22.54 $10.63 $16.84 10,716,238
Ocean Rig UDW Inc ORIG $2.31 $2.92 -20.89% $16.26 $2.17 $9.42 1,473,788
Pacific Drilling PACD $1.35 $1.59 -15.09% $8.59 $1.28 $4.71 819,292
Rowan Companies RDC $16.21 $17.09 -5.15% $25.49 $15.15 $23.72 2,801,780
Seadrill Ltd. SDRL $6.18 $6.89 -10.30% $26.76 $5.76 $12.01 3,146,338
Transocean RIG $12.58 $14.31 -12.09% $32.59 $11.60 $18.12 4,438,121
CONTAINERS Ticker 9/25/2015 9/18/2015 Change % 52 wk
high
52 wk
low 1/2/2015
3-Month
Avg. Vol.
Box Ships Inc TEU $0.47 $0.63 -25.05% $1.25 $0.47 $0.89 79,124
Costamare Inc CMRE $13.73 $14.75 -6.92% $22.30 $12.85 $17.61 134,684
Danaos Corp DAC $5.93 $6.01 -1.33% $6.62 $4.13 $5.57 34,518
Diana Containerships Inc DCIX $1.31 $1.54 -14.94% $2.66 $1.29 $2.03 92,322
Global Ship Lease Inc GSL $5.00 $5.66 -11.66% $6.29 $3.12 $4.65 82,569
Seaspan Corp SSW $15.72 $16.66 -5.64% $21.77 $15.14 $18.39 217,370

11
Monday, September 28, 2015 (Week 39)
OFFSHORE SUPPLY Ticker 9/25/2015 9/18/2015 Change % 52 wk
high
52 wk
low 1/2/2015
3-Month
Avg. Vol.
Gulfmark Offshore GLF $6.80 $7.13 -4.63% $32.84 $6.49 $24.80 544,618
Hornback Offshore HOS $14.04 $16.20 -13.33% $34.36 $14.02 $24.77 1,025,873
Nordic American Offshore NAO $6.19 $6.20 -0.16% $17.67 $5.96 $12.51 131,036
Tidewater TDW $14.47 $15.77 -8.24% $40.22 $13.85 $32.33 1,280,701
Seacor Holdings CKH $61.35 $62.32 -1.56% $82.45 $59.28 $74.10 172,779
OSLO-Listed Shipping Comps
(currency in NOK) Ticker 9/25/2015 9/18/2015 Change %
52 wk
high
52 wk
low 1/2/2015
3-Month
Avg. Vol.
Goldean Ocean GOGL $23.70 $25.70 -7.78% $44.80 $21.80 N/A N/A
Stolt-Nielsen Ltd. SNI $120.00 $118.00 1.69% $142.50 $106.50 $124.50 34,147
Frontline Ltd. FRO $23.15 $23.83 -2.85% $33.20 $8.19 $19.40 1,889,596
Jinhui Shpg. & Trans JIN $9.79 $10.05 -2.59% $16.40 $9.65 $12.50 60,065
Odfjell (Common A Share) ODF $27.90 $27.00 3.33% $31.00 $18.60 $31.00 14,195
Odfjell (Common B Share) ODFB $26.70 $26.30 1.52% $27.60 $17.80 $27.50 4,312
American Shipping Co. AMSC $39.50 $39.00 1.28% $45.10 $27.07 $34.84 23,040
Hoegh LNG HLNG $119.00 $112.50 5.78% $132.50 $70.25 $84.75 101,137
I.M. Skaugen IMSK $2.06 $2.06 0.00% $6.80 $1.90 $4.68 39,171
Western Bulk WBULK $2.82 $2.73 3.30% $7.65 $2.52 $4.51 97,181

12
Monday, September 28, 2015 (Week 39)
Shipping Equities: The Week in Review SHIPPING EQUITIES UNDERPERFORM THE BROADER MARKET
During last week, shipping equities underperformed the broader market, with the Capital Link Maritime Index
(CLMI), a composite index of all US listed shipping stocks, down 9.50%, compared to the S&P 500 declining
1.36%, Nasdaq decreasing 2.92%, and Dow Jones Industrial Average (DJII) deminishing 0.43%.
Dry Bulk stocks were the best performers during last week, with Capital Link Dry Bulk Index decreasing 5.38%,
followed by Capital Link Container Index down 6.21%. LNG/LPG equities were the least performer during last
week, with Capital Link LNG/LPG Index declining 10.63%.
During last week, Dry Bulk shipping stocks underperformed the physical market, with Baltic Dry Index (BDI)
declining 1.77%, compared to the Capital Link Dry Bulk Index decreasing 5.38%.
During last week, Baltic Dirty Tanker Index (BDTI) grew 6.01%, and Baltic Clean Tanker Index (BCTI) rose
2.70%, compared to Capital Link Tanker Index down 6.62%.
The Trading Statistics supplied by KCG Holdings, Inc. provide details of the trading performance of each
shipping stock and analyze the market’s trading momentum and trends for the week and year-to-date.
The objective of the Capital Link Maritime Indices is to enable investors, as well as all shipping market
participants, to better track the performance of listed shipping stocks individually, by sector or as an industry.
Performance can be compared to other individual shipping stocks, to their sector, to the broader market, as well
as to the physical underlying shipping markets or other commodities. The Indices currently focus only on
companies listed on US Exchanges providing a homogeneous universe. They are calculated daily and are
based on the market capitalization weighting of the stocks in each index. In terms of historical data, the indices
go back to January 2, 2005, thereby providing investors with historical performance.
There are seven indices in total; the Capital Link Maritime Index comprised of all 45 listed shipping stocks, and
six Sector Indices, the CL Dry Bulk Index, the CL Tanker Index, the CL Container Index, the CL LNG / LPG
Index, the CL Mixed Fleet Index and the CL Maritime MLP Index.
The Index values are updated daily after the market close and can be accessed at
www.CapitalLinkShipping.com or at or www.MaritimeIndices.com. They can also be found through the
Bloomberg page “CPLI” and Reuters.
CAPITAL MARKETS DATA
Get your message across to
36,000 weekly recipients around the globe
Join a select group of shipping & financial industry’s advertisers by promoting your
brand with Capital Link’s Shipping Weekly Markets Report.
For additional advertising information and a media kit, please contact/email:
Capital Link at +1 212 661-7566 or [email protected]
13
Monday, September 28, 2015 (Week 39)
MARITIME INDEX DAILY COMPARISON CHARTS (52 -WEEK )
*SOURCE: BLOOMBERG
CAPITAL MARKETS DATA
*Teekay Corp was removed from the Capital Link Tanker Index on Aug 28, 2014.

14
Monday, September 28, 2015 (Week 39)
Custom Statistics Prepared Weekly for Capital Link Shipping
BROAD MARKET
Percent Change of Major Indexes for the Week Ending Friday, September 18, 2015
Name Symbol Close Net Gain Percent Gain
Dow Jones Industrial Average Index INDU 16314.67 -69.91 -0.43%
S&P 500 Index SPX 1931.34 -26.74 -1.37%
Russell 1000 Index RUI 1076.7 -17.15 -1.57%
Russell 3000 Index RUA 1150.73 -20.17 -1.72%
Nasdaq-100 Index NDX 4224.74 -99.12 -2.29%
Dow Jones Transportation Index TRAN 7850.62 -185.75 -2.31%
Nasdaq Composite Index COMPX 4686.5 -140.73 -2.92%
Russell 2000 Index RUT 1122.87 -40.48 -3.48%
SHIPPING INDUSTRY DATA (43 Companies)
Moving Averages
• 12.50% closed > 10D Moving Average.
• 7.50% closed > 50D Moving Average.
• 7.50% closed > 100D Moving Average.
• 15.00% closed > 200D Moving Average.
Top Upside Momentum (Issues with the greatest 100 day upside
momentum*)
Top Downside Momentum (Issues with the greatest 100 day
downward momentum*)
*Momentum: Momentum: (100D % change) + 1.5*(50D % change)
+ 2.0*(10D % change) for each stock then sort group in descending order and report the top 10.
*Momentum: (100D % change) + 1.5*(50D % change) + 2.0*(10D
% change) for each stock then sort all names that have a negative value in ascending order and report the top 10.
Symbol Close Weekly %
Change
50-Day %
Change
NAT 15.45 -2.34% -4.63%
ASC 12.39 -4.03% -5.85%
TNK 6.76 -3.01% -7.90%
FRO 2.59 -10.69% 2.78%
SFL 15.85 -3.94% -3.82%
DHT 7.37 -6.23% -9.35%
Symbol Close Weekly %
Change
50-Day %
Change
FREE 0.15 -48.28% -93.98%
DRYS 0.18 -21.74% -70.97%
PRGN 0.32 -11.11% -72.17%
TEU 0.47 -25.40% -52.04%
GLOG 10.27 -19.89% -40.43%
DCIX 1.31 -14.94% -34.17%
GMLP 16.22 -13.95% -30.03%
TOO 14.53 -13.15% -25.06%
NMM 7.68 -8.57% -29.67%
TOPS 0.87 -14.71% -28.10%
SHIPPING MARKETS
Top Consecutive Higher Closes Top Consecutive Lower Closes
Symbol Close Up Streak
NM 2.64 2
SBLK 2.43 2
Symbol Close Up Streak
DAC 5.93 -2
FREE 0.15 -2
TNK 6.76 -3
NAT 15.45 -3
SALT 1.55 -4
NVGS 14.23 -4
KNOP 16.87 -4
GSL 5 -4
DHT 7.37 -4
FRO 2.59 -5

15
Monday, September 28, 2015 (Week 39)
Top Largest Weekly Trading Gains Top Largest Weekly Trading Losses
Symbol Close One
Week Ago
Today
Close
Net
Change % Change
ESEA 4.45 4.85 0.40 8.99%
SBLK 2.38 2.43 0.05 2.10%
DSX 6.81 6.84 0.03 0.44%
Symbol Close One
Week Ago
Today
Close
Net
Change % Change
FREE 0.29 0.15 -0.14 -48.28%
TEU 0.63 0.47 -0.16 -25.40%
DRYS 0.23 0.18 -0.05 -21.74%
GLOG 12.82 10.27 -2.55 -19.89%
DCIX 1.54 1.31 -0.23 -14.94%
TOPS 1.02 0.87 -0.15 -14.71%
GMLP 18.85 16.22 -2.63 -13.95%
EGLE 7.46 6.45 -1.01 -13.54%
TOO 16.73 14.53 -2.20 -13.15%
GSL 5.66 5 -0.66 -11.66%
Top Largest Monthly Trading Gains (A month has been
standardized to 20 trading days)
Top Largest Monthly Trading*Losses (A month has been
standardized to 20 trading days)
Stocks Nearest to 52-Week Highs Stocks Nearest To 52-Week Lows
Symbol Close One
Month Ago
Today
Close
Net
Change % Change
ASC 10.99 12.39 1.40 12.74%
TNK 6.1 6.76 0.66 10.82%
TNP 7.51 8.19 0.68 9.05%
NAT 14.23 15.45 1.22 8.57%
SBLK 2.24 2.43 0.19 8.48%
NNA 3.23 3.5 0.27 8.36%
DSX 6.54 6.84 0.30 4.59%
DHT 7.11 7.37 0.26 3.66%
NMM 7.48 7.68 0.20 2.67%
FRO 2.55 2.59 0.04 1.57%
Symbol Close One
Month Ago
Today
Close
Net
Change % Change
DRYS 0.45 0.18 -0.27 -60.00%
FREE 0.37 0.15 -0.22 -59.46%
PRGN 0.65 0.32 -0.33 -50.77%
TEU 0.65 0.47 -0.18 -27.69%
GLOG 13.53 10.27 -3.26 -24.09%
DCIX 1.65 1.31 -0.34 -20.61%
GLNG 35.98 30.54 -5.44 -15.12%
TOPS 1.02 0.87 -0.15 -14.71%
TOO 17.02 14.53 -2.49 -14.63%
TK 34.82 31.11 -3.71 -10.65%
Symbol 52W Low % Away
CMRE 13.40 2.46%
GASS 4.10 2.93%
TK 30.00 3.70%
SSW 15.11 4.04%
TGP 22.88 5.64%
NVGS 13.46 5.72%
TOO 13.74 5.75%
SB 2.70 8.15%
NM 2.43 8.83%
GLNG 26.77 14.07%
SHIPPING MARKETS
Symbol 52W High % Away
SFL 16.80 -5.65%
NAT 17.01 -9.18%
DAC 6.70 -11.49%
TNK 7.88 -14.21%
MATX 43.80 -14.77%
DHT 8.89 -17.07%
ASC 14.97 -17.22%
STNG 11.50 -18.88%
GSL 6.30 -20.61%
NNA 4.44 -21.12%
16
Monday, September 28, 2015 (Week 39)
SHIPPING MARKETS
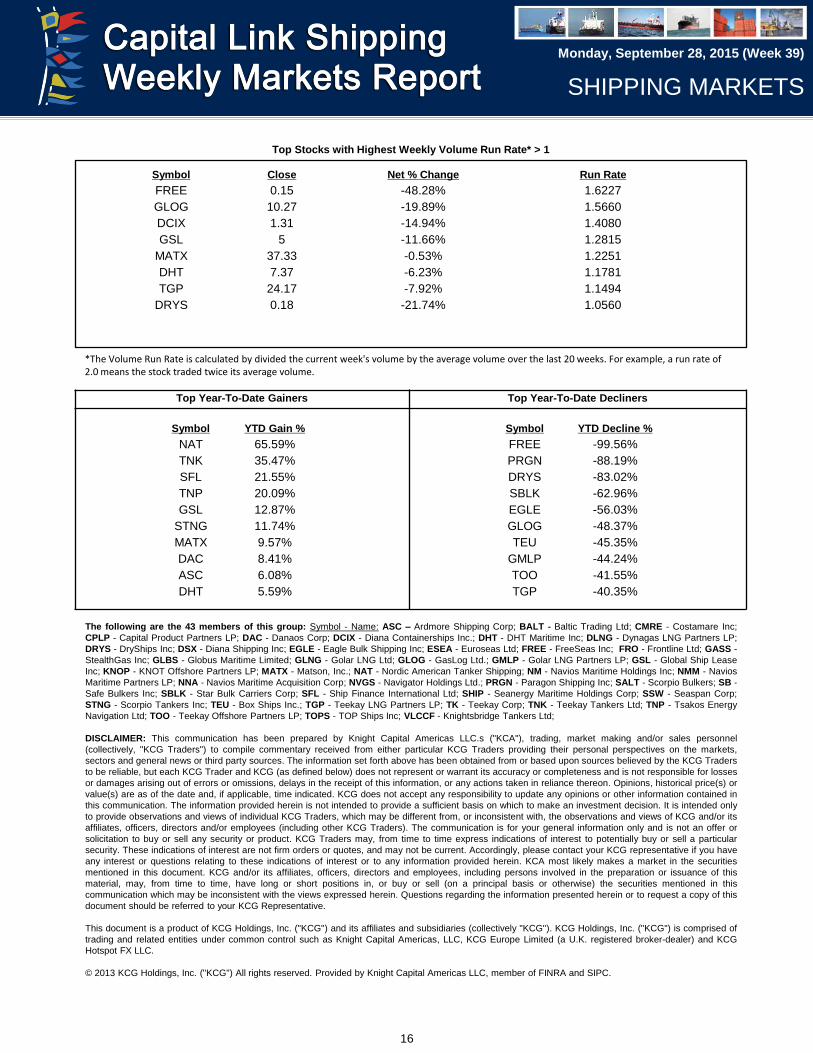
Symbol Close Net % Change Run Rate
FREE 0.15 -48.28% 1.6227
GLOG 10.27 -19.89% 1.5660
DCIX 1.31 -14.94% 1.4080
GSL 5 -11.66% 1.2815
MATX 37.33 -0.53% 1.2251
DHT 7.37 -6.23% 1.1781
TGP 24.17 -7.92% 1.1494
DRYS 0.18 -21.74% 1.0560
Top Stocks with Highest Weekly Volume Run Rate* > 1
*The Volume Run Rate is calculated by divided the current week's volume by the average volume over the last 20 weeks. For example, a run rate of 2.0 means the stock traded twice its average volume.
Top Year-To-Date Gainers Top Year-To-Date Decliners
Symbol YTD Gain %
NAT 65.59%
TNK 35.47%
SFL 21.55%
TNP 20.09%
GSL 12.87%
STNG 11.74%
MATX 9.57%
DAC 8.41%
ASC 6.08%
DHT 5.59%
The following are the 43 members of this group: Symbol - Name: ASC – Ardmore Shipping Corp; BALT - Baltic Trading Ltd; CMRE - Costamare Inc;
CPLP - Capital Product Partners LP; DAC - Danaos Corp; DCIX - Diana Containerships Inc.; DHT - DHT Maritime Inc; DLNG - Dynagas LNG Partners LP;
DRYS - DryShips Inc; DSX - Diana Shipping Inc; EGLE - Eagle Bulk Shipping Inc; ESEA - Euroseas Ltd; FREE - FreeSeas Inc; FRO - Frontline Ltd; GASS -
StealthGas Inc; GLBS - Globus Maritime Limited; GLNG - Golar LNG Ltd; GLOG - GasLog Ltd.; GMLP - Golar LNG Partners LP; GSL - Global Ship Lease
Inc; KNOP - KNOT Offshore Partners LP; MATX - Matson, Inc.; NAT - Nordic American Tanker Shipping; NM - Navios Maritime Holdings Inc; NMM - Navios
Maritime Partners LP; NNA - Navios Maritime Acquisition Corp; NVGS - Navigator Holdings Ltd.; PRGN - Paragon Shipping Inc; SALT - Scorpio Bulkers; SB -
Safe Bulkers Inc; SBLK - Star Bulk Carriers Corp; SFL - Ship Finance International Ltd; SHIP - Seanergy Maritime Holdings Corp; SSW - Seaspan Corp;
STNG - Scorpio Tankers Inc; TEU - Box Ships Inc.; TGP - Teekay LNG Partners LP; TK - Teekay Corp; TNK - Teekay Tankers Ltd; TNP - Tsakos Energy
Navigation Ltd; TOO - Teekay Offshore Partners LP; TOPS - TOP Ships Inc; VLCCF - Knightsbridge Tankers Ltd;
DISCLAIMER: This communication has been prepared by Knight Capital Americas LLC.s ("KCA"), trading, market making and/or sales personnel
(collectively, "KCG Traders") to compile commentary received from either particular KCG Traders providing their personal perspectives on the markets,
sectors and general news or third party sources. The information set forth above has been obtained from or based upon sources believed by the KCG Traders
to be reliable, but each KCG Trader and KCG (as defined below) does not represent or warrant its accuracy or completeness and is not responsible for losses
or damages arising out of errors or omissions, delays in the receipt of this information, or any actions taken in reliance thereon. Opinions, historical price(s) or
value(s) are as of the date and, if applicable, time indicated. KCG does not accept any responsibility to update any opinions or other information contained in
this communication. The information provided herein is not intended to provide a sufficient basis on which to make an investment decision. It is intended only
to provide observations and views of individual KCG Traders, which may be different from, or inconsistent with, the observations and views of KCG and/or its
affiliates, officers, directors and/or employees (including other KCG Traders). The communication is for your general information only and is not an offer or
solicitation to buy or sell any security or product. KCG Traders may, from time to time express indications of interest to potentially buy or sell a particular
security. These indications of interest are not firm orders or quotes, and may not be current. Accordingly, please contact your KCG representative if you have
any interest or questions relating to these indications of interest or to any information provided herein. KCA most likely makes a market in the securities
mentioned in this document. KCG and/or its affiliates, officers, directors and employees, including persons involved in the preparation or issuance of this
material, may, from time to time, have long or short positions in, or buy or sell (on a principal basis or otherwise) the securities mentioned in this
communication which may be inconsistent with the views expressed herein. Questions regarding the information presented herein or to request a copy of this
document should be referred to your KCG Representative.
This document is a product of KCG Holdings, Inc. ("KCG") and its affiliates and subsidiaries (collectively "KCG"). KCG Holdings, Inc. ("KCG") is comprised of
trading and related entities under common control such as Knight Capital Americas, LLC, KCG Europe Limited (a U.K. registered broker-dealer) and KCG
Hotspot FX LLC.
© 2013 KCG Holdings, Inc. ("KCG") All rights reserved. Provided by Knight Capital Americas LLC, member of FINRA and SIPC.
Symbol YTD Decline %
FREE -99.56%
PRGN -88.19%
DRYS -83.02%
SBLK -62.96%
EGLE -56.03%
GLOG -48.37%
TEU -45.35%
GMLP -44.24%
TOO -41.55%
TGP -40.35%

17
Monday, September 28, 2015 (Week 39)
17
Global Shipping Company Bond Data
Contributed by Stifel Nicolaus & Co, Inc.
SHIPPING MARKETS
18
Monday, September 28, 2015 (Week 39)
SHIPPING MARKETS
Contributed by
Allied Shipbroking Inc
48 Aigialeias Str. 151 25 Maroussi
Athens, Greece
Phone: +30 2104524500
Website: www.allied-shipbroking.gr
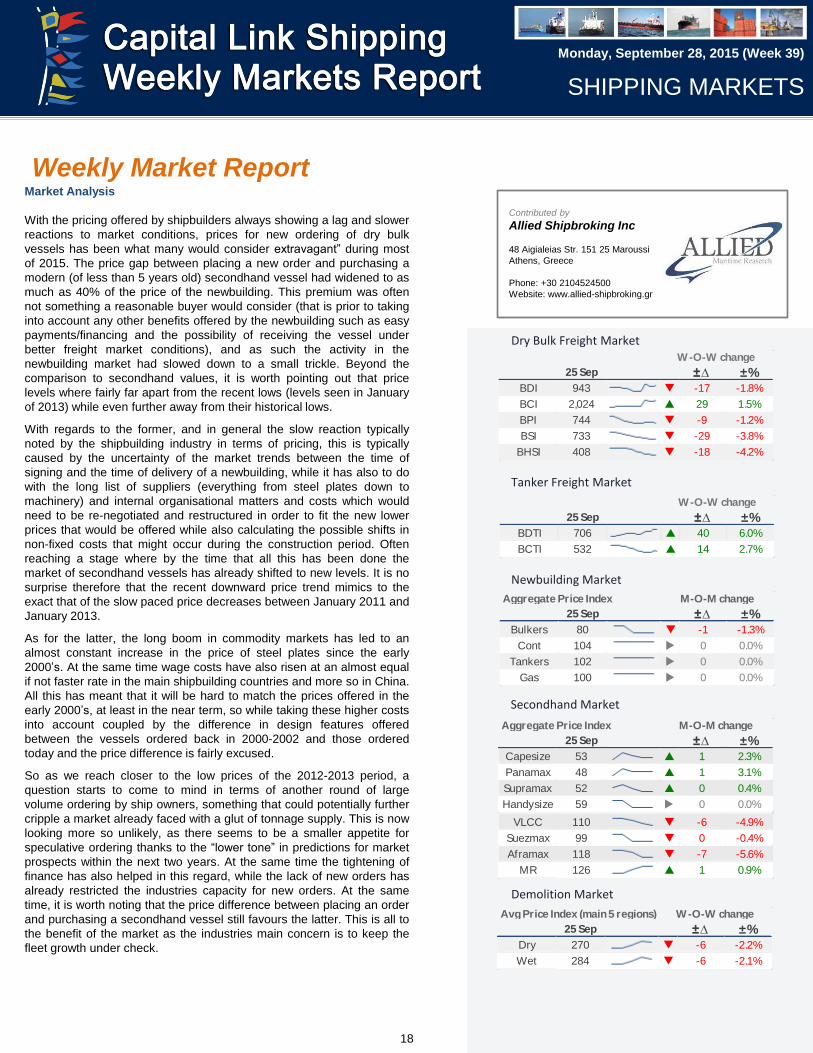
Weekly Market Report Market Analysis
With the pricing offered by shipbuilders always showing a lag and slower
reactions to market conditions, prices for new ordering of dry bulk
vessels has been what many would consider extravagant” during most
of 2015. The price gap between placing a new order and purchasing a
modern (of less than 5 years old) secondhand vessel had widened to as
much as 40% of the price of the newbuilding. This premium was often
not something a reasonable buyer would consider (that is prior to taking
into account any other benefits offered by the newbuilding such as easy
payments/financing and the possibility of receiving the vessel under
better freight market conditions), and as such the activity in the
newbuilding market had slowed down to a small trickle. Beyond the
comparison to secondhand values, it is worth pointing out that price
levels where fairly far apart from the recent lows (levels seen in January
of 2013) while even further away from their historical lows.
With regards to the former, and in general the slow reaction typically
noted by the shipbuilding industry in terms of pricing, this is typically
caused by the uncertainty of the market trends between the time of
signing and the time of delivery of a newbuilding, while it has also to do
with the long list of suppliers (everything from steel plates down to
machinery) and internal organisational matters and costs which would
need to be re-negotiated and restructured in order to fit the new lower
prices that would be offered while also calculating the possible shifts in
non-fixed costs that might occur during the construction period. Often
reaching a stage where by the time that all this has been done the
market of secondhand vessels has already shifted to new levels. It is no
surprise therefore that the recent downward price trend mimics to the
exact that of the slow paced price decreases between January 2011 and
January 2013.
As for the latter, the long boom in commodity markets has led to an
almost constant increase in the price of steel plates since the early
2000’s. At the same time wage costs have also risen at an almost equal
if not faster rate in the main shipbuilding countries and more so in China.
All this has meant that it will be hard to match the prices offered in the
early 2000’s, at least in the near term, so while taking these higher costs
into account coupled by the difference in design features offered
between the vessels ordered back in 2000-2002 and those ordered
today and the price difference is fairly excused.
So as we reach closer to the low prices of the 2012-2013 period, a
question starts to come to mind in terms of another round of large
volume ordering by ship owners, something that could potentially further
cripple a market already faced with a glut of tonnage supply. This is now
looking more so unlikely, as there seems to be a smaller appetite for
speculative ordering thanks to the “lower tone” in predictions for market
prospects within the next two years. At the same time the tightening of
finance has also helped in this regard, while the lack of new orders has
already restricted the industries capacity for new orders. At the same
time, it is worth noting that the price difference between placing an order
and purchasing a secondhand vessel still favours the latter. This is all to
the benefit of the market as the industries main concern is to keep the
fleet growth under check.
Dry Bulk Freight Market
Secondhand Market
Newbuilding Market
Demolition Market
Tanker Freight Market
25 Sep ±∆ ±%BDI 943 q -17 -1.8%
BCI 2,024 p 29 1.5%
BPI 744 q -9 -1.2%
BSI 733 q -29 -3.8%
BHSI 408 q -18 -4.2%
W-O-W change
25 Sep ±∆ ±%BDTI 706 p 40 6.0%
BCTI 532 p 14 2.7%
W-O-W change
Avg Price Index (main 5 regions)
25 Sep ±∆ ±%Dry 270 q -6 -2.2%
Wet 284 q -6 -2.1%
W-O-W change
Aggregate Price Index
25 Sep ±∆ ±%Bulkers 80 q -1 -1.3%
Cont 104 u 0 0.0%
Tankers 102 u 0 0.0%
Gas 100 u 0 0.0%
M-O-M change
Aggregate Price Index
25 Sep ±∆ ±%Capesize 53 p 1 2.3%
Panamax 48 p 1 3.1%
Supramax 52 p 0 0.4%
Handysize 59 u 0 0.0%
M-O-M change
VLCC 110 q -6 -4.9%
Suezmax 99 q 0 -0.4%
Aframax 118 q -7 -5.6%
MR 126 p 1 0.9%

19
Monday, September 28, 2015 (Week 39)
Dry Bulkers – Spot Market
SHIPPING MARKETS
Capesize – With the overall mood having improved significantly over the
past weeks and position lists primed to provide real support to the market,
the upward direction was able to continue. Fresh inquiries kept at fairly
good volume levels allowing for owners to further increase their rate ideas,
yet things were a touch calmer then what we were witnessing a week prior
leading to a more moderate increase rate rather then the fast paced spike
we witnessed towards the end of the previous week.
Panamax - With the exception of some increases noted in the Pacific, the
market continued to suffer from a supply glut, especially in the U.S. Gulf.
The Pacific itself seemed to have been slightly hampered by a rush by
owners to fix their vessels before more upcoming holidays next week. All
attention is now pointed towards the Atlantic RV, which without its support it
looks as though it will be a tough deal to get the market on a firm course
once more.
Supramax - A fairly quiet week with little to show for as rates continued to
slip. The Far East was hampered considerably by a lack of fresh interest,
while only the Med/Black Sea region was showing some positive signs as
the lack in tonnage helped boost rates their.
Handysize - Things got hampered further this week with fairly strong
losses noted in both the Atlantic and Pacific basins as charterers seemed
to have gone quiet for the moment. The North Atlantic seemed to have
suffered the most, while things seemed to have held a lot better in the
Pacific basin.
2014 2015
BCI Average TCE
BPI Average TCE
BSI Average TCE
BHSI Average TCE
Dry Bulk Indices
25 Sep 18 Sep ±% 2015 2014
Baltic Dry Index
BDI 943 960 -1.8% 738 1,104
Capesize
BCI 2,024 1,995 1.5% 993 1,961
BCI 5TC $ 14,672 $ 14,658 0.1% $ 7,934 $ 15,278
ATLANTIC RV $ 13,675 $ 13,325 2.6% $ 8,293 $ 14,130
Cont / FEast $ 27,050 $ 26,700 1.3% $ 16,397 $ 32,135
PACIFIC RV $ 13,864 $ 13,591 2.0% $ 7,249 $ 14,319
FEast / ECSA $ 14,836 $ 15,809 -6.2% $ 8,309 $ 13,932
Panamax
BPI 744 753 -1.2% 737 964
BPI - TCA $ 5,962 $ 6,035 -1.2% $ 5,882 $ 7,714
ATLANTIC RV $ 5,455 $ 5,750 -5.1% $ 6,612 $ 6,861
Cont / FEast $ 11,073 $ 11,116 -0.4% $ 11,100 $ 15,315
PACIFIC RV $ 6,499 $ 6,432 1.0% $ 5,278 $ 7,844
FEast / Cont $ 822 $ 840 -2.1% $ 539 $ 835
Supramax
BSI 733 762 -3.8% 702 939
BSI - TCA $ 7,669 $ 7,972 -3.8% $ 7,343 $ 9,816
Cont / FEast $ 12,417 $ 12,808 -3.1% $ 10,166 $ 14,974
Med / Feast $ 12,079 $ 12,014 0.5% $ 9,523 $ 13,840
PACIFIC RV $ 5,683 $ 5,808 -2.2% $ 6,273 $ 8,873
FEast / Cont $ 4,090 $ 4,350 -6.0% $ 5,311 $ 6,179
USG / Skaw $ 12,456 $ 13,438 -7.3% $ 11,871 $ 14,638
Skaw / USG $ 4,854 $ 5,200 -6.7% $ 4,018 $ 4,971
Handysize
BHSI 408 426 -4.2% 379 523
BHSI - TCA $ 5,882 $ 6,150 -4.4% $ 5,603 $ 7,680
Skaw / Rio $ 5,150 $ 5,380 -4.3% $ 3,783 $ 5,625
Skaw / Boston $ 5,754 $ 6,008 -4.2% $ 4,019 $ 5,273
Rio / Skaw $ 9,453 $ 10,217 -7.5% $ 9,357 $ 10,072
USG / Skaw $ 8,736 $ 9,186 -4.9% $ 7,627 $ 10,743
SEAsia / Aus / Jap $ 3,991 $ 4,093 -2.5% $ 4,335 $ 7,022
PACIFIC RV $ 4,991 $ 5,111 -2.3% $ 5,683 $ 7,840
Spot market rates & indices Average
0
10
20
30
40
50'000 US$/day
0
5
10
15'000 US$/day
0
5
10
15'000 US$/day
0
3
6
9
12
15'000 US$/day
0
1,000
2,000
3,000
4,000
BDI BCI BPI BSI BHSI

20
Monday, September 28, 2015 (Week 39)
Tankers – Spot Market
SHIPPING MARKETS
Crude Oil Carriers - There was a small downward correct from last week
as things were moving slower in terms of fresh interest for Eastbound MEG
voyages. Demand continue to hold fairly firm for the Westbound trips and
with the WAF region livening up this week momentum seemed to still be
there. This was also evident in the Suezmax size which was playing catch
up to the larger rates that the VLs are now receiving. Afras are the only size
segment still lagging behind the current market trends, with further drops
noted in most regions with the exception of the Caribs region were things
were kept busier there.
Oil Products - With demand holding strong in the North Atlantic, large
gains were noted for both DPP and CPP cargoes. The Black Sea/Med
region was the only one suffering from a slack in demand compared to the
number of vessels open for fixing, while there seemed to be some
corrections being noted from the previous week’s closing levels for CPP
fixtures in the Caribs region and ex-USAC.
2014 2015
VLCC Average TCE
Suezmax Average TCE
Aframax Average TCE
MR Average TCE
Tanker Indices
25 Sep 18 Sep ±% 2015 2014
Baltic Tanker Indices
BDTI 706 666 6.0% 813 777
BCTI 532 518 2.7% 679 602
VLCC
WS 38.17 35.75 6.8% 33.42 28.24
$/day $ 38,938 $ 34,955 11.4% $ 25,383 -$ 6,110
WS 64.00 64.75 -1.2% 60.23 48.36
$/day $ 63,926 $ 64,583 -1.0% $ 55,299 $ 37,314
WS 62.57 63.41 -1.3% 58.97 47.70
$/day $ 70,098 $ 71,061 -1.4% $ 61,158 $ 25,202
WS 74.38 67.08 10.9% 69.80 57.22
$/day $ 77,280 $ 68,240 13.2% $ 67,183 $ 32,821
SUEZMAX
WS 92.50 62.50 48.0% 80.87 75.11
$/day $ 57,488 $ 34,688 65.7% $ 44,989 $ 27,044
WS 95.00 65.77 44.4% 89.67 82.23
$/day $ 50,203 $ 25,768 94.8% $ 44,287 $ 26,364
AFRAMAX
WS 82.78 85.00 -2.6% 111.28 109.50
$/day $ 17,442 $ 17,888 -2.5% $ 36,354 $ 23,581
WS 86.11 86.94 -1.0% 114.87 107.79
$/day $ 22,524 $ 22,707 -0.8% $ 31,459 $ 16,427
WS 122.22 110.00 11.1% 133.25 127.51
$/day $ 33,819 $ 28,398 19.1% $ 37,291 $ 24,895
WS 57.50 59.72 -3.7% 93.55 89.14
$/day $ 19,787 $ 20,962 -5.6% $ 43,417 $ 29,167
DPP
WS 110.00 75.00 46.7% 137.33 139.78
$/day $ 23,294 $ 11,801 97.4% $ 29,355 $ 21,213
WS 89.25 87.50 2.0% 124.14 127.00
$/day $ 20,152 $ 19,322 4.3% $ 29,787 $ 19,144
WS 96.19 94.53 1.8% 112.38 96.35
$/day $ 30,757 $ 29,821 3.1% $ 35,832 $ 17,892
WS 68.72 74.33 -7.5% 108.80 104.64
$/day $ 15,555 $ 17,938 -13.3% $ 35,321 $ 21,008
CPP
WS 81.94 82.22 -0.3% 114.51 96.90
$/day $ 21,357 $ 21,341 0.1% $ 31,385 $ 14,208
WS 100.91 94.09 7.2% 144.79 123.74
$/day $ 12,740 $ 11,177 14.0% $ 20,339 $ 9,516
WS 130.00 155.00 -16.1% 135.86 110.57
$/day $ 22,351 $ 28,446 -21.4% $ 21,940 $ 7,995
WS 103.21 142.50 -27.6% 99.16 92.94
$/day $ 14,097 $ 22,105 -36.2% $ 11,768 $ 3,442
BALTIC-UKC
ARA-USG
Spot market rates & indices Average
MED-MED
CONT-USAC
USG-CONT
MEG-USG
MEG-SPORE
WAF-USG
BSEA-MED
MEG-SPORE
MEG-JAPAN
WAF-USAC
NSEA-CONT
CARIBS-USG
CARIBS-USAC
SEASIA-AUS
MEG-JAPAN
CARIBS-USAC
450
650
850
1,050
1,250
1,450
BDTI BCTI
-100
1020304050607080
'000 US$/day
-25
0
25
50
75
100'000 US$/day
0
20
40
60
80
100'000 US$/day
5
10
15
20
25
30
35'000 US$/day

21
Monday, September 28, 2015 (Week 39)
Period Charter Market
SHIPPING MARKETS
Capesize Panamax
Dry Bulk 12 month period charter rates (USD ‘000/day)
VLCC Suezmax
Tanker 12 month period charter rates (USD ‘000/day)
Supramax Handysize
Aframax MR
Latest indicative Dry Bulk Period Fixtures
Latest indicative Tanker Period Fixtures
last 5 years
25 Sep 21 Aug ±% Min Avg Max
Capesize
$ 12,000 $ 12,250 -2.0% $ 7,950 $ 19,183 $ 40,200
$ 12,000 $ 13,500 -11.1% $ 9,950 $ 18,900 $ 33,700
Panamax
$ 8,250 $ 8,500 -2.9% $ 6,450 $ 13,607 $ 30,450
$ 8,750 $ 8,750 0.0% $ 7,950 $ 13,120 $ 22,450
Supramax
$ 8,250 $ 9,000 -8.3% $ 7,450 $ 12,832 $ 24,950
$ 8,250 $ 8,500 -2.9% $ 7,450 $ 12,381 $ 18,700
Handysize
$ 7,000 $ 7,000 0.0% $ 6,200 $ 10,262 $ 18,700
$ 7,250 $ 7,250 0.0% $ 6,950 $ 10,388 $ 15,200
36 months
12 months
36 months
36 months
12 months
36 months
12 months
12 months
Dry Bulk period market TC rates
last 5 years
25 Sep 21 Aug ±% Min Avg Max
VLCC
$ 48,000 $ 49,000 -2.0% $ 18,000 $ 29,270 $ 55,000
$ 42,500 $ 44,000 -3.4% $ 22,000 $ 31,728 $ 45,000
Suezmax
$ 36,000 $ 42,500 -15.3% $ 15,250 $ 22,683 $ 42,500
$ 33,500 $ 35,000 -4.3% $ 17,000 $ 24,203 $ 35,000
Aframax
$ 29,000 $ 29,000 0.0% $ 13,000 $ 17,018 $ 29,000
$ 25,000 $ 25,000 0.0% $ 14,750 $ 18,445 $ 25,000
MR
$ 19,500 $ 20,250 -3.7% $ 12,500 $ 14,317 $ 21,000
$ 17,500 $ 17,000 2.9% $ 13,500 $ 14,883 $ 17,500
12 months
36 months
Tanker period market TC rates
12 months
36 months
12 months
36 months
12 months
36 months
81012141618202224262830
6
7
8
9
10
11
12
13
7
8
8
9
9
10
10
11
11
12
6
7
8
9
10
11
20
25
30
35
40
45
50
55
60
15
20
25
30
35
40
45
12
14
16
18
20
22
24
26
28
30
1213141516171819202122
M/T ' 'COSBRIGHT LAKE'', 299000 dwt, built 2003, $42,500, for 3+3 months
storage, to TRAFIGURA
M/T ' 'GENER8 HORN'', 159000 dwt, built 1999, rnr, for 3 months trading, to
SHELL
M/T ' 'PARAMOUNT HYDRA'', 114000 dwt, built 2011, $29,950, for 1 year
trading, to VALERO
M/T ' 'OCEAN SCHOONER'', 73083 dwt, built 2000, $22,000, for 2 years
trading, to ATC
M/T ' 'STAR EXPRESS'', 45800 dwt, built 2005, $16,750, for 1 year trading, to
KOCH
M/V ' 'CAPE CENTURY'', 172683 dwt, built 2001, dely Xiamen spot , $12,850,
for 6 months trading, to SwissMarine
M/V ' 'AETOLIA'', 58106 dwt, built 2010, dely Richards Bay early October for
about, $8,000, for 10/14 months trading, to Olam
M/V ' 'YASA GULTEN'', 55953 dwt, built 2005, dely CJK prompt for about,
$7,600, for 4/6 months trading, to Gearbulk
M/V ' 'ULTRA PANACHE'', 78450 dwt, built 2011, dely Mundra 25 September
, $8,100, for 5/8 months trading, to Hudson
M/V ' 'BUNUN DYNASTY'', 37600 dwt, built 2014, dely Xiamen end
September about, $7,500, for 3/5 months trading, to Japanese chrtr

22
Monday, September 28, 2015 (Week 39)
Indicative Dry Bulk Values (US$ million)
25 Sep 21 Aug ±% Min Avg Max
Capesize
Resale 46.0 47.0 -2.1% 36.0 53.4 74.0
5 year old 35.0 33.0 6.1% 31.0 42.0 61.0
10 year old 20.0 19.0 5.3% 18.0 29.9 45.5
15 year old 10.5 10.5 0.0% 10.0 18.3 29.5
Panamax
Resale 28.0 28.0 0.0% 24.5 33.8 46.0
5 year old 18.0 17.0 5.9% 16.5 26.0 40.3
10 year old 12.0 11.5 4.3% 11.0 19.9 33.8
15 year old 6.5 6.3 4.0% 6.0 13.7 24.5
Supramax
Resale 25.5 26.5 -3.8% 23.5 31.2 40.0
5 year old 15.5 14.5 6.9% 14.5 24.0 32.3
10 year old 10.5 10.5 0.0% 10.5 18.0 26.3
15 year old 6.0 6.0 0.0% 6.0 12.6 21.6
Handysize
Resale 21.0 21.0 0.0% 21.0 24.7 30.0
5 year old 13.0 13.0 0.0% 13.0 19.8 27.4
10 year old 9.5 9.5 0.0% 9.0 15.0 21.8
15 year old 5.5 5.5 0.0% 5.5 10.4 16.5
last 5 years
Secondhand Asset Values
SHIPPING MARKETS
The combination of softening newbuilding prices and demo prices still
able to hold their ground fairly well, has started to create a reversal on
the previously widened gap between newbuilding, modern and older
aged vessels, allowing for a slight rebalancing, while for the moment this
rebalancing has been skewed towards the upper side of the price mark.
This is in part by a more optimistic approach towards the secondhand
vessels on offer, their recent earnings and all this against the historical
lows their values had reached during the summer months..
On the tanker side, things are still in a correcting phase, with buyers
seemingly in fright of the more moderate performance of the freight
market in recent weeks and still “scared” of the number of “shaky”
aspects, while others have also chosen to take up the newbuilding
option thanks to the narrow price difference that is currently on offer.
Capesize Panamax
Supramax Handysize
VLCC Suezmax
Aframax MR
Price movements of 5 year old Dry Bulk assets
Price movements of 5 year old Tanker assets
+6%
+13%
+6%
-27%-30%
-25%
-20%
-15%
-10%
-5%
0%
5%
10%
15%
1 month diff 3 months diff6 months diff 12 months diff
+6%+9%
+6%
-22%-25%
-20%
-15%
-10%
-5%
0%
5%
10%
15%
1 month diff 3 months diff6 months diff 12 months diff
+7% +7%
-3%
-34%-40%
-35%
-30%
-25%
-20%
-15%
-10%
-5%
0%
5%
10%
1 month diff 3 months diff6 months diff 12 months diff
+0% +0%
-4%
-32%-35%
-30%
-25%
-20%
-15%
-10%
-5%
0%
1 month diff 3 months diff6 months diff 12 months diff
Indicative Tanker Values (US$ million)
25 Sep 21 Aug ±% Min Avg Max
VLCC
Resale 105.0 105.0 0.0% 80.0 97.1 117.0
5 year old 80.0 84.0 -4.8% 55.0 72.0 91.0
10 year old 55.0 59.0 -6.8% 33.8 48.2 65.0
15 year old 38.0 41.0 -7.3% 16.9 26.7 41.0
Suezmax
Resale 72.0 73.0 -1.4% 53.0 65.0 74.5
5 year old 61.0 61.0 0.0% 38.0 51.1 63.4
10 year old 42.0 42.0 0.0% 24.0 34.9 46.0
15 year old 22.0 22.0 0.0% 14.0 19.4 26.6
Aframax
Resale 56.0 57.0 -1.8% 39.0 49.4 60.0
5 year old 45.0 46.0 -2.2% 27.0 37.5 47.0
10 year old 30.0 33.0 -9.1% 16.0 24.5 33.0
15 year old 17.0 18.5 -8.1% 8.0 13.3 18.5
MR
Resale 38.5 38.5 0.0% 32.0 36.6 39.3
5 year old 29.0 28.0 3.6% 22.0 26.7 30.5
10 year old 20.0 20.0 0.0% 13.8 17.7 20.4
15 year old 13.5 13.5 0.0% 9.0 11.0 13.8
last 5 years
-5%
-2%-1%
+8%
-6%
-4%
-2%
0%
2%
4%
6%
8%
10%
1 month diff 3 months diff6 months diff 12 months diff
+0%
+3%+5%
+22%
0%
5%
10%
15%
20%
25%
1 month diff 3 months diff6 months diff 12 months diff
-2%
+0% +0%
+7%
-4%
-2%
0%
2%
4%
6%
8%
1 month diff 3 months diff6 months diff 12 months diff
+4%
+7% +7%
+14%
0%
2%
4%
6%
8%
10%
12%
14%
16%
1 month diff 3 months diff6 months diff 12 months diff

23
Monday, September 28, 2015 (Week 39)
Newbuilding Market
SHIPPING MARKETS
Tanker Newbuilding Prices
Dry Bulk Newbuilding Prices
Demolition Market
Wet Scrap Prices
Dry Scrap Prices
Indicative Dry Prices ($/ ldt) last 5 years
25 Sep 18 Sep ±% Min Avg Max
Indian Sub Continent
Bangladesh 325 335 -3.0% 250 417 515
India 330 335 -1.5% 280 422 525
Pakistan 325 330 -1.5% 285 417 510
Far East Asia
China 175 180 -2.8% 120 338 455
Mediterranean
Turkey 195 200 -2.5% 180 287 355
Indicative Wet Prices ($/ ldt) last 5 years
25 Sep 18 Sep ±% Min Avg Max
Indian Sub Continent
Bangladesh 340 345 -1.4% 280 441 540
India 340 350 -2.9% 300 447 550
Pakistan 340 345 -1.4% 300 443 525
Far East Asia
China 195 200 -2.5% 140 356 485
Mediterranean
Turkey 205 210 -2.4% 190 297 355
Indicative Dry NB Prices (US$ million) last 5 years
25 Sep 21 Aug ±% Min Avg Max
Dry Bulkers
Capesize (180,000dwt) 48.0 48.5 -1.0% 46.0 52.1 60.0
Kamsarmax (82,000dwt) 26.5 26.8 -0.9% 26.5 30.7 38.0
Panamax (77,000dwt) 26.0 26.3 -1.0% 25.8 29.5 34.5
Ultramax (64,000dwt) 24.5 24.8 -1.0% 24.3 27.4 32.0
Handysize (37,000dwt) 20.5 21.0 -2.4% 20.5 23.3 27.8
Container
Post Panamax (9,000teu) 88.0 88.0 0.0% 76.5 87.3 97.0
Panamax (5,200teu) 58.0 58.0 0.0% 48.6 57.8 65.6
Sub Panamax (2,500teu) 30.5 30.5 0.0% 29.5 33.7 41.5
Feeder (1,700teu) 22.5 22.5 0.0% 21.2 24.8 29.8
Indicative Wet NB Prices (US$ million) last 5 years
25 Sep 21 Aug ±% Min Avg Max
Tankers
VLCC (300,000dwt) 95.5 95.5 0.0% 89.5 97.7 107.5
Suezmax (160,000dwt) 64.5 64.5 0.0% 55.8 62.2 68.0
Aframax (115,000dwt) 53.0 53.0 0.0% 47.0 52.4 58.0
LR1 (75,000dwt) 45.8 45.8 0.0% 40.5 44.1 47.0
MR (56,000dwt) 35.5 35.5 0.0% 33.5 35.3 37.3
Gas
LNG 160k cbm 200.0 200.0 0.0% 198.0 200.9 211.5
LPG LGC 80k cbm 77.0 77.0 0.0% 69.5 73.5 80.0
LPG MGC 55k cbm 67.5 67.5 0.0% 62.0 64.3 68.5
LPG SGC 25k cbm 45.0 45.0 0.0% 41.0 44.3 46.5
20
30
40
50
60
Capesize Panamax Supramax Handysize
US$ million
30
50
70
90
110
VLCC Suezmax Aframax LR1 MR
US$ million
100150200250300350400450500
Bangladesh India Pakistan China Turkey
US$/ldt
100150200250300350400450500
Bangladesh India Pakistan China Turkey
US$/ldt
24
Monday, September 28, 2015 (Week 39)
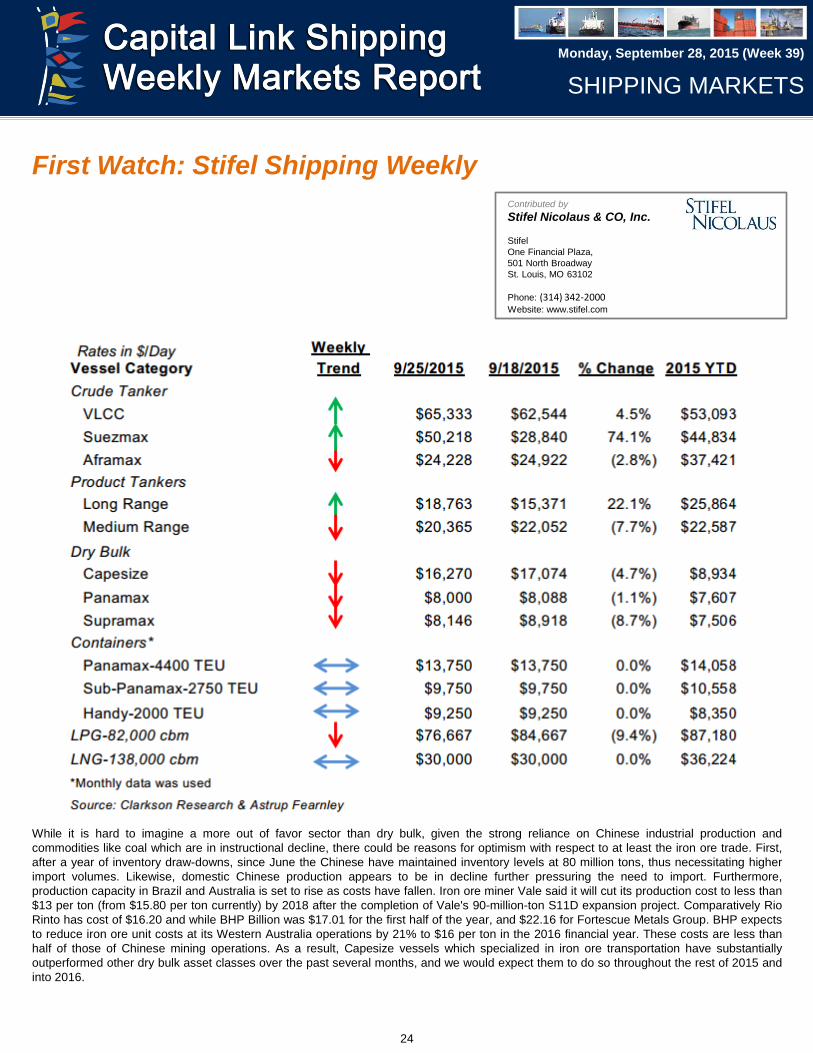
First Watch: Stifel Shipping Weekly Contributed by
Stifel Nicolaus & CO, Inc.
Stifel
One Financial Plaza,
501 North Broadway
St. Louis, MO 63102
Phone: (314) 342-2000 Website: www.stifel.com
While it is hard to imagine a more out of favor sector than dry bulk, given the strong reliance on Chinese industrial production and
commodities like coal which are in instructional decline, there could be reasons for optimism with respect to at least the iron ore trade. First,
after a year of inventory draw-downs, since June the Chinese have maintained inventory levels at 80 million tons, thus necessitating higher
import volumes. Likewise, domestic Chinese production appears to be in decline further pressuring the need to import. Furthermore,
production capacity in Brazil and Australia is set to rise as costs have fallen. Iron ore miner Vale said it will cut its production cost to less than
$13 per ton (from $15.80 per ton currently) by 2018 after the completion of Vale's 90-million-ton S11D expansion project. Comparatively Rio
Rinto has cost of $16.20 and while BHP Billion was $17.01 for the first half of the year, and $22.16 for Fortescue Metals Group. BHP expects
to reduce iron ore unit costs at its Western Australia operations by 21% to $16 per ton in the 2016 financial year. These costs are less than
half of those of Chinese mining operations. As a result, Capesize vessels which specialized in iron ore transportation have substantially
outperformed other dry bulk asset classes over the past several months, and we would expect them to do so throughout the rest of 2015 and
into 2016.
SHIPPING MARKETS

25
Monday, September 28, 2015 (Week 39)
25
Global Shipping Fleet & Orderbook Statistics
Contributed by Stifel Nicolaus & Co, Inc.
SHIPPING MARKETS

26
Monday, September 28, 2015 (Week 39)
Container Market – Weekly Highlights
Macroeconomics
The US economy grew faster than previously estimated in the second
quarter of the year, according to revised official figures. The US
Commerce Department said the economy expanded at an annualised
pace of 3.9 per cent, rather than 3.7 per cent. The growth in the economy
overall was due to strong consumer spending, business investment and
residential construction. It rate is much higher than the 0.6 per cent rate
recorded in the first quarter.
China's factory activity contracted at the fastest pace for six and a half
years in September, according to a preliminary survey of the vast sector.
The Caixin/Markit manufacturing purchasing managers' index (PMI) fell to
47 in September, below forecasts of 47.5 and down from 47.3 in August.
The Asian Development Bank has lowered its growth forecasts for Asia's
developing economies on the back of slowing growth in both China and
India. The region is now expected to grow by 5.8 per cent this year and 6
per cent in 2016, revised down from March's forecast of 6.3 per cent for
both years.
The Markit Eurozone Composite PMI slipped from 54.3 in August to 53.9
in September, according to the preliminary 'flash' reading. The latest
index came in below consensus expectations of a dip to 54.1 but
nevertheless remained broadly in line with recent readings seen over the
past eight months.
SHIPPING MARKETS
Contributed by
Braemar ACM Shipbroking
35 Cosway Street
London NW1 5BT
United Kingdom
Phone: +44 (0) 20 7535 2650
Website: braemarseascope.com
Sale and Purchase
Last week was very quiet with no reportable sales in the container
second hand market. Greek owners Danaos officially announced their
acquisition (via bareboat) of the MV 'Suez Canal' (5,600TEU built 2002
Hyundai HI) and MV 'Genoa' (5,500TEU built 2002 Imabari) which had
been rumoured since July. However, their announcement also included
their purchase of a 6,400TEU vessel, the MV 'NYK Lodestar' (6,200TEU
built 2001 Samsung HI), which was unreported previously.
There were no finalised newbuilding orders last week, however German
line Hapag-Lloyd announced their plans for a $500Mn IPO. Some of the
cash raised from this IPO is reportedly going towards investment in six
ultra-large container vessels with a capacity of approximately
20,000TEU. Headlines
Surge in US west coast traffic and slower box growth at Atlantic ports
suggests that east-west split of transpacific trade is returning to
'normality‘ US west coast ports have been gradually regaining the trans-
Pacific traffic lost to its Atlantic rivals since the much-documented labour
dispute was resolved in February, and there is evidence to suggest that
this positive trend continued in August. (Source : LL)
Freight rates on the Asia-Europe trades have tumbled for their third
successive week to levels approaching the all-time lows witnessed in
June. The latest Shanghai Containerised Freight Index shows that rates
to north Europe from Asia fell by a further 31.4 per cent to $313/TEU,
and to the Mediterranean by 30.1 per cent to $313/TEU. (Source: LL)
Introducing an award-winning hybrid container developed to be used
either as a 20 ft container or coupled with another to form a 40 ft box.
The humble 20 ft or 40 ft container may have revolutionised both the
shipping industry and world trade, but the design is fairly standard and,
one would have thought, hard to fundamentally change. Tworty Box
GmbH & Co has given that name to a hybrid container it has developed
that could be used either as a 20 ft container. or coupled with another to
form a 40 ft box. (Source: LL)

27
Monday, September 28, 2015 (Week 39)
More From Mesopotamia Iraqi crude oil production
After OPEC decided in November 2014 to maintain market share
rather than protect the oil price, total OPEC output has increased
significantly. According to IEA estimates, OPEC production (including
NGLs) increased from 36.6 Million barrels per day (Mb/d) to 38.5
Mb/d in recent months. Almost half of the increase was due to growth
in Iraqi crude oil production. As Iraqi production and exports increase,
so is the importance of these exports to the tanker market.
Iraq exports crude through two routes: out of the Basrah terminal in
the Arabian Gulf and out of Ceyhan in Turkey. Shipments from
Basrah consist mostly of production from southern fields, while
exports from Ceyhan are mostly northern production. The fields in the
north are mainly controlled by the Kurdistan regional government;
although the official state controlled marketing organization (SOMO)
also exports some crude through Ceyhan. According to Bloomberg,
Iraq exported 3.6 Mb/d during the last three months, 3.1 Mb/d from
Basrah and 0.5 Mb/d from Ceyhan. Exports from both locations
increased significantly since the beginning of the year: exports from
Basrah increased from 2.2 Mb/d in January to 3.0 Mb/d in early
September, while exports through Ceyhan increased from 0.4 to 0.6
Mb/d.
Basrah exports received a boost when Iraq started to export
significant volumes of Basrah Heavy, starting at 0.6 Mb/d in June and
expected to reach more than 0.9 Mb/d in September. Further
increases are planned. For October, Iraq announced a total export
schedule of 81 cargoes totaling 114 million barrels out of Basrah for
October, a significant increase from the planned 90.5 million barrels
in September.
The increased throughput has made the Basrah terminal more prone
to delays and disruptions add to the volatility of the Arabian Gulf
VLCC and Suezmax market. In the spring of this year for example,
winter storms caused delays at the Basrah terminal and more than 20
VLCCs were lined up waiting to load. This clearly contributed to the
high freight market for VLCCs in the spring.
In contrast to many other state owned oil producers, Iraq does not
operate a significant crude tanker fleet. Therefore, the crude
transportation is done by international shipping companies, mainly
using spot market tonnage.
Iraq’s government budget has suffered a double blow over the last 12
months: The decline in oil prices and the cost of fighting militants from
the Islamic State of Iraq and the Levant (ISIL) in the northwestern
areas of the country. As a result, Iraq has urged foreign oil
companies, working as contractors on the southern oil fields in Iraq,
to reduce their budgets as the country runs short on cash to
reimburse them for their costs. As a result, BP agreed to reduce its
2015 budget on the Rumaila field, the largest in the country, from
$3.5 Billion to $2.5 Billion. The field currently produces about 1.3
Mb/d and is expected to increase production to 1.4 Mb/d in 2016. The
budget for the West Qurna 1 field, which produces about 400 Kb/d,
has been reduced from $1.6 billion to $1.1 billion. Iraq has also
started to pay with crude rather than cash. Since its launch in June,
Iraq has used the new heavy Basrah grade as payment to
Contributed by
Poten & Partners, Inc.
805 Third Avenue
New York, NY 10022
Phone: (212) 230 - 2000
Website: www.poten.com
SHIPPING MARKETS
remunerate international oil companies such as Shell, BP, Total,
Lukoil, Petronas and China National Petroleum Corporation for their
development of Iraqi oil fields.
Iraq is an example of the dilemma facing many oil producers
currently. They need to produce more oil to meet their budgets, but
by doing so, crude prices remain under pressure, which again
undermines these countries’ finances.
Iraqi production and exports are expected to keep growing and since
Iraqi crude is sold worldwide (both in the Atlantic and the Pacific
Basins), their volumes will continue to contribute to ton-mile demand
for both VLCC and Suezmax tankers.

28
Monday, September 28, 2015 (Week 39)
SHIPPING MARKETS
Contributed by
Charles R. Weber Company, Inc.
Greenwich Office Park One,
Greenwich, CT 06831
Phone: (203) 629 - 2300
Website: www.crweber.com
Tanker Market – Weekly Highlights Amid lower demolitions, older tonnage poised for phasing‐out
remains
Sales of tanker tonnage for demolition in the MR and larger segments
have dwindled since the start of the year, thanks to sustained earnings
strength and a collapse of Indian subcontinent demolition
prices. Measure by total deadweight capacity, demolition sales activity
is down by 77% YTD, y/y while the average subcontinent $/ldt price is
off by 30% y/y to $340.
The demolitions trend comes despite earlier expectations that the
average phase‐out age would decline on incrementally higher
maintenance costs at the third special survey and subsequent
maintenance intervals as well as to avoid the cost of compliance with
forward regulations. While the average age of a VLCC sold for
demolition in 2013 was 18, 2014 saw that figure rise to 21 years while
YTD the two VLCCs sold for demolition (both of which had been phased
out from trading in previous years) had an average age of 25. A year
ago, before the extent and sustainability of the present rally became
known, our fleet growth projections had assumed that the average age
would decline to 22.5 years in 2015 and 20 years in 2016 (in
determining the target phase‐out number for any fleet, we also consider
each unit on an individual basis to account for various ownership and
trading profiles which are likely to force a deviation from the average).
Instead, nearly all of the units targeted for phase‐out this year to avoid
special surveys or dry docking have undertaken the required
maintenance or sought extensions.
Low demolition prices have also had their impact: the average VLCC
unit has seen its demolition value drop by ~$5.6m, or 30%, from a year
ago to $13.3m. However, while this suggests a disincentive for owners
to sell for demolition, it also makes more unpalatable the added costs of
future regulatory compliance. With older units generally having little or
no debt servicing requirements, the present earnings environment easily
compensates for both the lost demolition value and maintenance
costs. A decline to the 5‐year VLCC earnings average – or even to the
2014 average – and the addition of such compliance costs as ballast
water treatment systems, however, would strongly erode the prospective
benefit of keeping older units in service. With ordering having picked up
this year and the percentage of the present VLCC fleet standing at 19%,
concerns have been raised about the earnings environment from 2017
after deliveries rise progressively during 2016. Any resulting negative
impact on earnings from fleet growth would enhance the case for
demolition sales, which would help to moderate fleet growth. Our three
VLCC fleet growth cases illustrate the various possible trends by
exploring fleet growth in the case of no further orders and our base case
of phase‐outs as compared with the high growth case where phase‐outs
remain low and fresh ordering remains high and the low growth case
where fresh orders decline and phase‐outs accelerate.

29
Monday, September 28, 2015 (Week 39)
Tanker Market – Weekly Highlights
SHIPPING MARKETS

30
Monday, September 28, 2015 (Week 39)
Tanker Market – Weekly Highlights
SHIPPING MARKETS
VLCC
VLCC rates remained elevated following last week’s gains. Further
fresh upside, however, was limited by a slower pace of fixture activity
this week; the tally of fixtures for loading in the Middle East eased 14%
w/w to 30 while those for loading in West Africa were off by 29% w/w to
five. Demand for voyages to China from all areas posted a sharp
correction after last week’s tally set a fresh YTD high paring back by
70% w/w. Bullishness remains evident, however, as the fundamentals
outlook remain strong. The October Middle East program has thus far
yielded 55 covered cargoes, leaving an estimated 25 through
second‐decade loading dates. During the same space of time, there
are 36 units showing availability, from which draws for West Africa
cargoes will likely total seven, leaving an implied surplus of four
units. This compares with 13 at the close of the September program
and 17 at the close of the August program and is half of the YTD
end‐month average. Looking further forward, discharging delays have
materialized across Asia from India to the Far East due to ullage issues,
which will likely maintain low availability rates once the market moves
past the October program. For its part, Saudi crude production levels
reportedly remain unchanged around the 10.2‐10.3 MnB/d level while
exports are likely to strengthen through the remainder of the year
following stronger domestic consumption during the summer months,
stockpiling during the startup of the Yanbu refinery and low seasonal
demand from Asian buyers during the summer. Elsewhere, though
West African exports appear set to ease during November from
October’s YTD high, the expected October demand from Asian buyers
failed to meet expectations and pushed more cargoes than anticipated
into the European market despite refinery maintenance. Assuming that
Asian demand for November cargoes inches up on well‐covered
European demand, VLCC should benefit from any increase in West
Africa cargoes to Asia.
Middle East
Rates to the Far East gained an average of 7.9 points w/w to an average
of ws62.5. Corresponding TCEs rose by 19% to an average of
~$68,282/day. The present assessment of ws63 yields
~$68,704/day. Rates to the USG via the Cape gained 2.9 points to an
average of w36.4. Triangulated Westbound trade earnings rose by 23%
w/w to an average of ~$75,998/day.
Atlantic Basin
Following a slight lag last week, rates in the West Africa market surged
to catch up with those observed earlier in the Middle East market. The
WAFR‐FEAST route added 11.9 points w/w to an average of ws63.5
with corresponding TCEs gaining 29% to an average of
~$65,137/day. The present assessment of ws65 yields ~$68,689/day.
The Caribbean market was markedly stronger this week on increased
demand and outstanding inquiry – with traders augmenting that of more
usual and structural players – while Venezuelan cargoes remain on
offer. Additionally, lighter demand for voyages to the USG is now
keeping Caribbean positions tight. These factors supported a $1.9m
gain on the CBS‐SPORE route.
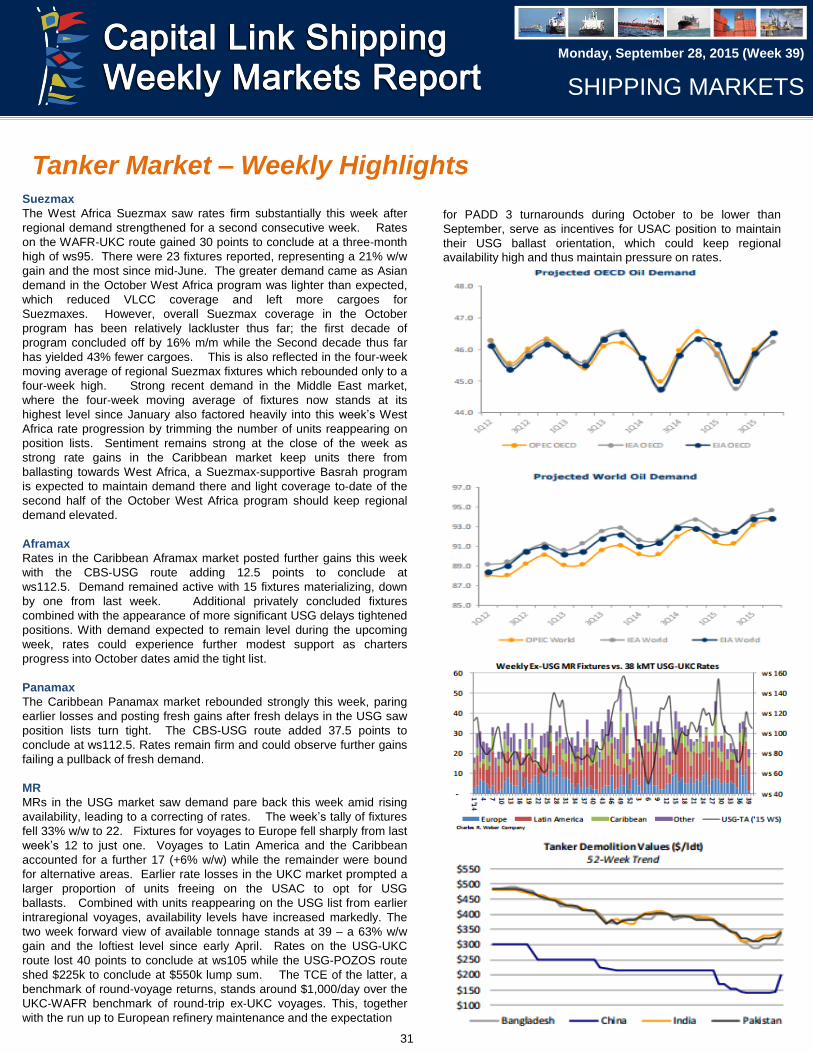
31
Monday, September 28, 2015 (Week 39)
Tanker Market – Weekly Highlights
SHIPPING MARKETS
Suezmax
The West Africa Suezmax saw rates firm substantially this week after
regional demand strengthened for a second consecutive week. Rates
on the WAFR‐UKC route gained 30 points to conclude at a three‐month
high of ws95. There were 23 fixtures reported, representing a 21% w/w
gain and the most since mid‐June. The greater demand came as Asian
demand in the October West Africa program was lighter than expected,
which reduced VLCC coverage and left more cargoes for
Suezmaxes. However, overall Suezmax coverage in the October
program has been relatively lackluster thus far; the first decade of
program concluded off by 16% m/m while the Second decade thus far
has yielded 43% fewer cargoes. This is also reflected in the four‐week
moving average of regional Suezmax fixtures which rebounded only to a
four‐week high. Strong recent demand in the Middle East market,
where the four‐week moving average of fixtures now stands at its
highest level since January also factored heavily into this week’s West
Africa rate progression by trimming the number of units reappearing on
position lists. Sentiment remains strong at the close of the week as
strong rate gains in the Caribbean market keep units there from
ballasting towards West Africa, a Suezmax‐supportive Basrah program
is expected to maintain demand there and light coverage to‐date of the
second half of the October West Africa program should keep regional
demand elevated.
Aframax
Rates in the Caribbean Aframax market posted further gains this week
with the CBS‐USG route adding 12.5 points to conclude at
ws112.5. Demand remained active with 15 fixtures materializing, down
by one from last week. Additional privately concluded fixtures
combined with the appearance of more significant USG delays tightened
positions. With demand expected to remain level during the upcoming
week, rates could experience further modest support as charters
progress into October dates amid the tight list.
Panamax
The Caribbean Panamax market rebounded strongly this week, paring
earlier losses and posting fresh gains after fresh delays in the USG saw
position lists turn tight. The CBS‐USG route added 37.5 points to
conclude at ws112.5. Rates remain firm and could observe further gains
failing a pullback of fresh demand.
MR
MRs in the USG market saw demand pare back this week amid rising
availability, leading to a correcting of rates. The week’s tally of fixtures
fell 33% w/w to 22. Fixtures for voyages to Europe fell sharply from last
week’s 12 to just one. Voyages to Latin America and the Caribbean
accounted for a further 17 (+6% w/w) while the remainder were bound
for alternative areas. Earlier rate losses in the UKC market prompted a
larger proportion of units freeing on the USAC to opt for USG
ballasts. Combined with units reappearing on the USG list from earlier
intraregional voyages, availability levels have increased markedly. The
two week forward view of available tonnage stands at 39 – a 63% w/w
gain and the loftiest level since early April. Rates on the USG‐UKC
route lost 40 points to conclude at ws105 while the USG‐POZOS route
shed $225k to conclude at $550k lump sum. The TCE of the latter, a
benchmark of round‐voyage returns, stands around $1,000/day over the
UKC‐WAFR benchmark of round‐trip ex‐UKC voyages. This, together
with the run up to European refinery maintenance and the expectation
for PADD 3 turnarounds during October to be lower than
September, serve as incentives for USAC position to maintain
their USG ballast orientation, which could keep regional
availability high and thus maintain pressure on rates.

32
Monday, September 28, 2015 (Week 39)
TANKER TIME CHARTER ESTIMATES* (pdpr) - Non-Eco
tonnage
Tanker Comment: Crude sector is still edging away with VL
1 year rates very strong touching 50K for the second time
this year. Charterers also having a preference for
Suezmaxes after keeping low in the last month. Clean
sector steady with MR’s cooling off the most and numbers at
mid 18K for 1 year but Owners holding/hoping for better
rates moving forward.
Contributed by
Alibra Shipping Limited
35 Thurloe Street
South Kensington
London, SW7 2LQ
Phone: +44 020 7581 7766
Website: www.alibrashipping.com
Dry/Wet & TC Rates
SHIPPING MARKETS
DRY TIME CHARTER ESTIMATES* (pdpr)
Dry comment: Capes volatility increases with big jumps on the index in
the last week - if market is to pick up further, its important for the index not
to try test the bottom set earlier this year again. Panamaxes NoPac trips
remain weak around $6k with ECSA to FEAST holding between 11-13k
with a BB.
Supras cooling off in Atlantic slightly with USG to Cont/Med around 14k and
in the pacific rates under $7k for single trips. Despite index continuing its
downtrend Atlantic numbers on period biz picking up.
DRY – Trading feeling slightly more optimistic put for how much longer
as physical market volatility increases.
WET – Traders on the Wet sector betting heavily on the forward trend
as physical markets especially on the crude picking up and
fundamentals still for now pointing in the right direction.
ATL PAC ATL PAC ATL PAC
HANDY (3 2 k dw t )
$8,000 $6,550 $7,500 $6,850 $8,000 $8,000
SUPRA (5 6 k dw t )
$10,000 $7,850 $9,850 $8,000 $10,000 $9,000
ULTRA (6 2 k dw t )
$10,850 $8,150 $10,000 $8,500 $10,000 $9,150
PANA/KMAX (7 6 k-8 2 k d w t )
$9,000 $7,750 $9,000 $8,000 $10,000 $9,000
CAPE (1 7 0 k d w t )
$11,750 $11,750 $12,850 $12,850 $13,500 $13,500
6 MOS 1 YR 2 YR
1 YR 2 YR 3 YR 5 YR
HANDY $16,850 $16,500 $15,250 $14,750
MR IMO3 $18,500 $18,000 $16,850 $16,500
LR1 $24,000 $23,000 $22,250 $21,000
LR2 (1 1 5 d w t c pp & dpp)
$27,750 $27,000 $25,500 $24,000
AFRA (1 1 5 dw t )
$26,850 $24,750 $24,250 $23,000
SUEZ $34,500 $34,000 $32,500 $28,500
VLCC $50,000 $45,500 $42,500 $40,000
FFA DRY
CAPE PANA SUPRA HANDY
6 MOS $11,200 $7,300 $7,700 $6,000
12 MOS $10,350 $7,400 $7,600 $6,100
24 MOS $11,000 $7,500 $7,700 $6,200
FFA WET
TD3 TD5 TD7 TC2 TC4 TC6
1
MOS
$58,00
0
$48,50
0
$32,00
0
$15,30
0
$17,00
0
$13,80
0
2
MOS
$79,00
0
$46,00
0
$39,00
0
$17,80
0
$17,40
0
$18,80
0
3
MOS
$81,00
0
$47,00
0
$43,00
0
$22,00
0
$18,00
0
$24,00
0
12
MOS
$48,00
0
$41,00
0
$30,40
0
$20,00
0
$11,60
0
$19,20
0