Embed Size (px)
Citation preview

13th of September 2018
London
CAPITAL MARKET DAY 2018

KEY INDICATORS & RESULTSS&T GROWTH PATH CONTINUES
Richard Neuwirth, Chief Financial Officer

2
S&T GROUP PROFITABILITY
16,620,1
22,9
28,3
34,4
68,1
80,0
4,9%
5,9% 5,9%6,1%
6,8%
7,7%8,0%
0,0%
1,0%
2,0%
3,0%
4,0%
5,0%
6,0%
7,0%
8,0%
9,0%
0,0
10,0
20,0
30,0
40,0
50,0
60,0
70,0
80,0
90,0
2012 2013 2014 2015 2016 2017 2018p
EBITDA + EBITDA Margin (Mio. EUR | %)

3
IOT SEGMENT DRIVES PROFITABILITY
Incl. I/C revenues | * incl. HQ/Holding cost
156,6171,6
86,6
199,9185,3
77,6
IT Services IoT Solutions Embedded Systems
LEFT: 6M 2017 | RIGHT: 6M 2018
6,8*
11,19,39,5*
21,8
5,4
IT Services IoT Solutions Embedded Systems
LEFT: 6M 2017 | RIGHT: 6M 2018
Revenue 6M 2017 vs 6M 2018 EBITDA 6M 2017 vs 6M 2018
27,2
36,7
6M 2017 6M 2018
Group EBITDA
+35%

4
SOLID FINANCING FOR FURTHER GROWTH
EUR 100 Mio. available for acquisitions and growth
60,3
125,6
216,9
0,0
50,0
100,0
150,0
200,0
250,0
2015 2016 2017
Liquidity (Mio. EUR)
51,0
93,6
115,1
0,0
20,0
40,0
60,0
80,0
100,0
120,0
2015 2016 2017
Debt (Mio. EUR)
60,3
125,6
216,9
51,0
93,6115,1
0,0
50,0
100,0
150,0
200,0
250,0
2015 2016 2017
Liquidity vs. Debt (Mio. EUR)

5
S&T GROUP BALANCE SHEET
Largest single customer contributes > 3% to S&T Group turnover
in EUR Mio. 30.06.2018 31.12.2017 30.06.2018 31.12.2017
EQUITY 335,6 331,9
NON-CURRENT ASSETS 262,1 268,0 NON-CURRENT LIABILITIES 116,9 134,6
Fixed assets 235,1 239,4 Long-term loans and borrowings 62,1 68,7
Other assets 27,0 28,6 Other non-current liabilities 54,8 65,9
CURRENT ASSETS 476,7 536,9 CURRENT LIABILITIES 286,3 338,4
Inventories 116,5 104,0 Trade accounts payable 122,0 154,8
Trade accounts receivable 151,9 171,1 Short-term borrowings 31,7 46,4
Cash and cash equivalents 140,0 216,9 Other current liabilities 132,6 137,2
Other assets 68,3 44,8
Assets 738,8 804,9 Liabilities & Equity 738,8 804,9
Equity Ratio 45% 41%
Net Cash 46,2 101,8
Working Capital 149,6 121,5

6
S&T KEY FIGURES
* Includes EUR 26 Mio. one-time effect in Kontron
In Mio. EUR 2016 2017 6M 2017 6M 2018
Revenues 503,7 882,0 381,4 422,7
Gross Profit (Margin) 168,9 (33,5%) 315,0 (35,7%) 146,0 (38,3%) 154,8 (36,6%)
EBITDA (Margin) 34,4 (6,8%) 68,1 (7,7%) 27,2 (7,1%) 36,7 (8,7%)
EBIT before PPA amortization 28,2 47,9 17,3 25,8
Net Income 20,4 29,4 9,2 17,2
EBITDA Interest Coverage Ratio 7,9 9,8 7,9 10,8
Net Cash 32,0 101,8 3,2 46,2
Working Capital 119,2 121,5 119,4 149,6
Equity Ratio 36,0% 41,2% 37,4% 45,4%
Operating Cashflow 61,4* 44,9 -4,6 -15,9
Employees 3.786 3.918 3.797 4.012

7
OUR AGENDA 2023: S&T‘S GROWTH PATH CONTINUES
882
1000
0
200
400
600
800
1000
2017 2018p
Revenue(Mio. EUR)
68,1
80
0
10
20
30
40
50
60
70
80
90
100
2017 2018p
EBITDA (Mio. EUR)
2018 forecast
Long-term forecast 2023Doubling sales to
EUR 2 billionduring the next five years
8
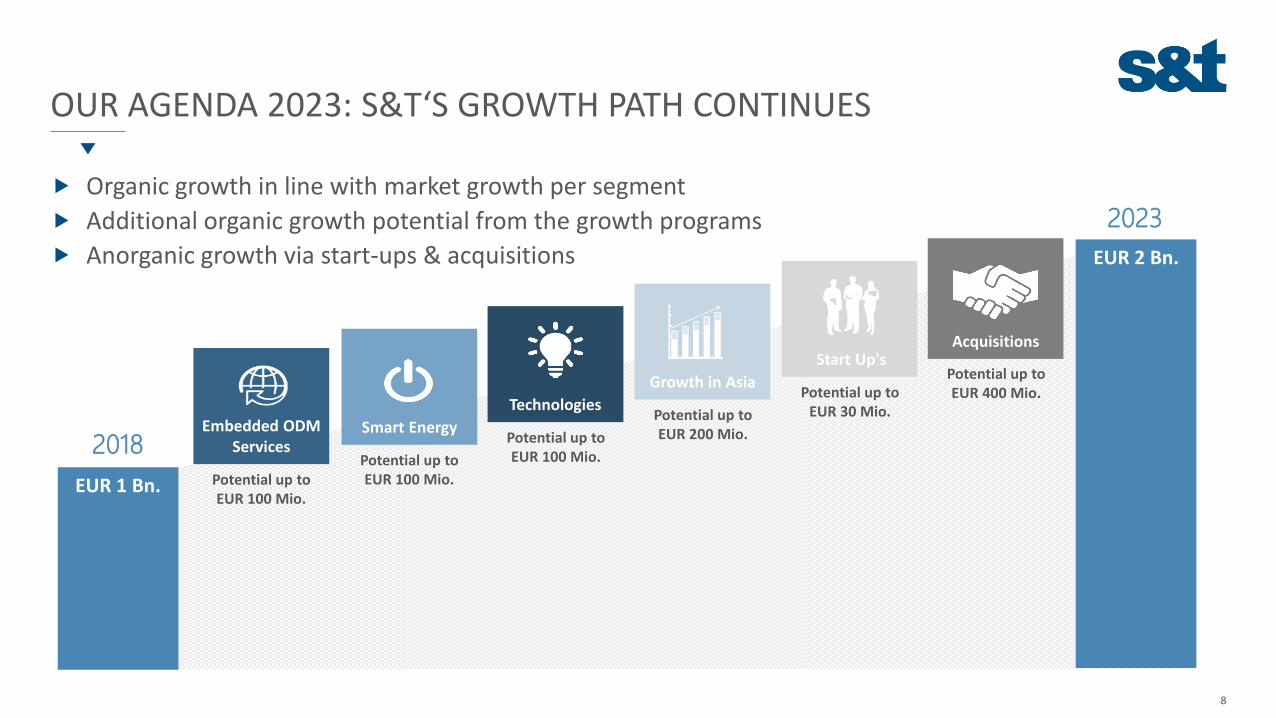
OUR AGENDA 2023: S&T‘S GROWTH PATH CONTINUES
Organic growth in line with market growth per segment
Additional organic growth potential from the growth programs
Anorganic growth via start-ups & acquisitions EUR 2 Bn.
2023
2018
IT Services
420
IoT Solutions
450
EUR 1 Bn.
Start Up's Acquisitions
Growth in Asia
Smart Energy
TechnologiesEmbedded ODM
Services
Potential up to EUR 100 Mio.
Potential up to EUR 100 Mio.
Potential up to EUR 100 Mio.
Potential up to EUR 200 Mio.
Potential up to EUR 30 Mio.
Potential up to EUR 400 Mio.

9
S&T ACQUISITION STRATEGY
Acquisitions targets – “technology pearls”
Complement our technology
SW Companies in the American region
Target small technology companies: Reasonable price despite high multiples (20 +)
Acquisitions targets – “volume suppliers”
Kontron model:
Buy embedded Hardware companies at
reasonable prices (multiples <10)
Increase GM from 25% to 40%
Growing IoT market
Acquisition of:
Inocybe, a Canadian software company July 2018Price: USD 3,3 Mio.Revenues: USD 1,5 Mio. p.a.
Acquisition of:
Exceet Electronics entities in GER, A, CH July 2018Price: EUR 30 Mio.Revenues: EUR 55 Mio. p.a.

THE S&T SHARE – TECDAX & SDAX MEMBER; TARGET: MDAX
10
Coverage
Kepler Cheuvreux | Buy: EUR 29,00
Hauck & Aufhäuser | Buy: EUR 28,50
Equinet | Buy: EUR 27,00
Warburg Research | Hold EUR 20,30
Shareholder Structure
Ennoconn Corporation -24%
Freefloat - 76% - includes as follows:
grosso holding Gesellschaft mbH - 1%
Hannes Niederhauser - 2%
Allianz Global Investors GmbH - 4%
Dorval Asset Management - 3%
JPMorgan Asset Management - 4%
Liquidity
0
200 000 000
400 000 000
600 000 000
800 000 000
1 000 000 000
2012 2013 2014 2015 2016 2017 2018 (8m)
0,00
5,00
10,00
15,00
20,00
25,00
30,00
35,00
0200400600800
1000120014001600
S&T AG TecDAX Index S&T AG EUR
1300% increase in 6 years

11
SUMMARY
Benefit from cooperation and partners
Cost efficient engineering in EE High growth in Industry 4.0Opportunities
90% Net income growth in 6M 2018 35% EBITDA growth in 6M 2018 Successful transformation from HW
into a IoT solutions companyAchievements
Big players enter our niches in Industry 4.0
US-Dollar development Address right technology trends Risks
2 Bn. revenues in 2023 Ongoing GM Improvement to
40% and EBITDA to 10% Leadership in IoT/Industry 4.0 MDAX membership
Targets

DISCLAIMER
This document includes 'forward-looking statements'. Forward-looking statements are all statements, which do not describe facts of the past, but containing the words "believe", "estimate","expect", "anticipate", "assume", "plan", "intend", "could", and words of similar meaning. These forward-looking statements are subject to inherent risks and uncertainties since they relate tofuture events and are based on current assumptions and estimates of S&T AG, which might not occur at all or occur not as assumed. They therefore do not constitute a guarantee for theoccurrence of future results or performances of S&T AG. The actual financial position and the actual results of S&T AG, as well as the overall economic development and the regulatory environmentmay differ materially from the expectations, which are assumed explicitly or implicitly in the forward-looking statements and do not comply to them. Analysts and investors, and any other person orentity that may need to take decisions, or prepare or release opinions about the shares / securities issued by S&T AG are cautioned not to place undue reliance on those forward-lookingstatements, which speak only as of the date of this document. Past performance cannot be relied upon as a guide to future performance.
Except as required by applicable law, S&T AG undertakes no obligation to revise these forward-looking statements to reflect events and circumstances after the date of this presentation, including,without limitation, changes in S&T’s business or strategy or to reflect the occurrence of unanticipated events. The financial information and opinions contained in this document are unaudited andare subject to change without notice. This document contains summarized information or information that has not been audited. In this sense, this information is subject to, and must be read inconjunction with, all other publicly available information, including if it is necessary, any fuller disclosure document published by S&T AG. None of the Company, its subsidiaries or affiliates or by anyof its officers, directors, employees, advisors, representatives or agents shall be liable whatsoever for any loss however arising, directly or indirectly, from any use of this document its content orotherwise arising in connection with this document.
This document or any of the information contained herein do not constitute, form part of or shall be construed as an offer or invitation to purchase, subscribe, sale or exchange, nor a request for anoffer of purchase, subscription, sale or exchange of shares / securities of S&T AG, or any advice or recommendation with respect to such shares / securities. This document or a part of it shall notform the basis of or relied upon in connection with any contract or commitment whatsoever.
This document does not constitute an offer to purchase securities in the United States, Canada, Australia, South Africa and Japan. Securities, including the bond of S&T AG may not be sold oroffered for sale within the United States or to or for the account of / in favor of US citizens (as defined in Regulation S under the U.S. Securities Act of 1933 in the current version (the "SecuritiesAct") unless they are registered under the regulations of the Securities Act or unless they are subject to an exemption from registration. Neither S&T AG nor any other person intend to register theoffer or a part thereof in the United States or to make a public offer of the securities in the United States.