Embed Size (px)
Citation preview
© LafargeHolcim Ltd 2015
Capital Markets DayOperational Excellence
Urs Bleisch, Performance & Cost
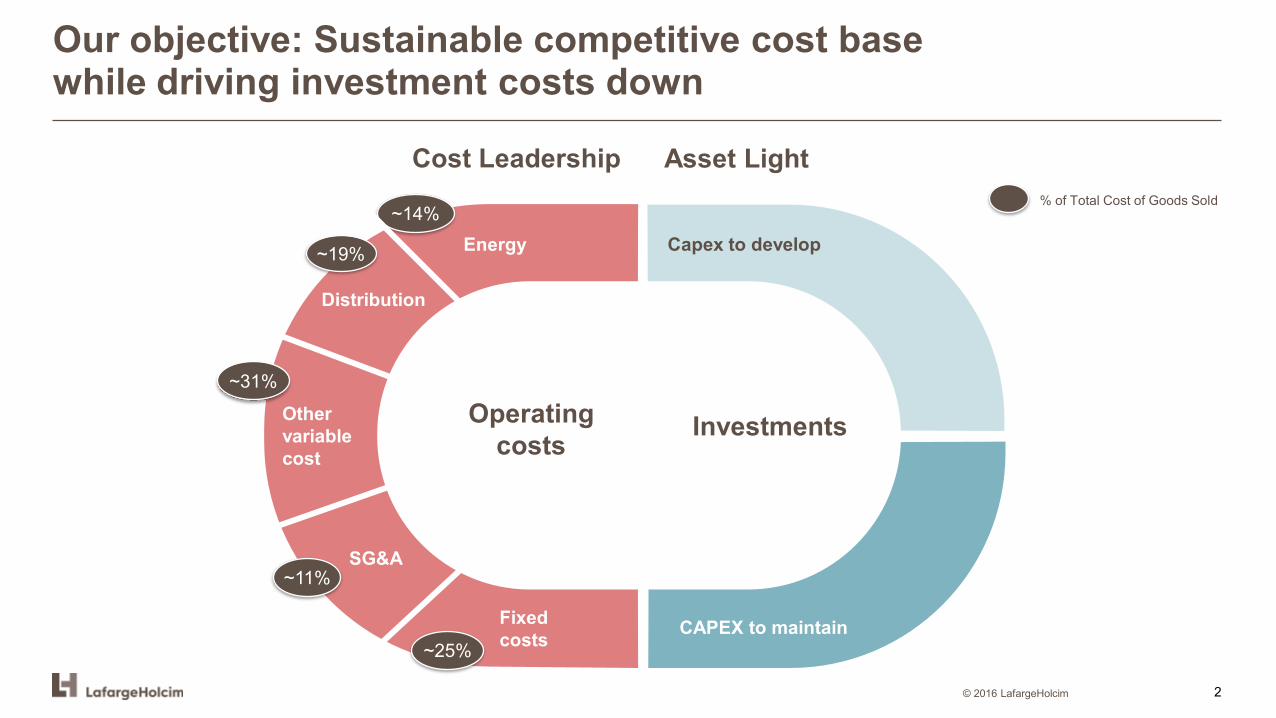
Our objective: Sustainable competitive cost base while driving investment costs down
© 2016 LafargeHolcim
Energy
Fixedcosts CAPEX to maintain
Capex to develop
Distribution
Other variable cost
SG&A
~14%
~19%
~31%
~11%
~25%
% of Total Cost of Goods Sold
Cost Leadership Asset Light
Operating costs
Investments
2
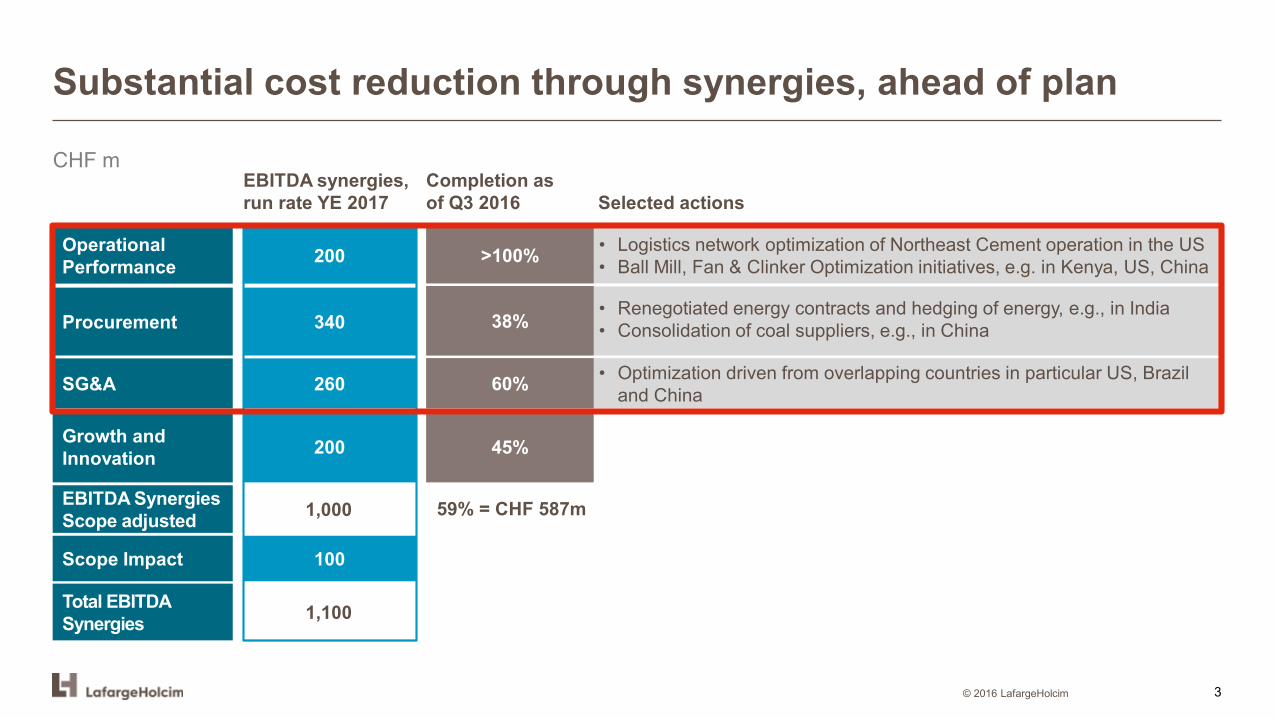
Substantial cost reduction through synergies, ahead of plan
© 2016 LafargeHolcim
CHF mCompletion as of Q3 2016 Selected actions
1,100
EBITDA synergies, run rate YE 2017
Procurement 38% • Renegotiated energy contracts and hedging of energy, e.g., in India• Consolidation of coal suppliers, e.g., in China 340
SG&A 60% • Optimization driven from overlapping countries in particular US, Brazil and China260
Growth andInnovation 45%200
Operational Performance 200 >100% • Logistics network optimization of Northeast Cement operation in the US
• Ball Mill, Fan & Clinker Optimization initiatives, e.g. in Kenya, US, China
Scope Impact 100
59% = CHF 587m1,000EBITDA Synergies Scope adjusted
Total EBITDA Synergies
3
0%5%10%15%20%25%30%35%40%
0
1
2
3
4
5
6
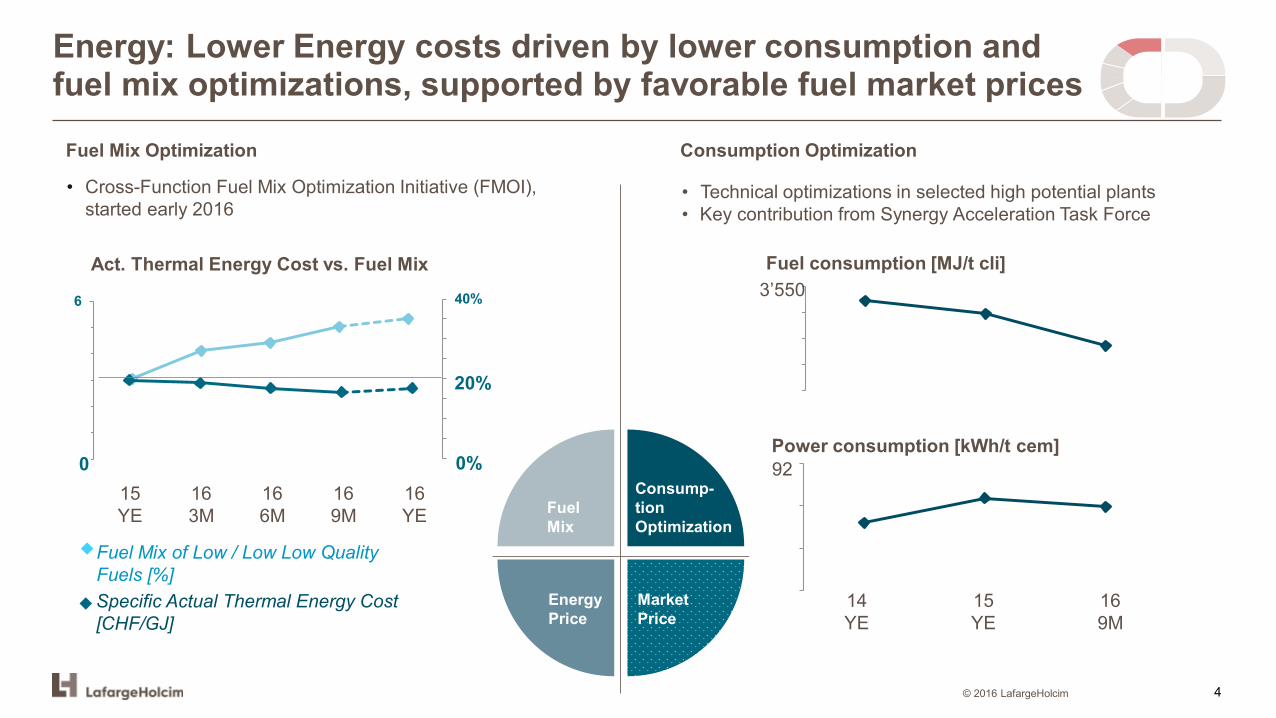
Energy: Lower Energy costs driven by lower consumption andfuel mix optimizations, supported by favorable fuel market prices
© 2016 LafargeHolcim
Fuel Mix
Consump-tionOptimization
EnergyPrice
Market Price
• Technical optimizations in selected high potential plants • Key contribution from Synergy Acceleration Task Force
Consumption Optimization
• Cross-Function Fuel Mix Optimization Initiative (FMOI), started early 2016
Fuel Mix Optimization
3,480
3,500
3,520
3,540
3,560Fuel consumption [MJ/t cli]
Power consumption [kWh/t cem]
14 YE
16 9M
15 YE
89.0
90.0
91.0
92.0
3’550
92
Specific Actual Thermal Energy Cost [CHF/GJ]
Fuel Mix of Low / Low Low Quality Fuels [%]
16 YE
15 YE
16 3M
16 6M
16 9M
Act. Thermal Energy Cost vs. Fuel Mix
0%0
20%
4
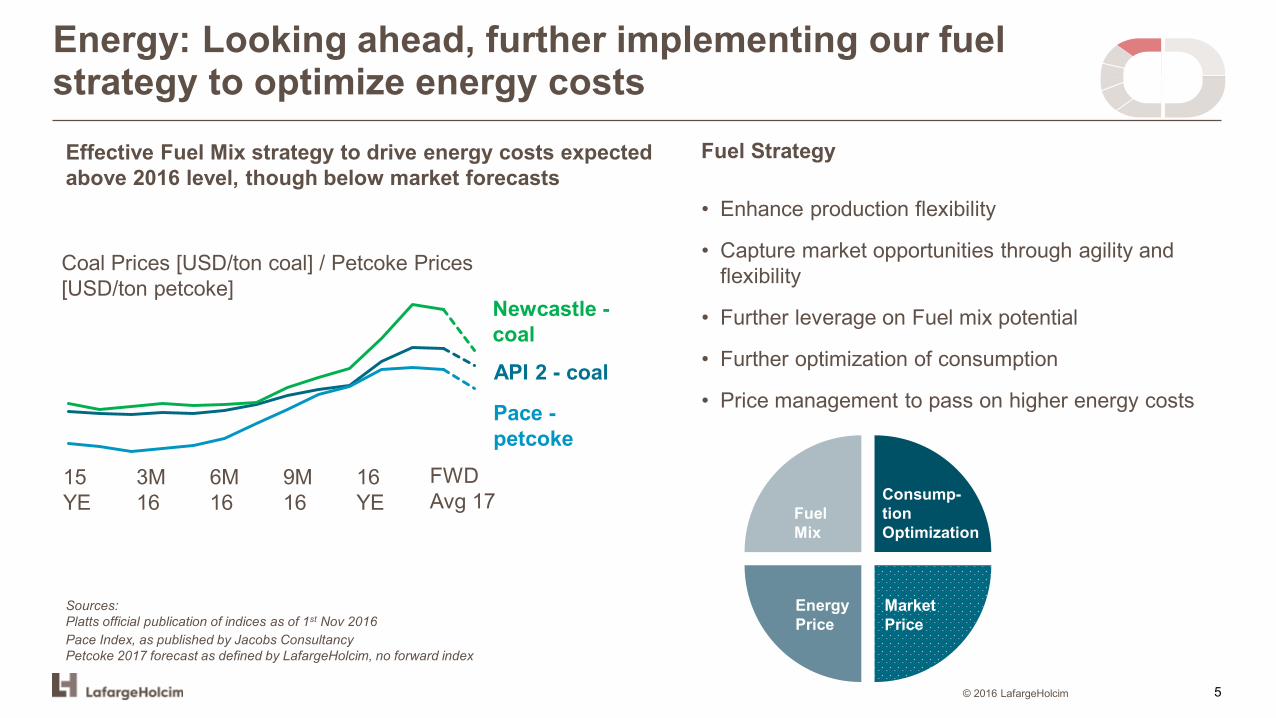
Energy: Looking ahead, further implementing our fuelstrategy to optimize energy costs
© 2016 LafargeHolcim
Fuel StrategyEffective Fuel Mix strategy to drive energy costs expected above 2016 level, though below market forecasts
Coal Prices [USD/ton coal] / Petcoke Prices [USD/ton petcoke]
9M 16
15YE
3M 16
6M 16
16YE
FWD Avg 17
Sources: Platts official publication of indices as of 1st Nov 2016Pace Index, as published by Jacobs ConsultancyPetcoke 2017 forecast as defined by LafargeHolcim, no forward index
Newcastle -coalAPI 2 - coal
Pace -petcoke
Fuel Mix
Consumption Optimization
Energy Price
Market Price
• Enhance production flexibility
• Capture market opportunities through agility and flexibility
• Further leverage on Fuel mix potential
• Further optimization of consumption
• Price management to pass on higher energy costs
Fuel Mix
Consump-tionOptimization
EnergyPrice
Market Price
5
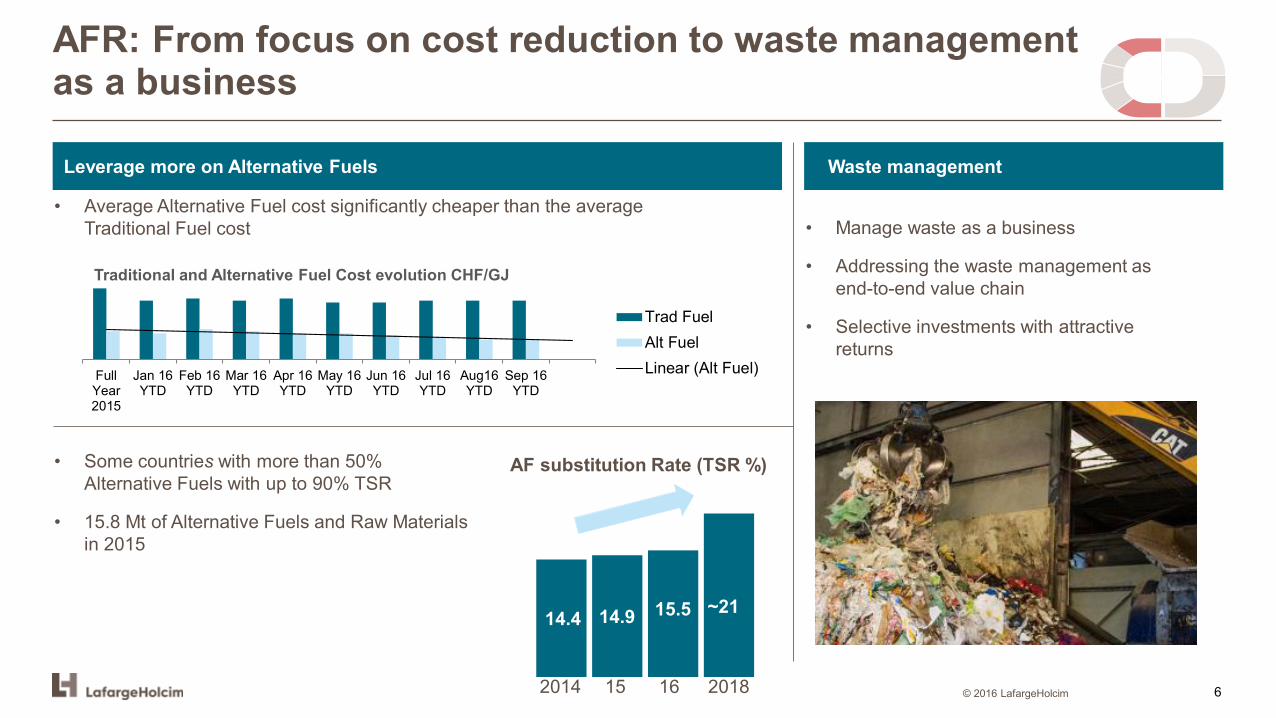
AFR: From focus on cost reduction to waste management as a business
Leverage more on Alternative Fuels
• Average Alternative Fuel cost significantly cheaper than the average Traditional Fuel cost
• Some countries with more than 50% Alternative Fuels with up to 90% TSR
• 15.8 Mt of Alternative Fuels and Raw Materials in 2015
• Manage waste as a business
• Addressing the waste management as end-to-end value chain
• Selective investments with attractive returns
Waste management
14.4 14.9 15.5 ~21
AF substitution Rate (TSR %)
FullYear2015
Jan 16YTD
Feb 16YTD
Mar 16YTD
Apr 16YTD
May 16YTD
Jun 16YTD
Jul 16YTD
Aug16YTD
Sep 16YTD
Traditional and Alternative Fuel Cost evolution CHF/GJ
Trad FuelAlt FuelLinear (Alt Fuel)
15 162014 2018 © 2016 LafargeHolcim 6
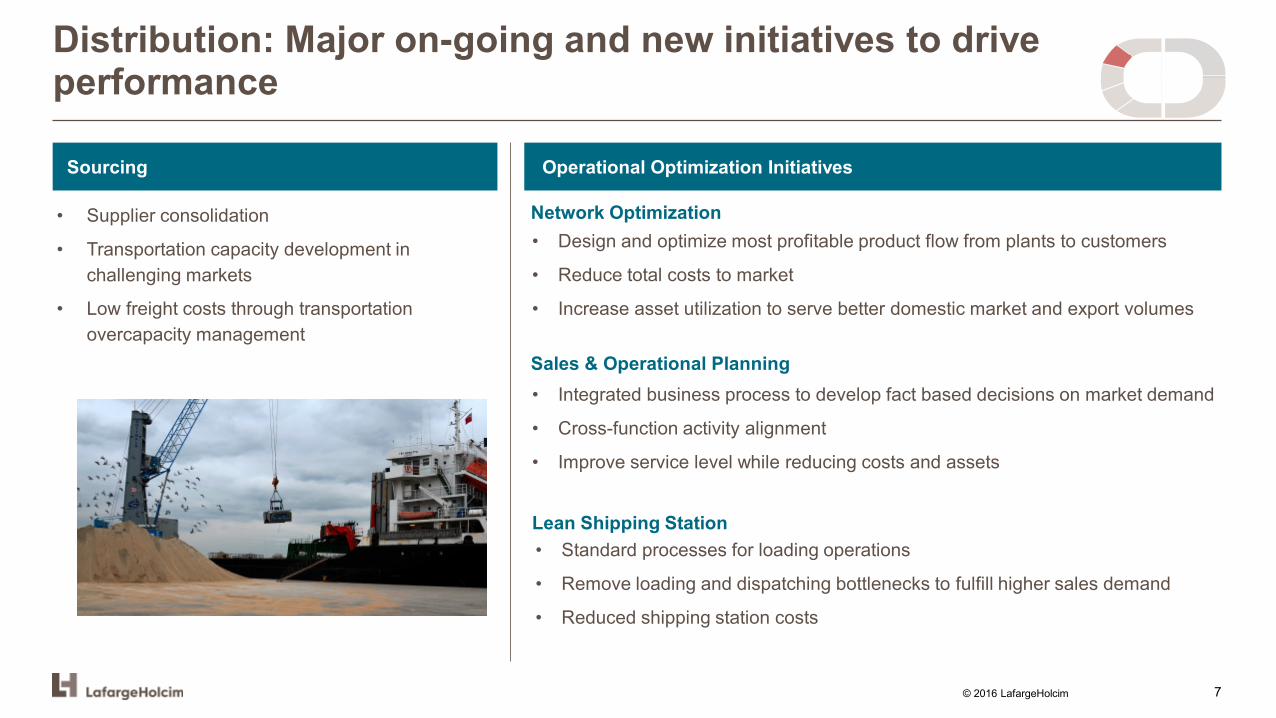
Distribution: Major on-going and new initiatives to drive performance
Operational Optimization Initiatives
• Supplier consolidation
• Transportation capacity development in challenging markets
• Low freight costs through transportation overcapacity management
Sourcing
Network Optimization• Design and optimize most profitable product flow from plants to customers
• Reduce total costs to market
• Increase asset utilization to serve better domestic market and export volumes
Sales & Operational Planning • Integrated business process to develop fact based decisions on market demand
• Cross-function activity alignment
• Improve service level while reducing costs and assets
Lean Shipping Station • Standard processes for loading operations
• Remove loading and dispatching bottlenecks to fulfill higher sales demand
• Reduced shipping station costs
© 2016 LafargeHolcim 7
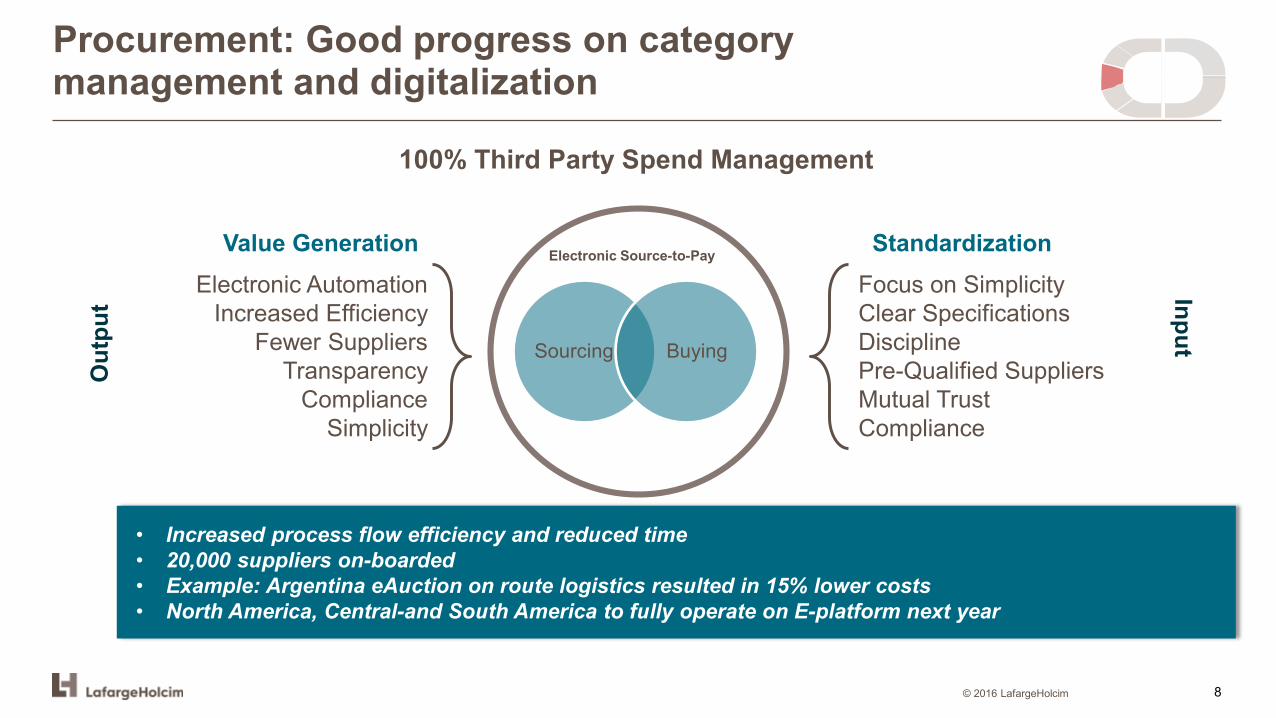
Procurement: Good progress on category management and digitalization
© 2016 LafargeHolcim
Sourcing Buying
Electronic Source-to-Pay
Electronic AutomationIncreased Efficiency
Fewer SuppliersTransparency
ComplianceSimplicity
Focus on SimplicityClear SpecificationsDisciplinePre-Qualified SuppliersMutual TrustCompliance
StandardizationValue Generation
Out
put Input
100% Third Party Spend Management
• Increased process flow efficiency and reduced time• 20,000 suppliers on-boarded• Example: Argentina eAuction on route logistics resulted in 15% lower costs• North America, Central-and South America to fully operate on E-platform next year
8
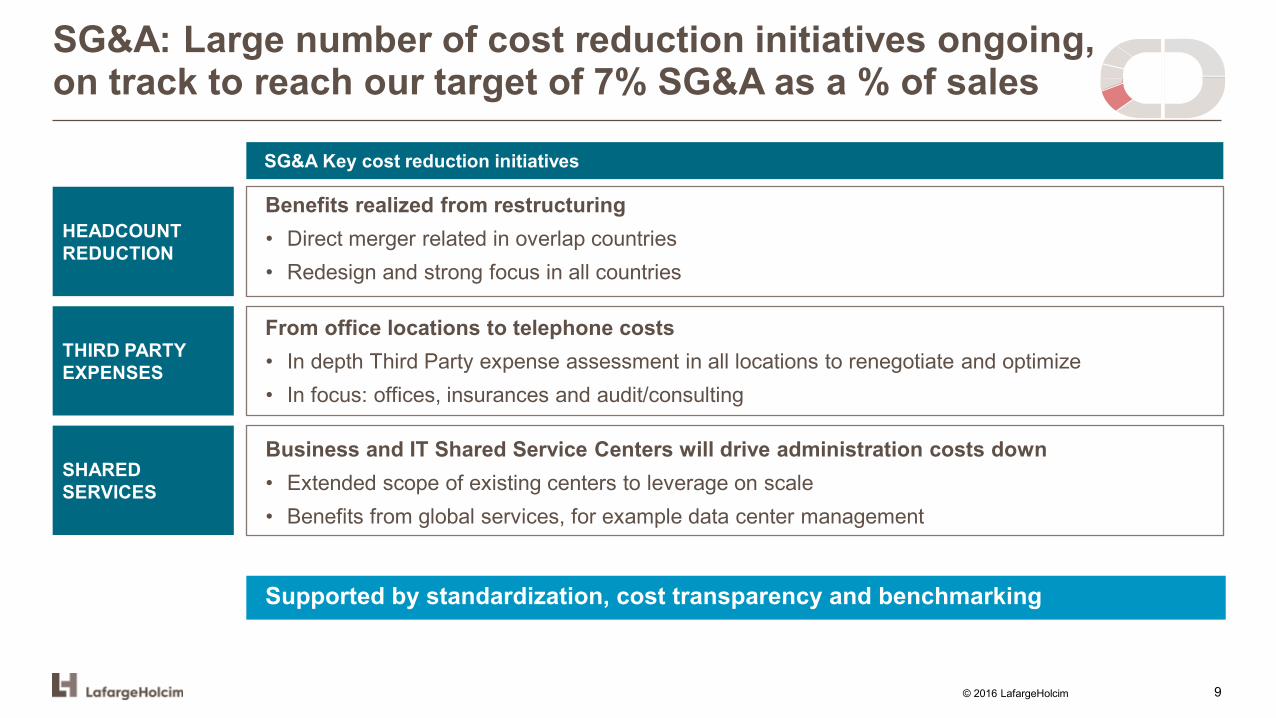
SG&A: Large number of cost reduction initiatives ongoing,on track to reach our target of 7% SG&A as a % of sales
HEADCOUNT REDUCTION
THIRD PARTY EXPENSES
SHARED SERVICES
Benefits realized from restructuring• Direct merger related in overlap countries• Redesign and strong focus in all countries
From office locations to telephone costs• In depth Third Party expense assessment in all locations to renegotiate and optimize• In focus: offices, insurances and audit/consulting
Business and IT Shared Service Centers will drive administration costs down• Extended scope of existing centers to leverage on scale• Benefits from global services, for example data center management
Supported by standardization, cost transparency and benchmarking
SG&A Key cost reduction initiatives
© 2016 LafargeHolcim 9
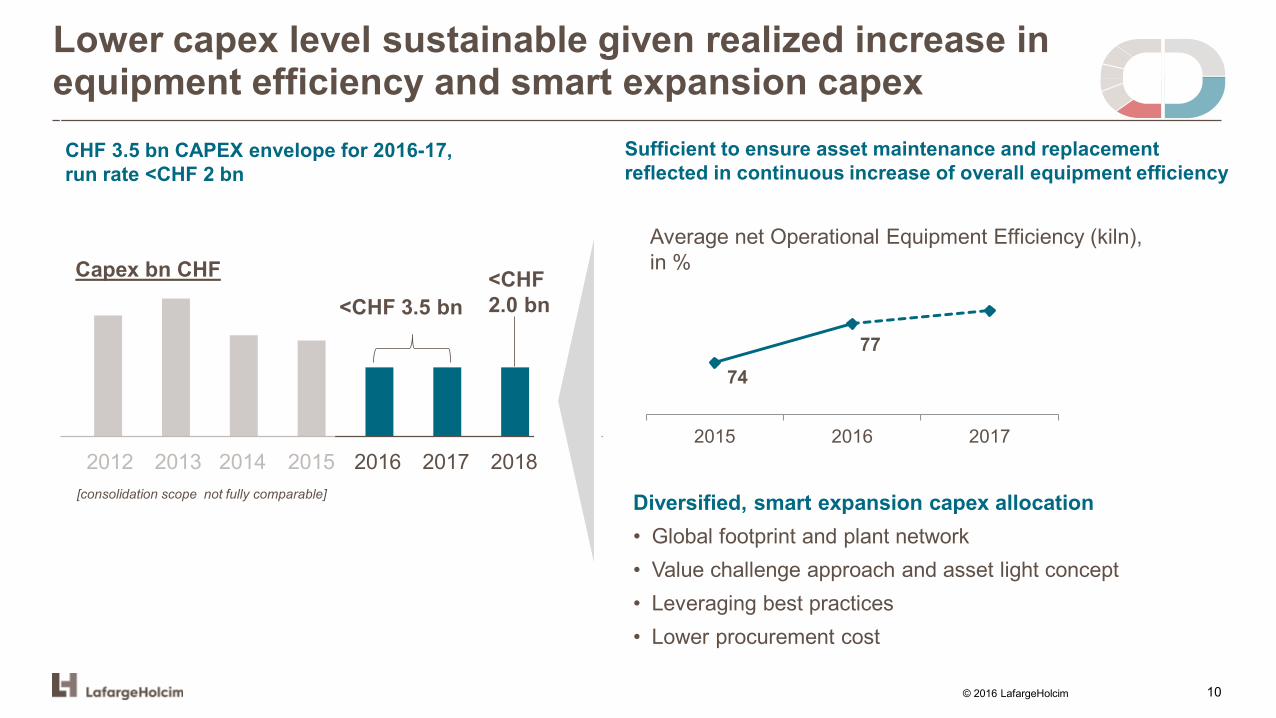
Sufficient to ensure asset maintenance and replacement reflected in continuous increase of overall equipment efficiency
Average net Operational Equipment Efficiency (kiln), in %
7477
2015 2016 2017
Diversified, smart expansion capex allocation• Global footprint and plant network• Value challenge approach and asset light concept• Leveraging best practices• Lower procurement cost
2015 2016 2017 201820132012 2014
<CHF 3.5 bn<CHF 2.0 bn
Capex bn CHF
[consolidation scope not fully comparable]
Lower capex level sustainable given realized increase in equipment efficiency and smart expansion capex
CHF 3.5 bn CAPEX envelope for 2016-17, run rate <CHF 2 bn
© 2016 LafargeHolcim 10
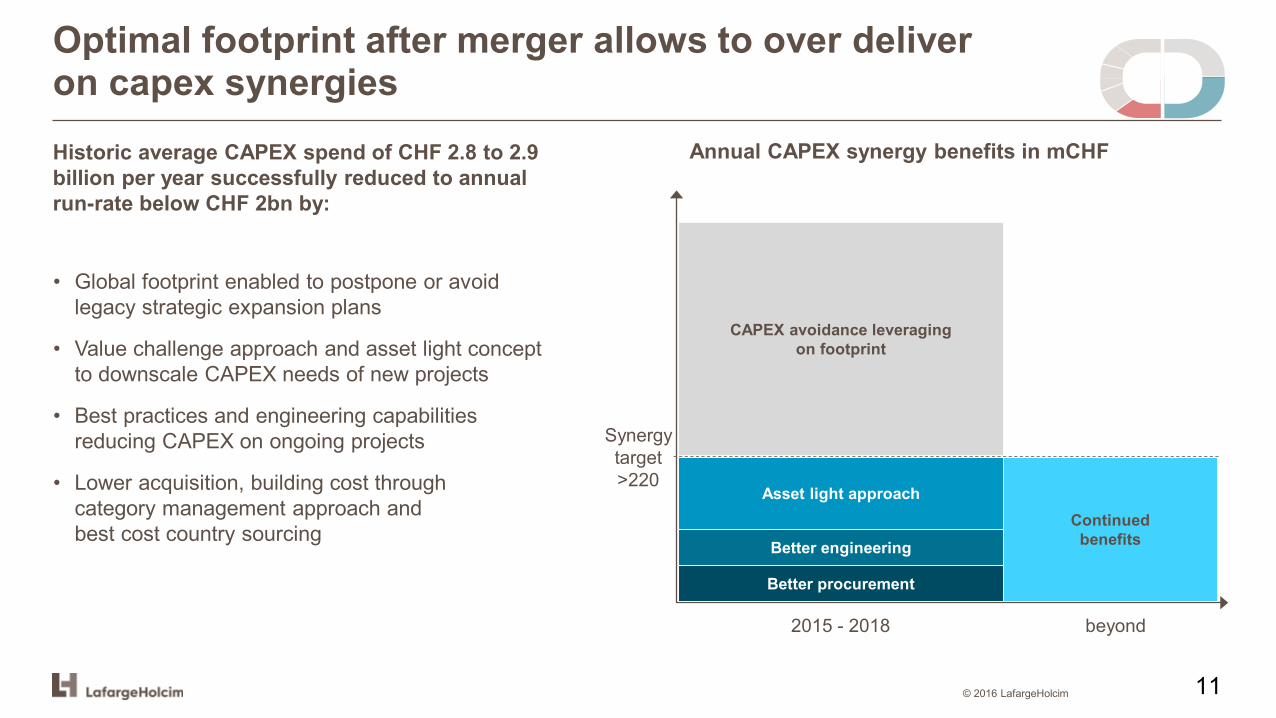
Optimal footprint after merger allows to over deliver on capex synergiesHistoric average CAPEX spend of CHF 2.8 to 2.9 billion per year successfully reduced to annual run-rate below CHF 2bn by:
• Global footprint enabled to postpone or avoid legacy strategic expansion plans
• Value challenge approach and asset light concept to downscale CAPEX needs of new projects
• Best practices and engineering capabilities reducing CAPEX on ongoing projects
• Lower acquisition, building cost throughcategory management approach andbest cost country sourcing
© 2016 LafargeHolcim
2015 - 2018 beyond
Better procurement
Better engineering
Asset light approach
CAPEX avoidance leveragingon footprint
Synergy target >220
Annual CAPEX synergy benefits in mCHF
Continuedbenefits
11
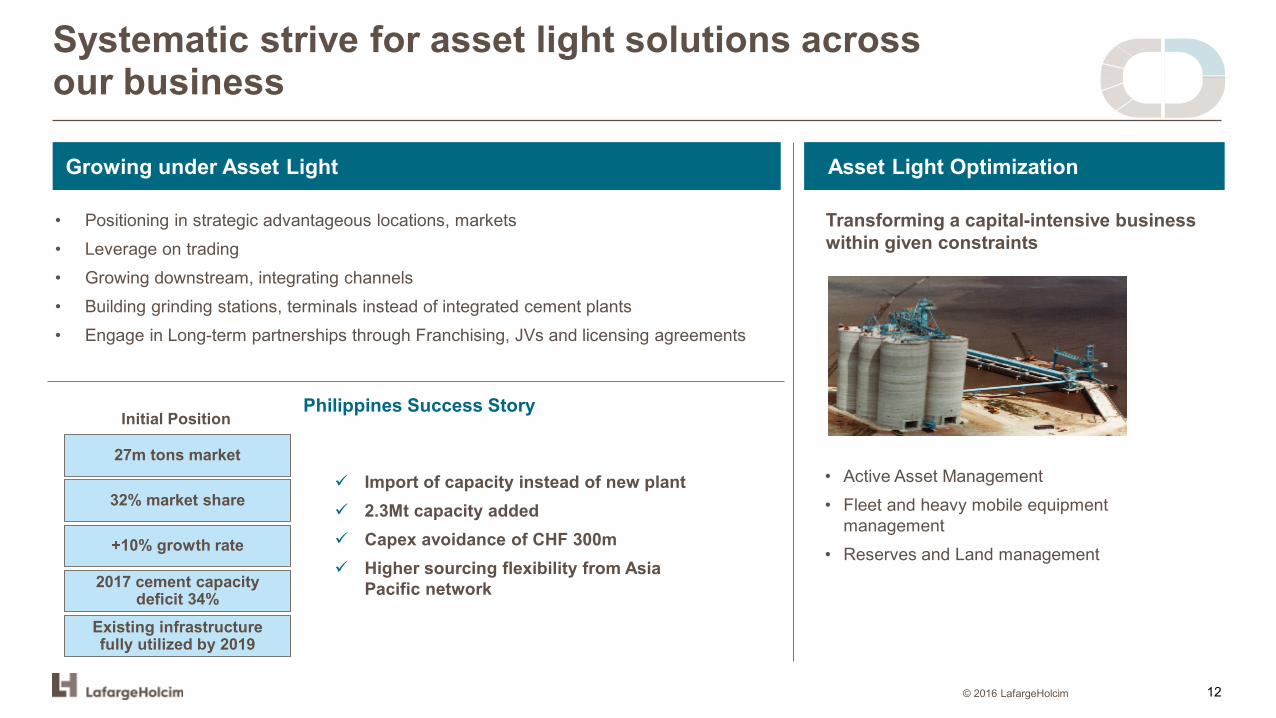
Systematic strive for asset light solutions acrossour business
© 2016 LafargeHolcim
Growing under Asset Light
Transforming a capital-intensive business within given constraints
Asset Light Optimization
• Positioning in strategic advantageous locations, markets• Leverage on trading • Growing downstream, integrating channels• Building grinding stations, terminals instead of integrated cement plants• Engage in Long-term partnerships through Franchising, JVs and licensing agreements
• Active Asset Management • Fleet and heavy mobile equipment
management • Reserves and Land management
Import of capacity instead of new plant 2.3Mt capacity added Capex avoidance of CHF 300m Higher sourcing flexibility from Asia
Pacific network
Philippines Success Story Initial Position
27m tons market
32% market share
+10% growth rate
2017 cement capacity deficit 34%
Existing infrastructure fully utilized by 2019
12
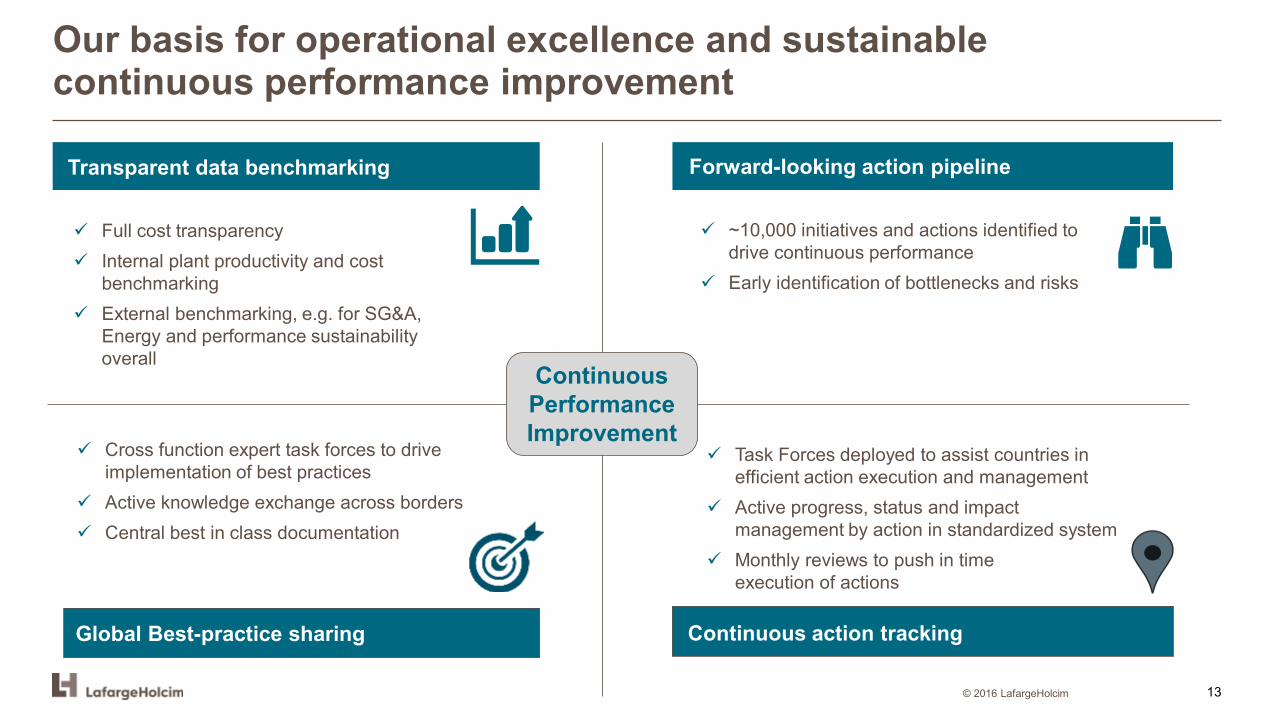
Continuous action trackingGlobal Best-practice sharing
Task Forces deployed to assist countries in efficient action execution and management
Active progress, status and impact management by action in standardized system
Monthly reviews to push in time execution of actions
Our basis for operational excellence and sustainable continuous performance improvement
© 2016 LafargeHolcim
Full cost transparency Internal plant productivity and cost
benchmarking External benchmarking, e.g. for SG&A,
Energy and performance sustainability overall
~10,000 initiatives and actions identified to drive continuous performance
Early identification of bottlenecks and risks
Cross function expert task forces to drive implementation of best practices
Active knowledge exchange across borders Central best in class documentation
Forward-looking action pipeline
Continuous Performance Improvement
Transparent data benchmarking
13
Operational excellence – Concluding remarks
• Operational excellence is key to drive sustainable growth in margins
• Synergies are being delivered ahead of schedule
• Significant cost improvements were achieved in 2016 and are planned for 2017
• On track to reach our target of 7% SG&A as a % of sales
• Energy prices expected to rise in 2017 (around 10%); tight cost management, fuel mix optimization, increased AF usage and operational improvements will partly mitigate cost impact
• Fixed costs being driven down through operational efficiency and optimized preventive maintenance
• Our asset light strategy is progressing and will allow growth under efficient capital allocation through: • New initiatives and business models• Leverage of our global footprint and of our existing capacities
© 2016 LafargeHolcim 14