Embed Size (px)
Citation preview
CAPITAL METRO Canberra’s light rail project
in a global context
March 2015
2
CAPITAL METRO: CANBERRA’S LIGHT RAIL IN A GLOBAL CONTEXT
The Australasian Railway Association (ARA) is a member based organisation which represents the interests of the rail sector in Australia and New Zealand. Members include urban, regional and interstate passenger rail operators, both government and privately owned. The ARA also covers all major freight operators, rail track owners together with private sector industry providers of infrastructure construction and maintenance, signalling and communications equipment and rolling stock manufacturers. For further information on this paper please contact: Australasian Railway Association, Suite 4, Level 4 Plaza Offices (East) Canberra Airport ACT 2609 Australia
T: +61 2 6270 4501 E: [email protected] Scott Martin – Manager, Rail Policy
Alicia Hewitt – Corporate Communications Manager
3
LIGHT RAIL: CAPITAL METRO IN A GLOBAL CONTEXT
TABLE OF CONTENTS
EXECUTIVE SUMMARY ................................................................................................................................................................................. 4
BACKGROUND ............................................................................................................................................................................................. 6
LIGHT RAIL AND ITS BENEFITS ................................................................................................................................................................... 7
CAPITAL METRO: LIGHT RAIL FOR CANBERRA ....................................................................................................................................... 10
Canberra ................................................................................................................................................................................................. 10
The Route ............................................................................................................................................................................................... 11
The case for light rail ............................................................................................................................................................................. 13
LIGHT RAIL IN AUSTRALIA ........................................................................................................................................................................ 17
Adelaide Light Rail ................................................................................................................................................................................. 17
G:Link, Gold Coast Light Rail ................................................................................................................................................................ 17
Melbourne .............................................................................................................................................................................................. 18
Sydney .................................................................................................................................................................................................... 19
LIGHT RAIL AROUND THE GLOBE ............................................................................................................................................................ 20
France ..................................................................................................................................................................................................... 20
Germany ................................................................................................................................................................................................. 22
United States of America ...................................................................................................................................................................... 23
INNOVATIVE FUNDING AND FINANCING ............................................................................................................................................... 27
KEY LESSONS ............................................................................................................................................................................................. 28
REFERENCES ............................................................................................................................................................................................... 30
4
LIGHT RAIL: CAPITAL METRO IN A GLOBAL CONTEXT
EXECUTIVE SUMMARY This paper outlines the proven benefits of light rail and how they can be delivered in Canberra. It details a number of
international light rail case studies similar to Capital Metro that illustrates the benefits of light rail to cities. Multiple examples
from around the world demonstrate that Canberra has a population suitable for developing light rail, with the many benefits
outweighing the initial financial cost and demonstrating the importance of a public transport system in ensuring better urban
connectivity and productivity.
Light Rail is a mode of transport that forms part of an integrated transport system, providing many benefits to cities,
including:
Certainty: The fixed routes of light rail lines provide certainty for residential, retail and commercial property
investment. This is one vital factor leading to considerable intensification of property development and uplift in
property values around light rail lines and at stations.
Capacity: Light rail can move between 4,000 and 20,000 people per hour in one direction in space equivalent to
one lane of road traffic. The same space dedicated to an arterial road lane could move only 800 cars (or less than
1,000 people) per hour, while the same space dedicated to buses would move between 2,000 and 8,000 people per
hour.1
Accessibility for all: Modern, low-floor light rail vehicles and level-access stops ensure the service is available to
people of all abilities, including the elderly, people with disabilities, tourists with luggage and people with prams.
Urban renewal: Light rail is highly valued for its ability to regenerate urban areas alongside complementary urban
planning policies to maximise revitalisation along light rail corridors and around light rail stations.
Residential and commercial property value uplift: Internationally, light rail is proven to generate long-term
average increases of up to 20 per cent in nearby property values. This uplift is indicative of preferences by firms
and individuals to locate along light rail stations and corridors.
The examples from overseas used in this paper should remind policy makers in Australia that light rail is a key element in
successfully developing and implementing long-term future urban plans, that prioritising public transport is essential to
managing future growth and improving a city’s amenity, liveability and sustainability. These key policy lessons include:
Integrated transport and land use planning to support city building, growing population without growing
congestion;
Transit-Oriented Development plans that direct property development into light rail stations and along light rail
corridors;
A suite of policy disincentives for car use in the city that increase the costs in time and money for car use;
Provision of a high-quality public transport alternative that integrates light rail and buses into a ‘mobility package’,
and;
Walking and cycling links that bring new and existing users to public transport by active transport.
5
LIGHT RAIL: CAPITAL METRO IN A GLOBAL CONTEXT
Canberra is a city set for further expansion over the coming decades. The transport needs for a city of 500,000 people is
different in many ways for a city of 300,000, just as the transport needs of present-day Canberra are different to those of the
1960s and 1970s. Continuing to invest heavily in more road capacity will not effectively serve the needs of Canberra and its
people as it continues to grow in population and develops into a more diversified economy. The implementation of a light
rail network integrated with the existing bus network will be a vital part of Canberra’s fabric for decades to come. Stage One
of Capital Metro is an appropriate and timely investment in the future of Canberra and also a down payment on a more
socially, economically and environmentally resilient city.
6
LIGHT RAIL: CAPITAL METRO IN A GLOBAL CONTEXT
BACKGROUND Canberra is ready to realise its light rail legacy and take advantage of the many benefits light rail offers. After a century
relying on road-based transport solutions, and investing $1 billion in roads over the last decade alone,2 Canberra is investing
in light rail with its Capital Metro project. Phase One is a 12km light rail line that will connect the northern suburb of
Gungahlin with the city centre in Civic, with an option for a further 3.2km extension from Civic to Russell Offices.3
Australian cities will come to a stand-still unless governments take a systemic approach that considers the optimal
integration of all transport modes according to the requirements of each city. Concentrating the majority of transport
infrastructure investment into roads has created an unbalanced, inefficient transport system that is unable to meet the
growing needs of the population.
As part of a growing recognition across Australia of the limitations to more road building, Canberra’s Capital Metro project is
part of a broader renaissance of light rail in Australia. New light rail projects are either operational, under construction, or
being planned in Melbourne, Adelaide, Canberra, the Gold Coast, Perth, Newcastle and Sydney; while smaller cities such as
Hobart and the Sunshine Coast are proposing their own light rail projects.
Light rail is an on-road public transport technology proven to provide broad-reaching benefits, including increased transport
capacity, more frequent and reliable public transport services and improved access to a city’s amenities for people of all
abilities. Light rail is also effective in stimulating increased investment in residential and commercial property development,
urban renewal and consequent uplift in property values, along with a range of environmental and human health benefits.
Light rail is experiencing a global renaissance in cities of all sizes, from cities with populations around 100,000 to under one
million. According to the International Association of Public Transport (UITP), 189 tram or light rail systems were operational
throughout Europe in 2009.4 Between 2004 and 2009, the number of networks in Europe grew by 10 per cent.
5 Since 1975,
30 cities in the United States and Canada have constructed light rail systems.6
Light rail projects in Australia and overseas typically face public and political opposition during the project development and
construction stages. Light rail extensions in Adelaide and the Gold Coast light rail faced such opposition, but experienced
significant shifts in perception by the media and the local and business communities after their completion. Both projects
have exceeded their initial patronage expectations and have spurred demands for the creation of city-wide light rail network
plans to expand single lines into a network in both cities. This is also likely scenario for the future of light rail in Canberra,
particularly since the extension in scope of Capital Metro Stage One from Civic to Russell Offices.
7
LIGHT RAIL: CAPITAL METRO IN A GLOBAL CONTEXT
LIGHT RAIL AND ITS BENEFITS At the start of the 21
st Century, more than 400 light rail systems were in operation and 100 systems were under construction
around the world.7 In the last decade, Australia has experienced a light rail renaissance, with projects in seven States and
Territories at varying stages of planning, construction or expansion. Today, light rail continues to experience a global revival.
Light rail offers cities such as Canberra a compelling public transport value proposition, which consists of:
a medium capacity, road-based public transport solution;
delivered at an affordable price point;
a range of economic, social and environmental benefits.
Unlike street tramways, which operate within mixed traffic and are susceptible to delay, light rail runs on dedicated rights-of-
way, segregated from other modes of transport with traffic signal priority at road intersections. As a result, light rail is a more
reliable form of road-based public transport, travelling at faster, and more consistent speeds than surrounding traffic, with
significantly higher capacity per lane of road space.
Light rail provides improved mobility in urban centres, particularly when well integrated with other forms of public transport.
It acts as a high-capacity, high-speed ‘spine’ that, when integrated with trunk and feeder bus services and local, regional and
national airports and railway stations, provides citizens with a ‘mobility package’ that is a serious alternative to the car. It also
provides many households with an option for a ‘low car/no car’ lifestyle with a range of social, economic and environmental
benefits.
Due to its low noise and emissions, light rail is able to be commonly viewed as improving the urban environment and the
accessibility and amenity of activity centres and suburban areas along the light rail corridor. Such improvements to the urban
environment can trigger urban regeneration as individuals and firms make decisions to relocate in and around light rail
corridors and stations.
Light rail also encourages more active, healthier lifestyles by increasing physical activity from increased levels of walking and
cycling to light rail stops. It improves accessibility to the city and its amenities for persons of all abilities, through the use of
‘step-free’ low-floor vehicles and level access platforms at stations.
Light Rail is a mode of transport that forms part of an integrated transport system, providing a broad range of benefits to
cities, including:
Certainty: The fixed routes of light rail lines provide certainty for residential, retail and commercial property
investment. This is one vital factor leading to considerable intensification of property development and uplift in
property values around light rail lines and at stations.
Capacity: Light rail can move between 4,000 and 20,000 people per hour in one direction in space equivalent to
one lane of road traffic. The same space dedicated to an arterial road lane could move only 800 cars (or less than
8
LIGHT RAIL: CAPITAL METRO IN A GLOBAL CONTEXT
1,000 people) per hour, while the same space dedicated to buses would move between 2,000 and 8,000 people per
hour.8
Accessibility for all: Modern, low-floor light rail vehicles and level-access stops ensure the service is available to
people of all abilities, including the elderly, people with disabilities, tourists with luggage and people with prams.
Urban renewal: Light rail is highly valued for its ability to regenerate urban areas. As a result, local governments
usually align light rail projects with complementary urban planning policies and precinct planning to maximise
urban revitalisation along light rail corridors and around light rail stations.
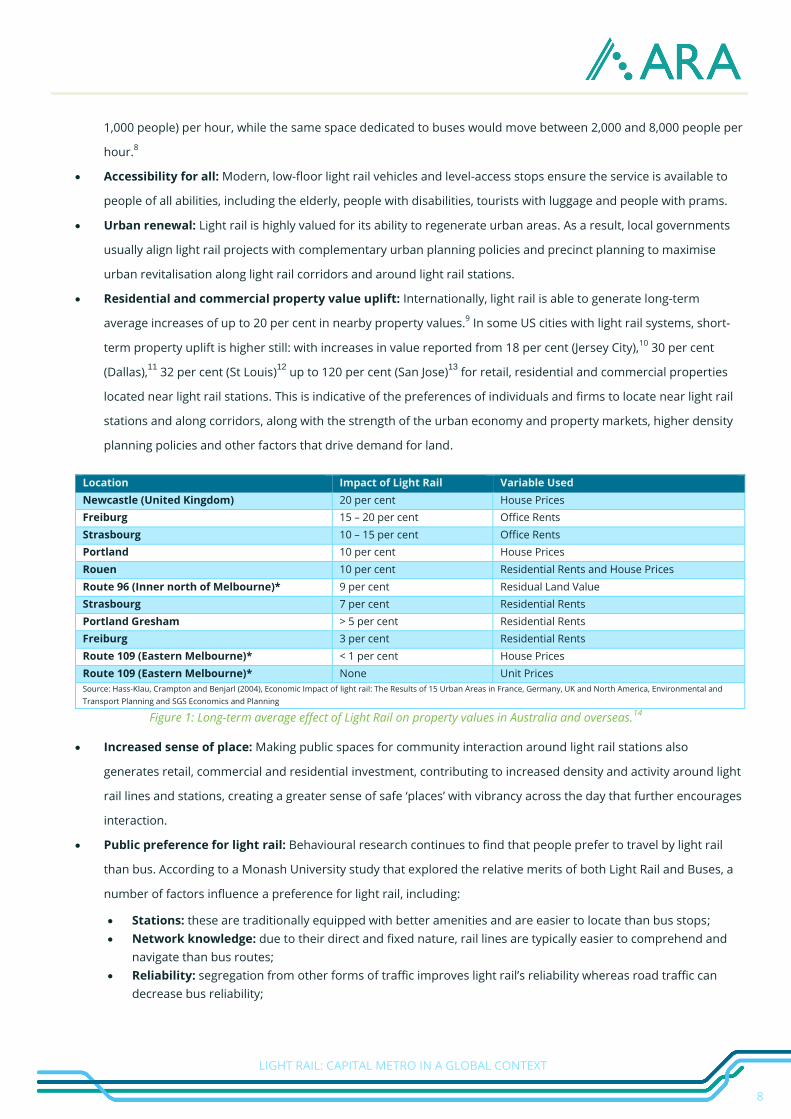
Residential and commercial property value uplift: Internationally, light rail is able to generate long-term
average increases of up to 20 per cent in nearby property values.9 In some US cities with light rail systems, short-
term property uplift is higher still: with increases in value reported from 18 per cent (Jersey City),10
30 per cent
(Dallas),11
32 per cent (St Louis)12
up to 120 per cent (San Jose)13
for retail, residential and commercial properties
located near light rail stations. This is indicative of the preferences of individuals and firms to locate near light rail
stations and along corridors, along with the strength of the urban economy and property markets, higher density
planning policies and other factors that drive demand for land.
Location Impact of Light Rail Variable Used
Newcastle (United Kingdom) 20 per cent House Prices
Freiburg 15 – 20 per cent Office Rents
Strasbourg 10 – 15 per cent Office Rents
Portland 10 per cent House Prices
Rouen 10 per cent Residential Rents and House Prices
Route 96 (Inner north of Melbourne)* 9 per cent Residual Land Value
Strasbourg 7 per cent Residential Rents
Portland Gresham > 5 per cent Residential Rents
Freiburg 3 per cent Residential Rents
Route 109 (Eastern Melbourne)* < 1 per cent House Prices
Route 109 (Eastern Melbourne)* None Unit Prices
Source: Hass-Klau, Crampton and Benjarl (2004), Economic Impact of light rail: The Results of 15 Urban Areas in France, Germany, UK and North America, Environmental and
Transport Planning and SGS Economics and Planning
Figure 1: Long-term average effect of Light Rail on property values in Australia and overseas.14
Increased sense of place: Making public spaces for community interaction around light rail stations also
generates retail, commercial and residential investment, contributing to increased density and activity around light
rail lines and stations, creating a greater sense of safe ‘places’ with vibrancy across the day that further encourages
interaction.
Public preference for light rail: Behavioural research continues to find that people prefer to travel by light rail
than bus. According to a Monash University study that explored the relative merits of both Light Rail and Buses, a
number of factors influence a preference for light rail, including:
Stations: these are traditionally equipped with better amenities and are easier to locate than bus stops;
Network knowledge: due to their direct and fixed nature, rail lines are typically easier to comprehend and
navigate than bus routes;
Reliability: segregation from other forms of traffic improves light rail’s reliability whereas road traffic can
decrease bus reliability;
9
LIGHT RAIL: CAPITAL METRO IN A GLOBAL CONTEXT
Priority: segregation from traffic provides light rail with priority right-of-way at intersections. Although buses
can be provided with priority rights-of-way, its effectiveness can be limited when buses are moving with
traffic, and;
Speed: rail is perceived to travel faster than buses, particularly in mixed road traffic.15
Health improvements: Public transport is a driver behind more active lifestyles leading to healthier individuals
and communities and helps to mitigate some of the health impacts of sedentary lifestyles. For example,
Melburnians travelling by public transport are five times more active than those who drive, averaging 41 minutes
walking each day compared to 8 minutes a day for drivers.16
The Queensland Government reports that public
transport assists increased activity levels of socioeconomically disadvantaged groups who are half as likely as more
advantaged individuals to participate in sport or physical activity.17
Environmentally efficient: The use of fossil fuels for transport creates one fifth of the world’s greenhouse gas
emissions.18
Aside from improving local air quality along the route, electrically-powered light rail vehicles can be
one of the most sustainable forms of land transport. Depending on the energy source, light rail is commonly cited
as capable of being close to emissions neutral and is therefore recognised as a sustainable transport solution. This
is a good fit for Canberra, with the ACT Government mandating 90 per cent of its energy to be generated from
renewable sources by 2020.
10
LIGHT RAIL: CAPITAL METRO IN A GLOBAL CONTEXT
CAPITAL METRO: LIGHT RAIL FOR CANBERRA The ACT Government committed to constructing light rail for Canberra after the 2012 election. Specifically the ACT
Government agreed to:
Establish an independent, statutory authority to implement the light rail project and associated development in the
corridor;
Undertake the necessary design studies, preparatory works, financing, procurement and tendering arrangements,
with a target date for the laying of tracks for the first route in 2016; and
Create a Canberra-wide light rail network master plan.19
Capital Metro has been established as the statutory body to deliver the Light Rail project. The project objectives are to:
Increase the mode share of public transport
Optimise frequency and service reliability
Affordable capital and operational costs
Grow a more diversified Canberra economy
Stimulate sustainable, urban re-development along the corridor
Increase social and economic participation
Revitalise the Northbourne Avenue corridor
Reduce carbon and other emissions.20
The Capital Metro project is directly engaged with the future of Canberra through introducing a sustainable transport
solution that provides broad reaching benefits for Australia’s Capital. The Capital Metro Business Case released in October
2014 confirmed the viability of the project, highlighting that that the project will deliver at least $1.20 in benefits for each
dollar invested.21
With construction to commence in 2016 followed by operation in 2019, initial patronage forecasts for Capital Metro
anticipate 15,120 passengers a day in 2021.22
The recent announcement of an enhanced scope for Capital Metro
incorporating Russell Offices and the Constitution Avenue corridor is projected to increase Capital Metro’s patronage
forecasts by up to 30 per cent.23
The Canberra-wide Light Rail Master Plan is under development for release during 2015.
Canberra Canberra is a planned city, based on the designs of landscape architect Walter Burley Griffin and Marion Mahony Griffin’s
master plan which was based on a vision of “parks and boulevards, public buildings and monuments”.24
To date, the plan has
only been partially realised. The wide median strips down the “main boulevards” of Northbourne, Adelaide and Wentworth
Avenues are all reminders that a major part of the Griffin’s vision for the city is missing: They envisaged a Canberra
connected by light rail.25
Through generations of investment in a high-volume, high-capacity, high-speed road network, Canberra has evolved into a
car-centric city. After a century of reliance on roads, the city is ready to realise its light rail legacy and the many benefits it is
11
LIGHT RAIL: CAPITAL METRO IN A GLOBAL CONTEXT
proven to generate; certainty for commercial and residential investment; transport capacity; accessibility for all; property
value uplift; increased density and sense of community; health benefits through active lifestyles as well as employment
during construction, operation and maintenance.
The Route Stage One of Capital Metro was originally envisaged to construct a 12-kilometre light rail line between Gungahlin and the
Civic. The route links into existing bus interchanges to ensure the new line is integrated with the existing bus network.
Existing pedestrian and cycling networks will link into the route to increase the catchment area of Capital Metro. To increase
the catchment further, several park-and-ride facilities will encourage patronage from the wider region to drive to a light rail
station and complete their journey by light rail.
A recent decision by the ACT Government has extended the scope of Capital Metro past Alinga Street in Civic to Russell
Offices via Constitution Avenue.26
As patronage is the most commonly cited indicator of success for public transport projects,
the ARA believes all efforts should be made to ensure Stage One captures a significant patronage base. Doing so would
better ensure the success of Stage One and provide confidence for future Territory governments to proceed with network
extensions.
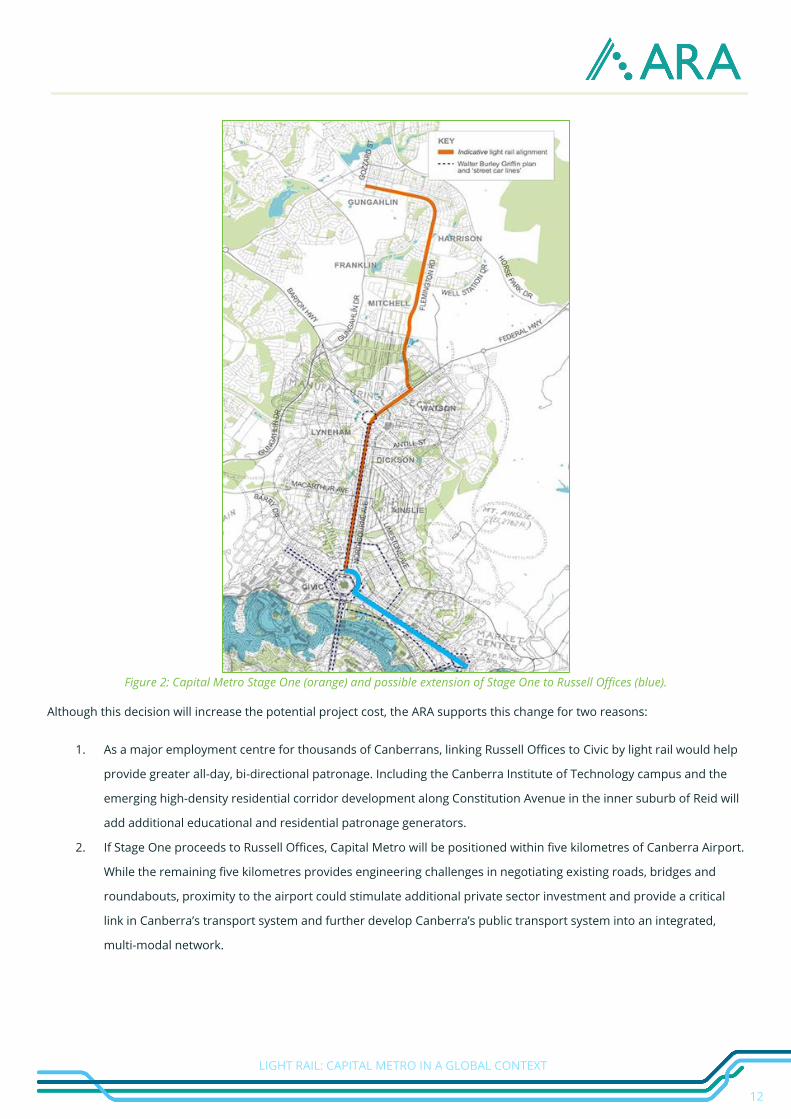
Figure 2 below displays the proposed route for Capital Metro Stage One in orange. The potential extension to Russell Offices
is highlighted in blue.
12
LIGHT RAIL: CAPITAL METRO IN A GLOBAL CONTEXT
Figure 2: Capital Metro Stage One (orange) and possible extension of Stage One to Russell Offices (blue).
Although this decision will increase the potential project cost, the ARA supports this change for two reasons:
1. As a major employment centre for thousands of Canberrans, linking Russell Offices to Civic by light rail would help
provide greater all-day, bi-directional patronage. Including the Canberra Institute of Technology campus and the
emerging high-density residential corridor development along Constitution Avenue in the inner suburb of Reid will
add additional educational and residential patronage generators.
2. If Stage One proceeds to Russell Offices, Capital Metro will be positioned within five kilometres of Canberra Airport.
While the remaining five kilometres provides engineering challenges in negotiating existing roads, bridges and
roundabouts, proximity to the airport could stimulate additional private sector investment and provide a critical
link in Canberra’s transport system and further develop Canberra’s public transport system into an integrated,
multi-modal network.
13
LIGHT RAIL: CAPITAL METRO IN A GLOBAL CONTEXT
Integrating light rail with buses Light rail and buses should not be viewed as an ‘either/or’ proposition. Arguments pitting buses against light rail are
blinkered and detract from the role both technologies can play in reducing car dependence in cities such as Canberra.
Integration between transport modes is vital to the success of a public transport system.
Australian cities will come to a stand-still unless governments take a systemic approach that considers the optimal
integration of all transport modes according to the requirements of each city. Concentrating the majority of transport
infrastructure investment into roads has created an unbalanced, inefficient transport system that is unable to meet the
growing needs of the population.
By learning from the many international success stories in integrating bus and light rail, efforts should be focused on how to
make buses and light rail seamless extensions of each mode so that they collectively provide a modern, integrated transport
system for a growing city that is competitive with the car for a range of work and leisure trips. Modern transport systems
integrate all modes of transport, establish buses as feeder services into heavy and light rail operations and encourage
individuals to park and ride, walk or cycle to transport stations.
An integrated transport system with service connectivity between transport modes is critical. It allows more people to use
public transport as they can move from additional origins to additional destinations which in turn increases the productivity
of the city and therefore the nation.
The case for light rail Like most significant projects, there are political, business and community members who publically support or do not
support the Capital Metro project. Those against the Capital Metro project typically cite Canberra’s low population density,
the project’s cost, its route or the inefficiency of the existing bus network in Canberra as their reasons that the project should
not proceed as planned. This section presents the case for light rail in Canberra.
Case Study: Lyon, France
Lyon in the south of France is recognised globally as a leader in integrated public transport. It is the largest network in
Europe to be contracted to a private operator.1 Keolis holds the contract which includes “four metro lines, four tram
lines, eight trolleybus lines, more than a hundred bus routes and two funicular railways, as well as 6,000 park and ride
spaces”.1 The four metro lines alone provide half of Lyon’s 1.4 million daily journeys on the Lyon transport network.
1
When Keolis took over the contract in Lyon, it redesigned and relaunched a new city bus network to better integrate bus
services with the metro, tram and trolleybus stations. In the first week this optimised network design increased
patronage by six per cent, proving that integrated public transport services will encourage greater patronage.
14
LIGHT RAIL: CAPITAL METRO IN A GLOBAL CONTEXT
Canberra’s population can support light rail Canberra’s population reached 381,500 in the middle of 2013 and is expecting high levels of future growth.
27 By 2016, the
ACT Government forecasts Canberra’s population to reach 390,000,28
with longer-term population projections of around
550,000 by 2035.29
The largest single growth area (around 40 per cent) of Canberra’s population is expected to occur in the
Gungahlin region of Canberra’s outer north.30
Canberra is generally viewed as a low density city with an urban corridor stretching 45km North to South, giving an average
Gross population density of around 4.4 people per hectare. However, when significant areas of nature reserves and state
forests in the ACT are removed, along with land not zoned residential, Canberra’s net residential densities are much higher,
with an adjusted average of 29.2 persons per hectare.31
Examining Gross population densities figures reveal significant
residential population concentrations (above 40 persons per hectare) in Canberra. High net residential population
concentrations already exist along key urban corridors in Canberra such as:
Along Northbourne Avenue from the CBD and Civic (Braddon, Turner);
South of the Lake around Wentworth Avenue and the Parliamentary Triangle (Barton, Kingston)
Ginnindera Avenue (Bruce, Lyneham).
Other concentrations include existing medium density development in and around existing town centres (Belconnen, Woden
and Tuggeranong) and newer outer suburban growth areas around Gunghalin (Amaroo, Gunghalin, Ngunnawal,
Palmerston).32
These pockets of high net residential densities suggest that Canberra can support high-quality, high-capacity public transport
such as light rail and suggests an outline of corridors and destinations for future light rail network expansion.
Capital Metro costs money – but so does doing nothing The Capital Metro Business Case costs out the initial 12km light rail line at $783 million. The average per-kilometre cost of
approximately $65 million/km is broadly consistent with the average capital costs of new-build Australian light rail projects
over the past 20 years.33
The $783 million cost of Capital Metro also includes significant funding of the one-off establishment
costs for a light rail network. Infrastructure such as rollingstock depots, traction power supply and distribution networks and
control centres are required either for a short ‘starter’ line such as Gunghalin – Civic - Russell Offices or for a more mature
network with multiple lines.
Case Study: Smaller cities can invest in Light Rail too
Cities around the globe with populations similar to or smaller than Canberra are successfully investing in light rail. Case
studies in this paper of Freiburg im Breisgau and Valenciennes, with urban populations respectively of 220,000 and
42,900 (and 390,000 in the wider region) both provide examples of cities with smaller populations than Canberra that
already reap many benefits from light rail. These case studies confirm Canberra’s population is not too small and it can
indeed support the Capital Metro project. Further information on case studies are provided from Page 15.
15
LIGHT RAIL: CAPITAL METRO IN A GLOBAL CONTEXT
The Capital Metro Business Case has forecast the project will generate around $1 billion in benefits for the Canberra
community over its first 30 years of operation.34
These benefits include travel time reductions, land use benefits,
infrastructure efficiencies, environmental benefits, direct and indirect employment throughout the various stages of the
project, health benefits and broader economic benefits for the city of Canberra. Essentially, the project is projected to return
at least $1.20 for every $1 invested.35
To better contextualise this figure, over the past ten years, the ACT Government has invested more than $1 billion on road
infrastructure. Over the next four years, a total of $2.5 billion has been budgeted by the ACT Government for infrastructure
development, with Capital Metro’s $783 representing less than one third of the Territory’s total infrastructure investment.36
It is clear governments can no longer build their way out of road congestion by increasing road capacity even where suitable
corridors exist. The induced demand for transport means new road capacity is quickly used and roads rapidly become
congested.37
Capital Metro represents a way to break this downward cycle of spending on more and bigger roads by
reallocating existing road space to carry more people per lane, per hour than private cars or the existing bus system can do.
Capital Metro services a high density, job rich corridor Canberra’s settlement pattern provides a wide-spread community that is challenging to connect with high quality public
transport. Stage One of Capital Metro will connect the CBD with Gungahlin, the fastest growing region of Canberra and on to
the large employment precinct of Russell Offices. As the ACT Government prepares its Light Rail Network Masterplan, the
plans to expand the single line into a more comprehensive network are expected to be revealed. Locally, Adelaide, the Gold
Coast and Sydney provide examples where single route light rail lines have been successfully constructed or extended and
planning for additional lines and better integration with bus and heavy rail systems has occurred.
Light rail due to its capital cost cannot service all of the city, but must connect key origins and destinations. Better public
transport connections to Canberra’s CBD are vital for the economic well-being and productivity of Canberra and the wider
region, particularly as a place where the high-value, high-skilled service sector jobs agglomerate. A recent study on the
relationship between public transport and urban productivity identified Canberra’s CBD (Civic) as one of a group of emerging
“high value-service sector clusters” powering the Australian economy. In FY 2012-2013, Civic was noted as contributing $5.6
billion to the nation’s GDP and was the 15th most valuable location in Australia by gross economic output in FY 2012-2013.38
Further along the corridor are the high density residential and employment sites along Northbourne Avenue and at the
northern end is the growing centre of Gunghalin which provides a range of retail, medical and personal services for outer
suburban areas targeted to absorb a significant proportion of Canberra’s future population such as Amaroo, Crace,
Ngunnawal and Palmerston.
The economic benefits derived through investing in public transport networks are broadly spread across the urban economy,
in new jobs, development of land, increased economic activity and reduced road congestion likely to be repaid many times
over. The South Australian Government’s research confirms this hypothesis, with the capital costs of its City West to Adelaide
Entertainment Centre light rail extension exceeded by the associated economic value generated by the project.39
Similarly,
16
LIGHT RAIL: CAPITAL METRO IN A GLOBAL CONTEXT
the Hiawatha light rail line in the US city of Minneapolis attracted strong opposition based on its high capital cost but went on
to attract patronage 65 per cent higher than originally predicted.40
Making decisions about who benefits most and least from the introduction of light rail is a dilemma for the ACT Government.
Ultimately, introduction of a new transport system must begin somewhere. The ACT Government’s reference to the
Gungahlin - Civic line as Stage One of the broader Capital Metro project demonstrates its intent to expand the single line into
a broader light rail network integrated with existing bus services.
Canberra needs a viable public transport option The efficient movement of the population for work and leisure is vital for the continued productivity, economic and social
prosperity of Australian cities. The Bureau of Infrastructure, Transport and Regional Economics identified that congestion
was costing the Australian economy $9.4 billion a year in 2005 due to lost productivity through additional travel times,
increased vehicle operating costs and poorer air quality.41
By 2020, congestion and consequent loss of productivity is
estimated to cost $20.4 billion nationally.42
For decades, Australian cities, including Canberra have looked to greater investment in roads to combat congestion but
investing in additional roads to accommodate additional cars is not a long-term solution. More roads lead to more vehicles
and ultimately, more congestion, leading to slower average speeds, longer travel times, heightened pollution, and increased
vehicle running costs.
Canberra is also commonly known as one Australia’s most car dependent cities. According to the 2011 Census of Population
and Housing, 83 per cent of the ACT’s population travels to work by car as either a driver or passenger. Active transport
(walking, cycling) account for only 7.7 per cent, with public transport having only 7.8 per cent of journeys to work 43
Canberra’s public transport usage statistics are well below Australia’s national average where an average of 16 per cent of
commuters travel to work by public transport. In jurisdictions with larger public transport networks, public transport’s mode
share is higher. For instance, 21 per cent of Sydney’s population commutes to work by public transport.44
Canberra’s low public transport usage is confirmation that the existing alternatives to the car are inadequate. Capital Metro,
when fully integrated into the existing bus network will provide an attractive alternative ‘mobility package’ that will shift many
Canberrans out of their cars and transform the public transport offering in Australia’s capital city.
17
LIGHT RAIL: CAPITAL METRO IN A GLOBAL CONTEXT
LIGHT RAIL IN AUSTRALIA Australia is undergoing a light rail renaissance, with cities such as Melbourne investing in upgrading and modernising their
mature tram network; in cities such as Sydney and Perth, light rail systems are being re-inserted into built up areas where
trams once ran; while smaller capitals (Adelaide) are extending and planning an expanded network, while regional cities
(Gold Coast) are building new light rail lines into complex urban environments. Canberra is now part of this renaissance with
Capital Metro. The following sections outline the recent successes of light rail in Australia.
Adelaide Light Rail In March 2010, the South Australian (SA) Government completed an extension of its single light rail line, taking it to a 16 km
line between Glenelg and the Adelaide Entertainment Centre via the city’s CBD. Although it faced strong public and political
opposition during its planning and construction, the extended light rail line quickly became a success.
The line exceeded its initial patronage forecasts and hit maximum capacity during peak periods leading the SA Government
to purchase additional rollingstock to meet demand. Public transport patronage increased on the route by 40 per cent to and
from Glenelg and today the line moves 20,000 people daily.
The project achieved a higher benefit-cost-ratio than identified during planning. It triggered an extra 1354 jobs within 400m
of the light rail system and the SA Government states that the associated economic value far exceeds construction costs.45
Following the success of the extension, the SA Government released its Integrated Transport and Land Use Planning Strategy
which outlines a comprehensive light rail network for Adelaide, effectively relaying the tracks from the tram network Adelaide
previously had. Named AdeLINK, the proposed network includes six tram lines designed to link the CBD with Adelaide
suburbs.46
G:Link, Gold Coast Light Rail The 13 km light rail line that runs from the Gold Coast University Hospital at Southport down the coast to Broadbeach
opened on 20 July 2014. Within three months of opening, higher patronage numbers than forecast meant that by mid-
September 2014 the service had moved over 1.2 million passengers, sparking a 13 per cent patronage increase on the Gold
Coast’s public transport system.47
As at February 2015, G:Link has carried over 3 million passengers and is on trend to
exceed its Year One forecasts.
The line runs 14 bi-directional high-capacity light rail vehicles, each carrying up to 309 passengers at speeds of up to 70km/h
to complete the 13 km journey in 37 minutes, with an trams arriving at stops on average every 7.5 minutes (8 services an
hour). The G:Link route operates largely in a reserved right of way, either on one side of the street or in the central median to
ensure minimal interaction between light rail vehicles and other road traffic.
18
LIGHT RAIL: CAPITAL METRO IN A GLOBAL CONTEXT
The project was funded through a public private partnership that included federal, state and local government funding.
Although it was met with some opposition during early stages of construction, as the system prepared to open, locals began
calling for phase two of the line to be approved and commenced. The line doesn’t currently link with the heavy rail service
into the Gold Coast. Phase Two would connect the light rail line to the heavy rail service in the north of the Gold Coast, better
integrating both modes.
The Gold Coast City Transport Strategy 2031 provides a city-wide transport plan, including the expansion of the G:Link light
rail with a possible four lines and better integration with the heavy rail and bus network.48
Both the Adelaide light rail extension to the Entertainment Centre and the G:Link project on the Gold Coast both experienced
negative media coverage and community feedback initially and during construction. However, when operations began, both
projects became almost overnight successes. Faced with overloaded services, the SA Government needed to purchase
additional rollingstock to meet demand. On the Gold Coast, local and business communities actively demanding that the
Queensland Government commence Stage Two of the project to commence, with the backing of a once-hostile local
newspaper.49
Melbourne The economic vitality of Melbourne relies on the tram system, which provides access to 34 per cent of all jobs in metropolitan
Melbourne.50
It links Melbourne’s inner and middle suburbs to employment, educational, medical and other activity centres
in Melbourne’s CBD and surrounds and local access to suburban strip shopping centres.
An outstanding example of the role the tram system plays in supporting Melbourne’s economy is the 14km-long Route 96
tram (East Brunswick – St Kilda Beach) that gives access to over one in every 10 metropolitan jobs.51
Some corridors carry
high numbers of passenger for a street tramway system. The Elizabeth Street corridor (Flinders St/Queen Victoria Market)
can carry around 4,000 people per hour in each direction. The Swanston Street/St Kilda Road corridor carries over 5,500
people per hour in each direction. It is no coincidence that the recently announced Melbourne Metro project follows this
corridor.
Melbourne’s tram network is today the largest in the world, totalling 250km of double-track.52
However, 80 per cent of
Melbourne's tram network shares road space with other vehicles.53
As a result, trams compete with road traffic, slowing
average tram speeds to 16 km/h and as low as 11 km/h within the CBD.54
Up until a decade ago, the tram network expanded
along arterial roads in the middle and outer suburbs of Melbourne, although the limits to further network extensions has
probably been reached.
To improve the network speed and therefore capacity and service offering, Melbourne’s tram operator Yarra Trams and
government agency Public Transport Victoria are implementing plans to modernise the system and transition it from a ‘tram’
system to a ‘light rail’ system where the network is segregated from other road traffic and is granted priority right-of-way at
traffic lights. Route 96 is earmarked as one of the first routes to be converted to a ‘premium’ light rail route.
19
LIGHT RAIL: CAPITAL METRO IN A GLOBAL CONTEXT
Sydney Today Sydney like many other global cities, is re-investing in light rail. From 1997 to 2000, a disused freight railway was
progressively converted to light rail and new services introduced between Central Station and Lilyfield. The line was
expanded a further 5.6km to Dulwich Hill in 2014.
Most recently, the NSW Government awarded a $2.1 billion contract to design, build, operate, maintain and finance Sydney’s
CBD and South East Light Rail, a 15 km light rail line that will link multiple key locations in Sydney’s inner south-east; Circular
Quay and Central Station in the CBD, the sporting and entertainment precincts at Moore Park, the University of NSW at
Kensington, as well as the Sydney Cricket Ground, Sydney Football Stadium, Randwick Racecourse and Prince of Wales
Hospital at Randwick. Integrated with existing heavy rail and bus networks this project will greatly improve transport
between in the ‘Global Arc’ between Sydney’s CBD and the inner south-east.
The detailed planning and development being undertaken into the Western Sydney Light Rail project confirms the state’s
commitment to light rail, connecting the Parramatta CBD to the Hills District and Macquarie University.
20
LIGHT RAIL: CAPITAL METRO IN A GLOBAL CONTEXT
LIGHT RAIL AROUND THE GLOBE
France During the 1950’s and 60’s, France, like many other nations, removed almost all of its tram networks. Only the tramways of
Lille, Etienne and Marseille were retained.55
In the mid-1970’s, the French Transport Minister announced national funding
assistance for medium-sized cities that invested in light rail to address growing traffic congestion and parking problems.56
Following significant investment since the 1980s, France is today recognised as a world leader in light rail.57
The Nantes light rail system, opened in 1985, is attributed as the first modern light rail system in Europe.58
By 2008, 37 light
rail systems were in operation in French cities of all sizes, including those with populations as low as 90,000.59
The French
Government’s political commitment to sustainable transport and the use of its Versement Transport (payroll tax) funding
mechanism are both attributed to the national expansion of light rail throughout French cities of various sizes.
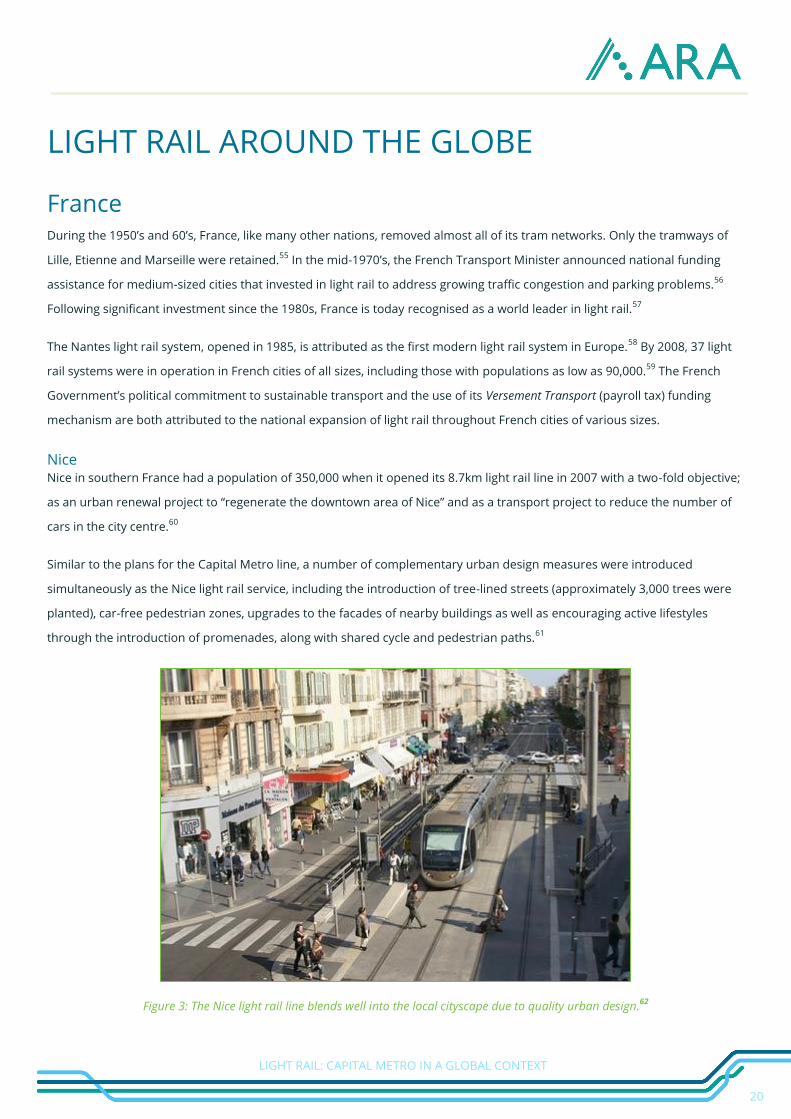
Nice Nice in southern France had a population of 350,000 when it opened its 8.7km light rail line in 2007 with a two-fold objective;
as an urban renewal project to “regenerate the downtown area of Nice” and as a transport project to reduce the number of
cars in the city centre.60
Similar to the plans for the Capital Metro line, a number of complementary urban design measures were introduced
simultaneously as the Nice light rail service, including the introduction of tree-lined streets (approximately 3,000 trees were
planted), car-free pedestrian zones, upgrades to the facades of nearby buildings as well as encouraging active lifestyles
through the introduction of promenades, along with shared cycle and pedestrian paths.61
Figure 3: The Nice light rail line blends well into the local cityscape due to quality urban design.62
21
LIGHT RAIL: CAPITAL METRO IN A GLOBAL CONTEXT
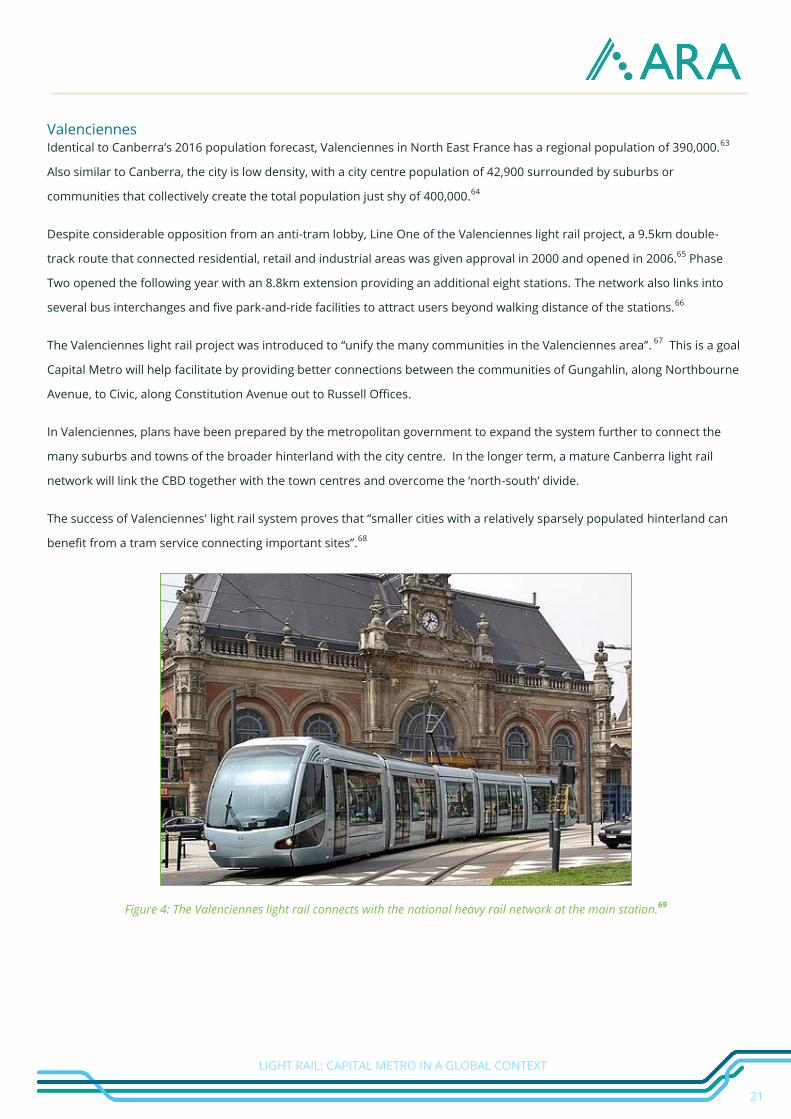
Valenciennes Identical to Canberra’s 2016 population forecast, Valenciennes in North East France has a regional population of 390,000.
63
Also similar to Canberra, the city is low density, with a city centre population of 42,900 surrounded by suburbs or
communities that collectively create the total population just shy of 400,000.64
Despite considerable opposition from an anti-tram lobby, Line One of the Valenciennes light rail project, a 9.5km double-
track route that connected residential, retail and industrial areas was given approval in 2000 and opened in 2006.65
Phase
Two opened the following year with an 8.8km extension providing an additional eight stations. The network also links into
several bus interchanges and five park-and-ride facilities to attract users beyond walking distance of the stations.66
The Valenciennes light rail project was introduced to “unify the many communities in the Valenciennes area”. 67
This is a goal
Capital Metro will help facilitate by providing better connections between the communities of Gungahlin, along Northbourne
Avenue, to Civic, along Constitution Avenue out to Russell Offices.
In Valenciennes, plans have been prepared by the metropolitan government to expand the system further to connect the
many suburbs and towns of the broader hinterland with the city centre. In the longer term, a mature Canberra light rail
network will link the CBD together with the town centres and overcome the ‘north-south’ divide.
The success of Valenciennes' light rail system proves that “smaller cities with a relatively sparsely populated hinterland can
benefit from a tram service connecting important sites”.68
Figure 4: The Valenciennes light rail connects with the national heavy rail network at the main station.69
22
LIGHT RAIL: CAPITAL METRO IN A GLOBAL CONTEXT
Germany Due to not dismantling its tram systems to the same extent as other nations with the advent of cars and buses, Germany has
more tram and light rail systems in service than any other country worldwide. According to the UITP, 56 systems were
operational throughout in 2009.70
However, many of these are legacy tramway systems as opposed to the modern light rail
networks being constructed today.71
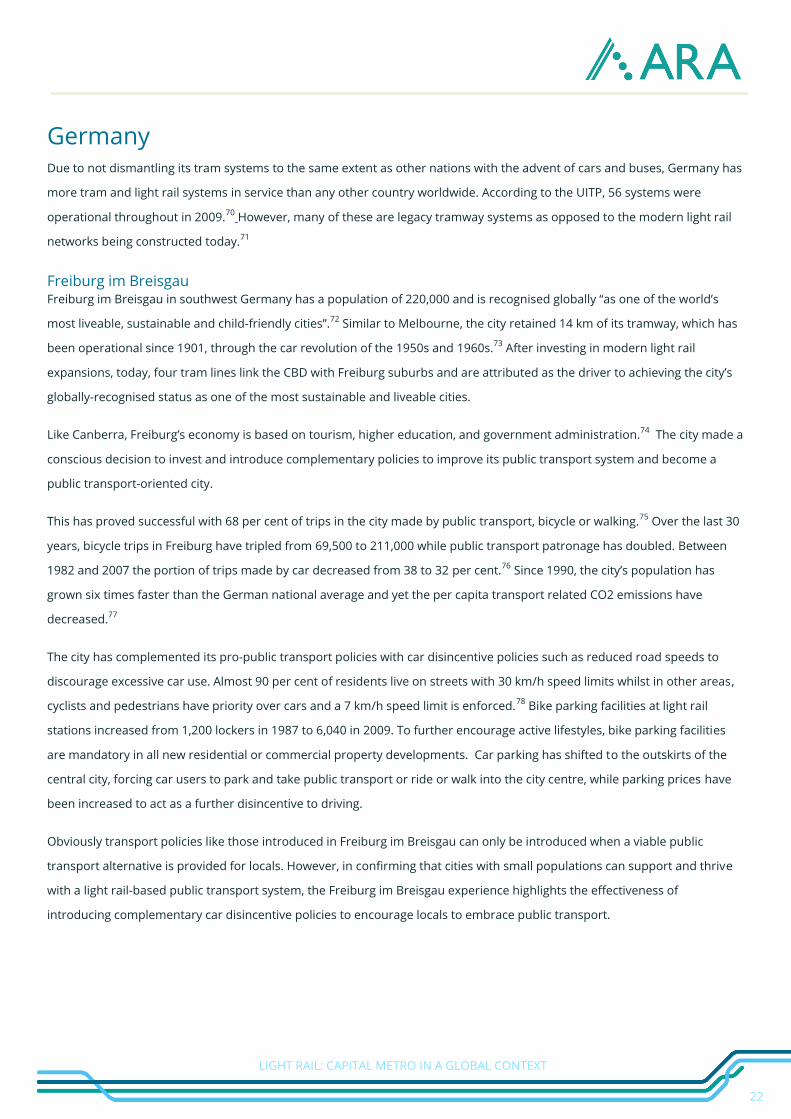
Freiburg im Breisgau Freiburg im Breisgau in southwest Germany has a population of 220,000 and is recognised globally “as one of the world’s
most liveable, sustainable and child-friendly cities”.72
Similar to Melbourne, the city retained 14 km of its tramway, which has
been operational since 1901, through the car revolution of the 1950s and 1960s.73
After investing in modern light rail
expansions, today, four tram lines link the CBD with Freiburg suburbs and are attributed as the driver to achieving the city’s
globally-recognised status as one of the most sustainable and liveable cities.
Like Canberra, Freiburg’s economy is based on tourism, higher education, and government administration.74
The city made a
conscious decision to invest and introduce complementary policies to improve its public transport system and become a
public transport-oriented city.
This has proved successful with 68 per cent of trips in the city made by public transport, bicycle or walking.75
Over the last 30
years, bicycle trips in Freiburg have tripled from 69,500 to 211,000 while public transport patronage has doubled. Between
1982 and 2007 the portion of trips made by car decreased from 38 to 32 per cent.76
Since 1990, the city’s population has
grown six times faster than the German national average and yet the per capita transport related CO2 emissions have
decreased.77
The city has complemented its pro-public transport policies with car disincentive policies such as reduced road speeds to
discourage excessive car use. Almost 90 per cent of residents live on streets with 30 km/h speed limits whilst in other areas,
cyclists and pedestrians have priority over cars and a 7 km/h speed limit is enforced.78
Bike parking facilities at light rail
stations increased from 1,200 lockers in 1987 to 6,040 in 2009. To further encourage active lifestyles, bike parking facilities
are mandatory in all new residential or commercial property developments. Car parking has shifted to the outskirts of the
central city, forcing car users to park and take public transport or ride or walk into the city centre, while parking prices have
been increased to act as a further disincentive to driving.
Obviously transport policies like those introduced in Freiburg im Breisgau can only be introduced when a viable public
transport alternative is provided for locals. However, in confirming that cities with small populations can support and thrive
with a light rail-based public transport system, the Freiburg im Breisgau experience highlights the effectiveness of
introducing complementary car disincentive policies to encourage locals to embrace public transport.
23
LIGHT RAIL: CAPITAL METRO IN A GLOBAL CONTEXT
Figure 5: A car-free zone of the city of Freiburg im Breisgau is intersected by the light rail network.79
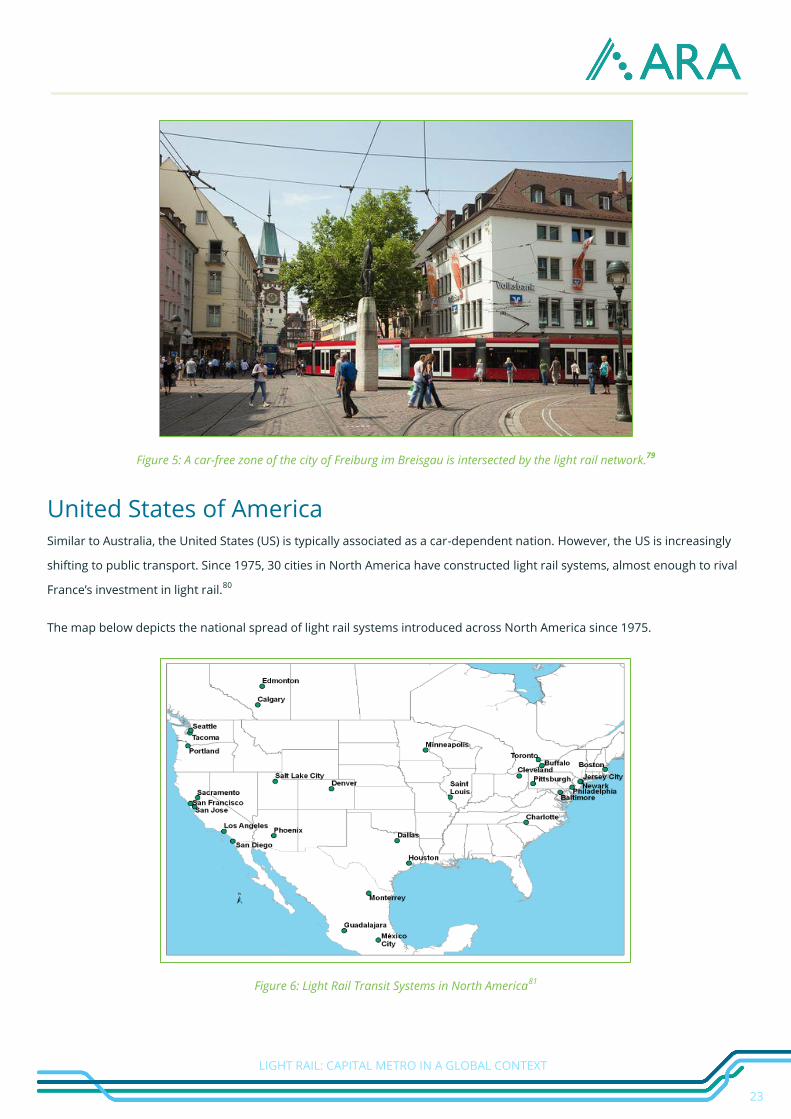
United States of America Similar to Australia, the United States (US) is typically associated as a car-dependent nation. However, the US is increasingly
shifting to public transport. Since 1975, 30 cities in North America have constructed light rail systems, almost enough to rival
France’s investment in light rail.80
The map below depicts the national spread of light rail systems introduced across North America since 1975.
Figure 6: Light Rail Transit Systems in North America81
24
LIGHT RAIL: CAPITAL METRO IN A GLOBAL CONTEXT
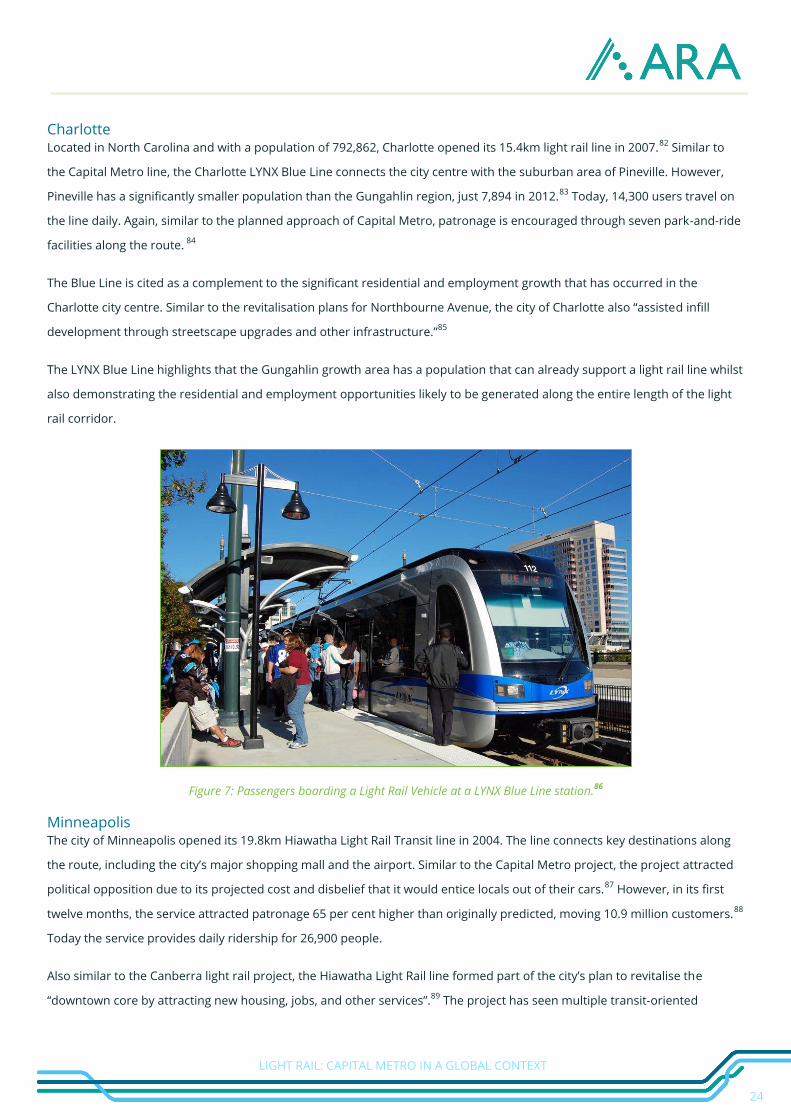
Charlotte Located in North Carolina and with a population of 792,862, Charlotte opened its 15.4km light rail line in 2007.
82 Similar to
the Capital Metro line, the Charlotte LYNX Blue Line connects the city centre with the suburban area of Pineville. However,
Pineville has a significantly smaller population than the Gungahlin region, just 7,894 in 2012.83
Today, 14,300 users travel on
the line daily. Again, similar to the planned approach of Capital Metro, patronage is encouraged through seven park-and-ride
facilities along the route. 84
The Blue Line is cited as a complement to the significant residential and employment growth that has occurred in the
Charlotte city centre. Similar to the revitalisation plans for Northbourne Avenue, the city of Charlotte also “assisted infill
development through streetscape upgrades and other infrastructure.”85
The LYNX Blue Line highlights that the Gungahlin growth area has a population that can already support a light rail line whilst
also demonstrating the residential and employment opportunities likely to be generated along the entire length of the light
rail corridor.
Figure 7: Passengers boarding a Light Rail Vehicle at a LYNX Blue Line station.86
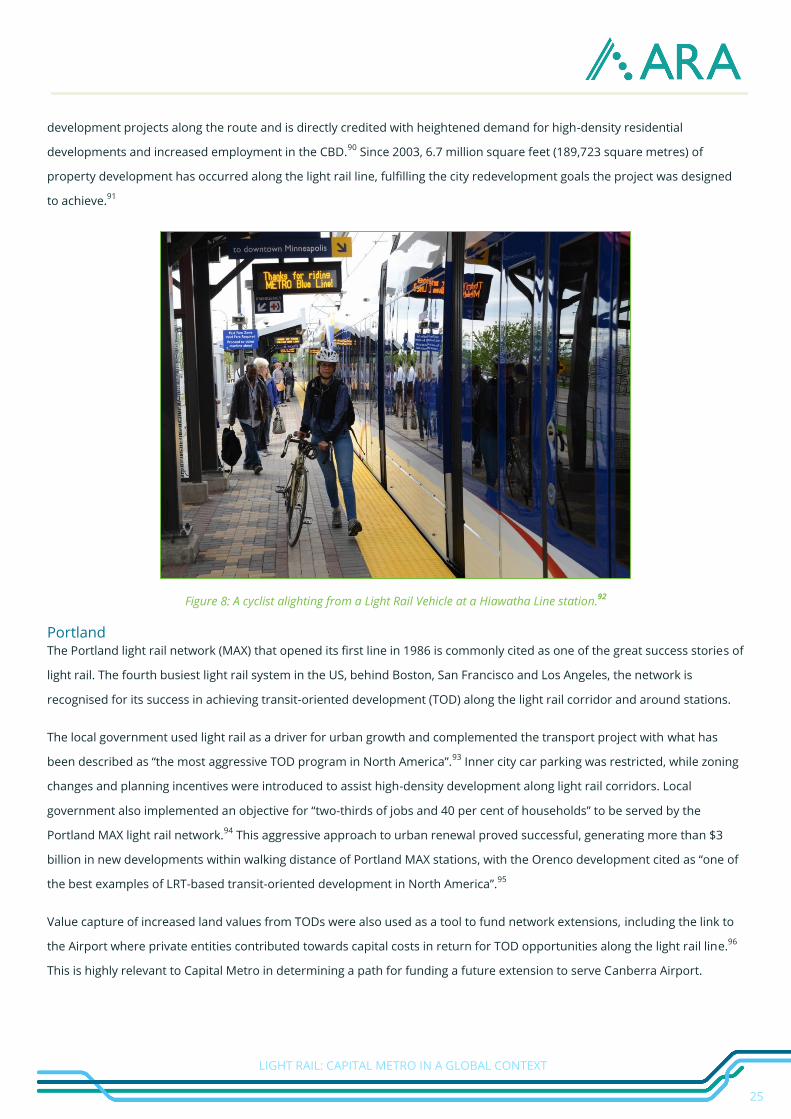
Minneapolis The city of Minneapolis opened its 19.8km Hiawatha Light Rail Transit line in 2004. The line connects key destinations along
the route, including the city’s major shopping mall and the airport. Similar to the Capital Metro project, the project attracted
political opposition due to its projected cost and disbelief that it would entice locals out of their cars.87
However, in its first
twelve months, the service attracted patronage 65 per cent higher than originally predicted, moving 10.9 million customers.88
Today the service provides daily ridership for 26,900 people.
Also similar to the Canberra light rail project, the Hiawatha Light Rail line formed part of the city’s plan to revitalise the
“downtown core by attracting new housing, jobs, and other services”.89
The project has seen multiple transit-oriented
25
LIGHT RAIL: CAPITAL METRO IN A GLOBAL CONTEXT
development projects along the route and is directly credited with heightened demand for high-density residential
developments and increased employment in the CBD.90
Since 2003, 6.7 million square feet (189,723 square metres) of
property development has occurred along the light rail line, fulfilling the city redevelopment goals the project was designed
to achieve.91
Figure 8: A cyclist alighting from a Light Rail Vehicle at a Hiawatha Line station.92
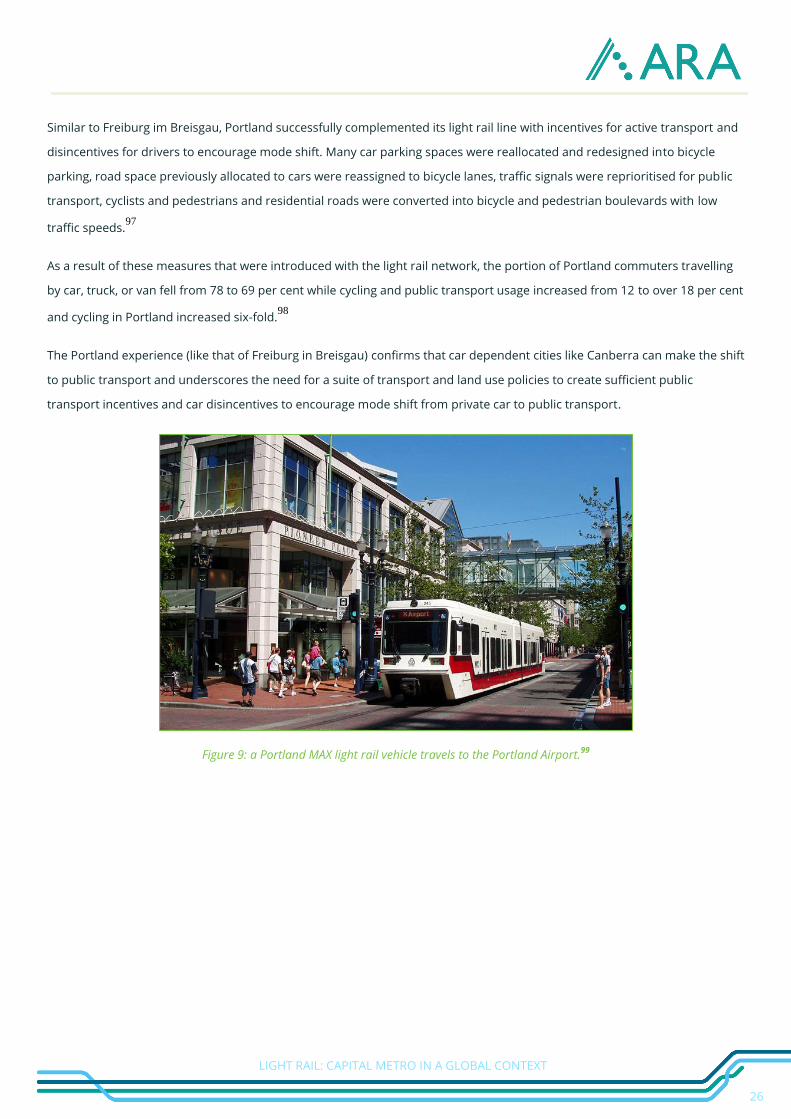
Portland The Portland light rail network (MAX) that opened its first line in 1986 is commonly cited as one of the great success stories of
light rail. The fourth busiest light rail system in the US, behind Boston, San Francisco and Los Angeles, the network is
recognised for its success in achieving transit-oriented development (TOD) along the light rail corridor and around stations.
The local government used light rail as a driver for urban growth and complemented the transport project with what has
been described as “the most aggressive TOD program in North America”.93
Inner city car parking was restricted, while zoning
changes and planning incentives were introduced to assist high-density development along light rail corridors. Local
government also implemented an objective for “two-thirds of jobs and 40 per cent of households” to be served by the
Portland MAX light rail network.94
This aggressive approach to urban renewal proved successful, generating more than $3
billion in new developments within walking distance of Portland MAX stations, with the Orenco development cited as “one of
the best examples of LRT-based transit-oriented development in North America”.95
Value capture of increased land values from TODs were also used as a tool to fund network extensions, including the link to
the Airport where private entities contributed towards capital costs in return for TOD opportunities along the light rail line.96
This is highly relevant to Capital Metro in determining a path for funding a future extension to serve Canberra Airport.
26
LIGHT RAIL: CAPITAL METRO IN A GLOBAL CONTEXT
Similar to Freiburg im Breisgau, Portland successfully complemented its light rail line with incentives for active transport and
disincentives for drivers to encourage mode shift. Many car parking spaces were reallocated and redesigned into bicycle
parking, road space previously allocated to cars were reassigned to bicycle lanes, traffic signals were reprioritised for public
transport, cyclists and pedestrians and residential roads were converted into bicycle and pedestrian boulevards with low
traffic speeds.97
As a result of these measures that were introduced with the light rail network, the portion of Portland commuters travelling
by car, truck, or van fell from 78 to 69 per cent while cycling and public transport usage increased from 12 to over 18 per cent
and cycling in Portland increased six-fold.98
The Portland experience (like that of Freiburg in Breisgau) confirms that car dependent cities like Canberra can make the shift
to public transport and underscores the need for a suite of transport and land use policies to create sufficient public
transport incentives and car disincentives to encourage mode shift from private car to public transport.
Figure 9: a Portland MAX light rail vehicle travels to the Portland Airport.99
27
LIGHT RAIL: CAPITAL METRO IN A GLOBAL CONTEXT
INNOVATIVE FUNDING AND FINANCING Continued investment and expansion of all modes of public transport is crucial to the success and productivity of the nation.
Whether Australians travel by public transport or not, they still benefit from its existence and its use by others. However, long
term investment into public transport by governments at all levels is limited by demands for spending on competing
priorities such as health, education and roads. Investment in and use of public transport ensures less vehicles and therefore
congestion on roads, decreased transport-related emissions and fewer road accident costs.
The ARA is of the view that Australian Governments at all levels must continue to innovate and explore alternate funding
mechanisms and introduce reforms that improve the market for private financing and encourage investment in public
transport projects and infrastructure. This would help provide the necessary funding and entice private investment to help
fund projects.
The ARA’s 2014 paper Innovative Funding and Financing for Public Transport explores various mechanisms currently
implemented around the world to fund and finance public transport infrastructure. Rather than recommend one revenue
raising tool over another, its intention is to inform debate and highlight innovative funding options that can ensure the long-
term funding of public transport investment in Australia at national and state level. The paper is available from the ARA
website at: www.ara.net.au
These funding tools are many and varied and include:
Value Capture: capitalising on the increased value that public transport provides for nearby commercial and
residential properties, value capture is a mechanism that recoups part or all of the increased value transport
improvements provide to nearby properties.
Transit-Oriented Developments (TODs): as well as acting as a tool to encourage greater patronage, property
developments at and around public transport stations are being increasingly utilised to generate long-term
revenue to support public transport operations.
Congestion Charging: a user-pays demand-management approach where road users pay to access roads or
areas, generating funds for reinvestment in public transport and providing incentives for drivers to switch to public
transport.
Payroll Tax: employees or employers are levied a small percentage of their taxable income that is then
hypothecated to fund public transport investments.
Sales Tax: a percentage of the purchase price is added to the purchase price of goods and services and then
drawn upon for public transport investment.
Fuel Tax: a specific amount is added to the fuel price and hypothecated for transport investments.
The paper highlights that success of these (and other) tools in generating reliable, sustainable long-term funding streams for
public transport investment relies on common criteria that must:
28
LIGHT RAIL: CAPITAL METRO IN A GLOBAL CONTEXT
Keep pace with inflation: it is vital that any revenue raising mechanism rises with CPI to continue generating
sufficient funds as the economy grows. Failure to do so (as outlined in the examples of Australian and United
States Federal fuel excises) stalls the revenue generating capabilities of the mechanism, effectively decreasing the
revenue raising abilities over time.
Be hypothecated for transport uses only: the benefit to providing a reliable and dedicated source of revenue is
that long term planning can then occur. Hypothecating, or dedicating the revenue from a specific revenue-raising
tool provides certainty and allows long-term planning and commitments to be made.
KEY LESSONS A “well-functioning city” is one that is sustainable and capable of meeting the needs of the population into the future.
Globally, all modes of public transport are being recognised for the vital role they play in moving and connecting the
population for work and leisure and the influence it has on economic and social activity levels.
As detailed in this paper, light rail provides a broad range of benefits for the community or city it is introduced into. However,
like any transport project, it is not a matter of ‘build it and they will come’. Incentives to encourage public transport use and
disincentives to entice drivers out of cars will contribute to a modal shift. “While incentives for public transport, walking, and
cycling can work alone to some extent, combining them with policy sticks for car use has the potential to amplify the
beneficial impacts of policy carrots”.100
Service success relies on a number of factors, including but not limited to:
Integrated land use and transport planning: A combined approach to transport and land use planning will
maximise the benefits of planning and investment in both areas. Linking access to residential and commercial
destinations with integrated transport options will create a sustainable and liveable city that meets the needs of a
growing population.
Transit-oriented development policies: Light rail is proven to generate property development around light rail
lines and stations but development opportunities should be maximised through supportive policies that provide
enhanced zoning for developers or initiatives to encourage in-fill property development and encourage
developments that lead to increased density. TOD development can also be used to fund further investment in
light rail networks.
Integration with existing transport modes: At no point should one transport mode be viewed as the solution to
a city’s challenges. Instead focus should be maintained on a truly multi-modal integrated public transport system
that links key destinations and provides travellers with a seamless travel experience that provides a viable and
credible alternative to the car.
Car disincentive policies: Restrictions on car use in the city centre through parking space initiatives such as
reduced parking or increased parking charges, decreased road speeds and reallocation of road space to give
priority to public transport, cyclists and pedestrians will contribute to a modal shift. However, these initiatives
29
LIGHT RAIL: CAPITAL METRO IN A GLOBAL CONTEXT
should only be introduced when viable alternative transport options are provided, such as an integrated light rail
and bus network.
Encourage walking and cycling access: Leveraging off existing pedestrian and cycling routes to access light rail
stations and feeder bus stops will help capture a broader patronage catchment as a critical segment of public
transport’s mobility package that offers a ‘low car/no car’ lifestyle. In outer suburban areas, inclusion of park-and-
ride facilities can add to the mix to further broaden the catchment area.
Continued investment: Like any project, continued investment to meet the changing needs of customers is vital
for light rail, whether this be through the introduction of improved ticketing, customer amenities or line
expansions out to other locations.
Government support: the French expansion of modern light rail networks is attributed to government policies
that supported funding for light rail projects in the mid-1970s as a solution to the problem of car-based congestion
in cities. Equally, the lack of support by Australian state governments for their urban tram systems (with the
exception of Melbourne) in the 1950s and 1960s were an important contributor to their demise. Government
support and commitment for light rail is vital to meet the increasing social, economic and environmental
challenges faced by cities.
30
LIGHT RAIL: CAPITAL METRO IN A GLOBAL CONTEXT
REFERENCES
1 Vuchic, V (2007), Urban Transit: Systems and Technology, Wiley.
2 ACT Government (2014), Capital Metro Business Case. 3 McIlroy, T ‘Light rail extension to Russell under consideration’, Canberra Times, 6 February 2015:
http://www.canberratimes.com.au/act-news/light-rail-extension-to-russell-under-consideration-20150206-
137k43.html
4 The European Rail Research Advisory Council and International Association of Public Transport (UITP). (2009).
Metro, light rail and tram systems in Europe.
5 The European Rail Research Advisory Council and International Association of Public Transport (UITP). (2009).
Metro, light rail and tram systems in Europe.
6 Higgins, C. and Ferguson, M. The North American Light Rail Experience: Insights for Hamilton (2012). McMaster
Institute for Transportation & Logistics.
7 The European Rail Research Advisory Council and International Association of Public Transport (UITP). (2009).
Metro, light rail and tram systems in Europe. 8 Vuchic, V (2007), Urban Transit: Systems and Technology, Wiley.
9 SGS Economics and Planning (2015), www.sgsep.com.au/insights/insights-bulletin/canberra-insights-
bulletin/light-rail-understaning-the-urban-impacts/ 10
Kim, K & M L Lahr (2013) The impact of Hudson-Bergen Light Rail on residential property appreciation, Papers in
Regional Science.
11 Weinstein, B. et al. “The Initial Economic Impacts of the DART LRT System,” Center for Economic Development
and Research, University of North Texas, 1999
12 Garrett, T. “Light Rail Transit in America”: Policy Issues and Prospected for Economic Development,” Federal
Reserve Bank of St. Louis, 2004
13 Cervero, R. et al. “Transit’s Value Added: Effects of Light Commercial Rail Services on Commercial Land
Values,” Presented at TRB Annual Meeting, 2002.
14 SGS Economics and Planning (2015), www.sgsep.com.au/insights/insights-bulletin/canberra-insights-
bulletin/light-rail-understaning-the-urban-impacts/
15 Currie, G, Research perspectives on the merits of Light Rail vs Bus, Monash University:
www.infrastructureaustralia.gov.au/publications/files/lightrailvsbus.pdf
16 BusVic Briefing Paper (2010). Public Transport Use a Ticket to Health
17 BusVic Briefing Paper (2010). Public Transport Use a Ticket to Health
18 Buehler, R., and Pucher, J. (2011). Sustainable Transport in Freiburg: Lessons from Germany’s Environmental
Capital. International Journal of Sustainable Transportation
19 Parliamentary Agreement for the 8th Legislative Assembly for the Australian Capital Territory
20 www.capitalmetro.act.gov.au/about-us/project-objectives
21 Capital Metro Business Case (2014)
22 Capital Metro Business Case (2014) 23
McIlroy, T ‘Light rail extension to Russell under consideration’, Canberra Times, 6 February 2015:
http://www.canberratimes.com.au/act-news/light-rail-extension-to-russell-under-consideration-20150206-
137k43.html
24 www.nationalcapital.gov.au/downloads/publications/griffin_legacy%20snapshot.pdf
25 www.nationalcapital.gov.au/downloads/publications/griffin_legacy%20snapshot.pdf 26
http://www.cmd.act.gov.au/open_government/inform/act_government_media_releases/corbell/2015/city-to-
russell-extension-option-for-stage-one-of-canberraas-light-rail-network
31
LIGHT RAIL: CAPITAL METRO IN A GLOBAL CONTEXT
27
www.abs.gov.au/ausstats/[email protected]/Products/3235.0~2011~Main+Features~Australian+Capital+Territory?OpenD
ocument
28 www.cmd.act.gov.au/__data/assets/pdf_file/0007/119734/suburb-population-projection.pdf 29
http://www.abs.gov.au/ausstats/[email protected]/Lookup/3222.0main+features142012%20%28base%29%20to%202101
30 www.cmd.act.gov.au/__data/assets/pdf_file/0007/119734/suburb-population-projection.pdf 31
www.actpla.act.gov.au/__data/assets/rtf.../Population_Density_20114.rtf 32
www.actpla.act.gov.au/__data/assets/rtf.../Population_Density_20114.rtf 33
Martin, S (2014), Moving Beyond Cost: Evaluating LRT & BRT Options in Australasian Cities
34 ACT Government (2014), Capital Metro Business Case.
35 ACT Government (2014), Capital Metro Business Case.
36 ACT Government (2014), Capital Metro Business Case. 37
http://www.wired.com/2014/06/wuwt-traffic-induced-demand/
38 PwC for Tourism and Transport Forum (2014). Better Public Transport. Better Productivity.
39 www.wccc.com.au/documents/2014/20140523%20CMA%20Weston%20Creek%20CC%20May%202014.pdf
40 SRF Consulting Group (2010). Before & After Study: Hiawatha Light Rail Transit Line. Metro Transit.
41 www.bitre.gov.au/publications/2007/files/wp_071.pdf sourced 14.01.13
42 www.bitre.gov.au/publications/2007/files/wp_071.pdf sourced 14.01.13
43 http://mams.rmit.edu.au/ov14prh13lps1.pdf
44 http://www.abs.gov.au/ausstats/[email protected]/Lookup/4602.0.55.002Main+Features40Mar+2012
45 www.wccc.com.au/documents/2014/20140523%20CMA%20Weston%20Creek%20CC%20May%202014.pdf
46 South Australian Government (2013). The Integrated Transport and Land Use Plan 47
http://www.goldcoastbulletin.com.au/news/public-transport-usage-spikes-on-gold-coast-after-introduction-of-
light-rail-network/story-fnj94j0t-1227112313640
48 City of Gold Coast. (2013). Gold Coast Transport Strategy 2031. 49
http://www.goldcoastbulletin.com.au/news/public-transport-usage-spikes-on-gold-coast-after-introduction-of-
light-rail-network/story-fnj94j0t-1227112313640 50
http://www.afr.com/p/national/quiet_achiever_keeps_city_ticking_yMTAkuRtI8VZw5hvniwPaL 51
http://www.afr.com/p/national/quiet_achiever_keeps_city_ticking_yMTAkuRtI8VZw5hvniwPaL
52 http://yarratrams.com.au/about-us/who-we-are/facts-figures/
53 http://yarratrams.com.au/about-us/who-we-are/facts-figures/
54 Light Rail in Australia – Performance and Prospects Prof Graham Currie & Dr Matthew Burke ATRF 2013.
55 Diaz, D. (2012). Perspectives on French Light Rail Success. SYSTRA USA.
56 Bottoms, G. (2013). Continuing Developments in Light Rail Transit in Western Europe United Kingdom, France,
Spain, Portugal, and Italy. Federal Transport Administration
57 Jellett, G. (2013) Light Rail in France – The Current Scene, Light Rail Transit Association.
58 Bottoms, G. (2013). Continuing Developments in Light Rail Transit in Western Europe United Kingdom, France,
Spain, Portugal, and Italy. Federal Transport Administration
59 Jellett, G. (2013) Light Rail in France – The Current Scene, Light Rail Transit Association.
Bottoms, G. (2013). Continuing Developments in Light Rail Transit in Western Europe United Kingdom, France, Spain,
Portugal, and Italy. Federal Transport Administration
60 www.lightrailnow.org/news/n_lrt_2008-01a.htm
61 www.lightrailnow.org/news/n_lrt_2008-01a.htm
62 www.railway-technology.com/projects/citadis/citadis13.html
63 http://www.railway-technology.com/projects/citadis/
64 http://www.railway-technology.com/projects/citadis/
32
LIGHT RAIL: CAPITAL METRO IN A GLOBAL CONTEXT
65 Bottoms, G. (2013). Continuing Developments in Light Rail Transit in Western Europe United Kingdom, France,
Spain, Portugal, and Italy. Federal Transport Administration
66 Bottoms, G. (2013). Continuing Developments in Light Rail Transit in Western Europe United Kingdom, France,
Spain, Portugal, and Italy. Federal Transport Administration
67 Bottoms, G. (2013). Continuing Developments in Light Rail Transit in Western Europe United Kingdom, France,
Spain, Portugal, and Italy. Federal Transport Administration
68 www.guardian.co.uk/environment/2008/mar/23/freiburg.germany.greenest.city
69 www.railway-technology.com/projects/citadis/citadis13.html
70 The European Rail Research Advisory Council and International Association of Public Transport (UITP). (2009).
Metro, light rail and tram systems in Europe.
71 Bottoms, G. (2013). Continuing Developments in Light Rail Transit in Western Europe United Kingdom, France,
Spain, Portugal, and Italy. Federal Transport Administration
72 www.livablecities.org/articles/freiburg-city-vision
73 www.gluas.ie/case-studies/
74 Buehler, R., and Pucher, J. (2011). Sustainable Transport in Freiburg: Lessons from Germany’s Environmental
Capital. International Journal of Sustainable Transportation
75 Buehler, R., and Pucher, J. (2011). Sustainable Transport in Freiburg: Lessons from Germany’s Environmental
Capital. International Journal of Sustainable Transportation
76
www.google.com/url?sa=t&rct=j&q=&esrc=s&source=web&cd=14&ved=0CC4QFjADOAo&url=http%3A%2F%2Fw
ww.bendigo.vic.gov.au%2Ffiles%2F2a714b2d-4551-441a-a1a5-
a0d1010fe7c8%2FTrevor_Budge_Presentation.pdf&ei=YnCWVOnLHJDU8gWOrYC4Bg&usg=AFQjCNFGBPYqr7W5K
uYPZz4LJ5XZdnDzEw&sig2=oBmVvJT4Q7tMe7ttW9E39Q&bvm=bv.82001339,d.dGc
77
www.google.com/url?sa=t&rct=j&q=&esrc=s&source=web&cd=14&ved=0CC4QFjADOAo&url=http%3A%2F%2Fw
ww.bendigo.vic.gov.au%2Ffiles%2F2a714b2d-4551-441a-a1a5-
a0d1010fe7c8%2FTrevor_Budge_Presentation.pdf&ei=YnCWVOnLHJDU8gWOrYC4Bg&usg=AFQjCNFGBPYqr7W5K
uYPZz4LJ5XZdnDzEw&sig2=oBmVvJT4Q7tMe7ttW9E39Q&bvm=bv.82001339,d.dGc
78 Buehler, R., and Pucher, J. (2011). Sustainable Transport in Freiburg: Lessons from Germany’s Environmental
Capital. International Journal of Sustainable Transportation
79 http://news.nationalgeographic.com/news/energy/2011/11/pictures/111115-car-free-city-zones/
80 Higgins, C. and Ferguson, M. The North American Light Rail Experience: Insights for Hamilton (2012). McMaster
Institute for Transportation & Logistics.
81 Higgins, C. and Ferguson, M. The North American Light Rail Experience: Insights for Hamilton (2012). McMaster
Institute for Transportation & Logistics.
82 http://quickfacts.census.gov/qfd/states/37/3712000.html
83 www.city-data.com/city/Pineville-North-Carolina.html
84 Higgins, C. and Ferguson, M. The North American Light Rail Experience: Insights for Hamilton (2012). McMaster
Institute for Transportation & Logistics.
85 Higgins, C. and Ferguson, M. The North American Light Rail Experience: Insights for Hamilton (2012). McMaster
Institute for Transportation & Logistics.
86 www.dot.gov/fastlane/lynx-blue-line-extension-breaks-ground-charlotte
87 SRF Consulting Group (2010). Before & After Study: Hiawatha Light Rail Transit Line. Metro Transit.
88 SRF Consulting Group (2010). Before & After Study: Hiawatha Light Rail Transit Line. Metro Transit.
89 SRF Consulting Group (2010). Before & After Study: Hiawatha Light Rail Transit Line. Metro Transit.
90 SRF Consulting Group (2010). Before & After Study: Hiawatha Light Rail Transit Line. Metro Transit.
33
LIGHT RAIL: CAPITAL METRO IN A GLOBAL CONTEXT
91 Higgins, C. and Ferguson, M. The North American Light Rail Experience: Insights for Hamilton (2012). McMaster
Institute for Transportation & Logistics.
92 www.hapihour.org/decorative-and-hiawatha-light-rail-tasty-light-rail-minneapolis-expansion/
93 Higgins, C. and Ferguson, M. The North American Light Rail Experience: Insights for Hamilton (2012). McMaster
Institute for Transportation & Logistics.
94 Higgins, C. and Ferguson, M. The North American Light Rail Experience: Insights for Hamilton (2012). McMaster
Institute for Transportation & Logistics.
95 Higgins, C. and Ferguson, M. The North American Light Rail Experience: Insights for Hamilton (2012). McMaster
Institute for Transportation & Logistics.
96 Higgins, C. and Ferguson, M. The North American Light Rail Experience: Insights for Hamilton (2012). McMaster
Institute for Transportation & Logistics.
97 Buehler, R., and Pucher, J. (2011). Sustainable Transport in Freiburg: Lessons from Germany’s Environmental
Capital. International Journal of Sustainable Transportation
98 Buehler, R., and Pucher, J. (2011). Sustainable Transport in Freiburg: Lessons from Germany’s Environmental
Capital. International Journal of Sustainable Transportation
99 http://3.bp.blogspot.com/_2v96do7dhfY/SG5O7ra4vkI/AAAAAAAAAhY/Egg6sRMjHz4/s1600-h/ptd-dntn-pp-
0703%23162-800.jpg
100 Buehler, R., Pucher, J (2011). Sustainable Transport in Freiburg: Lessons from Germany’s Environmental Capital