Embed Size (px)
Citation preview

CAPITAL STRUCTURE AND
FINANCING PATTERN

CHAPTER - IV
CAPITAL STRUCTURE AND FINANCING PATTERN •
Finance is the main pre-requisite for every productive
operation. For many of the business problems, solutions are found
on financial strength of the unit. The functions of raising funds,
investing them in assets and distributing returns earned from
assets to shareholders are known as Financial Management. While
performing these functions, a firm attempts to balance cash inflow's
and out flows. Finance requires skillful planning, control and
execution of a firm's activities.
Finance is one of the constant problem, and if Small Scale
Industries require finance then they must have adequate credit.
Credit is available on the basis of the credit worthiness of the
entrepreneur. Finance is called the science of money. It is the
basic requirement for starting and running every human activity in
a purposeful manner for expansion, diversification and development
of business activities finance is a must. The importance of finance
function in Small Scale Industry have increased considerably
mainly due to the use of capital intensive technology and difficulty
in raising finance from different sources. Finance is needed for a
business for promotional activities, to invest in fixed capital

requirement, working capital requirement and for developmental
purpose.
4.1 CAPITAL PLAN - It is primarily a statement estimating the
amount of capital and determining its composition. Financial plan
requires a great deal of foresight and imagination while preparing it.
It is a plan that gives the blueprint of the financial structure of a
company. It is a statement which tells, how much capital will be
required, how it will be collected and utilised. It tells about the
total capital requirement of a unit and what are the ways and
means of raising it and most productive, rational and scientific way
of using it. It helps in the total capitalisation of the unit. Thus, it
helps to estimate the financial needs of the enterprise and ensure
adequate supply of capital to the units, minimise the cost of raising
funds and provide flexibility to the financial structure of an
enterprise.
Before preparing a capital plan the enterprise should decide
the short term and long term needs and formulate the policies to
raise the required finance. It have to decide the forms of securities
to be issued for capital collection and the proportion of various
kinds of securities to be issued. Administration of financial /
capital plan is very important. It have to see the timely payment of
interest and return of the capital raised and if possible try to renew
the plan if it is not working as per it's requirement. Financial
156
capital plan brings financial discipline and ensures orderly
functioning of an enterprise.
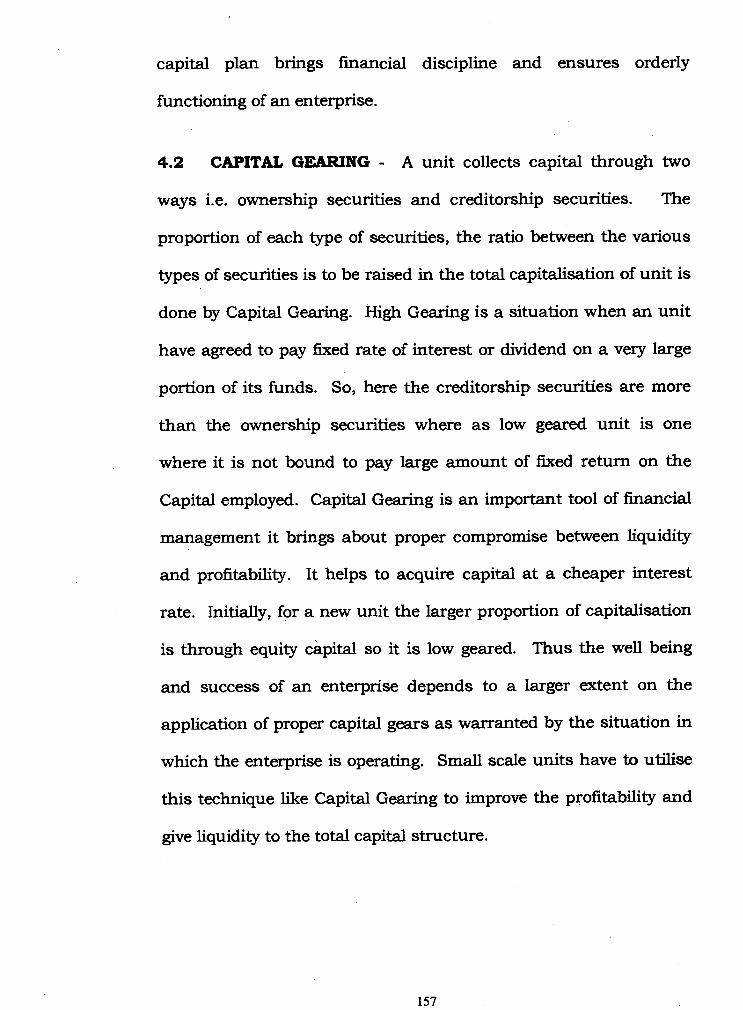
4.2 CAPITAL GEARING - A unit collects capital through two
ways i.e. ownership securities and creditorship securities. The
proportion of each type of securities, the ratio between the various
types of securities is to be raised in the total capitalisation of unit is
done by Capital Gearing. High Gearing is a situation when an unit
have agreed to pay fixed rate of interest or dividend on a very large
portion of its funds. So, here the creditorship securities are more
than the ownership securities where as low geared unit is one
where it is not bound to pay large amount of fixed return on the
Capital employed. Capital Gearing is an important tool of financial
management it brings about proper compromise between liquidity
and profitability. It helps to acquire capital at a cheaper interest
rate. Initially, for a new unit the larger proportion of capitalisation
is through equity capital so it is low geared. Thus the well being
and success of an enterprise depends to a larger extent on the
application of proper capital gears as warranted by the situation in
which the enterprise is operating. Small scale units have to utilise
this technique like Capital Gearing to improve the profitability and
give liquidity to the total capital structure.
157
4.3 TRADING ON EQUITY - When an unit uses borrowed capital
as well as owned capital in a regular conduct of its business it is
said to be trading on equity. It means taking the advantage of
equity share capital over borrowed fund on reasonable basis. It
also suggests additional profits that equity shares earn because of
issuing other forms of securities. It represents the arrangement
under which an enterprise uses borrowed funds carrying a fixed
rate of interest in such a way so as to increase the rate of return on
equity shares. By issuing creditorship securities with fixed return,
the dividend rate can be substantially raised with reference to
equity shareholders. The main objective of trading on equity is to
ensure maximum possible return on investment to the equity
shareholders and also to influence adequate management control.
Trading on equity can be classified into two, Trading on thin
equity and Trading on thick equity. It ultimately helps the equity
shareholders to get attractive return on their investment. It thus
develops their loyalty towards the firm. It helps to the enterprise for
expansion and growth. It helps to develop an optimal capital
structure which involves minimum cost and maximum return and
control to equity shareholders. Such tool is also important when we
decide about capital structure. Satisfying the owners/equity
holders by maximum or decent return on investment is the prime
necessity of any business unit to keep their financial structure
strong and stable.
158

Secured Loans
Ownersh'p Securities
Equity Share
Capital Structure
Creditorship Securities
Preference Shares
Debentures
viv Reserves &
Surplus Unsecured Loans
4.4 CAPITAL STRUCTURE - Capital Structure refers to the mix
of long term sources of funds such as debentures, long term debt,
preference shares, capital and equity share capital including
reserves and surpluses. Firms with unplanned Capital Structure
can prosper in short run but face difficulties in raising funds and
economising the use of their funds in the long run.
A small scale units capital structure can be planned with an
objective of maximising shareholders wealth. It suggests the ratio
between owned capital and borrowed capital. Capital structure of a
company involves a decision regarding the ratio of ownership
capital to borrowed capital, between short term and long term
capital and the ratio among different sources of finance for capital
which includes loans, bonds, share issues and reserves.
Determination of an optimum capital structure is a
formidable task. There are significant variations among industries
and among individual companies within an industry in terms of
159

capital structure. The chief financial officer of a company should
develop an appropriate capital structure which is most
advantageous to the company. This can be done only when all
these factors which are relevant to the company's capital structure
decision are properly analysed and balanced. The Capital Structure
should be planned generally keeping in view the interest of the
equity shareholders and the financial requirements of the company
in order to know what would be the proposition of equity and debt
in a capital structure of a unit, There is a need to understand the
relationship between financial leverage and cost of capital. The
Capital structure decision is a continuous one and have to be taken
whenever a firm needs additional finances while planning for capital
structure every company should develop an appropriate capital
structure which is most advantageous to the company and the
owners. Obviously, there cannot be a uniform capital structure
which suits the requirement of all companies. In other words the
Capital structure have to be tailored in such a way so as to suit the
needs of a particular company.
This proper mix of debt and equity minimises overall cost of
capital and maximises the market value of the firm. Incursion of
debt into the total capital have an effect of pulling down the firms
cost of capital. The cost of capital tends to reach its lowest point at
a certain stage with continuous increase in debt equity ratio and it
takes sometimes for the investors to realise the increasing financial
risk of the firm that is inherent in a continuous increase in the Debt
160
equity ratio. In Small Scale Industry, capital structure is quite
simple. A large number of units starts production with the capital
contributed by the entrepreneurs or by money borrowed from
relatives, friends and shown as capital while only among the bigger
small scale units capital is raised from the public.
4.5 FINANCIAL LEVERAGE - To understand the capital
structure it is very important to know the financial leverage.
Leverage is the employment of fixed assets or funds for which a firm
have to meet fixed costs/fixed rate of interest obligation irrespective
of the level of activities attained/ level of operating profit earned.
The higher the leverage, higher the profit and vice versa. But a
higher leverage obviously implies higher outside borrowing and
hence riskier. There are two types of leverages operating and
financial. The leverage associated with Investment activities is
called as operating leverage. We are more concerned about
financial leverage for the purpose of fmancing decision of the firm.
Leverage associated with financing activities is called Financial
Leverage.
Financial leverage represents the relationship between the
firms earnings before interest and taxed and the earnings available
for ordinary shareholders. It is concerned with the effect of changes
in EBIT on the earnings available to equity holders. It is the ability
of a firm to use fixed financial changes to magnify the effects of
changes in EBIT on the firms earning per share. It involve the use
161
of funds obtained at a fixed costs in the hope of increasing the
return to the shareholders. Favourable or positive leverage occurs
when the firm earns more on the assets purchased with the funds,
then the fixed cost of their use. Unfavourable leverage occurs when
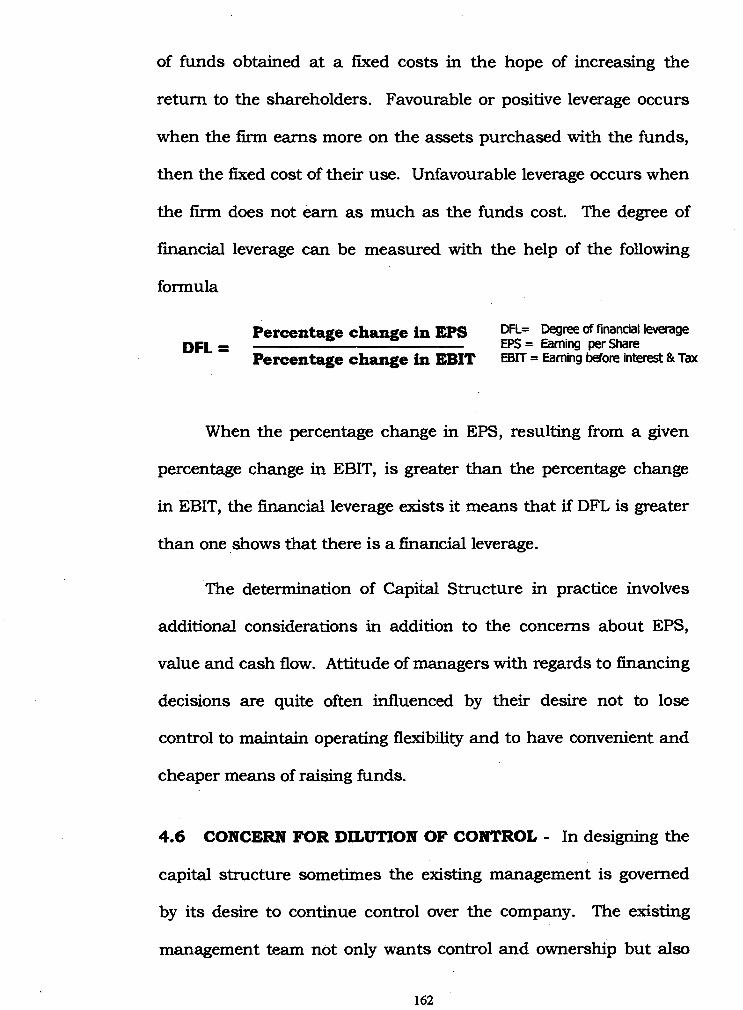
the firm does not earn as much as the funds cost. The degree of
financial leverage can be measured with the help of the following
formula
Percentage change in EPS DFL= Degree of financial leverage DFL = EPS = Earning per Share
Percentage change in EBIT EBIT = Earning before interest & Tax
When the percentage change in EPS, resulting from a given
percentage change in EBIT, is greater than the percentage change
in EBIT, the financial leverage exists it means that if DFL is greater
than one shows that there is a financial leverage.
The determination of Capital Structure in practice involves
additional considerations in addition to the concerns about EPS,
value and cash flow. Attitude of managers with regards to financing
decisions are quite often influenced by their desire not to lose
control to maintain operating flexibility and to have convenient and
cheaper means of raising funds.
4.6 CONCERN FOR DILUTION OF CONTROL - In designing the
capital structure sometimes the existing management is governed
by its desire to continue control over the company. The existing
management team not only wants control and ownership but also
162

to manage the company without any outside interference. This is
needed in case of widely held company and closely held company.
Desire to maintain operating flexibility is one of the most
serious considerations in setting up the capital structure.
Flexibility means the firm's ability to adapt its capital structure to
the needs of the changing conditions. The company should be able
to raise funds without undue delay and cost, whenever needed to
fmance the profitable investments. It should also be in a position to
redeem its preference capital or debt whenever warranted by the
future conditions. The financial plan should be flexible enough to
change the composition of the capital structure as warranted by the
company's operating strategy and needs.
4.7 EASE OF RAISING CAPITAL INEXPENSIVELY - There should
be investors to purchased a security in a given period of time and to
demand reasonable return. Marketability does not influence the
initial capital structure, but is an important consideration to decide
about the appropriate timing of security issues. The Company have
to see the market condition whether it is a boom period or
depression and floating costs also.
4.8 CAPACITY FOR ECONOMIES OF SCALE - The size of a
company may influence the availability of funds from different
sources. A small firm fmds great difficulties in raising long-term
loans. To obtain long term loan it will be available at higher rate of
163
interest and in convenient terms. In case of small firms to make
their financial structures very flexible management finds it very
difficult. Small firms depend on share capital and retained
earnings for their long term funds. It is quite difficult for them to
raise share capital in the capital markets. Also, the capital base of
small firm is so small that they are not allowed to be registered in
the stock exchanges.
4.9 EBIT - EPS ANALYSIS - It is one of the basic objectives of
financial management to design an appropriate capital structure
which can provide the highest Earning Per Share (EPS) over the
firm's expected range of Earning Before Interest & Tax (EBIT). EPS
is a yard stick to evaluate the firms performance for the investors.
The level of EBIT varies from year to year shows how successful the
firms operation are. EBIT. - EPS approach is an important tool for
designing the optimal capital structure framework of the firms.
Keeping in view all the above aspects of finance, an attempt
was made in this study to know the financial structure, its ratio's
and measure the degree of financial leverage in the selected small
scale units.
4.10 DEBT-EQUITY - The debt-equity Ratio determined to
ascertain the soundness of the long term financial policies of the
company. It shows the relationship between borrowed funds and
owner's capital is a popular measure of the long term financial
164

solvency of the firm. This ratio indicates the relative proportions of
debts and equity in financing the assets of a firm. It is computed by
using the following formula
Total Debt Debt-Equity Ratio =
Total Debt + Net Worth
In the Table 4.1 shows the total debt equity analysis. It is
clear from the Table that debt capital is more than the equity
capital in all the cases. The overall figure showed 62.05 percent
was the debt capital in the total capitalisation of the units and
37.95 percent is equity capital. This indicated that the firms have
lots of chance to go for trading on equity but as far as external
parties are concerned they visualise that there is more risk involved
in it. But it all depends upon firm to firm, unit to unit and person
to person. The overall ratio showed 1.64 and food & beverage
showed 2.10 higher than the overall average, it means in food &
beverage debts are more than the equity which is also very clear
from the above Table. Where as in case of chemicals the debts are
the lowest among all it is 58.58 percent which showed a debt equity
ratio of 1.41. Small scale units are more depended on external
debts and assistance given by the outsiders. It is costly but they
don't mind it.
Again in the Table 4.2 shows the number of units under total
debt-equity ratio in the various categories . Here the debt equity
ratio is divided into three category: Below one, one and upto two
165

TABLE 4.1 Total Debt - Equity Ratio followed b the Sample SSI Units
Capital Structure
■
Pharmaceutical Electricals Electronics Chemical Plastic Engineenns _ F & B Total'
Average
Equity Capital 39.15 40.06 55.58 41.42 38.10 39.41 , 32.20 37.95
Debt Capital 60.85 60.00 64.42 58.58 61.90 60.59 67.80 62 05
Total 100.00 100.00 100.00 100.00 100.00 100.00 100.00 100.00
Ratio 1.55 1:50 1.82 1.41 1.02 1.54 2.10 1.85
Source : Data collected from Sample Industrial Units and Questionnaire.
TABLE 4.2 Total debt - Equity Ratio (NUmber of Units) -
Debit Equity Ratio Pharmaceutical Electricals Electranics . Chemical Plastic Engineerino F & B Tote Below 1 16
©% 0.00 12.00 16.00 4.00 12.00 0.00 . 4.00 9.14 0% 12.50 14.75 ' 25.00 6.25 18.75 -12.50 6.25 10600
Between 1 & 2 16 18 ' 15 21 17 . 1 9 . 22 127 crk 60.00 ' 72.00 ' 50.00 0400 68.00 76.00 . 88.00 72.57 0% 11611i 14.17 11.81 15.54 13.39 14.96 17:32 100.00
Above 2 . 32 ©% ' 32:00 ' 15.00 24.00 12.90 20.00 '10.00 8.00 18.29 gm 25:00 12.50 18.75 9.38 15.63 12.50. 6.25 10000
Total 25 25 25 .25 .25 25 25 175 ook 1 00.00 100.00 1 66. 00 100,06 loam . s 100.00
. 100.00 100.00 100.00 cm 14:29 14.29 14.29 14.29 14.29 14.29, 14.29
ei yo - represents column percentage cargo - represe*row percentage Source : Data collected from Sample Industrial Units and . Questionnaire ,

and above two. It further revealed that 127 units representing
72.57 percent were found to have had one and below two debt
equity while 16 units representing 9.14 percent registered a debt-
equity ratio below one where as 32 units representing 18.29 percent
units recorded debt-equity ratio above two. It also revealed that 16
units whose ratio was below one were very conservative and did not
like to take any risk mainly electronics, electricals and plastics
units. Their capital structure showed very rigid and fixed. It lacks
in the quality of flexibility in the capital structure but they enjoyed
good public confidence. 127 units were found on an average as per
the standard debt equity ratio 2:1. They are not high and not low
also, and they maintained a good balance debts and equity capital
to enjoy the investors support. While in case of 32 units the debt
equity ratio was above 2 which only means they are having a very
aggressive type of capital structure. Their maximum capital in the
capital structure consisted of debt capital. They enjoyed lots of
flexibility and control in the capital structure. Most of the
pharmaceuticals units (8 units), electronics 6 units, plastics 5 units
and engineering and electricals 4 units each are the main units
whose debt-equity ratio was above two i.e. above the standard ratio.
It is a risky structure and needs to be constant appraisal, checks
and control on all the resources from time to time. They enjoyed
lots of flexibility but at the same time it involves risk too. It is good
to see that some of the units are ready to take risk in the business.
167
4.11 LONG TERM DEBT-EQUITY RATIO - can be seen from the
Table 4.3. It indicated that on an average long term debt is 0.96
paise of each rupee of net worth. Equity shareholders are therefore
relatively more than the interest of the creditors. Obviously capital
structure is neither so conservative nor so lenient also, it is on an
average equal. The practice of employing relatively lower proportion
of long term borrowed capital is desirable in case of small scale
units in view of instability and unpredictably of profits. The
fmancial strength of these units is strong and the financial risk is
low.
The highest average ratio of long term debt to shareholders
equity is recorded in engineering (1.23) followed by electricals (1.06)
and chemicals (0.96). The lowest ratio is recorded in
pharmaceuticals (0.82) times followed by plastics 0.85 times. It is
noted that higher debt equity ratio means higher dependence on
debts and lower means lower dependence on debts.
In the Table 4.4 shows long term debt-equity in terms of
number of units. Again here the long term debt-equity ratio is
classified into three categories i.e. below one, one and upto two and
above two. 146 units (83.43 percent) posted a long term debt-
equity ratio below one and in the category of one and below 2, there
are 46 units representing 14.86 percent while above 2 there are just
3 units (1.71 percent). The industry wise, in category of below one
food 86 beverage 25 units (100 percent) have the highest followed by
168

TABLE 4.3 .
Lon . Term debt - E. ui Ratio
Components : of Capital Pharmaceutical Electricals, il Electronics Chemical Plastic , Engineering , F & B Total
Average Equity Capital 45.16 51.42 48.18 49;02 46.62 56-16 4&21 49.00
51.00 Long Tenn debt 54:84 48.58 51.82 50.98 ' 64.18 44.94 61/9
Total 100600 100.00 _ 1 100.00 100.00 , 100.00 100106 100.00 100:00
Ratio 0.82 1.08 0.93 0.96.
1;85 1.23 0.93 0.96
Source : Data collected from Sample Industrial Units , and Questionnaire
TABLE 4.4 Long Term Debt to Equity - Number of Units
Debt Equity Ratio Pharmaceutical EleCtricals Electionics chemical Plastic , . Engineering , F 8, B Total BeloW 1 16 24 20 . 10 20 146
0% 84.00 98.00 80.00 72.00 ' 62.00 80.Q0 100.00 83.43 QVA 10.96 ' 1644" 13.70 ' 12.33 15.75 , 13.70 17:12 100.00
Between 1, & 2, 8. '1 f. 5 6 , '2 . 4 0 28 ©% 32.00 4.00 20.40 . 24.00' . 0,00 '4.40 0.00 14.86 ®04 30.77 . 3.85 19.23 23.08 7.69 . 15.38 .o.oa 100:0o i
Above 0 CD% 4.00 ciao 0.00 4.40 .. 0.00 . 4.00' 000 1.71 0% 33.83 0.00 0.00 33.33' 0.00 • 33.33 0.00 100:00) ..
Total 25 25, 25 25 - 25 ' ' 25 25 175 % 106.,00 100.00 '100.00 100,00 ,100,00 , 10000 100.00' 100.001 -
et*
Vib - represents column percentage Source : Data Collected from
14.29 0%
Semple Industrial Units
14.29 i 14.29 - represents nom; percentage
and Questionnaire
14.29 14.29' ?i 4.29 14.29 100001 •

the electricals 24 units (96 percent), electronics and engineering 20
units each (80 percent). In the category of one and below two the
long term debt equity in terms of units wherein pharmaceuticals 8
units (32 percent), chemicals 6 units (24 percent), electronics 5
units (20 percent) and engineering 4 units (16 percent) were found
in case of above two category. Thus, units consisted of
pharmaceuticals, chemical and engineering, one unit each. Thus, it
showed the extend to which debt financing have been used in the
business. A high ratio shows that the claims of creditors are
greater than those of owners. A very high ratio is unfavourable
from the firms point of view. This introduces inflexibility in the
firms operations due to the increasing interference and pressures
from creditors. A high debt company also known as highly
leveraged or geared is able to borrow funds on very restrictive terms
and conditions. A low debt-equity ratio implies a greater claim of
owners than creditors.
4.12 COVERAGE RATIOS - These ratios are computed from
information available in the Profit and Loss Account. For a normal
firm, in the ordinary course of business, the claims of creditors are
not met out of the sale proceeds of the permanent assets of the
firms. The obligations of a firm are normally met out of the
earnings or operating profit. These claims consists of i) Interest on
loans preference dividend and iii) amortisation of principal or
repayment of the instalment of loans or redemption of preference
170

capital on maturity. The ability of the firm to service its claims is
called coverage ratios. It reassures the relationship between what is
normally available from operations of the firms and the claims of
the outsiders. It also measures the debt servicing capacity of a
firm. The interest coverage ratio or the times-interest earned is one
of the most conventional coverage ratios used to test the firm's debt
servicing capacity. A higher ratio is desirable but too high ratio
indicates that the firm is very conservative in using debt and it is
not using credit to the best advantage of shareholders. A lower
ratio indicates excessive use of debt or inefficient operation. The
firm should make efforts to improve the operating efficiency or to
retire debt to have a comfortable coverage ratio. The three
important factors that determine the value are i) the operating
profit; ii) the total amount borrowed; and the effective rate of
interest. Coverage Ratio can be applied to interest coverage,
dividend coverage and equity shareholders coverage.
4.13 INTEREST COVERAGE RATIO - Interest coverage ratio
determines the debt servicing capacity of a business enterprise
keeping in view fixed interest long-term debt. It shows the
relationship between earnings before interest and tax (EBIT) and
fixed interest charges. It is expressed in percentage or number of
times. The format for computation is
Interest Coverage = Earnings Before Interest. & Taxes(EBIT) Interest
171
This ratio shows how many times the interest charges are covered
by EBIT out of which they will be paid. If the business enterprise is
able to earn a return on the assets higher than the rate of interest
on long-term debt, the enterprise makes an overall profit. However,
if the enterprise runs the risk of not earning a return on asset equal
to the interest cost of the long-term loan, the enterprise makes an
overall loss. The interest coverage ratio measure the degree of
protection to creditors from default on the payment of interest by
the company. Table 4.5 showed the position of the small scale
units with reference to the interest coverage. It is clear that the
overall 39.45 percent of the profit is going for interest payment of
the small scale units and the industry wise, it is electronics which
paid the highest 42.18 percent followed by engineering 41.42
percent and electricals 40.81 percent while the lowest interest is
paid by chemicals 35.71 percent, plastics 38.12 percent and
pharmaceuticals 39.10 percent. The overall interest coverage ratio
interest coverage rate shows 1.53 and industry wise chemicals got
the highest 1.80 followed by plastics 1.62 and pharmaceuticals
1.56. While the lowest ratio is noticed in case of electronics 1.37,
engineering 1.41, electricals 1.45 and food 84 beverage 1.51.
It can be concluded from the above analysis that units like
chemicals, plastics, pharmaceuticals have got a higher debt
servicing capacity compared to the others. They have got the
interest coverage ratio more than the overall ratio of 1.53 where as
rest of the industrial units have got interest coverage ratio below the
172
overall ratio. It reflects also how best the funds specially the debts
are utilised to maintain reasonable interest coverage.
The interest coverage ratio is also studied from the number
of units coming under the different category of interest coverage
ratio can be seen from the Table 4.6. It is clear that 69 units were
found in the category of 2.1 to 3.00 ratio of interest coverage and
the units which had the highest were electronics (15 units), plastics
14 units and pharmaceuticals and chemicals 10 units each. While
67 units were noticed under the category of 1.1 to 2.00 ratio.
Wherein chemical (14 units), electricals (13 units) and food 8s
beverage (12 units) were on the top of the list. In Group 3.1 to 4.00
category, there are 24 units and was dominated by engineering (10
units) followed by pharmaceuticals 6 units. In 4.1 to 5.00 ratio
there are 8 units where in electronics, engineering and food 8s
beverage have got 2 units and plastics one unit. In 6.1 to 7.00 ratio
again there are three units two from food 8s beverage and one from
engineering. While in 7.1 to 8.0 category there is one unit which
from food 136 beverages. There are no units whose interest coverage
ratio is below one and above eight.
4.14 SOURCES OF FINANCE - One of the major characteristic
feature of small scale units is that the personal funds of the
entrepreneur form a substantial proportion of the total assets.
Most of the units are not corporate entities. The owner of small
173
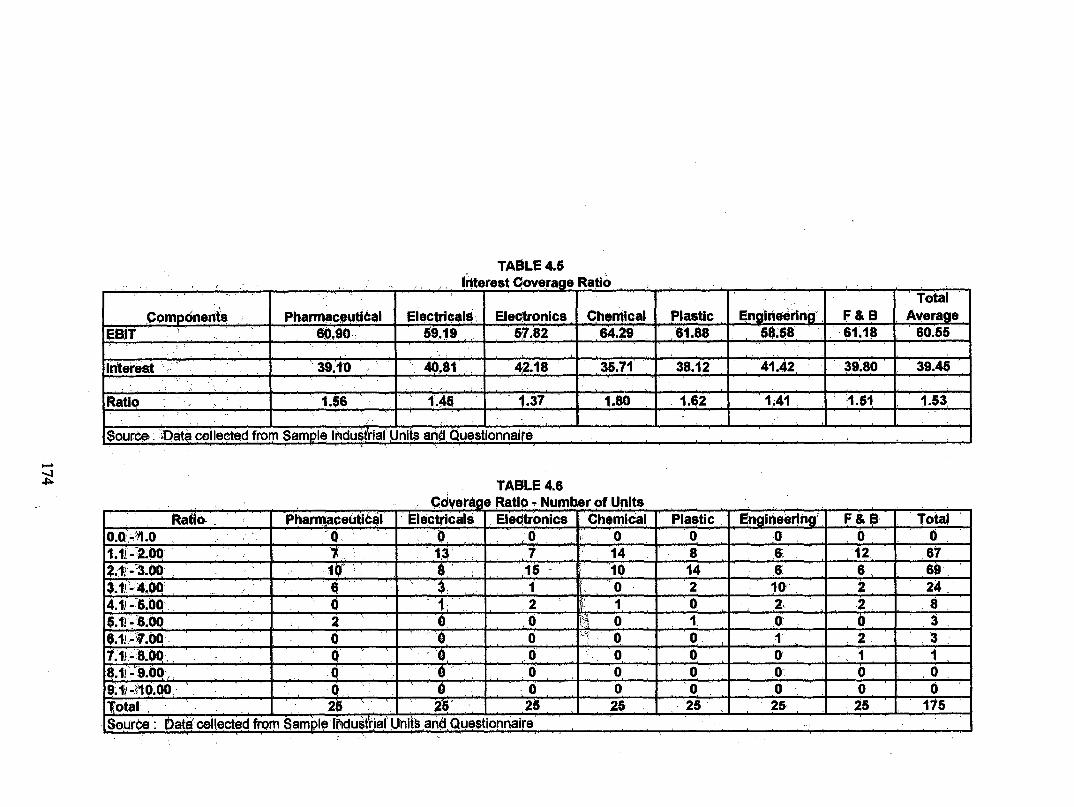
TABLE 4.5 interest Coverage Ratio
Components Pharmaceutital Electricals Electronics Chentical Plastic . Engineerin ' F & B Total
. Average EBIT e0.80 69,19 ' 57:82 . 64.29 , 61.88 58:58 61.18 80.55
Interest ' 39.10 ' 40,81 42.18 35.71 ' 38.12 41.42 39.80 ' 39.45
Ratio 1.58 1.45 1.37 . 1.80 1.62 , 1A1 1.51 1.53
Source : Data collected from Sample lildusfrial units and Questionnaire ,
TABLE 4.6 cdvera e Ratio - Number of Units
Ratio. Pharmaceutic,1 Electricals Eledtronics Chemical Plastic Engineering' F & B Total OA -1.0 Q 0 1.11-10Q 14 12 67 2.111 -1.00, 1
.
15 - 10 14 e9 3.11- 4.00 10 24 4.1) - 5.00 2 5.11;6,00 a 4 . 0 I 6.11-1.00 7.11- 8.00 , 8.11-"9.00 , 9.1,-10.0.0 ' 0 Total 25 25 ' 25 25 25 25 25 1/5 Source : i ate collected from Sample lifidus vial` Units and Questionnaire
scale units have to undertake a considerable amount of higher risk
than those of corporate units.
The sources that provide the working capital requirements
are commercial banks, co-operative banks, money lenders,
Maharashtra State Finance Corporation. Where as fixed capital
needs are usually met by the State Government, State Financial
Corporation, National Small Scale Industries Corporation,
Commercial Banks, State Industrial Development Corporation.
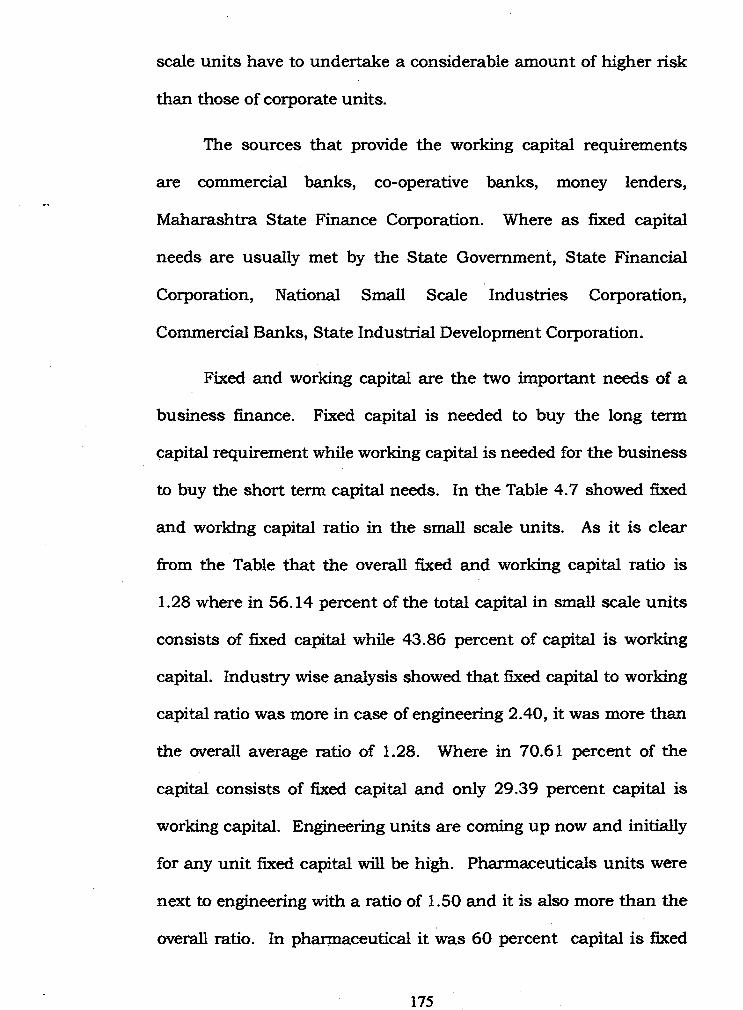
Fixed and working capital are the two important needs of a
business finance. Fixed capital is needed to buy the long term
capital requirement while working capital is needed for the business
to buy the short term capital needs. In the Table 4.7 showed fixed
and working capital ratio in the small scale units. As it is clear
from the Table that the overall fixed and working capital ratio is
1.28 where in 56.14 percent of the total capital in small scale units
consists of fixed capital while 43.86 percent of capital is working
capital. Industry wise analysis showed that fixed capital to working
capital ratio was more in case of engineering 2.40, it was more than
the overall average ratio of 1.28. Where in 70.61 percent of the
capital consists of fixed capital and only 29.39 percent capital is
working capital. Engineering units are coming up now and initially
for any unit fixed capital will be high. Pharmaceuticals units were
next to engineering with a ratio of 1.50 and it is also more than the
overall ratio. In pharmaceutical it was 60 percent capital is fixed
175

and 40 percent working capital. In food and beverage, total fixed
capital needs were 59.47 percent and working capital was 40.53
percent and the overall ratio showed 1.47 times more than the
overall average. Chemicals with 1.46 in the fourth in the above
category of industries, it showed that 59.42 percent capital is fixed
capital and 40.75 percent is working capital. In case plastics units
the ratio was the lowest i.e. 0.71 followed by electricals 1.00 and
electronics 1.08. In the case of plastics the fixed capital
requirement was 41.50 percent and working capital requirement
was 58.50, in electronics it was 50.07 percent in fixed capital and
49.93 working capital. It showed that fixed and working capital
requirement was more or less is same in case of electronics. In
electricals it was 51.81 percent fixed capital and 48.19 percent was
working capital.
Overall it revealed comment that most of the units were at the
initial stages so their fixed capital/long term capital requirement
was more except in case of plastic and rest were found to have had
the higher percentage of fixed capital requirement.
4.15 SOURCES OF FIXED CAPITAL/LONG TERM FUNDS
Fixed capital is required in the business to buy the fixed
assets for the business. It is a capital that is needed to meet the
permanent or long term needs of the business. Fixed capital
determines the smooth and efficient working of the business. This
capital is required most at the time of establishment of a new unit
176

and also for expansion, diversification and maintenance of the
existing enterprise. Fixed capital remains invested in the business
as long as the units or enterprise operates. The amount of fixed
capital required varies from unit to unit but this amount is quite
large as fixed assets are very costly. The fixed capital is collected
as per the estimate made in the capital plan. It provides strength
for the survival and stability to a unit specially manufacturing. The
amount of fixed capital is based upon the nature of business, the
size of the unit and method of manufacturing the product. Fixed
capital is the back bone of the business.
Sources of Fixed Capital Borrowed (External) in case of Small
Scali Units
Banks MSFC Financial Institutions Government Subsidies Other Sources including own source
In this study an attempt is made to know the various long
term sources (external) which financed he small scale units in Goa.
As far as internal are concerned they include paid up capital of
ordinary Equity Shares, Preference Shares, Deferred Shares and
Forfeited Shares. In the Table 4.8 showed the sources of fixed /
long term capital (external) borrowed by the small scale units. It
showed that 45.80 percent of the fixed capital came from the
177

TABLE 4.7
CoMponent & Ratio Pharmaceutical
- ---- - -
Eiectdcals
- - -.- -
Eleatronics CheMical PlaStic Enoineet1ng F & B Total
AVeratie
Fixed Capital 60.00 51.81 50:07 ._...., 59.52 41A0 70.61 . 59A7 5&14
WOrking Capital 40.00 48.19 49:93 40.75 58.80 29.39 40.53 43.90
Ratio ' 1.50 1.08 1.00 , 11.46 0.71 2.40 1 AT 1.28
Source : Data collected from Sample Industrial Units and Questionnaire
TABLE 4.8 ce of Fixed Capital BO dinged
Source of Finance Pharmaceutical ElOctricals Electronics , Chemical Plastic EngineeAng 48.51•
8 F & 60.21
Total Averat
45.8 Banks 30.15 40.32 46.71 4251 52.17
fit'SFC 10.26 12.14 15.10 10.26 1181 15.18 5.15 11.41 '
Financial Institution 18.12 15.91 10.72 35.1 10.11 14.81 10.17 16.44
Govt. Subsidies 24.52 20.10 22.841 6.27 5.18 1. 18.15 10.11 15.31
Other Source 16.95 11.53 4.63 5.75 20.73 135 14.38 11.04
Total 100400 100.00 100.00 100.00 10080 100.00 100.00 100.00
Source : Data collected from Semple Industrial Units and Questionnaire

commercial banks and the highest among them was food 8s
beverages sector which have got 60.21 percent of their total fixed
capital through commercial banks followed by plastics and
engineering 52.17percent and 48.51 percent respectively. The
lowest among them were the pharmaceuticals 30.15 percent and
electricals 40.32 percent. Commercial banks provided a wide
ranging financial assistance to small scale units in the form of
equity support and term loans which can be used for long term
establishment, expansion, modernisation and renovation. Another
important source of fixed capital is the Maharashtra State Financial
corporation which represented 11.41 percent of the overall fixed
capital. It is mainly utilised by engineerings 15.18 percent followed
by electronics 15.10 percent, electricals 12.14 percent and
engineering . 11.81 percent.. Financial institution played a very
important role in the financing of small scale units they proved
16.44 percent of the total fixed capital finance to small scale units.
In chemicals units with 35.21 percent, pharmaceuticals with 18.12
percent, electricals (15.19 percent) and food 86 beverages with
(10.17 percent) of their respective total capitalisation of the units.
In Goa, the major attraction for small scale units is the
government subsidy. The subsidies are many and their rates are
also very high in Goa. It can be seen from the above Table 4.8 that
overall Government subsidies consisted of 15.31 percent of the total
fixed capital borrowed and the industries which are on the top of
the Table are pharmaceuticals (24.52 percent), electronics (22.84
179

percent), electricals (20.10 percent) and engineerings (18.15
percent). Another important source of fixed capital finance is from
other sources i.e. money lenders, friends and relatives. The Table
showed that in case of plastics 20.73 percent came from other
sources followed by pharmaceuticals and electricals (16.95 percent).
It is clear that maximum fixed capital finance was provided
by commercial banks followed by other sources while Maharashtra
State Finance Corporation have relatively reduced its role in case of
financing fixed capital needs.
4.16 SOURCES OF WORKING CAPITAL BORROWED
Working capital requirement is the amount of funds which
the small scale industry must have to finance its day to day
activities. An adequate working capital ensures a regular and
orderly working of a business unit. Working capital is that part of
total capital which is required for purchasing current assets, to
meet regular recurring needs of a business unit. Table 4.9 showed
the sources of working capital borrowed. It showed that 71.91
percent of the total working capital is from commercial Banks. It is
the highest in all the types of Industry but among them engineering
with 80.11 percent was the highest followed by chemicals 76.24
percent, plastics 75.82 percent and pharmaceuticals 72.82 percent.
9.06 percent of the overall working capital was from own source
and among the own source, electronics was with 15.12 percent,
food & beverage with 10.18 percent, electricals 10 percent, were on
180

the top of the list while 19.04 percent of the total working capital
requirement was from other source. Other source included fund
borrowed from money lenders, suppliers credit, friends and relatives
etc. Electricals with 24.76 percent is on the top of the list followed
by electronics 24.07 percent, pharmaceuticals 19.08 percent,
chemicals 18.20 percent.
It can be inferred from the above analysis that Banks played
a crucial role in working capital requirement of a business. The
own source of capital is not yet developed. While other source is
again a crucial source for small scale industry although they have
to pay slightly higher interest rate on some of the funds borrowed
through these source still small scale industrial units prefer that
mainly there are less formalities and procedures involved. For a
small scale unit, working capital management is particularly
important mainly small scale units may decrease its investments in
fixed assets by renting or leasing plant and equipment. However,
there is no way of avoiding an investment in working capital
requirements.
4.17 SOURCES OF OWNED FUND (EQUITY BASE)
Owned source is one where the entrepreneurs did not have
to fall back up on the outside costly source. This is the source
which build up the strength of the enterprise. It included equity
share, retained earning and subsidies received from the
Government. Every business organisation whether partnership,
181

sole trading or joint stock company are allowed to issue equity
shares. But due to their small size of the issue they cannot be
traded in the stock exchange and as a result the moveability of
such shares is very slow. In the Table 4.10 showed the sources of
owned fund and it is clear from the Table that 86.61 percent of the
owned fund was funded by the equity shares and the industry wise,
engineering was with 90 percent of the total equity base followed by
chemicals 89 percent, plastics 88 percent were on the top of the
Table. It is revealed further that 8.86 percent of the total equity
base was funded by retained earning and prominent industries
among them were electronics 12 percent of the total equity base
followed by food & beverage and pharmaceuticals 10 percent each ,
and chemical with 9 percent were on the top of the list. Subsidies
are another source of equity base which consists of 5 percent of the
total equity. Industry wise, it is pharmaceutical with 8 percent,
electricals and food & beverage 6 percent each and plastics with 5
percent were on the top among the industries.
It is clear from the above analysis that maximum portion of
the own fund/equity base was from equity capital which was
financed by the owner himself or by some of the financial
institution. It is very interesting to note that retained earning is
also playing a very important role in funding equity base most of
the units have realised the importance of retained earning in
financing its own business while subsidies are also assisting the
owner to build up the equity base of the unit to some extent.
182
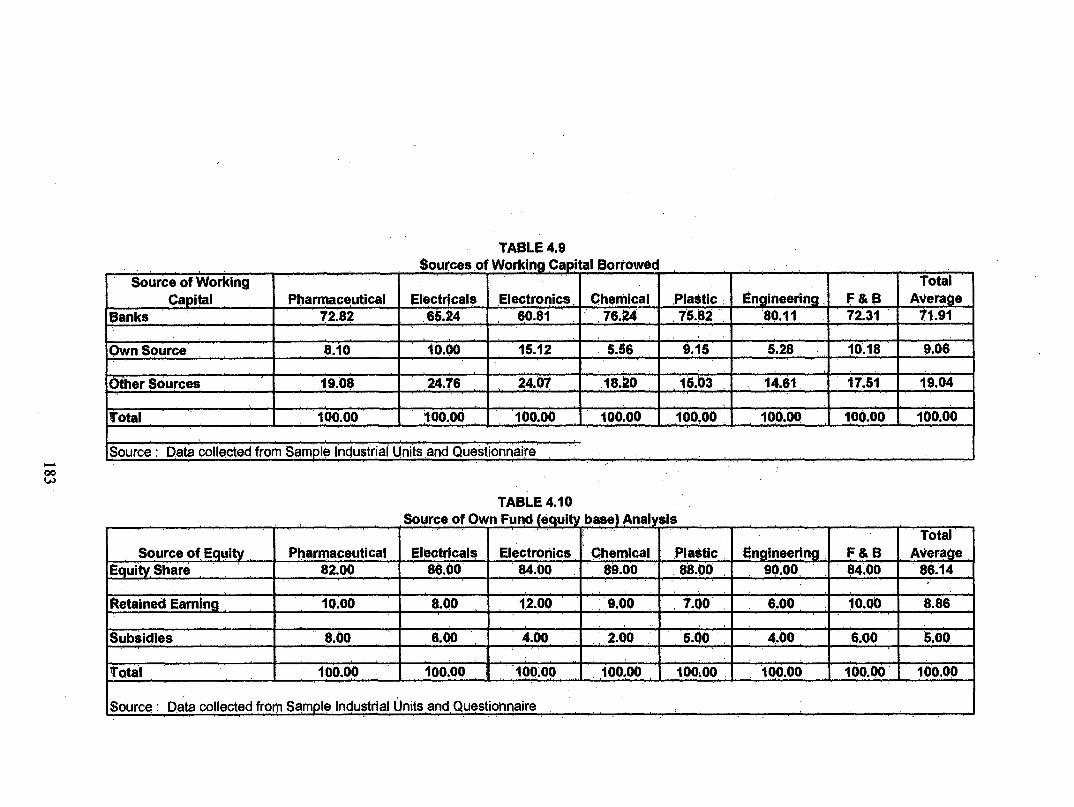
TABLE 4.9 Sources of Working Capital Borrowed
Source of Working Capital Pharmaceutical
. .
Electricals Electronics . Chemical PlaStic . Engineering , 80.11 ,
F & B 72.31 '
Total Average
Banks 72.82 66.24 , 60.81 , 76.24 , 76.82 1'1.91
Own SoUrce 8.10 '10.00 15.12 5.56 545 5.28 10.18 9.06
Other Sources 19:08 24.76 24.07 18.20 ,16.03 14.61, 17.61 19.04
Total 100.00 100.00 100.00 loom 100.00 100.00 100.00 100.00
Source : Data collected from Sample industrial Units and Questionnaire
TABLE 4.10 Source of Own Fund (equity base) Anal si
Source of Equity , Pharmaceutical Electricals Electronics Chemical ,Platitic Engineering F & B . Total AVerage
Equity,Share 82.00 86.00 84.00 89.00 ' 88.00 90.00, 84.00 ' 86:14
Retained Earning , 10.00 8.00 12.00 9.00 , 7.00 ' 6.00 10.00 0.86
Subsidies 8.00 6.00 . 4.00, , 2.00 6.80 4.00 , 6.00 6.00
Total 100.00 100.00 i 100.00 100,00 100.00 100.00 100.00 moo
Source : Data collected from Sample Industrial Units And Questionnaire

4.18 TYPES OF LOAN USED - Table 4.11 showed the type of loan
used by the small scale units. Term loan is a long term type of
loan. Small scale industries find it difficult to secure adequate
finance from institutional sources even for their working capital
requirements because of their own inherent limitations on the one
hand and the generally high standard applied by the lending
institutions to borrowers on the other. Banks and other lending
institutions find it difficult to assess their credit worthiness. Long
term and short term loan is required for the business to finance
their fixed and current assets of the business unit. Long term loans
are given in the form of term loans to small scale units is given
generally for more than one year. The only problem the small scale
industries face, is that they are not regarded as sufficiently credit
worthy because they are not able to satisfy the criteria laid down by
lenders. The Table 4.11 shows that except three units of plastics
rest of all the units used term loan as one of to finance their
business.
4.19 CASH CREDIT AND BILL FINANCING FACILITY - are
considered to be the short term loan facilities. To small scale units,
cash credit limit is sanctioned after completing necessary
formalities by the borrower. The bank opens a cash credit account
in the name of the borrower and the cash credit limit sanctioned is
credited to this cash credit account. Generally cash credit facility is
given a • sin st goods "hypothecated" or pledged with the bank. Cash
184

TA = LE 4.11 Type of Lban used 14 the units ,
TYpee of Loans Pharmaceutical Electricals I Electronics CheMical Plastic, • Engineering F & B Total Units 172 Term Loan 25 25 25 ' 25 22 ' . . 25 25
Cash Credit 25 21 2S 25 . . 25 22 161
Bills Facility 10
Source : Data collected from Sample Industrial Units and. Questionnaire
credit facility is useful for meeting working capital needs of
business. In the above Table shows the cash credit standing of
small scale units out of 175 units 161 units were found to have
utilised this facility. Industry wise, all the units of electricals,
plastics and engineering used cash credit facility while incase of
pharmaceutical 20 units used, electronics 21 units, chemicals 23
units and food & beverage 22 units used cash credit.
Bills facility is another type of loan (short term) used by small
scale units. Commercial banks provide short term finance to
business enterprise by discounting their bills of exchange,
promissory notes. Business enterprises get ready cash against bills
and this provides additional liquidity to them for business purposes
along with discounting of bills bank issue letter of credit in favour of
their customers. Bills facility is not so popular among small scale
units in Goa, as it can be seen from the Table, only 7 units out of
175 used this facility and the units which used this are
pharmaceuticals 2 units, plastics 3 units, food & beverages 3 units
and engineering 2 units only.
The analysis revealed that most of the small scale units
utilised Term Loan and Cash Credit as a means of financing. Bills
facility have not been understood by many of the small scale units,
so it is less popular means of financing.
As it was learnt that most of the small scale units have got
higher creditorship fund in the form of loans credits and borrowing
186

as a result it -makes the units highly geared. The interest burden
on small scale units goes on increasing as some of the funds were
borrowed with a high interest rate, that ultimately reduces the
profitability of the unit. At times they find it so much over
burdening that they stop producing. Manufacturing and this is one
of the reasons the sickness in small scale business units. It can be
evident from the Table 4.12 which showed the rate of interest on
term loan. In 0-10 percent interest rate it was observed only three
units which acquired their finance at that rate of interest. They
included pharmaceuticals two units and electricals one unit. In the
interest range of 11-15 percent, there were 66 units representing
37.71 percent of the total units. The top most units which have
acquired loans at this rate of interest were chemicals and
engineering 12 units each followed by plastics 10 units, electricals 9
units and the lowest in this Group were pharmaceuticals 6 units
followed by electronics 8 units and electricals and food & beverage 9
units each. In the interest range of 16-18 percent there are 70
units representing 40 percent of the total. The top three sectors are
plastics 14 units, pharmaceuticals 12 units and food & beverage 11
units. The lowest in this Group were electricals 6 units followed by
electronics 7 units and chemicals and engineering 10 units each.
In the interest range of 19-21 percent there are total 28 units which
borrowed their funds represented 16 percent of the total units. The
major units which have borrowed at this interest rate is electrical &
electronics 8 units each, food & beverage and pharmaceuticals 4
1R7

TABLE 4.12 Rate of Intetest on Term Loans
Semi Pharrnacoutipai giectrieois kificArdnks . P.fiefriiCal - Plastic, Enginemiiig F & , a ' total 0-10 _ ` 2 1 o Y 0 o ' 3
cok , 5.00 4.00 0.00 , 0,00 , 0,to , •0.00 . .0.00 ;1.71 46% • ,06.07 33,3 , 0.00 0.00' . '0.00 , 0.00 „0.00 160.00
ii .:15 " 12 - 10 12 9, 66 0% 24:00 36.00 32.06 40.06 . 40.60 40.00 6.00 87.71
6%, 0.09 13,64 12.12 15.18 15.15 ' 18:18 ' 13 ..64 ' 100.00 113 - 18 12 10 14 10 , 11 70
Co4 40.00' „ 24.00 20.00 40.00 50.00 , 4006 ' .44.00 40:00 . 0% . 17:14' . 8.57 10.00 14.29' , 20.00 , 14:29 , 15.71 - 100.06
19.:t1 ' , l3,. • Iticgi' 16.99' _3?..00 32.00 6.00" - . 0 :00' 8.00 16.00 .16.06
,(16% • ; 14.29' . i'.3.6/ ' 20.57 7.14 , 000 , 7.14 . 1'4.9 ' 100.00 2; L 24 ',.1 1 8
*4 4.00 - 4.00 8.00 4.00 , 4.00 . , 4.00 4.00 4.57 px:,
1 12.50 12,50 . 25.00 12.50 , 12.50 12.50 1250 100.00 Abirie 24
0 00 9
000 :0
0.00 , : 0 , 6.00'
0 , 6.00 64) 0.00 'o.ckcj ' 0.00
6% 0.60 0.00 • 0.00 25
0.00' 25
. 0,00 , 25
,0.0o . 25
0.00 25
0.00 ' 176 total 25 25
004 100.00 1•00.00. 100.06 100,00, 100,00. 100.0.0 1016,00 , 100.00 6% 1410 14,20 , 14.29 14.29 • 14.29 . 1429 1429 100.00
poys, -: represents column perceotogp , P°4 -.represents row perdentage" Sourde : Data collected frOrn SaMple Ind6itrillOnits and Questibnnaire

units each and chemicals and engineering 2 units each while there
was no unit from plastics which have borrowed from this range. In
interest range of 22-24 percent there were 8 units representing 4.57
percent and the major units are electronics two units and one unit
each from the rest six segments. At above 24 percent interest, there
was no unit noticed.
It is clear from the above analysis that most of the units were
found under the range of 11 to 21 percent range. It was noticed
majority of the units have borrowed funds at high interest rate
mainly because of their low credit worthiness in the market and as
a result they had to find some one who can lend finance to them
and it was fulfilled only at the cost of high interest rate.
Small scale units acquire creditorship securities in the form
of long term and short term financing. In the case of long term
loans, the interest rates are slightly lower as the entrepreneurs have
the option of choosing. They are not in a hurry it gives him
reasonable time to think. In the case of short term loans the time
to think is very short and the needs are very urgent, entrepreneurs
cannot postpone the needs. They have to keep the production
process working smooth, so, they will acquire the loan at higher
interest rate with less formalities and complexities. In the Table
4.13 showed the rate of interest on short term loans. It is clear that
in the interest range of 0-10 percent there were 9 units representing
5.14 percent wherein chemicals 3 units, pharmaceuticals and
189

TABLE 4.13 oan
Interest Rates Pharmaceutical Electricals Electronics dhaMiCal .Plaatic - Engineering F '9,13 • ' ,Total .TOtal , 0-10 1 ' o 9
0% 8.00 4.00 8.00 ' , 12.00 4.00 ' 0.00 0:00 ' J ,.5.14
8% 22.22 11.11 22,2 ' 83.38 11.11 0.09. ,o,O6 loo.Oor 11 - 15 10 lg 7 X 12 11; id /(v. 1
o% 40.00 48.00 28,00 - 48.00 42.00 . .44.00 *40.90' 1 40.00' 6% 14.29 17.14 10,00 . 1'7.14 - . 1t44 , ' 1§11. 1429 ' - , 100.001 I
16 - 18 12 , 10 11, ' . 64 1 0% 48.00 32.00 40: 00 ' 32.00 28.00 , p.00 4400 06.57 0% 18.75 12.50 15.63 ' 12:5p 10.94 : `ip.0, - 1719 :100.0a'
. 16 1 19 - 21 . , 3: , 0% 4.00 4.00 1600 ' 4.00 16.00 , 8.00 ,12.00 9:14 0% 6.25 6.25 25.00 . 6.25 2500 _ ' 12.60 .1$.75 ' ' 160.0
22 - 24 0 1 2 1 2 3 1 , .ioh. ' o% 0.00 4.00 8.00 . 400 9.b0 , , '12:0o - ,. .4',00 ' 1 5:11 ' 0% 0.00 10.00 20.0o ' ,fo.00 *:-.).00 , '(-5,0o ' ,ip.00' 1
13 , '1,00.0o
6. Above 24 0% 0.00 8.00 apo ' 0.00 , 12.00 , ' 4.09 ,0:0O ' 3.4$ e% 0.00 33.33 0.00 0.00 0.00 r' 16.67 .0:00 . ' 1,00.001
Total 25 25 25 25 , . i5:_ . . 175. (3% 100.00 100.00 , 100.00 ' 100.00 100 00 , '101:00'' ,. :00,90` 1 1,00 ' .0o'
e % 14.29 14.29 14.29 ' 14.29 14.29 , : 14R9 ' ) 100.00' 0% - represents column percentage 8% - represents row percentage .
Source : Data collected from Sample Industrial Units and Questionnaire

electronics 3 units each. In 11-15 percent range of interest, there
were 70 units representing 40 percent and the most prominent
among them were electrical and chemicals 12 units each followed
by engineering 11 units and food 86 beverage and pharmaceuticals
10 units each.
In the range of 16-18 percent interest, there were 64 units
representing 36.57 percent and the top most among them were
pharmaceuticals 12 units, food 86 beverage 11 units, electronics 10
units and electricals, chemicals and engineering 8 units each
respectively. In the range of 19-21 percent interest there were 16
units where in 4 units each in case of electronics and plastics, 3
units in the case of food 86 beverage and two units in engineering.
In the range of 22-24 percent there were 10 units where in
engineering with 3 units, electronics and plastics 2 units each while
in the case of above 24 percent interest range there were 6 units
representing 8.43 percent. Industry wise, it was electricals two
units, plastics 3 units and engineering one unit.
It is clear that the short term loans are acquired at much
more costly rate than the long term loan. It is interesting to note
that even in the interest bracket of above 24 percent interest 6
units were found. The number of units in the higher interest rates
were more mainly due to the urgency of the funds and secondly
their poor credit worthiness.
191
4.20 PROBLEM IN OBTAINING FINANCE - Small scale industries
are generally not regarded as sufficiently credit worthy because they
are not able to satisfy the criteria laid down by lenders. While
granting medium and long term loans the lending agency not only
assesses credit worthiness of borrowers and the security offered by
them but also an observance of rules and regulations governing
such advances. The unit should show the prospects of improving
its earning capacity -and profit, if financial assistance is granted to
them and various other expectations are laid down by the lenders.
Strict requirements of security and rigid prescription of acceptable
collateral. Delay involved in the sanction of loans are some of the
problems faced by small scale units in Goa. It can be evident from
the Table 4.14 which showed the problems in obtaining finance.
Out of 175 units 135 units representing 77.14 percent of the total
have expressed their concern in obtaining finance while 40 units
representing 22.86 percent have not found any problem in
obtaining finance. Industry wise 22 units from engineering
expressed their concern while 3 units did not face any problem in
obtaining finance. In electronics it was 21 units which have
problem while 4 units did not have any such problem in obtaining
finance. In electronics 21 units which raised their concern over
obtaining finance.
The maximum number of units in a particular segment
expressed happiness as they did not face any problem in obtaining
finance were plastics 8 units, followed by electricals and food &
192
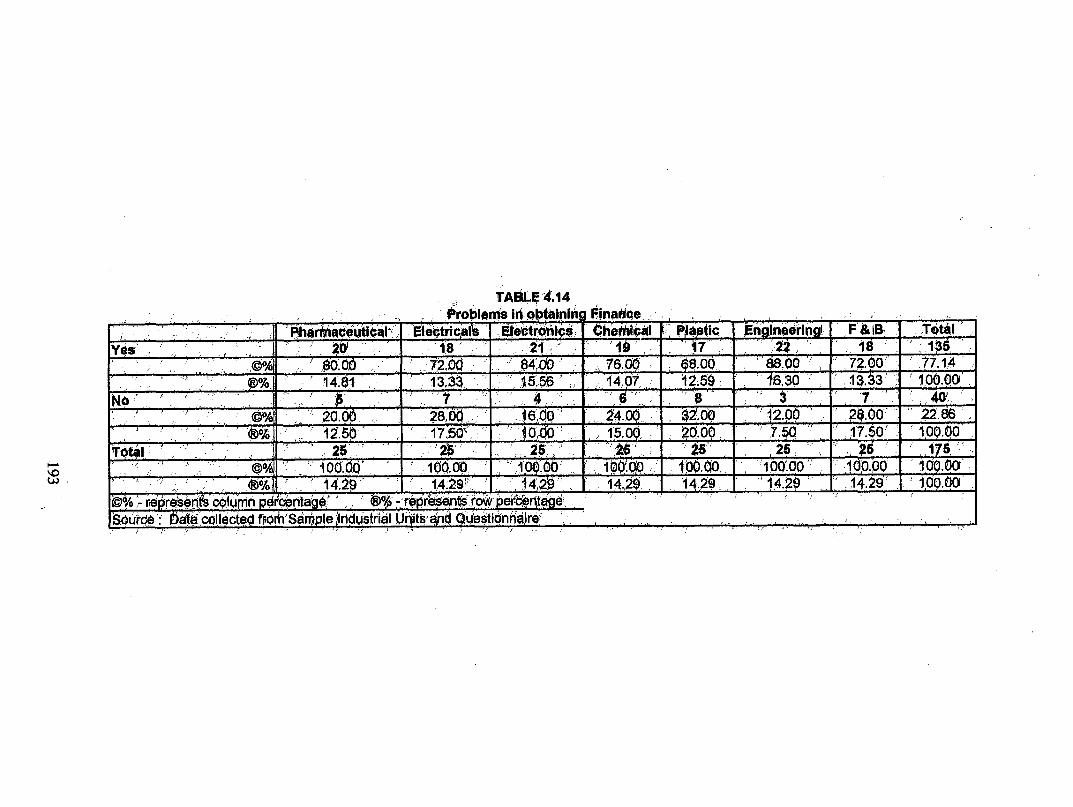
TABLE 4.14 Problems irf obialpin Anarice
EloOtio T4tai 135
Engineerin ► ra, YB 22 , 18
tifictricAN 1 .8' 'Yes 21.:
86.00 6,30
' 77.14 1.00.00' .
60.00 14.61
72.00' ;14, 3
84:0 15,56
, 76.00 14.07
7„ 12.00 • 7.50
22.66 VAL 20.0 0%
12150 1,0000
28,00 10;00 1500 ,
Total 176 , 25 100.00 '100100 " 100:00 ." •
14.26 1,0000 14.26 100.00 14.29 14,26 1 4 .26 ,
KiOre's(30., Wtirriti porlafrita lsW 11)% 7 rOVeSsispt0 es34? perOtitalje•,
Source i0d84collecteci fiforh'SOrt)ple , .
goestionhairev,
72.00 13.33
Plastic, 17 $ . 00 .
12.59
.4001 1 7.50
8 32,0Q 20.0,
100.00 ; 14.26'

beverage 7 units each. Chemicals 6 units, pharmaceuticals 5 units,
electronics 4 units and engineering 3 units.
The forgoing analysis showed that most of the Small Scale
Industries have a problem in obtaining finance. It is due to the
various reasons which were discussed in the above topic. In
addition to that some typical problems faced by small scale units
were identified. One of such problem is due to credit squeeze. The
Table 4.15 showed the details regarding the credit squeeze
problems created by the lenders and financial institutions, and how
it affected the small scale units in Goa. The severity of the problem
is measured by a 5 point scaling technique and presented it in
terms of the mean value. It is clear that 77 units with 44 percent of
the total have faced a very severe problem due to the policy of the
lending institution. While 61 units 34.86 percent one have faced a
high problem, 25 units (14.29 percent) faced moderated problems
regarding credit squeeze, 9 units were on low level and 3 units with
1.71 percent were at the very low level. Higher the point on the
scale more severe is the problem. The overall mean showed 4.14
which ultimately falls under the very high degree category. While
industry wise the plastics units with 4.44 average mean value was
on the top followed by engineering 4.32 and the lowest among them
was pharmaceuticals with 3.56 mean value which fell under
moderate category followed by electricals and food & beverage 4.00
mean value each representing high degree of credit squeeze. It is
194

TABLE 4.15 Preblernt in obtaining Finance Credit Squeeze
Scale
Pharmaceutical be hica Electronics Chemical Plastic En ineerin
8. 1B
Total .
OA 8.00 ' 0.00 0.00 , 4.00 0.00 0.60 000 1 ..71 ®0/0 ,„ 6 • 67 0.00 0.00 63.33 , 0.00 , 0.00 6,00 ' 106.00'
2 3 : • 1 1 1 ' 0 ' 1 2, • 0, 604 12.00 4.00' 4.00 4.00 0,00 4.d0, ' $00 , 5.14 0% 33.33 11,11 111.11 11,11 0.00 11.91 22.20' • 100.60
25. V% 26.00 . 16,00 1200 0.00 $.00 . 12,00 ' 24.00' 14.29 ea4 20.00 ' 16.00 12:10 ' 0.00 8.00 12.00 - ,24go' , - 100.00 ,
• 10 61 ' 34186
' 100.po ' VA; ' 30.00 . 32,00 40;00 ' 6.00 40.00 . . ' $2.00 ' ,28.66`
8% 14.75 ' 13,11 1639' 1475 16.30 ., ' 1311 1 11.48' , 12 11 12 ' 13 • ' 7.
4 24 .00 2460 24:00 24..00. 24.00 . ' 24,00 • 24.00•100.00 ' 8% 710 ' 15.66 1429 15.5$ . 15.85 . '16.5$ ' 12.99
Total , 25 25 26 25. VA, " 100.00 10000 . 106.00' 100.00., 106.00 . '`100:00'' • 100 ;00 ' 100.60 ,
(ID% '14.29 • • 14.29 . 14,20 14.29 14.29 . ''14,29 14.29' 160.60 Mean &55 ' 4.00' „4,24 ' 4.20 4444 4.32 4,00' . 4.14 Vio ',- represeriteOluMn percentage .; eoet) represents row Oercentaga, $tale: 1 - Veiy Law; 2 - Low; $ ,- Modetatk 4 - High; 6 -` Ve ry High. 8ourda : Data collected from San1dle lrickistrial Viiits and. Questionnaire

also interesting to note that 12 units were noticed under the
category of low to very low degree.
4.20.1 PROBLEM OF SECURITY - Not having enough security
to provide as a pledge or hypothecation is the another problem of
Small Scale Industry in Goa. With out security, it is rare that small
scale units can raise finance from the financial institution and
money lenders. It is mainly due to low credit worthiness of the
entrepreneurs that demands high security against the finance. In
the Table 4.16 showed the problem in obtaining finance among the
small scale units due to the security. It can be seen that 86 units
(49.14 percent) were found to have faced very severe problem in
raising funds due to poor security, while 63 units (36 percent) faced
high degree of such problem, 17 units (9.71 percent) faced
moderate problem, 8 units have faced low problem and one unit
have faced very low problem. The overall average mean showed
4.29 which means overall very severe problem faced by SSI units.
Industry wise, the average mean value again showed very high
degree of problem for the types of industries. The highest among
them was the food 86 beverages (4.52) and the lowest among them
was engineering with 4.04 mean value.
4.20.2 DELAY IN SANCTIONING LOAN - There are two stages
involved in granting of loan i.e. sanctioning and disbursement.
There is a General complaint by the entrepreneur that it takes a lot
of time in getting the loan sanctioned and also lot of time is wasted
196
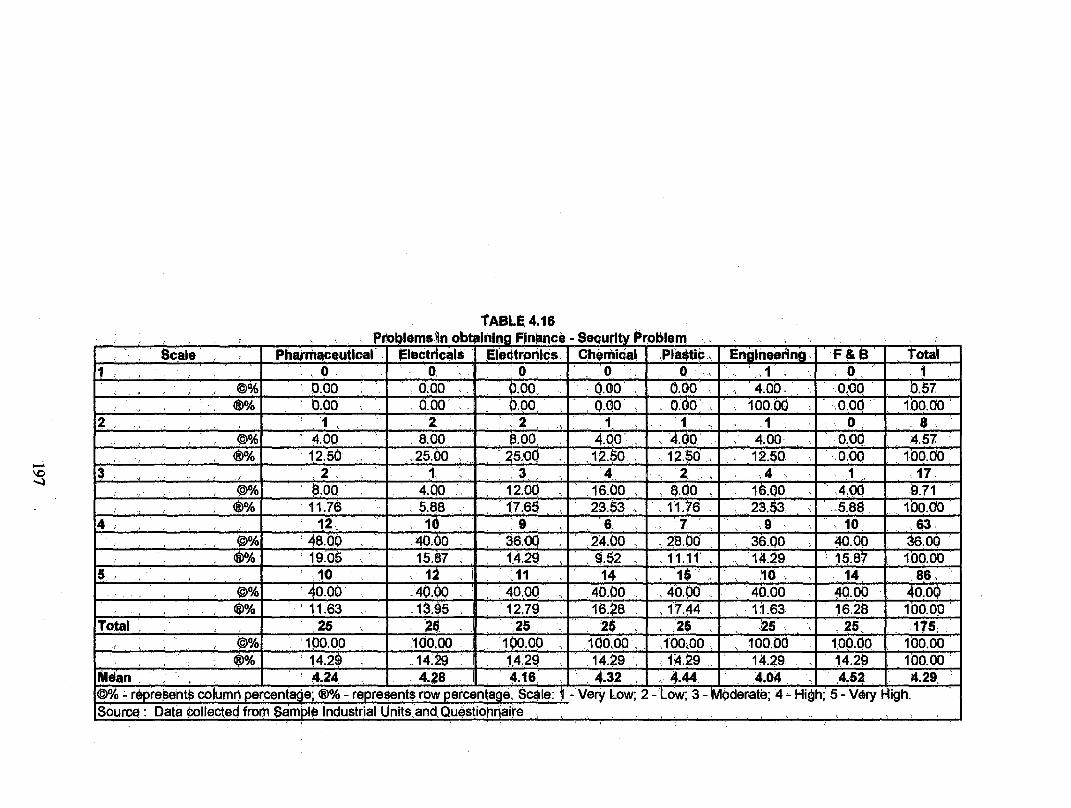
TABLE 4.16 Problems in obtaining Finance - Security Problem
Scale ' Pharmaceutical Elect colt gleetroniqs, chemical ,Plattic , En ineeiin F & B otal 0 : 0 0 O '0 • 1 . . 0 1
a% ' 0.00 . 0.00 .00 . 0.00 0.00 , 4.00 0.06 0.57 0% ' 0.00 0.00 0.00 0.00 ' : 0.00' 100.00 0.00 100.00
1 2 • . 1 1 0 8 0% 4.00 , 8.00 800 4.00 . , .. 4.00' 400 _0.00 4.57
cits% ' ' 12.50 25.00 25.00 ,12.$0 , 12.50 12.$0 0.00 100.00 ' 3 2 1 3 4 2 4 1 17
, ()% ' $.00 4.00 ' 12.00 16.00 , 8.00 16.00 .4C0 9.71 6% 11.76 5.88
10 • " 17.65 .
9 23.$3
' 6 _ 11.76
7 23.53.
9 ,5.88 , 10
100.00 . 63 4 12
coh ' 48.00 , 40.00 - 36.00 : 24.00 , 28.00 36.00 40.00 36.00 6A 19.05 15.87 1429 9.52 , . 11.11' 14.29 15.87 1130.00
5 10 12 I . 11 14 , '15 ' 10 14 86, , 40% • 40.00 40.00 ' 40.,00 40.00 . 40.06 , 40.00 40.00 40.00
0% ' 11.63 _13.$5 I . ' 12.79 , 16.28 „ 11.44 , 11.63 16.28 100.00 Total 25 25 I . ;25 25 , 25 25 25 175
0% 100.00 100.00 I '100.00 100.00 . . .100,00 , 100.00 100.00 100.00 • 6% 14.29 14.29 1429 14.29 1 .4.29 • 14.29 14.29 100.00
Mean , , , 4.24 4.28 4.16 . 4.32 4.44 . 4.04 4.52 4.29. 03 0 - repreSente column percentage', ®% - represents row petcentage. Scale: - Very Low; 2 - ow; 3 -
, oderate; 4 - High; 5 - Very High.
Source : Date Collected from Sample Industrial Units , and Questionnaire

in disbursement of loans. Table 4.17 showed the problem faced by
small scale entrepreneur in obtaining finance due to delay in
sanctioning and disbursement. 84 units representing 48 percent of
the total said there was a high degree of delay in sanctioning the
loan, 41 units representing 23.43 percent of the total complained
that there was very high degree of delay in sanctioning the loan, 40
units complained that there was moderate delay in sanctioning loan
while 10 units said there was low or very low degree of delay in
sanctioning. The overall average mean value showed 3.87 which
means high degree of delay. Industry wise, it showed electronics
and chemicals have got 4.04 mean value for each category which is
higher than the overall average mean and it is coming under very
high category. While engineering with 3.64 mean and
pharmaceuticals and electricals with 3.80 each are at the least
affected among all.
In Table 4.19 an attempt is been made to show the
comparative analysis of mean value regarding the problems faced
by small scale entrepreneurs in obtaining finance. All the problem
i.e. Credit squeeze, security, delay in sanction and disbursement
and corruption are shown with their average mean value are shown
in the above Table. It revealed that almost all the problems have a
very high degree of effect on small scale industries except delay in
sanctioning and disbursement which recorded 3.87 degree means
high degree. Among all security was the most severe problem as it
can be seen with the highest degree of average mean value 4.29
198

TABLE 4.17 . Prbblems in obtaining Finance - Delay in Sanction
Scale PharMaCeutical Erettricala , EleetroniCs . Chemical .Pladtic , Engineerling F & B Total
©% 4.00 . 0.00 k 4.00 . 0.00 0.00 4.00 ‘0.06 1.71. 0% 33:33 , 0.00 1 33.33 ' 0.00 ' 0.00 33.33 0.00 :100.00
o% $.00 ' 4.00 I 4.00 600 , 0.00 - 8.00 ,4.06 4.00 0% 28:57 1429 14.29 _ 0.00 0.00 28.57 14.29 ' 100.00
o% 2000 . 28.00 20.00 , 24.00 20.00 24.00 24.00 ' 22.86 e% 12:50 ' .17.50 12.50 .15.00 12.50 15.00 15.00 100.00
10 12 14 12 0% 40.00 52.00 48.00 ' . 48.00 86.00 48.00 ' 44.00 1 48.06
100.00 ooh 11:90 ,.15.48 ' 14.20 14.29 .16.67 14.29-, . 1 810 " 41
o% 28:00 28.00 28.00 , 28.00 , 28.00 28.00 ' 28.00 28.06 ®% 17:07 9.76 I . 1463 17.07 14.63 9.76 . 17.07 100.00
Total 25 25 25 25 , 25 175. . 0% 100.00 100.00 l '100.00 100.00 10000 100.60 " 1,00.00' 100.00
100.00 VA 14:29 14.29 ' 1420 . 14.29 14.29 14.29, 1429 ' Mean , 3.80 . 3.80 3.84 ' 4.04 404 3.64: 3.66 3.67. 0% - represents Column percentage; VA - repreSehte row percentage. Scale: 1 - Very LoW; 2 - Low; 3 - Moderate; 4 '- High, 5 - Very High. SOurce : Data collected from Sample Ihduetrial Units and Questionnaire
It is understood from the entrepreneurs that although it have got
the second place but its involvement is in almost all the problems
faced by small scale entrepreneurs. Among the pharmaceuticals,
security is the major problem. Credit squeeze is the major problem
of electronics units followed by security 4.16. It is very interesting
to note that credit squeeze and security have the same degree of
mean value 4.44 in case of plastics industry followed by delay in
sanctioning and disbursement 4.04 mean value. In engineering
industry, it was credit squeeze 4.32 is the major drawback followed
by food & beverages it is security the major problem due to their
low asset backing.
4.21 REPAYMENT PERIOD - Repayment of loans is suppose to be
the main financial difficulty for many entrepreneurs. Repayment
period starts much before they could utilise this fund in the
business and starts earning proper rate of return. Once the loans
granted and disbursed, whether it is a short term or long term loan
the interest starts mounting up, but it doesn't go at the same rate
in the earnings of the business. So the entrepreneurs always
expect the lender of funds should be little bit lenient during this
term. To understand this main problem of the entrepreneurs the
200

TABLE 4.19 roblelns in obtaini ng Comparative o arative An I s s Me n Value
. ,
Pharmaceutical - Electricals Electronics Chemical J
Plastic Engineering F & B Total Credit Squeeze 3.56 4.00 4.24 4.20 4.44 4.32 4.00 4.14
Delay in Sanction & Disbursement 3.00 3.80 3.84 4.04 4.04 3.64 3.96 3.87 Source : Data collected froM Sample InduStrial Units and Questionnaire
TABLE 4.20 Reaavment period of Tenn Loan
Pharmaceutical Electricals Electronics Chemical Plastic Engineering F & B Total First Month onward 0 0 0 1 1 1 2
OA 0:00 0.00 0.00 4.00 4.00 4.00 8.00 2.86 (firio 0.00 0.00 0.00 20.00 20.00 20.00 40.00 100.00 '
After Gestation Period 7 4 3 3 4 5 8 34 ©% ' 28.00 10.00 12.00 12.00 16.00 20.00 32.00 19.43
Vio . 20.59 11.76 ' 8.82 8.82 11.76 14.71 23.53 100.00 ' After definite piriod 18 21 22 21 20 19 .15 136
©% 72.00 84.00 88.00 84.00 80.00 76.00 60.00 77.71 . 0% 13.24 . 15.44 16:18 15.44 14.71 13.97 11.03 100.00 '
Total 25 25 25 25 25 25 25 175 " . d'h ' 100.00 100.00 100.00 100.00 100.00 100.00 100.00 100.00 ' ' 6% 14.29 14.29 14.29 14.29 14.29 14.29 14.29 100.00 '
©% - represents aoluinn percOriage e°4 - represehts row percentage Source : Data collected from Sample Industrial Units and. Questionnaire

repayment period is divided into three categories i.e. Repayment
period of term loan soon after first month onward, after the
Gestation period and after a definite period.
The Table 4.20 represented the repayment period of term
loans - long term in nature. It is clear from the Table that 136
units representing 77.71 percent have got a repayment period after
a definite period. The definite period may start from one years to
two years or more. Industry wise, electronics 22 units representing
88 percent followed this period of repayment while food & beverage
with 15 units (60 percent) were at the lowest among this category.
The Table showed that there were 34 units (19.43 percent) which
repayment period was after the Gestation period. It's a great relief
to the units which faced major problem of establishment and
market capturisation. Initially it was the food & beverage industry
8 units (32 percent) was top on the list followed by pharmaceuticals
7 units (28 percent) and least among them was electronics and
chemicals with 3 units each. There are still 5 units representing
2.86 percent of the total one had a repayment period soon after the
first month onwards and it's a big challenge for them to make the
payment within the time limit.
Overall it showed that the maximum units have got a definite
repayment period in case of term loan. It is because the fund
lenders realised that it is very difficult for them to make the
payment of instalment amount of loan and interest when they have
202

not started earning it, where as those five units representing two
from food & beverage and one each from chemicals, plastics and
engineering were not given any such concession.
Position of repayment of short term loans of small scale
entrepreneurs from Goa are shown in the Table 4.21 again having
the same criteria. Repayment after first month onwards, after
Gestation period and after definite period. It can be seen from the
Table that 146 units representing (83.43 percent) came under the
first category which repayment period started soon after the first
month. Industry wise, all the units representing 80 percent fell in
these category except pharmaceuticals 18 units (72 percent),
electricals 19 units (76 percent) while plastics with 24 units (96
percent) were on the top of the list. Total of 8 units repayment was
after the Gestation period and 21 units after the definite period.
Here 146 units fell under first category i.e. Repayment soon
after one month because it is a short term loan and short term
loans are to be repaid mainly within one years period of time.. This
loan is taken only when the investment in the long term Assets are
already made.
4.22 FAIL TO REPAY LOAN INSTALMENTS
For some units the sickness comes initially from the
beginning due to their failure to make the timely payment of loan
instalment when the unit becomes the defaulter, and the situation
continues for a long period, then such units are considered as
203
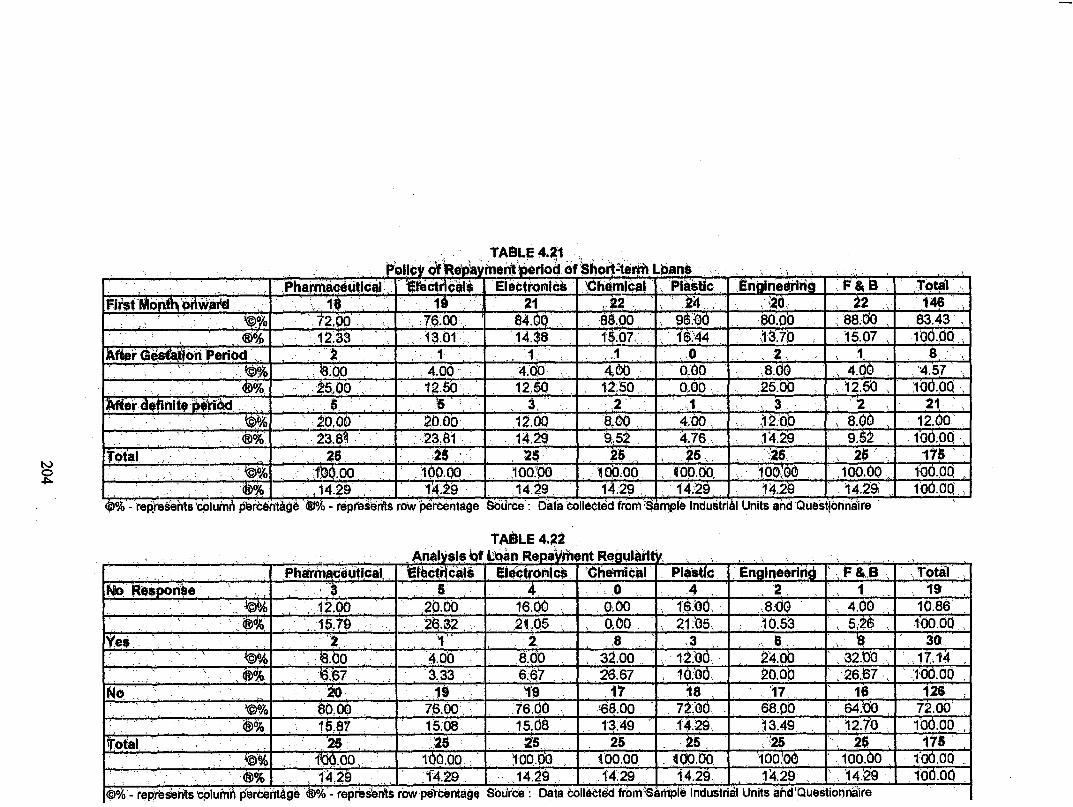
TABLE 4.21 olicv of epavmen't1eriodof Short terim L an
Phardlimititidal . Electronic -a 'Oliamidal 11,22123111=211NEM Total First 6 Oliwaled 1 1 21 2 24 .. , 20 2 146 ,
V% 72,00 75.00 84.00 . 58.00 96,06 80.00 ., 88.00 , 83.43 .1064 12.33 13.01 14.38 15.07. 16:44 13.70 . 15.07 , 10 .0Q
i Gas ion Period , ' 2 1 1 . ,1 0 2 , 4 % , :.00 . 4.00 4.00 400 000 , ,8•.0 4.00 . A.57 ' (D% . 2500 ' 12.50 12.50 1 .50 0.00 , 25.00 12.50 10 r .00 ,
er afloat, tl Wad 5 5 3. 2 21 ' ® . 20.00 . ' 20.00 12.00 6,00 4.00 12.00 , 8.0 , 12.00'
,®% , 23.81 14.29 9,52 416 „ 14.20 9. 55 10':00 , Total
ID
MEM ®% - recirtientst:duimi bisrOentit
25 25 25 25 ... 25 ..E 175 ' 1 ( 6.00 1 0.00 1000 100.00 100.00 10000 100.0 0 ,. 1 ,0 .00 .. , 14.29 14. 9. 14.29 1 29 14.29 14.29 14.29 . 10 .00 : )
6 40 I-tentacle Source . Data t, olleoted rom Sample Industrial Units and Questionnaire
TABLE 4.22 • ' "
,f■nawsis ot Loan Kepaymant Kegulanty .
Pharmaoeutical ' Elect` call EletirorilcS Plemital . Plastic Engineering P 84,13 , Total' Nio ResporiSe 5 4 . 0 4 2, 1 19
A . 12.00 20.00 16.00 0.00 1600 ,8100 4.00 10.86 igA , 15,79 , 26.52 21.05 000 21:05. 10.53 52 .. ., 100. . 00
Yes . 2 1' 8 3 5 8 30 t% 6.00 4.00 8.00 . , 32.00 , 12b0 . 24 .0.0 . , 32.00 ., ,17.1'4 66)4, 4567 3.33 6.67 , 6.67 16:00 M.00 ' , 26.67 100.00
No .,
3 - 2 s 19 19 17 18 , 17. 16 126 o • 80,00 . 76.00 . , 76.00 , 68.00 72.00• 68.00 64.00 , 72.00'
bai3 15.67 1508 • 15,08 13,49 14.29, 13.49 12.10 100.00 , total 25 25 . 25 , 25 25 176
100.00 :1100.30 100.00 i - 00.63 100.00 400.00 .100'.00 10(100 1+1.29 ,14.29 14.29 14.29 14.29 14.29 .14:29 . 100.00
0% - repres nits r,Oluinii Oerteritage OA . - represents row pertenta0e Source: Data colleted frorn .:Sarnple InduSinal Units at d`Questionnaire

insolvent and action is taken against them to repay the instalment
amount and the penal interest due to non-payment. Table 4.22
revealed the position of the small scale units in terms of repayment
of loan instalments. It is clear that 126 units representing 72
percent have answered saying that they never failed in repayment of
loan instalment on time. While 30 units representing 17.14 percent
have failed in repayment of loan instalment and 19 units
representing 10.86 gave no response to this question. They were
worried about the reputation of the units if the answer is negative.
The units which failed to repay loan instalments most are food &
beverages and chemicals 8 units each while electricals were the
least with just one unit which failed to repay the loan instalment
on time. Many of the entrepreneurs revealed after deep discussion
that they took second loan to repay the first loan and third to repay
second and that is how short term loans goes not circulating from
time to time
It is clear that the major problem of repayment is the long
term loan as it involves huge amount and huge interest repayment
also. Therefore, Small Scale Industry fallback mostly on owned
fund rather than borrowed fund. This will help the small scale
units atleast in the initial period to build up and grow well and as
far as possible small scale units have to see how to minimise the
cost of financing and interest there on the loans. Last movement
makes the units to borrow the funds from the costliest source
which will ultimately make them defaulters.
111