Embed Size (px)
Citation preview

CAPITALAND COMMERCIAL TRUST1Q 2020 Financial Results29 April 2020

Important NoticeThis presentation shall be read in conjunction with CCT’s 1Q 2020 Unaudited Financial Statement Announcement.
This presentation may contain forward-looking statements. Actual future performance, outcomes and results may differmaterially from those expressed in forward-looking statements as a result of a number of risks, uncertainties and assumptions.Representative examples of these factors include (without limitation) general industry and economic conditions, interest ratetrends, cost of capital and capital availability, availability of real estate properties, competition from other developments orcompanies, shifts in customer demands, shifts in expected levels of occupancy rate, property rental income, charge outcollections, changes in operating expenses (including employee wages, benefits and training, property operating expenses),governmental and public policy changes and the continued availability of financing in the amounts and the termsnecessary to support future business.
You are cautioned not to place undue reliance on these forward-looking statements, which are based on the current view of management regarding future events. No representation or warranty expressed or implied is made as to, and no reliance should be placed on, the fairness, accuracy, completeness or correctness of the information or opinions contained in this presentation. Neither CapitaLand Commercial Trust Management Limited (“Manager”) nor any of its affiliates, advisers or representatives shall have any liability whatsoever (in negligence or otherwise) for any loss howsoever arising, whether directly or indirectly, from any use, reliance or distribution of this presentation or its contents or otherwise arising in connection with this presentation.
The past performance of CapitaLand Commercial Trust (“CCT”) is not indicative of future performance. The listing of the unitsin the CCT (“Units”) on the Singapore Exchange Securities Trading Limited (the “SGX-ST”) does not guarantee a liquid market for the Units. The value of the Units and the income derived from them may fall as well as rise. Units are not obligations of, deposits in, or guaranteed by, the Manager. An investment in the Units is subject to investment risks, including the possible loss of the principal amount invested. Investors have no right to request that the Manager redeem or purchase their Units while the Units are listed on the SGX-ST. It is intended that holders of Units may only deal in their Units through trading on the SGX-ST.
This presentation is for information only and does not constitute an invitation or offer to acquire, purchase or subscribe for the Units.
2CapitaLand Commercial Trust Presentation April 2020
Contents
1. Highlights 04
2. Steering through COVID-19 10
3. Financials and Capital Management 16
4. Steady Portfolio Performance 24
5. Market Information 35
6. Committed to Sustainability 44
7. Value Creation Strategy for Sustainable Returns 46
8. Additional Information 54
Slide No.
*Any discrepancies in the tables and charts between the listed figures and totals thereof are due to rounding.
3CapitaLand Commercial Trust Presentation April 2020
Capital Tower, Singapore
1. Highlights

Resilient operating results
Notes:
(1) Higher gross revenue was largely attributed to contributions from Main Airport Center which was acquired in September 2019 as well as higherrevenue at 21 Collyer Quay, Gallileo and CapitaGreen. Property operating expenses increased due to addition of Main Airport Center and BugisVillage’s rental payable under the master lease with SLA.
(2) Despite the resilient operating performance of the CCT portfolio in 1Q 2020, distributable income to CCT unitholders is lower compared to 1Q 2019 byS$19.0 million due to retention of taxable distributable income and no distribution of tax-exempt income as a matter of prudence in light of theCOVID-19 situation. CCT will review this amount with the closure of the second quarter of 2020.
5CapitaLand Commercial Trust Presentation April 2020
1Q 2020 1Q 2019 Change
S$ mil S$ mil %
Gross Revenue 103.6 99.8 3.8
Property Operating Expenses (23.3) (20.0) 16.6
Net Property Income 80.3 79.8 0.7
Income for distribution to Unitholders 70.2 82.7 (15.2)
Distributable Income to Unitholders 63.7 82.7 (23.0) Please see note (2)
Distribution Per Unit 1.65¢ 2.20¢ (25.0)
Please see note (1)
Remarks
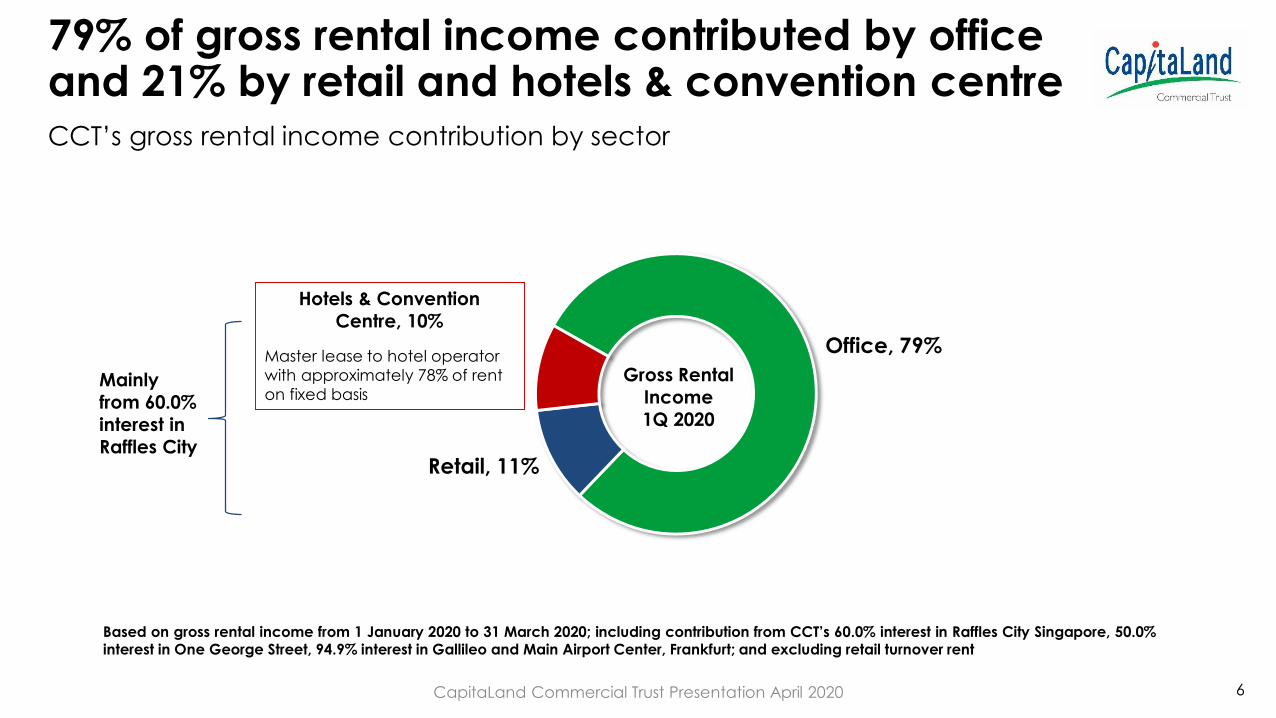
79% of gross rental income contributed by office and 21% by retail and hotels & convention centre
6
Based on gross rental income from 1 January 2020 to 31 March 2020; including contribution from CCT’s 60.0% interest in Raffles City Singapore, 50.0%interest in One George Street, 94.9% interest in Gallileo and Main Airport Center, Frankfurt; and excluding retail turnover rent
Office, 79%
Retail, 11%
Gross Rental
Income
1Q 2020
Mainly
from 60.0%
interest in
Raffles City
Hotels & Convention
Centre, 10%
Master lease to hotel operator
with approximately 78% of rent
on fixed basis
CCT’s gross rental income contribution by sector
CapitaLand Commercial Trust Presentation April 2020
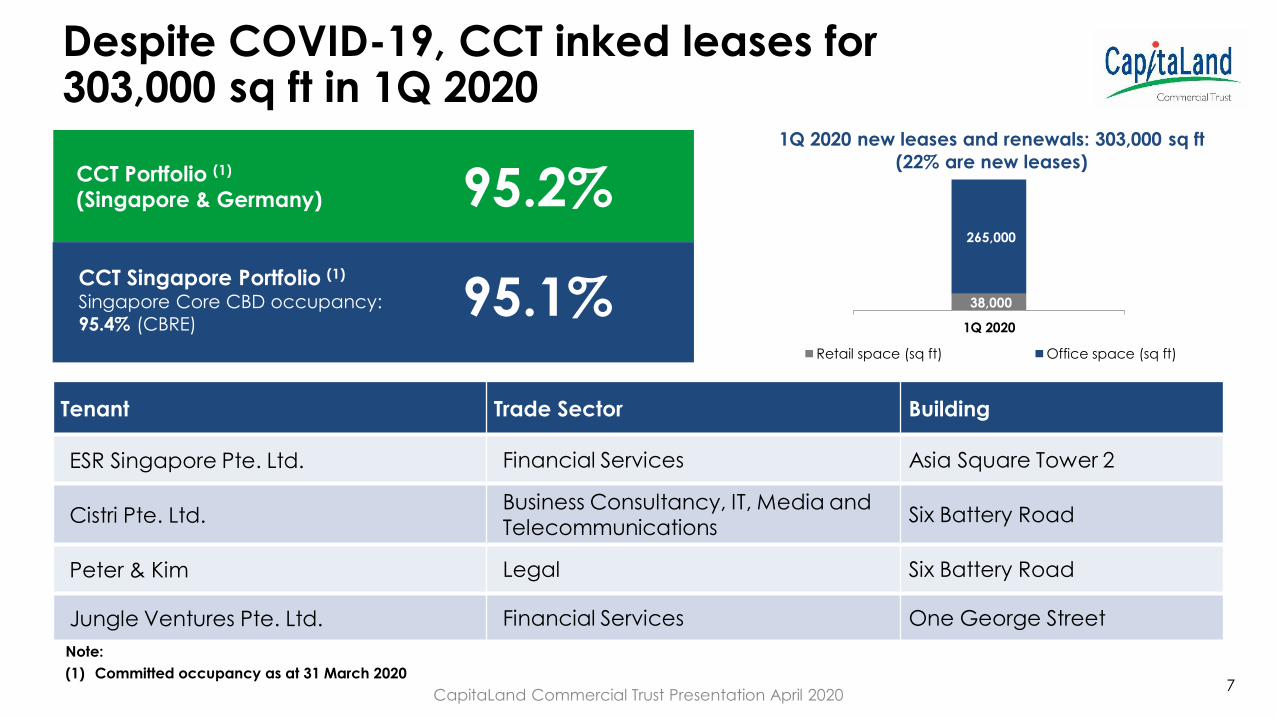
Despite COVID-19, CCT inked leases for 303,000 sq ft in 1Q 2020
CCT Portfolio (1)
(Singapore & Germany) 95.2%
38,000
265,000
1Q 2020
1Q 2020 new leases and renewals: 303,000 sq ft
(22% are new leases)
Retail space (sq ft) Office space (sq ft)
CCT Singapore Portfolio (1)
Singapore Core CBD occupancy:
95.4% (CBRE)95.1%
Note:
(1) Committed occupancy as at 31 March 2020
Tenant Trade Sector Building
ESR Singapore Pte. Ltd. Financial Services Asia Square Tower 2
Cistri Pte. Ltd.Business Consultancy, IT, Media and Telecommunications
Six Battery Road
Peter & Kim Legal Six Battery Road
Jungle Ventures Pte. Ltd. Financial Services One George Street
7CapitaLand Commercial Trust Presentation April 2020
8
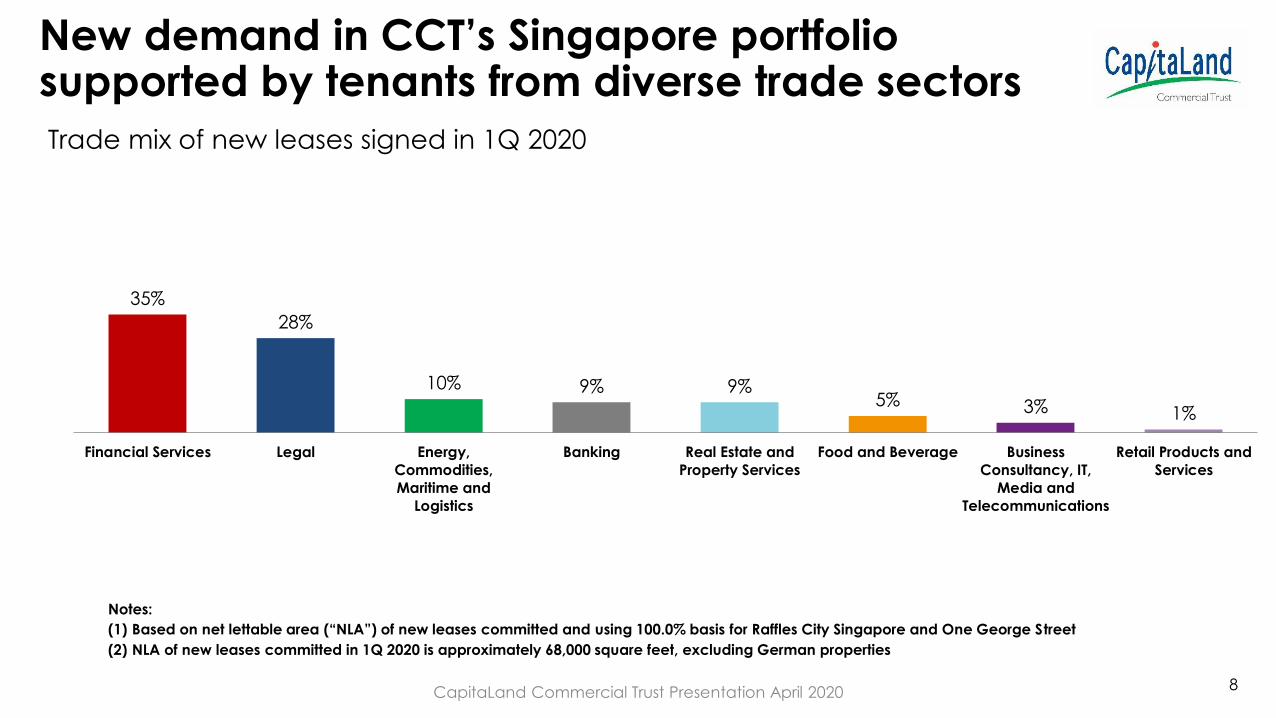
New demand in CCT’s Singapore portfolio supported by tenants from diverse trade sectors
Notes:
(1) Based on net lettable area (“NLA”) of new leases committed and using 100.0% basis for Raffles City Singapore and One George Street
(2) NLA of new leases committed in 1Q 2020 is approximately 68,000 square feet, excluding German properties
Trade mix of new leases signed in 1Q 2020
35%
28%
10% 9% 9%5% 3% 1%
Financial Services Legal Energy,
Commodities,
Maritime and
Logistics
Banking Real Estate and
Property Services
Food and Beverage Business
Consultancy, IT,
Media and
Telecommunications
Retail Products and
Services
CapitaLand Commercial Trust Presentation April 2020
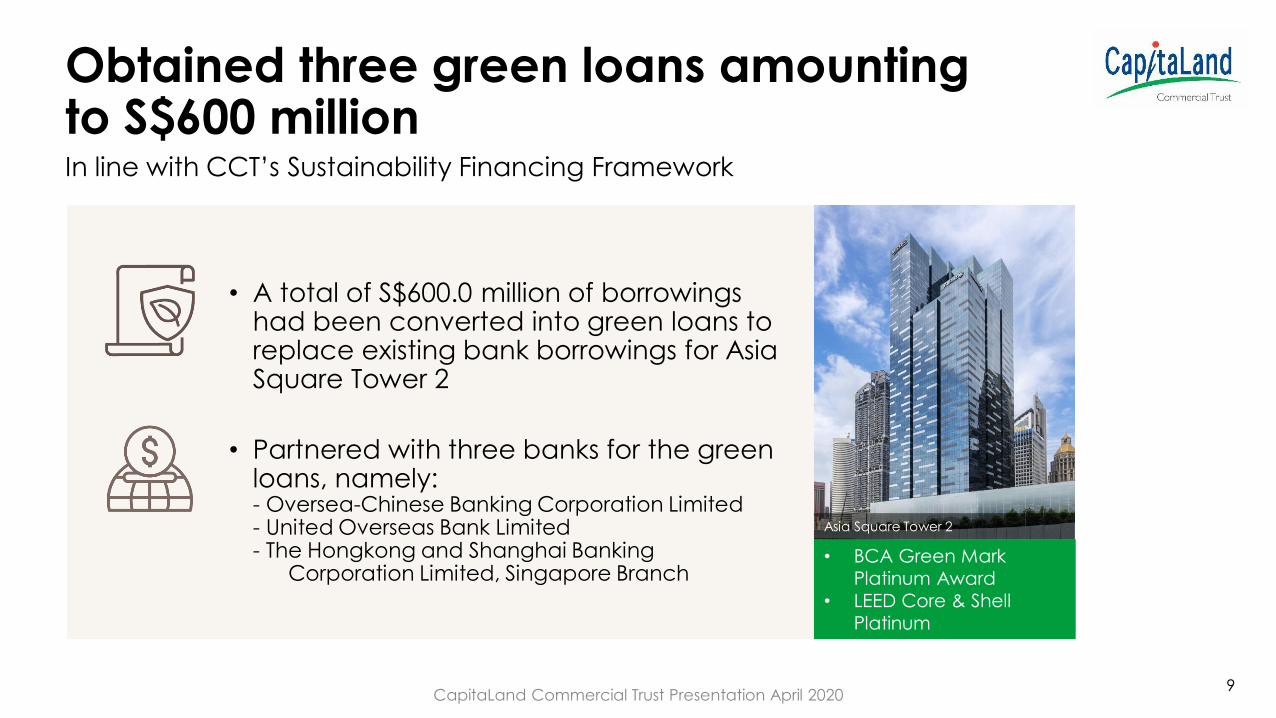
Obtained three green loans amounting to S$600 million
• A total of S$600.0 million of borrowings had been converted into green loans to replace existing bank borrowings for Asia Square Tower 2
• Partnered with three banks for the green loans, namely: - Oversea-Chinese Banking Corporation Limited- United Overseas Bank Limited - The Hongkong and Shanghai Banking
Corporation Limited, Singapore Branch
In line with CCT’s Sustainability Financing Framework
Asia Square Tower 2
• BCA Green Mark
Platinum Award
• LEED Core & Shell
Platinum
9CapitaLand Commercial Trust Presentation April 2020

CapitaGreen, Singapore
2. Steering through COVID-19
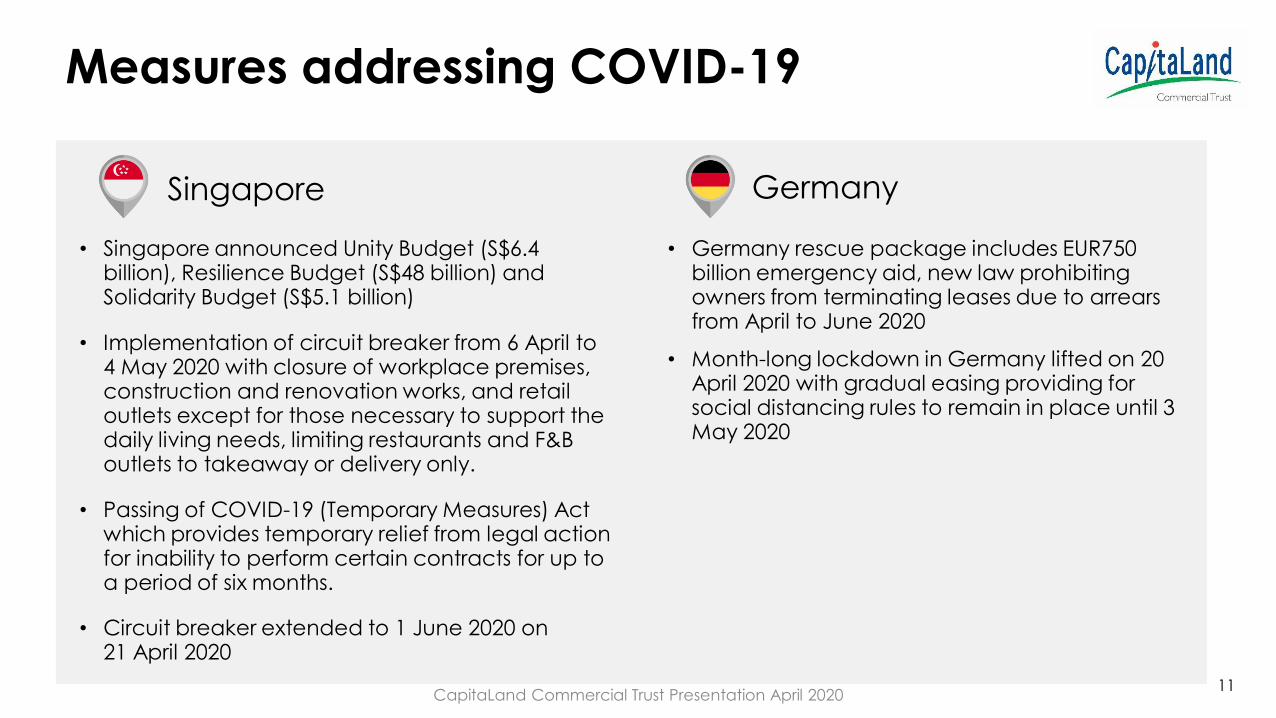
Measures addressing COVID-19
Singapore
11
Germany
• Germany rescue package includes EUR750 billion emergency aid, new law prohibiting owners from terminating leases due to arrears from April to June 2020
• Month-long lockdown in Germany lifted on 20 April 2020 with gradual easing providing for social distancing rules to remain in place until 3 May 2020
• Singapore announced Unity Budget (S$6.4 billion), Resilience Budget (S$48 billion) and Solidarity Budget (S$5.1 billion)
• Implementation of circuit breaker from 6 April to 4 May 2020 with closure of workplace premises, construction and renovation works, and retail outlets except for those necessary to support the daily living needs, limiting restaurants and F&B outlets to takeaway or delivery only.
• Passing of COVID-19 (Temporary Measures) Act which provides temporary relief from legal action for inability to perform certain contracts for up to a period of six months.
• Circuit breaker extended to 1 June 2020 on 21 April 2020
CapitaLand Commercial Trust Presentation April 2020
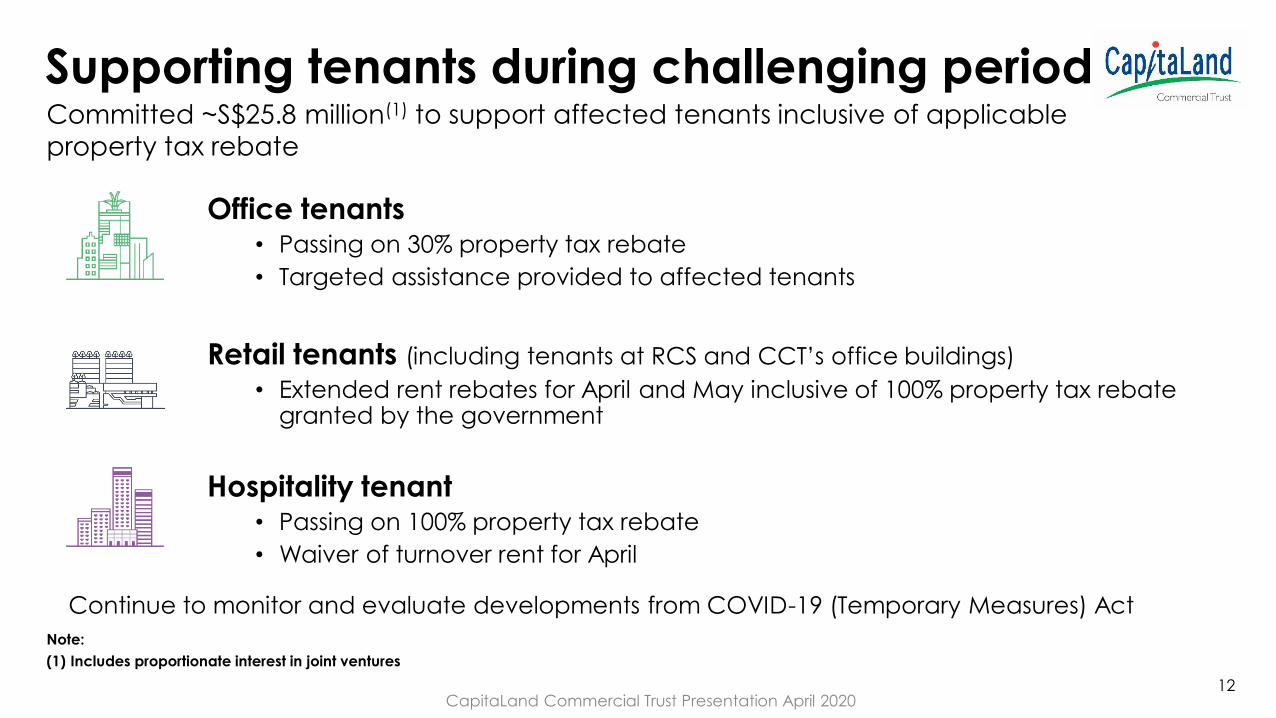
Supporting tenants during challenging period
Office tenants• Passing on 30% property tax rebate
• Targeted assistance provided to affected tenants
Retail tenants (including tenants at RCS and CCT’s office buildings)
• Extended rent rebates for April and May inclusive of 100% property tax rebate granted by the government
Hospitality tenant• Passing on 100% property tax rebate
• Waiver of turnover rent for April
CapitaLand Commercial Trust Presentation April 2020
Continue to monitor and evaluate developments from COVID-19 (Temporary Measures) Act
12
Committed ~S$25.8 million(1) to support affected tenants inclusive of applicable
property tax rebate
Note:
(1) Includes proportionate interest in joint ventures

Responses and impact of COVID-19
1. Leasing environment:
• Circuit breaker in Singapore has disrupted leasing activities such as viewings, handovers and fit-out works
• Longer time taken for decision making for lease commitment as companies focus on cost containment, evaluating space needs and prioritising renewals or extensions
• Leasing and investment activities in Frankfurt’s real estate sector have reduced
2. Lower car park income and other non-rental revenue
13
1. Safety measures in place to comply with the applicable policies and regulations
2. Focus on cost management
• Deferring non-essential capital expenditure works
• Reviewing operating expenses and deferring non-critical repair and redecoration works
3. Focus on cash conservation
4. Monitor and engage tenants in industry groups more affected by COVID-19
5. Hotels seeking alternative revenue streams
Responses Impact
Committed to the long term sustainability of CCT;
Focused on the health, well-being and safety of our stakeholders
CapitaLand Commercial Trust Presentation April 2020

Diverse tenant mix providing resilience to portfolio
Business sectors more affected by COVID-19
Travel and Hospitality 9%
Flex space operators 4%
Retail Products & Services 7%
Food and Beverage 5%
Total 25%
CapitaLand Commercial Trust Presentation April 202014
Banking, 23%
Financial Services, 13%
Energy,
Commodities,
Maritime and
Logistics, 9%
Business Consultancy, IT,
Media and
Telecommunications, 9%
Travel and Hospitality,
9%
Real Estate and Property
Services, 7%
Retail Products and
Services, 7%
Insurance, 6%
Food and Beverage, 5%
Manufacturing and
Distribution, 5%
Legal, 3%
Education and Services,
2%
Government, 2%
Committed Monthly Gross
Rental Income as at 31 March 2020
Notes:
(1) Based on committed monthly gross rental income of tenants as at 31 March 2020, including CCT’s 60.0% interest in Raffles City Singapore, 50.0% interest in One George Street and 94.9% interest in Gallileo and Main Airport Center (with effect from 18 September 2019), Frankfurt; and excluding retail turnover rent
(2) Excludes WeWork Singapore as lease expected to commence in 2Q 2021
(3) Excludes Bugis Village as the lease with the State ended on 31 March 2020
(Flexible space operators – 4%)

Status of ongoing and upcoming projects
15
21 COLLYER QUAY
✓ HSBC’s one year extension
lease will end in April 2020
✓ Upgrading work will
commence post circuit
breaker
SIX BATTERY ROAD
✓ Standard Chartered Bank’s lease
ended in January 2020 and
building’s occupancy is lower
✓ AEI work commenced in January
2020; Phasing of works may be
potentially delayed
✓ Leasing of upgraded space to
take longer
3Q 2021 (potential delay) 1H 2021 (on track)4Q 2020 (on track)
CAPITASPRING
✓ Construction progress is on
track with structural works
reaching Level 45
✓ Construction work will
continue post circuit
breaker
Expected
completion
CapitaLand Commercial Trust Presentation April 2020
Work at project sites have temporarily halted and will continue post circuit breaker; evaluating potential impact on supply chain and labour

Asia Square Tower 2, Singapore
3. Financials and Capital Management
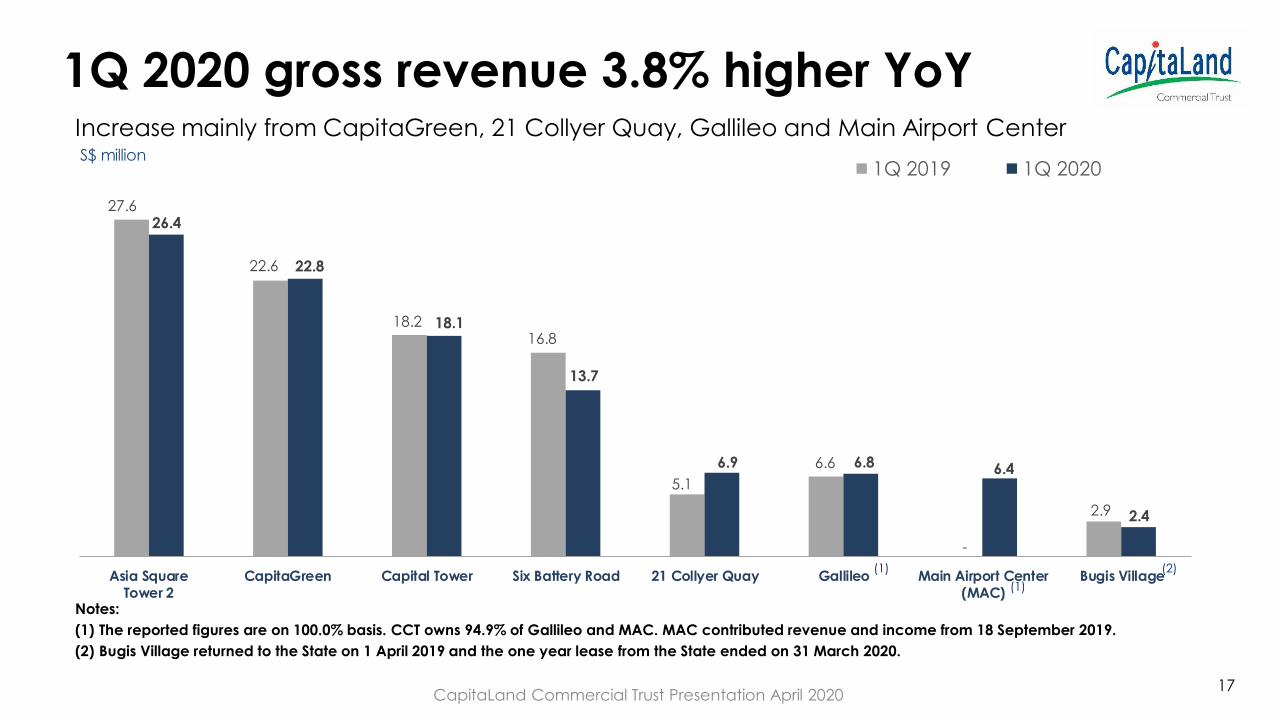
27.6
22.6
18.2 16.8
5.1
6.6
-
2.9
26.4
22.8
18.1
13.7
6.9 6.8 6.4
2.4
Asia SquareTower 2
CapitaGreen Capital Tower Six Battery Road 21 Collyer Quay Gallileo Main Airport Center(MAC)
Bugis Village
1Q 2019 1Q 2020S$ million
1Q 2020 gross revenue 3.8% higher YoY
Notes:
(1) The reported figures are on 100.0% basis. CCT owns 94.9% of Gallileo and MAC. MAC contributed revenue and income from 18 September 2019.
(2) Bugis Village returned to the State on 1 April 2019 and the one year lease from the State ended on 31 March 2020.
Increase mainly from CapitaGreen, 21 Collyer Quay, Gallileo and Main Airport Center
(1) (2)
(1)
17CapitaLand Commercial Trust Presentation April 2020
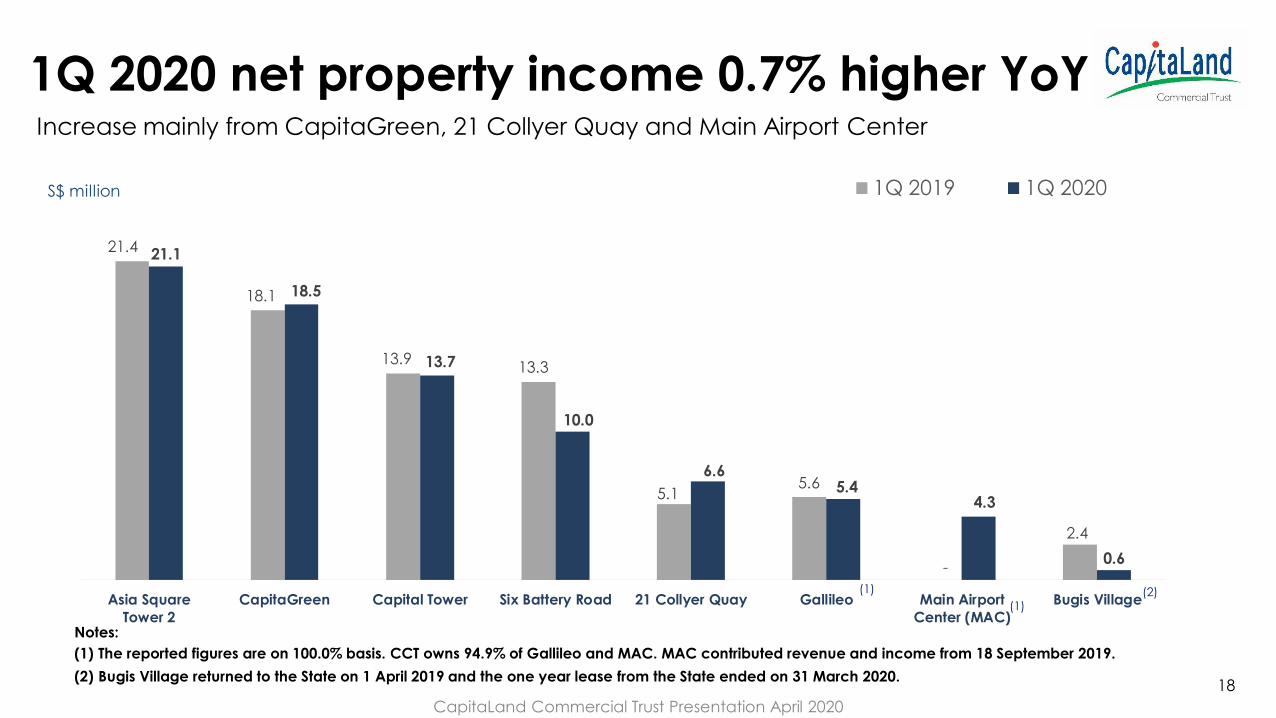
21.4
18.1
13.9 13.3
5.1 5.6
-
2.4
21.1
18.5
13.7
10.0
6.6 5.4
4.3
0.6
Asia Square
Tower 2
CapitaGreen Capital Tower Six Battery Road 21 Collyer Quay Gallileo Main Airport
Center (MAC)
Bugis Village
1Q 2019 1Q 2020S$ million
1Q 2020 net property income 0.7% higher YoY
Notes:
(1) The reported figures are on 100.0% basis. CCT owns 94.9% of Gallileo and MAC. MAC contributed revenue and income from 18 September 2019.
(2) Bugis Village returned to the State on 1 April 2019 and the one year lease from the State ended on 31 March 2020.
Increase mainly from CapitaGreen, 21 Collyer Quay and Main Airport Center
(1)
(1) (2)
18
CapitaLand Commercial Trust Presentation April 2020
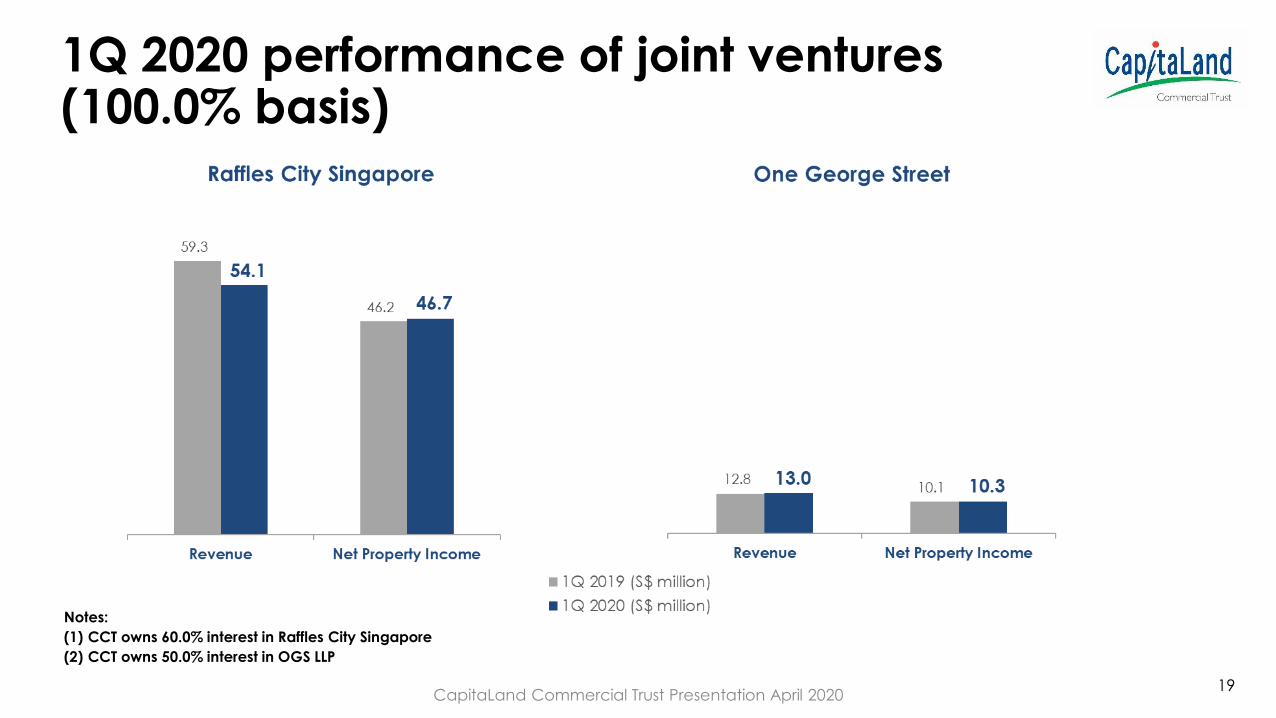
1Q 2020 performance of joint ventures(100.0% basis)
Notes:
(1) CCT owns 60.0% interest in Raffles City Singapore
(2) CCT owns 50.0% interest in OGS LLP
19CapitaLand Commercial Trust Presentation April 2020
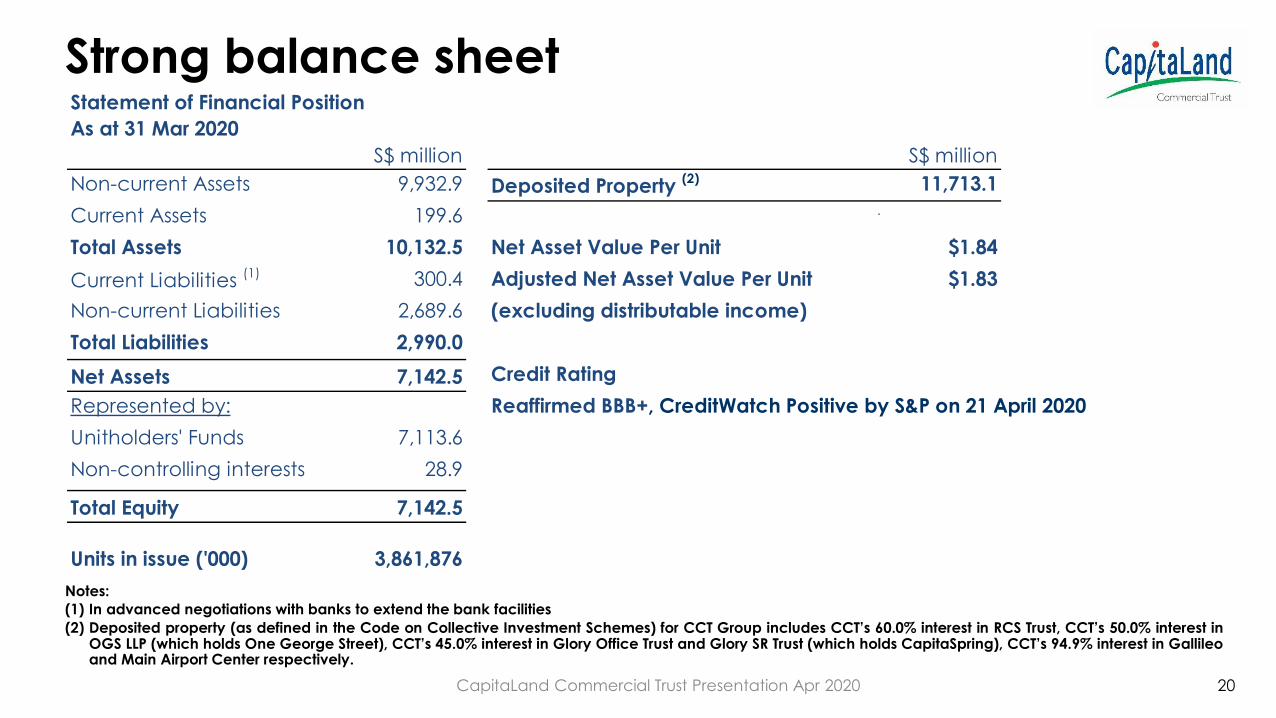
Strong balance sheet
Notes:
(1) In advanced negotiations with banks to extend the bank facilities
(2) Deposited property (as defined in the Code on Collective Investment Schemes) for CCT Group includes CCT’s 60.0% interest in RCS Trust, CCT’s 50.0% interest inOGS LLP (which holds One George Street), CCT’s 45.0% interest in Glory Office Trust and Glory SR Trust (which holds CapitaSpring), CCT’s 94.9% interest in Gallileoand Main Airport Center respectively.
20CapitaLand Commercial Trust Presentation Apr 2020
Statement of Financial Position
As at 31 Mar 2020
S$ million S$ million
Non-current Assets 9,932.9 Deposited Property (2) 11,713.1
Current Assets 199.6 .
Total Assets 10,132.5 Net Asset Value Per Unit $1.84
Current Liabilities (1) 300.4 Adjusted Net Asset Value Per Unit $1.83
Non-current Liabilities 2,689.6 (excluding distributable income)
Total Liabilities 2,990.0
Net Assets 7,142.5 Credit Rating
Represented by: Reaffirmed BBB+, CreditWatch Positive by S&P on 21 April 2020
Unitholders' Funds 7,113.6
Non-controlling interests 28.9
Total Equity 7,142.5
Units in issue ('000) 3,861,876

4Q 2019 1Q 2020 Remarks
Total Gross Debt (1) S$4,134.1m S$4,160.7m Higher
(Higher borrowings)
Aggregate Leverage (2) 35.1% 35.5% Higher
(Higher borrowings)
Unencumbered Assets as % of
Total Assets (3) 91.0% 91.0% Stable
Average Term to Maturity (4) 3.8 years 3.5 years Lower
(Passing of time)
Average Cost of Debt (p.a.) (5) 2.4% 2.3% Lower
Interest Coverage (6) 5.6 times 5.7 times Stable
Robust financial indicators
Notes:(1) Total gross debt includes CCT’s proportionate share of joint ventures’ borrowings. Higher borrowings quarter-on-quarter due to additional borrowings from joint
ventures.(2) In accordance with Property Funds Appendix, CCT’s proportionate share of its joint venture borrowings and deposited property values are included when
computing aggregate leverage. The ratio of total gross borrowings to total net assets is 58.3%.(3) Investment properties at CCT (exclude Joint Ventures) are all unencumbered except for Gallileo and MAC.(4) Excludes borrowings of joint ventures.(5) Ratio of interest expense (excludes amortisation of transaction costs) over weighted average gross borrowings.(6) Computed as trailing 12 months EBITDA (excluding effects of fair value changes of derivatives and investment properties) over 12-months trailing interest
expenses and related borrowing costs, as defined in the Code of Collective Investment Scheme, revised by Monetary Authority of Singapore on 16 April 2020. 21CapitaLand Commercial Trust Presentation Apr 2020

$125m (4%)$75m (2%) $100m (2%)
$100m (2%)
$180m (4%)
$290m (7%)
$43m (1%)
$148m (4%)
$378m (9%)
$300m (7%)
$300m (7%)
$75m (2%)
$300m (7%)
$90m (2%)
$165m (4%)$72m (2%)
$108m (3%)
$31m (1%)
$60m (1%)
$200m (5%)
$102m (2%)
$50m (1%)
$315m (8%)
$103m (2%)
$77m (2%)
$200m (5%)
$174m (4%)
2020 2021 2022 2023 2024 2025 2026 2027
Proactive capital management
Debt Maturity Profile as at 31 Mar 2020S$ million (% of total borrowings)
S$600 million green loans obtained, increasing percentage of sustainability funding
22
Bank facilities
in place to
refinance
In advanced
negotiation for
refinancing

85% of borrowings on fixed rate provides certainty of interest expense
23CapitaLand Commercial Trust Presentation April 2020
Borrowings
on Fixed
Rate 85%
Borrowings
on Floating
Rate 15%
As at 31 March 2020
Proforma impact on: Assuming +0.5% p.a.
increase in interest rate
Estimated additional annual
Interest expense+$3.1 million p.a.
Annualised YTD Mar 2020 DPU-0.08 cents
(1.2% of annualised YTD Mar 2020)
CapitaGreen, Singapore
4. Steady Portfolio Performance
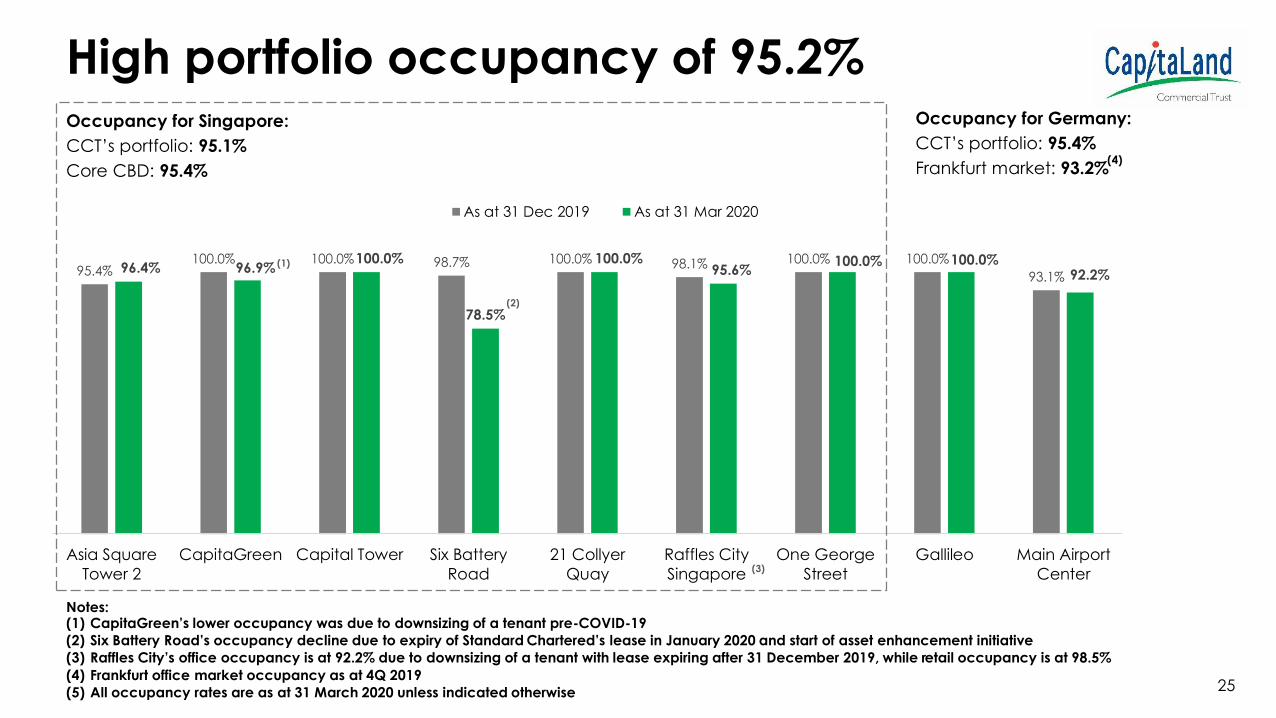
95.4%100.0% 100.0% 98.7% 100.0% 98.1% 100.0% 100.0%
93.1%96.4% 96.9%
100.0%
78.5%
100.0%95.6%
100.0% 100.0%92.2%
Asia Square
Tower 2
CapitaGreen Capital Tower Six Battery
Road
21 Collyer
Quay
Raffles City
Singapore
One George
Street
Gallileo Main Airport
Center
As at 31 Dec 2019 As at 31 Mar 2020
High portfolio occupancy of 95.2%Occupancy for Singapore:
CCT’s portfolio: 95.1%
Core CBD: 95.4%
Notes:(1) CapitaGreen’s lower occupancy was due to downsizing of a tenant pre-COVID-19
(2) Six Battery Road’s occupancy decline due to expiry of Standard Chartered’s lease in January 2020 and start of asset enhancement initiative
(3) Raffles City’s office occupancy is at 92.2% due to downsizing of a tenant with lease expiring after 31 December 2019, while retail occupancy is at 98.5%
(4) Frankfurt office market occupancy as at 4Q 2019
(5) All occupancy rates are as at 31 March 2020 unless indicated otherwise
(3)
Occupancy for Germany:
CCT’s portfolio: 95.4%
Frankfurt market: 93.2%(4)
(2)
(1)
25
26
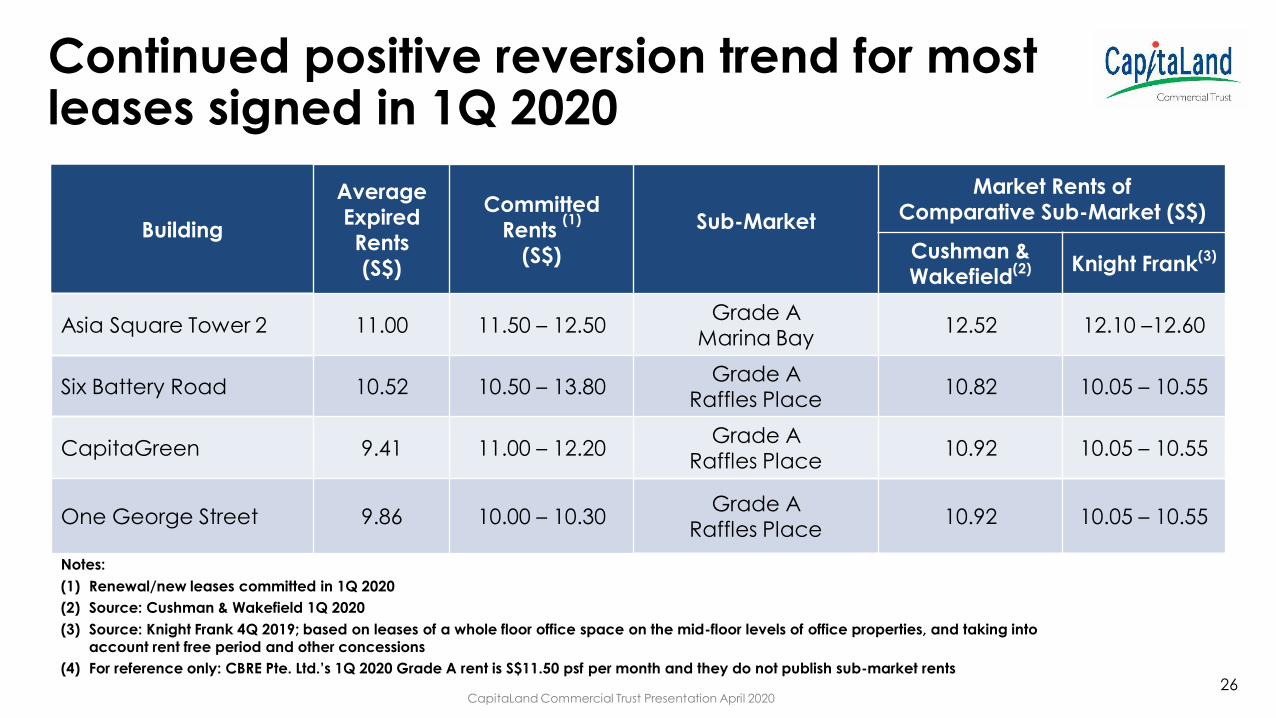
Continued positive reversion trend for most leases signed in 1Q 2020
Building
Average Expired Rents (S$)
Committed Rents
(1)
(S$)
Sub-Market
Market Rents ofComparative Sub-Market (S$)
Cushman & Wakefield
(2) Knight Frank(3)
Asia Square Tower 2 11.00 11.50 – 12.50Grade A
Marina Bay12.52 12.10 –12.60
Six Battery Road 10.52 10.50 – 13.80Grade A
Raffles Place10.82 10.05 – 10.55
CapitaGreen 9.41 11.00 – 12.20Grade A
Raffles Place10.92 10.05 – 10.55
One George Street 9.86 10.00 – 10.30 Grade A
Raffles Place10.92 10.05 – 10.55
Notes:
(1) Renewal/new leases committed in 1Q 2020
(2) Source: Cushman & Wakefield 1Q 2020
(3) Source: Knight Frank 4Q 2019; based on leases of a whole floor office space on the mid-floor levels of office properties, and taking into
account rent free period and other concessions
(4) For reference only: CBRE Pte. Ltd.’s 1Q 2020 Grade A rent is S$11.50 psf per month and they do not publish sub-market rents
CapitaLand Commercial Trust Presentation April 2020
27
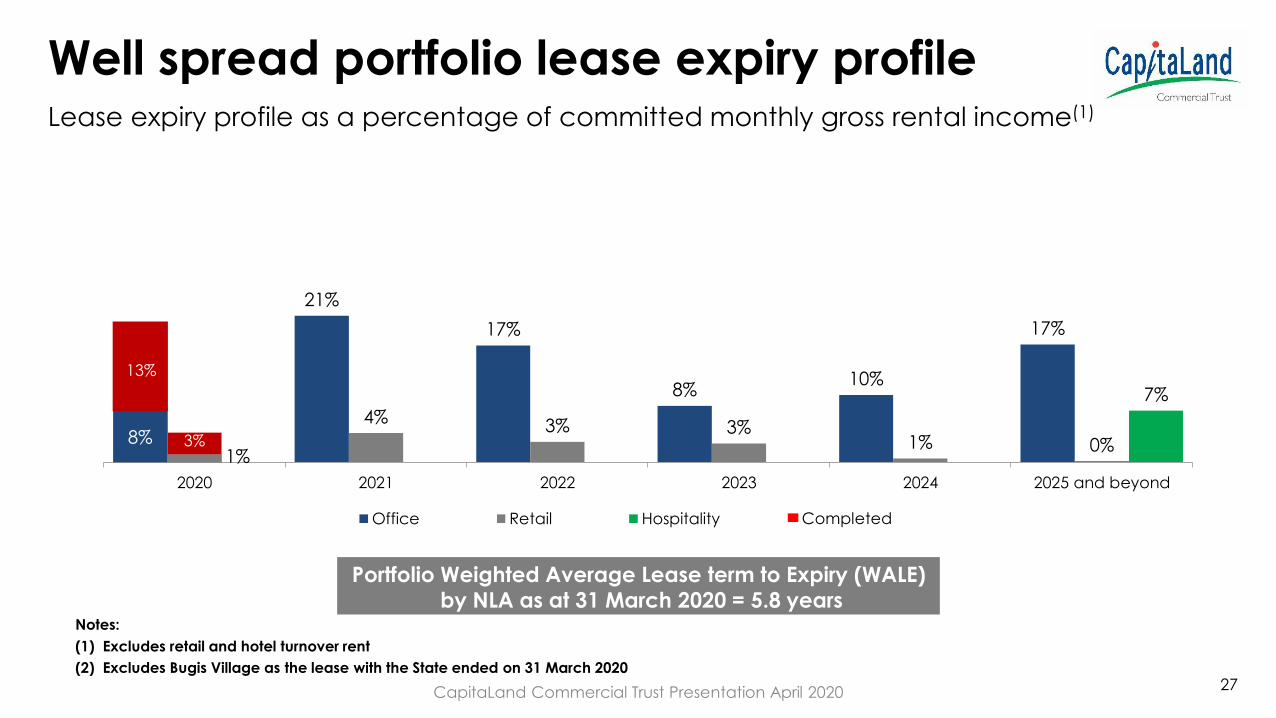
Well spread portfolio lease expiry profile
Notes:
(1) Excludes retail and hotel turnover rent
(2) Excludes Bugis Village as the lease with the State ended on 31 March 2020
Portfolio Weighted Average Lease term to Expiry (WALE)by NLA as at 31 March 2020 = 5.8 years
8%
21%
17%
8%10%
17%
1%
4% 3% 3%1% 0%
7%
2020 2021 2022 2023 2024 2025 and beyond
Office Retail Hospitality Completed
13%
3%
Lease expiry profile as a percentage of committed monthly gross rental income(1)
CapitaLand Commercial Trust Presentation April 2020

10%
26%
21%
10%12%
21%
10%
23%20%
8%
13%
26%
2020 2021 2022 2023 2024 2025 and beyond
Monthly Gross Rental Income Committed Net Lettable Area Completed
15%16%
28
Committed two-third of expiring 2020 leases
Notes:(1) Includes Gallileo and Main Airport Center’s leases(2) Includes WeWork’s 7-year lease for 21 Collyer Quay which is expected to commence in 2Q 2021(3) Includes JP Morgan’s lease which constitutes 4% of total office NLA(4) Excludes Bugis Village as the lease with the State ended on 31 March 2020
Office WALE by NLA as at 31 March 2020 = 3.7 years
Total Office Portfolio(1) Lease Expiry Profile as at 31 March 2020
(2)
(3)
Proactive engagement with tenants to manage their requirements
CapitaLand Commercial Trust Presentation April 2020
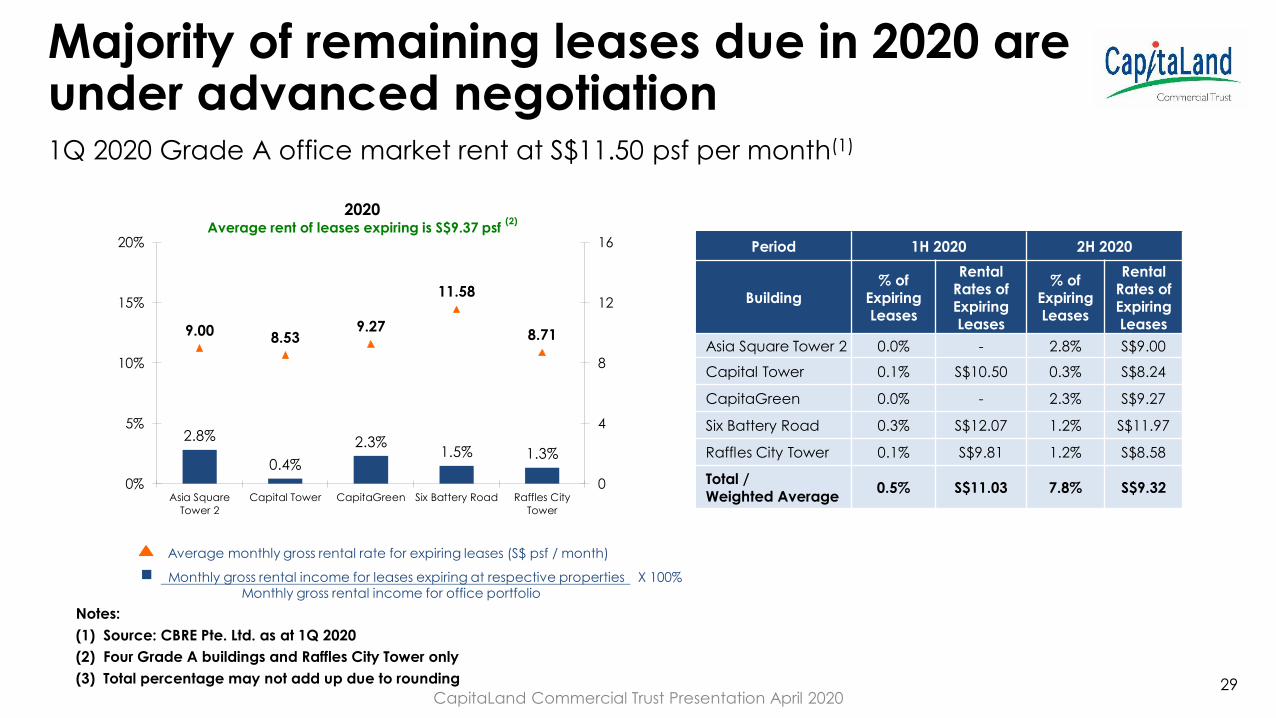
29
Notes:
(1) Source: CBRE Pte. Ltd. as at 1Q 2020
(2) Four Grade A buildings and Raffles City Tower only
(3) Total percentage may not add up due to rounding
Monthly gross rental income for leases expiring at respective properties X 100%Monthly gross rental income for office portfolio
Average monthly gross rental rate for expiring leases (S$ psf / month)
1Q 2020 Grade A office market rent at S$11.50 psf per month(1)
2.8%
0.4%
2.3%1.5% 1.3%
9.008.53
9.27
11.58
8.71
0
4
8
12
16
0%
5%
10%
15%
20%
Asia Square
Tower 2
Capital Tower CapitaGreen Six Battery Road Raffles City
Tower
2020Average rent of leases expiring is S$9.37 psf
(2)
Period 1H 2020 2H 2020
Building% of
Expiring Leases
Rental Rates of Expiring Leases
% of Expiring Leases
Rental Rates of Expiring Leases
Asia Square Tower 2 0.0% - 2.8% S$9.00
Capital Tower 0.1% S$10.50 0.3% S$8.24
CapitaGreen 0.0% - 2.3% S$9.27
Six Battery Road 0.3% S$12.07 1.2% S$11.97
Raffles City Tower 0.1% S$9.81 1.2% S$8.58
Total / Weighted Average
0.5% S$11.03 7.8% S$9.32
Majority of remaining leases due in 2020 are under advanced negotiation
CapitaLand Commercial Trust Presentation April 2020

30
Continue to proactively manage major leases expiring in the next 2 years
Note:
(1) Four Grade A buildings and Raffles City Tower only
Monthly gross rental income for leases expiring at respective properties X 100%Monthly gross rental income for office portfolio
Average monthly gross rental rate for expiring leases (S$ psf / month)
5.2% 5.0%
8.3%
4.0%
2.0%
13.74
8.27
11.50 11.23
8.43
0
4
8
12
16
0%
5%
10%
15%
20%
Asia Square
Tower 2
Capital Tower CapitaGreen Six Battery Road Raffles City
Tower
2021Average rent of leases expiring is S$10.68 psf
(1)
5.4% 5.1%
3.0%3.7%
1.0%
11.01
6.14
11.5112.22
9.05
0
4
8
12
16
0%
5%
10%
15%
20%
Asia Square
Tower 2
Capital Tower CapitaGreen Six Battery Road Raffles City
Tower
2022Average rent of leases expiring is S$9.14 psf
(1)
CapitaLand Commercial Trust Presentation April 2020
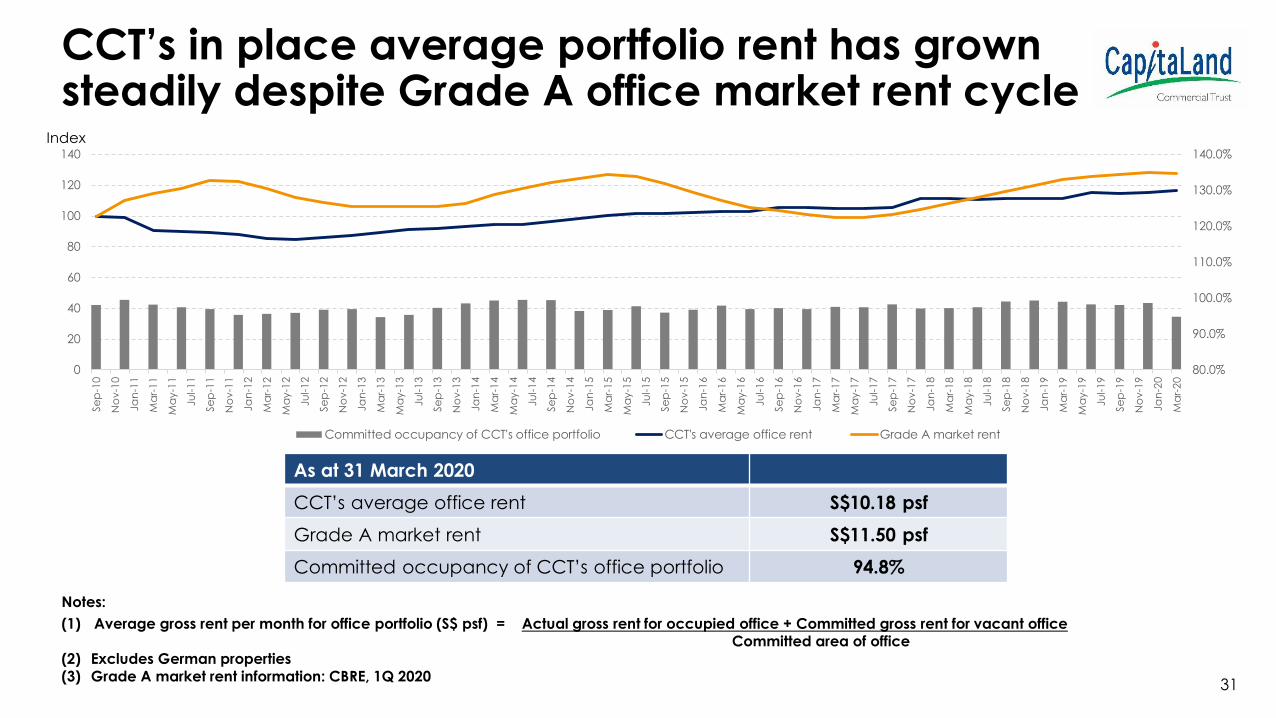
CCT’s in place average portfolio rent has grown steadily despite Grade A office market rent cycle
Index
Notes:
(1) Average gross rent per month for office portfolio (S$ psf) = Actual gross rent for occupied office + Committed gross rent for vacant officeCommitted area of office
(2) Excludes German properties
(3) Grade A market rent information: CBRE, 1Q 2020
As at 31 March 2020
CCT’s average office rent S$10.18 psf
Grade A market rent S$11.50 psf
Committed occupancy of CCT’s office portfolio 94.8%
0
20
40
60
80
100
120
140
Se
p-1
0
No
v-1
0
Ja
n-1
1
Ma
r-1
1
Ma
y-1
1
Ju
l-1
1
Se
p-1
1
No
v-1
1
Ja
n-1
2
Ma
r-1
2
Ma
y-1
2
Ju
l-1
2
Se
p-1
2
No
v-1
2
Ja
n-1
3
Ma
r-1
3
Ma
y-1
3
Ju
l-1
3
Se
p-1
3
No
v-1
3
Ja
n-1
4
Ma
r-1
4
Ma
y-1
4
Ju
l-1
4
Se
p-1
4
No
v-1
4
Ja
n-1
5
Ma
r-1
5
Ma
y-1
5
Ju
l-1
5
Se
p-1
5
No
v-1
5
Ja
n-1
6
Ma
r-1
6
Ma
y-1
6
Ju
l-1
6
Se
p-1
6
No
v-1
6
Ja
n-1
7
Ma
r-1
7
Ma
y-1
7
Ju
l-1
7
Se
p-1
7
No
v-1
7
Ja
n-1
8
Ma
r-1
8
Ma
y-1
8
Ju
l-1
8
Se
p-1
8
No
v-1
8
Ja
n-1
9
Ma
r-1
9
Ma
y-1
9
Ju
l-1
9
Se
p-1
9
No
v-1
9
Ja
n-2
0
Ma
r-2
0
80.0%
90.0%
100.0%
110.0%
120.0%
130.0%
140.0%
Committed occupancy of CCT's office portfolio CCT's average office rent Grade A market rent
31

Banking, 23%
Financial Services, 13%
Energy, Commodities,
Maritime and Logistics, 9%
Business Consultancy, IT, Media
and Telecommunications, 9%
Travel and Hospitality, 9%
Real Estate and Property
Services, 7%
Retail Products and Services,
7%
Insurance, 6%
Food and Beverage, 5%
Manufacturing and
Distribution, 5%
Legal, 3%
Education and Services, 2%
Government, 2%
Notes:
(1) Based on committed monthly gross rental income of tenants as at 31 March 2020, including CCT’s 60.0% interest in Raffles City Singapore, 50.0% interest in One George Street and 94.9% interest in Gallileo and Main Airport Center (with effect from 18 September 2019), Frankfurt; and excluding retail turnover rent
(2) Excludes WeWork Singapore as lease expected to commence in 2Q 2021
(3) Excludes Bugis Village as the lease with the State ended on 31 March 2020
Committed
Monthly Gross
Rental Income as
at 31 March 2020
Diverse tenant mix in CCT’s portfolio
(2)
(Flex space operators – 4%)
32

8%
6%
4% 4% 4%3%
3% 2% 2% 2%
RC Hotels (Pte)
Ltd
The Hongkong
and Shanghai
Banking
Corporation
Limited
Commerzbank
AG
GIC Private
Limited
Mizuho Bank, Ltd JPMorgan Chase
Bank, N.A.
CapitaLand
Group
Allianz
Technology SE,
Singapore Branch
Al-Futtaim Group Mitsui Group
33
Top 10 tenants contribute 37% of monthly gross rental income
(1) (2) (1)
Based on monthly gross rental income as at 31 March 2020, excluding retail turnover rent
Notes:
(1) Based on CCT’s 60.0% interest in Raffles City Singapore
(2) Based on CCT’s 94.9% interest in Gallileo, Frankfurt
(3) Al-Futtaim Group owns Robinsons and other brands at Raffles City Singapore
(4) Total percentage may not add up due to rounding
(3)
CapitaLand Commercial Trust Presentation April 2020

Looking ahead: 2020
Portfolio
• Proactive asset management and leasing to drive organic growth
• Partial closure of Six Battery Road from 1Q 2020 and complete closure of 21 Collyer Quay by May 2020 for refurbishment
Real Estate Markets
• Singapore: New supply remains limited while vacancy is low
• Frankfurt: Healthy demand while new supply is being taken up
Steering through COVID-19
• Strong balance sheet
• Active lease management
• Refurbishing our assets to be ready when market recovers
34CapitaLand Commercial Trust Presentation April 2020

Gallileo, Frankfurt, Germany
5. Market Information
1.3
0.5 0.4 0.40.1
-0.1
0.9
-0.7
1.31.4
1.6
2.2
0.2
0.6
0.3
-0.03
1.9 1.9
0.7
0.2
0.9
0.70.8
1.9
0.0 0.0
2.7
0.4
-1.4
-0.8
0.8
1.51.7
1.4
-0.1
-0.6
1.61.8
1.4
1.0
0.2 0.30.2
0.7
1.7
0.8 0.9
-2.0
-1.5
-1.0
-0.5
0.0
0.5
1.0
1.5
2.0
2.5
3.0
2000 2001 2002 2003 2004 2005 2006 2007 2008 2009 2010 2011 2012 2013 2014 2015 2016 2017 2018 2019 1Q
2020
2020F 2021F 2022F 2023F 2024F
sq f
t m
illio
n
Net Supply Net Demand
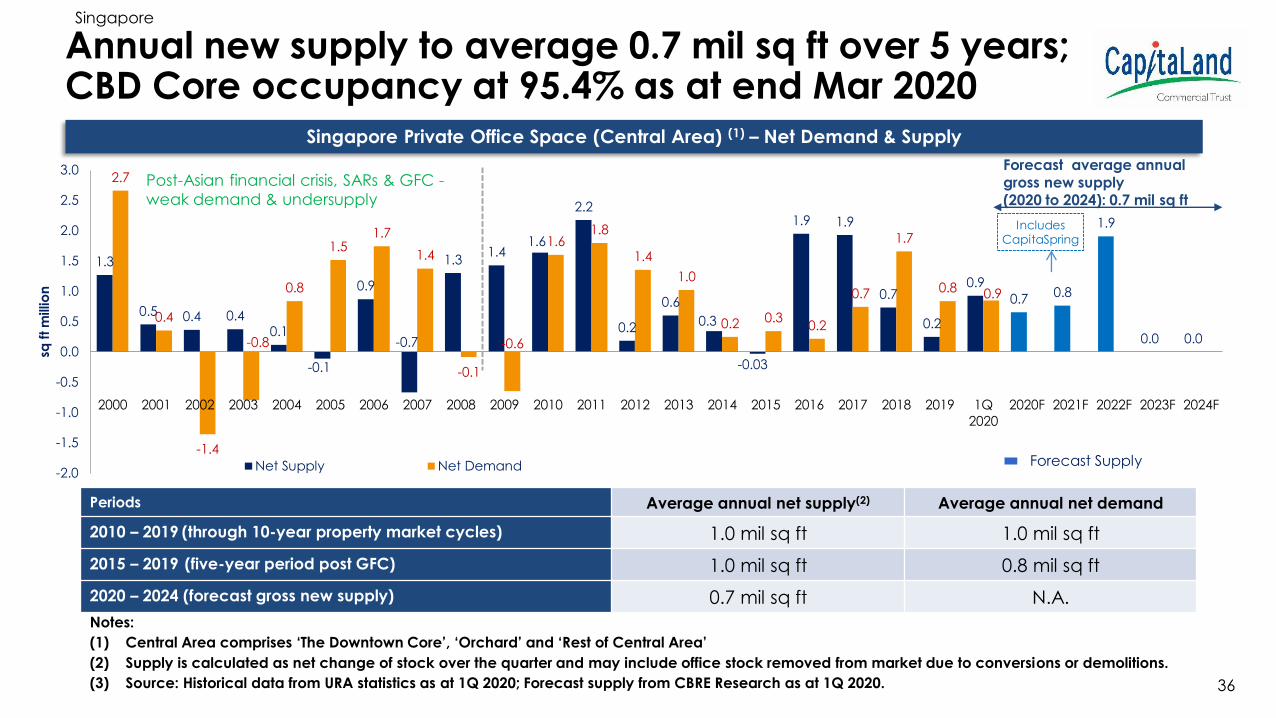
Annual new supply to average 0.7 mil sq ft over 5 years; CBD Core occupancy at 95.4% as at end Mar 2020
Singapore
Forecast average annual gross new supply (2020 to 2024): 0.7 mil sq ft
Notes:
(1) Central Area comprises ‘The Downtown Core’, ‘Orchard’ and ‘Rest of Central Area’
(2) Supply is calculated as net change of stock over the quarter and may include office stock removed from market due to conversions or demolitions.
(3) Source: Historical data from URA statistics as at 1Q 2020; Forecast supply from CBRE Research as at 1Q 2020.
Singapore Private Office Space (Central Area) (1) – Net Demand & Supply
Forecast Supply
Periods Average annual net supply(2) Average annual net demand
2010 – 2019 (through 10-year property market cycles) 1.0 mil sq ft 1.0 mil sq ft
2015 – 2019 (five-year period post GFC) 1.0 mil sq ft 0.8 mil sq ft
2020 – 2024 (forecast gross new supply) 0.7 mil sq ft N.A.
Post-Asian financial crisis, SARs & GFC -
weak demand & undersupply
Includes CapitaSpring
36

Notes:
(1) According to BT Report dated 13 July 2018, about 50,000 sq ft has been committed.
(2) CapitaSpring reported committed take-up for 34.8% of the development’s office NLA as at 31 December 2019
(3) Sources: CBRE Research and respective media reports
Known future office supply in Central Area (2020 – 2022)
Expected
completion
Proposed Office Projects Location NLA (sq ft)
1H 2020 79 Robinson Road(1) Robinson Road 514,000
1H 2020 Afro-Asia I-Mark Shenton Way 140,000
Subtotal (2020): 654,000
1H 2021 CapitaSpring(2) Raffles Place 635,000
1H 2021 Hub Synergy Point Redevelopment Anson Road 128,500
Subtotal (2021): 763,500
2022 Central Boulevard Towers Raffles Place/Marina 1,258,000
2022 Guoco Midtown City Hall 650,000
Subtotal (2022): 1,908,000
TOTAL FORECAST SUPPLY (2020-2022) 3,325,500
Total forecast supply excluding strata offices 3,325,500
Singapore
37
Construction slippages may happen due to supply chain disruption and restriction of labour
movement
CapitaLand Commercial Trust Presentation April 2020
$0
$2
$4
$6
$8
$10
$12
$14
$16
$18
$20
1Q02
2Q02
3Q02
4Q02
1Q03
2Q03
3Q03
4Q03
1Q04
2Q04
3Q04
4Q04
1Q05
2Q05
3Q05
4Q05
1Q06
2Q06
3Q06
4Q06
1Q07
2Q07
3Q07
4Q07
1Q08
2Q08
3Q08
4Q08
1Q09
2Q09
3Q09
4Q09
1Q10
2Q10
3Q10
4Q10
1Q11
2Q11
3Q11
4Q11
1Q12
2Q12
3Q12
4Q12
1Q13
2Q13
3Q13
4Q13
1Q14
2Q14
3Q14
4Q14
1Q15
2Q15
3Q15
4Q15
1Q16
2Q16
3Q16
4Q16
1Q17
2Q17
3Q17
4Q17
1Q18
2Q18
3Q18
4Q18
1Q19
2Q19
3Q19
4Q19
1Q20
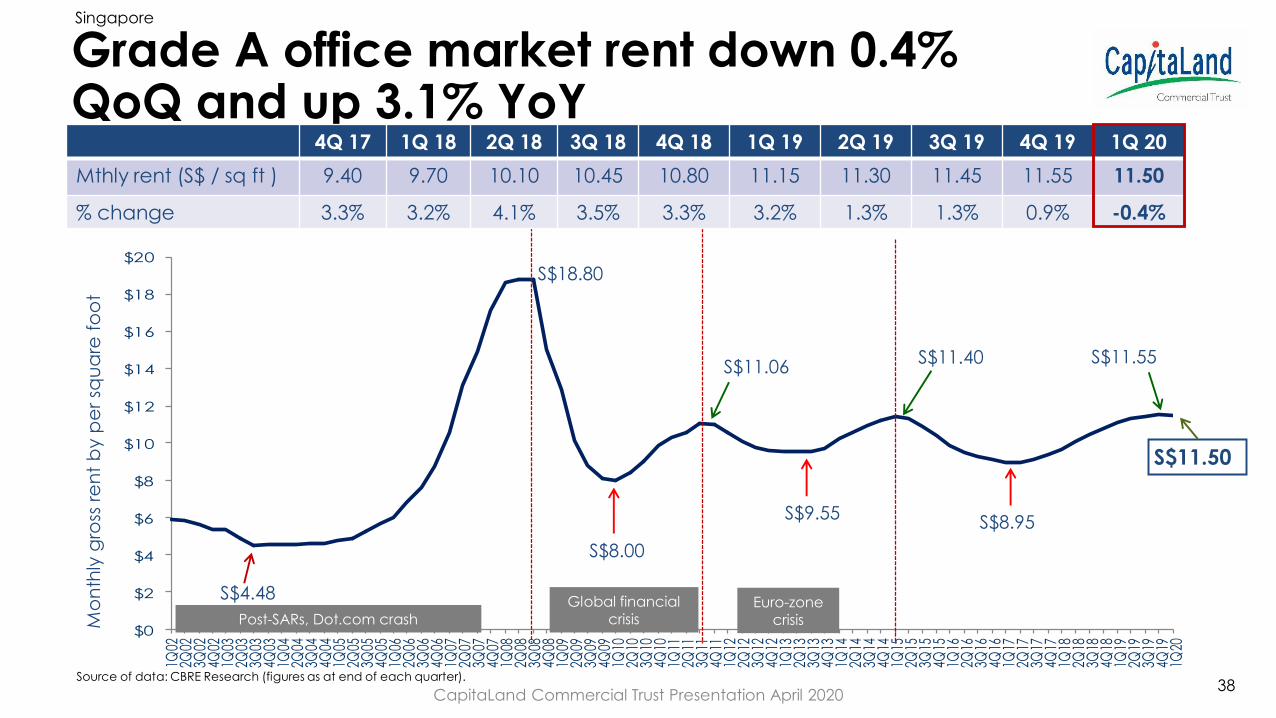
Grade A office market rent down 0.4% QoQ and up 3.1% YoY
S$18.80
S$4.48
S$11.50
Global financial
crisisPost-SARs, Dot.com crash
S$8.00
Euro-zone crisisM
on
thly
gro
ss r
en
t b
y p
er
squ
are
fo
ot
S$11.06
4Q 17 1Q 18 2Q 18 3Q 18 4Q 18 1Q 19 2Q 19 3Q 19 4Q 19 1Q 20
Mthly rent (S$ / sq ft ) 9.40 9.70 10.10 10.45 10.80 11.15 11.30 11.45 11.55 11.50
% change 3.3% 3.2% 4.1% 3.5% 3.3% 3.2% 1.3% 1.3% 0.9% -0.4%
Source of data: CBRE Research (figures as at end of each quarter).
S$9.55
S$11.40
S$8.95
Singapore
S$11.55
38CapitaLand Commercial Trust Presentation April 2020

Frankfurt and two submarkets take-up and supply
As at end-2019 Total stock Percentage
Overall Frankfurt Office 11.42 mil sqm 100.0%
Banking District 1.57 mil sqm 13.7%
Airport Office 0.72 mil sqm 6.3%
Rest of Frankfurt Office 9.13 mil sqm 80.0%
1,000 sqm Vacancy Rate (%)1,000 sqm
1,000 sqm
Vacancy Rate (%)
Vacancy Rate (%)
Source: CBRE Research, 2019
6.8%
0.0%
2.0%
4.0%
6.0%
8.0%
10.0%
12.0%
14.0%
16.0%
0
100
200
300
400
500
600
700
800
2015 2016 2017 2018 2019
Overall Frankfurt Office
Frankfurt Office New Supply Frankfurt Office Take-up Frankfurt Office Vacancy Rate
4.6%
0.0%
2.0%
4.0%
6.0%
8.0%
10.0%
12.0%
14.0%
16.0%
0
100
200
300
400
500
600
700
800
2015 2016 2017 2018 2019
Banking District
Banking District New Supply Banking District Take-up
Banking District Vacancy Rate
3.2%
0.0%
2.0%
4.0%
6.0%
8.0%
10.0%
12.0%
14.0%
16.0%
0
100
200
300
400
500
600
700
800
2015 2016 2017 2018 2019
Airport Office District
Airport Office District New Supply Airport Office District Take-upAirport Office District Vacancy Rate 39
Germany
CapitaLand Commercial Trust Presentation April 2020
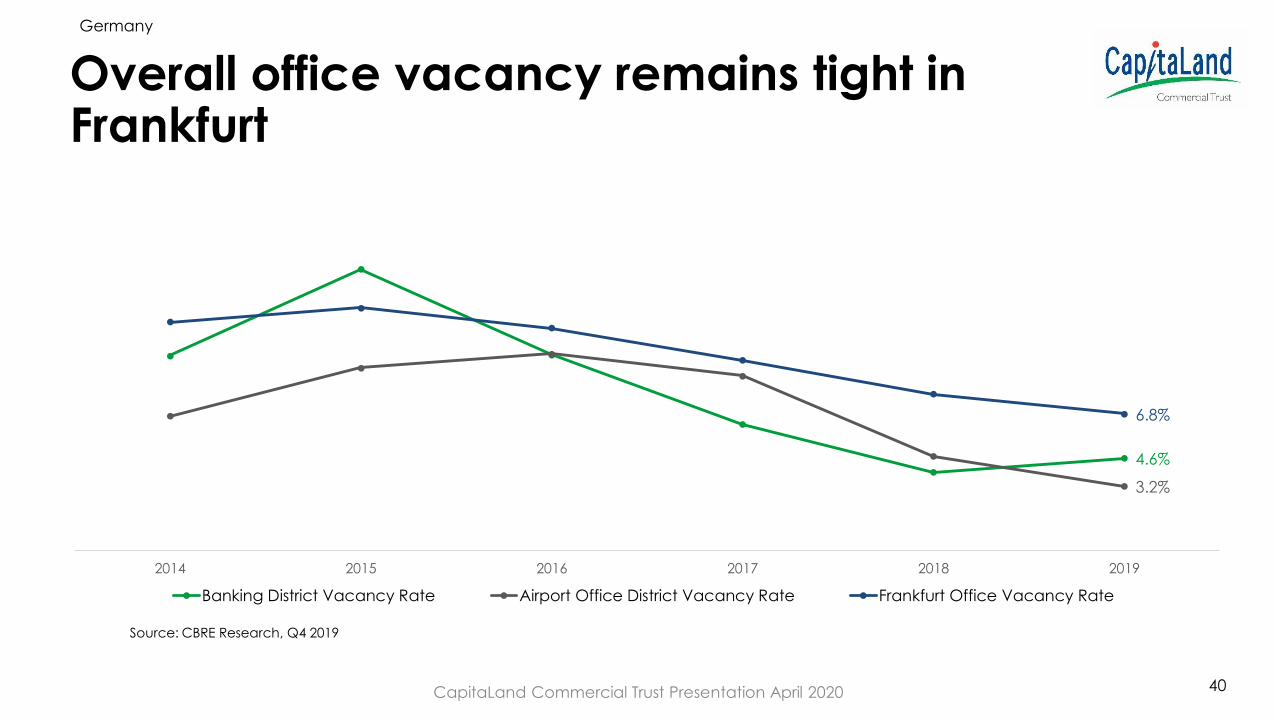
Overall office vacancy remains tight in Frankfurt
Germany
Source: CBRE Research, Q4 2019
4.6%
3.2%
6.8%
2014 2015 2016 2017 2018 2019
Banking District Vacancy Rate Airport Office District Vacancy Rate Frankfurt Office Vacancy Rate
40CapitaLand Commercial Trust Presentation April 2020
0
50
100
150
200
250
300
2012 2013 2014 2015 2016 2017 2018 2019 2020F 2021F
Banking District New Supply Airport Office District New Supply Rest of Frankfurt New Supply
Forecast New Supply
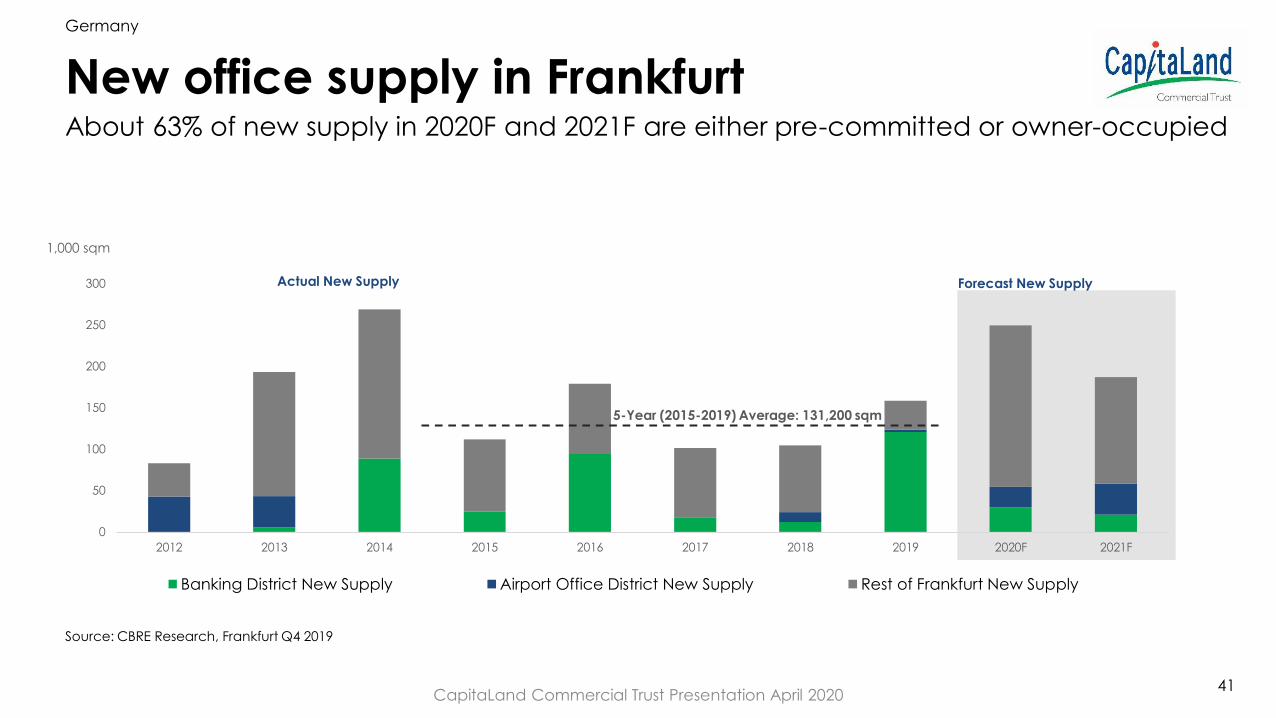
New office supply in Frankfurt
Germany
1,000 sqm
Actual New Supply
5-Year (2015-2019) Average: 131,200 sqm
Source: CBRE Research, Frankfurt Q4 2019
About 63% of new supply in 2020F and 2021F are either pre-committed or owner-occupied
41CapitaLand Commercial Trust Presentation April 2020
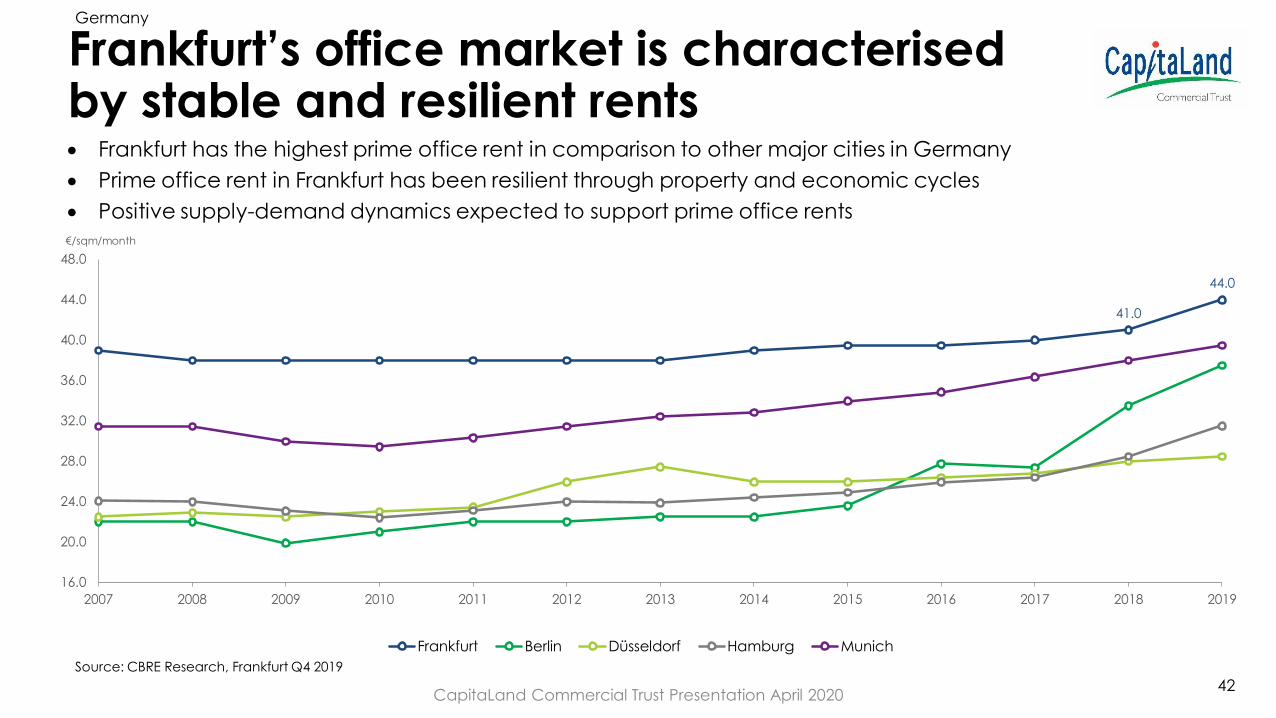
• Frankfurt has the highest prime office rent in comparison to other major cities in Germany
• Prime office rent in Frankfurt has been resilient through property and economic cycles
• Positive supply-demand dynamics expected to support prime office rents
€/sqm/month
Source: CBRE Research, Frankfurt Q4 2019
Frankfurt’s office market is characterisedby stable and resilient rents
Germany
41.0
44.0
16.0
20.0
24.0
28.0
32.0
36.0
40.0
44.0
48.0
2007 2008 2009 2010 2011 2012 2013 2014 2015 2016 2017 2018 2019
Frankfurt Berlin Düsseldorf Hamburg Munich
42CapitaLand Commercial Trust Presentation April 2020
BC
A
D
Niederrad
Westend
Banking
District
Frankfurt CBD
South
West City
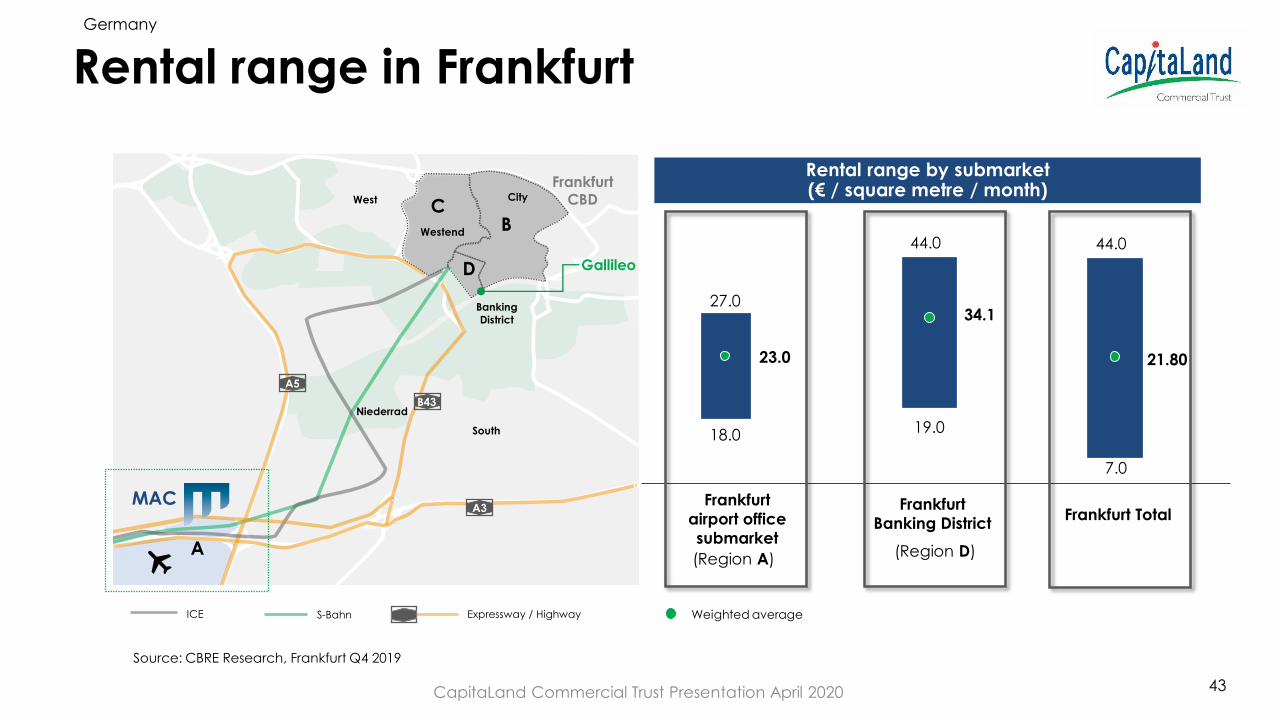
Rental range by submarket (€ / square metre / month)
Frankfurt
airport office
submarket
(Region A)
27.0
18.0
23.0
Frankfurt
Banking District
(Region D)
44.0
19.0
34.1
Weighted average
Gallileo
MAC
S-BahnICE Expressway / Highway
A5
A3
B43
Rental range in FrankfurtGermany
Source: CBRE Research, Frankfurt Q4 2019
Frankfurt Total
44.0
7.0
21.80
43CapitaLand Commercial Trust Presentation April 2020
CapitaSpring, Singapore
6. Committed to Sustainability
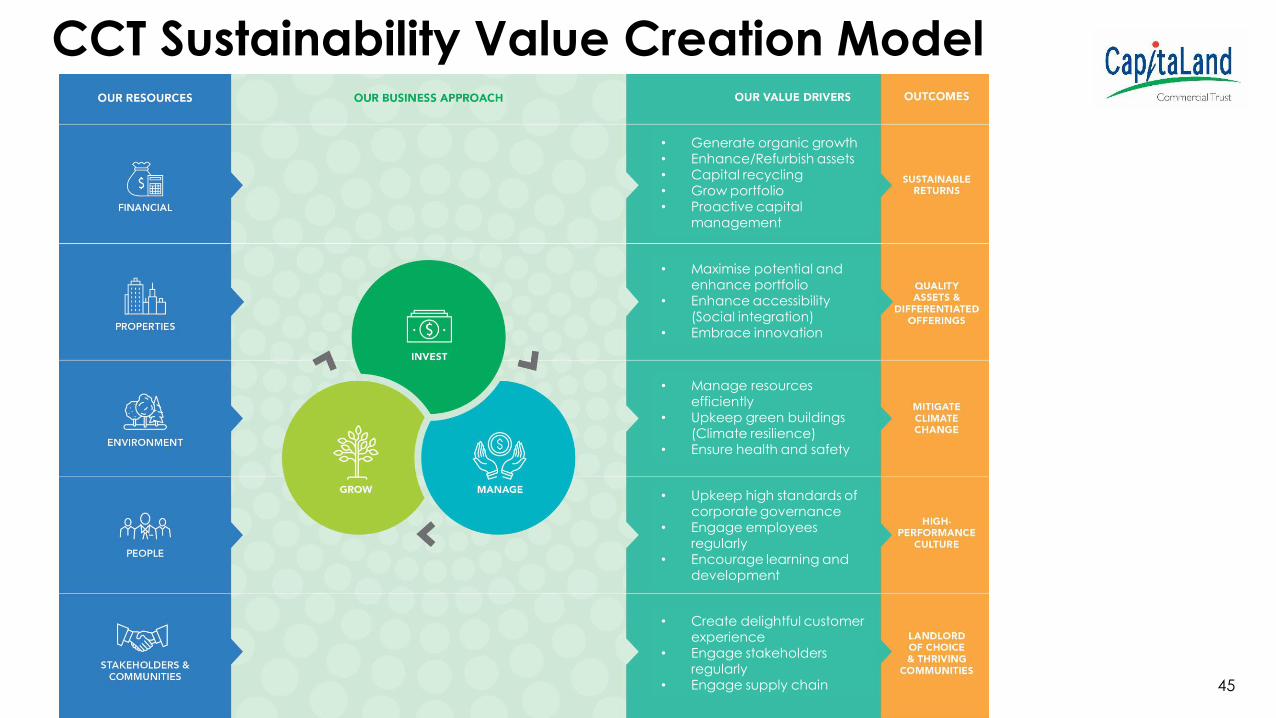
CCT Sustainability Value Creation Model
• Generate organic growth• Enhance/Refurbish assets• Capital recycling• Grow portfolio• Proactive capital
management
• Maximise potential and enhance portfolio
• Enhance accessibility (Social integration)
• Embrace innovation
• Manage resources efficiently
• Upkeep green buildings (Climate resilience)
• Ensure health and safety
• Upkeep high standards of corporate governance
• Engage employees regularly
• Encourage learning and development
• Create delightful customer experience
• Engage stakeholders regularly
• Engage supply chain 45

Six Battery Road, Singapore
7. Value creation strategy for sustainable returns
I. Asset enhancement initiatives
II. Development

CCT’s value creation strategy
Enhance value and positioning of assets to
stay competitive
Manage debt maturity profile to enhance financial flexibility
Unlock value from an asset at optimal stage of life cycle
Optimise asset value and performance
Acquire
quality
assets with
growth
potential in
identified
markets 47
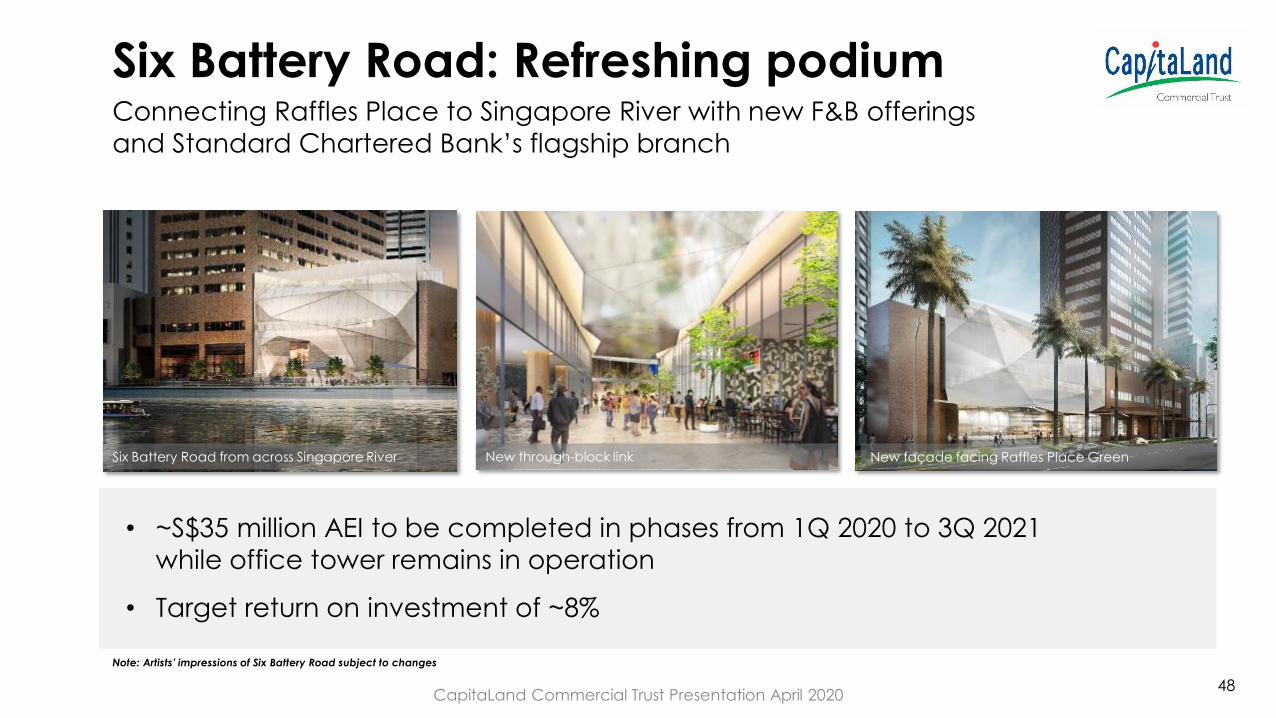
Six Battery Road: Refreshing podium
New façade facing Raffles Place GreenNew through-block linkSix Battery Road from across Singapore River
Note: Artists’ impressions of Six Battery Road subject to changes
• ~S$35 million AEI to be completed in phases from 1Q 2020 to 3Q 2021
while office tower remains in operation
• Target return on investment of ~8%
Connecting Raffles Place to Singapore River with new F&B offerings
and Standard Chartered Bank’s flagship branch
48CapitaLand Commercial Trust Presentation April 2020
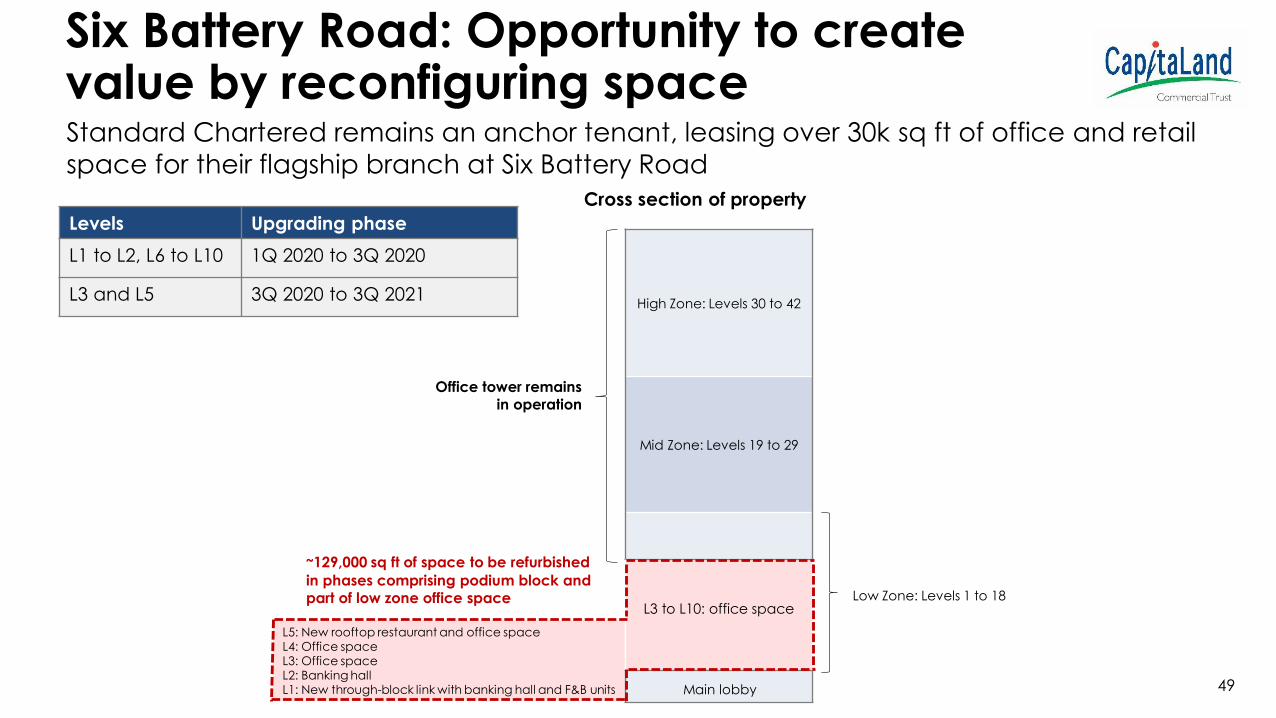
Six Battery Road: Opportunity to create value by reconfiguring space
L5: New rooftop restaurant and office spaceL4: Office spaceL3: Office spaceL2: Banking hallL1: New through-block link with banking hall and F&B units
High Zone: Levels 30 to 42
Mid Zone: Levels 19 to 29
L3 to L10: office space
Main lobby
~129,000 sq ft of space to be refurbished
in phases comprising podium block and part of low zone office space
Office tower remains in operation
Cross section of property
Levels Upgrading phase
L1 to L2, L6 to L10 1Q 2020 to 3Q 2020
L3 and L5 3Q 2020 to 3Q 2021
Low Zone: Levels 1 to 18
Standard Chartered remains an anchor tenant, leasing over 30k sq ft of office and retail
space for their flagship branch at Six Battery Road
49

21 Collyer Quay: New occupier from early 2021 and upgrading during transitional downtime
• HSBC lease expires end April 2020
• Entire building leased to WeWorkSingapore for 7 years from 2Q 2021
21 Collyer Quay is on 999-year leasehold, NLA of approximately 200,000 sq ft
• ~S$45 million upgrading works:
✓ Capitalise on transitional downtime
✓ Entire building will be closed for upgrading from 2Q 2020 to 4Q 2020
✓ Works include enhancements to essential equipment, common and lettable areas and to achieve BCA Green Mark GoldPLUS
rating
✓ Target return on investment of ~9%
50CapitaLand Commercial Trust Presentation April 2020

CapitaSpring – new integrated development at Market StreetDescription 51-storey integrated development
comprising Grade A office, serviced
residence with 299 rooms, ancillary retail
and a food centre
Joint Venture Interest CCT (45%), CapitaLand (45%), Mitsubishi
Estate (10%)
Height 280m (on par with tallest buildings in Raffles
Place)
Title Leasehold expiring 31 Jan 2081 (remaining
61 years)
Site Area 65,700 sq ft
Total GFA 1,005,000 sq ft
Office NLA
Ancillary retail NLA
635,000 sq ft (34.8% pre-committed)
12,000 sq ft
Serviced residence 299 rooms to be managed by Ascott
Food Centre GFA 44,000 sq ft
Car Park About 350 lots
Target yield on cost 5.0%
Estimated Project Development
Expenditure
S$1.82 billion Artist’s impression of CapitaSpring; target completion in 1H 2021 51

CapitaSpring drawn down S$47.0 mil in 1Q 2020 – CCT’s 45.0% share amounts to S$21.2 mil
Notes:
(1) Glory Office Trust and Glory SR Trust have obtained borrowings amounting to S$1,180.0m (100% interest)
(2) Balance capital requirement until 2021
CapitaSpring - Development remains on track
for completion in 1H 2021
CCT’s 45% interestCCT’s 45% interest in
Glory Office Trust and
Glory SR Trust
Drawdown
as at Mar 2020Balance
(2)
Debt at Glory Office Trust
and Glory SR Trust(1) S$531.0m (S$377.6m) S$153.4m
Equity inclusive of
unitholder’s loanS$288.0m (S$245.3m) S$42.7m
Total S$819.0m (S$622.9m) S$196.1m
52CapitaLand Commercial Trust Presentation April 2020
Thank youFor enquiries, please contact: Ms Ho Mei Peng , Head, Investor Relations, Direct: (65) 6713 3668
Email: [email protected]
CapitaLand Commercial Trust Management Limited (http://www.cct.com.sg)168 Robinson Road, #28-00 Capital Tower, Singapore 068912
Tel: (65) 6713 2888; Fax: (65) 6713 2999
Raffles City Singapore
8. Additional Information

Portfolio diversification with income contribution from 10 properties
Based on net property income (“NPI”) for 1Q 2020; including NPI from CCT’s 60.0% interest in Raffles City Singapore, 50.0% interest in One George Street and 94.9% interest in Gallileo and Main Airport Center, Frankfurt
Raffles City Singapore and six Grade A offices contributed 89% of Portfolio NPI
Raffles City Singapore
(60%), 23%
Asia Square Tower 2, 19%
CapitaGreen, 17%
Capital Tower, 12%
Six Battery Road,
9%
21 Collyer Quay,
6%
Galilleo, Frankfurt
(94.9%), 5%
One George Street
(50%), 4%
Main Airport Center
(94.9%), 4%Bugis Village, 1%
Net Property
Income
1Q 2020
55CapitaLand Commercial Trust Presentation April 2020

56
Singapore portfolio occupancy of 95.1%
SingaporeCCT Committed Occupancy(1) Market Occupancy Level
(2)
1Q 2020 4Q 2019 1Q 2020 4Q 2019
Grade A office 94.7% 98.6% 97.6% 96.1%
Portfolio 95.1% 98.6% 95.4% 95.8%
(2)(3)
Notes:
(1) Exclude Bugis Village with effect from 2Q 2019 and German properties
(2) Source: CBRE 1Q 2020
(3) Source: URA 1Q 2020
CapitaLand Commercial Trust Presentation April 2020
95.1%
98.2%
96.0%95.3%
99.4%
97.0%98.1% 97.8% 97.3%
99.1%
95.1%
87.5% 87.9% 88.3%
90.8%90.0% 89.8%
90.8%
88.4%87.5%
88.2%89.0%
92.4%
94.4%
90.7%
93.2%
95.7% 96.1%95.1% 95.6%
94.1%95.4% 95.4%
1Q 2Q 3Q 4Q 1Q 2Q 3Q 4Q 1Q 2Q 3Q 4Q 1Q 2Q 3Q 4Q 1Q 2Q 3Q 4Q 1Q 2Q 3Q 4Q 1Q 2Q 3Q 4Q 1Q 2Q 3Q 4Q 1Q 2Q 3Q 4Q 1Q 2Q 3Q 4Q 1Q
2010 2011 2012 2013 2014 2015 2016 2017 2018 2019 2020
CCT's Committed Occupancy Since Inception
CCT URA CBRE's Core CBD Occupancy Rate
Notes:
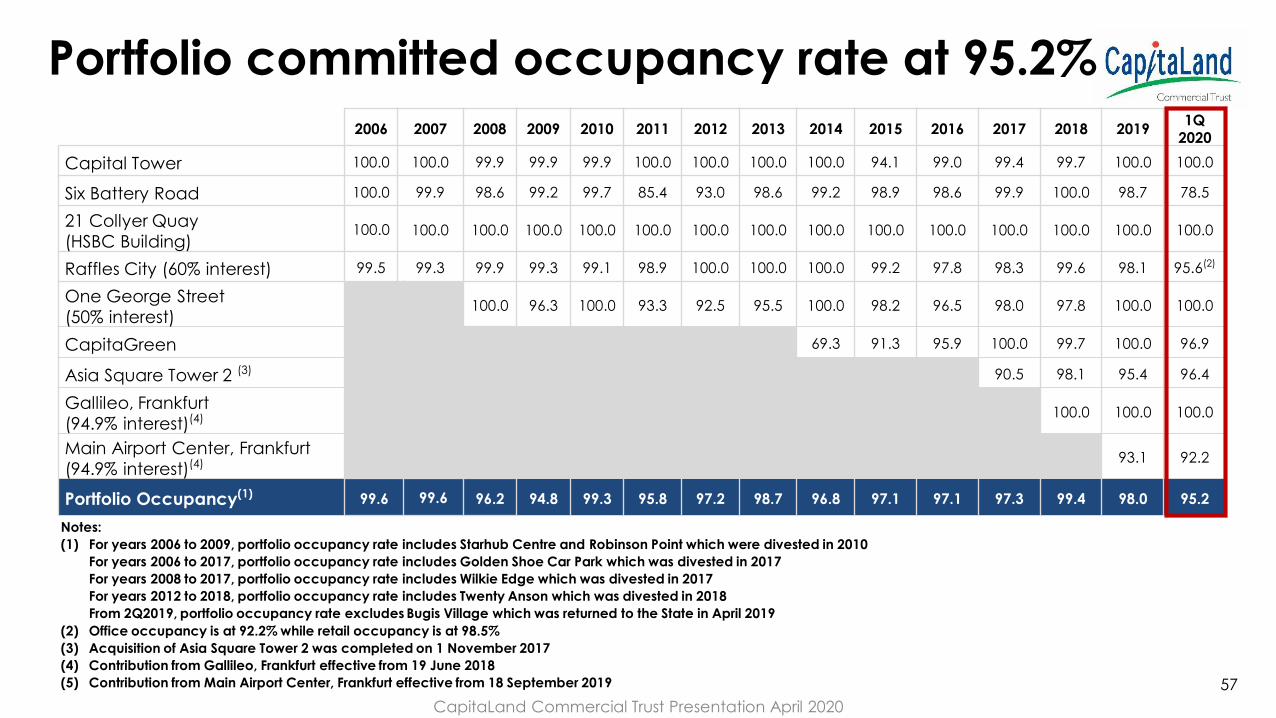
(1) For years 2006 to 2009, portfolio occupancy rate includes Starhub Centre and Robinson Point which were divested in 2010
For years 2006 to 2017, portfolio occupancy rate includes Golden Shoe Car Park which was divested in 2017
For years 2008 to 2017, portfolio occupancy rate includes Wilkie Edge which was divested in 2017
For years 2012 to 2018, portfolio occupancy rate includes Twenty Anson which was divested in 2018
From 2Q2019, portfolio occupancy rate excludes Bugis Village which was returned to the State in April 2019
(2) Office occupancy is at 92.2% while retail occupancy is at 98.5%
(3) Acquisition of Asia Square Tower 2 was completed on 1 November 2017
(4) Contribution from Gallileo, Frankfurt effective from 19 June 2018
(5) Contribution from Main Airport Center, Frankfurt effective from 18 September 2019 57
Portfolio committed occupancy rate at 95.2%
2006 2007 2008 2009 2010 2011 2012 2013 2014 2015 2016 2017 2018 20191Q
2020
Capital Tower 100.0 100.0 99.9 99.9 99.9 100.0 100.0 100.0 100.0 94.1 99.0 99.4 99.7 100.0 100.0
Six Battery Road 100.0 99.9 98.6 99.2 99.7 85.4 93.0 98.6 99.2 98.9 98.6 99.9 100.0 98.7 78.5
21 Collyer Quay
(HSBC Building)100.0 100.0 100.0 100.0 100.0 100.0 100.0 100.0 100.0 100.0 100.0 100.0 100.0 100.0 100.0
Raffles City (60% interest) 99.5 99.3 99.9 99.3 99.1 98.9 100.0 100.0 100.0 99.2 97.8 98.3 99.6 98.1 95.6(2)
One George Street
(50% interest)100.0 96.3 100.0 93.3 92.5 95.5 100.0 98.2 96.5 98.0 97.8 100.0 100.0
CapitaGreen 69.3 91.3 95.9 100.0 99.7 100.0 96.9
Asia Square Tower 2 (3) 90.5 98.1 95.4 96.4
Gallileo, Frankfurt
(94.9% interest)(4) 100.0 100.0 100.0
Main Airport Center, Frankfurt
(94.9% interest)(4) 93.1 92.2
Portfolio Occupancy(1) 99.6 99.6 96.2 94.8 99.3 95.8 97.2 98.7 96.8 97.1 97.1 97.3 99.4 98.0 95.2
CapitaLand Commercial Trust Presentation April 2020
Investment Properties (1) 30-Jun-19 31-Dec-18 31-Dec-19
12-month
Variance
(Dec 2018 to
Dec 2019)
12-month
Variance
(Dec 2018 to
Dec 2019)
31-Dec-19
6-month
Variance
(Jun 2019 to Dec
2019)
S$m S$m S$m S$m % S$ per sq foot %
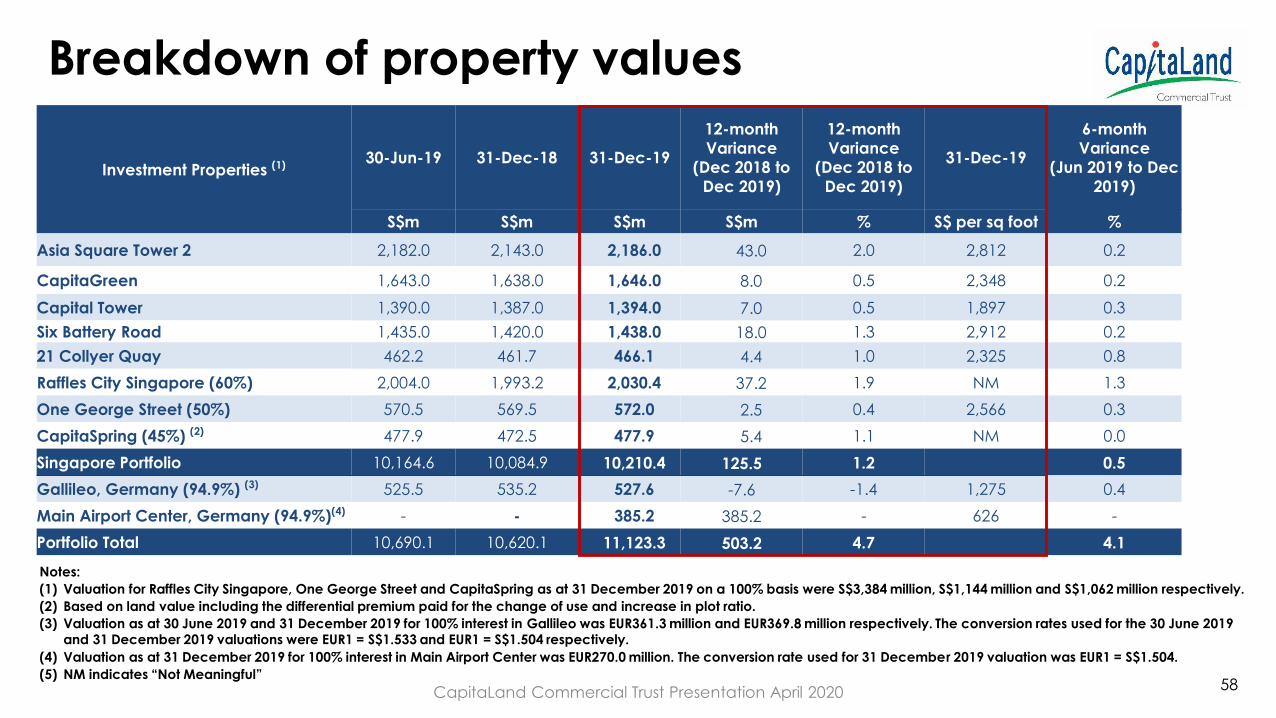
Asia Square Tower 2 2,182.0 2,143.0 2,186.0 43.0 2.0 2,812 0.2
CapitaGreen 1,643.0 1,638.0 1,646.0 8.0 0.5 2,348 0.2
Capital Tower 1,390.0 1,387.0 1,394.0 7.0 0.5 1,897 0.3
Six Battery Road 1,435.0 1,420.0 1,438.0 18.0 1.3 2,912 0.2
21 Collyer Quay 462.2 461.7 466.1 4.4 1.0 2,325 0.8
Raffles City Singapore (60%) 2,004.0 1,993.2 2,030.4 37.2 1.9 NM 1.3
One George Street (50%) 570.5 569.5 572.0 2.5 0.4 2,566 0.3
CapitaSpring (45%) (2) 477.9 472.5 477.9 5.4 1.1 NM 0.0
Singapore Portfolio 10,164.6 10,084.9 10,210.4 125.5 1.2 0.5
Gallileo, Germany (94.9%) (3) 525.5 535.2 527.6 -7.6 -1.4 1,275 0.4
Main Airport Center, Germany (94.9%)(4) - - 385.2 385.2 - 626 -
Portfolio Total 10,690.1 10,620.1 11,123.3 503.2 4.7 4.1
Breakdown of property values
Notes:
(1) Valuation for Raffles City Singapore, One George Street and CapitaSpring as at 31 December 2019 on a 100% basis were S$3,384 million, S$1,144 million and S$1,062 million respectively.
(2) Based on land value including the differential premium paid for the change of use and increase in plot ratio.
(3) Valuation as at 30 June 2019 and 31 December 2019 for 100% interest in Gallileo was EUR361.3 million and EUR369.8 million respectively. The conversion rates used for the 30 June 2019 and 31 December 2019 valuations were EUR1 = S$1.533 and EUR1 = S$1.504 respectively.
(4) Valuation as at 31 December 2019 for 100% interest in Main Airport Center was EUR270.0 million. The conversion rate used for 31 December 2019 valuation was EUR1 = S$1.504.
(5) NM indicates “Not Meaningful”58
CapitaLand Commercial Trust Presentation April 2020
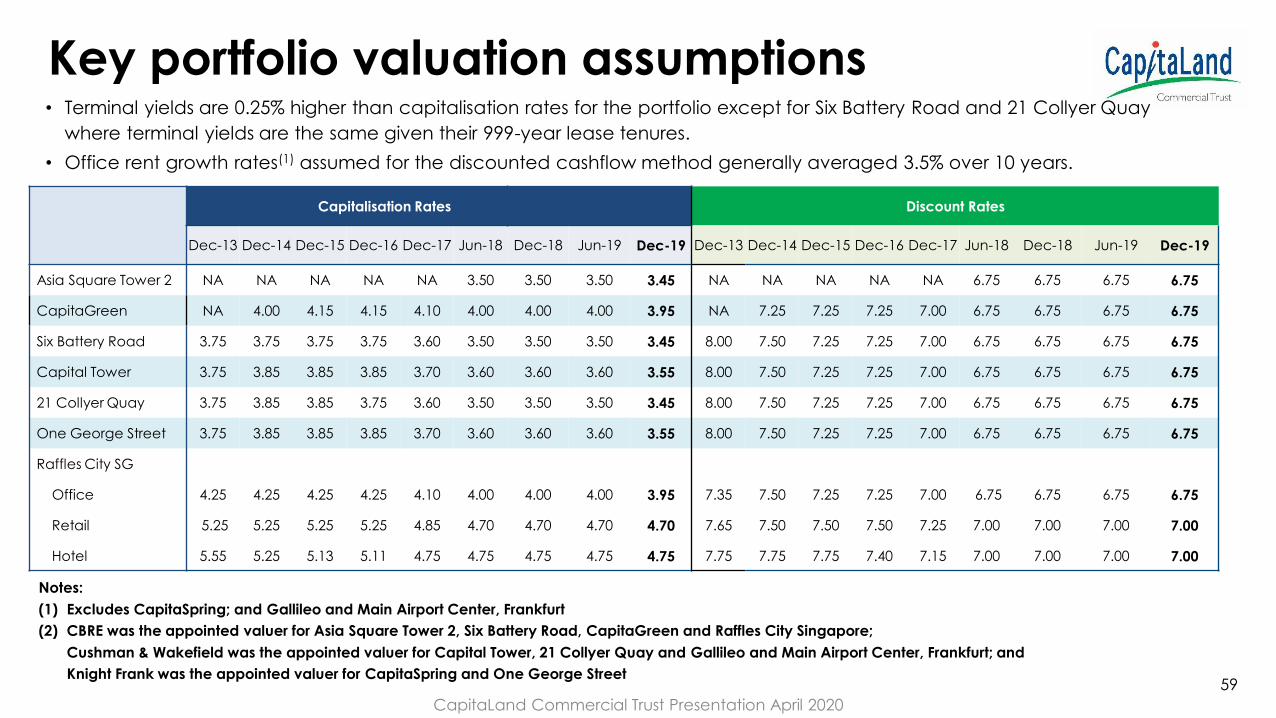
Key portfolio valuation assumptions• Terminal yields are 0.25% higher than capitalisation rates for the portfolio except for Six Battery Road and 21 Collyer Quay
where terminal yields are the same given their 999-year lease tenures.
• Office rent growth rates(1) assumed for the discounted cashflow method generally averaged 3.5% over 10 years.
Notes:
(1) Excludes CapitaSpring; and Gallileo and Main Airport Center, Frankfurt
(2) CBRE was the appointed valuer for Asia Square Tower 2, Six Battery Road, CapitaGreen and Raffles City Singapore;
Cushman & Wakefield was the appointed valuer for Capital Tower, 21 Collyer Quay and Gallileo and Main Airport Center, Frankfurt; and
Knight Frank was the appointed valuer for CapitaSpring and One George Street
Capitalisation Rates Discount Rates
Dec-13 Dec-14 Dec-15 Dec-16 Dec-17 Jun-18 Dec-18 Jun-19 Dec-19 Dec-13 Dec-14 Dec-15 Dec-16 Dec-17 Jun-18 Dec-18 Jun-19 Dec-19
Asia Square Tower 2 NA NA NA NA NA 3.50 3.50 3.50 3.45 NA NA NA NA NA 6.75 6.75 6.75 6.75
CapitaGreen NA 4.00 4.15 4.15 4.10 4.00 4.00 4.00 3.95 NA 7.25 7.25 7.25 7.00 6.75 6.75 6.75 6.75
Six Battery Road 3.75 3.75 3.75 3.75 3.60 3.50 3.50 3.50 3.45 8.00 7.50 7.25 7.25 7.00 6.75 6.75 6.75 6.75
Capital Tower 3.75 3.85 3.85 3.85 3.70 3.60 3.60 3.60 3.55 8.00 7.50 7.25 7.25 7.00 6.75 6.75 6.75 6.75
21 Collyer Quay 3.75 3.85 3.85 3.75 3.60 3.50 3.50 3.50 3.45 8.00 7.50 7.25 7.25 7.00 6.75 6.75 6.75 6.75
One George Street 3.75 3.85 3.85 3.85 3.70 3.60 3.60 3.60 3.55 8.00 7.50 7.25 7.25 7.00 6.75 6.75 6.75 6.75
Raffles City SG
Office 4.25 4.25 4.25 4.25 4.10 4.00 4.00 4.00 3.95 7.35 7.50 7.25 7.25 7.00 6.75 6.75 6.75 6.75
Retail 5.25 5.25 5.25 5.25 4.85 4.70 4.70 4.70 4.70 7.65 7.50 7.50 7.50 7.25 7.00 7.00 7.00 7.00
Hotel 5.55 5.25 5.13 5.11 4.75 4.75 4.75 4.75 4.75 7.75 7.75 7.75 7.40 7.15 7.00 7.00 7.00 7.00
59
CapitaLand Commercial Trust Presentation April 2020
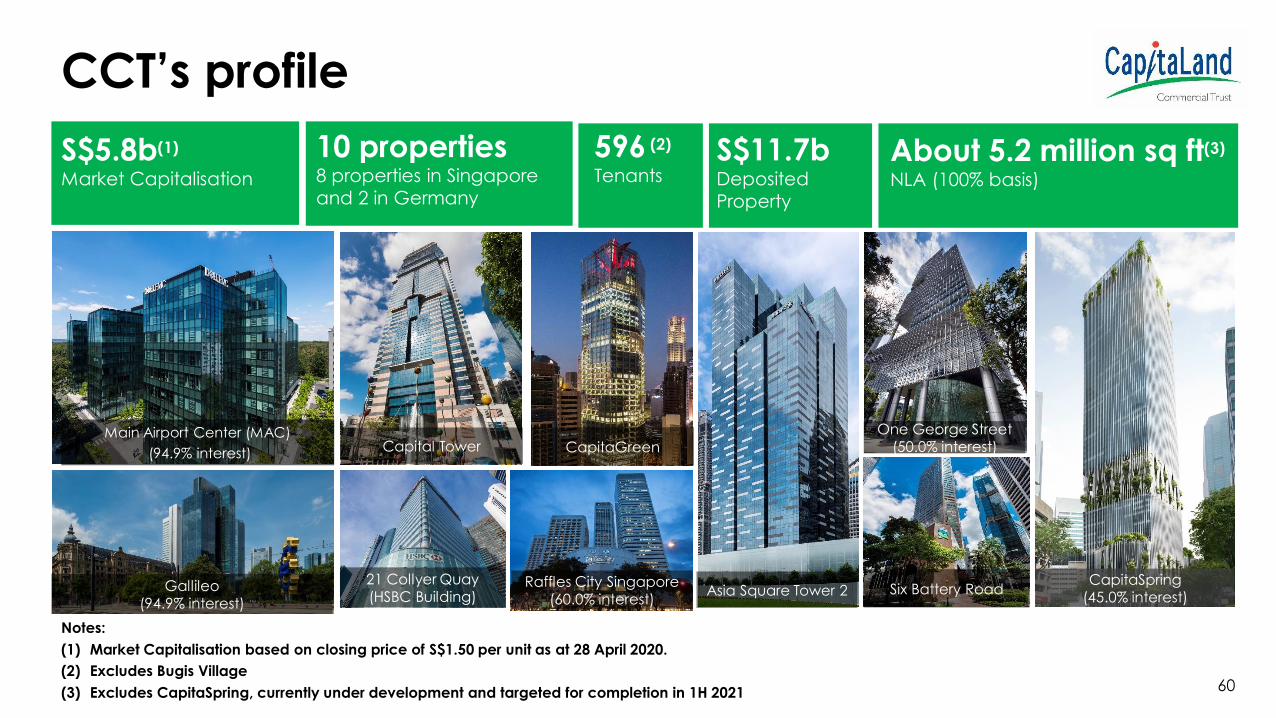
CCT’s profile
10 properties8 properties in Singapore
and 2 in Germany
S$11.7bDeposited
Property
S$5.8b(1)
Market Capitalisation
About 5.2 million sq ft(3)
NLA (100% basis)
Gallileo(94.9% interest)
One George Street (50.0% interest)
Raffles City Singapore (60.0% interest)
CapitaGreen
Six Battery Road21 Collyer Quay (HSBC Building) Asia Square Tower 2
Capital Tower
Notes:
(1) Market Capitalisation based on closing price of S$1.50 per unit as at 28 April 2020.
(2) Excludes Bugis Village
(3) Excludes CapitaSpring, currently under development and targeted for completion in 1H 2021
596 (2)
Tenants
CapitaSpring(45.0% interest)
Main Airport Center (MAC)
(94.9% interest)
60

Owns 8 centrally-located quality commercial properties in Singapore
Notes:
(1) CCT has 50.0% interest in One George Street
(2) CCT has 60.0% interest in Raffles City Singapore
(3) CCT has 45.0% interest in CapitaSpring
Capital Tower
Asia Square Tower 2
CapitaGreen
Six Battery Road
One George Street (1)
Raffles City Singapore (2) CapitaSpring
1
2
3
4
5
6 (3)
8
21 Collyer Quay7
New integrated development, CapitaSpring in Raffles Place under construction
61CapitaLand Commercial Trust Presentation April 2020

Owns 2 properties strategically located in Frankfurt Airport office submarket and Banking District
20 mins by Car
• Via A3 / A5 motorways
11 mins by Train
• Inter City Express (ICE) high
speed trains offer 204 domestic
and regional connections
15 mins by S-Bahn commuter
railway
• 4 stops to Frankfurt city centre
(Frankfurt central station)
Close proximity between Frankfurt airport office district and
Frankfurt city centre
Excellent connectivity between Frankfurt airport and Frankfurt city centre via a
comprehensive transportation infrastructure network
9. Gallileo
10. Main Airport Center
62

Property details (1)
Capital TowerAsia Square
Tower 2CapitaGreen
Six Battery
Road
Raffles City Singapore
(100.0%)
Address168 Robinson
Road12 Marina View 138 Market Street 6 Battery Road
250/252 North Bridge
Road; 2 Stamford Road;
80 Bras Basah Road
NLA (sq ft) 734,000 777,000 701,000 494,000
808,100
(Office: 381,300,
Retail: 426,800)
Leasehold
expiring31-Dec-2094
2-Mar-2107
(land lot only(1))31-Mar-2073 19-Apr-2825 15-Jul-2078
Committed
occupancy100.0% 96.4% 96.9% 78.5% 95.6%
Valuation
(31 Dec 2019)S$1,394.0m S$2,186.0m S$1,646.0m S$1,438.0m
S$3,384.0m (100.0%)
S$2,030.4m (60.0%)
Car park lots 415 263 184 190 1,051 Note:(1) Excludes airspace and subterranean lots.
63CapitaLand Commercial Trust Presentation April 2020
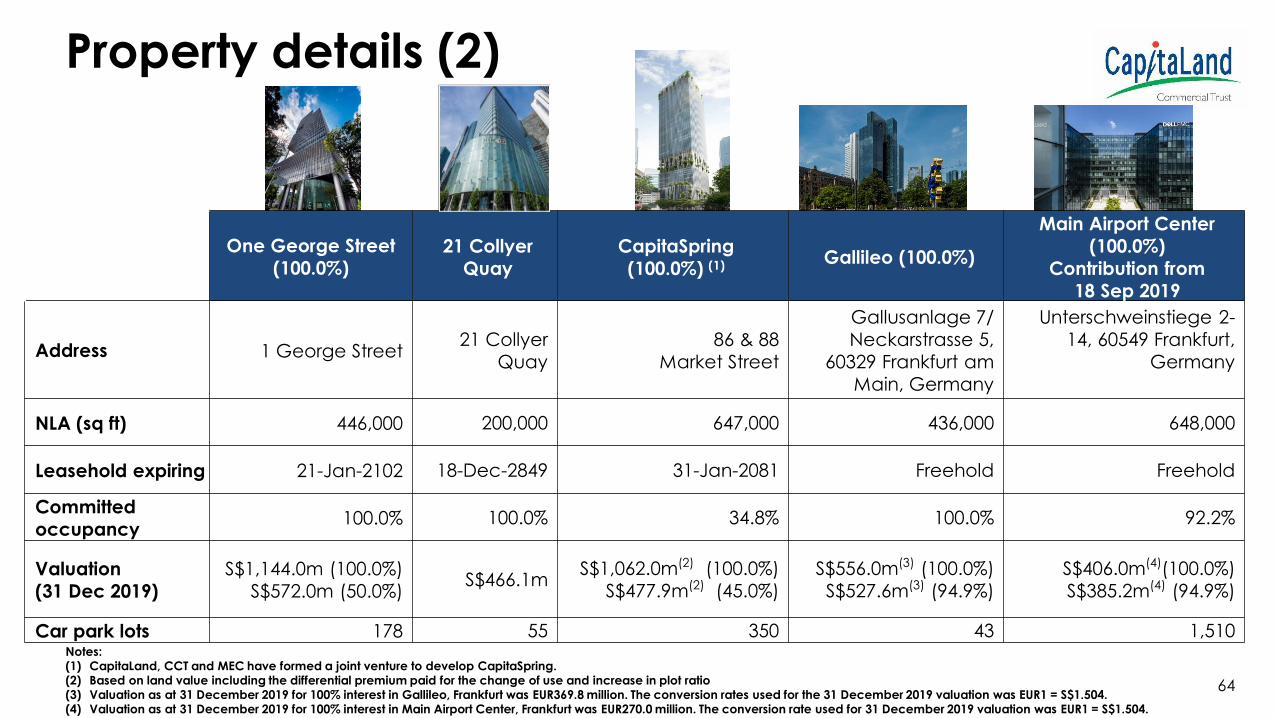
Property details (2)
One George Street
(100.0%)21 Collyer
Quay
CapitaSpring
(100.0%) (1) Gallileo (100.0%)
Main Airport Center
(100.0%)
Contribution from
18 Sep 2019
Address 1 George Street21 Collyer
Quay
86 & 88
Market Street
Gallusanlage 7/
Neckarstrasse 5,
60329 Frankfurt am
Main, Germany
Unterschweinstiege 2-
14, 60549 Frankfurt,
Germany
NLA (sq ft) 446,000 200,000 647,000 436,000 648,000
Leasehold expiring 21-Jan-2102 18-Dec-2849 31-Jan-2081 Freehold Freehold
Committed
occupancy100.0% 100.0% 34.8% 100.0% 92.2%
Valuation
(31 Dec 2019)
S$1,144.0m (100.0%)
S$572.0m (50.0%)S$466.1m
S$1,062.0m(2) (100.0%)
S$477.9m(2) (45.0%)
S$556.0m(3) (100.0%)
S$527.6m(3) (94.9%)
S$406.0m(4)(100.0%)
S$385.2m(4) (94.9%)
Car park lots 178 55 350 43 1,510Notes:(1) CapitaLand, CCT and MEC have formed a joint venture to develop CapitaSpring.(2) Based on land value including the differential premium paid for the change of use and increase in plot ratio(3) Valuation as at 31 December 2019 for 100% interest in Gallileo, Frankfurt was EUR369.8 million. The conversion rates used for the 31 December 2019 valuation was EUR1 = S$1.504.(4) Valuation as at 31 December 2019 for 100% interest in Main Airport Center, Frankfurt was EUR270.0 million. The conversion rate used for 31 December 2019 valuation was EUR1 = S$1.504.
64