Embed Size (px)
Citation preview
Capitalism in Green Disguise: The Political Economy of Organic Farming in the European Union Charalampos Konstantinidis __________________________ WORKING PAPER 2014-01
________________________________
DEPARTMENT OF ECONOMICS
UNIVERSITY OF MASSACHUSETTS BOSTON ________________________________
Capitalism in Green Disguise: The Political Economy of Organic Farming in the European Union
Charalampos Konstantinidis
Department of Economics
University of Massachusetts Boston
January 7, 2014
Abstract
Organic farming is often presented as the success story of Rural Development policies in the European
Union, having grown from a marginal activity to one covering more than 5% of European agricultural
land. Even though organic farming is often thought of as small-‐scale farming, I show that organic
farms in Europe display characteristics associated with capitalist agriculture. Organic farms are
larger and more mechanized than conventional farms. Furthermore, organic farms are associated with
wage-‐labor and use less labor per hectare than their conventional counterparts, casting doubt on the
efficacy of organic farming in increasing labor demand in marginalized communities and acting as an
effective tool for keeping rural residents in the countryside. These results present us with evidence of
the “conventionalization” of organic farming, and with a significant case of “green-‐washing” of
capitalist structures of production.
1
1. Introduction
In his piece “A future for small farms? Biodiversity and sustainable agriculture” James
Boyce argues that small farmers provide a “crucial public good: the conservation of
agricultural biodiversity” (Boyce, 2006). Boyce claims that there is need for agricultural
policies that will not only reduce rural poverty but will also recognize the contributions made
by small farmers in environmental protection and further farmers’ positive environmental role.
When reading the official documents of the European Union, one gets the impression
that such goals are not as unrealistic or outside the policy agenda as they seem prima facie.
Through the EU Common Agricultural Policy’s (CAP) agri-‐environmental measures,
European farmers receive support for contributing to objectives as diverse as maintaining
biodiversity, improving soil, water and air quality, preserving agricultural landscapes, and
contributing to climate stability and food security (Cooper et al., 2009; European Network
for Rural Development, 2010). This is an impressive discursive change for the CAP, a policy
that was considered predisposed, if not synonymous, to the imposition of capitalist relations
in agriculture (Redclift, 1987; Panitsidis, 1992; Liodakis, 1994; Marsden, 2003).
The objective of this paper is to examine whether the discursive change reflects real
change in support of small farms. To do so, I examine the rise of organic farming in the
European Union. Over the past 20 years and under the auspices of the revised Common
Agricultural Policy, organic farming has grown from a marginal activity to a common
feature of European agriculture. In 2011 5% of European Utilized Agricultural Area is
cultivated under organic methods; in certain regions the share of agricultural land under
organic methods is as high as 40%. This increase in the visibility of organic methods of
production is seen as evidence of a process of repeasantization of the European economy (van
der Ploeg, 2009).
The structure of this paper is as follows: The second section presents the theoretical
predictions regarding the disappearance of the peasantry and its replacement by agricultural
wage labor. The third section discusses European agriculture: I first show that the
transition to capitalist farming is not complete in most European countries, as evidenced by
the low share of wage labor in European agriculture. Subsequently I discuss the history of
the CAP and the tension permeating the CAP around the support of capitalist as opposed to
small or peasant farms; I show how Rural Development policies after 1992, and support for
organic farming in particular, are o f t e n presented as a reversal of the CAP’s earlier support for
capitalist farming. The fourth section lays out empirical evidence which refutes the claim that
2
organic farming in Europe is small-‐scale farming. I show that organic farms are more
likely to display characteristics associated with capitalist rather than with peasant farming:
they are larger than their conventional counterparts, employ less labor per unit of land, are
more mechanized, and are more likely to be corporate enterprises. The fifth section
discusses these results and presents reasons, including access to the market and to technical
support and other institutional barriers, which may tip the scale towards large capitalist
farms in their transition to organic methods. The sixth section concludes.
2. Capitalist relations in agriculture: Theoretical predictions The question of capitalist penetration in agriculture has produced some of the most heated
debates of the Marxist tradition. Most of the agrarian debates of the 20th century, such as
the Indian mode of production debates or the Nairobi debates, take place in the developing
world (Thorner, 1969; Patnaik, 1971; Thorner, 1982; Kitching, 1980; Githinji and
Cullenberg, 2003). Underlying these debates is the notion that Europe, the core of
capitalism, is further advanced in a linear process of capitalist development. However, wage
farm labor was not a dominant feature of European agriculture when these theoretical
confrontations took place, and although rising, it is still not to this day.
The literature on agrarian transition is divided around the question of the development
of capitalism in agriculture and the presence of the peasantry. The first line is defined by the
seminal authors of the Marxian tradition (Marx, Lenin, Kautsky) a nd predicts the
disappearance of the peasantry and the development of capitalist structures in agriculture.
For Marx, the peasant smallholding, where the cultivator is also the owner of the land and
the instruments of labor, and which arose out of the dissolution of feudal estates in
Europe was only a transitional form towards capitalist farming. The destruction of the
rural domestic industry, the depletion of soil fertility, and the usurpation of communal lands
make it impossible for the peasant to compete with large-‐scale agriculture in a context of
decreasing agricultural prices (because of increased productivity due to technological
advances), even though the peasant keeps for himself a wage that only secures his physical
existence at the bare minimum (Marx, 1967, 1981).
Karl Kautsky in the Agrarian Question presents his clear support for the large farm, as
opposed to the Narodnik position of supporting the small peasant. His basic position is one of
the technological superiority of the large farm. Technological improvements cannot be
introduced unless the farm size is larger than a minimum threshold. Additionally, savings
3
can occur in large farms, through the use of specialized labor (including managerial and
educated labor). Similarly, credit and commercial considerations point to the superiority of
large farms (Kautsky, 1998a, b).
As in Kautsky’s analysis, Lenin in his Development of Capitalism in Russia, examines the
differentiation between rural bourgeoisie and rural proletariat. Lenin finds that self-‐
employed/small-‐scale peasants who constitute more than half of the rural population in
Russia are usually worse-‐off than agricultural wage laborers (Lenin, 1974, 129-‐190).
According to Lenin, isolated passages in Marx do not warrant the Narodnik praise of small-‐
scale production, as both Marx and Engels salute the historical role of capitalism (ibid.,
328-‐334). Communal arrangements of land tenure can only delay but not stop capitalist
development in agriculture.
“If we are told that we are running ahead in making such an assertion, our reply will be the
following. Whoever wants to depict some living phenomenon in its development is inevitably and
necessarily confronted with the dilemma of either running ahead or lagging behind. There is no
middle course. And if all the facts show that the character of the social evolution is precisely
such that this evolution has already gone very far … and if, furthermore, precise reference is
made to the circumstances and institutions that retard this evolution (excessively high taxes,
social-‐estate exclusiveness of the peasantry, lack of full freedom in the purchase and sale of land,
and in movement and settlement), then there is nothing wrong in such running ahead.” -‐ Lenin,
on the development of capitalism in agriculture (Lenin, 1974, 329)
The second line of thought rejects the teleology of a linear process towards capitalist
agriculture, and seeks to understand the resilience of peasant farms. This line of thought, which is in
some ways initiated by the work of A.V. Chayanov, analyzes the integration of agriculture in capitalism,
allowing for the central feature of agriculture (farming) to follow a different model than the
large-‐scale model of industrial capitalism.
A.V. Chayanov is the best-‐known critic of the thesis of the inevitability of the capitalist
organization of agriculture. In his major work Theory of Peasant Economy (1966),
Chayanov criticizes the Marxist analysis of agriculture and argues that categories such as
rent or capital are not suitable for the analysis of agriculture, since agriculture is a sphere
dominated by unpaid labor performed by peasant family members1. Since the family farm does
not pay wages, it can operate under conditions that would have been impossible for a capitalist
1 Chayanov claims that 90% of peasant households in Russia did not hire any labor power (Chayanov, 1966, 112).
4
farm (Chayanov, 1966, 86-‐89). The peasant household will often push labor intensity beyond
its optimal levels in order to increase the gross income of the family, even at the cost of lower
revenue per labor unit. Similarly, the peasant household might pay higher rents for land than
what would be reasonable for a capitalist farm, or make investment decisions which do not
maximize its rate of return, such as growing less productive crops which may not display
irregularities of labor demand over different seasons. All these factors show that it is the
self-‐exploitation of the peasant that explains the viability and the stability of the peasant
form, despite facing competition from the more efficient capitalist sector (Chayanov, 1966,
86-‐89; 189-‐236).
Costas Vergopoulos furthers Chayanov’s claims to argue that family ownership in
agriculture is indicative of “disformed capitalism”. In an attempt to reconcile Marxism with
the empirical reality of the persistence of peasants farms in Western Europe, Vergopoulos
seeks to analyze the role of agriculture within the “social apparatus of capitalism”. According
to Vergopoulos, the rationality of the capitalist system is guaranteed at the expense of the
rationality of the organization of production in agriculture. Thus, industrial capital
supports family farming in order to block the development of agricultural capitalism. The
State, beyond breaking up latifundia through land reforms and promoting intensive farming in
small farms (which increases the mass of surplus), has always promoted the transfer of
surplus outside agriculture: indebtedness has systematically transferred surplus from
farms to finance capital. At the same time, the relatively small number of cases of land
repossession points to a systemic preference of peasant indebtedness over capitalist agriculture
(Vergopoulos and Amin, 1975, 21). This configuration of modern family farms in the Global
North within capitalism allows industrial, financial and commercial capital operating “up
and down the food-‐value chain” to collect profits instead of the farmers who produced the
value in the first place (Amin, 2011, xii).
Richard Lewontin in a recent article echoes Vergopoulos and Amin’s analysis of the
articulation of peasant farming within capitalism. According to Lewontin, one needs to
separate farming from agriculture: for a variety of reasons, which include the difficulty of
supervising the farming process and its unpredictability, the low liquidity of farm land, the
limits to the turnover time for farming, and the limits to economies of scale, farming has
not been organized along capitalist lines. Thus, capital has stayed away from farming, a
process organized around large number of independent petty producers, and has focused instead
on other agricultural processes (e.g. input provision, processing, distribution) (Lewontin,
5
2000).
3 European agriculture and the role of policy 3.1 Wage labor in European agriculture over time
It is in this context that we need to examine the changes in European agriculture, and the
tension between capitalist and peasant relations in farming. Eric Hobsbawm writes in the
“Age of Extremes” that “the most dramatic and far-‐reaching social change of the second half
of this century, and the one which cuts us off for ever from the world of the past, is the
death of the peasantry” (Hobsbawm, 1996, 289). Prior to WWII, the only two industrial
countries in which agricultural population comprised less than 20% of total population were
Great Britain and Belgium. By the early 1980s most European countries did not employ
more than 10% of their population in agriculture, and the peasant population had fallen
even in traditional peasant strongholds, such as Greece (Hobsbawm, 1996, 289-‐291).
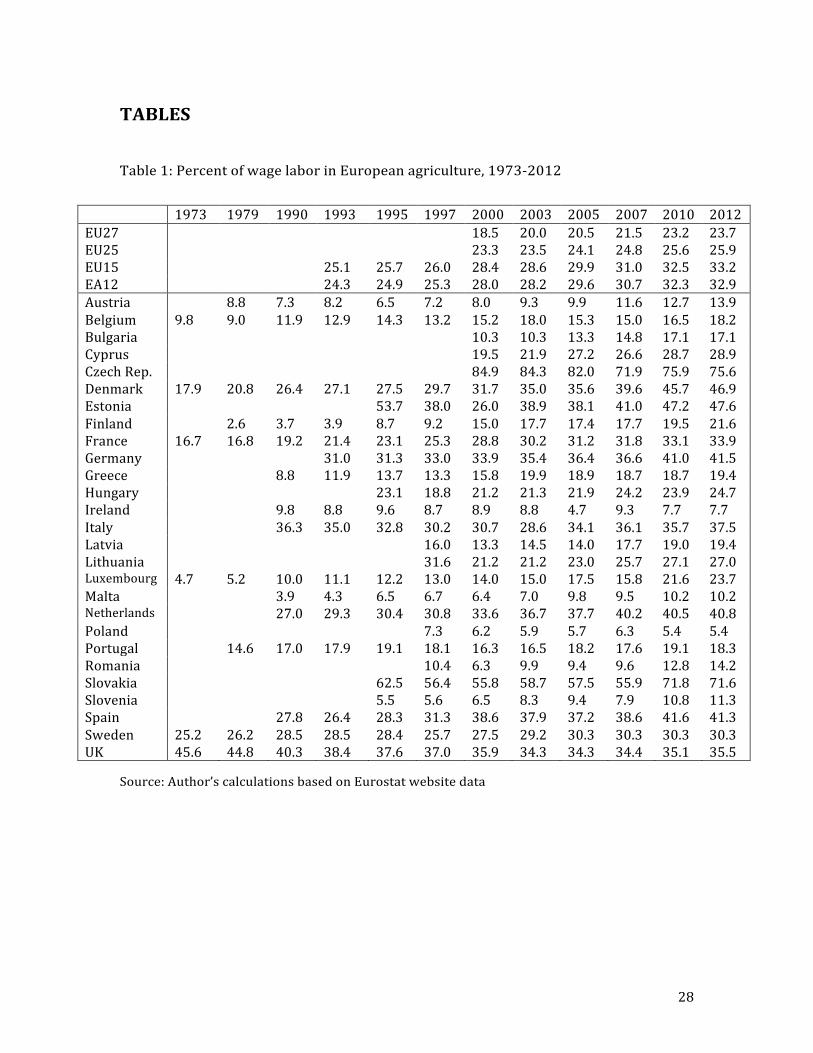
###Table 1 here####
The consolidation of farms and the creation of larger farms meant an increased
presence of wage labor, as the family could not provide the labor power required to
manage the larger farms. This is especially the case in Europe, which has been
experiencing declining birth rates over the past 50 years. While in the original countries of
the EEC less than 14% of agricultural labor was performed by non-‐family wage labor
(Djurfeldt, 1981, 167-‐168), table 1 shows a general increase in the presence of wage labor
in agriculture over the last 40 years. The percentage of wage labor in European agriculture
is measured by the use of annual work units performed under wage arrangements as a
share of total annual work units. As we can see in table 1, in 2012, wage-‐labor accounts for
less than 24% of agricultural labor in EU-‐27 countries; for the 12 earlier members of the
Community, this number has gone up from 24% to approximately 33% over the last 20
years. We also note that in several countries more than 40% of agricultural labor is
performed by wage-‐workers in a series of countries (76% in the Czech Republic, 72% in
6
Slovakia, 48% in Estonia, 42 in Germany, etc. 2). Although growing in general, wage-‐labor
still accounts for less than one-‐fifth of agricultural labor in several European countries
(14% in Austria, 18% in Belgium and Portugal, etc.). Thus, even in Europe the transition to
capitalist farming is far from complete3.
3.2 European policy: from the ‘Mansholt plan’ to Rural Development
The role of the State is a crucial part of an explanation of the changes in the
structural characteristics of European agriculture, or the lack thereof. This analysis
becomes more pertinent since the Common Agricultural Policy has historically been a
central piece of European policy. Its foundation was laid out in the Treaty of Rome, the
inaugural document of the European Economic Community, in 1957, with the explicit objectives
of increasing agricultural productivity and assuring the availability of food supplies
(European Union, 2006; Konstantinidis, 2013). These objectives would be accomplished by
significant payments to agricultural producers, embracing the productivist logic of the early era
of industrial agriculture. The significance of the CAP is further established by the fact that
despite its decrease in the relative weight in the EU budget over the last 30 years, the CAP still
receives more than 44% of the EU budget4. Naturally, one should inquire which structures of
production are favored by these policies.
The fact that the disappearance of the peasantry had not been fully realized in Europe
70 years after Lenin and Kautsky’s writings is revealed by the ‘Mansholt plan’, the first
reform of the CAP, proposed in 1968 by Sicco Mansholt, the first Commissioner for
Agriculture (1958-‐1972). The ‘Mansholt plan’ attempted to “modernize” European
agriculture and to “improve its competitiveness”, by actively reducing the ratio of
population employed in agriculture and consolidating farms into large holdings, with
minimum size requirements of 80-‐120 hectares of arable land or 40-‐60 dairy cows. These
new farms would be able to take advantage of economies of scale, and to introduce modern
technology and methods of farming (Kommission, 1968, 1-‐27; Lynggaard, 2006, 87-‐89).
According to European policy makers these reforms would allow the agricultural community
2 The UK stands out as an exception to the general rule, probably as a result of counter-‐urbanization. 3 See also Djurfeldt (1981), Winter (1982), Raikes (1982), Goodman and Redclift (1982), Nelson (1983). 4 See http://ec.europa.eu/agriculture/cap-‐post-‐2013/graphs/graph1_en.pdf, accessed August 27, 2013.
7
to participate in the welfare boom enjoyed by the rest of society and curb surplus
production, which reinforced the downward trends of agricultural prices and incomes and put
additional pressure on taxpayers to support farmers (Lynggaard, 2006).
The ‘Mansholt plan’ did not fare well. The modernization envisioned by Mansholt
stipulated that by 1980 five million hectares of land be retired from agriculture and
transferred to other uses, and five million people leave agriculture through early retirement
or retraining. Hence, the plan faced significant opposition from farmer organizations, and
Mansholt himself was given the unflattering nickname “peasant killer” (Ingersent,1990;
Ingersent and Rayner, 1999). Furthermore, the plan’s support for a type of ‘modern
farm’ went against the ideal of the small-‐scale-‐ or family-‐farm in the South and the North
of the EEC respectively. Advocating for the reduction of the population employed in
agriculture seemed politically costly, in the absence of a comprehensive employment plan in
other sectors, and hence was not adopted in its initial form, but as watered-‐down ’social-‐
structural directives’ in 1972 (Lynggaard, 2006). This attempt to essentially create capitalist
structures in agricultural production is considered to this day one of the most controversial
and failed attempts of European policy making5 (Ingersent and Rayner, 1999; Marsden, 2003;
Garzon, 2006).
Whereas the Mansholt plan promoted openly the creation of ‘modern’ capitalist farms in
the European countryside, this objective is not openly stated in the more recent versions of
the CAP. Instead, we see that the European Commission presents the CAP as a policy that
contributes to environmental protection and deters rural depopulation6. As such, the CAP
appears to be a policy that allows small farmers to continue farming and to prosper. The
following passage from an official publication of the European Commission illustrates the
discursive change in the CAP, from active support for modern capitalist structures to claims
that it seeks to retain family farms in the European countryside:
“Q: Does the CAP encourage intensive farming?
A: No. In fact, the CAP rewards extensive production systems. We are
not interested in industrialised farming for Europe. There is a place in
our model for small as well as large farms. If we got rid of the CAP
tomorrow, the only way for many of our farmers to survive would be to
intensify their production. Under the reformed CAP, however, the 5 It also drove home that capitalist development in the countryside necessarily renders part of the population excessive, a point raised by Kautsky. 6 See http://ec.europa.eu/agriculture/envir/cap/index_en.htm, accessed August 28, 2013.
8
incentive is not to produce more, but to produce in a sustainable and
environmentally-‐friendly way.'' (European Commission, 2009).
The inclusion of environmental considerations into European agricultural policy was
the outcome of a long and complex process. In 1973 the Council of the European
Communities identified for the first time the ramifications of the “intensive use of certain
types of fertilizers and the misuse of pesticide” (Council of the European Communities,
1973). In the 1980s, the European Commission would explicitly link modern agricultural
methods to a series of environmental problems, ranging from ground and surface water
pollution to species extinction and ecosystem destruction (European Commission 1985, 50,
as quoted in Lynggaard, 2006, 107). The legitimacy of the CAP was further challenged by
the fact that the main culprits of environmental degradation (large arable farms) were
receiving the lion's share of European payments for agricultural support (Buller et al. 2000;
Garzon, 2006).
Furthermore with the expansion of the EEC to include the UK, Ireland, and Denmark,
agricultural policy was modified so as to address imbalances between different regions.
Hence, in 1975 Directive 268 defined certain agricultural regions as "mountainous" or "less-‐
favored" areas (LFAs), calling for special direct payments to allow the continuation of
farming (Shucksmith et al, 2005, 26-‐27). The LFA designation marked a significant change
in the nature of the CAP, as it allowed for policies addressing regional imbalances to be
pursued through agricultural policy. In subsequent years, the scope of the LFA policies was
increased with the accession of new Member States, so as to include regions
• With permanent handicaps (as indicated by altitude, poor soils, climate, steep slopes)
• Experiencing depopulation or low population density
• Lacking infrastructure, needing support for supplementary non-‐agricultural
activities (tourism, local crafts etc.) (ibid., 36-‐37).
These new considerations (environmental and distributional consequences, territorial
imbalances) seem to be integrated into the first major reform of the CAP, which took place
in 1992, ending what some authors called ``thirty years of immobility'' (Garzon, 2006).
According to the MacSharry reform of the CAP (named after then commissioner Raymond
MacSharry), the agri-‐environmental schemes, set up by some Member States (e.g. Germany,
Denmark) on their own initiative and under the pressure of their national environmental
lobbies, became ``accompanying measures'' to the more traditional price support policies of
9
the CAP. This meant that every country was now required to design and implement
measures for environmental protection in its respective territory, apart from and parallel to
its support for agriculture (Shucksmith et al., 2005). At the same time, the MacSharry
reforms reduced the price/market support policies as a step towards the ``decoupling'' of
support from production7 (Scrieciu, 2011). In 1999, with the ``Agenda 2000'' reform of the
CAP, Rural Development was explicitly designated as the Second Pillar of Agricultural Policy
(the First Pillar being traditional price supports). These developments allow the European
Commission to entertain the vision that the CAP has moved from the support of industrial
agriculture and productivism (before 1992) towards environmental protection and support
for rural development (after 1992)8. There is hardly anything more striking than the
following quote from an official document of the European Commission:
``Were we to represent Europe by a colour, that colour would
undoubtedly be green'' (European Commission, 1992, 7).
3.3 Organic farming
Organic farming is considered as one of the most significant, and judging by the growth
of the organic sector also as one of the most successful, tools for rural development.
Organic farming contributes to environmental objectives by banishing the use of pesticides
and synthetic fertilizers. Furthermore, since the 1980s, the European Commission has
viewed organic farming as an alternative to industrial agriculture, and as a way to reduce
the use of energy and agro-‐chemicals, to preserve biodiversity, to maintain and improve
soil, water and rural landscapes, as well as to contribute to human health and animal
7 A further benefit derived from the “decoupling” of payments from production levels would shift most of the agricultural support measures from the trade-‐distorting classification of the WTO (the “red box”) to the non-‐trade distorting “green box” (Scrieciu, 2011, 79). 8 One should not underestimate the role of farmers, who have been anything but passive recipients of policy. Beyond lobbying at the national level and influencing electoral outcomes, farmers participate through organizations such as COPA-‐COGECA, or the European Farmers Coordination in the negotiations of agricultural policy. Farmers' resistance to the Mansholt plan was a major part of the plan's failure, whereas farmers in various European countries, such as France or Greece, protested against the reduction of agricultural support (which was a consequence of CAP reform) and what they considered the abandonment of peasants at the mercy of neoliberalism (Bartell, 1975; Louloudis and Maraveyas, 1997; Bove and Dufour, 2002; Woods, 2003). Beyond protest, farmers have articulated a series of responses to global agroindustrial dynamics in their attempt to maintain their livelihoods and to increase their autonomy and/or power. They have entered into new relationships of exchange, co-‐operation and competition, such as the local food networks or the movement against genetic modification, in what several authors call either ``agrarian-‐based rural development (Marsden, 2003) or “repeasantization” (van der Ploeg, 2009).
10
welfare (Lynggaard, 2006; European Commission,
http://ec.europa.eu/agriculture/organic/download-‐information_en, accessed on November
21, 2013).
Beyond its environmental benefits, organic farming is purported to assist the social and
economic goals of the European Commission by keeping small farmers in the countryside
and revitalizing regions which were plagued by urbanization (Shucksmith et al, 2005;
Lynggaard, 2006). As the following quote from the European Commission's website on
Rural Development illustrates, the European Commission directly connects organic farming
to small farms and job creation.
“The very nature of organic farming means that it contributes to creating job
opportunities, large rural populations and rural wealth. Factors
contributing to this include:
• Organic farms tend to be smaller and more diversified than non-‐organic
farms, which by comparison tend on the whole to be larger and more
intensive [sic] managed
• The often high labour intensiveness created by restrictions on inputs
and emphasis on physical and mechanical production''9
Thus, every EU country has been supporting farmers who decide to switch from
conventional to organic farming. This support includes payments to farmers for potential
income losses from the transition to organic farming, and in most countries for maintaining
their agricultural holdings under the organic regulations even after the initial conversion
period10 (Pohl 2009, Stolze and Lampkin, 2009, Sanders, 2011). Under these policies,
organic land as a share of agricultural area increased significantly in most European
countries. Figure 1 displays the changes of organic area for every EU country for the period
2000-‐2011. One notices the growth in organic area both in countries with traditions of
organic farming, such as Austria or Sweden, and also in other countries without a similar
tradition, such as Greece or Portugal. Particularly impressive is the rise of organic farming
9 See http://ec.europa.eu/agriculture/organic/society-‐economy/rural-‐development_en, accessed July 15, 2013. 10 Conveniently, this form of ``environmental'' subsidies is compatible with the regulations of the World Trade Organization, in an era where the global North has demonized agricultural subsidies in less developed countries (Garzon, 2006).
11
in certain Eastern European countries such as the Czech Republic, Estonia or Latvia, in all
three of which organic farming has surpassed 10% of utilized agricultural area.
###Figure 1 here###
4. Establishing capitalist organic
4.1 Farm size
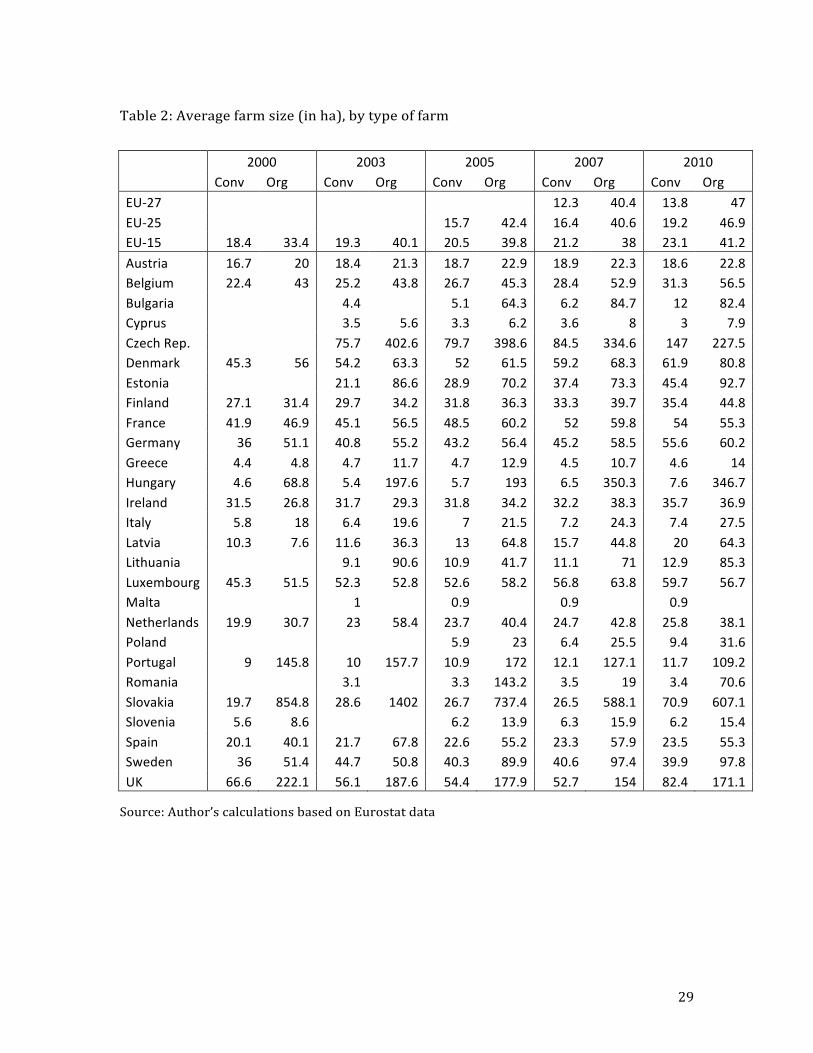
The empirical reality disproves the rhetoric that connects organic farms to small size.
Table 2 shows the evolution of average farm size for organic and conventional farms during
the period 2000-‐2010. At the EU-‐27 level, the average farm size for organic farms is 47
hectares, whereas the average farm size for conventional farms is only 13.8 ha. In 2010,
average organic farm size is greater than average conventional farm size for every EU
country with the exception of Luxembourg. For certain countries the difference is
astonishing: in Hungary, for example, the average organic farm size is 347 hectares, as
compared to 8 hectares for conventional farms; in Portugal, the average organic farm size is
109 hectares as opposed to 12 hectares for conventional farms, and in Sweden, the average
organic farm size is 98 hectares as opposed to 40 hectares for conventional farms. One also
notices that average organic farm size has generally increased over the 2000-‐2010 period;
in several cases, such as Spain or Italy, average organic farm size has also grown faster than
average conventional farm size. Furthermore, one notices that in certain cases, such as
Greece or Latvia, average organic farm size was very similar or even below average
conventional farm size at the beginning of the period in question; however, by the end of the
period, organic farm size is on average 3-‐4 times higher than average conventional farm
size11. Finally, it is interesting to note that the ratio of average organic to average
conventional farm size is negatively correlated with national income. Even excluding for
outliers such as Luxembourg, Romania or Hungary, which would make this relationship
11 Unfortunately the data starts in 2000, when Eurostat begun collecting data for organic farms in its Farm Structure Survey. If the data extended to previous periods, we would probably find this pattern in other European countries. Padel claims that in other cases, such as Germany, Denmark and the EU-‐15 in general, average organic farm size starts historically below average conventional farm size and in all cases surpasses it by the mid-‐1990s (Padel, 2001).
12
even stronger, we notice the presence of a negative association between the ratio of average
organic to average conventional farm size to real GDP per capita (Figure 2).
###Figure 2 here###
###Table 2 here###
###Table 3 here###
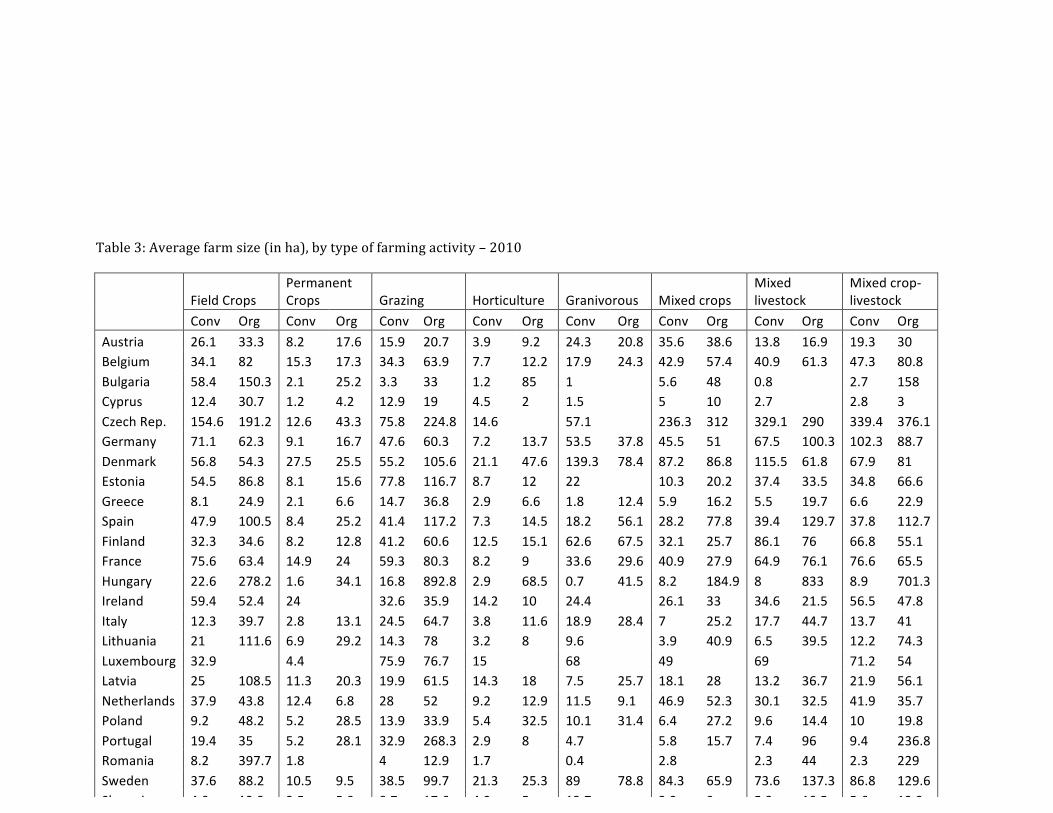
There are obvious criticisms against the use of average measures to capture the
developments taking place in agriculture12. In the specific case of organic farming, a
common criticism by agricultural officials is to treat the numbers presented in table 2 as a
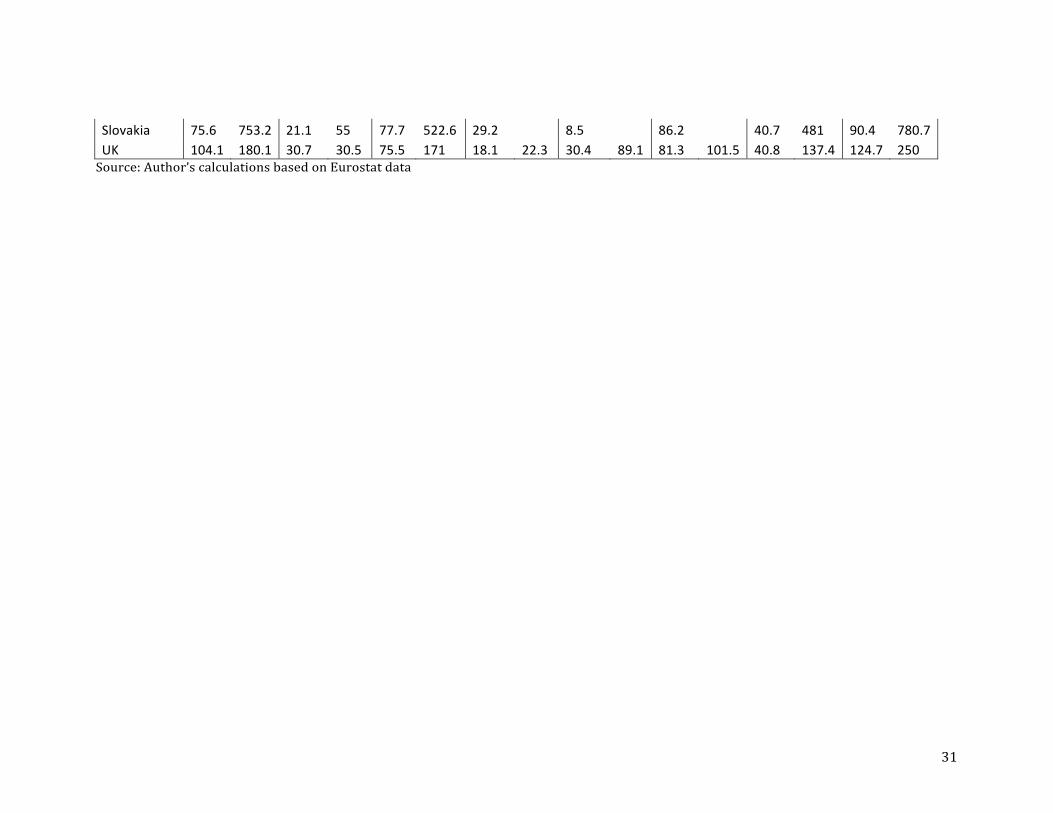
statistical artifact resulting from the inclusion of pastures into agricultural statistics13. Table
3 debunks this criticism by displaying the average farm size for organic and conventional
farms in different European countries in 2010, disaggregated by types of farming activities
(specialist field crop production, specialist permanent crop production, specialist
horticulture, specialist grazing livestock, specialist granivorous livestock, mixed cropping,
mixed livestock, and mixed crops-‐livestock). Although it is true that organic farms that
engage in specialist grazing are larger on average than their conventional counterparts, the
average land size of organic farms is also greater than the average land size of conventional
farms in most European countries for all other agricultural activities.
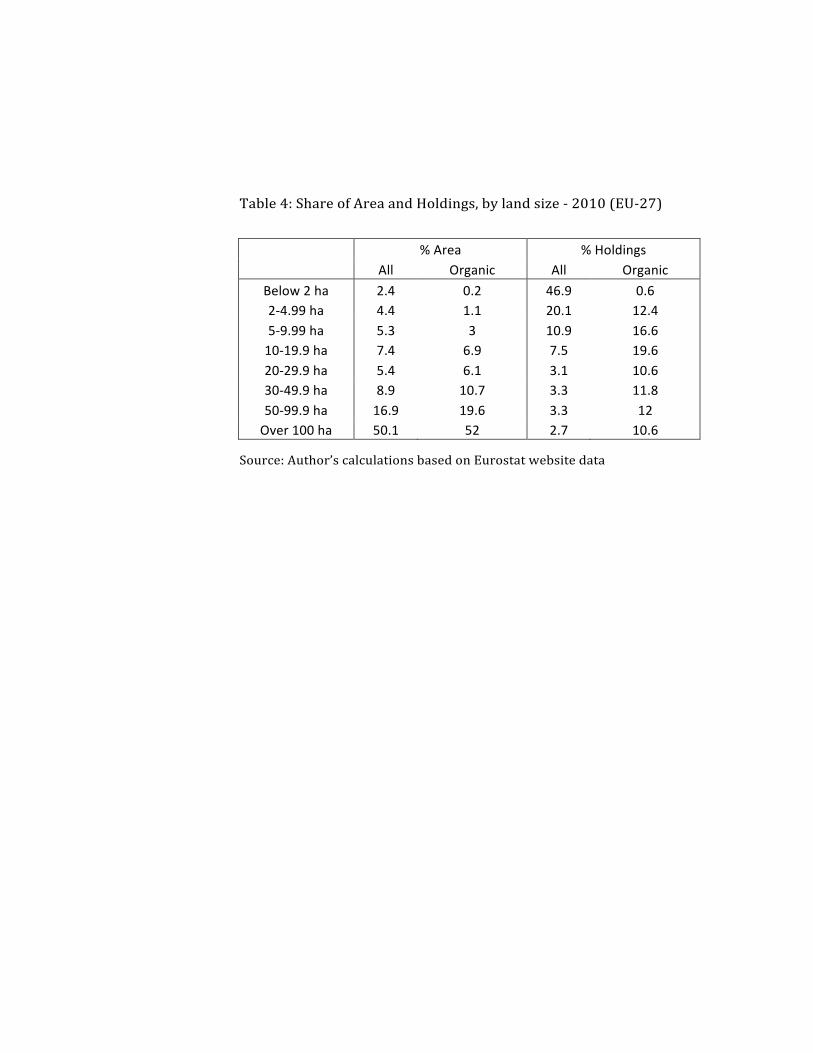
Table 4 presents the relative share of organic farms, both in terms of area and in terms
of the number of holdings in each farm size. The table illustrates a well-‐known fact, the
unequal distribution of agricultural land in Europe. Thus, we see that 47% of farms in
Europe operate on less than 2 hectares of land. Despite the size of this group, these farms
account for only 2.4% of agricultural land in Europe. At the same time, farms with land size
above 100 hectares, which constitute 2.7% of European agricultural holdings, control over
50% of European utilized agricultural area.
How do organic farms fit into this picture? The first striking observation is that organic
farms are significantly underrepresented among small farms and overrepresented among
larger farms. We notice that only 0.6% of organic farms operate on less than 2 hectares.
While 67% of farms in the European Union are below 5 ha, only 13% of organic farms fall
under the same category. At the same time, 6% of European farms are greater than 50
hectares, as opposed to approximately 23% of organic farms. The distribution of organic
12 See also Lenin (1974). 13 According to this criticism, the inclusion of grazing lands tends to inflate the average farm size for organic farms, as pastures may be overrepresented in organic agriculture. See Konstantinidis (2012, 138).
13
land among different classes of farms is quite similar to that of all agricultural land, with
approximately 72% of organic land being controlled by farms that are greater than 50
hectares, as opposed to 67% for all land in general. Thus, comparing the distribution of
farms and land for both organic and all farms, we notice that the majority land is controlled
in both cases by a small percentage of farms. However, whereas the median European farm
is between 2 and 5 hectares, the median organic farm is between 20 and 30 hectares.
###Table 4 here###
###Table 5 here###
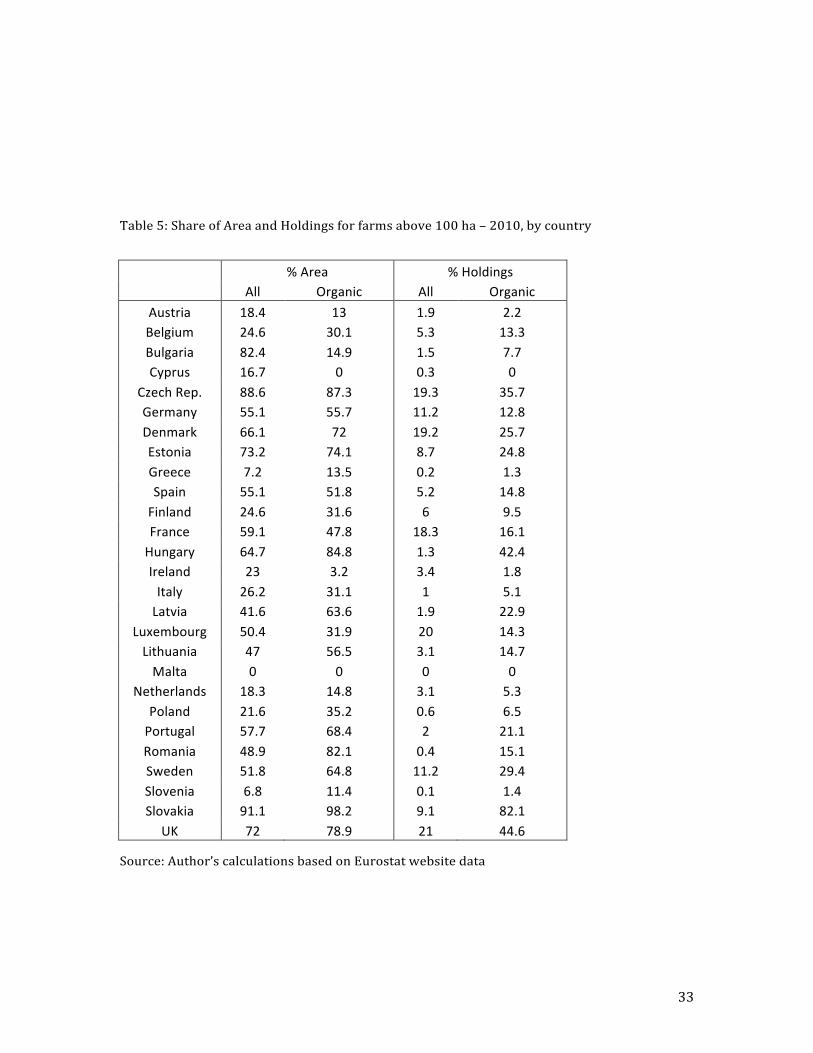
Table 5 looks specifically at farms that operate on an area greater than 100 hectares.
We notice that in most countries organic farms are overrepresented among large farms -‐ in
the UK, for example, 21% of farms are above 100 hectares; for organic farms this
percentage rises to 44.6%. Furthermore, whereas farms above 100 hectares control 72% of
the UK agricultural area, approximately 79% of organic land belongs to farms above 100
hectares. Again, the pattern of organic holdings being overrepresented among large farms is
persistent across twenty-‐two out of the EU-‐27 countries and particularly striking in some of
them: in Slovakia four out of five organic farms are above 100 hectares, as compared to only
9% of total farms which operate on land size of 100 hectares or more. In Hungary, where
only 1.3% of total farms are above 100 hectares, 42% of organic farms are above 100
hectares.
###Table 6 here###
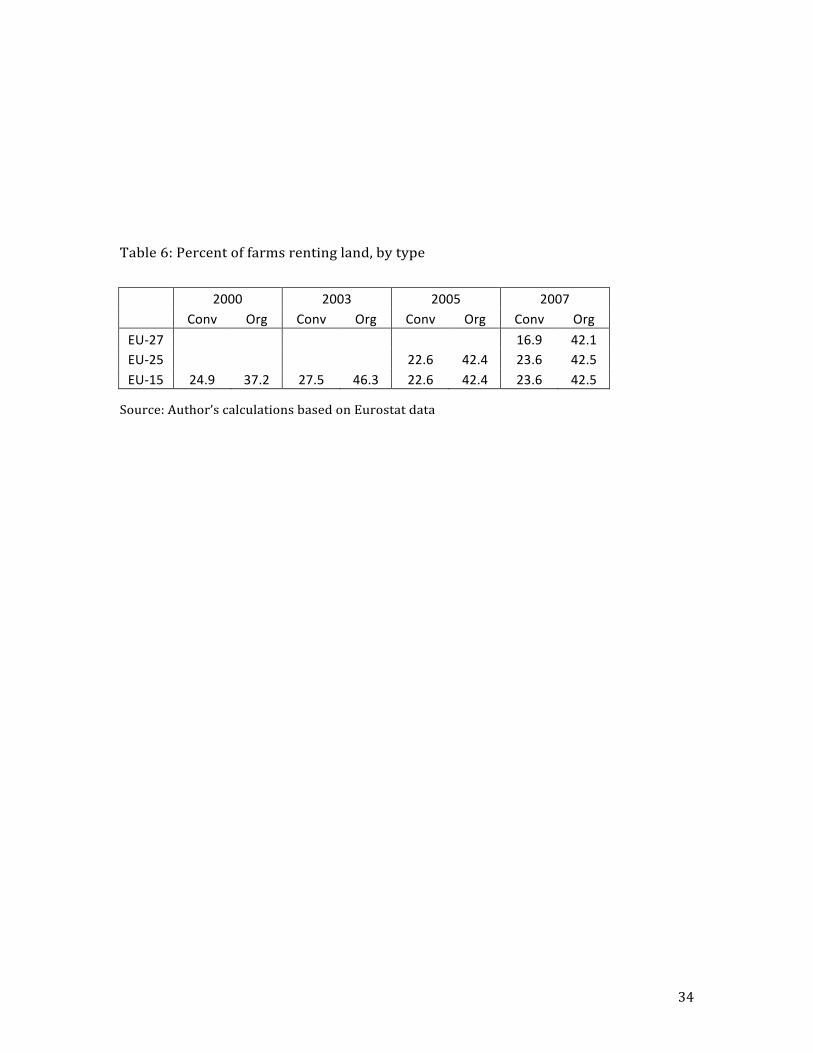
Table 6 presents the share of farms that have tenant arrangements over land. We
notice that organic farms are more likely than conventional farms to be renting at least
portion of the land they operate on: in 2007, approximately 42% of organic farms in the EU-‐
27 were renting land, as opposed to 17% for conventional farms. Interestingly, comparing
the share of organic farms that were renting land in 2000 and in 2007 reveals that this
figure has gone up for organic farms in the EU-‐15 (where comparisons are possible) from
37% in 2000 to 43% in 2007, while the same variable has dropped marginally from 25% to
24% for conventional farms. Thus, organic farms have experienced a degree of dynamism
(revealed by the ability to pay rent) that is not necessarily shared by conventional farms.
4.2 Labor use and mechanization
14
Land is not a sufficient measure in order to decipher how the CAP is transforming
European agriculture. Furthermore, farm size measured in terms of land is not the correct
category in order to classify a farm as capitalist. If we want to name the class process taking
place in a farm, we would need to examine the concrete ways in which value is produced
and appropriated: in capitalist farms, wage workers would produce not just value, but also
surplus value which would be appropriated by the capitalist (Marx, 1967, 1981; Resnick
and Wolff, 1987). Furthermore, another common characteristic of capitalist farms as
opposed to peasant farms would be the economizing on the labor power applied to every
unit of land. On the other hand, peasant farms which do not pay for labor power would be
expected to apply more labor per hectare than capitalist farms (Chayanov, 1966;
Vergopoulos and Amin, 1975).
If organic farms are larger farms in terms of land size, we should probably expect to see
them use more labor, even if we don't take into account the common assumption that
organic methods of production are more labor-‐intensive than conventional methods
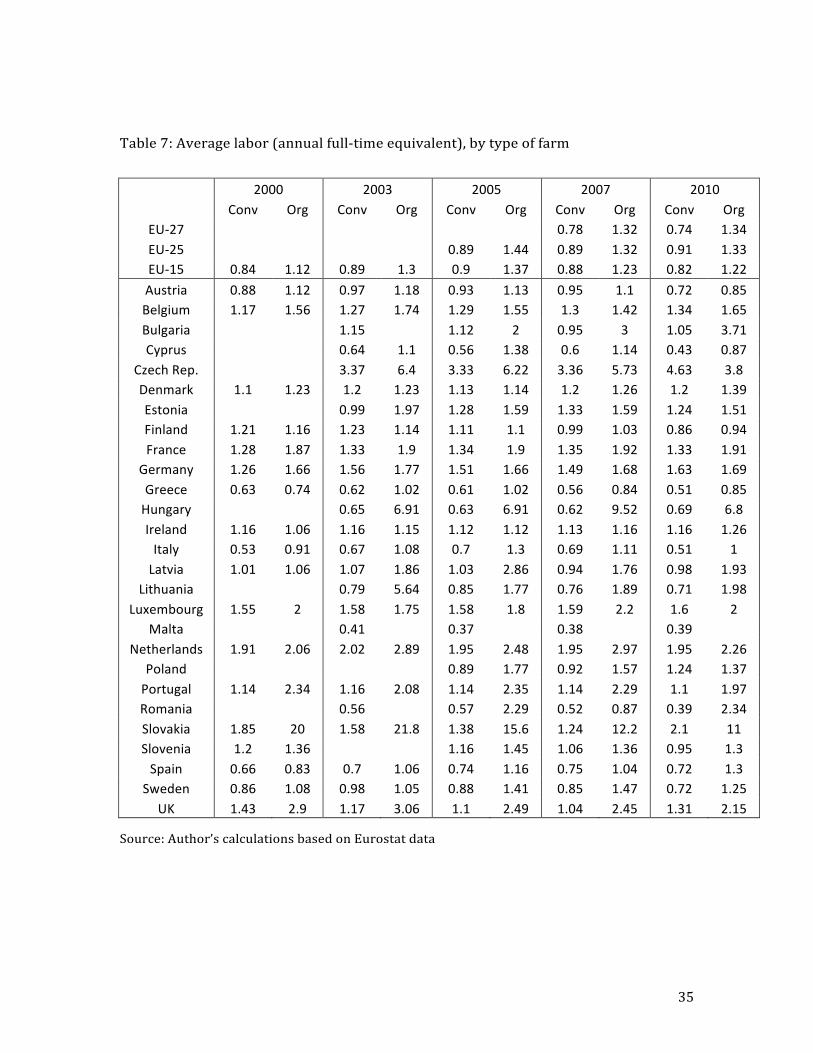
(Altieri, 1987). Table 7 displays how many units of full-‐time labor power (measured in
Annual Work Units) are, on average expended in conventional and organic agricultural
holdings in Europe14. It is certainly difficult to draw general conclusions for diverse
economies by looking at the average number of workers per farm. What we notice though
is that the average labor per farm is almost universally higher for organic farms than for
conventional farms. In certain countries, such as Hungary or Slovakia, the average number
of full-‐time workers in organic farms is so high that we should consider (just by looking at
this table alone) the fact that such high labor requirements can only be satisfied by recourse
to wage-‐labor.
###Table 7 here###
###Table 8 here###
Organic farms are frequently assumed to have higher labor requirements than
conventional farms for every unit of land15: the reason is that organic farmers cannot use
pesticide to combat pest, hence having to resort to more labor-‐intensive processes such as
weeding. Subsequently one should expect organic farms to generate positive employment
14 1 Annual Work Unit is the equivalent of a year round full-‐time employee. 15 See van der Ploeg et al. (2002); Soil Association (2006).
15
effects. Surprisingly table 8 shows that on average organic farms in Europe are less labor-‐
intensive than their conventional counterparts. At the EU-‐27 level, organic farms utilize
approximately half the labor per hectare as compared to their conventional counterparts
(0.28 as opposed to 0.54 full-‐time workers per 10 hectares, or a full-‐time worker for every
35.7 hectares of organic land as opposed to a full-‐time worker for every 18.5 hectares for
conventional holdings). Again, countries like Greece or Latvia are particularly interesting,
as in their cases, the labor intensity per hectare was initially higher for organic farms rather
than for conventional farms. By the end of the 2000-‐2010 period, this is no longer the
case16.
How do organic farms manage to display such a pattern? Using regional data for the
use of machinery by different types of farms for 2005 we observe that organic farms utilize
capital at a higher frequency than conventional farms. As table 9 shows, organic farms are
more likely to have tractors and irrigation equipment, as well as to be in possession of their
own cultivators and combine harvesters. The average percentage of organic farms that
possess tractors or similar equipment is 91%, as opposed to 76% for conventional farms
across different European regions. 27% of organic farms have irrigation equipment as
opposed to 20% for their conventional counterparts. 32% of organic farms are in
possession of their own cultivators, as opposed to 26% for their conventional counterparts,
whereas 15% of organic farms own combine harvesters, as opposed to 11% for
conventional farms17.
One could raise the objection that the reason for the difference in the share of organic
farms that are mechanized may be organic farms' being disproportionately concentrated in
activities that require the use of such machinery. In fact, specialist permanent crops, such
as vineyards, olives, and fruit production are overrepresented in organic production as
compared to conventional production. If these production processes were to demand a
higher degree of mechanization, then we may mistakenly associate organic farming with
mechanization. To address this potential objection, I include in table 9 the relevant
comparisons for the two most common types of farming, specialist field crops (which
includes specialist cereals, oilseed and protein crops, as well as field crops such as tobacco
or cotton) and specialist grazing livestock (which includes dairy farms, cattle rearing, sheep,
16 Unsurprisingly both organic and conventional farms exhibit a trend towards less utilization of labor per hectare. 17 In addition to being economically significant, a t-‐test shows that these differences are statistically significant different than zero at the 1% level.

16
goats and other grazing livestock). We notice that in both cases, organic farms are more
mechanized than conventional farms along all four dimensions that are present in our data.
###Table 9 here###
###Figure 3 here###
Figure 3 shows the development of the relationship between wage labor (as a share of
total agricultural labor) and organic share of agriculture over time. The scatterplot on the
left shows the existence of a (weak) negative relationship between the share of wage labor
in agriculture (on the vertical axis) and the share of utilized agricultural area that is
cultivated under organic methods of production (on the horizontal axis) in 2000. In 2011,
this relationship has been replaced by a positive correlation between wage labor and
organic farming, i.e. countries in which wage labor is more common in agriculture appear
generally to also have a higher share of their agricultural area under organic methods.
Thus, organic farming is generally more visible in regions where wage-‐labor is common.
4.3 Environmental dimensions of capitalist organic
The previous sections illustrate that organic farms in Europe are larger than
conventional farms. Additionally, contrary to the usual assumption of higher labor
intensity, organic farms appear to use less labor per hectare than their conventional
counterparts. This is enabled by the use of machinery, which takes place to a higher degree
than for conventional farms. The higher use of machinery and the lower use of labor are
characteristics associated with capitalist rather than with peasant farming: so is wage labor,
which appears to be positively correlated with the organic share of agriculture. Although
capitalist is not a legal category, one would probably expect capitalist structures of
production to be more likely to be incorporated than non-‐capitalist ones. As one notices in
table 10 which displays the percent of corporate farms in different countries for
conventional and for organic farms, organic farms are more likely to be incorporated than
their conventional counterparts: thus, 6.1% of organic farms at the EU-‐27 are incorporated
as opposed to only 2.4% for conventional farms. The pattern of the corporate legal form
being more likely for organic than for conventional farms is present in 22 out of the 26
countries for which comparable data exists.
17
###Table 10 here###
###Table 11 here###
All the elements presented so far point to the capitalist organization of organic farming.
A further element that is associated with the industrial character of European organic
agriculture is the presence of monocultures. Organic farming is often associated with the
implementation of agro-‐ecological principles, such as crop rotation, nitrogen fixing through
cover crops, polycultures or integrated crop-‐livestock systems (Altieri, 1987; Sonnino et al.
2008). However, as table 11 shows European organic farms are not very different from
conventional farms in that specialist farming systems are more common than mixed
farming systems. One notices that in several countries (e.g. Sweden, Italy) the extent of
specialist systems has increased for organic farms over the last 10 years, and that in 13
countries specialist methods are more predominant in organic land than what they are in
land cultivated under conventional methods.
5. Discussion
The preceding sections present us with a rather clear refutation of the association
between ``small'' and ``organic'' in Europe. Organic farms in Europe appear to have
characteristics that are associated with capitalist rather than with peasant structures. They
operate on significantly larger holdings in terms of land size and are more mechanized than
their conventional counterparts. Furthermore, they employ less labor per hectare than
conventional farms. Since the labor requirements per farm are larger, they usually employ
wage-‐labor rather than family labor or other forms traditionally associated with peasant
agriculture. This takes place during a period of stated policy support for small or family
farms; ironically, organic farming is often presented as a ``success story'' for combating
rural depopulation and environmental degradation.
This phenomenon can be explained, consistently with Marxist literature, as a case of
concentration and centralization of capital (Panitisidis, 1992; Liodakis, 1994l Economakis,
2000; Tolios, 2009). These authors claim that the CAP, despite its assertions to the contrary,
attempts to facilitate the penetration of capital in the agricultural sector as predicted by
Kautsky and Lenin. Consequently, even if they assert the protection of the family farm as
their political priority, all policies falling under the CAP ultimately support capitalist
structures and attempt to create these, when they don't exist. Hence, the support for
18
organic farms should be considered an avenue for the further intrusion of capital in the
agricultural sector, a very welcome development in a context of falling profit rates and
declining legitimacy for capital18.
Another way, which is consistent with the literature on development and which avoids
attributing bad intentions to those designing and implementing the CAP would be to think
in terms of technology adoption and diffusion 19 . Drawing lessons from the Green
Revolution, one could argue that, for reasons of higher income, access to credit, political
power, education, and ability to take risks, large farmers are more likely to differentiate
partly or to transition wholly to organic production earlier than small farmers. However
this explanation does not address the fact that the number of organic farmers has not been
increasing in Europe as fast as organic land. In fact, in many European countries, the
number of organic farmers has stagnated or even decreased since the late 1990s
(Konstantinidis, 2012).
Institutional biases, such as minimum land requirements for a holding to be certified as
organic, may constitute a further reason why small farmers may be excluded from switching
successfully to organic production. In the absence of strong farmers' associations or local
food networks, small organic farmers cannot establish their position as easily as larger
ones. Thus, if farmers do not associate with other organic farmers, they still have to pay
high interest rates to banks, and high procurement prices to input providers, while their
access to markets is not guaranteed as a result of their small volume of production20. Greek
organic farmers, for example, often resort to selling their organic production as
conventional, because the few organic wholesale merchants in the country do not want to
deal with small volumes of production (Konstantinidis, 2012). Similar difficulties have been
documented for other countries: small organic farmers in Hungary in the early 1990s found
it difficult to sell their product; it was only after 1995 that an export-‐oriented organic
sector, dominated by large farms, was developed in Hungary (Kovács and Frühwald, 2005).
In Estonia, lack of funding and knowledge of small-‐scale processing has made it difficult for
18 For the falling profit rates see McNally (2011) and Basu and Manolakos (2013). For environmental regulation as a way of opening up new pathways for capitalism see Vlachou (2004). 19 See, for example, Feder and O’Mara (1981) or Albrecht (1974). For an analysis of organic farming as the diffusion of an innovation see Padel (2001). 20 Policies of public procurement of organic product would provide with a way for small organic farmers to be assured of the sales of their product. The case of Piacenza is documented by Bocchi et al. (2009). Since 2001, Emilia-‐Romagna mandates that 100% of meals in day care facilities and at least 70% of meals in primary and secondary schools be organic. See also Loes and Nolting (2009).
19
small-‐scale farmers to make their product available in local markets (Estonian Organic
Farming Foundation, 2012).
Furthermore, certification is more expensive for smaller farms in comparison to larger
ones, allowing them to retain a smaller part of the subsidy they receive. Larger farms are
also more likely to be able to afford the services of agronomists specialized in tackling
production problems associated with organic farming. In the absence of the technical (and
even psychological) support provided by the community of other organic farmers, small
producers are likely to be discouraged and to exit production21.
These results challenge the idea that small farms, which theoretically should be
presented with fewer problems than larger farms for the transition to (certified) organic
processes, actually take advantage of the new policies. Hence, it becomes difficult to
articulate the claim that the discrepancy between organic and conventional farms is a
temporary phenomenon, happening for reasons advanced by the adoption/diffusion
framework, which would be ameliorated over time with the growing appearance of organic
methods. The same institutional factors allow larger farms to generate super-‐profits and to
receive surplus transfers in the form of pecuniary transfers for the provision of
environmental services. This explains the change in the profile of organic farmers: whereas
the first explicitly organic farmers in most European countries were smaller farmers, often
without previous farming background, entering organic farming out of idealistic
motivations, the more recent recruits to organic farming appear to be larger and profit-‐
driven (Padel, 2001; Schermer, 2003, 2008; Bartel-‐Kratochvil and Schermer, 2008;
Konstantinidis, 2012; Herre, 2013). Thus, the organic sector develops forms of production
which deviate more and more from the social and environmental ideals of the more radical
segments of the organic movement. Hence, the creation of large farms which specialize in
monocultures and sell in distant markets, but abstain from using chemicals and pesticides,
can be considered evidence of the ``conventionalization'' of organic farming in Europe, a
phenomenon that has been clearly documented for the US, most prominently by Julie
Guthman22 (Buck et al. 1997; Guthman, 1998, 2004), but whose presence in European
agriculture has been rejected by a series of authors (Michelsen, 2001; Campbell and Liepins,
2001, Kaltoft, 2001).
21 This was the case in certain regions of Austria in the late 1990s and in Greece between 2008 and 2010. 22 See also Allen and Kovach (2000). Michael Pollan also presents clear images of conventionalized organic agriculture (Pollan, 2005).
20
Using a class-‐analytic lens, we can understand certification expenses, agronomists’
fees, and merchant and financial profits in exchange for access to markets and liquidity
respectively as different claims on the surplus produced by farmers that are then
transferred outside the agricultural sector (Resnick and Wolff, 1987). Capitalist farms are
more effective in retaining a larger part of their surplus value that they produce as opposed
to smaller organic farms, which are squeezed by these payments. However, it is significant
to note that there is no technical reason why organic farming should be large-‐scale farming.
Strong agricultural cooperatives and other effective forms of farmers' associations could
also help decrease the rents farmers pay to certifiers, finance and input providers and
merchants, while providing them with the economic and technical support to compete
effectively against larger-‐scale farms. This form of association would empower small
farmers, allowing them not to just to experiment with organic farming but to transition
successfully and permanently to organic methods of production.
6. Conclusions This paper shows that the rise of organic agriculture in Europe is not associated with
elements of peasant agriculture, but rather with capitalist forms of organization of
production. Agricultural policies in the European Union, which focus on increasing the
prevalence of organic methods in the European countryside, have uncritically assumed that
organic farms would be small farms. By doing so, they have missed that the organic sector
of the EU has created new opportunities for large farms, therefore not delivering the
employment gains frequently associated with organic farming. Thus, organic farms in the
EU are larger in terms of farm size and more mechanized than conventional farms,
disproving the association between small-‐scale farming and organic methods, which is often
held as an axiomatic truth. Furthermore, organic farms use labor less intensively than
conventional farms, casting doubt on the efficacy of organic farming in increasing labor
demand in marginalized communities and acting as an effective tool for keeping rural
residents in the countryside. Finally, organic farms are more likely to be corporate farms
than their conventional counterparts.
The problem, however, does not lie in organic farming per se. For small farms to make
a successful transition to organic methods, they need to be effective in retaining a larger
part of the surplus that they produce. Large capitalist production is not the only way to
21
achieve this outcome: another potent way could be through agricultural cooperatives and
other forms of farmer associations. These forms of organization would assist their members
in getting access to the market, cheap certification, equipment and technical assistance,
better terms of financing investment, as well as emotional support from others who
experience the same challenges as they do. Such associations could also move beyond
advancing the position of their members and effectively enforce high standards in the
treatment of labor, while helping Europe move towards more ecologically and socially
sustainable methods of production. Finally, these forms of organization could empower
farmers and provide a much-‐needed example for European workers even outside the
agricultural sector by illustrating that it is possible to find collective solutions to shared
problems.
References Albrecht, H. 1974. Die Verbreitung von Neuerungen: der Diffusionsprozess. Der
Förderungsdienst, 22(2), 33-‐40.
Allen, P. and M. Kovach. 2000. The capitalist composition of organic: The potential of
markets in fulfilling the promise of organic agriculture. Agriculture and Human
Values, 17, 221-‐232.
Amin, S. 2011. Food Sovereignty: A Struggle for convergence in diversity. In: E. Holt-‐
Gimenez, ed. Food Movements Unite!: Strategies to transform our food systems.
Oakland, CA: Food First Books.
Altieri, M.A. 1987. Agroecology: The Scientific Basis of Alternative Agriculture. Boulder,
Colorado: Westview Press.
Bartel, Kratochvil, R. and M. Schermer. 2008. Regionale Vermarktung in Österreich,
Ökologie & Landbau , 147(3), 30-‐32.
Bartell, T. 1975. Agrarian violence: A comparative analysis of recent farm movements
in Europe and North America. Paper presented at the Annual Meeting of the Rural
Sociological Society (San Francisco, CA, August, 21-‐24, 1975).
Basu, D. and P.T. Manolakos. 2013. Is there a tendency for the rate of profit to fall?
22
Econometric evidence for the U.S. economy, 1948-‐2007. Review of Radical Political
Economics 45(1), 76-‐95.
Bocchi, S., R. Spigarolo, M.V. Sarti, and B. Nolting. 2009. Organising supply chains of
organic products for Italian school meals – the case of the province and the city of
Piacenza. In B. Nolting, ed. Proceedings of the iPOPY seminar held at the BioFach
February 20th 2009 in Nuremberg, Germany. Number 1991 Core Organic Project
Series Report.
Bove, J. and F. Dufour. 2002. The World is not for sale: Farmers against Junk Food. New
York: Verso Books.
Boyce, J.K. 2006. A future for small farms? Biodiversity and sustainable agriculture. In:
J.K. Boyce, S. Cullenberg, P.K. Pattanaik, and R. Pollin, eds. Human Development in
the Era of Globalization, Northampton, MA: Edward Elgar.
Buck, D., C. Getz, and J. Guthman. 1997. From farm to table: The organic vegetable
commodity chain of Northern California. Sociologia Ruralis, 37(1), 3-‐20.
Buller, H., G.A. Wilson and A. Höll. 2000. Introduction: the emergence of regulation
2078. In: H. Buller, G.A. Wilson and A. Höll, eds. Agri-‐environmental policy in the
European Union. Aldershot: Ashgate.
Campbell, H. and R. Liepins. 2001. Naming organics : Understanding organic standards
in New Zealand as a discursive field. Sociologia Ruralis, 41(1), 21-‐39.
Chayanov, A.V. 1966. The Theory of Peasant Economy. Homewood, IL: Richard D. Irwin,
Inc.
Cooper, T., K. Hart, and D. Baldock. 2009. The provision of public goods through
agriculture in the European Union. Report Prepared for DG Agriculture and Rural
Development, Contract No. 30-‐CE-‐0233091/00-‐28, Institute for Environmental
Policy, London.
Council of the European Communities 1973. Declaration of the Council of the European
Communities and of the representatives of the Governments of the Member States
meeting in the Council of 22 November 1973 on the programme of action of the
European Communities on the environment. Official Journal C112. 20.12.73.
Djurfeldt, G. 1981. What happened to the agrarian bourgeoisie and rural proletariat
under monopoly capitalism? Some hypotheses derived from the classics of
23
Marxism on the agrarian question. Acta Sociologica, 24(3), 167-‐191.
Economakis, G. 2000. Historical Modes of Production: Capitalist System and Agriculture.
Athens: Ellinika Grammata (in Greek).
Estonian Organic Farming Foundation 2012. Organic Farming in Estonia 2011.
Ministry of Agriculture, Republic of Estonia. Talinn, Estonia.
European Commission 1985. Communication from the Commission to the Council and
Parliament: Perspectives for the Common Agricultural Policy. COM(85) 333 Final,
15.07.85. Luxemourg: Office for Official Publications of the European Communities.
European Commission 2009. Technical report, Directorate-‐General for Agriculture and
Rural Development.
European Network for Rural Development 2010. Public goods and public intervention
in agriculture. Technical report, European Commission: Agriculture and Rural
Development.
European Union 2006. Consolidated versions of the Treaty on European Union and of
the Treaty establishing the European Community.
Feder, G. and G.T. O’Mara 1981. Farm size and the diffusion of green revolution
technology. Economic Development and Cultural Change 30(1), 59-‐76.
Garzon, I. 2006. Reforming the Common Agricultural Policy: History of a Paradigm
Change. New York, NY: Palgrave Macmillan.
Githinji, M.w. and S. Cullenberg 2003. Deconstructing the peasantry: Class and
development in rural Kenya. Critical Sociology 29(1), 67-‐88.
Goodman, D. and M. Redclift 1982. From Peasant to Proletarian: Capitalist Development
and Agrarian Transitions. New York: St. Martin’s Press.
Guthman, J. 1998. Regulating meaning, appropriating nature: The codification of
California organic agriculture. Antipode 30(2), 135-‐154.
Guthman, J. 2004. The trouble with organic ‘lite’ in California: a rejoinder to the
‘conventionalisation’ debate. Sociologia Ruralis 44(3), 301-‐316.
Herre, R. Land concentration, land grabbing and options for change in Germany. In:
Land concentration, land grabbing and people’s struggles in Europe. European
Coordination Via Campesina.
Hobsbawm, E. 1996. The Age of Extremes: A History of the World , 1914-‐1991. New
24
York: Vintage Books.
Ingersent, K.A. 1990. Agriculture in the Uruguay Round: A European perspective.
University of Minnesota, Institute of Agriculture, Forestry and Home Economics,
Staff Paper Series P90-‐2.
Ingersent, K.A. and A. Rayner 1999. Agricultural Policy in Western Europe and the
United States. Northampton, MA: Edward Elgar.
Kaltoft, P. 2001. Organic farming in late modernity: At the frontier of modernity or
opposing modernity? Sociologia Ruralis 41(1): 146-‐158.
Kautsky, K. 1988a. The Agrarian Question. Volume 1. London: Zwan Publications.
Kautsky, K. 1988b. The Agrarian Question. Volume 2. London: Zwan Publications.
Kitching, G. 1980. Class and Economic Change in Kenya: The making of an African Petite-‐
Bourgeoisie. New Haven: Yale University Press.
Kommission 1968. Memorandum zur Reform der Landwirtschaft in der Europäischen
Wirtschaftsgemeinschaft. KOM(68), Teil A, 18.12.68. Brussel; Kommission der
Europäischen Gemeinschaften.
Konstantinidis, C. 2012. Organic Farming and Rural Transformations in the European
Union: A Political Economy approach. Open access dissertations, paper 614,
University of Massachusetts Amherst.
Konstantinidis, C. 2013. Assessing the socio-‐economic consequences of the rise of
organic farming in the European Union. University of Massachusetts Boston,
Economics Department Working Paper 2013-‐05.
Kovács, A. and F. Frühwald 2005. Organic farming in Hungary in 2005. Originally
published at the organic-‐europe.net website. Now archives at the Organic-‐World
website, maintained by the Research Institute of Organic Agriculture (FiBL), Frick,
Switzerland. http://www.organic-‐
europe.net/fileadmin/documents/country_information/ARCHIVE/hungary-‐2005-‐
organic-‐europe.pdf.
Lenin, V. 1974. The Development of Capitalism in Russia. Moscow: Progress Publishers.
Lewontin, R. C. 2000. The maturing of capitalist agriculture: Farmer as proletarian. In
F. Magdoff, J.B. Foster, and F.H. Buttel, eds., Hungry for Profit: The Agribusiness
Threat to Farmers, Food, and the Environment. New York: Monthly Review Press.
25
Liodakis, G. 1994. Land rent, interest rate and agricultural prices: Economic aspects of
the agrarian question. Athens: Synchroni Epochi (in Greek).
Loes, A.-‐K. and B. Nölting 2009. Organic school meal-‐systems – towards a more
sustainable nutrition. Agronomy Research 7 (Special Issue II), 647-‐653.
Louloudis, L. and N. Maraveyas 1997. Farmers and agricultural policy in Greece since
the accession to the European Union. Sociologia Ruralis 37(2), 270-‐286.
Lynggaard, K. 2006. The Common Agricultural Policy and Organic Farming: An
Institutional Perspective on Continuity and Change. Oxfordshire: CABI Publishing.
Marsden, T. 2003. The Condition of Rural Sustainability. Assen, The Netherlands: Royal
Van Gorcum.
Marx, K. 1967. Capital: Vol. I. New York: International Publishers.
Marx, K. 1981. Capital: Vol. III. London: Penguin Books.
McNally, D. 2011. Global Slump: The economics of politics of crisis and resistance.
Oakland, CA: PM Press.
Michelsen, J. 2001. Recent development and political acceptance of organic farming in
Europe. Sociologia Ruralis 41(1), 3-‐20.
Nelson, E. 1983. Capitalism in western agriculture: A comment. Acta Sociologica,
26(3/4), 281-‐285.
Padel, S. 2011. Conversion to organic farming: A typical example of the diffusion of an
innovation? Sociologia Ruralis 41(1), 40-‐61.
Panitsidis, G. 1992. Approaching the Class Structure of our Agricultural Economy.
Athens: Synchroni Epohi (in Greek).
Patnaik, U. 1971. Capitalist development in agriculture. Economic and Political Weekly
39, 123-‐130.
Pohl, A. 2009. The Future of Organic Farming in Europe: How do European Rural
Development Programmes support Organic Farming? Brussels, Belgium:
International Federation of Organic Agriculture Movements EU Group.
Pollan, M. 2005. The Omnivore’s Dilemma: A Natural History of Four Meals. New York,
Penguin Books.
Raikes, M. 1982. Djurfeldt’s ‘what happened to the agrarian bourgeoisie and rural
proletariat under monopoly capitalism?’ A comment. Acta Sociologica 25(2), 159-‐
26
165.
Redclift, M.1987. Sustainable Development: Exploring the Contradictions. London:
Routledge.
Resnick, S.A. and R.D. Wolff. 1987. Knowledge and Class: A Marxian Critique of Political
Economy. Chicago: University of Chicago Press.
Snaders, J. 2011. Towards a typology of public support policies addressing organic
farming. In: J. Sanders, M. Stolze, and S. Padel, eds., Use and efficiency of public
support measures addressing organic farming, Johann Heinrich von Thünen-‐
Institut.
Schermer, M. 2003. Bauer-‐Power-‐Bioregionen. Das Potenzial des biologischen
Landbaues für die ländliche Regionalentwicklung in Österreich. Ph.D. thesis,
Leopold Franzens Universität Innsbruck.
Scrieciu, S.S. 2011. Socioeconomic and Environmental Impacts on Agriculture in the New
Europe: Post-‐Communist transition and accession to the European Union. London:
Routledge.
Shucksmith, M. K. Thomson and D. Roberts 2005. The CAP and the Regions: The
Territorial Impact of the Common Agricultural Policy. Oxfordshire: CABI Publishing.
Soil Association 2006. Organic works: Providing more jobs through organic farming
and local food supply. Soil Association, Bristol.
Sonnino, R. Y. Kanemasu, and T. Marsden 2008. Sustainability and rural development.
In: J.D. van der Ploeg and T. Marsden, eds.. Unfolding Webs: The Dynamics of
Regional Rural Development. Assen, The Netherlands: Royal Van Gorcum.
Stolze, M and N. Lampkin 2009. Policy for organic farming: Rationale and concepts.
Food Policy 34, 237-‐244.
Thorner, A. 1982. Semi-‐feudalism or capitalism? Contemporary debates on classes and
modes of production in India. Economic and Political Weekly 17(51), 2061-‐2066.
Thorner, D. 1969. Capitalist farming in India. Economic and Political Weekly, 4(52),
A211-‐A212.
Tolios, G. 2009. Environment and Agricultural Policy under Globalization: An Alternative
Strategy for Food Sovereignty. Athens: Kapsimi (in Greek).
Van der Ploeg, J.D. 2009. The New Peasantries: Struggles for Autonomy and
27
Sustainability in an Era of Empire and Globalization. London: Earthscan.
Van der Ploeg, J.D., A. Long and J. Banks 2002. Introduction. In: J.D van der Ploeg, A.
Long, and J. Banks, eds. Living Countrysides: Rural Development Processes in
Europe: The State of the Art. Doetinchem, The Netherlands: Elsevier.
Vergopoulos, K. and S. Amin 1975. Capitalisme difforme: essai sur l’agriculture dans le
capitalisme. Athens: Papazisis (in Greek).
Vlachou, A. 2004. Capitalism and ecological sustainability: the shaping of
environmental policy. Review of International Political Economy 11(5), 926-‐952.
Vogl, C. R. Haas, and S. Kummer 2005. Organic Farming in Austria: Idealism vs. market
realism in the organic farming movement. Institute for Organic Farming, Vienna,
Austria.
Winter, M. 1982. What happened to the agrarian bourgeoise and rural proletariat
under monopoly capitalism? A reply to Göran Djurfeldt. Acta Sociologica 25(2),
147-‐157.
Woods, M. 2003. Deconstructing rural protest: The emergence of a new social
movement. Journal of Rural Studies. 19(3), 309-‐325.
28
TABLES
Table 1: Percent of wage labor in European agriculture, 1973-‐2012
1973 1979 1990 1993 1995 1997 2000 2003 2005 2007 2010 2012 EU27 18.5 20.0 20.5 21.5 23.2 23.7 EU25 23.3 23.5 24.1 24.8 25.6 25.9 EU15 25.1 25.7 26.0 28.4 28.6 29.9 31.0 32.5 33.2 EA12 24.3 24.9 25.3 28.0 28.2 29.6 30.7 32.3 32.9 Austria 8.8 7.3 8.2 6.5 7.2 8.0 9.3 9.9 11.6 12.7 13.9 Belgium 9.8 9.0 11.9 12.9 14.3 13.2 15.2 18.0 15.3 15.0 16.5 18.2 Bulgaria 10.3 10.3 13.3 14.8 17.1 17.1 Cyprus 19.5 21.9 27.2 26.6 28.7 28.9 Czech Rep. 84.9 84.3 82.0 71.9 75.9 75.6 Denmark 17.9 20.8 26.4 27.1 27.5 29.7 31.7 35.0 35.6 39.6 45.7 46.9 Estonia 53.7 38.0 26.0 38.9 38.1 41.0 47.2 47.6 Finland 2.6 3.7 3.9 8.7 9.2 15.0 17.7 17.4 17.7 19.5 21.6 France 16.7 16.8 19.2 21.4 23.1 25.3 28.8 30.2 31.2 31.8 33.1 33.9 Germany 31.0 31.3 33.0 33.9 35.4 36.4 36.6 41.0 41.5 Greece 8.8 11.9 13.7 13.3 15.8 19.9 18.9 18.7 18.7 19.4 Hungary 23.1 18.8 21.2 21.3 21.9 24.2 23.9 24.7 Ireland 9.8 8.8 9.6 8.7 8.9 8.8 4.7 9.3 7.7 7.7 Italy 36.3 35.0 32.8 30.2 30.7 28.6 34.1 36.1 35.7 37.5 Latvia 16.0 13.3 14.5 14.0 17.7 19.0 19.4 Lithuania 31.6 21.2 21.2 23.0 25.7 27.1 27.0 Luxembourg 4.7 5.2 10.0 11.1 12.2 13.0 14.0 15.0 17.5 15.8 21.6 23.7 Malta 3.9 4.3 6.5 6.7 6.4 7.0 9.8 9.5 10.2 10.2 Netherlands 27.0 29.3 30.4 30.8 33.6 36.7 37.7 40.2 40.5 40.8 Poland 7.3 6.2 5.9 5.7 6.3 5.4 5.4 Portugal 14.6 17.0 17.9 19.1 18.1 16.3 16.5 18.2 17.6 19.1 18.3 Romania 10.4 6.3 9.9 9.4 9.6 12.8 14.2 Slovakia 62.5 56.4 55.8 58.7 57.5 55.9 71.8 71.6 Slovenia 5.5 5.6 6.5 8.3 9.4 7.9 10.8 11.3 Spain 27.8 26.4 28.3 31.3 38.6 37.9 37.2 38.6 41.6 41.3 Sweden 25.2 26.2 28.5 28.5 28.4 25.7 27.5 29.2 30.3 30.3 30.3 30.3 UK 45.6 44.8 40.3 38.4 37.6 37.0 35.9 34.3 34.3 34.4 35.1 35.5
Source: Author’s calculations based on Eurostat website data
29
Table 2: Average farm size (in ha), by type of farm
2000 2003 2005 2007 2010 Conv Org Conv Org Conv Org Conv Org Conv Org EU-‐27 12.3 40.4 13.8 47 EU-‐25 15.7 42.4 16.4 40.6 19.2 46.9 EU-‐15 18.4 33.4 19.3 40.1 20.5 39.8 21.2 38 23.1 41.2 Austria 16.7 20 18.4 21.3 18.7 22.9 18.9 22.3 18.6 22.8 Belgium 22.4 43 25.2 43.8 26.7 45.3 28.4 52.9 31.3 56.5 Bulgaria 4.4 5.1 64.3 6.2 84.7 12 82.4 Cyprus 3.5 5.6 3.3 6.2 3.6 8 3 7.9 Czech Rep. 75.7 402.6 79.7 398.6 84.5 334.6 147 227.5 Denmark 45.3 56 54.2 63.3 52 61.5 59.2 68.3 61.9 80.8 Estonia 21.1 86.6 28.9 70.2 37.4 73.3 45.4 92.7 Finland 27.1 31.4 29.7 34.2 31.8 36.3 33.3 39.7 35.4 44.8 France 41.9 46.9 45.1 56.5 48.5 60.2 52 59.8 54 55.3 Germany 36 51.1 40.8 55.2 43.2 56.4 45.2 58.5 55.6 60.2 Greece 4.4 4.8 4.7 11.7 4.7 12.9 4.5 10.7 4.6 14 Hungary 4.6 68.8 5.4 197.6 5.7 193 6.5 350.3 7.6 346.7 Ireland 31.5 26.8 31.7 29.3 31.8 34.2 32.2 38.3 35.7 36.9 Italy 5.8 18 6.4 19.6 7 21.5 7.2 24.3 7.4 27.5 Latvia 10.3 7.6 11.6 36.3 13 64.8 15.7 44.8 20 64.3 Lithuania 9.1 90.6 10.9 41.7 11.1 71 12.9 85.3 Luxembourg 45.3 51.5 52.3 52.8 52.6 58.2 56.8 63.8 59.7 56.7 Malta 1 0.9 0.9 0.9 Netherlands 19.9 30.7 23 58.4 23.7 40.4 24.7 42.8 25.8 38.1 Poland 5.9 23 6.4 25.5 9.4 31.6 Portugal 9 145.8 10 157.7 10.9 172 12.1 127.1 11.7 109.2 Romania 3.1 3.3 143.2 3.5 19 3.4 70.6 Slovakia 19.7 854.8 28.6 1402 26.7 737.4 26.5 588.1 70.9 607.1 Slovenia 5.6 8.6 6.2 13.9 6.3 15.9 6.2 15.4 Spain 20.1 40.1 21.7 67.8 22.6 55.2 23.3 57.9 23.5 55.3 Sweden 36 51.4 44.7 50.8 40.3 89.9 40.6 97.4 39.9 97.8 UK 66.6 222.1 56.1 187.6 54.4 177.9 52.7 154 82.4 171.1
Source: Author’s calculations based on Eurostat data
30
Table 3: Average farm size (in ha), by type of farming activity – 2010
Field Crops
Permanent Crops Grazing Horticulture Granivorous Mixed crops
Mixed livestock
Mixed crop-‐livestock
Conv Org Conv Org Conv Org Conv Org Conv Org Conv Org Conv Org Conv Org
Austria 26.1 33.3 8.2 17.6 15.9 20.7 3.9 9.2 24.3 20.8 35.6 38.6 13.8 16.9 19.3 30 Belgium 34.1 82 15.3 17.3 34.3 63.9 7.7 12.2 17.9 24.3 42.9 57.4 40.9 61.3 47.3 80.8 Bulgaria 58.4 150.3 2.1 25.2 3.3 33 1.2 85 1
5.6 48 0.8
2.7 158
Cyprus 12.4 30.7 1.2 4.2 12.9 19 4.5 2 1.5
5 10 2.7
2.8 3 Czech Rep. 154.6 191.2 12.6 43.3 75.8 224.8 14.6
57.1
236.3 312 329.1 290 339.4 376.1
Germany 71.1 62.3 9.1 16.7 47.6 60.3 7.2 13.7 53.5 37.8 45.5 51 67.5 100.3 102.3 88.7 Denmark 56.8 54.3 27.5 25.5 55.2 105.6 21.1 47.6 139.3 78.4 87.2 86.8 115.5 61.8 67.9 81 Estonia 54.5 86.8 8.1 15.6 77.8 116.7 8.7 12 22
10.3 20.2 37.4 33.5 34.8 66.6
Greece 8.1 24.9 2.1 6.6 14.7 36.8 2.9 6.6 1.8 12.4 5.9 16.2 5.5 19.7 6.6 22.9 Spain 47.9 100.5 8.4 25.2 41.4 117.2 7.3 14.5 18.2 56.1 28.2 77.8 39.4 129.7 37.8 112.7 Finland 32.3 34.6 8.2 12.8 41.2 60.6 12.5 15.1 62.6 67.5 32.1 25.7 86.1 76 66.8 55.1 France 75.6 63.4 14.9 24 59.3 80.3 8.2 9 33.6 29.6 40.9 27.9 64.9 76.1 76.6 65.5 Hungary 22.6 278.2 1.6 34.1 16.8 892.8 2.9 68.5 0.7 41.5 8.2 184.9 8 833 8.9 701.3 Ireland 59.4 52.4 24
32.6 35.9 14.2 10 24.4
26.1 33 34.6 21.5 56.5 47.8
Italy 12.3 39.7 2.8 13.1 24.5 64.7 3.8 11.6 18.9 28.4 7 25.2 17.7 44.7 13.7 41 Lithuania 21 111.6 6.9 29.2 14.3 78 3.2 8 9.6
3.9 40.9 6.5 39.5 12.2 74.3
Luxembourg 32.9
4.4
75.9 76.7 15
68
49
69
71.2 54 Latvia 25 108.5 11.3 20.3 19.9 61.5 14.3 18 7.5 25.7 18.1 28 13.2 36.7 21.9 56.1 Netherlands 37.9 43.8 12.4 6.8 28 52 9.2 12.9 11.5 9.1 46.9 52.3 30.1 32.5 41.9 35.7 Poland 9.2 48.2 5.2 28.5 13.9 33.9 5.4 32.5 10.1 31.4 6.4 27.2 9.6 14.4 10 19.8 Portugal 19.4 35 5.2 28.1 32.9 268.3 2.9 8 4.7
5.8 15.7 7.4 96 9.4 236.8
Romania 8.2 397.7 1.8
4 12.9 1.7
0.4
2.8
2.3 44 2.3 229 Sweden 37.6 88.2 10.5 9.5 38.5 99.7 21.3 25.3 89 78.8 84.3 65.9 73.6 137.3 86.8 129.6 Slovenia 4.9 12.3 2.5 5.9 8.7 17.6 4.2 5 13.7
3.2 9 5.3 10.5 5.6 13.3
31
Slovakia 75.6 753.2 21.1 55 77.7 522.6 29.2
8.5
86.2
40.7 481 90.4 780.7 UK 104.1 180.1 30.7 30.5 75.5 171 18.1 22.3 30.4 89.1 81.3 101.5 40.8 137.4 124.7 250 Source: Author’s calculations based on Eurostat data
32
Table 4: Share of Area and Holdings, by land size -‐ 2010 (EU-‐27)
% Area % Holdings All Organic All Organic
Below 2 ha 2.4 0.2 46.9 0.6 2-‐4.99 ha 4.4 1.1 20.1 12.4 5-‐9.99 ha 5.3 3 10.9 16.6 10-‐19.9 ha 7.4 6.9 7.5 19.6 20-‐29.9 ha 5.4 6.1 3.1 10.6 30-‐49.9 ha 8.9 10.7 3.3 11.8 50-‐99.9 ha 16.9 19.6 3.3 12 Over 100 ha 50.1 52 2.7 10.6
Source: Author’s calculations based on Eurostat website data
33
Table 5: Share of Area and Holdings for farms above 100 ha – 2010, by country
% Area % Holdings All Organic All Organic
Austria 18.4 13 1.9 2.2 Belgium 24.6 30.1 5.3 13.3 Bulgaria 82.4 14.9 1.5 7.7 Cyprus 16.7 0 0.3 0
Czech Rep. 88.6 87.3 19.3 35.7 Germany 55.1 55.7 11.2 12.8 Denmark 66.1 72 19.2 25.7 Estonia 73.2 74.1 8.7 24.8 Greece 7.2 13.5 0.2 1.3 Spain 55.1 51.8 5.2 14.8 Finland 24.6 31.6 6 9.5 France 59.1 47.8 18.3 16.1 Hungary 64.7 84.8 1.3 42.4 Ireland 23 3.2 3.4 1.8 Italy 26.2 31.1 1 5.1 Latvia 41.6 63.6 1.9 22.9
Luxembourg 50.4 31.9 20 14.3 Lithuania 47 56.5 3.1 14.7 Malta 0 0 0 0
Netherlands 18.3 14.8 3.1 5.3 Poland 21.6 35.2 0.6 6.5 Portugal 57.7 68.4 2 21.1 Romania 48.9 82.1 0.4 15.1 Sweden 51.8 64.8 11.2 29.4 Slovenia 6.8 11.4 0.1 1.4 Slovakia 91.1 98.2 9.1 82.1
UK 72 78.9 21 44.6
Source: Author’s calculations based on Eurostat website data
34
Table 6: Percent of farms renting land, by type
2000 2003 2005 2007 Conv Org Conv Org Conv Org Conv Org
EU-‐27
16.9 42.1 EU-‐25
22.6 42.4 23.6 42.5
EU-‐15 24.9 37.2 27.5 46.3 22.6 42.4 23.6 42.5
Source: Author’s calculations based on Eurostat data
35
Table 7: Average labor (annual full-‐time equivalent), by type of farm
2000 2003 2005 2007 2010
Conv Org Conv Org Conv Org Conv Org Conv Org
EU-‐27
0.78 1.32 0.74 1.34 EU-‐25
0.89 1.44 0.89 1.32 0.91 1.33
EU-‐15 0.84 1.12 0.89 1.3 0.9 1.37 0.88 1.23 0.82 1.22 Austria 0.88 1.12 0.97 1.18 0.93 1.13 0.95 1.1 0.72 0.85 Belgium 1.17 1.56 1.27 1.74 1.29 1.55 1.3 1.42 1.34 1.65 Bulgaria
1.15
1.12 2 0.95 3 1.05 3.71
Cyprus
0.64 1.1 0.56 1.38 0.6 1.14 0.43 0.87 Czech Rep.
3.37 6.4 3.33 6.22 3.36 5.73 4.63 3.8
Denmark 1.1 1.23 1.2 1.23 1.13 1.14 1.2 1.26 1.2 1.39 Estonia
0.99 1.97 1.28 1.59 1.33 1.59 1.24 1.51
Finland 1.21 1.16 1.23 1.14 1.11 1.1 0.99 1.03 0.86 0.94 France 1.28 1.87 1.33 1.9 1.34 1.9 1.35 1.92 1.33 1.91
Germany 1.26 1.66 1.56 1.77 1.51 1.66 1.49 1.68 1.63 1.69 Greece 0.63 0.74 0.62 1.02 0.61 1.02 0.56 0.84 0.51 0.85 Hungary
0.65 6.91 0.63 6.91 0.62 9.52 0.69 6.8
Ireland 1.16 1.06 1.16 1.15 1.12 1.12 1.13 1.16 1.16 1.26 Italy 0.53 0.91 0.67 1.08 0.7 1.3 0.69 1.11 0.51 1 Latvia 1.01 1.06 1.07 1.86 1.03 2.86 0.94 1.76 0.98 1.93
Lithuania
0.79 5.64 0.85 1.77 0.76 1.89 0.71 1.98 Luxembourg 1.55 2 1.58 1.75 1.58 1.8 1.59 2.2 1.6 2
Malta
0.41
0.37
0.38
0.39 Netherlands 1.91 2.06 2.02 2.89 1.95 2.48 1.95 2.97 1.95 2.26
Poland
0.89 1.77 0.92 1.57 1.24 1.37 Portugal 1.14 2.34 1.16 2.08 1.14 2.35 1.14 2.29 1.1 1.97 Romania
0.56
0.57 2.29 0.52 0.87 0.39 2.34
Slovakia 1.85 20 1.58 21.8 1.38 15.6 1.24 12.2 2.1 11 Slovenia 1.2 1.36
1.16 1.45 1.06 1.36 0.95 1.3
Spain 0.66 0.83 0.7 1.06 0.74 1.16 0.75 1.04 0.72 1.3 Sweden 0.86 1.08 0.98 1.05 0.88 1.41 0.85 1.47 0.72 1.25
UK 1.43 2.9 1.17 3.06 1.1 2.49 1.04 2.45 1.31 2.15
Source: Author’s calculations based on Eurostat data
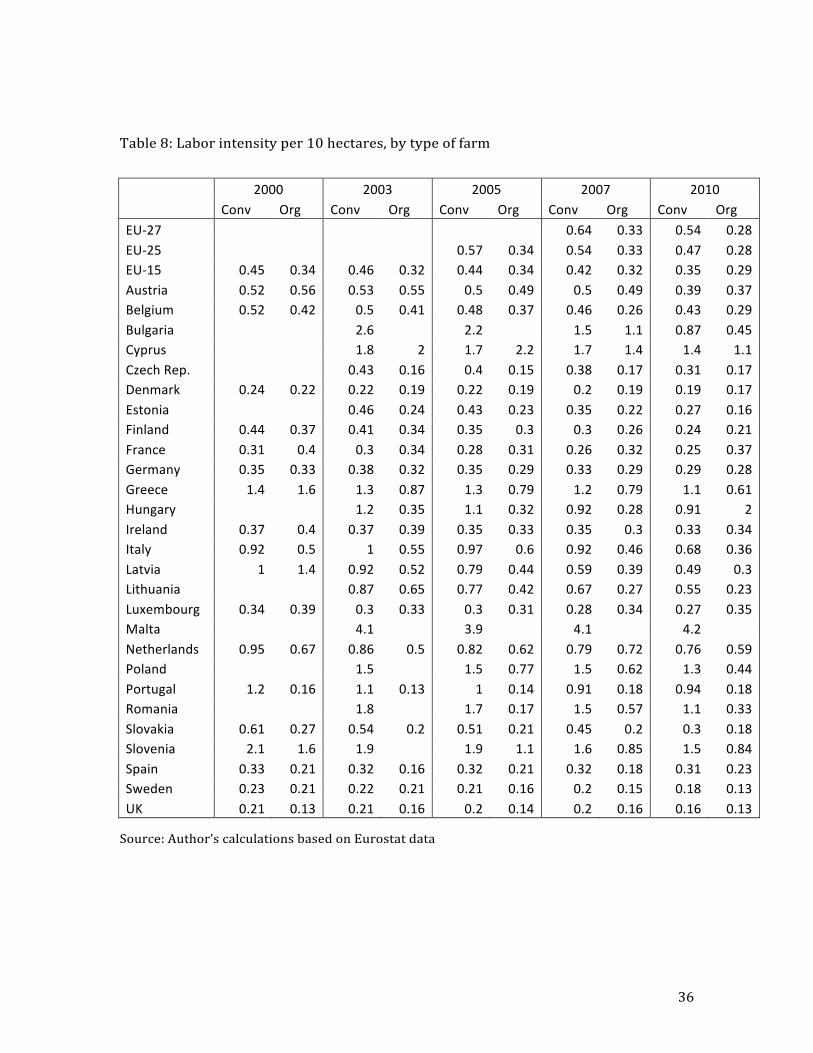
36
Table 8: Labor intensity per 10 hectares, by type of farm
2000 2003 2005 2007 2010 Conv Org Conv Org Conv Org Conv Org Conv Org EU-‐27
0.64 0.33 0.54 0.28
EU-‐25
0.57 0.34 0.54 0.33 0.47 0.28 EU-‐15 0.45 0.34 0.46 0.32 0.44 0.34 0.42 0.32 0.35 0.29 Austria 0.52 0.56 0.53 0.55 0.5 0.49 0.5 0.49 0.39 0.37 Belgium 0.52 0.42 0.5 0.41 0.48 0.37 0.46 0.26 0.43 0.29 Bulgaria
2.6 2.2
1.5 1.1 0.87 0.45
Cyprus
1.8 2 1.7 2.2 1.7 1.4 1.4 1.1 Czech Rep.
0.43 0.16 0.4 0.15 0.38 0.17 0.31 0.17
Denmark 0.24 0.22 0.22 0.19 0.22 0.19 0.2 0.19 0.19 0.17 Estonia
0.46 0.24 0.43 0.23 0.35 0.22 0.27 0.16
Finland 0.44 0.37 0.41 0.34 0.35 0.3 0.3 0.26 0.24 0.21 France 0.31 0.4 0.3 0.34 0.28 0.31 0.26 0.32 0.25 0.37 Germany 0.35 0.33 0.38 0.32 0.35 0.29 0.33 0.29 0.29 0.28 Greece 1.4 1.6 1.3 0.87 1.3 0.79 1.2 0.79 1.1 0.61 Hungary
1.2 0.35 1.1 0.32 0.92 0.28 0.91 2
Ireland 0.37 0.4 0.37 0.39 0.35 0.33 0.35 0.3 0.33 0.34 Italy 0.92 0.5 1 0.55 0.97 0.6 0.92 0.46 0.68 0.36 Latvia 1 1.4 0.92 0.52 0.79 0.44 0.59 0.39 0.49 0.3 Lithuania
0.87 0.65 0.77 0.42 0.67 0.27 0.55 0.23
Luxembourg 0.34 0.39 0.3 0.33 0.3 0.31 0.28 0.34 0.27 0.35 Malta
4.1 3.9
4.1 4.2
Netherlands 0.95 0.67 0.86 0.5 0.82 0.62 0.79 0.72 0.76 0.59 Poland
1.5 1.5 0.77 1.5 0.62 1.3 0.44
Portugal 1.2 0.16 1.1 0.13 1 0.14 0.91 0.18 0.94 0.18 Romania
1.8 1.7 0.17 1.5 0.57 1.1 0.33
Slovakia 0.61 0.27 0.54 0.2 0.51 0.21 0.45 0.2 0.3 0.18 Slovenia 2.1 1.6 1.9 1.9 1.1 1.6 0.85 1.5 0.84 Spain 0.33 0.21 0.32 0.16 0.32 0.21 0.32 0.18 0.31 0.23 Sweden 0.23 0.21 0.22 0.21 0.21 0.16 0.2 0.15 0.18 0.13 UK 0.21 0.13 0.21 0.16 0.2 0.14 0.2 0.16 0.16 0.13
Source: Author’s calculations based on Eurostat data
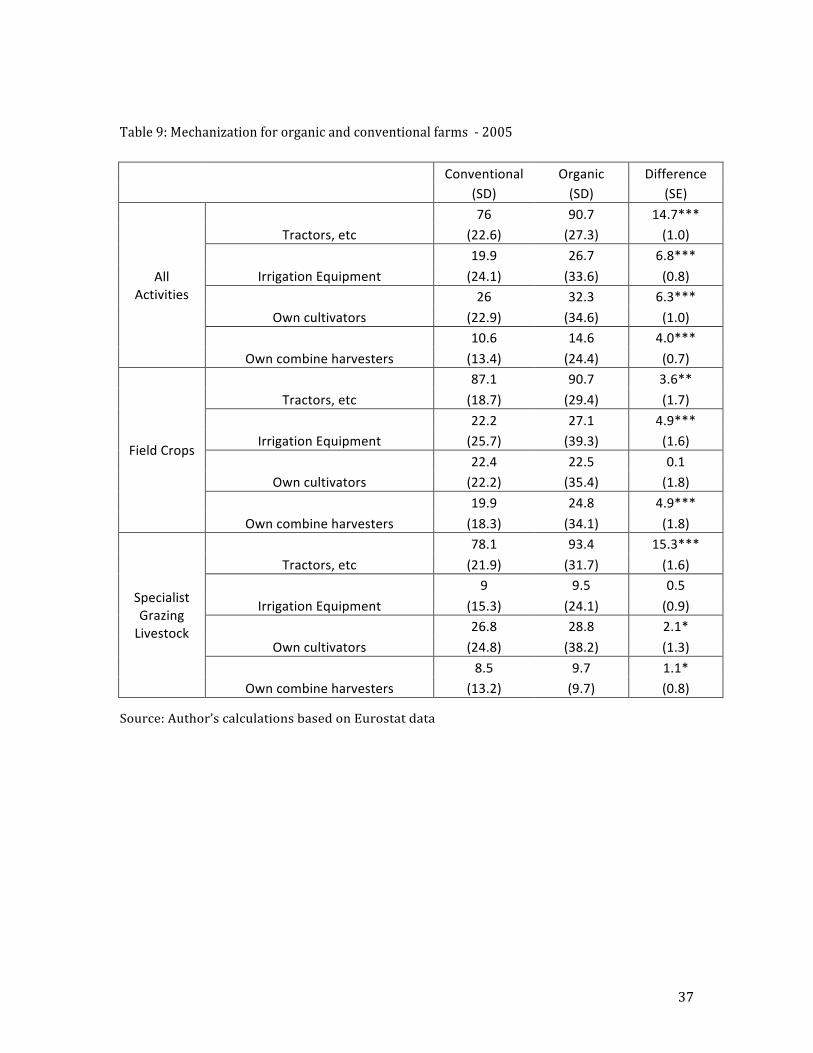
37
Table 9: Mechanization for organic and conventional farms -‐ 2005
Conventional Organic Difference
(SD) (SD) (SE)
All Activities
Tractors, etc 76 90.7 14.7***
(22.6) (27.3) (1.0)
Irrigation Equipment 19.9 26.7 6.8*** (24.1) (33.6) (0.8)
Own cultivators 26 32.3 6.3***
(22.9) (34.6) (1.0)
Own combine harvesters 10.6 14.6 4.0*** (13.4) (24.4) (0.7)
Field Crops
Tractors, etc 87.1 90.7 3.6** (18.7) (29.4) (1.7)
Irrigation Equipment 22.2 27.1 4.9*** (25.7) (39.3) (1.6)
Own cultivators 22.4 22.5 0.1 (22.2) (35.4) (1.8)
Own combine harvesters 19.9 24.8 4.9*** (18.3) (34.1) (1.8)
Specialist Grazing Livestock
Tractors, etc 78.1 93.4 15.3*** (21.9) (31.7) (1.6)
Irrigation Equipment 9 9.5 0.5
(15.3) (24.1) (0.9)
Own cultivators 26.8 28.8 2.1* (24.8) (38.2) (1.3)
Own combine harvesters 8.5 9.7 1.1*
(13.2) (9.7) (0.8)
Source: Author’s calculations based on Eurostat data
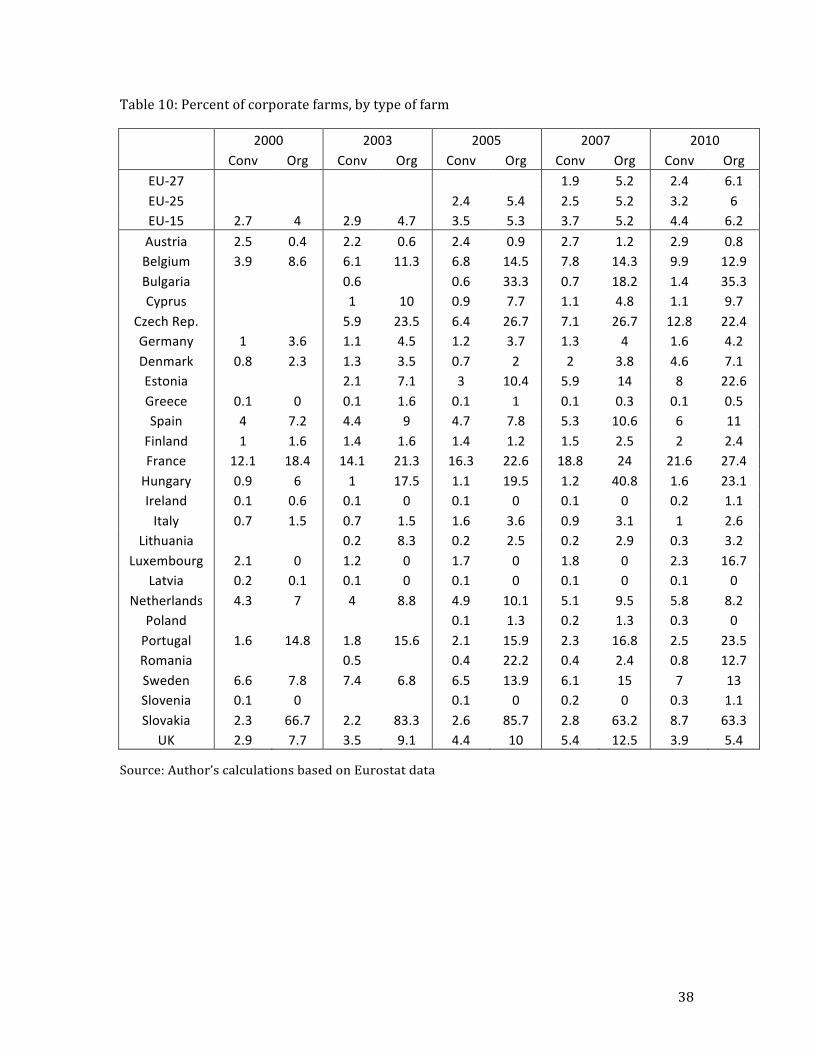
38
Table 10: Percent of corporate farms, by type of farm
2000 2003 2005 2007 2010 Conv Org Conv Org Conv Org Conv Org Conv Org
EU-‐27 1.9 5.2 2.4 6.1 EU-‐25 2.4 5.4 2.5 5.2 3.2 6 EU-‐15 2.7 4 2.9 4.7 3.5 5.3 3.7 5.2 4.4 6.2 Austria 2.5 0.4 2.2 0.6 2.4 0.9 2.7 1.2 2.9 0.8 Belgium 3.9 8.6 6.1 11.3 6.8 14.5 7.8 14.3 9.9 12.9 Bulgaria 0.6 0.6 33.3 0.7 18.2 1.4 35.3 Cyprus 1 10 0.9 7.7 1.1 4.8 1.1 9.7
Czech Rep. 5.9 23.5 6.4 26.7 7.1 26.7 12.8 22.4 Germany 1 3.6 1.1 4.5 1.2 3.7 1.3 4 1.6 4.2 Denmark 0.8 2.3 1.3 3.5 0.7 2 2 3.8 4.6 7.1 Estonia 2.1 7.1 3 10.4 5.9 14 8 22.6 Greece 0.1 0 0.1 1.6 0.1 1 0.1 0.3 0.1 0.5 Spain 4 7.2 4.4 9 4.7 7.8 5.3 10.6 6 11 Finland 1 1.6 1.4 1.6 1.4 1.2 1.5 2.5 2 2.4 France 12.1 18.4 14.1 21.3 16.3 22.6 18.8 24 21.6 27.4 Hungary 0.9 6 1 17.5 1.1 19.5 1.2 40.8 1.6 23.1 Ireland 0.1 0.6 0.1 0 0.1 0 0.1 0 0.2 1.1 Italy 0.7 1.5 0.7 1.5 1.6 3.6 0.9 3.1 1 2.6
Lithuania 0.2 8.3 0.2 2.5 0.2 2.9 0.3 3.2 Luxembourg 2.1 0 1.2 0 1.7 0 1.8 0 2.3 16.7
Latvia 0.2 0.1 0.1 0 0.1 0 0.1 0 0.1 0 Netherlands 4.3 7 4 8.8 4.9 10.1 5.1 9.5 5.8 8.2
Poland 0.1 1.3 0.2 1.3 0.3 0 Portugal 1.6 14.8 1.8 15.6 2.1 15.9 2.3 16.8 2.5 23.5 Romania 0.5 0.4 22.2 0.4 2.4 0.8 12.7 Sweden 6.6 7.8 7.4 6.8 6.5 13.9 6.1 15 7 13 Slovenia 0.1 0 0.1 0 0.2 0 0.3 1.1 Slovakia 2.3 66.7 2.2 83.3 2.6 85.7 2.8 63.2 8.7 63.3
UK 2.9 7.7 3.5 9.1 4.4 10 5.4 12.5 3.9 5.4
Source: Author’s calculations based on Eurostat data
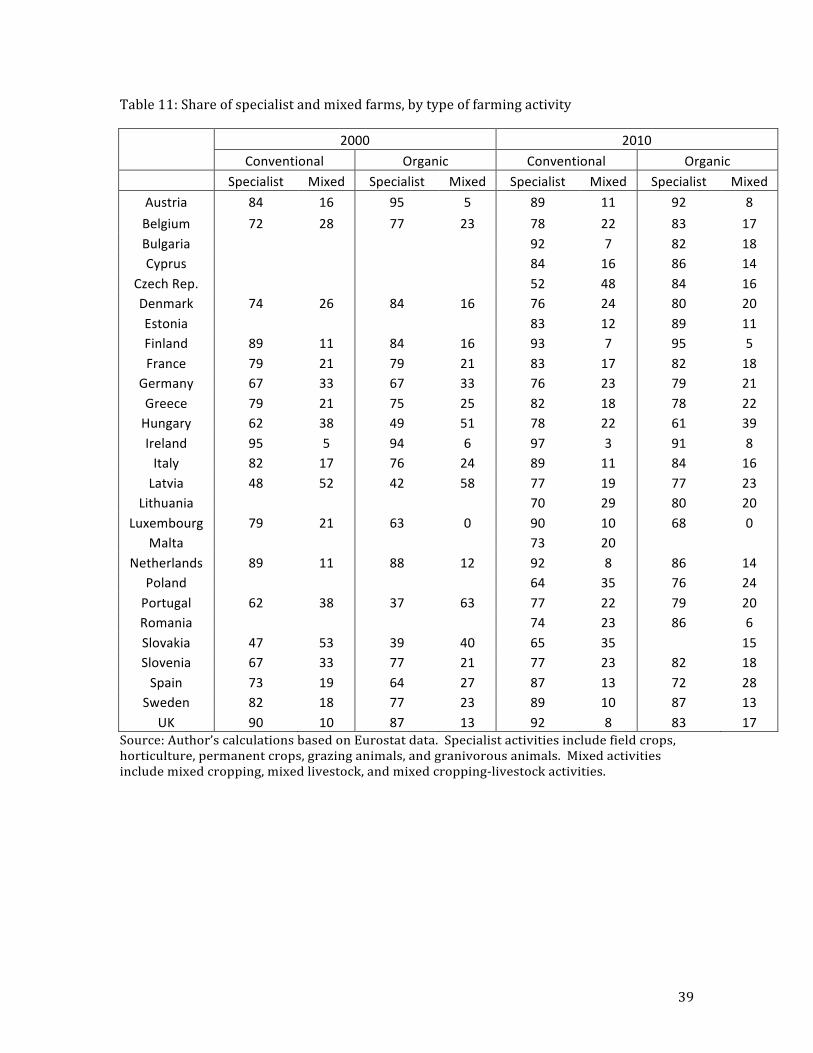
39
Table 11: Share of specialist and mixed farms, by type of farming activity
2000 2010 Conventional Organic Conventional Organic Specialist Mixed Specialist Mixed Specialist Mixed Specialist Mixed
Austria 84 16 95 5 89 11 92 8 Belgium 72 28 77 23 78 22 83 17 Bulgaria
92 7 82 18
Cyprus
84 16 86 14 Czech Rep.
52 48 84 16
Denmark 74 26 84 16 76 24 80 20 Estonia
83 12 89 11
Finland 89 11 84 16 93 7 95 5 France 79 21 79 21 83 17 82 18
Germany 67 33 67 33 76 23 79 21 Greece 79 21 75 25 82 18 78 22 Hungary 62 38 49 51 78 22 61 39 Ireland 95 5 94 6 97 3 91 8 Italy 82 17 76 24 89 11 84 16 Latvia 48 52 42 58 77 19 77 23
Lithuania
70 29 80 20 Luxembourg 79 21 63 0 90 10 68 0
Malta
73 20
Netherlands 89 11 88 12 92 8 86 14
Poland
64 35 76 24 Portugal 62 38 37 63 77 22 79 20 Romania
74 23 86 6
Slovakia 47 53 39 40 65 35
15 Slovenia 67 33 77 21 77 23 82 18 Spain 73 19 64 27 87 13 72 28
Sweden 82 18 77 23 89 10 87 13 UK 90 10 87 13 92 8 83 17
Source: Author’s calculations based on Eurostat data. Specialist activities include field crops, horticulture, permanent crops, grazing animals, and granivorous animals. Mixed activities include mixed cropping, mixed livestock, and mixed cropping-‐livestock activities.
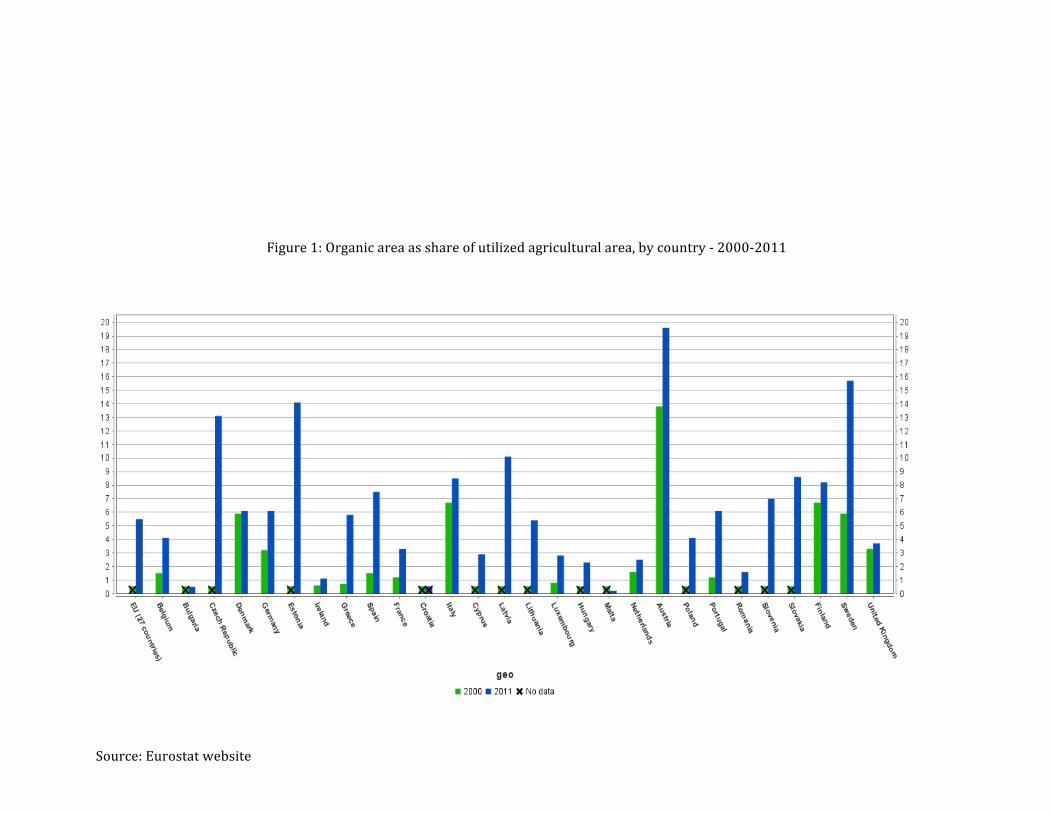
40
Figure 1: Organic area as share of utilized agricultural area, by country -‐ 2000-‐2011
Source: Eurostat website
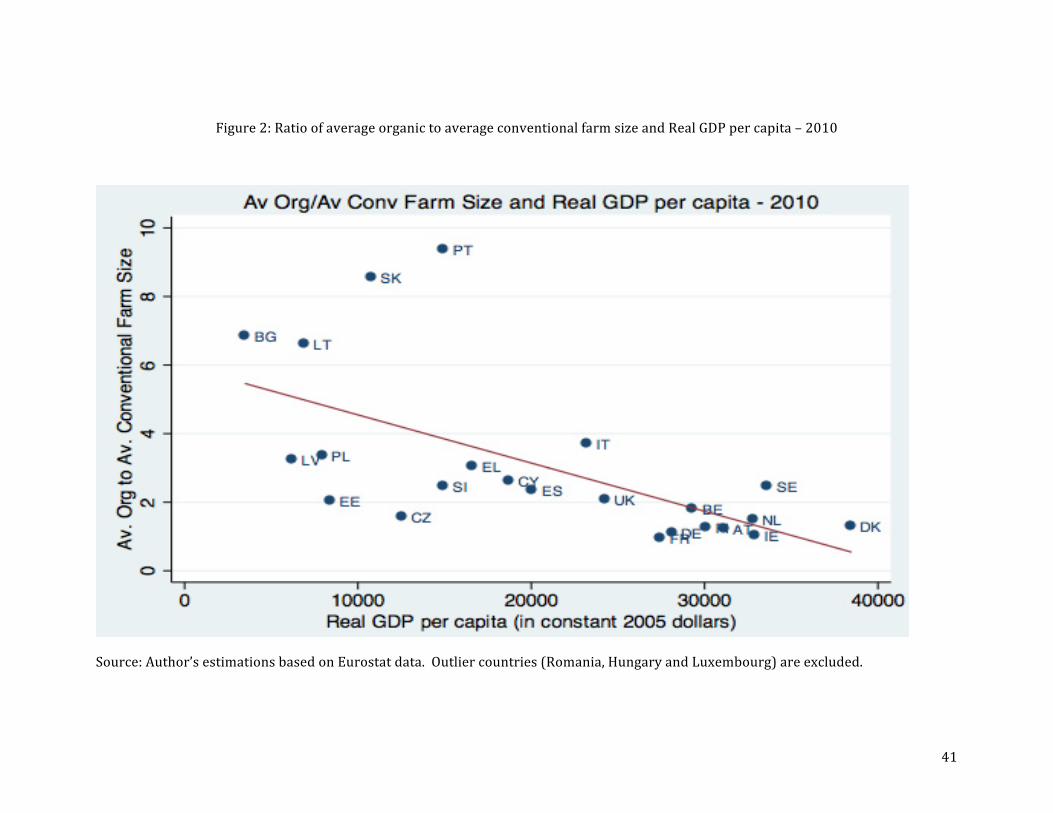
41
Figure 2: Ratio of average organic to average conventional farm size and Real GDP per capita – 2010
Source: Author’s estimations based on Eurostat data. Outlier countries (Romania, Hungary and Luxembourg) are excluded.
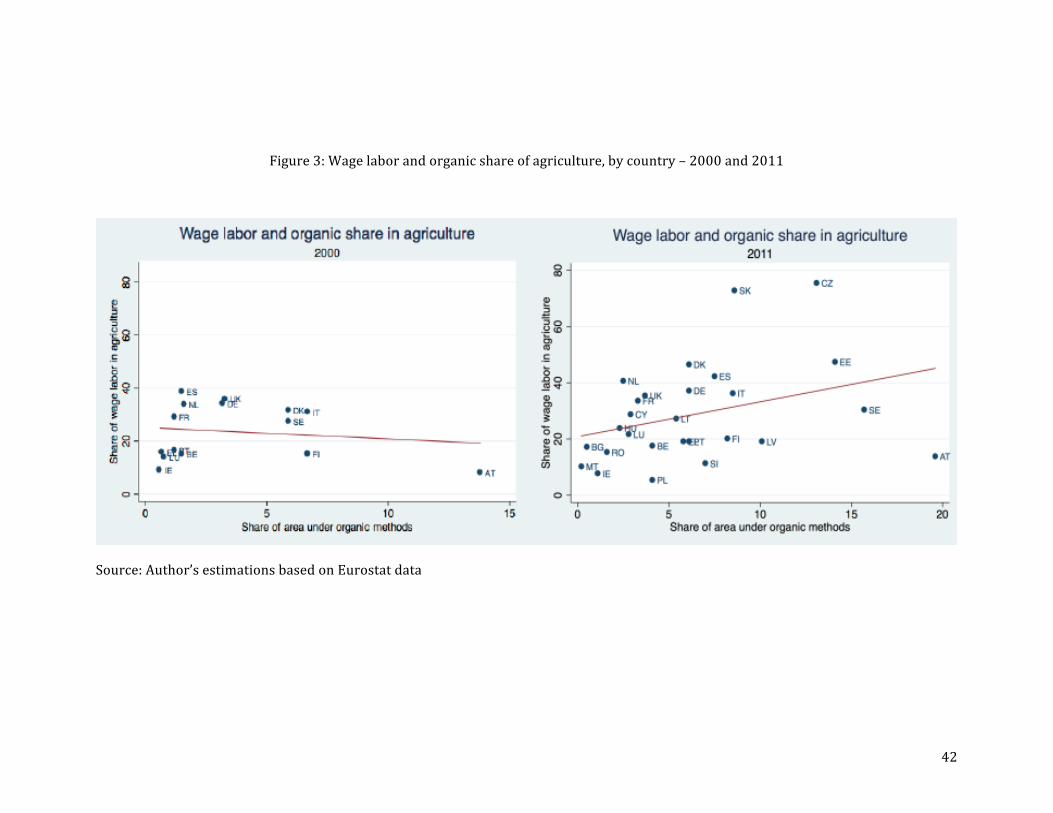
42
Figure 3: Wage labor and organic share of agriculture, by country – 2000 and 2011
Source: Author’s estimations based on Eurostat data