Embed Size (px)
Citation preview

CAPITALIZATION
RATE ANALYSIS
DOUGLAS COUNTY,
NEBRASKA
Kenneth Voss, MAI, SRA, CAE
The purpose of this report is to provide the
Douglas County, Nebraska Assessor's Office
recommended market derived capitalization
rates for various property classes and applied
for use in ad valorem tax purposes.
Kenneth Voss & Associates, LLC
Post Office Box 190054
Atlanta, Georgia 31119-0054
Office 404.869.7970
Fax 404.869.1985
www.kennethvoss.com

KVAKENNETH VOSS& ASSOCIATES
RD\L PROPERTY APPRAISERS • CONSULTANTS • MARKET ANALYSTS
May 25, 2010
Mr. Roger F. Morrissey
Douglas County Assessor
11422 Miracle Hills Drive, Suite 110
Omaha, Nebraska 68154-4420
RE: 2010 Douglas County, Nebraska Capitalization Rate Analysis
Dear Mr. Morrissey:
In accordance with your request, Kenneth Voss & Associates, LLC has researched and analyzed
various sales, consisting of apartment/multifamily, office, retail, and industrial properties, to
determination overall capitalization rates.
The purpose of the report is to aid your office in determining market derived capitalization
rates to be applied for use in ad valorem tax purposes. The scope of this project involves
gathering income and expense information on sales of income producing properties from a
variety of sources available to the appraiser.
Through the study, I found that most buyers and sellers of investment properties make little or
no allowance for replacement reserves. Most of the data reviewed indicated that buyers and
sellers were divided when capitalizing net operating income (NOI) after tenant improvements
and leasing commissions when quoting and using capitalization rates.
Therefore, I have estimated capitalization rates derived from the market without these items.
As noted within the introduction section of this report, the documented capitalization rates are
based on actual data at the time of the sale resulting in rates that vary widely due to the actual
operations that may be above or below market rates.
Therefore, I have estimated capitalization rates to apply to market net operating income. I
have concluded that properties generating below market net operating income would typically
sell at capitalization rates lower, than those based on market operation, and that properties
currently producing net operating income above a market rent would be expected to sell at
higher capitalization rates than indicated by the recommended capitalization rates based on
market income and expenses.
KENNETH W VOSS, MAI, SRA, CAE
JOHN iVk FARLAND, ASSOCIATE APPRALSFR • 1 1IIDI Mi TARLAND, LXLCUTIV1- OF IICI:. MANACil-.il • JUDI VOSS, MARKHINC, DIRECTOR
PO BOX 190054 • ATLANTA, GEORGIA 31119 • TQ.. (404) 869-7970 • TAX: (404) 869-1985 • CELL: (404) 822-9595

KVAKINNETil VOSS
ex ASSOUAILS
Located on the following pages, is a summary of my opinions of capitalization rates for the
various types and classes of property analyzed. The analysis is based on data summarized in
the attached report as well as other data contained in the appraiser's files.
Kenneth Voss & Associates, LLC
Kenneth Voss, MAI, SRA, CAE
Principal

TABLE OF CONTENTS
TITLE PAGE i
LETTER OF TRANSMITTAL ii
TABLE OF CONTENTS 1
INTRODUCTION 2
EXECUTIVE SUMMARY OF CAPITALIZATION RATES 2
DEFINITIONS 3
SCOPE OF WORK 6
MARKET CONDITIONS 11
EMERGING TRENDS IN REAL ESTATE 11
MARKET DATA 12
DERIVATION OF CAPITALIZATION RATES 12
CAPITALIZATION RATE SELCTION CRITERIA 13
DIRECT CAPITALIZATION STRENGTHS AND WEAKNESSES 14
PROPERTY CLASS TRANSITION 15
SUMMARY 16
APARTMENTS/MULTI-FAMILY PROPERTIES 17
OFFICE PROPERTIES 22
RETAIL PROPERTIES 29
INDUSTRIAL PROPERTIES 39
ADDENDA 48
CERTIFICATION 49
PROFESSIONAL QUALIFICATION 50
ASSUMPTIONS AND LIMITING CONDITIONS FOR A CONSULTING ASSIGNMENT 51
INTRODUCTION
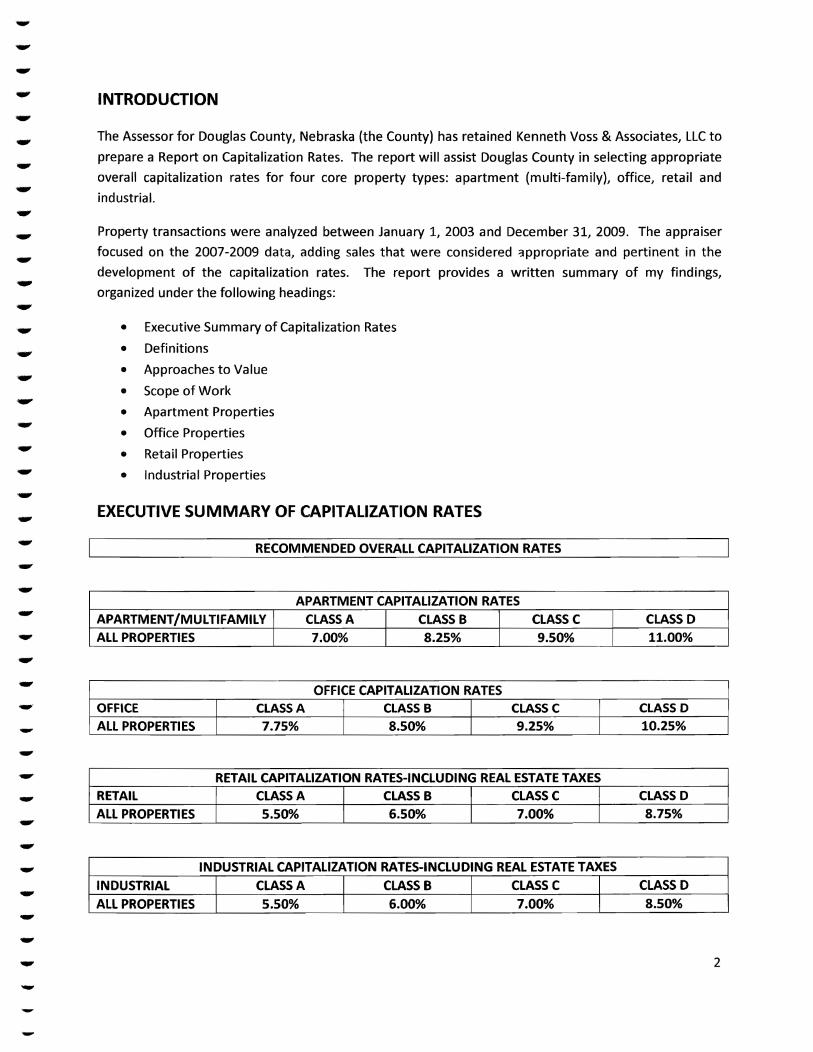
The Assessor for Douglas County, Nebraska (the County) has retained Kenneth Voss & Associates, LLC to
prepare a Report on Capitalization Rates. The report will assist Douglas County in selecting appropriate
overall capitalization rates for four core property types: apartment (multi-family), office, retail and
industrial.
Property transactions were analyzed between January 1, 2003 and December 31, 2009. The appraiser
focused on the 2007-2009 data, adding sales that were considered appropriate and pertinent in the
development of the capitalization rates. The report provides a written summary of my findings,
organized under the following headings:
• Executive Summary of Capitalization Rates
® Definitions
© Approaches to Value
® Scope of Work
® Apartment Properties
® Office Properties
• Retail Properties
® Industrial Properties
EXECUTIVE SUMMARY OF CAPITALIZATION RATES
RECOMMENDED OVERALL CAPITALIZATION RATES
APARTMENT/MULTIFAMILY
ALL PROPERTIES
APARTMENT
CLASS A
7.00%
CAPITALIZATION RATES
CLASS B
8.25%
CLASS C
9.50%
CLASS D
11.00%
OFFICE
ALL PROPERTIES
CLASS A
7.75%
OFFICE CAPITALIZATION RATES
CLASS B
8.50%
CLASS C
9.25%
CLASS D
10.25%
RETAIL
ALL PROPERTIES
RETAIL CAPITALIZATION
CLASS A
5.50%
RATES-INCLUDING
CLASS B
6.50%
REAL ESTATE TAXES
CLASS C
7.00%
CLASS D
8.75%
INDUSTRIAL
ALL PROPERTIES
INDUSTRIAL CAPITALIZATION
CLASS A
5.50%
RATES-INCLUDING
CLASS B
6.00%
REAL ESTATE TAXES
CLASS C
7.00%
CLASS D
8.50%

The capitalization rates above are for the class of property indicated, i provided definitions for each
class and sub-class for each type of sale analyzed to develop a capitalization rate. Not all capitalization
rates developed include replacement reserves.
Although I provided a capitalization rate for each property class, there is a range for each rate, which I
estimated at approximately 25 to 50 basis points. The range provides the staff appraiser's movement
within each property class.
DEFINITIONS
The following definitions or terms are used or implied throughout this report. A clear understanding of
these definitions and terms provides a foundation of my analysis in the development of the
recommended capitalization rates.
Band of Investment A technique in which the capitalization rates attributable to components
of a capital investment are weighted and combined to derive a weighted-average rate
attributable to the total investment.
© Build-Out The interior construction that converts raw space into finished space ready
for occupancy; includes installation of equipment, finished carpentry, construction of
amenities, and initial tenant improvements.
• Capitalization The conversion of income into value.
• Capital Expenditure Investments of cash or the creation of liability to acquire or
improve an asset, e.g., land, buildings, building additions, or site improvements.
• Capitalization Rate-Any rate used to convert income into value.
• Common Area The total area within a property that is not designed for sale or rent, but
is available for common use by all owners, tenants, or their invitees, e.g., parking and its
appurtenances, malls, sidewalks, landscaped areas, recreation areas, public toilets, truck
and service facilities.
• Common Area Maintenance (CAM) The expense of operating and maintaining
common areas; may or may not management charges and usually does not include
capital expenditures on tenant improvements or other such improvements to the
property.
• Concession A benefit or benefits granted by a seller or lessor to induce a sale or lease.
• Debt Coverage Ratio The ratio of net operating income (NOI) to annual debt service;
measures the ability of a property to meet its debt service out of net operating income.
• Discounted Cash Flow A procedure in which the discount rate is applied to a set of
projected income streams and reversion.
• Discount Rate An interest rate used to convert future payments into present value.

Effective Rent The rental rate net of financial concessions such as periods of no rent
during the lease term; the effective rent may be calculated on a discounted basis,
reflecting the time value of money, or a simple straight-line basis.
Expense Stop A clause in the lease that limits the landlord's expense obligation because
the lessee assumes any expense above an established amount.
Going-ln Capitalization Rate The going-in capitalization rate is usually defined as the
first year net operating income (NOI-before capital items of tenant improvements,
leasing commissions, and debt service but after real estate taxes) divided by present
value or purchase price.
Holding Period Average period of time that a property type is held for investment.
Institutional Grade Real Estate Real property investments that are sought by
institutional buyers and have the capacity to meet generally prevalent institutional
investment criteria.
Investor Survey The Investor Survey represents comprehensive data sets of investment
activity for commercial real estate in a condensed format, providing capitalization rates,
debt-coverage-ratios, and band-of-investment data for a variety of property types.
Land~to-Building Ratio The ratio of land area to gross building area; one of the factors
determining comparability of properties.
Leasing Commissions Fees paid to an agent for leasing tenant space. When leasing fees
are spread over the term of the lease or lease renewal they are treated as a variable
operating expense. Initial leasing fees usually fall under capital expenditures for
development and are not included among periodic expenses.
Overall Capitalization Rate (Cap Rate, OAR)-An income rate for a total real property
interest that reflects the relationship between a single year's net operating expectancy
and the total property price or value; used to convert net operating income into an
indication of overall property value.
Market Rent The most probable rent that a property should bring in a competitive and
open market reflecting all conditions and restrictions of the typical lease agreement,
including the rental adjustment and revaluation, permitted uses, use restrictions,
expense obligations, term, concessions, renewal and purchase options and tenant
improvements.
Net Operating Income The actual or anticipated net income that remains after all
operating expenses are deducted from the effective gross income, but before mortgage
debt service and book depreciation. The net operating income may be calculated
before or after deducting replacement reserves, leasing commissions and tenant
improvements.
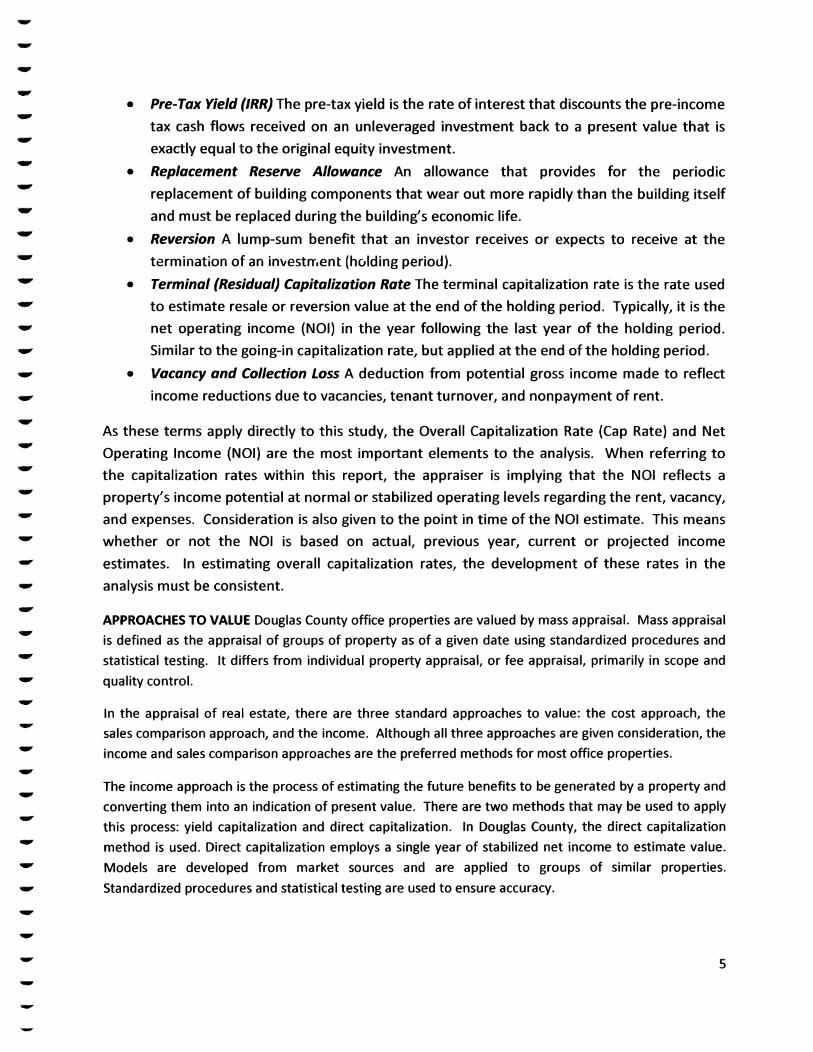
• Pre-Tax Yield (IRR) The pre-tax yield is the rate of interest that discounts the pre-income
tax cash flows received on an unleveraged investment back to a present value that is
exactly equal to the original equity investment.
• Replacement Reserve Allowance An allowance that provides for the periodic
replacement of building components that wear out more rapidly than the building itself
and must be replaced during the building's economic life.
• Reversion A lump-sum benefit that an investor receives or expects to receive at the
termination of an investment (holding period).
• Terminal (Residual) Capitalization Rate The terminal capitalization rate is the rate used
to estimate resale or reversion value at the end of the holding period. Typically, it is the
net operating income (NOI) in the year following the last year of the holding period.
Similar to the going-in capitalization rate, but applied at the end of the holding period.
• Vacancy and Collection Loss A deduction from potential gross income made to reflect
income reductions due to vacancies, tenant turnover, and nonpayment of rent.
As these terms apply directly to this study, the Overall Capitalization Rate (Cap Rate) and Net
Operating Income (NOI) are the most important elements to the analysis. When referring to
the capitalization rates within this report, the appraiser is implying that the NOI reflects a
property's income potential at normal or stabilized operating levels regarding the rent, vacancy,
and expenses. Consideration is also given to the point in time of the NOI estimate. This means
whether or not the NOI is based on actual, previous year, current or projected income
estimates. In estimating overall capitalization rates, the development of these rates in the
analysis must be consistent.
APPROACHES TO VALUE Douglas County office properties are valued by mass appraisal. Mass appraisal
is defined as the appraisal of groups of property as of a given date using standardized procedures and
statistical testing. It differs from individual property appraisal, or fee appraisal, primarily in scope and
quality control.
In the appraisal of real estate, there are three standard approaches to value: the cost approach, the
sales comparison approach, and the income. Although all three approaches are given consideration, the
income and sales comparison approaches are the preferred methods for most office properties.
The income approach is the process of estimating the future benefits to be generated by a property and
converting them into an indication of present value. There are two methods that may be used to apply
this process: yield capitalization and direct capitalization. In Douglas County, the direct capitalization
method is used. Direct capitalization employs a single year of stabilized net income to estimate value.
Models are developed from market sources and are applied to groups of similar properties.
Standardized procedures and statistical testing are used to ensure accuracy.

The primary elements used in the income models are income, expenses, vacancy and collection loss, and
a capitalization rate. Once developed, the models are applied to the properties by a computer assisted
mass appraisal system (CAMA). Vacancy and collection loss and expenses are deducted from the
property's potential gross income. The resulting net operating income (NOI) is divided by the
capitalization rate to estimate the property's value. The models are designed to reflect the value of a
typical or mean property in any given class. If the appraiser applying the model believes an individual
property differs significantly from the typical property in the group, adjustments may be made to the
model to reflect the differences.
SCOPE OF WORK
The appraiser is required to identify the scope of work sufficient to produce credible results that are
supported to the degree necessary for the intended use of the assignment. It is important that both the
appraiser and the client fully understand the scope of work to ensure that it is appropriate for the
intended use of the assignment. It is the intent of this assignment that all appropriate data pertinent to
the development of this assignment to be collected and confirmed.
The Scope of Work sufficient for this engagement encompassed the following methodology:
• Meet with the Douglas County, Nebraska Appraisal Staff to discuss the study, review process
and approaches to be undertaken
• Review the available data and information accessible in the Assessor's office and other sources
for transactional data
• Determine a reasonable sample size of improved sales to accomplish the study for each
property type analyzed
• Determine the most acceptable approach to developing net operating income (NOI) for the
various property types
• Determine the most acceptable method to developing vacancy percentages
• Determine the most acceptable method to develop operating expense ratios
• Discuss which approaches and techniques are most acceptable and should be employed to
support the capitalization rates such as transactions, investor interviews and surveys
• Develop a matrix of capitalization rates appropriate for the building classes and subcategories
and review our conclusions with the County and submit our final report
COMPETENCY STATEMENT
The appraiser has the appropriate knowledge, education, and experience to complete this report. The
appraiser's professional qualifications are included in the Addenda.
FORMAT OF REPORT
The following pages contains four distinct property types but similar in the narrative description. Each
property type begins with a general over view of the Douglas County, Nebraska market through the

fourth quarter 2009. The local overview is followed by a series of national publications providing an in-
depth overview of the particular property under discussion. This part is followed by brief descriptions of
the major class and subclasses of the property under discussion.
The critical part is the analysis of market sales by class with the capitalization rate and price per square
foot for an additional measure I considered. I provided a range of capitalization rates, minimum-to-
maximum, and the median and mean capitalization rate.
The final section deals with an overview of the capitalization rates and the final determination of
capitalization rates.
OPERATING EXPENSES
Proper appraisal practice requires the detailed analysis of operating expenses. A failure to
properly estimate allowable operating expenses can significantly influence the potential net
operating income or forecasted cash flows and thus the appraised value of commercial real
estate.
The following pages illustrate two scenarios. The first scenario is developing a capitalization
rate with or without replacement reserves. The second scenario is developing a capitalization
rate with and without real estate taxes.

CALCULATIONS-REPLACEMENT RESERVES
The following is an example of how we derived the various overall capitalization rates. In the example
below, I assumed a 10,000 gross square foot office building with 9,500 net square feet sold for $750,000
and had a gross potential income of $95,000 with a 5% vacancy and collection loss. Fixed expenses were
$8,000 (real estate taxes and insurance) and variable expenses of $15,000 (management,
administration, maintenance, and utilities).
GROSS POTENTIAL INCOME
LESS: 5% VACANCY & CREDIT LOSS
EFFECTIVE GROSS INCOME
LESS EXPENSES
FIXED
VARIABLE
TOTAL EXPENSES
NET OPERATING INCOME BEFORE RESERVES
LESS RESERVES
TOTAL RESERVES
NET OPERATING INCOME AFTER RESERVES
$ 8,000
$ 15,000
ROOF & PAVING
RENOVATION
$2,500
$5,500
$95,000
-$4,750
$90,250
$23,000
$67,250
$8,000
$59,250
The overall capitalization rate without replacement reserves, tenant improvements, and leasing
commissions is 8.97% ($67,250 before replacement reserves divided by the sales price of $750,000).
The overall capitalization rate with reserves is 7.90% ($59,250 after replacement reserves divided by the
sale price of $750,000). The property may be appraised with either capitalization rate as long as it is
applied to the proper net operating income as illustrated below:
NOI BEFORE REPLACEMENT RESERVES $67,250
Sale Price $750,000
Overall Capitalization Rate 8.97%
OR
NOI AFTER REPLACEMENT RESERVES $59,250
Sale Price $750,000
Overall Capitalization Rate 7.90%

If leasing commissions, tenant improvements or a greater allowance for replacement reserves
were included as a deduction to derive the net operating income, the overall capitalization rate
would be reduced by a pro-rata amount. The estimated overall capitalization rate without
replacement reserves, leasing commissions and tenant improvements can be applied
consistently within a specific property type and investment class. The majority of sales that
were analyzed represent overall capitalization rates without replacement reserves. The market
consistently cited rates in this manner.
CALCULATIONS-REAL ESTATE TAXES (OMITTED)
The below illustration below does not include real estate taxes as a fixed expense.
GROSS POTENTIAL INCOME
LESS: 5% VACANCY & CREDIT LOSS
EFFECTIVE GROSS INCOME
LESS EXPENSES
FIXED
REAL ESTATE TAXES (OMITTED)
INSURANCE
VARIABLE
TOTAL EXPENSES
NET OPERATING INCOME
$ 7,500
$ 500
$15,000
$95,000
-$ 4,750
$90,250
$15,500
$74,750
The overall capitalization rate without real estate taxes is 9.97% ($66,750 divided by the sales price of
$750,000). Assessors add (load) the effective tax rate component to the estimated composite or
base capitalization rate; in these cases, no specific expense deduction are made for real estate
taxes.
CALCULATIONS-REAL ESTATE TAXES (INCLUDED)
The below illustration includes real estate taxes as a fixed expense.
GROSS POTENTIAL INCOME
LESS: 5% VACANCY & CREDIT LOSS
EFFECTIVE GROSS INCOME
LESS EXPENSES
FIXED
REAL ESTATE TAXES (INCLUDED)
INSURANCE
VARIABLE
TOTAL EXPENSES
NET OPERATING INCOME
$ 7,500
$ 500
$15,000
$95,000
-$ 4,750
$90,250
$23,000
$67,250
The overall capitalization rate with real estate taxes is 8.97% ($67,250 divided by the sales price of
$750,000).

The rational for loading the base capitalization rate is to preclude circular reasoning. By adding
the effective tax rate to the capitalization rate, sufficient income is afforded to pay the taxes
based on documented market value. Any bias in indicated value caused by reliance on previous
assessed value or historic taxes is removed.
The effective tax rate is the product of the nominal tax rate and the assessment ratio. The
effective tax rate provides the actual tax rate paid on the assessed value of the property.
The following pages provides my analysis and interpretation of income producing properties
that were sold on the open market, specific market data on each property class where
capitalization rates were developed, national and local indices.
10

MARKET CONDITIONS
• Leasing activity is down in the real estate market over the last year and appears the
trend will continue into 2011. Investors are concerned about the economy, future
tenant demand (concessions) and tenant requirements (space).
• More stringent underwriting criteria and lack of debt funds has limited the number of
real estate transactions.
• The volatility of the real estate market has seen sellers pull out of the market, and those
remaining are negotiating prices that are below last year's acceptance level. The trend
will continue into 2011.
• All sectors of the real estate market has seen a continuing decline in sales activity over
the past two years.
• The failure of major banks around the country has lead to further erosion of consumer
confidence in the real estate market. Residential foreclosures have led to a downturn in
the commercial real estate market.
• In the final analysis, capitalization rates have gradually increased over the past two
years, and unfortunately will continue to increase.
The current economy problems leading into the real estate market will not improve in the near
future, but will linger until there is a move to increase job availability. The investment market is
at a standstill; few properties are being sold, and when sold, usually at a lower price than
originally offered making an analysis of where capitalization rates difficult
EMERGING TRENDS IN REAL ESTATE
The Urban Land Institute and KORPACZ/PRICEWATERHOUSECOOPERS publish annually Emerging Trends
in Real Estate. The 2010 publication contained the following comments:
• The commercial real estate industry hits bottom in 2010, suffering a surge of painful
writedowns, defaults, and workouts.
• Debt markets will remain severely compromised; resuscitated banks will increase lending slowly,
employing strict underwriting standards, and requiring significant equity stakes from borrowers.
• A lackluster economic recovery characterized by problematic job growth will hamper the pace of
any real estate market resurgence, which probably cannot gain much traction until late 2011 or
2012.
• Commercial property sectors generally avoided overbuilding, but slack demand pushes up
vacancies and many new projects cannot hope to meet leasing projections or debt-service
obligations.
• Value losses will be mitigated somewhat in the top-tier markets as institutional and foreign
buyers look to acquire prime assets, keeping prices from free fall; capitalization rates in these
cities rise close to or above historic norms from unsustainably low levels.
11

• And, Emerging Trends surveys indicate 2010 will be the worst time for investors to sell
properties in the reports 30-years history, but will offer a much-improving environment to buy
(with cash).
Referencing capitalization rates, the trend is upward, with the following points:
• Borrowers can find loans, but at "expensive," back-to-the-future pricing, 60 to 65 percent loan-
to-value ratios, 7 to 7.25 percent interest rates, and 1.4 debt-service coverage.
• Shifts in capitalization rates indicate increases in all sectors of the commercial real estate
market, from 25 to 250 basis points.
• Decreasing net operating income, coupled with increased vacancies and tenant concessions, and
the ever-increasing capitalization rates, will continue to lower value.
MARKET DATA
I researched and assembled sales of improved properties for this assignment. These sales were verified
by one of the participating parties or a third party, or from a reliable source were utilized in my
database. A number of sales were not included because of various reasons arising from validity and/or
arm's length transactions.
The market data that an appraiser relies on is always dated but this factor is especially important in a
market environment we are experiencing currently. Sales activity has declined across all commercial
real estate sectors over the past two years. Overall capitalization rates across all commercial real estate
sectors have increased during the same period. Therefore, with limited sale activity to rely on, I have to
consider many different data sources to assist in the concluded overall capitalization rates. An
important source is interviews with local real estate appraisers, forming a consensus about the current
market conditions and the concluded overall capitalization rates.
The purpose of this section is to define capitalization rates and their use in this study. It is organized in
five sub-sections:
1. Derivation of capitalization rates
2. Capitalization rates selection criteria
3. Direct capitalization strengths and weaknesses
4. Property class transition
5. Capitalization rate spreads
DERIVATION OF CAPITALIZATION RATES
A capitalization rate study is a relationship of a single year of net operating income estimate from a
property compared to its sale price. Capitalization rates can vary based upon the net operating income
analyzed in this study. The net operating income may reflect the actual (historical) net income, the year-
to-date annualized, or next year's budgeted net income. Generally, market transactions are based on
12

the next twelve month budgeted net income or current-in-place net income. This is an area of
inconsistency and should be understood in developing capitalization rates.
Capitalization rates may be derived from abstraction from market sales, mathematical formulas, and
investor surveys. The emphasis in this study has been placed upon actual market transactions, investor
surveys, and published studies.
• Published Studies: Most surveys are performed on a national basis, then segregated into
regional areas. Real Estate Research Corporation, Reis, Korpacz Real Estate Investor Survey
(KORPACZ/PRICEWATERHOUSECOOPERS), RealtyRates.com, and Real Capital Analytics were
analyzed for this study. Of the surveys analyzed, only Real Estate Research, Reis, and Real
Capital Analytics addressed each property type in the Omaha area specifically. The surveys
typically provide a range of capitalization rates applicable to certain property types and
generally involve only investment or institutional grade properties.
Each of the surveys cited in this study reflect investment grade property. An investment grade
property includes only Class A and above average Class B real estate.
• Personal Interviews: I conducted a personal interview of various appraisers and
acquisition/dispositions professionals during the week of June 8, 2009 to gather data into the
Omaha investment market, focusing mainly on capitalization rates. The results of these
interviews follow:
1. Few properties are trading, making it difficult to estimate real estate prices and
capitalization rates currently and in the near future.
2. Assets in second-tier cities, as Omaha are being adjusted 50-150+ basis points above
national capitalization rates depending on the type of property.
3. Capitalization rates have increased in all commercial real estate sectors, a trend that will
continue into 2011/2012, or until lenders are willing to finance properties at reasonable
terms.
CAPITALIZATION RATE SELECTION CRITERIA
Various economic and physical factors influence the risk of a particular investment and its implied
capitalization rate. These criteria should be understood in the application of and selection of
capitalization rates. The economic and physical factors that affect risk are considered to be as follows:
• Current alternative yields involve rates of returns available in the current real estate market
from alternative investments such as mortgages, bonds, and certificates of deposit.
• Ease of entry into development of product type may take years to conceive, approve, and
develop whereas others are easily processed through the development cycle and possibly
subject to overbuilding. This may restrict supply and influence capitalization rates.
• Financing is the availability and price of debt, which has a direct impact on new development
and property transactions. Capitalization rates analyzed in this study assume an unleveraged
position or cash equivalent financing. However, the availability of financing has an impact on
13

the potential buyer's ability to purchase a property since most commercial real estate is
purchased with financing. The recent "credit crunch" has severely influenced activity in all types
of real estate.
• Geographical/Political Forces can influence either positively or negatively the willingness of
investors to purchase or develop property in an area. These issues could involve zoning,
transportation issues, utility, infrastructure issues, and real estate taxes.
• Location is critical to the success of a real estate development and involves factors such as
demographics, transportation, exposure, and marketability.
• Management burden varies by type of property and can influence expense ratios and,
consequently capitalization rates accruing to certain property types.
• Ownership position refers to the interest or the estate being transferred such as fee simple,
lease fee, or leasehold. The interest created by leases, mortgages, etc. can affect the risk
ascribed to an investment.
Property specific criteria include the following:
• Occupancy/Rollover Risk: Overall capitalization rates are typically analyzed on an "as if or
stabilized basis. High vacancy rates or near term tenant expirations or rollover risk can influence
the capitalization rate acceptable to a potential purchaser.
• Tenancy: A real estate investment is a portfolio of leases. The lease terms and conditions, lease
type, credit worthiness of the tenants, quantity, quality, and durability of the income stream all
influence the risk associated with the investment.
• Operating expense ratio: Typically, a higher expense to gross income ratio, reflects a higher
capitalization rate.
• Potential growth in net operating income:
• Reserve/allowance: Reserve allowance are not typically included as an operating expense by
buyers, sellers, or brokers for most property types. However, at the clients request, I have
reflected these rates both with and without reserve allowances as an expense item for retail an
industrial property types.
• Remaining economic life: Real property is a depreciating asset and as properties age, they
experience class or quality transition, their remaining economic life shortens and the
capitalization rates generally increase.
DIRECT CAPITALIZATION STRENGTHS AND WEAKNESSES
An overall capitalization rate is applied to the net operating income through the process called direct
capitalization. The capitalization rate is typically applied to a stabilized or typical net operating income
for a single year. There are certain strengths and weakness in utilizing an overall capitalization rate in
property valuation. The strengths are:
• Satisfies all of the investors' return requirements; the return on and of the investment.
• Reliable for income streams without variable income growth rates.
• Simple, easy to understand and apply and widely used.
14

There are also certain weaknesses that need to be understood regarding the application of an overall
capitalization using direct capitalization. The weaknesses are:
• Difficult to apply to an un-stabilized income stream; this could be caused by higher than normal
market vacancy, or significant spikes in market rental rates.
• Difficult to apply to single or multi-tenant properties with long-term leases that have substantial
near term risk of roll-over of tenants.
• There is inconsistency of application regarding the calculation of net operating income and
reserve allowances.
• In the current real estate market there is some level of uncertainty and agreement as to
acceptable capitalization rates of return and deal pricing among market participants.
PROPERTY CLASS TRANSITION
Over time, properties tend to transition between quality classes. A new property rated as class A grade
at its completion may transition to a class B after a period of time depending on market conditions.
Similarly, a class B property that receives significant capital infusion may be upgraded to a class A rating.
The determination of property class or quality is based upon the analysis of several factors including
location, size, age, quality and condition, occupancy, tenancy, and rent levels. To an extent, these
factors are controlled through asset management, maintenance, and capital expenditures. However,
external factors such as new supply, changing economic conditions, design, and amenities can cause a
property to transition between classes. It is therefore necessary to review property class ratings
periodically to insure that each property is classified correctly.
The property classifications are identified in the individual property type discussions to follow. The
purpose of this study is to develop estimated capitalization rates for each class of property type:
apartment/multifamily, office, retail, and industrial. The classes of property are commonly referred to
as being, A, B, or C class property. Douglas County requested rates on D class property as well. Surveys
analyzed and investors contacted do not involve themselves with this quality of asset and capitalization
rates for low-end property are based on market transactions and the appraiser's judgment.
Finally, it is important to note that this assignment did not allow the appraiser to inspect any of the
properties that were selected as market transactions. The conclusion, as to class of property is
subjective and based on the age of the improvements, photographs of the property (if available), and
discussion with the verifying source.
CAPITALIZATION RATE SPREADS
It was possible to analyze a sufficient number of sales for each general property type from available
market data in Douglas County. The sales I researched provided a wide range in capitalization rates.
Since the available database from the Douglas County real estate market is limited and imperfect. The
capitalization rates derived were limited to a certain extent for C class properties, and especially for D
15

class properties. I have also analyzed the potential spread between property classes by employing
separate techniques. The alternative techniques are:
• Investor surveys reflecting A and B class properties.
• Yield spreads between 10-year corporate bonds and 10-year Treasury Bills. The spread is the
risk premium associated with various investment grades above a "safe investment".
• The analysis of capitalization rates of over 600 sales, ranging from 2002 through 2009 in Douglas
County of various types of properties.
• The Korpacz Survey data of Institutional vs. Non-Institutional grade capitalization rates which
are generally A or B vs. C class and lower.
SUMMARY
In the final analysis, the data analyzed indicates a spread of 250 to 400 basis points to be a reasonable
range from the risk difference between Class A and Class D real estate investments. The risk of owning
real estate is generally regarded as higher than the risk of owning a corporate bond for liquidity and
marketability reasons. Therefore, my analysis using a basis point spread begins with the overall
capitalization rate that is determined appropriate for Class A property and adds a premium for perceived
additional risk by property class.
FUTURE OUTLOOK
Omaha and Douglas County offers several strengths as a business location. Omaha has an excellent
transportation system, including highways, airport, railroad, and river. The local economy is diverse and
the cost of doing business is moderate, including real estate rates relative to other medium size
metropolitan areas, and a relatively low tax burden. Consumers are also impacted by the challenging
housing market, although less than other areas in the United States. The current economy and related
problems will impede economic growth in the near future.
16

DOUGLAS COUNTY APARTMENT/MULTIFAMILY MARKET
DOUGLAS COUNTY METRO DATA-APARTMENT/MULTIFAMILY PROPERTIES
Year
2008
2008
2009
2009
Qtr
1
2
3
4
All
1
2
3
4
All
1 nventory/SF/Units
37,672
37,672
37,762
37,762
37,762
37,762
38,170
38,470
38,470
38,554
Completions
302
0
0
0
302
0
498
300
84
882
Inventory Growth
0.8%
0.0%
0.0%
0.0%
0.8%
0.0%
1.3%
0.8%
0.2%
2.3%
Vacant Stock
2,189
2,150
1,924
2,138
2,138
2,277
2,422
2,863
2,637
2,637
Year
2008
2008
2009
2009
Qtr
1
2
3
4
All
1
2
3
4
All
Vacancy Rate
5.8%
5.7%
5.1%
5.7%
5.7%
6.0%
6.3%
7.4%
6.8%
6.8%
Vacancy Change (BP)
20
-10
-60
60
10
30
30
110
-60
110
Occupied Stock
35,483
35,522
35,748
35,534
35,534
35,395
35,748
35,607
35,917
35,917
Net Absorption
219
39
226
-214
270
-139
353
-141
310
383
APARTMENT/MULTIFAMILY CAPITALIZATION RATES, NATIONAL
REAL ESTATE RESEARCH CORPORATION, MIDWEST INVESTMENT CRITERIA- SUMMER 2009
APARTMENT/MULTIFAMILY
First-Tier Properties Second-Tier Properties Third-Tier Properties
PRE-TAX YIELD (IRR) (%)
RANGE
MEAN
7.0-11.0
9.2
8.0-14.0
10.2
8.5-15.0
11.2
GOING-IN CAP RATE (%)
RANGE
MEAN
5.5-9.0
7.1
6.5-10.0
8.6
6.5-11.0
9.1
TERMINAL CAP RATE (%)
RANGE
MEAN
6.0-10.0
7.8
7.8-10.5
9.0
8.0-12.0
9.8
17

REAL ESTATE RESEARCH CORPORATION, OMAHA - SUMMER 2009
GOING-IN CAP RATE (%)
TERMINAL CAP RATE (%)
RERC ESTIMATE
8.1%
8.6%
MIDWEST
7.6%
8.3%
U.S.
7.6%
8.3%
KORPACZ/PRICEWATERHOUSECOOPERS, LLP, 4th Quarter 2009
KEY INDICATORS
DISCOUNT RATE (IRR)
RANGE
MEAN
CHANGE (Basis Points)
OVERALL RATE (OAR)
RANGE
MEAN
CHANGE (Basis Points)
RESIDUAL CAP RATE
RANGE
MEAN
CHANGE (Basis Points)
CURRENT QUARTER
6.50%-14.00%
10.17%
5.75%-11.00%
8.03%
5.75%-10.75%
8.19%
LAST QUARTER
7.50%-14.00%
10.06%
+11
5.75%-10.00%
7.84%
+19
5.75%-9.75%
8.06%
+13
ONE YEAR AGO
6.00%-10.50%
8.32%
+185
3.80%-8.50%
6.13%
+190
5.00%-9.25%
6.88%
+131
RealtyRates.com Investor Survey
ALL TYPES
GARDEN/SUBURBAN
HI-RISE TOWNHOUSE
4th Quarter 2009
DEBT COVERAGE RATIO
BAND OF INVESTMENT
INVESTOR SURVEY
DEBT COVERAGE RATIO
BAND OF INVESTMENT
INVESTOR SURVEY
DEBT COVERAGE RATIO
BAND OF INVESTMENT
INVESTOR SURVEY
MINIMUM
4.87%
5.44%
5.16%
4.87%
5.44%
5.16%
5.85%
6.33%
6.02%
MAXIMUM
12.25%
14.53%
13.80%
11.97%
13.16%
12.51%
12.25%
14.53%
13.80%
MEAN
8.16%
8.91%
9.44%
7.89%
8.47%
8.70%
9.66%
9.65%
9.65%
18

APARTMENT/MULTIFAMILY CLASSIFICATIONS The following definitions are used to describe
apartment/multifamily classifications as interpreted with this report as Class A, B, C, and D.
Apartment Complex: A type of commercial building used exclusively or primarily for office use
(business), as opposed to manufacturing, warehousing, or other uses.
CLASS A has an excellent location and appearance with abundance of amenities. The building has
superior architectural design, finish, and ornamentation. Common characteristics may include new
construction, luxury clubhouse, fully equipped fitness center, garages, controlled access, intrusion
alarm, washer and dryer in each unit, fireplace, racquetball court, tennis court, pools, spa, sauna,
oversized tub, vaulted ceiling, and premium view.
CLASS B has a desirable location and appearance with ample amenities. The building has above mean
construction and finish with some detail. Common characteristics may include slightly older
construction, clubhouse, fitness center, controlled access, intrusion alarm, washer and dryer connection
in each unit, fireplace, tennis court, and pool.
CLASS C has an average location and appearance with standard amenities, construction, and finish with
a lack of ornamentation. Common characteristics may include slightly older construction, an adequate
clubhouse, fitness center, laundry center, and pool.
CLASS D has a less desirable location and appearance with minimum amenities. The building has simple
construction and finish and generally in need of repairs. Common characteristics may include older
construction, minimum clubhouse, and laundry room.
APARTMENT/MULTIFAMILY OVERVIEW The large amount of negative net absorption in 2009 is
indicative of weakness continuing to pervade multifamily properties across the nation.
Nationally, the apartment market gave up nearly 32,000 units and pushed the national vacancy
rate to over 7.5%. For perspective, this is the largest amount of negative net absorption since
the first quarter of 2002.
Asking and effective rents continued their precipitous decline, with negative effective growth
passing asking negative rent growth as landlords offer more concessions in an attempt to stop
further deterioration in occupancy levels. This is significant: a decline in asking rents implies
that landlord's are lowering offering price even before meeting with tenants for negotiations
about further concessions, and is indicative of the increased pressure apartment properties
face to maintain occupancy levels in the continuing economic downturn.
New buildings coming online in 2010 will face higher initial vacancy levels, and will work to
increase the pressure on leasing managers of existing properties to support current rent and
occupancy levels. Without an indication of a more severe cutback in supply coming online in
2010, signs point to more difficulty for rental apartment/multifamily for the rest of the year
19

unless economic conditions improve drastically. Large declines in both asking and effective
rents may serve to hold off faster deterioration in occupancy.
APARTMENT/MULTIFAMILY MARKET
SALES Kenneth Voss & Associates, LLC examined 36 apartment sales in the Douglas County
area. Twenty-six apartment sales were used in the final analysis. Eight of these properties
were classified as Class A, six as Class B, five as Class C, and seven were classified as Class D.
SUMMARY OF APARTMENT/MULTIFAMILY SALES
Sale*
1
2
3
4
5
6
7
8
9
10
11
12
13
14
15
16
17
18
19
20
21
22
23
24
25
26
Class
A
A
A
A
A
A
A
A
B
B
B
B
B
B
C
C
C
C
C
D
D
D
D
D
D
D
Sale Date
July 2008
December 2007
December 2007
August 2007
August 2007
July 2008
May 2006
March 2007
December 2007
March 2007
August 2005
June 2005
March 2005
July 2004
October 2007
January 2007
October 2006
September 2006
July 2005
July 2002
September 2002
February 2003
December 2003
December 2003
July 2005
January 2006
YOC
1998
1992
1997
1999
2006
1920(R)
1964
1910(R)
1914(R)
1910(R)
1976
1993
1973
1973
1972
1965
1967
1919(R)
1921
1971
1974
1913
1913
1916
1910
1916
City
Omaha
Omaha
Omaha
Omaha
Omaha
Omaha
Omaha
Omaha
Omaha
Omaha
Omaha
Omaha
Omaha
Omaha
Omaha
Omaha
Omaha
Omaha
Omaha
Omaha
Omaha
Omaha
Omaha
Omaha
Omaha
Omaha
SP/Unit
$80,414
$48,958
$71,970
$78,788
$85,833
$112,782
$95,500
$69,129
$101,014
$69,129
$50,000
$56,974
$49,811
$43,056
$37,313
$37,097
$30,313
$21,250
$21,364
$33,167
$39,394
$13,036
$19,683
$15,600
$15,000
$21,250
Ro
6.25%
6.59%
6.73%
6.38%
6.12%
6.00%
5.80%
6.10%
7.05%
7.29%
8.75%
7.54%
8.32%
8.05%
8.96%
9.24%
8.82%
8.56%
9.46%
10.64%
10.17%
10.43%
10.44%
11.64%
11.60%
10.24%
Min
Max
Med
Mean
5.80%
6.73%
6.19%
6.25%
Min
Max
Med
Mean
7.05%
8.75%
7.80%
7.83%
Min
Max
Med
Mean
8.56%
9.46%
8.96%
9.08%
Min
Max
Med
Mean
10.17%
11.64%
10.44%
10.74%
20
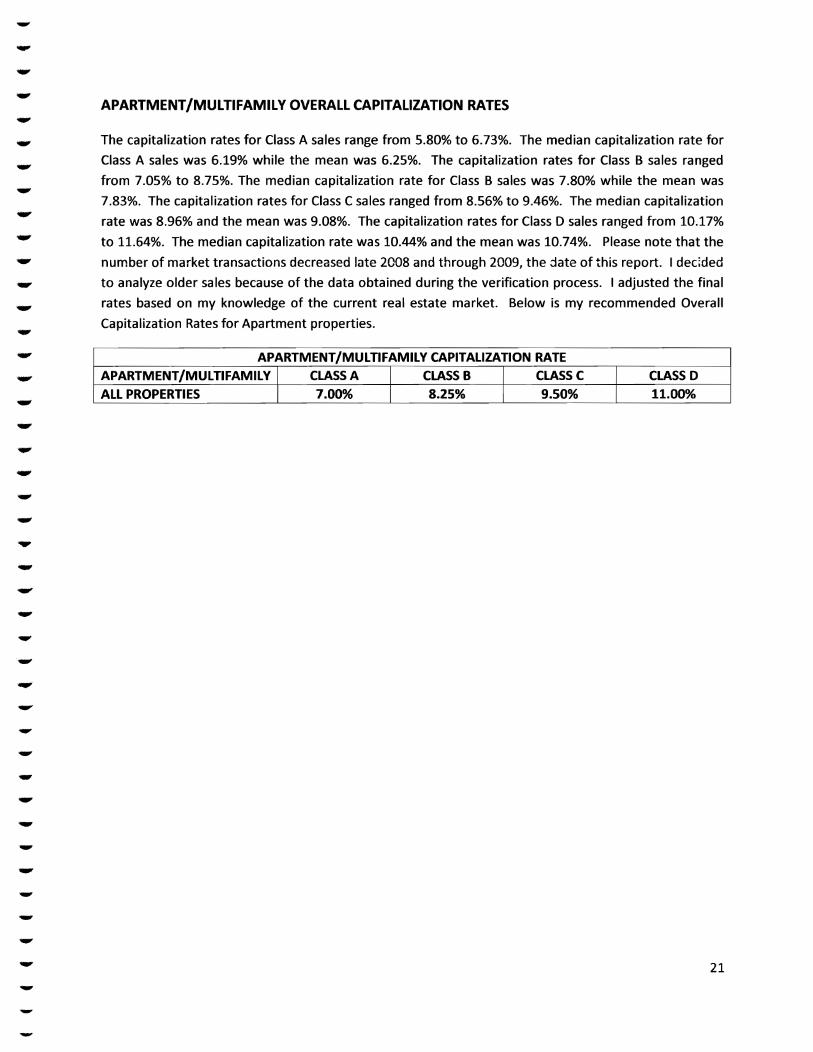
APARTMENT/MULTIFAMILY OVERALL CAPITALIZATION RATES
The capitalization rates for Class A sales range from 5.80% to 6.73%. The median capitalization rate for
Class A sales was 6.19% while the mean was 6.25%. The capitalization rates for Class B sales ranged
from 7.05% to 8.75%. The median capitalization rate for Class B sales was 7.80% while the mean was
7.83%. The capitalization rates for Class C sales ranged from 8.56% to 9.46%. The median capitalization
rate was 8.96% and the mean was 9.08%. The capitalization rates for Class D sales ranged from 10.17%
to 11.64%. The median capitalization rate was 10.44% and the mean was 10.74%. Please note that the
number of market transactions decreased late 2008 and through 2009, the date of this report. I decided
to analyze older sales because of the data obtained during the verification process. I adjusted the final
rates based on my knowledge of the current real estate market. Below is my recommended Overall
Capitalization Rates for Apartment properties.
APARTMENT/MULTIFAMILY CAPITALIZATION RATE
APARTMENT/MULTIFAMILY
ALL PROPERTIES
CLASS A
7.00%
CLASS B
8.25%
CLASS C
9.50%
CLASS D
11.00%
21

DOUGLAS COUNTY OFFICE MARKET
DOUGLAS COUNTY METRO DATA-OFFICE
Year
2008
2008
2009
2009
Qtr
1
2
3
4
All
1
2
3
4
All
Inventory/SF
17,570,000
17,570,000
17,447,000
17,273,000
17,273,000
17,112,000
17,484,000
17,450,000
17,383,000
17,383,000
Completions
0
0
61,000
16,000
77,000
0
411,000
33,000
0
444,000
Inventory Growth
0.0%
0.0%
-0.7%
-1.0%
-1.7%
-0.9%
2.2%
-0.2%
-0.4%
0.6%
Vacant Stock
2,315,000
2,249,000
2,411,000
2,413,000
2,413,000
2,379,000
2,774,000
2,940,000
2,988,000
2,980,000
Year
2008
2008
2009
2009
Qtr
1
2
3
4
All
1
2
3
4
All
Vacancy Rate
13.2%
12.8%
13.8%
14.0%
14.0%
13.9%
15.9%
16.8%
17.2%
17.2%
Vacancy Change(BP)
-110
-40
100
20
-30
-10
200
90
40
320
Occupied Stock
15,255,000
15,321,000
15,036,000
14,860,000
14,860,000
14,733,000
14,710,000
14,510,000
14,395,000
14,395,000
Net Absorption
206,000
66,000
-285,000
-176,000
-189,000
-127,000
-23,000
-200,000
-115,000
-465,000
OFFICE CAPITALIZATION RATES, NATIONAL
REAL ESTATE RESEARCH CORPORATION, MIDWEST INVESTMENT CRITERIA - SUMMER 2009
OFFICE-CBD
First-Tier Properties Second-Tier Properties Third-Tier Properties
PRE-TAX YIELD (IRR) (%)
RANGE
MEAN
8.6-13.0
10.2
9.0-14.0
11.1
9.0-15.0
11.7
GOING-IN CAP RATE (%)
RANGE
MEAN
7.0-10.0
8.3
7.5-11.0
9.2
8.0-12.0
10.0
TERMINAL CAP RATE (%)
RANGE
MEAN
8.0-10.5
8.9
8.0-11.0
9.7
8.5-12.0
10.7
22

OFFICE-SUBURBAN
First-Tier Properties Second-Tier Properties Third-Tier Properties
PRE-TAX YIELD (IRR) (%)
RANGE
MEAN
8.5-13.0
10.7
9.0-15.0
12.0
9.5-15.0
11.9
GOING-IN CAP RATE (%)
RANGE
MEAN
7.5-10.0
8.6
8.0-10.5
9.5
8.3-12.0
10.0
TERMINAL CAP RATE (%)
RANGE
MEAN
8.0-12.0
9.3
8.5-12.0
10.1
8.8 -14.0
10.9
REAL ESTATE RESEARCH CORPORATION, OMAHA - SUMMER 2009
CBD
GOING-IN CAP RATE (%)
TERMINAL CAP RATE (%)
RERC ESTIMATE
9.2%
9.8%
MIDWEST
l_ 8.3%
8.9%
U.S.
8.1%
8.8%
SUBURBAN
GOING-IN CAP RATE (%)
TERMINAL CAP RATE (%)
RERC ESTIMATE
9.7%
10.3%
MIDWEST
8.6%
9.3%
U.S.
8.4%
9.1%
KORPACZ/PRICEWATERHOUSECOOPERS, LLP, 4th Quarter 2009
CBD
KEY INDICATORS
DISCOUNT RATE (IRR)
RANGE
MEAN
CHANGE (Basis Points)
OVERALL RATE (OAR)
RANGE
MEAN
CHANGE (Basis Points)
RESIDUAL CAP RATE
RANGE
MEAN
CHANGE (Basis Points)
CURRENT QUARTER
6.75%-14.00%
9.39%
5.60%-11.00%
8.24%
6.50%-11.00%
8.44%
LAST QUARTER
7.50%-13.00%
9.24%
+15
5.00%-11.00%
8.11%
+13
6.50%-11.00%
8.44%
0
ONE YEAR AGO
6.25%-12.00%
8.52%
+87
4.50%-10.00%
7.14%
+110
6.25%-10.00%
7.80%
+64
23

KORPACZ/PRICEWATERHOUSECOOPERS, LLP, 4th Quarter 2009
SUBURBAN
KEY INDICATORS
DISCOUNT RATE (IRR)
RANGE
MEAN
CHANGE (Basis Points)
OVERALL RATE (OAR)
RANGE
MEAN
CHANGE (Basis Points)
RESIDUAL CAP RATE
RANGE
MEAN
CHANGE (Basis Points)
CURRENT QUARTER
7.25%-14.00%
10.02%
6.75%-12.00%
8.75%
7.00%-11.50%
8.76%
LAST QUARTER
8.00%-14.00%
10.24%
-22
7.00%-12.00%
8.72%
+3
7.50%-11.50%
8.85%
-9
ONE YEAR AGO
7.00%-12.50%
9.12%
+90
5.50%-11.00%
7.59%
+116
6.50%-11.50%
8.09%
+67
RealtYRates.com Investor Survey
ALL TYPES
CBD
SUBURBAN
4th Quarter 2009
DEBT COVERAGE RATIO
BAND OF INVESTMENT
INVESTOR SURVEY
DEBT COVERAGE RATIO
BAND OF INVESTMENT
INVESTOR SURVEY
DEBT COVERAGE RATIO
BAND OF INVESTMENT
INVESTOR SURVEY
MINIMUM
4.85%
6.24%
5.93%
5.17%
6.63%
6.30%
4.85%
6.24%
5.93%
MAXIMUM
12.88%
14.11%
13.40%
12.88%
14.11%
13.40%
9.72%
13.60%
12.92%
MEAN
8.49%
9.26%
10.08%
8.87%
9.86%
10.17%
8.14%
9.73%
9.20%
OFFICE CLASSIFICATIONS The following definitions are used to describe office classifications as
interpreted with this report as Class A, B, C, and D, or properties indicated as first, second or third tier
office buildings.
OFFICE BUILDING: A type of commercial building used exclusively or primarily for office use (business),
as opposed to manufacturing, warehousing, or other uses. Office buildings may sometimes have other
associated uses within part of the building, i.e., retail, sales, financial, or restaurant, usually on the
ground floor.
24

CLASS A Multi-Story (First Tier): A classification used to describe buildings that generally qualify as
extremely desirable investment grade properties and command the highest rents or sale prices
compared to other buildings in the same market. Such buildings are well located and provide efficient
tenant layouts as well as high quality and in some buildings, one-of-a-kind floor plans. They can be an
architectural or historical landmark designed by prominent architects. These buildings contain a modern
mechanical system, and have above-mean maintenance and management as well as the best quality
materials and workmanship in there trim and fittings. They are generally the most attractive and eagerly
sought by investors willing to pay a premium for quality.
CLASS B Multi-Story (Second Tier): A classification used to describe buildings that generally qualify as a
more speculative investment, and command lower rents or sale prices compared to other buildings in
the same market. Such buildings offer utilitarian space without special attractions, and have ordinary
design, if new or fairly new; good to excellent design if an older, non-landmark building. These buildings
typically have mean to good maintenance, management, and tenants. They are less appealing to
tenants in Class A properties, and may be deficient in a number of respects including floor plans,
condition, and facilities. They lack prestige and must depend chiefly on a lower price to attract tenants
and investors.
CLASS C Multi-Story (Third Tier): A classification used to describe buildings that generally qualify as no-
frills, older buildings that offer basic space and command lower rents or sale prices compared to other
buildings in the same market. Such buildings typically have below-mean maintenance and management,
and could have mixed or low tenant prestige, inferior elevators, and/or mechanical/electric systems.
These buildings lack prestige and must depend on a lower rent to attract tenants and investors.
CLASS D Multi-Story: A classification used to describe buildings that generally below mean and reaching
the end of their economic life. These buildings with have lower rental rates and lower occupancy rates.
Such buildings typically have lower quality construction and finish, often in need of extensive
renovation. The buildings have below-mean maintenance and management, and could have mixed or
low tenant prestige. Usually not in a prime location and generally a break-even basis; not income
producing
Class A One-Story Office has excellent location, access, appearance, and construction. The building has
superior architectural design and construction and is usually new or competitive with new buildings.
Class B One-Story Office class has a good location, access, appearance, and construction. Property may
be slightly older than "A" properties.
Class C One-Story Office is an older building with a secondary location. Often these are single family
dwellings have been converted for office use.
Class D One-Story Office is an older building often in need of renovation and/or repairs. These buildings
are usually in the least desirable location.
25
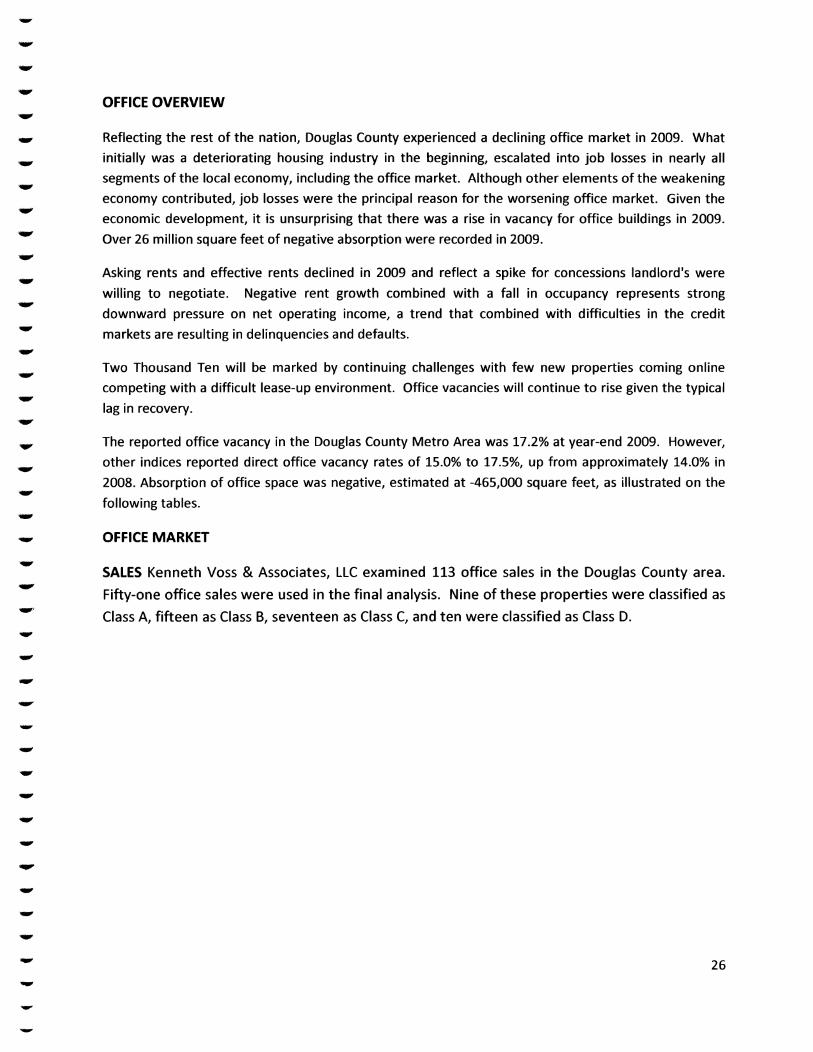
OFFICE OVERVIEW
Reflecting the rest of the nation, Douglas County experienced a declining office market in 2009. What
initially was a deteriorating housing industry in the beginning, escalated into job losses in nearly all
segments of the local economy, including the office market. Although other elements of the weakening
economy contributed, job losses were the principal reason for the worsening office market. Given the
economic development, it is unsurprising that there was a rise in vacancy for office buildings in 2009.
Over 26 million square feet of negative absorption were recorded in 2009.
Asking rents and effective rents declined in 2009 and reflect a spike for concessions landlord's were
willing to negotiate. Negative rent growth combined with a fall in occupancy represents strong
downward pressure on net operating income, a trend that combined with difficulties in the credit
markets are resulting in delinquencies and defaults.
Two Thousand Ten will be marked by continuing challenges with few new properties coming online
competing with a difficult lease-up environment. Office vacancies will continue to rise given the typical
lag in recovery.
The reported office vacancy in the Douglas County Metro Area was 17.2% at year-end 2009. However,
other indices reported direct office vacancy rates of 15.0% to 17.5%, up from approximately 14.0% in
2008. Absorption of office space was negative, estimated at -465,000 square feet, as illustrated on the
following tables.
OFFICE MARKET
SALES Kenneth Voss & Associates, LLC examined 113 office sales in the Douglas County area.
Fifty-one office sales were used in the final analysis. Nine of these properties were classified as
Class A, fifteen as Class B, seventeen as Class C, and ten were classified as Class D.
26

SUMMARY OF OFFICE SALES
Sale#
201
202
203
204
205
206
207
208
209
210
211
212
213
214
215
216
217
218
219
220
221
222
223
224
225
226
227
228
229
230
231
232
233
234
235
236
237
238
239
240
241
Class
A
A
A
A
A
A
A
A
A
B
B
B
B
B
B
B
B
B
B
B
B
B
B
B
C
C
C
C
C
C
C
C
C
C
C
C
C
C
C
C
C
Sale Date
January 2009
May 2005
May 2006
January 2007
February 2005
February 2007
August 2006
May 2007
December 2005
January 2009
April 2005
April 2004
May 2007
June 2006
January 2005
December 2005
November 2006
June 2008
December 2007
September 2006
September 2006
August 2006
November 2005
May 2008
August 2004
May 2008
July 2004
November 2005
January 2007
April 2005
August 2004
June 2008
December 2007
September 2004
August 2008
January 2004
September 2005
August 2004
January 2005
June 2004
May 2008
YOC
1988
2001
1998
1995
1994
1995
1986
1980(R)
2005
1986
2001
2001
1980
1970
1993
1997
1980
1996
1997
1964
1984
1987
2002
1985
1966
1983
1991
1999
1976
1975
1983
1996
1997
2002
1970
1984
1970
1977
1986
1994
1985
City
Omaha
Omaha
Omaha
Omaha
Omaha
Omaha
Omaha
Omaha
Omaha
Omaha
Omaha
Omaha
Omaha
Omaha
Omaha
Omaha
Omaha
Omaha
Omaha
Omaha
Omaha
Omaha
Omaha
Omaha
Omaha
Omaha
Omaha
Omaha
Omaha
Omaha
Omaha
Omaha
Omaha
Omaha
Omaha
Omaha
Omaha
Omaha
Omaha
Omaha
Omaha
$SP/PSF
$ 136.79
$ 199.49
$ 185.63
$ 144.61
$ 106.99
$ 141.92
$ 125.91
$ 158.45
$ 184.22
$ 125.43
$ 90.52
$ 148.80
$ 105.63
$ 159.93
$ 122.16
$ 106.52
$ 119.17
$ 145.60
$ 130.48
$ 170.58
$ 129.85
$ 228.52
$ 106.99
$ 100.59
$ 75.00
$ 78.67
$ 89.62
$ 116.21
$ 85.00
$ 81.15
$ 111.01
$ 145.60
$ 130.48
$ 138.84
$ 73.23
$ 88.48
$ 68.16
$ 82.50
$ 91.82
$ 82.10
$ 100.59
Ro
6.81%
6.84%
7.31%
7.39%
7.91%
8.12%
8.20%
5.64%
6.12%
7.43%
7.56%
7.71%
7.76%
8.07%
8.16%
8.18%
8.45%
8.51%
8.69%
8.40%
9.95%
7.44%
8.64%
9.26%
8.57%
8.76%
8.82%
8.08%
8.10%
8.29%
8.47%
8.51%
8.69%
8.79%
8.88%
9.25%
9.30%
9.67%
9.73%
9.89%
9.26%
Min
Max
Med
Mean
5.64%
8.20%
7.31%
7.15%
Min
Max
Med
Mean
7.43%
9.95%
8.18%
8.28%
Min
Max
Med
Mean
7.73%
9.26%
8.76%
8.89%
27

Saletf
242
243
244
245
246
247
248
249
250
251
Class
D
D
D
D
D
D
D
D
D
D
Sale Date
March 2008
September 2005
November 2008
April 2005
August 2006
December 2006
April 2005
January 2006
May 2004
July 2006
YOC
1957
1945
1966
1998
1972
1993
2000
1989
1982
1971
City
Omaha
Omaha
Omaha
Omaha
Omaha
Omaha
Omaha
Omaha
Omaha
Omaha
$SP/PSF
$ 88.47
$ 92.89
$ 76.92
$ 110.01
$ 53.05
$ 149.71
$ 104.88
$ 80.59
$ 100.86
$ 46.11
Ro
7.73%
7.82%
8.34%
8.35%
8.46%
8.75%
8.75%
9.45%
9.97%
11.16%
Min
Max
Med
Mean
7.73%
11.16%
8.61%
8.88%
OFFICE OVERALL CAPITALIZATION RATES
The capitalization rates for Class A sales range from 5.64% to 8.20%. The median capitalization rate for
Class A sales was 7.319% while the mean was 7.15%. The capitalization rates for Class B sales ranged
from 7.43% to 9.75%. The median capitalization rate for Class B sales was 8.18% while the mean was
8.28%. The capitalization rates for Class C sales ranged from 8.57% to 9.26%. The median capitalization
rate was 8.76% and the mean was 8.89%. The capitalization rates for Class D sales ranged from 7.73% to
11.16%. The median capitalization rate was 8.61% and the mean was 8.88%. Please note that the
number of market transactions decreased in late 2008 and through 2009, the date of this report. I
decided to analyze older sales because of the data obtained during the verification process. I adjusted
the final rates based on my knowledge of the current real estate market. Below is my recommended
Overall Capitalization Rates for Office properties.
OFFICE
ALL PROPERTIES
CLASS A
7.75%
OFFICE CAPITALIZATION RATE
CLASS B
8.50%
CLASS C
9.25%
CLASS D
10.25%
28

DOUGLAS COUNTY RETAIL MARKET
DOUGLAS COUNTY METRO DATA-NEIGHBRHOOD & COMMUNITY SHOPPING CENTERS
Year
2008
2008
2009
2009
Qtr
1
2
3
4
All
1
2
3
4
All
Inventory/SF
13,760,000
13,782,000
13,807,000
13,905,000
13,905,000
13,905,000
13,905,000
13,923,000
13,923,000
13,923,000
Completions
37,000
22,000
25,000
98,000
182,000
0
0
18,000
0
18,000
Inventory Growth
0.3%
0.2%
0.2%
0.7%
1.3%
0.0%
0.0%
0.1%
-0.4%
0.1%
Vacant Stock
1,220,000
1,248,000
1,207,000
1,276,000
1,276,000
1,302,000
1,262,000
1,255,000
1,451,000
1,451,000
Year
2008
2008
2009
2009
Qtr
1
2
3
4
All
1
2
3
4
All
Vacancy Rate
8.9%
9.1%
8.7%
9.2%
9.2%
9.4%
9.1%
9.0%
10.4%
10.4%
Vacancy Change(BP)
50
20
-40
50
80
20
-30
-10
140
120
Occupied Stock
12,540,000
12,534,000
12,600,000
12,629,000
12,629,000
12,603,000
12,643,000
12,668,000
12,472,000
12,472,000
Net Absorption
-37,000
-6,000
66,000
29,000
52,000
-26,000
40,000
25,000
-196,000
-157,000
RETAIL CAPITALIZATION RATES, NATIONAL
REAL ESTATE RESEARCH CORPORATION, MIDWEST INVESTMENT CRITERIA - SUMMER 2009
RETAIL-REGIONAL MALL
First-Tier Properties Second-Tier Properties Third-Tier Properties
PRE-TAX YIELD (IRR) (%)
RANGE
MEAN
8.0-12.0
9.8
9.0-14.0
10.8
9.0-16.0
12.0
GOING-IN CAP RATE (%)
RANGE
MEAN
5.0-9.0
8.1
7.5-10.5
9.1
8.0-12.0
10.1
TERMINAL CAP RATE (%)
RANGE
MEAN
7.7-10.0
8.8
8.0-12.0
9.8
8.3 -15.0
10.9
29

RETAIL-POWER CENTER
First-Tier Properties Second-Tier Properties Third-Tier Properties
PRE-TAX YIELD (IRR) (%)
RANGE
MEAN
8.0-12.0
9.8
9.0-14.0
10.7
10.0-16.0
12.1
GOING-IN CAP RATE (%)
RANGE
MEAN
6.5-9.0
8.3
6.5-10.0
9.1
8.5-12.0
10.1
TERMINAL CAP RATE (%)
RANGE
MEAN
7.8-11.0
9.1
8.5-13.0
9.8
9.5 -14.0
10.9
RETAIL-NEIGHBORHOOD & COMMUNITY CENTER
First-Tier Properties Second-Tier Properties Third-Tier Properties
PRE-TAX YIELD (IRR) (%)
RANGE
MEAN
8.0-12.0
10.0
9.0-14.0
10.9
10.5 -15.0
11.7
GOING-IN CAP RATE (%)
RANGE
MEAN
5.8-10.0
8.5
6.5-12.0
9.4
8.5-13.0
10.1
TERMINAL CAP RATE (%)
RANGE
MEAN
6.0-11.0
9.2
8.0-12.5
10.0
9.3 -14.0
10.7
REAL ESTATE RESEARCH CORPORATION, OMAHA-SUMMER 2009
REGIONAL MALL
GOING-IN CAP RATE (%)
TERMINAL CAP RATE (%)
RERC ESTIMATE
9.0%
9.7%
MIDWEST
8.1%
8.8%
U.S.
8.1%
8.9%
POWER CENTER
GOING-IN CAP RATE (%)
TERMINAL CAP RATE (%)
RERC ESTIMATE
9.4%
10.1%
MIDWEST
8.3%
9.1%
U.S.
8.3%
9.1%
NEIGHBORHOOD & COMMUNITY
GOING-IN CAP RATE (%)
TERMINAL CAP RATE (%)
RERC ESTIMATE
9.5%
10.1%
MIDWEST
8.5%
9.2%
U.S.
8.4%
9.1%
30

KORPACZ/PRICEWATERHOUSECOOPERS, LLP, 4th Quarter 2009
REGIONAL MALL
KEY INDICATORS
DISCOUNT RATE (IRR)
RANGE
MEAN
CHANGE (Basis Points)
OVERALL RATE (OAR)
RANGE
MEAN
CHANGE (Basis Points)
RESIDUAL CAP RATE
RANGE
MEAN
CHANGE (Basis Points)
CURRENT QUARTER
7.00%-17.00%
10.36%
5.00%-11.00%
8.06%
6.25%-12.00%
8.84%
LAST QUARTER
7.00%-15.00%
10.43%
+20
5.00%-11.00%
7.98%
+8
6.25%-12.00%
8.64%
+20
ONE YEAR AGO
7.00%-11.00%
9.02%
+161
5.00%-9.50%
6.96%
+110
6.00%-10.00%
7.53%
+131
KORPACZ/PRICEWATERHOUSECOOPERS, LLP, 4th Quarter 2009
POWER CENTER
KEY INDICATORS
DISCOUNT RATE (IRR)
RANGE
MEAN
CHANGE (Basis Points)
OVERALL RATE (OAR)
RANGE
MEAN
CHANGE (Basis Points)
RESIDUAL CAP RATE
RANGE
MEAN
CHANGE (Basis Points)
CURRENT QUARTER
7.50%-15.00%
10.08%
7.50%-10.00%
8.60%
7.50%-10.00%
8.68%
LAST QUARTER
7.50%-15.00%
9.92%
+16
7.50%-10.00%
8.63%
-3
7.50%-10.50%
8.88%
-20
ONE YEAR AGO
7.00%-12.00%
8.95%
+113
6.00%-10.00%
7.57%
+103
6.75%-12.00%
8.20%
+48
31

KORPACZ/PRICEWATERHOUSECOOPERS, LLP, 4th Quarter 2009
STRIP SHOPPING CENTER
KEY INDICATORS
DISCOUNT RATE (IRR)
RANGE
MEAN
CHANGE (Basis Points)
OVERALL RATE (OAR)
RANGE
MEAN
CHANGE (Basis Points)
RESIDUAL CAP RATE
RANGE
MEAN
CHANGE (Basis Points)
CURRENT QUARTER
7.50%-12.00%
9.44%
7.25%-11.00%
8.53%
7.25%-11.00%
8.63%
LAST QUARTER
7.75%-12.00%
9.38%
+6
7.50%-11.00%
8.41%
+12
7.25%-10.00%
8.61%
+2
ONE YEAR AGO
7.00%-10.00%
8.49%
+95
5.80%-9.00%
7.49%
+104
6.00%-10.50%
7.82%
+81
RealtyRates.com Investor Survey
ALL TYPES
ANCHORED CENTERS
UNANCHORED
CENTERS
FREESTANDING
4th Quarter 2009
DEBT COVERAGE RATIO
BAND OF INVESTMENT
INVESTOR SURVEY
DEBT COVERAGE RATIO
BAND OF INVESTMENT
INVESTOR SURVEY
DEBT COVERAGE RATIO
BAND OF INVESTMENT
INVESTOR SURVEY
DEBT COVERAGE RATIO
BAND OF INVESTMENT
INVESTOR SURVEY
MINIMUM
5.36%
6.20%
5.89%
5.36%
6.20%
5.89%
6.13%
6.98%
6.63%
6.02%
6.21%
6.26%
MAXIMUM
13.33%
14.42%
13.70%
13.17%
13.10%
12.44%
13.33%
14.42%
13.70%
13.11%
13.76%
13.07%
MEAN
8.28%
9.27%
9.98%
8.89%
9.09%
9.90%
9.60%
10.22%
10.62%
8.67%
9.00%
10.26%
32

RETAIL CLASSIFICATIONS The following definitions are used to describe apartment/multifamily
classifications as interpreted with this report as Class A, B, C, and D.
SUPER REGIONAL MALL offers extensive variety in general merchandise, apparel, furniture, and
home furnishings, as well as a variety of services and recreational facilities. It is built around
three or more full-line department stores generally not less than 75,000 square feet each,
although there are exceptions in small communities. The typical size of a super regional center
is about 1,000,000 square feet of gross leasable area. In practice the size ranges from about
500,000 square feet to more than 1,500,000 square feet.
REGIONAL MALL provides general merchandise, apparel, furniture, and home furnishings in
depth and variety, as well as a range of services and recreational facilities. It is built around
two-full line department stores of generally not less than 50,000 square feet, although there
are exceptions in small communities. The typical size is about 500,000 square feet of gross
leasable area. In practice, it may range from 250,000 square feet to more than 900,000 square
feet. The regional center provides services typical of a business district yet not as extensive as
those of a super regional center.
COMMUNITY CENTER is any center larger than a neighborhood center but with neither a
traditional department store nor the trade area of a regional shopping center. The typical size
of a community center is about 180,000 square feet of gross leasable area, but in practice, may
range from 100,000 to 500,000 square feet.
NEIGHBORHOOD CENTER provides for the sale of convenience goods and personal services for
the day-to-day living needs of the immediate neighborhood. It is built around a supermarket as
the principal tenant and typically contains a gross leasable area of 60,000 square feet. In
practice, it may range in size from 30,000 to 100,000 square feet.
POWER CENTER contains at least four category-specific anchors of 20,000 or more square feet.
These anchors typically emphasize hard goods, such as consumer electronics, sporting goods,
office supplies, home furnishings, and personal computer hardware/software. Anchors in
power centers typically occupy 85 percent or more of the total gross leasable area.
CONVENIENCE CENTER provides for the sale of personal services and convenience goods similar
to those of a neighborhood center. It contains a minimum of three stores, with a total gross
leasable area of 30,000 or less. Instead of being anchored by a supermarket, it is usually
anchored by some other type of service such as a minimarket.
Class A One-Story Retail is a store with excellent location, access, appearance, and
construction. These buildings are usually new or competitive with new buildings.
33

Class B One-Story Retail is a store with an average location, access, appearance, and
construction. Finish typically has little ornamentation.
Class C One-Story Retail is a store with a less desirable location, access, appearance, and
construction. Finish typically has a lack of ornamentation.
Class D One-Story Retail is a store in the least desirable location, access, appearance, and
construction. These buildings are old and in need of repair.
Retail properties are generally classified by size of center, types of tenants, and trade area
draw. I have considered freestanding single tenant retail, unanchored strip centers, and/or
neighborhood centers anchored by grocery stores, and community centers, which are larger
than neighborhood centers and have several anchor tenants, often including a large discount
retailer. Retail properties are also classified on a scale of A to E, based on a variety of factors as
indicated below.
CLASS A
Wealth distribution, specific location, visibility, and/or access greatly contribute to the potential
success of the project when compared to others in the market area.
CLASS B
Wealth distribution, specific location, visibility, and/or access to the project are above mean
and have a positive impact to the potential success of the project when compared to others in
the market area.
CLASS C
Sub-neighborhood wealth, specific location, visibility, and/or access to the project are typical
when compared to others in the market area.
CLASS D
Wealth distribution, specific location, visibility, and/or access are inferior to others in the
market area
RETAIL OVERVIEW A spike in deterioration characterized the performance of neighborhood and
community centers in 2009. Negative net absorption in 2009 represents the largest single-
period figure in negative net absorption. Asking and effective rents also registered declines as
landlords came under increasing pressure from tenants who were either downsizing or going
out of business. The amount of concessions increased significantly, as effective rents
decreased. Larger properties were not spared, as Mall vacancy increased to over 8.0%. Asking
34

rents for regional malls also decreased. Unless conditions change, there will be a continued
increase in vacancy, and negative asking and effective rent decreases in neighborhood and
community centers through 2011.
The current weakness weighting down retail properties is the pullback in consumer spending
and low level of consumer confidence. With continuing uncertainty in both stock of wealth and
flow of future income, there appears to be little basis for optimism required to maintain or
increase spending and therefore keep retail businesses afloat. With tenants downsizing in
terms of their space or going out of business, the near-term future of retail space remains
daunting.
RETAIL MARKET
SALES Kenneth Voss & Associates, LLC examined 216 retail sales in the Douglas County area.
One hundred-seven retail sales were used in the final analysis. Fifteen of these properties were
classified as Class A, twenty-eight as Class B, forty-five as Class C, and nineteen were classified
as Class D.
35

SUMMARY OF RETAIL SALES
Sale#
301
302
303
304
305
306
307
308
309
310
311
312
313
314
315
316
317
318
319
320
321
322
323
324
325
326
327
328
329
330
331
332
333
334
335
336
337
338
339
340
341
342
Class
A
A
A
A
A
A
A
A
A
A
A
A
A
A
A
B
B
B
B
B
B
B
B
B
B
B
B
B
B
B
B
B
B
B
B
B
B
B
B
B
B
B
Sale Date
February 2007
August 2008
February 2007
June 2007
March 2004
October 2005
July 2007
March 204
September 2008
April 2008
November 2004
October 2006
February 2007
May 2007
May 2007
November 2007
February 2006
December 2006
March 206
January 2006
March 2007
May 2007
September 2006
September 2007
September 2004
March 2008
March 2009
May 2009
August 2007
July 2009
June 2009
November 2005
December 2005
March 2008
December 2005
October 2007
November 2008
November 2004
August 2008
February 2007
December 2008
December 2008
YOC
1989
2007
2004
2006
2004
2001
1995
2004
1999
2005
2001
2004
2003
2000
1999
1985
1976
1976
1974
1974
1940
2003
1986
1973
1990
1997
1996
1984
1996
1995
2003
1979
1987
1929
1988
1969
1981
2004
1970
1971
1994
1994
City
Omaha
Omaha
Omaha
Omaha
Omaha
Omaha
Omaha
Omaha
Omaha
Omaha
Omaha
Omaha
Omaha
Omaha
Omaha
Omaha
Omaha
Omaha
Omaha
Omaha
Omaha
Omaha
Omaha
Omaha
Omaha
Omaha
Omaha
Omaha
Omaha
Omaha
Omaha
Omaha
Omaha
Omaha
Omaha
Omaha
Omaha
Omaha
Omaha
Omaha
Omaha
Omaha
$SP/PSF
$365.68
$232.09
$483.35
$223.53
$345.21
$231.59
$117.26
$143.05
$152.19
$330.33
$138.89
$214.85
$162.28
$150.00
$145.52
$124.83
$82.00
$124.81
$98.48
$93.80
$40.71
$108.16
$126.92
$43.15
$75.32
$124.50
$65.23
$155.73
$133.28
$132.79
$64.06
$77.29
$63.84
$125.39
$125.00
$74.24
$37.81
$144.63
$73.23
$76.94
$128.19
$128.19
Ro
6.67%
6.74%
6.87%
6.93%
6.99%
7.00%
7.15%
7.15%
7.17%
7.22%
7.39%
7.45%
7.79%
7.98%
8.23%
7.14%
7.15%
7.30%
7.48%
7.60%
7.69%
7.74%
7.83%
7.87%
7.90%
7.98%
8.07%
8.11%
8.15%
8.19%
8.22%
8.34%
8.52%
8.53%
8.56%
8.60%
8.86%
8.86%
8.88%
9.00%
9.25%
9.25%
Min
Max
Med
Mean
6.67%
8.23%
7.15%
7.25%
Min
Max
Med
Mean
7.14%
9.25%
8.15%
8.48%
36

Saletf
343
344
345
346
347
348
349
350
351
352
353
354
355
356
357
358
359
360
361
362
363
364
365
366
367
368
369
370
371
372
373
374
375
376
377
378
379
380
381
382
383
384
385
386
Class
C
C
C
C
C
C
C
C
C
C
C
C
C
c
c
c
c
c
c
c
c
c
c
c
c
c
c
c
c
c
c
c
c
c
c
c
c
c
c
c
c
c
c
c
Sale Date
August 2006
September 2005
August 2005
May 2008
September 2005
January 2005
December 2006
February 2005
July 2005
November 2006
December 2006
August 2004
January 2006
September 2005
March 2007
August 2007
November 2005
November 2004
March 2005
June 2004
November 2005
December 2006
September 2007
December 2008
October 2004
October 2008
February 2006
January 2006
May 2009
May 2004
October 2007
February 2008
April 2006
July 2004
October 2005
May 2008
March 2004
August 2004
December 2007
June 2004
June 2006
January 2005
April 2008
August 2008
YOC
1956
1930
1978
1976
1925
1919
1961
1905
1913
1930
1920
1992
1980
1945
1975
1944
1925
1980
1978
1962
1971
1981
1966
1991
1991
1974
1990
1992
1974
1900
1999
1974
1974
1986
1976
1968
1922
1911
1968
1950
1998
1987
1987
1970
City
Omaha
Omaha
Omaha
Omaha
Omaha
Omaha
Omaha
Omaha
Omaha
Omaha
Omaha
Omaha
Omaha
Omaha
Omaha
Omaha
Omaha
Omaha
Omaha
Omaha
Omaha
Omaha
Omaha
Omaha
Omaha
Omaha
Omaha
Omaha
Omaha
Omaha
Omaha
Omaha
Omaha
Omaha
Omaha
Omaha
Omaha
Omaha
Omaha
Omaha
Omaha
Omaha
Omaha
Omaha
$SP/PSF
$85.00
$58.75
$57.44
$122.67
$39.62
$63.89
$25.00
$88.07
$138.33
$70.18
$123.37
$55.00
$115.37
$92.89
$65.35
$54.35
$106.99
$120.07
$69.99
$43.73
$66.38
$36.74
$62.93
$69.23
$108.61
$57.62
$109.58
$70.00
$34.69
$60.44
$58.98
$52.93
$94.23
$86.70
$80.91
$128.19
$87.95
$42.14
$40.87
$47.26
$130.56
$46.15
$51.19
$128.19
Ro
7.15%
7.20%
7.36%
7.43%
7.60%
8.03%
8.10%
8.10%
8.15%
8.30%
8.32%
8.39%
8.41%
8.47%
8.51%
8.54%
8.64%
8.69%
8.70%
8.73%
8.91%
8.91%
8.93%
8.95%
9.06%
9.06%
9.13%
9.16%
9.17%
9.21%
9.23%
9.23%
9.23%
9.51%
9.61%
9.69%
9.72%
9.72%
9.79%
9.85%
9.93%
10.05%
10.22%
10.35%
Min
Max
Med
Mean
7.15%
10.35%
8.92%
8.85%
37

Salett
387
388
389
390
391
392
393
394
395
396
397
398
399
400
401
402
403
404
405
Class
D
D
D
D
D
D
D
D
D
D
D
D
D
D
D
D
D
D
D
Sale Date
October 2007
October 2007
May 2005
January 2009
June 2008
January 2004
December 2005
March 2007
July 2004
September 2006
October 2005
July 2007
February 2008
August 2006
March 2004
November 2006
July 2004
June 2004
March 2008
YOC
1927
1971
1996
1930
1971
1974
1986
1938
1985
1964
1957
1957
1915
1880
1922
1948
1937
1977
1950
City
Omaha
Omaha
Omaha
Omaha
Omaha
Omaha
Omaha
Omaha
Omaha
Omaha
Omaha
Omaha
Omaha
Omaha
Omaha
Omaha
Omaha
Omaha
Omaha
$SP/PSF
$66.56
$83.33
$55.23
$46.25
$24.01
$75.45
$56.32
$54.56
$37.67
$22.37
$28.95
$30.16
$33.32
$63.00
$36.40
$23.19
$37.20
$58.73
$45.51
Ro
8.70%
9.23%
9.87%
10.00%
10.12%
10.20%
10.28%
10.45%
10.53%
10.64%
10.96%
11.01%
11.18%
11.32%
11.78%
11.92%
12.13%
12.28%
14.10%
Min
Max
Med
Mean
8.70%
14.10%
10.64%
10.88%
RETAIL OVERALL CAPITALIZATION RATES
The capitalization rates for Class A sales ranged from 6.67% to 8.23%. The median capitalization rate for
Class A sales was 7.15% while the mean was 7.25%. The capitalization rates for Class B sales ranged
from 7.14% to 9.25%. The median capitalization rate for Class B sales was 8.15% while the mean was
8.48%. The capitalization rates for Class C sales ranged from 7.15% to 10.35%. The median
capitalization rate was 8.92% and the mean was 8.85%. The capitalization rates for Class D sales ranged
from 8.70% to 14.10%. The median capitalization rate was 10.64% and the mean was 10.88%. Please
note that the number of market transactions decreased in late 2008 and through 2009, the date of this
report. I decided to analyze older sales because of the data obtained during the verification process. I
adjusted the final rates based on my knowledge of the current real estate market. Below is my
recommended Overall Capitalization Rates for Retail properties.
RETAIL
ALL PROPERTIES
CLASS A
7.50%
RETAIL CAPITALIZATION RATE
CLASS B
8.50%
CLASS C
9.00%
CLASS D
10.75%
38

INDUSTRIAL PROPERTIES
DOUGLAS COUNTY METRO DATA-INDUSTRIAL
Year
2008
2009
2009
Qtr
1
2
3
4
1
2
3
4
All
Inventory/SF
33,339,980
33,346,980
33,242,780
33,242,780
33,242,780
33,249,780
33,249,780
33,249,779
33,271,400
Vacant SF
1,593,870
1,907,514
1,704,767
1,758,077
1,820,072
1,851,511
1,884,275
1,844,078
1,888,398
Inventory Growth
4.8%
5.7%
5.1%
5.3%
5.5%
5.6%
5.7%
5.5%
5.7%
Net Absorption
371,862
-306,644
98,547
-53,310
-61,995
-24,439
-32,764
40,196
-44,320
Year
2008
2009
2009
Qtr
1
2
3
4
1
2
3
4
All
No. Buildings
1,022
1,023
1,022
1,022
1,022
1,023
1,023
1,022
1,025
Buildings Delivered
1
0
0
0
0
1
0
0
1
Area/SF Delivered
7,000
0
0
0
0
7,000
0
0
40,000
SF Under Const.
7,000
0
0
7,000
7,000
0
52,255
52,255
52,255
INDUSTRIAL CAPITALIZATION RATES, NATIONAL
REAL ESTATE RESEARCH CORPORATION, MIDWEST INVESTMENT CRITERIA - SUMMER 2009
WAREHOUSE
First-Tier Properties Second-Tier Properties Third-Tier Properties
PRE-TAX YIELD (IRR) (%)
RANGE
MEAN
8.0-13.0
9.7
8.8-15.0
10.5
9.0 -15.0
11.2
GOING-IN CAP RATE (%)
RANGE
MEAN
7.0-9.3
8.4
7.5-10.0
9.0
8.0-12.0
9.7
TERMINAL CAP RATE (%)
RANGE
MEAN
7.5-10.0
8.9
8.0-11.0
9.4
8.5 -13.0
10.2
39

First-Tier Properties
PRE-TAX YIELD (IRR) (%)
RANGE
MEAN
8.0-13.0
9.9
GOING-IN CAP RATE (%)
RANGE
MEAN
7.0-9.5
8.6
TERMINAL CAP RATE (%)
RANGE
MEAN
7.5 -10.0
9.1
First-Tier Properties
PRE-TAX YIELD (IRR) (%)
RANGE
MEAN
8.0-14.5
10.0
GOING-IN CAP RATE (%)
RANGE
MEAN
7.0-9.5
8.6
TERMINAL CAP RATE (%)
RANGE
MEAN
7.5-10.5
9.2
REAL ESTATE RESEARCH CORPORATION,
WAREHOUSE
GOING-IN CAP RATE (%)
TERMINAL CAP RATE (%)
R&D
GOING-IN CAP RATE (%)
TERMINAL CAP RATE (%)
FLEX SPACE
GOING-IN CAP RATE (%)
TERMINAL CAP RATE (%)
R&D
Second-Tier Properties
9.0-14.0
10.7
7.0-10.5
9.2
8.0-11.0
9.7
FLEX SPACE
Second-Tier Properties
9.0-14.0
10.6
7.0-10.5
9.3
8.0-11.0
9.8
OMAHA - SUMMER 2009
RERC ESTIMATE
9.4%
9.9%
RERC ESTIMATE
9.7%
10.2%
RERC ESTIMATE
9.7%
10.2%
MIDWEST
8.4%
8.9%
MIDWEST
8.6%
9.1%
MIDWEST
8.6%
9.2%
Third-Tier Properties
9.0-15.0
11.6
8.0-11.5
10.0
8.5-12.5
10.5
Third-Tier Properties
9.0-15.5
11.6
8.0-11.5
10.0
8.5 -12.0
10.5
U.S.
8.1%
8.8%
U.S.
8.3%
9.0%
U.S.
8.4%
9.1%
40

KORPACZ/PRICEWATERHOUSECOOPERS, LLP, 4th Quarter 2009
WAREHOUSE
KEY INDICATORS
DISCOUNT RATE (IRR)
RANGE
MEAN
CHANGE (Basis Points)
OVERALL RATE (OAR)
RANGE
MEAN
CHANGE (Basis Points)
RESIDUAL CAP RATE
RANGE
MEAN
CHANGE (Basis Points)
CURRENT QUARTER
7.50%-12.50%
9.74%
6.50%-12.00%
8.80%
6.50%-12.00%
8.73%
LAST QUARTER
7.50%-12.50%
9.35%
+39
6.50%-12.00%
8.46%
+34
6.50%-11.00%
8.53%
+20
ONE YEAR AGO
6.00%-11.00%
8.19%
+155
5.00%-9.00%
6.73%
+207
5.50%-9.50%
7.26%
+147
KORPACZ/PRICEWATERHOUSECOOPERS, LLP, 4th Quarter 2009
SR&D/FLEX SPACE
KEY INDICATORS
DISCOUNT RATE (IRR)
RANGE
MEAN
CHANGE (Basis Points)
OVERALL RATE (OAR)
RANGE
MEAN
CHANGE (Basis Points)
RESIDUAL CAP RATE
RANGE
MEAN
CHANGE (Basis Points)
CURRENT QUARTER
8.00%-13.00%
10.27%
7.50%-11.50%
9.14%
7.50%-12.50%
9.20%
LAST QUARTER
7.75%-13.00%
9.84%
+43
7.00%-11.50%
8.77%
+37
7.50%-12.50%
9.11%
+9
ONE YEAR AGO
6.75%-11.00%
8.85%
+142
5.50%-10.00%
7.76%
+138
7.00%-10.50%
8.24%
+96
41

RealtyRateS.com Investor Survey
ALL TYPES
WAREHOUSE
R&D/FLEX
4th Quarter 2009
DEBT COVERAGE RATIO
BAND OF INVESTMENT
INVESTOR SURVEY
DEBT COVERAGE RATIO
BAND OF INVESTMENT
INVESTOR SURVEY
DEBT COVERAGE RATIO
BAND OF INVESTMENT
INVESTOR SURVEY
MINIMUM
4.60%
6.24%
5.93%
4.60%
6.24%
5.93%
6.16%
7.68%
7.30%
MAXIMUM
12.80%
14.54%
13.82%
11.61%
12.61%
11.98%
12.80%
14.54%
13.82%
MEAN
8.40%
9.39%
10.27%
7.71%
8.76%
8.93%
9.54%
10.66%
10.62%
INDUSTRIAL BUILDING A type of building adapted for such uses as the assemblage, processing, and/or
manufacturing of products from raw materials or fabricated parts. Additional uses include warehousing,
distribution, and maintenance facilities. The primary purpose of the space is for storing, producing,
assembling, or distributing product. The following definitions are used to describe industrial
classifications as interpreted with this report as Class A, B, C, and D. Factors that aid in the classification
of industrial properties are location, access, site, truck court configuration, ceiling height, column
spacing, overall construction quality, and percentage and quality of office build out, among other
factors.
The following definitions are used to describe industrial classifications as interpreted with this report as
Class A, B, C, and D.
Class A Light Manufacturing Good percentage of office space and A/C interior finish. Good lighting
and plumbing to accommodate higher personnel density. Usually used as manufacturing plant or
possibly a mill. The improvement has above mean ceiling heights and design.
Class B Light Manufacturing The improvement has adequate office space and interior finish. These
types of buildings are typically located in industrial parks. Design, workmanship, and fenestration are of
good quality.
Class C Light Manufacturing The building has very little office space and interior finish. Usually no A/C
and has mean ceiling heights. The building has mean design and workmanship. A typical use would be a
cabinet shop.
42

Class D Light Manufacturing The building has no office space or interior finish. The building could be
used for light manufacturing or storage warehouse depending on quality of lighting. Design and
workmanship are below mean and height of building may limit the use of the building.
Class A Warehouse A good percentage of the building is office space. The building contains heavy roof
structures to support Craneways and good wall structures. Typically these buildings have a wall height
of 24-36 feet. The building has adequate fenestration and good exterior finish.
Class B Warehouse Distribution or storage warehouse with storage vaults and interior firewalls as well
as some exterior firewalls. Structures are primarily designed for heavy floor use. Adequate interior and
office finish.
Class C Warehouse Large open areas and some interior finish. This is typically a lighter structure than a
good classed warehouse. The building contains small office space.
Class D Warehouse The building is a structure with large open areas and little finish. No fenestration or
office space. These buildings typically have low ceiling heights. Normal use is for storage or service
garage. The building is built to minimum building code standards.
Class A Flex/Warehouse The exterior of the building will tend to look like an office building. Large area
devoted to office space. High intensity lighting, plumbing, good partitioning, and finish work.
Class B Flex/Warehouse Typical of industrial park development. The building can be divided for
multiply tenancy with adequate display, office space storage and work areas.
Class C Flex/Warehouse Plain building with little trim and few interior subdivisions and finish. These
buildings normally have adequate office reception areas with rear portions of building being warehouse
space.
Class D Flex/Warehouse Very little, front office entry and finish. The building is normally subdivided into
smaller spaces.
INDUSTRIAL MARKET
SALES Kenneth Voss & Associates, LLC examined 216 industrial sales in the Douglas County
area. One hundred-nine retail sales were used in the final analysis. Seven of these properties
were classified as Class A, twenty-nine as Class B, forty-five as Class C, and twenty-eight were
classified as Class D.
43

SUMMARY OF INDUSTRIAL SALES
Sale#
501
502
503
504
505
506
507
508
509
510
511
512
513
514
515
516
517
518
519
520
521
522
523
524
525
526
527
528
529
530
531
532
533
534
535
536
Class
A
A
A
A
A
A
A
B
B
B
B
B
B
B
B
B
B
B
B
B
B
B
B
B
B
B
B
B
B
B
B
B
B
B
B
B
Sale Date
January 2008
November 2007
July 2009
March 2006
April 2005
April 2008
March 2009
April 2005
May 2004
October 2005
March 2008
February 2008
October 2007
May 2008
June 2004
July 2006
June 2004
March 2004
June 2004
October 2006
July 2007
October 2008
April 2005
November 2008
November 2007
May 2005
April 2007
July 2005
July 2004
November 2005
June 2007
July 2008
May 2005
July 2008
February 2004
February 2004
YOC
2000
2007
2005
1991
2001
2005
2005
1986
1986
1995
1994
1999
1979
1972
2001
1970
1995
1990
1987
2000
1964
1970
1999
1992
1996
1995
1994
2002
1989
1996
1999
2004
2002
1977
2001
1991
City
Omaha
Omaha
Omaha
Omaha
Omaha
Omaha
Omaha
Omaha
Omaha
Omaha
Omaha
Omaha
Omaha
Omaha
Omaha
Omaha
Omaha
Omaha
Omaha
Omaha
Omaha
Omaha
Omaha
Omaha
Omaha
Omaha
Omaha
Omaha
Omaha
Omaha
Omaha
Omaha
Omaha
Omaha
Omaha
Omaha
$SP/PSF
$105.34
$123.10
$74.79
$94.56
$90.52
$50.31
$78.31
$34.29
$53.61
$80.83
$53.25
$80.35
$34.05
$45.54
$54.58
$25.73
$56.36
$73.48
$60.00
$56.30
$33.09
$49.01
$69.95
$46.30
$63.24
$66.67
$46.11
$38.46
$100.03
$75.10
$74.26
$48.00
$70.65
$31.58
$48.51
$46.60
Ro
6.37%
6.53%
7.04%
7.38%
7.56%
8.31%
8.87%
6.74%
6,76%
6.82%
6.84%
7.06%
7.13%
7.15%
7.22%
7.43%
7.59%
7.80%
7.83%
7.91%
7.96%
8.00%
8.12%
8.13%
8.14%
8.15%
8.24%
8.37%
8.40%
8.44%
8.45%
8.46%
8.48%
8.48%
8.72%
8.78%
Min
Max
Med
Mean
6.37%
8.87%
7.38%
7.44%
Min
Max
Med
Mean
6.74%
8.78%
8.00%
7.85%
44

Sale#
537
538
539
540
541
542
543
544
545
546
547
548
549
550
551
552
553
554
555
556
557
558
559
560
561
562
563
564
565
566
567
568
569
570
571
572
573
574
575
576
577
578
579
580
581
Class
C
C
c
c
c
c
c
c
c
c
c
c
c
c
c
c
c
c
c
c
c
c
c
c
c
c
c
c
c
c
c
c
c
c
c
c
c
c
c
c
c
c
c
c
c
Sale Date
May 2006
May 2007
April 2006
July 2004
June 2006
May 2004
January 2007
January 2006
September 2007
February 2006
February 2008
April 2006
February 2006
December 2007
December 2005
July 2005
July 2007
November 2005
June 2006
October 2006
September 2005
May 2006
April 2004
June 2007
March 2004
October 2006
June 2007
June 2005
April 2007
April 2008
January 2005
March 2006
June 2007
June 2004
February 2005
January 2005
December 2007
June 2006
February 2005
March 2006
July 2005
June 2006
April 2005
November 2005
January 2006
YOC
1968
1986
1980
1977
1979
1988
1971
1966
1973
1973
1972
1976
1985
1954
1987
1975
1996
1980
1979
1968
1990
1978
1969
1977
1967
1966
1977
1989
1996
1978
1991
1986
1952
1993
1974
1973
1994
1999
1989
1995
1978
1977
1982
1967
1989
City
Omaha
Omaha
Omaha
Omaha
Omaha
Omaha
Omaha
Omaha
Omaha
Omaha
Omaha
Omaha
Omaha
Omaha
Omaha
Omaha
Omaha
Omaha
Omaha
Omaha
Omaha
Omaha
Omaha
Omaha
Omaha
Omaha
Omaha
Omaha
Omaha
Omaha
Omaha
Omaha
Omaha
Omaha
Omaha
Omaha
Omaha
Omaha
Omaha
Omaha
Omaha
Omaha
Omaha
Omaha
Omaha
$SP/PSF
$88.38
$77.97
$49.14
$40.14
$62.82
$53.58
$83.18
$44.25
$43.15
$42.84
$55.02
$61.41
$60.00
$55.53
$63.25
$37.50
$53.82
$47.66
$75.37
$30.73
$60.36
$31.11
$41.74
$53.03
$33.05
$31.93
$48.72
$34.36
$45.17
$47.54
$13.83
$49.04
$25.33
$34.74
$39.30
$45.46
$54.74
$35.89
$51.29
$61.29
$34.92
$44.01
$31.42
$56.02
$34.51
Ro
6.32%
6.58%
6.81%
7.04%
7.17%
7.18%
7.20%
7.40%
7.87%
7.89%
7.99%
8.01%
8.08%
8.11%
8.12%
8.19%
8.28%
8.28%
8.32%
8.35%
8.37%
8.46%
8.52%
8.54%
8.67%
8.67%
8.78%
8.90%
8.99%
8.99%
8.99%
9.06%
9.06%
9.23%
9.25%
9.30%
9.37%
9.38%
9.47%
9.53%
9.58%
9.71%
9.77%
9.79%
9.98%
Min
Max
Med
Mean
6.32%
9.98%
8.52%
8.48%
45

Sale#
582
583
584
585
596
587
589
590
591
592
593
594
595
596
597
498
499
600
601
602
603
604
605
606
607
608
609
610
Class
D
D
D
D
D
D
D
D
D
D
D
D
D
D
D
D
D
D
D
D
D
D
D
D
D
D
D
D
Sale Date
July 2004
August 2007
December 2005
June 2007
July 2006
October 2005
March 2007
December 2006
February 2007
February 2006
June 2007
January 2008
October 2005
October 2004
September 2006
April 2006
February 2006
July 2004
August 2007
December 2004
August 2006
November 2004
December 2006
August 2004
October 2005
June 2007
March 2005
May 2004
YOC
1938
1956
1987
1945
1930
1961
1973
1970
1992
1928
1979
1958
1973
1963
1979
1954
1969
1977
1979
1970
1961
1979
1947
1967
1957
1977
1971
1947
City
Omaha
Omaha
Omaha
Omaha
Omaha
Omaha
Omaha
Omaha
Omaha
Omaha
Omaha
Omaha
Omaha
Omaha
Omaha
Omaha
Omaha
Omaha
Omaha
Omaha
Omaha
Omaha
Omaha
Omaha
Omaha
Omaha
Omaha
Omaha
$SP/PSF
$31.03
$55.44
$63.84
$29.57
$37.50
$27.06
$34.04
$40.78
$55.56
$24.08
$45.00
$25.76
$29.60
$42.44
$43.03
$34.77
$30.24
$34.26
$31.85
$28.01
$18.11
$25.13
$43.66
$50.60
$28.95
$24.49
$26.13
$12.34
Ro
8.45%
8.48%
8.52%
9.01%
9.02%
9.19%
9.31%
9.53%
9.56%
9.56%
9.60%
9.76%
9.95%
9.96%
9.99%
10.02%
10.15%
10.15%
10.20%
10.28%
10.57%
10.66%
10.79%
10.82%
10.96%
11.68%
12.53%
12.95%
Min
Max
Med
Mean
8.45%
12.95%
9.98%
10.06%
INDUSTRIAL OVERALL CAPITALIZATION RATES
The capitalization rates for Class A sales ranged from 6.37% to 8.87%. The median capitalization rate for
Class A sales was 7.38% while the mean was 7.44%. The capitalization rates for Class B sales ranged
from 6.74% to 8.78%. The median capitalization rate for Class B sales was 8.00% while the mean was
7.85%. The capitalization rates for Class C sales ranged from 6.32% to 9.98%. The median capitalization
rate was 8.52% and the mean was 8.48%. The capitalization rates for Class D sales ranged from 8.45% to
12.95%. The median capitalization rate was 9.98% and the mean was 10.06%. Please note that the
number of market transactions decreased in late 2008 and through 2009, the date of this report. I
decided to analyze older sales because of the data obtained during the verification process. I adjusted
the final rates based on my knowledge of the current real estate market. Below is my recommended
Overall Capitalization Rates for Industrial properties.
46

INDUSTRIAL
ALL PROPERTIES
INDUSTRIAL
CLASS A
7.50%
CAPITALIZATION
CLASSB
8.00%
RATE
CLASS C
9.00%
CLASS D
10.50%
47

ADDENDA
48

CERTIFICATION
49

CERTIFICATION
I certify that, to the best of my knowledge and belief:
• The statements of fact contained in this report are true and correct.
• The reported analyses, opinions, and conclusions are limited only by the reported
assumptions and limiting conditions, and is personal, impartial, and unbiased professional
analyses, opinions and conclusions.
• I have no present or prospective interest in the properties that are part of this report, and
no personal interest with respect to the parties involved.
• I have no bias with respect to the properties that are the subject of this report or to the
parties involved with this assignment.
• My engagement in this assignment was not contingent upon developing or reporting
predetermined results.
• My compensation for completing this assignment is not contingent upon the development
or reporting of a predetermined value or direction in value that favors the cause of the
client, the amount of value opinion, the attainment of a stipulated result, or the
concurrence of a subsequent event directly related to the intended use of this assignment.
• Kenneth Voss, MAI, SRA made a personal inspection of a sample of the properties that are
the subject of this report.
• No one provided significant real property consulting assistance to the person signing this
certification other than data extracted from various national indices.
• The reported analyses, opinions, and conclusions were developed, and this report has been
prepared, in conformity with the requirements of the Code of Professional Ethics and
Standards of Professional Appraisal Practice of the Appraisal Institute, which include the
Uniform Standards of Professional Appraisal Practice.
• The use of this report is subject to the requirements of the Appraisal Institute relating to
review by its duly authorized representatives.
• As of the date of this report, Kenneth Voss, MAI, SRA has completed the continuing
education program of the Appraisal Institute.
• There were no steps taken in performing the analysis that were either necessary or
appropriate to comply with the Competency Provision of the USPAP.
• This assignment was made subject to regulations of the State of Georgia Real Estate
Appraiser Commission. The undersigned state certified appraiser has met the requirements
of the board.
Kenneth Voss, MAI, SRA, CAE
State of Georgia Certified General Real Property Appraiser License #5763

PROFESSIONAL QUALIFICATIONS
50
Professional Qualifications
Kenneth Voss, MAI, SRA, CAE
Background
Mr. Voss attended East Carolina University, Greenville, North Carolina graduating in 1970, with a
Bachelor of Arts in Geography and History. Mr. Voss also graduated from Lindenwood College, St.
Charles, Missouri in 1984 with a Master Degree in Real Estate. He began his career as an appraiser
with the Snohomish County Assessors Office in Everett, Washington in 1970.
Real Estate Experience
Mr. Voss is the principal of the firm Kenneth Voss & Associations, LLC, specializing in real estate
valuation, real estate consulting, and arbitration with concentration in the south and southeast United
States. Prior to opening his own appraisal practice, Mr. Voss was associated with Hoffert &
Associates, Southfield, Michigan and a former Vice President with Tennenbaum & Associates, Kansas
City, Missouri. Mr. Voss is a partner in the firm, Farley, Mendola, Voss & Associates, and a Senior
Consultant in TEAMConsulting. Mr. Voss has spent over 35-years in county and state government, tax
consulting and independent appraisal work. Mr. Voss has appraised all property types, including
office, industrial facilities (manufacturing and distribution warehouses), multifamily, hospitality, land
development and recreational properties. Prior to establishing Kenneth Voss & Associates, he was
affiliated with the firm of Hoffert & Associates where he was Director of the Southeast Region from
1995 through 2000, Vice President, Valuation Services with Tenenbaum & Associates from 1989 to
1995 prior to their merger with Ernst & Young, LLP. He received his CAE designation in 1975, SRA
designation in 1978 and the MAI designation in 1991. Mr. Voss is also a Senior National Instructor for
various IAAO Courses and various seminars.
Professional Affiliations
MAI Member of the Appraisal Institute
SRA Member of the Appraisal Institute
CAE Member of the International Association of Assessing Officers
Real Estate Appraiser, Georgia and West Virginia
Affiliate Member, Certified Commercial Investment Member (CCIM)
Georgia Association of Assessing Officials (GAAO)
Marine Corps Reserve Officers Association (MCROA)
Author and Lecturer
"Highest and Best Use," National Association of Review Appraisers, 1989
Mr. Voss has served as a moderator and speaker at various Annual Conferences, Legal Seminars and
The Trail Preparation Seminars hosted by the International Association of Assessing Officers.
Education
Various real estate courses offered by the Appraisal Institute and other appraisal organizations including
Highest and Best Use Analysis, Standards of Professional Appraisal Practice, Advanced Income
Capitalization, and Advanced Applications.
Kenneth Voss & Associates, LLC

GENERAL ASSUMPTIONS AND LIMITING CONDITIONS
FOR A CONSULTING ASSIGNMENT
51
GENERAL ASSUMPTIONS AND LIMITING CONDITIONS
FOR A CONSULTING ASSIGNMENT
The following Standard Conditions apply to real estate consulting and market analysis engagements by
Kenneth Voss & Associate, LLC. Special conditions are added as required.
Report Content:
Analyses are performed and written reports are prepared in accordance with the Uniform Standards of
Professional Appraisal Practice of the Appraisal Foundation and with the Appraisal Institute's Standards
of Professional Appraisal Practice and Code of Professional Ethics.
The analysis assumes market conditions as observed as of the current date of our research stated in the
letter of transmittal. These market conditions are believed to be correct; however, the analysts assume
no liability should market conditions materially change because of unusual or unforeseen circumstances.
No opinion is rendered as to property title, which is assumed to be good and marketable. Unless
otherwise stated, no consideration is given to liens or encumbrances against the property. It is assumed
that legal, engineering, or other professional advice, as may be required, has been or will be obtained
from professional sources and that the report will not be used for guidance in legal or technical matters
such as, but not limited to, the existence of encroachments, easements or other discrepancies affecting
the legal description of the property. It is assumed that there are no concealed or dubious conditions of
the subsoil or subsurface waters including water table and flood plain, unless otherwise noted. We
further assume there are no regulations of any government entity to control or restrict the use of the
property unless specifically referred to in the report. It is assumed that the property will not operate in
violation of any applicable government regulations, codes, ordinances, or statues.
This report is not intended to be an engineering report. We are not qualified as structural or
environmental engineers; therefore, we are not qualified to judge the structural or environmental
integrity of the improvements, if any. Consequently, no warranty or representations are made nor any
liability assumed for the structural soundness, quality, adequacy or capacities of said improvements and
utility services, including the construction materials, particularly the roof, foundations, and equipment,
including the HVAC systems, if applicable. Should there be any question concerning same, it is strongly
recommended that an engineering, construction and/or environmental inspection be obtained. We will
call to your attention any apparent defects or material adverse conditions which come to our attention.
In the absence of competent technical advice to the contrary, it is assumed that the property being
analyzed is not adversely affected by concealed or unapparent hazards such as, but not limited to
asbestos, hazardous, or contaminated substances, toxic waste, or radioactivity.
Information furnished by others is presumed to be reliable, and where so specified in the report, has
been verified; but no responsibility, whether legal or otherwise, is assumed for its accuracy, and it

cannot be guaranteed as being certain. No single item of information was completely relied upon to the
exclusion of other information.
Analysis reports may contain estimated of future financial performance, estimates opinions that
represent the analyst's view of reasonable expectations at a particular point in time, but such
information, estimates or opinions are not offered as predictions or as assurances that a particular level
of income or profit will be achieved, that events will occur, or that a particular price will be offered or
accepted. Actual results achieved during the period covered by our prospective financial analyses will
vary from those described in our report, and the variations may be material.
Any proposed construction of rehabilitation referred to in the analysis is assumed to be completed
within a reasonable time and in a workmanlike manner according to or exceeding currently accepted
standards of design and methods of construction.
It should be specifically noted by any prospective mortgagee that the analysis assumes that the property
will be competently managed, leased, and maintained by financially sound owners over the expected
period of ownership. This engagement, unless otherwise noted, does not entail an evaluation of
management's or owner's effectiveness, nor are we responsible for future marketing efforts and other
management or ownership actions upon which actual results will depend.
The Americans with Disabilities Act ("ADA") became effective January 26, 1992. Kenneth Voss &
Associates, LLC has not made a specific compliance survey and analysis of this property to determine
whether or not it is in conformity with the various detailed requirements of ADA. It is possible that a
compliance survey of the property, together with a detailed analysis of the requirements of the ADA,
could reveal that the property is not in compliance with one or more of the requirements of the Act. If
so, this fact could have a negative effect upon the value of the property. Since Kenneth Voss &
Associates, LLC has no direct evidence relating to this issue, Kenneth Voss & Associates, LLC did not
consider how possible non-compliance with the requirements of ADA would impact the value of the
property being analyzed.
Use of the Report:
The analysis applies only to the property or market area described and for the purpose so stated and
should not be used for any other purpose. The report and estimates of the future financial
performances included herein, are intended for the information of the person or persons to whom they
are addressed, solely for the purposes stated herein, and should not be relied upon for any other
purpose. The addressee shall not distribute the report to third parties without prior permission from
Kenneth Voss & Associates, LLC. Before such permission shall be provided, the third party shall agree to
hold harmless relative to their use of the report. Neither our report, nor its contents, nor any reference
to the analysts or Kenneth Voss & Associates, LLC, may be included or quoted in any offering circular or
registration statement, prospectus, sales brochure, appraisal, loan or other agreement or documents
without prior written permission. Permission will be granted only upon meeting certain conditions.
Generally, Kenneth Voss & Associates, LLC will not agree to the use of its name as a "named expert"
within the meaning of the Securities Act of 1933 and the securities Act of 1934.

Neither the report nor any portions thereof (especially the identity of the analysts or Kenneth Voss &
Associates, LLC) shall be disseminated to the public through public relations media, news media,
advertising media, sales media or any other public means of communications without the prior written
consent and approval of Kenneth Voss & Associates, LLC. The date(s) to which the conclusions apply is
set forth in the letter of transmittal and within the body of the report. The financial analysis is based on
the purchasing power of the United States dollar as of that date.
Terms of the Engagement:
Assignments are accepted with the understanding that there is no obligation to furnish services after
completion of the original document. If the need for subsequent service related to a specific assignment
(e.g., testimony, updates, conferences, reprint, or copy service) is contemplated, special arrangements
acceptable to Kenneth Voss & Associates, LLC must be made in advance. The working papers for this
engagement have been retained in our files and are available for your reference.
Unless otherwise stated, no effort has been made to determine the possible effect, if any, on the subject
property of energy shortage or future federal, state or local legislation, including environmental or
ecological matters or interpretations thereof.
We take no responsibility for any events, conditions or circumstances affecting the subject property or
its value, that take place subsequent to either the effective date of the analysis cited in the report or the
date of our field inspection, whichever occurs first.