Embed Size (px)
Citation preview

0
CapitaMalls Asia Limited Asia’s Leading Mall
Developer, Owner and Manager
Singapore •China •Malaysia • Japan •India
Europe, Tokyo & North America Non-Deal Roadshows
3-18 Sep 2013
1 Europe, Tokyo & North America Non-Deal Roadshows - Sep 2013
Disclaimer This presentation may contain forward-looking statements that involve assumptions, risks and
uncertainties. Actual future performance, outcomes and results may differ materially from those expressed in forward-looking statements as a result of a number of risks, uncertainties and assumptions. Representative examples of these factors include (without limitation) general industry and economic conditions, interest rate trends, cost of capital and capital availability, competition from other developments or companies, shifts in expected levels of occupancy rate, property rental income, charge out collections, changes in operating expenses (including employee
wages, benefits and training costs), governmental and public policy changes and the continued availability of financing in the amounts and the terms necessary to support future business. You are cautioned not to place undue reliance on these forward-looking statements, which are based on the current view of management on future events. The information contained in this presentation has not been independently verified. No
representation or warranty expressed or implied is made as to, and no reliance should be placed on, the fairness, accuracy, completeness or correctness of the information or opinions contained in this presentation. Neither CapitaMalls Asia (“CMA”) or any of its affiliates, advisers or representatives shall have any liability whatsoever (in negligence or otherwise) for any loss howsoever arising, whether directly or indirectly, from any use, reliance or distribution of this presentation or its contents or otherwise arising in connection with this presentation.
The past performance of CMA is not indicative of the future performance of CMA. The value of shares in CMA (“Shares”) and the income derived from them may fall as well as rise. Shares are not obligations of, deposits in, or guaranteed by, CMA or any of its affiliates. An investment in Shares is subject to investment risks, including the possible loss of the principal
amount invested.
2 Europe, Tokyo & North America Non-Deal Roadshows - Sep 2013
Contents
Overview of CapitaMalls Asia
Our Business Model
1H 2013 Highlights
Operational Updates
Our Key Markets
Financial Performance
Valuation of Properties
Capital Management
Our Strategic Thrusts
Moving Forward
Appendix
3 Europe, Tokyo & North America Non-Deal Roadshows - Sep 2013
Plaza Singapura, Singapore
Overview of
CapitaMalls Asia
4 Europe, Tokyo & North America Non-Deal Roadshows - Sep 2013
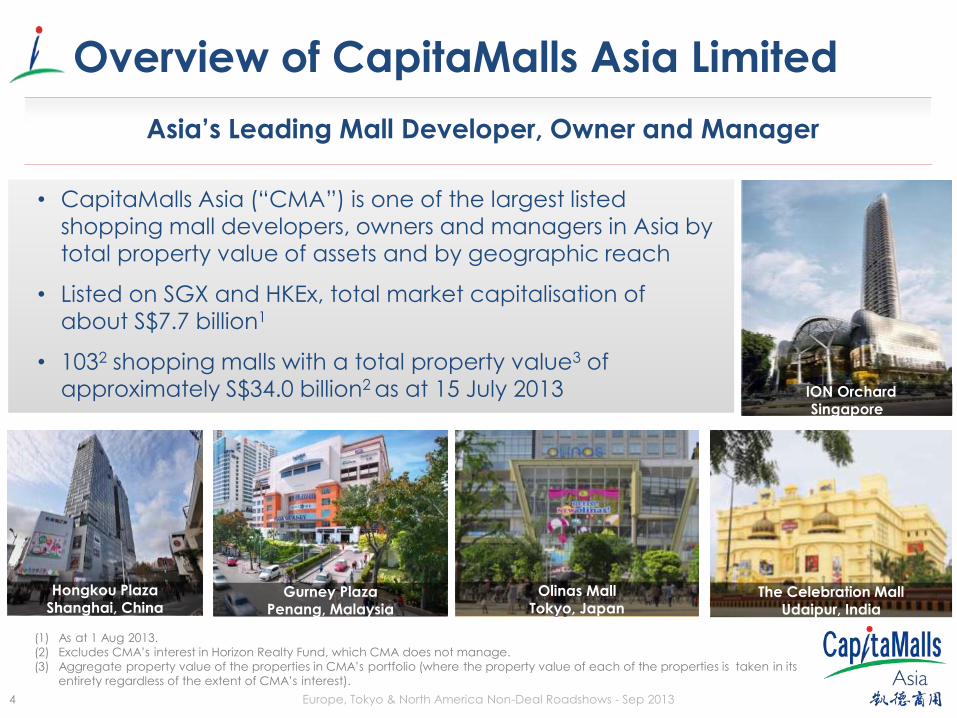
Overview of CapitaMalls Asia Limited
Asia’s Leading Mall Developer, Owner and Manager
• CapitaMalls Asia (“CMA”) is one of the largest listed
shopping mall developers, owners and managers in Asia by total property value of assets and by geographic reach
• Listed on SGX and HKEx, total market capitalisation of about S$7.7 billion1
• 1032 shopping malls with a total property value3 of approximately S$34.0 billion2 as at 15 July 2013
Gurney Plaza Penang, Malaysia
ION Orchard Singapore
Hongkou Plaza
Shanghai, China Olinas Mall
Tokyo, Japan The Celebration Mall
Udaipur, India
(1) As at 1 Aug 2013.
(2) Excludes CMA’s interest in Horizon Realty Fund, which CMA does not manage.
(3) Aggregate property value of the properties in CMA’s portfolio (where the property value of each of the properties is taken in its
entirety regardless of the extent of CMA’s interest).
5 Europe, Tokyo & North America Non-Deal Roadshows - Sep 2013
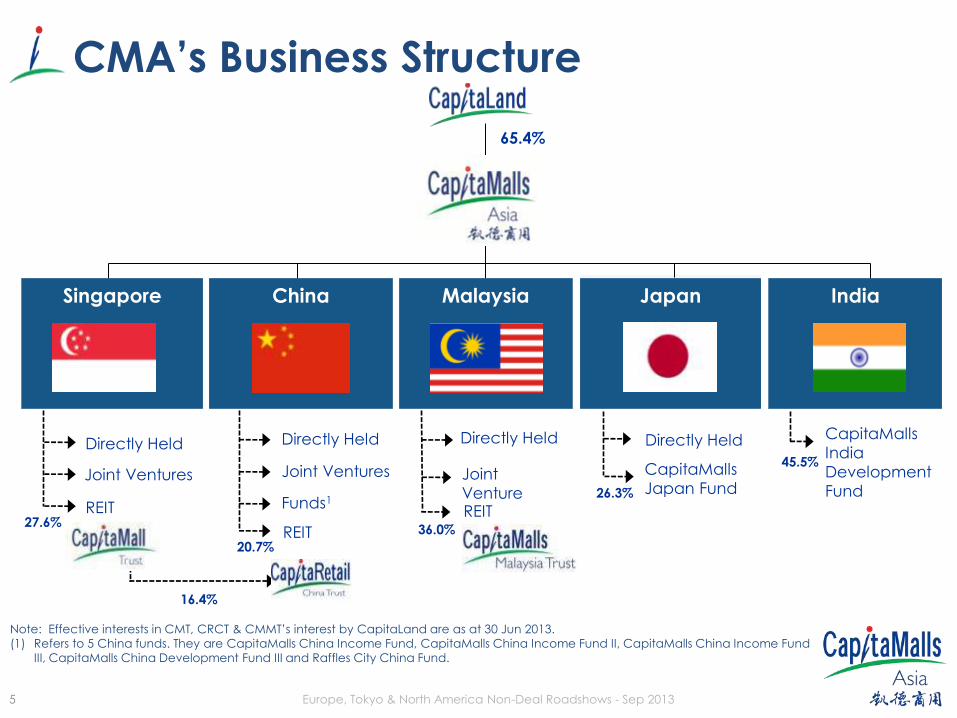
CMA’s Business Structure
Note: Effective interests in CMT, CRCT & CMMT’s interest by CapitaLand are as at 30 Jun 2013.
(1) Refers to 5 China funds. They are CapitaMalls China Income Fund, CapitaMalls China Income Fund II, CapitaMalls China Income Fund
III, CapitaMalls China Development Fund III and Raffles City China Fund.
Directly Held
Joint Ventures
REIT
Directly Held
Joint Ventures
REIT
Funds1
Directly Held
REIT
CapitaMalls
Japan Fund
CapitaMalls
India
Development
Fund
65.4%
Singapore
China
Malaysia
Japan
India
27.6%
20.7%
36.0%
16.4%
26.3%
45.5%
Directly Held
Joint
Venture
6 Europe, Tokyo & North America Non-Deal Roadshows - Sep 2013
Our Business Model
Raffles City Singapore
7 Europe, Tokyo & North America Non-Deal Roadshows - Sep 2013
Singapore
China
Malaysia
Japan
India
0%
5%
10%
15%
20%
25%
0% 5% 10% 15% 20% 25%
GDP CAGR '06 - '11
Priva
te C
on
sum
ptio
n
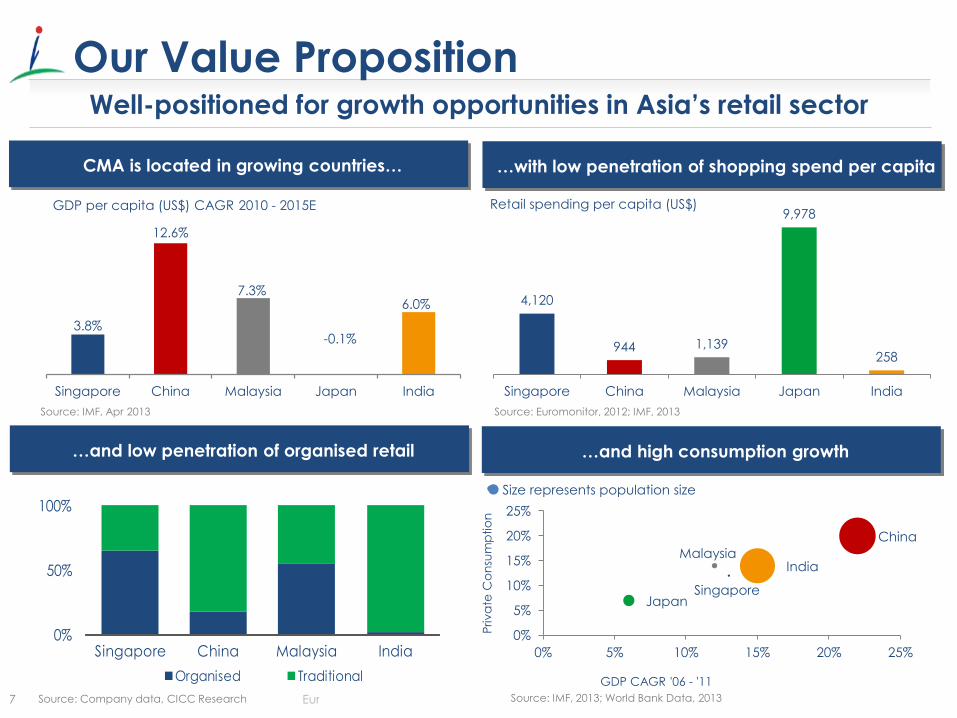
4,120
944 1,139
9,978
258
Singapore China Malaysia Japan India
Retail spending per capita (US$)
0%
50%
100%
Singapore China Malaysia India
Organised Traditional
Source: Company data, CICC Research
Source: Euromonitor, 2012; IMF, 2013
Size represents population size
3.8%
12.6%
7.3%
-0.1%
6.0%
Singapore China Malaysia Japan India
GDP per capita (US$) CAGR 2010 - 2015E
Source: IMF, Apr 2013
Well-positioned for growth opportunities in Asia’s retail sector
CMA is located in growing countries… …with low penetration of shopping spend per capita
…and low penetration of organised retail …and high consumption growth
Our Value Proposition
Source: IMF, 2013; World Bank Data, 2013 Source: IMF, 2013; World Bank Data, 2013
8 Europe, Tokyo & North America Non-Deal Roadshows - Sep 2013
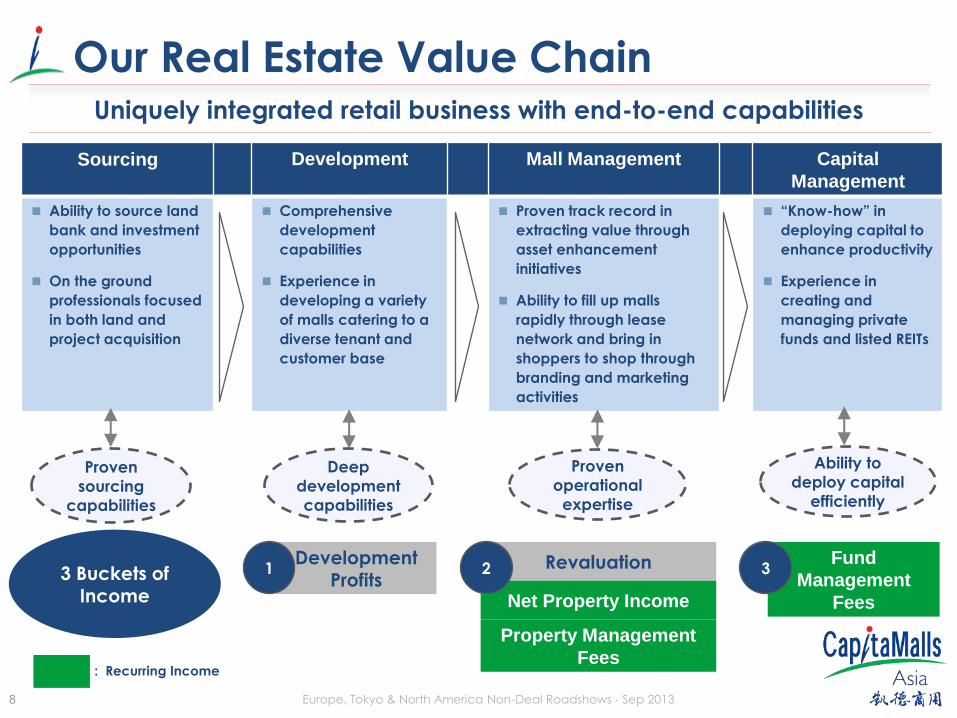
Sourcing Development Mall Management Capital
Management
Ability to source land
bank and investment
opportunities
On the ground
professionals focused
in both land and
project acquisition
Comprehensive
development
capabilities
Experience in
developing a variety
of malls catering to a
diverse tenant and
customer base
Proven track record in
extracting value through
asset enhancement
initiatives
Ability to fill up malls
rapidly through lease
network and bring in
shoppers to shop through
branding and marketing
activities
“Know-how” in
deploying capital to
enhance productivity
Experience in
creating and
managing private
funds and listed REITs
Proven
sourcing
capabilities
Deep
development
capabilities
Ability to
deploy capital
efficiently
Proven
operational
expertise
: Recurring Income
Revaluation
Net Property Income
Property Management
Fees
3 Buckets of
Income
Development Profits
Fund
Management
Fees
1 2 3
Our Real Estate Value Chain Uniquely integrated retail business with end-to-end capabilities
9 Europe, Tokyo & North America Non-Deal Roadshows - Sep 2013
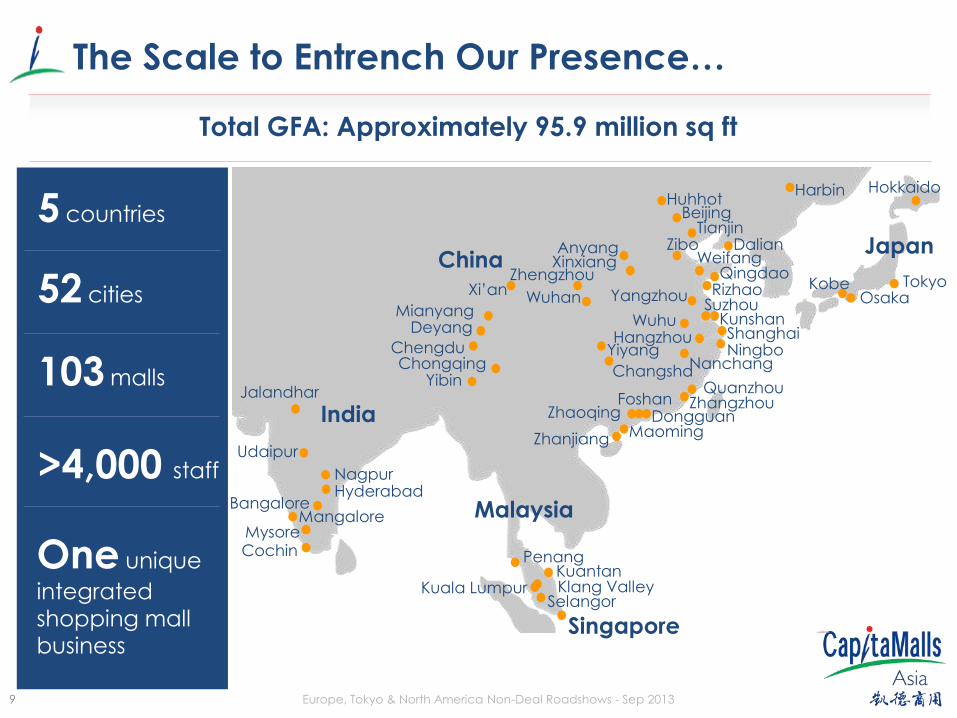
The Scale to Entrench Our Presence…
Total GFA: Approximately 95.9 million sq ft
India
Tokyo Osaka
China
Penang
Jalandhar
Udaipur
Nagpur
Mangalore Mysore Cochin
Hyderabad
Hokkaido
Kobe
Japan
Selangor Kuala Lumpur
Malaysia
Singapore
Kuantan
Bangalore
Klang Valley
Zhanjiang Maoming Dongguan
Foshan Zhaoqing
Zhangzhou Quanzhou
Ningbo Nanchang
Changsha
Yiyang Shanghai Hangzhou
Wuhu Kunshan Suzhou
Yangzhou Rizhao Qingdao
Weifang Dalian
Harbin
Tianjin Beijing
Huhhot
Zibo Anyang Xinxiang
Zhengzhou
Mianyang Deyang
Yibin Chongqing
Xi’an
Chengdu
Wuhan
5 countries
52 cities
103 malls
>4,000 staff
One unique
integrated shopping mall business

10 Europe, Tokyo & North America Non-Deal Roadshows - Sep 2013
With Leading Retail Network of >13,000 Leases…
Strong relationship with a wide profile of retailers including home-grown chains and international brands
11 Europe, Tokyo & North America Non-Deal Roadshows - Sep 2013
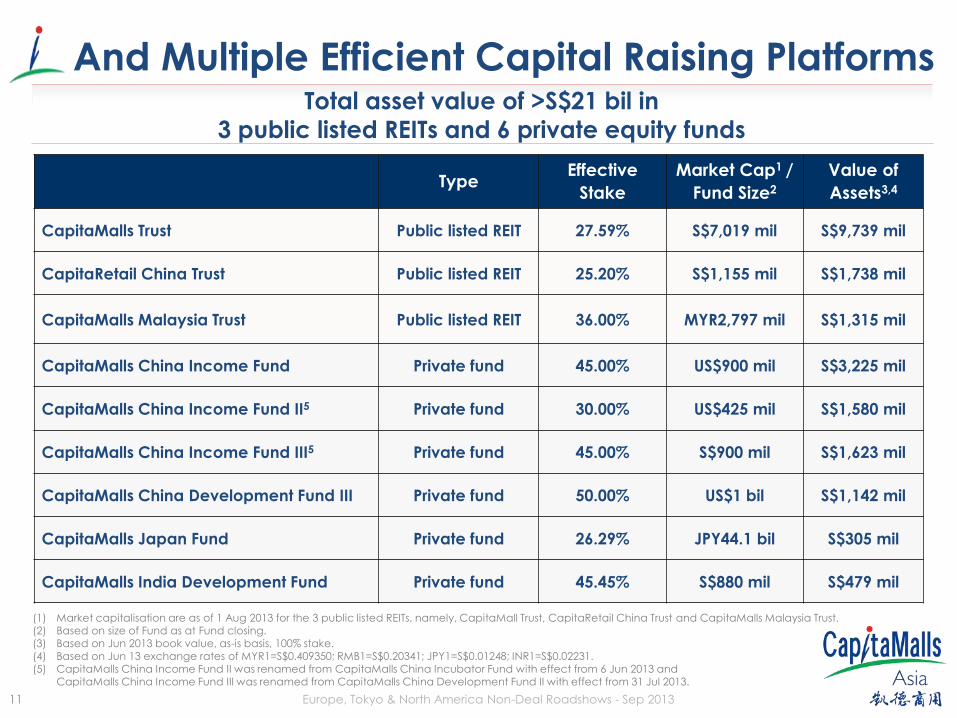
Type Effective
Stake
Market Cap1 /
Fund Size2
Value of
Assets3,4
CapitaMalls Trust Public listed REIT 27.59% S$7,019 mil S$9,739 mil
CapitaRetail China Trust Public listed REIT 25.20% S$1,155 mil S$1,738 mil
CapitaMalls Malaysia Trust Public listed REIT 36.00% MYR2,797 mil S$1,315 mil
CapitaMalls China Income Fund Private fund 45.00% US$900 mil S$3,225 mil
CapitaMalls China Income Fund II5 Private fund 30.00% US$425 mil S$1,580 mil
CapitaMalls China Income Fund III5 Private fund 45.00% S$900 mil S$1,623 mil
CapitaMalls China Development Fund III Private fund 50.00% US$1 bil S$1,142 mil
CapitaMalls Japan Fund Private fund 26.29% JPY44.1 bil S$305 mil
CapitaMalls India Development Fund Private fund 45.45% S$880 mil S$479 mil
(1) Market capitalisation are as of 1 Aug 2013 for the 3 public listed REITs, namely, CapitaMall Trust, CapitaRetail China Trust and CapitaMalls Malaysia Trust. (2) Based on size of Fund as at Fund closing. (3) Based on Jun 2013 book value, as-is basis, 100% stake. (4) Based on Jun 13 exchange rates of MYR1=S$0.409350; RMB1=S$0.20341; JPY1=S$0.01248; INR1=S$0.02231. (5) CapitaMalls China Income Fund II was renamed from CapitaMalls China Incubator Fund with effect from 6 Jun 2013 and
CapitaMalls China Income Fund III was renamed from CapitaMalls China Development Fund II with effect from 31 Jul 2013.
And Multiple Efficient Capital Raising Platforms Total asset value of >S$21 bil in
3 public listed REITs and 6 private equity funds
12 Europe, Tokyo & North America Non-Deal Roadshows - Sep 2013
The Star Vista, Singapore
1H 2013 Highlights
13 Europe, Tokyo & North America Non-Deal Roadshows - Sep 2013
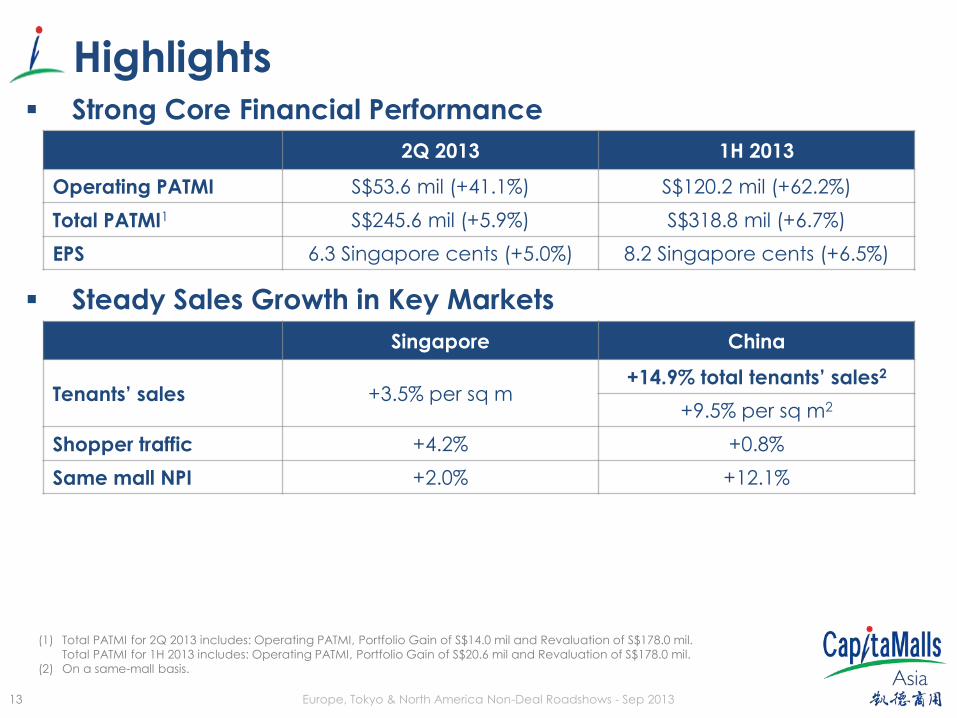
Highlights Strong Core Financial Performance
Steady Sales Growth in Key Markets
Singapore China
Tenants’ sales +3.5% per sq m +14.9% total tenants’ sales2
+9.5% per sq m2
Shopper traffic +4.2% +0.8%
Same mall NPI +2.0% +12.1%
(1) Total PATMI for 2Q 2013 includes: Operating PATMI, Portfolio Gain of S$14.0 mil and Revaluation of S$178.0 mil.
Total PATMI for 1H 2013 includes: Operating PATMI, Portfolio Gain of S$20.6 mil and Revaluation of S$178.0 mil.
(2) On a same-mall basis.
2Q 2013 1H 2013
Operating PATMI S$53.6 mil (+41.1%) S$120.2 mil (+62.2%)
Total PATMI1 S$245.6 mil (+5.9%) S$318.8 mil (+6.7%)
EPS 6.3 Singapore cents (+5.0%) 8.2 Singapore cents (+6.5%)
14 Europe, Tokyo & North America Non-Deal Roadshows - Sep 2013 Hongkou Plaza, Shanghai, China
Operational Updates
15 Europe, Tokyo & North America Non-Deal Roadshows - Sep 2013
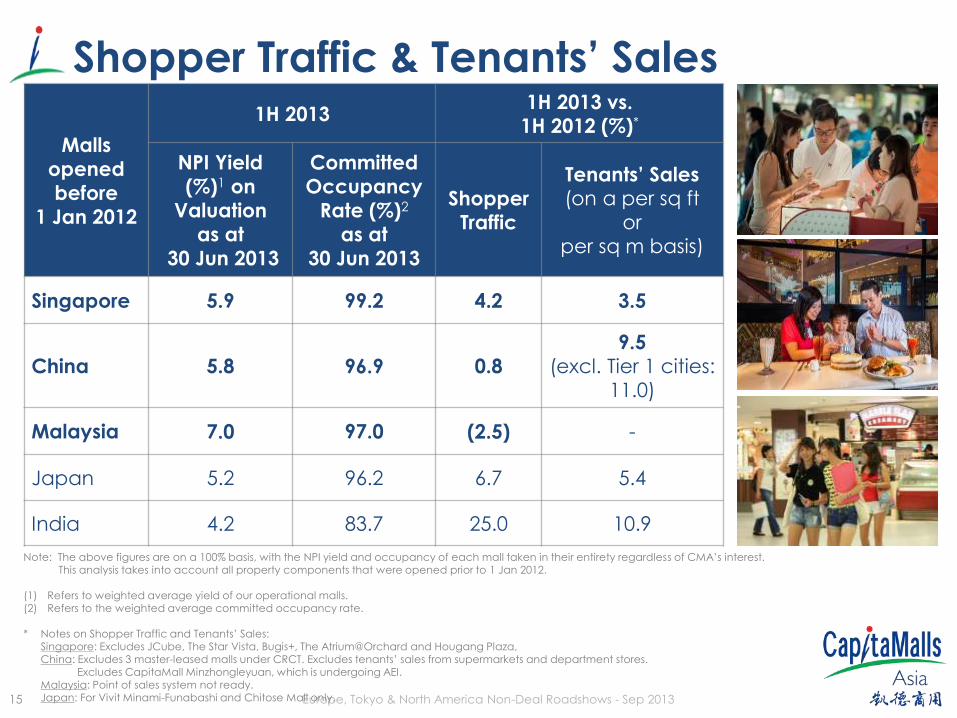
Shopper Traffic & Tenants’ Sales
Malls
opened
before
1 Jan 2012
1H 2013 1H 2013 vs.
1H 2012 (%)*
NPI Yield
(%)1 on
Valuation
as at
30 Jun 2013
Committed
Occupancy
Rate (%)2
as at
30 Jun 2013
Shopper
Traffic
Tenants’ Sales (on a per sq ft
or
per sq m basis)
Singapore 5.9 99.2 4.2 3.5
China 5.8 96.9 0.8
9.5
(excl. Tier 1 cities:
11.0)
Malaysia 7.0 97.0 (2.5) -
Japan 5.2 96.2 6.7 5.4
India 4.2 83.7 25.0 10.9
Note: The above figures are on a 100% basis, with the NPI yield and occupancy of each mall taken in their entirety regardless of CMA’s interest. This analysis takes into account all property components that were opened prior to 1 Jan 2012.
(1) Refers to weighted average yield of our operational malls. (2) Refers to the weighted average committed occupancy rate.
* Notes on Shopper Traffic and Tenants’ Sales: Singapore: Excludes JCube, The Star Vista, Bugis+, The Atrium@Orchard and Hougang Plaza, China: Excludes 3 master-leased malls under CRCT. Excludes tenants’ sales from supermarkets and department stores. Excludes CapitaMall Minzhongleyuan, which is undergoing AEI. Malaysia: Point of sales system not ready. Japan: For Vivit Minami-Funabashi and Chitose Mall only.
16 Europe, Tokyo & North America Non-Deal Roadshows - Sep 2013
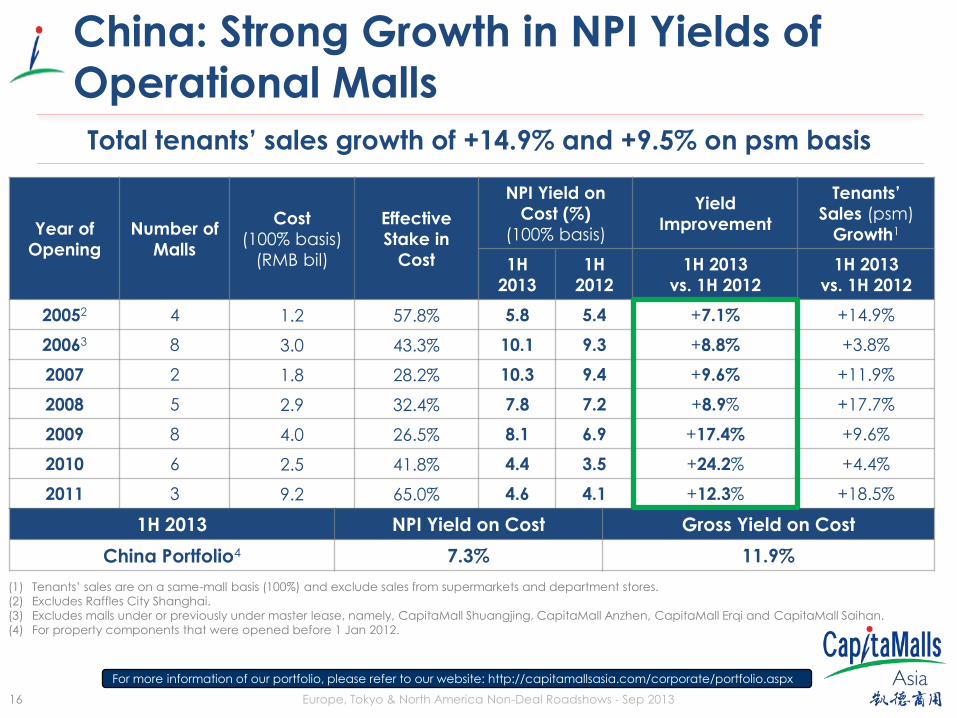
China: Strong Growth in NPI Yields of
Operational Malls
Year of
Opening
Number of
Malls
Cost
(100% basis)
(RMB bil)
Effective
Stake in
Cost
NPI Yield on
Cost (%)
(100% basis)
Yield
Improvement
Tenants’
Sales (psm)
Growth1
1H
2013
1H
2012
1H 2013
vs. 1H 2012
1H 2013
vs. 1H 2012
20052 4 1.2 57.8% 5.8 5.4 +7.1% +14.9%
20063 8 3.0 43.3% 10.1 9.3 +8.8% +3.8%
2007 2 1.8 28.2% 10.3 9.4 +9.6% +11.9%
2008 5 2.9 32.4% 7.8 7.2 +8.9% +17.7%
2009 8 4.0 26.5% 8.1 6.9 +17.4% +9.6%
2010 6 2.5 41.8% 4.4 3.5 +24.2% +4.4%
2011 3 9.2 65.0% 4.6 4.1 +12.3% +18.5%
1H 2013 NPI Yield on Cost Gross Yield on Cost
China Portfolio4 7.3% 11.9%
(1) Tenants’ sales are on a same-mall basis (100%) and exclude sales from supermarkets and department stores.
(2) Excludes Raffles City Shanghai.
(3) Excludes malls under or previously under master lease, namely, CapitaMall Shuangjing, CapitaMall Anzhen, CapitaMall Erqi and CapitaMall Saihan.
(4) For property components that were opened before 1 Jan 2012.
For more information of our portfolio, please refer to our website: http://capitamallsasia.com/corporate/portfolio.aspx
Total tenants’ sales growth of +14.9% and +9.5% on psm basis
17 Europe, Tokyo & North America Non-Deal Roadshows - Sep 2013
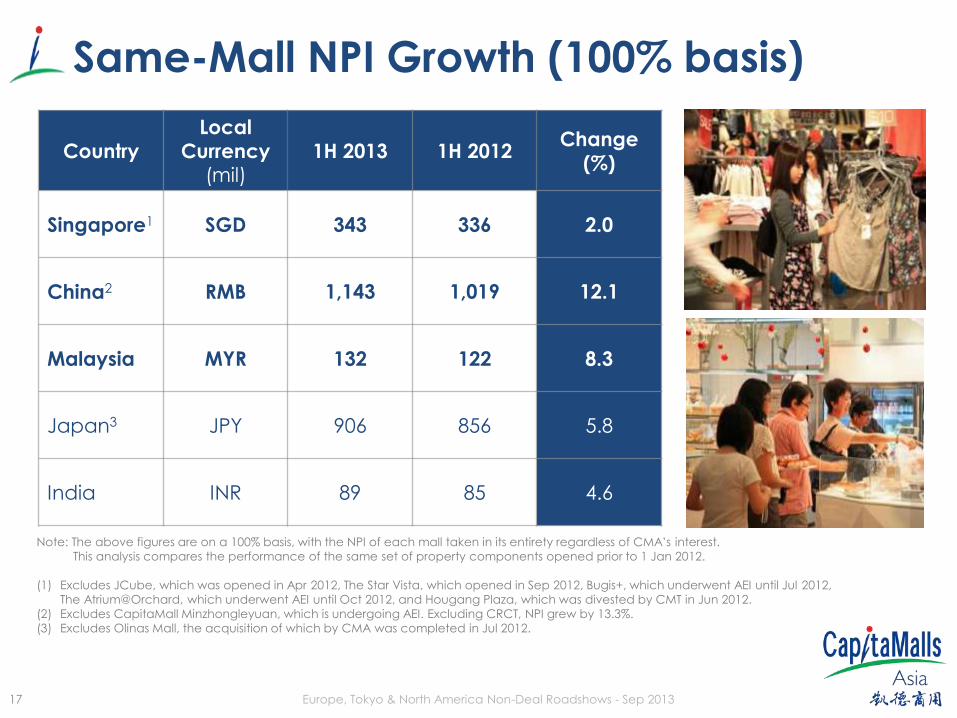
Same-Mall NPI Growth (100% basis)
Country
Local
Currency (mil)
1H 2013 1H 2012 Change
(%)
Singapore1 SGD 343 336 2.0
China2 RMB 1,143 1,019 12.1
Malaysia MYR 132 122 8.3
Japan3 JPY 906 856 5.8
India INR 89 85 4.6
Note: The above figures are on a 100% basis, with the NPI of each mall taken in its entirety regardless of CMA’s interest.
This analysis compares the performance of the same set of property components opened prior to 1 Jan 2012.
(1) Excludes JCube, which was opened in Apr 2012, The Star Vista, which opened in Sep 2012, Bugis+, which underwent AEI until Jul 2012,
The Atrium@Orchard, which underwent AEI until Oct 2012, and Hougang Plaza, which was divested by CMT in Jun 2012.
(2) Excludes CapitaMall Minzhongleyuan, which is undergoing AEI. Excluding CRCT, NPI grew by 13.3%.
(3) Excludes Olinas Mall, the acquisition of which by CMA was completed in Jul 2012.
18 Europe, Tokyo & North America Non-Deal Roadshows - Sep 2013
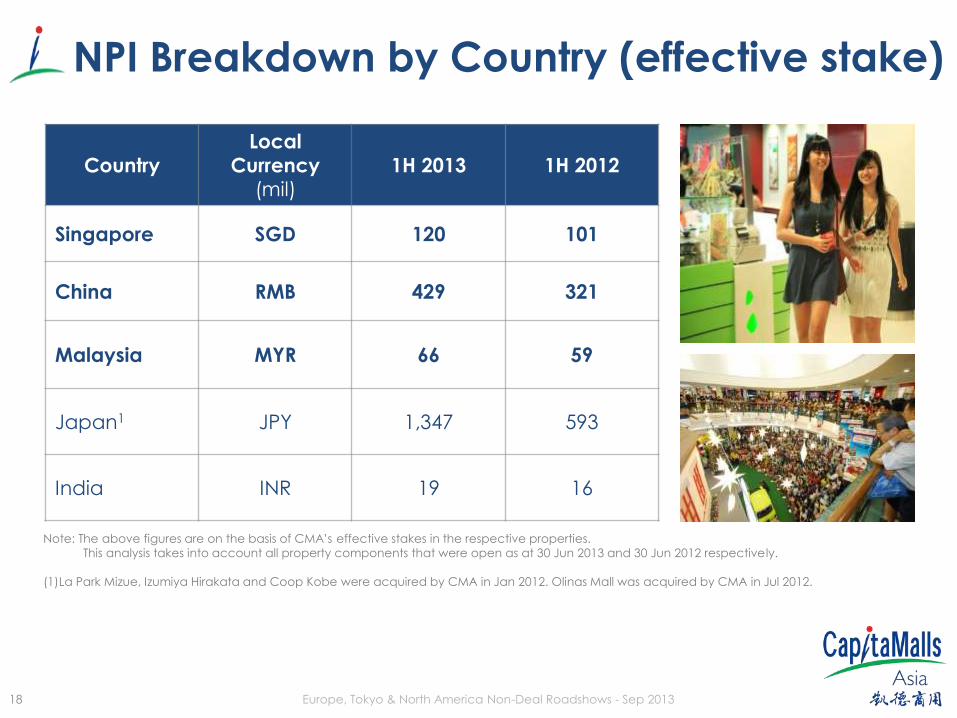
NPI Breakdown by Country (effective stake)
Country
Local
Currency (mil)
1H 2013 1H 2012
Singapore SGD 120 101
China RMB 429 321
Malaysia MYR 66 59
Japan1 JPY 1,347 593
India INR 19 16
Note: The above figures are on the basis of CMA’s effective stakes in the respective properties.
This analysis takes into account all property components that were open as at 30 Jun 2013 and 30 Jun 2012 respectively.
(1)La Park Mizue, Izumiya Hirakata and Coop Kobe were acquired by CMA in Jan 2012. Olinas Mall was acquired by CMA in Jul 2012.

19 Europe, Tokyo & North America Non-Deal Roadshows - Sep 2013
Our Key Markets
Ku
ek S
we
e S
en
g, C
ap
ita
Lan
d “
Bu
ildin
g P
eo
ple
” P
ho
tog
rap
hy C
om
pe
titio
n 2
01
2
Clarke Quay, Singapore
20 Europe, Tokyo & North America Non-Deal Roadshows - Sep 2013
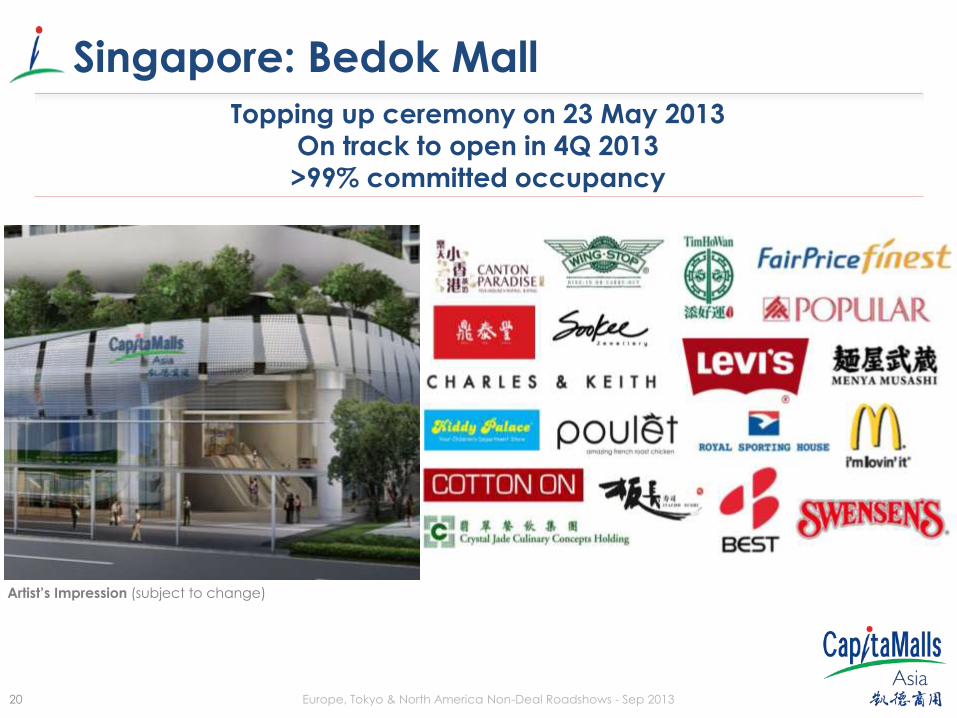
Singapore: Bedok Mall
Artist’s Impression (subject to change)
Topping up ceremony on 23 May 2013
On track to open in 4Q 2013
>99% committed occupancy
21 Europe, Tokyo & North America Non-Deal Roadshows - Sep 2013
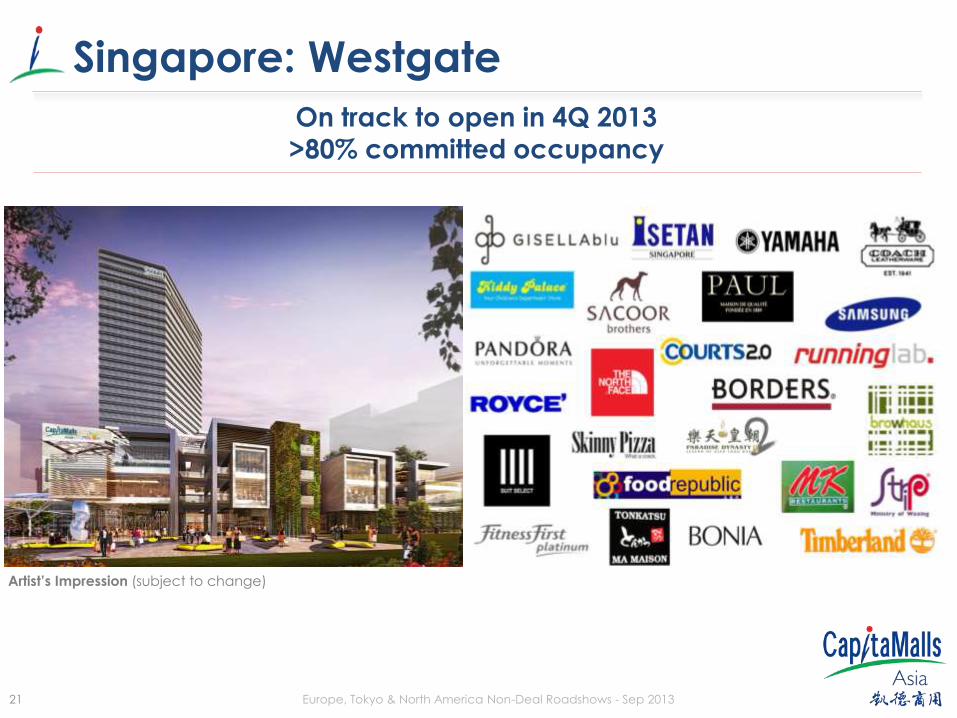
Singapore: Westgate
On track to open in 4Q 2013
>80% committed occupancy
Artist’s Impression (subject to change)
22 Europe, Tokyo & North America Non-Deal Roadshows - Sep 2013
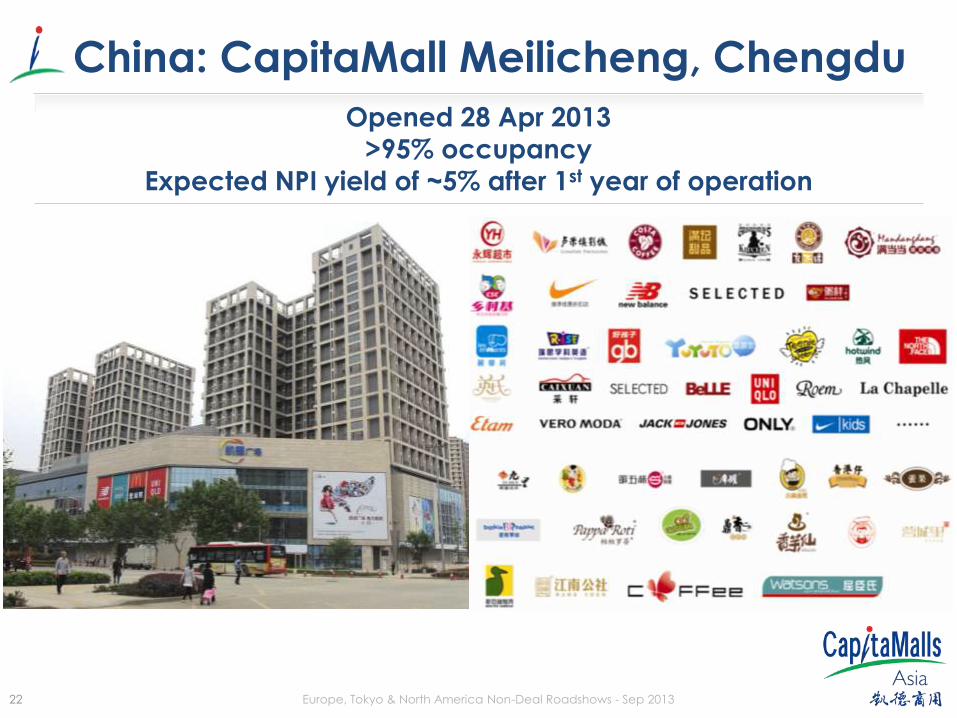
China: CapitaMall Meilicheng, Chengdu
Opened 28 Apr 2013
>95% occupancy
Expected NPI yield of ~5% after 1st year of operation
23 Europe, Tokyo & North America Non-Deal Roadshows - Sep 2013
Artist’s Impression (subject to change)
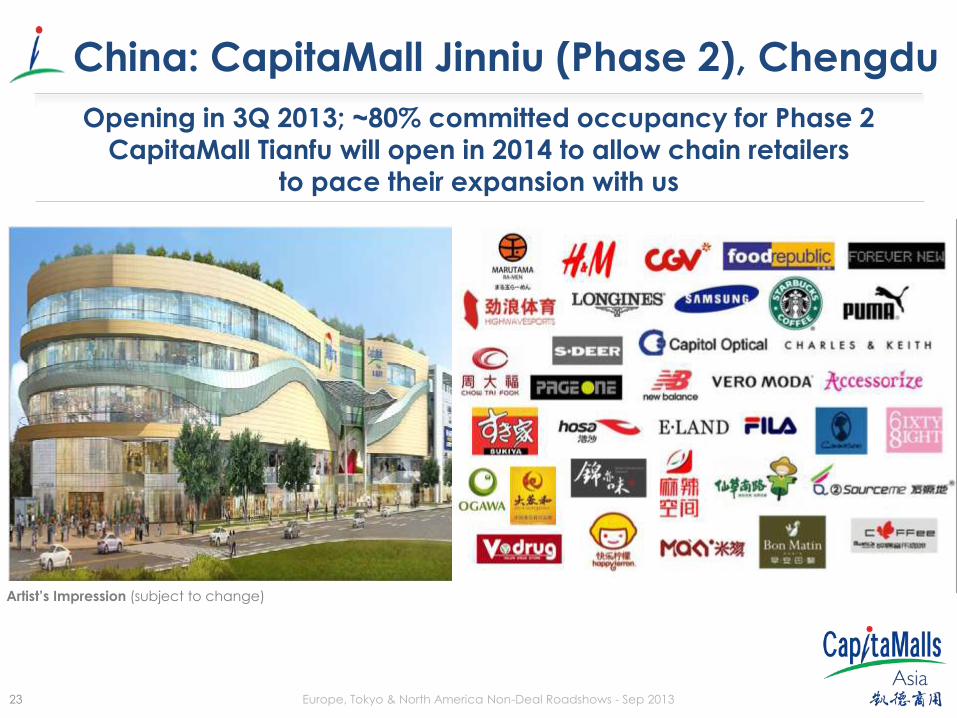
China: CapitaMall Jinniu (Phase 2), Chengdu
Opening in 3Q 2013; ~80% committed occupancy for Phase 2
CapitaMall Tianfu will open in 2014 to allow chain retailers
to pace their expansion with us
24 Europe, Tokyo & North America Non-Deal Roadshows - Sep 2013
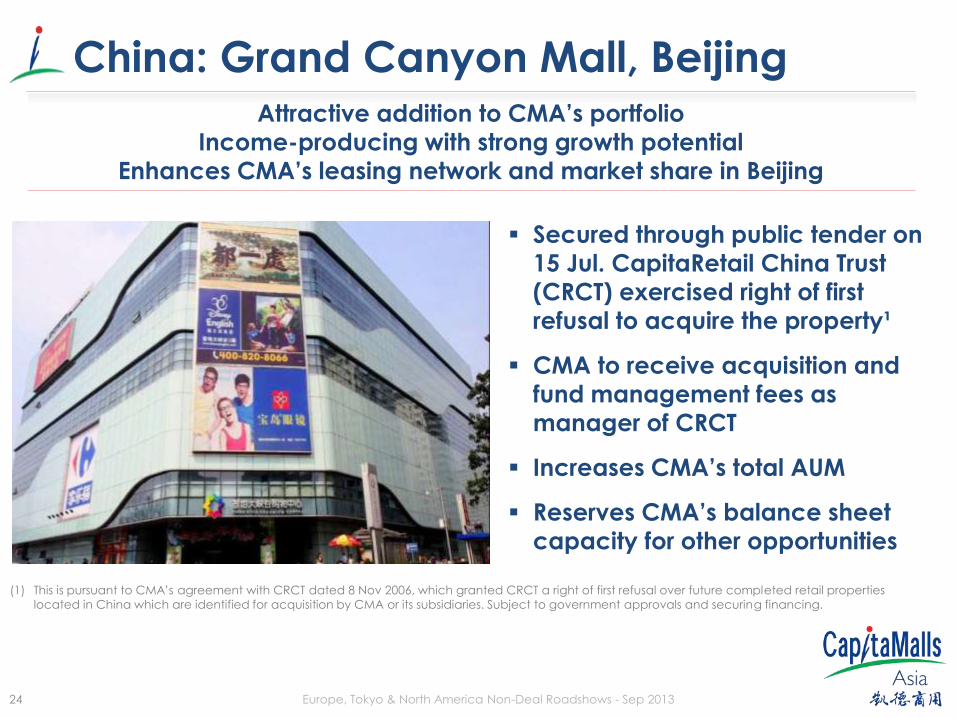
China: Grand Canyon Mall, Beijing Attractive addition to CMA’s portfolio
Income-producing with strong growth potential
Enhances CMA’s leasing network and market share in Beijing
Secured through public tender on
15 Jul. CapitaRetail China Trust
(CRCT) exercised right of first
refusal to acquire the property¹
CMA to receive acquisition and
fund management fees as
manager of CRCT
Increases CMA’s total AUM
Reserves CMA’s balance sheet
capacity for other opportunities
(1) This is pursuant to CMA’s agreement with CRCT dated 8 Nov 2006, which granted CRCT a right of first refusal over future completed retail properties
located in China which are identified for acquisition by CMA or its subsidiaries. Subject to government approvals and securing financing.
25 Europe, Tokyo & North America Non-Deal Roadshows - Sep 2013
Financial Performance
The Celebration Mall, Udaipur, India
26 Europe, Tokyo & North America Non-Deal Roadshows - Sep 2013
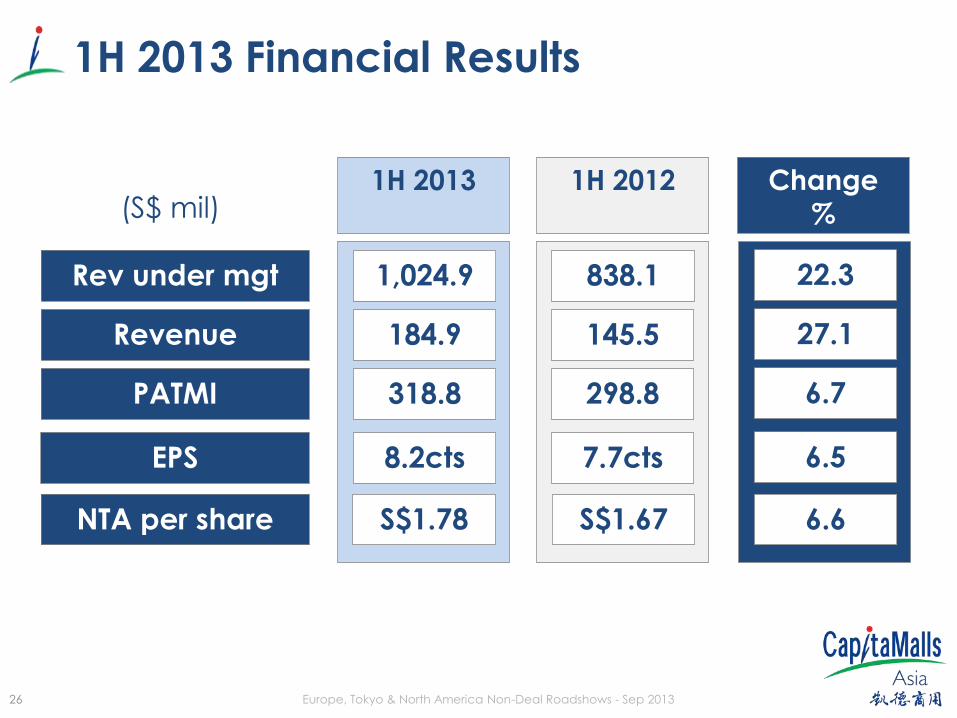
1H 2013 Financial Results
(S$ mil)
27.1
6.7
145.5
298.8
184.9
318.8 PATMI
Revenue
22.3 838.1 1,024.9 Rev under mgt
6.5 7.7cts 8.2cts
1H 2013 1H 2012
Change
%
EPS
6.6 S$1.67 S$1.78 NTA per share
27 Europe, Tokyo & North America Non-Deal Roadshows - Sep 2013
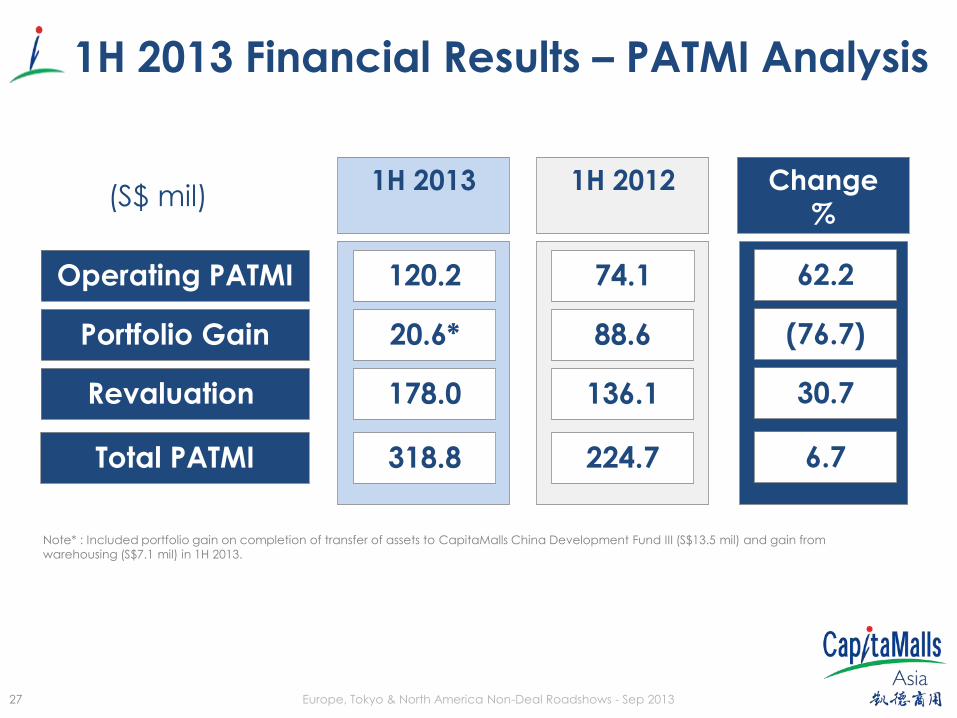
1H 2013 Financial Results – PATMI Analysis
(S$ mil)
(76.7)
30.7
88.6
136.1
20.6*
178.0 Revaluation
Portfolio Gain
62.2 74.1 120.2 Operating PATMI
6.7 224.7 318.8
1H 2013 1H 2012
Change
%
Total PATMI
Note* : Included portfolio gain on completion of transfer of assets to CapitaMalls China Development Fund III (S$13.5 mil) and gain from
warehousing (S$7.1 mil) in 1H 2013.
28 Europe, Tokyo & North America Non-Deal Roadshows - Sep 2013
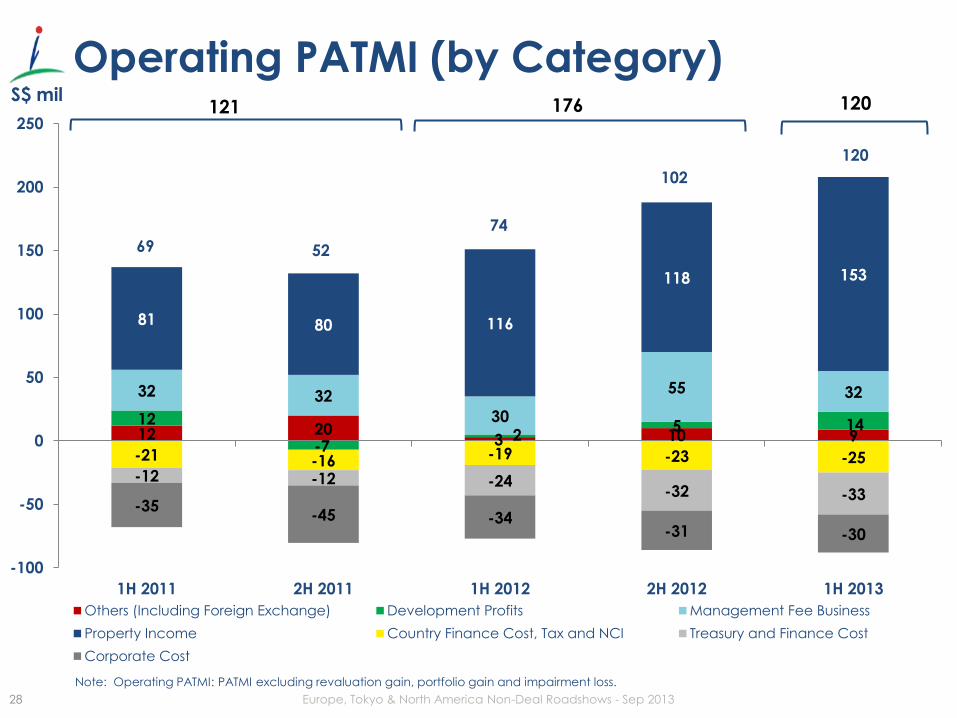
12 20 3 10 9
12
-7 2
5 14
32 32
30
55 32
81 80 116
118 153
-21 -16 -19 -23 -25 -12 -12 -24
-32 -33 -35
-45 -34 -31 -30
69 52
74
102
120
-100
-50
0
50
100
150
200
250
1H 2011 2H 2011 1H 2012 2H 2012 1H 2013
S$ mil
Others (Including Foreign Exchange) Development Profits Management Fee Business
Property Income Country Finance Cost, Tax and NCI Treasury and Finance Cost
Corporate Cost
176 121 120
Operating PATMI (by Category)
Note: Operating PATMI: PATMI excluding revaluation gain, portfolio gain and impairment loss.
29 Europe, Tokyo & North America Non-Deal Roadshows - Sep 2013 The Mines, Selangor, Malaysia
Valuation of Properties
30 Europe, Tokyo & North America Non-Deal Roadshows - Sep 2013
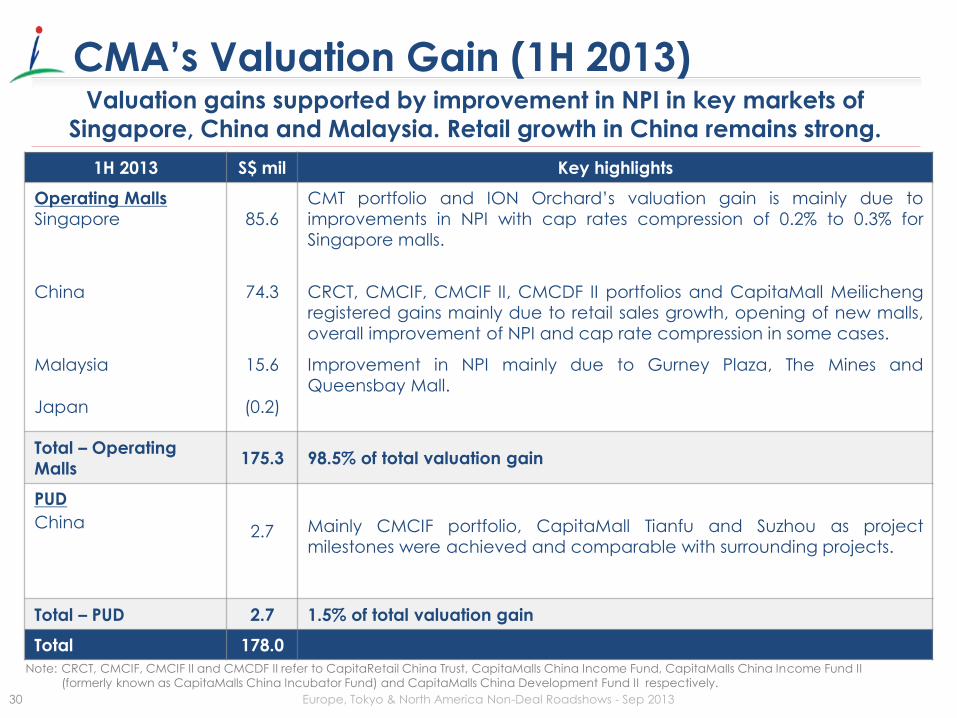
1H 2013 S$ mil Key highlights
Operating Malls
Singapore
China
Malaysia Japan
85.6
74.3
15.6
(0.2)
CMT portfolio and ION Orchard’s valuation gain is mainly due to
improvements in NPI with cap rates compression of 0.2% to 0.3% for
Singapore malls.
CRCT, CMCIF, CMCIF II, CMCDF II portfolios and CapitaMall Meilicheng
registered gains mainly due to retail sales growth, opening of new malls,
overall improvement of NPI and cap rate compression in some cases. Improvement in NPI mainly due to Gurney Plaza, The Mines and
Queensbay Mall.
Total – Operating
Malls 175.3 98.5% of total valuation gain
PUD China
2.7
Mainly CMCIF portfolio, CapitaMall Tianfu and Suzhou as project
milestones were achieved and comparable with surrounding projects.
Total – PUD 2.7 1.5% of total valuation gain
Total 178.0
CMA’s Valuation Gain (1H 2013) Valuation gains supported by improvement in NPI in key markets of
Singapore, China and Malaysia. Retail growth in China remains strong.
Note: CRCT, CMCIF, CMCIF II and CMCDF II refer to CapitaRetail China Trust, CapitaMalls China Income Fund, CapitaMalls China Income Fund II
(formerly known as CapitaMalls China Incubator Fund) and CapitaMalls China Development Fund II respectively.
31 Europe, Tokyo & North America Non-Deal Roadshows - Sep 2013
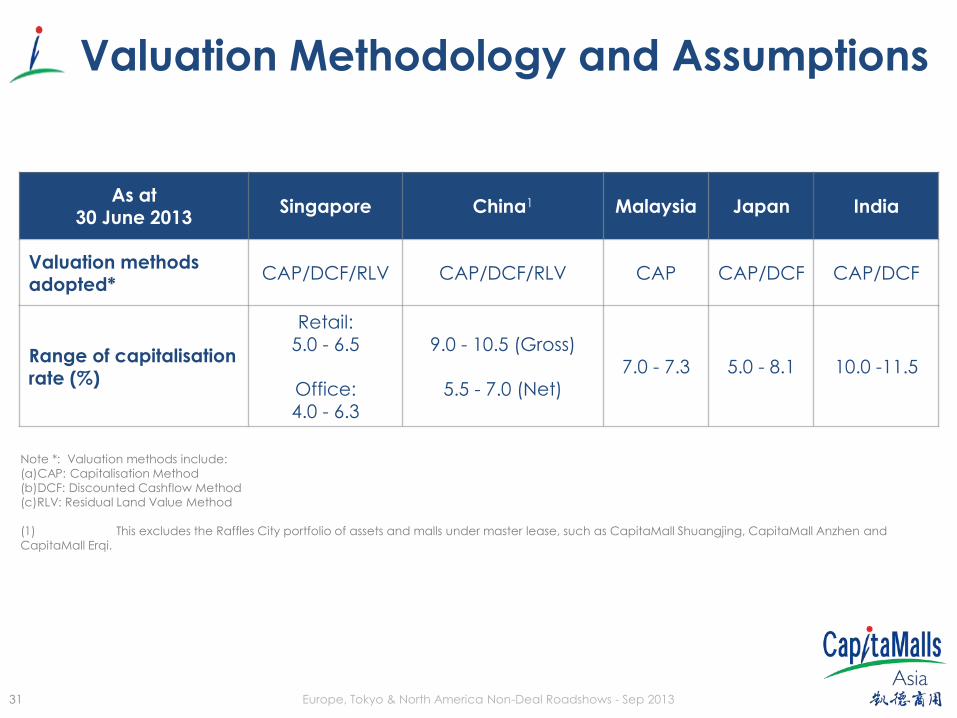
Valuation Methodology and Assumptions
As at 30 June 2013
Singapore China1 Malaysia Japan India
Valuation methods adopted*
CAP/DCF/RLV CAP/DCF/RLV CAP CAP/DCF CAP/DCF
Range of capitalisation rate (%)
Retail: 5.0 - 6.5
Office: 4.0 - 6.3
9.0 - 10.5 (Gross)
5.5 - 7.0 (Net)
7.0 - 7.3 5.0 - 8.1 10.0 -11.5
Note *: Valuation methods include:
(a)CAP: Capitalisation Method
(b)DCF: Discounted Cashflow Method
(c)RLV: Residual Land Value Method
(1) This excludes the Raffles City portfolio of assets and malls under master lease, such as CapitaMall Shuangjing, CapitaMall Anzhen and
CapitaMall Erqi.
32 Europe, Tokyo & North America Non-Deal Roadshows - Sep 2013
Capital Management
Olinas Mall, Tokyo, Japan
33 Europe, Tokyo & North America Non-Deal Roadshows - Sep 2013
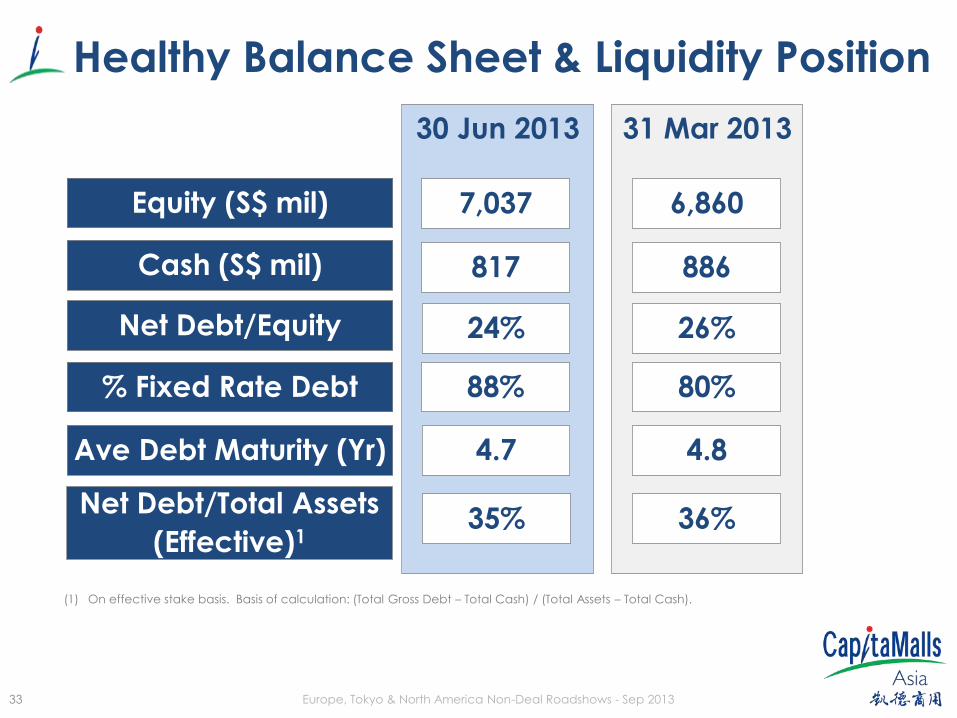
Healthy Balance Sheet & Liquidity Position
30 Jun 2013
Net Debt/Equity
% Fixed Rate Debt
Ave Debt Maturity (Yr)
Cash (S$ mil)
Equity (S$ mil)
31 Mar 2013
88%
7,037
817
24%
4.7
6,860
886
80%
26%
4.8
Net Debt/Total Assets
(Effective)1 35% 36%
(1) On effective stake basis. Basis of calculation: (Total Gross Debt – Total Cash) / (Total Assets – Total Cash).
34 Europe, Tokyo & North America Non-Deal Roadshows - Sep 2013
RB
B
B
RB MTN
UF
B
MTN
UF
B
UF
MTN
0
100
200
300
400
500
600
700
2013 2014 2015 2016 2017 2018 2019 2020 2021 2022 >2022
Bank (B) Retail Bond (RB) Medium Term Notes (MTN) Undrawn Facilities (UF)
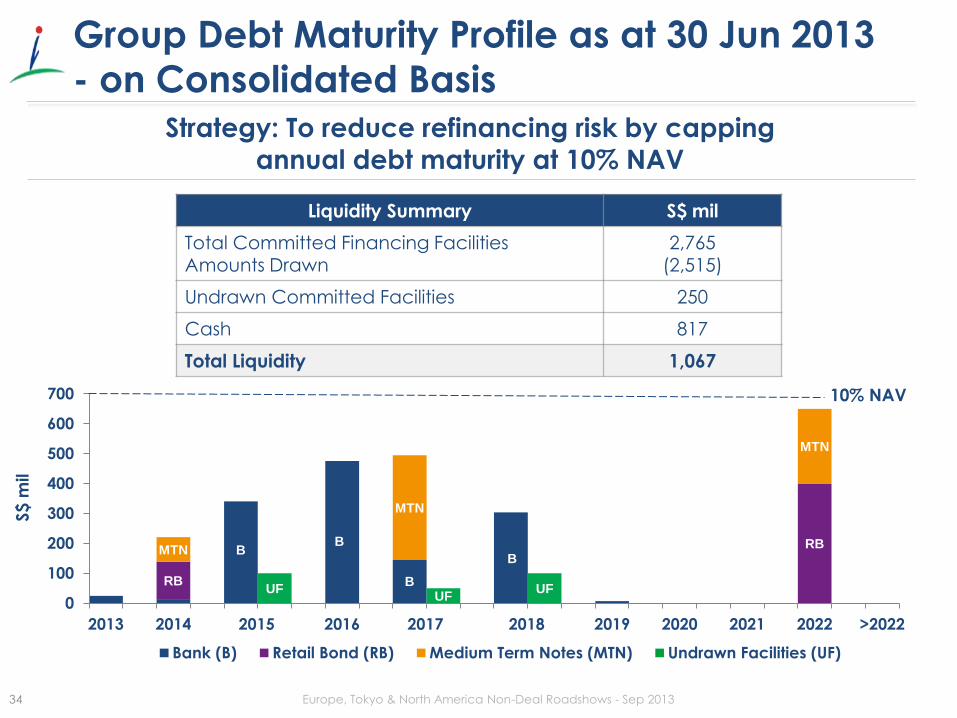
Liquidity Summary S$ mil
Total Committed Financing Facilities Amounts Drawn
2,765 (2,515)
Undrawn Committed Facilities 250
Cash 817
Total Liquidity 1,067
10% NAV
S$ m
il
Group Debt Maturity Profile as at 30 Jun 2013
- on Consolidated Basis
Strategy: To reduce refinancing risk by capping
annual debt maturity at 10% NAV
35 Europe, Tokyo & North America Non-Deal Roadshows - Sep 2013
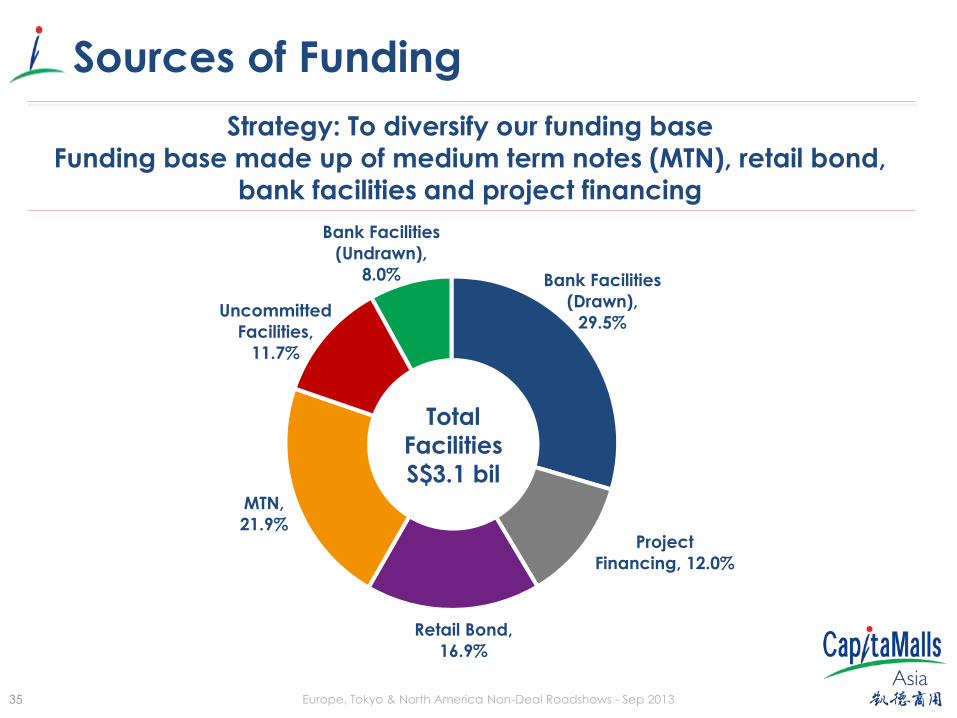
Bank Facilities
(Drawn),
29.5%
Project
Financing, 12.0%
Retail Bond,
16.9%
MTN,
21.9%
Uncommitted
Facilities,
11.7%
Bank Facilities
(Undrawn),
8.0%
Total
Facilities
S$3.1 bil
Sources of Funding
Strategy: To diversify our funding base Funding base made up of medium term notes (MTN), retail bond,
bank facilities and project financing
36 Europe, Tokyo & North America Non-Deal Roadshows - Sep 2013
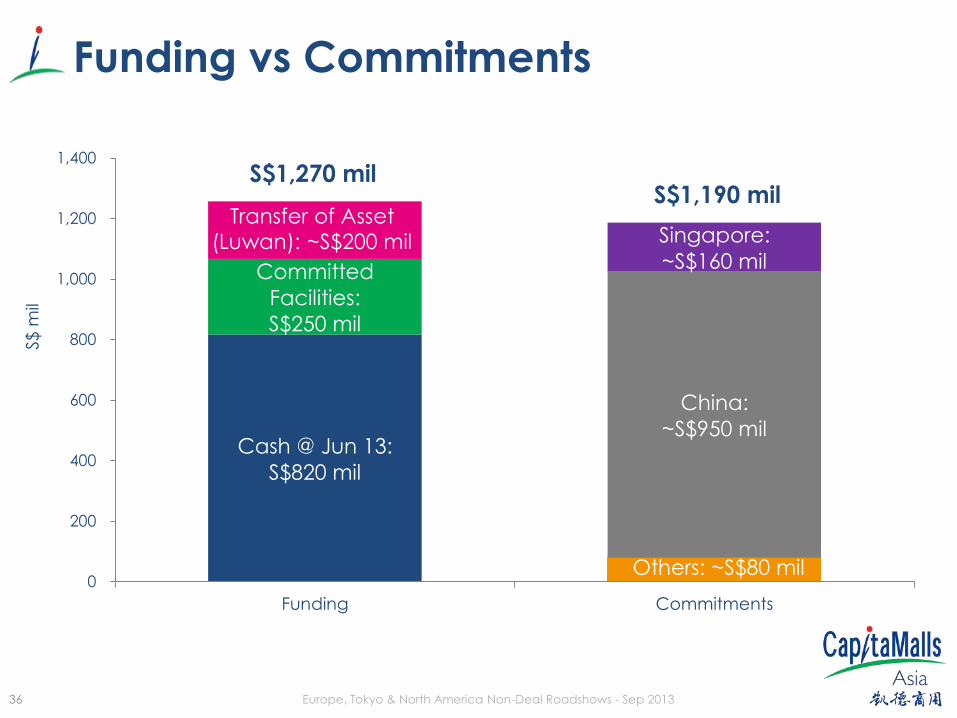
Funding vs Commitments S$
mil
Transfer of Asset
(Luwan): S$190 mil
Cash @ Jun 13:
S$820 mil
Committed
Facilities:
S$250 mil
China:
~S$950 mil
Singapore:
~S$160 mil
S$1,270 mil S$1,190 mil
0
200
400
600
800
1,000
1,200
1,400
Funding Commitments
Others: ~S$80 mil
Transfer of Asset
(Luwan): ~S$200 mil
37 Europe, Tokyo & North America Non-Deal Roadshows - Sep 2013
Our Strategic Thrusts
Hongkou Plaza, Shanghai, China
38
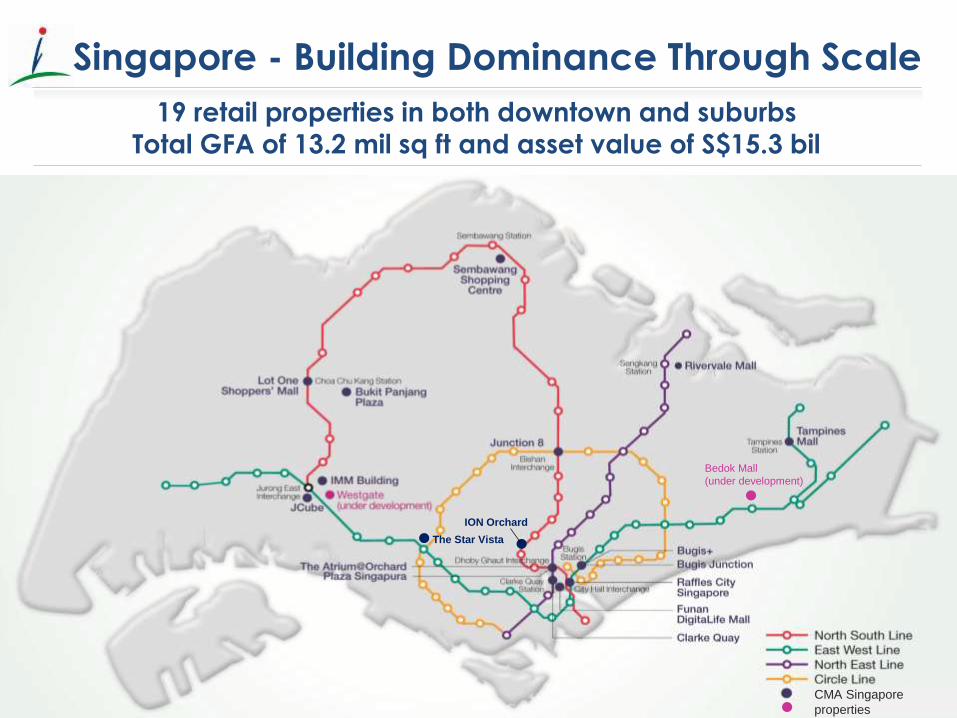
Singapore - Building Dominance Through Scale
38
The Star Vista
ION Orchard
Bedok Mall
(under development)
19 retail properties in both downtown and suburbs Total GFA of 13.2 mil sq ft and asset value of S$15.3 bil
CMA Singapore
properties
39 Europe, Tokyo & North America Non-Deal Roadshows - Sep 2013
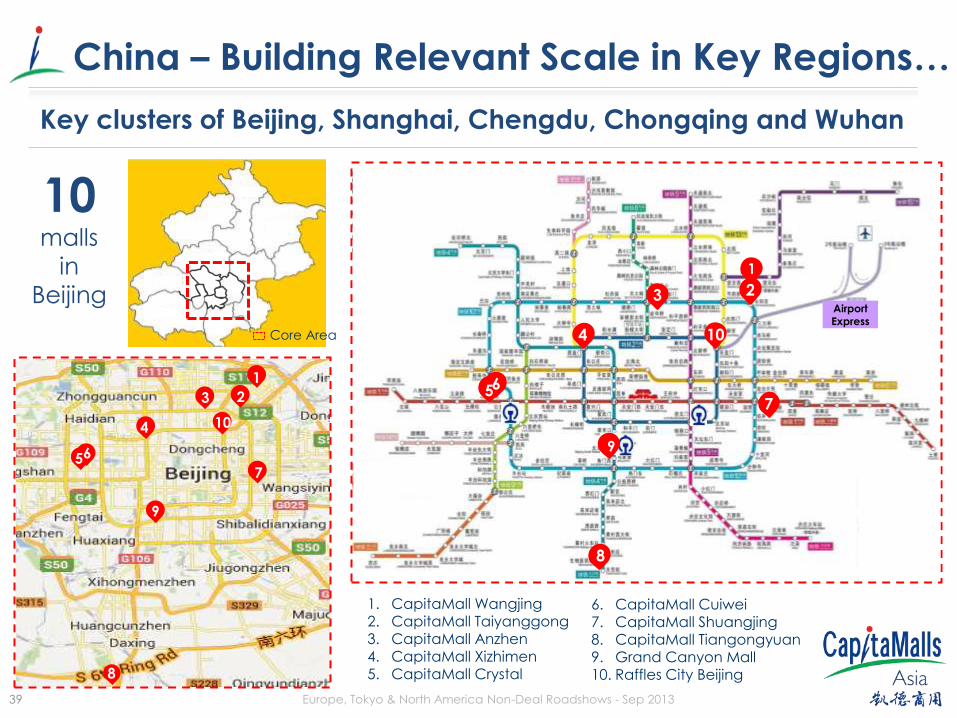
China – Building Relevant Scale in Key Regions…
Key clusters of Beijing, Shanghai, Chengdu, Chongqing and Wuhan
2 3
10 4
8
1
7
6
Airport Express
5
1. CapitaMall Wangjing 2. CapitaMall Taiyanggong 3. CapitaMall Anzhen
4. CapitaMall Xizhimen 5. CapitaMall Crystal
6. CapitaMall Cuiwei
7. CapitaMall Shuangjing 8. CapitaMall Tiangongyuan 9. Grand Canyon Mall 10. Raffles City Beijing
1
2 3
10
7
4
8
6
9
5
10
malls
in
Beijing
Core Area
9
40 Europe, Tokyo & North America Non-Deal Roadshows - Sep 2013
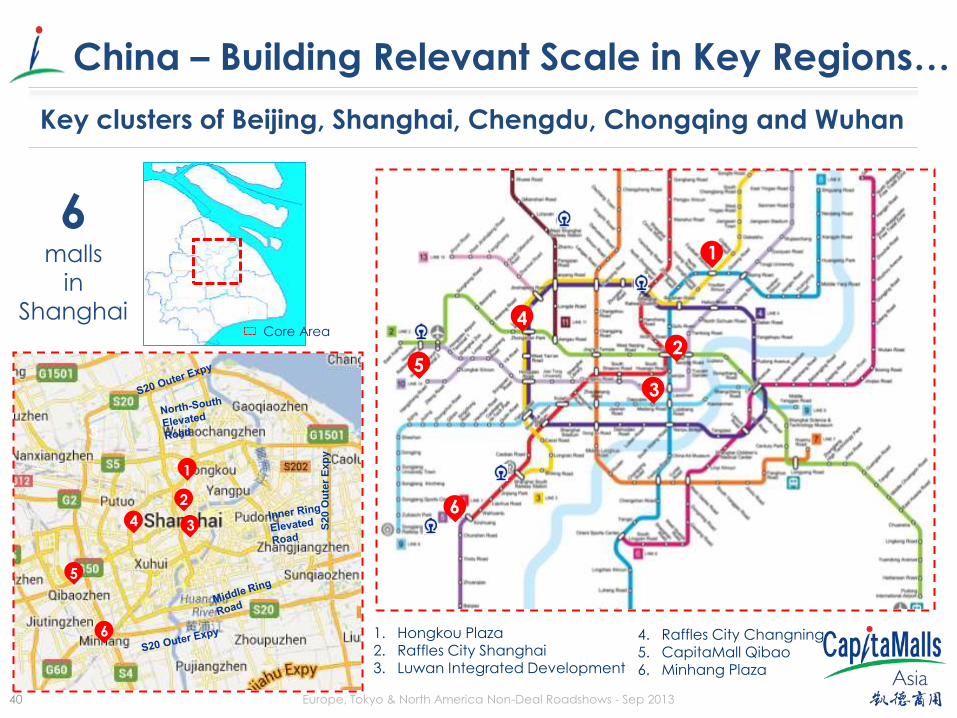
China – Building Relevant Scale in Key Regions…
Key clusters of Beijing, Shanghai, Chengdu, Chongqing and Wuhan
6
malls
in
Shanghai
3
5
6
S20 O
ute
r E
xp
y
1
3
2
4 6
5
1
4
2
3
1. Hongkou Plaza 2. Raffles City Shanghai 3. Luwan Integrated Development
4. Raffles City Changning
5. CapitaMall Qibao 6. Minhang Plaza
Core Area
41 Europe, Tokyo & North America Non-Deal Roadshows - Sep 2013
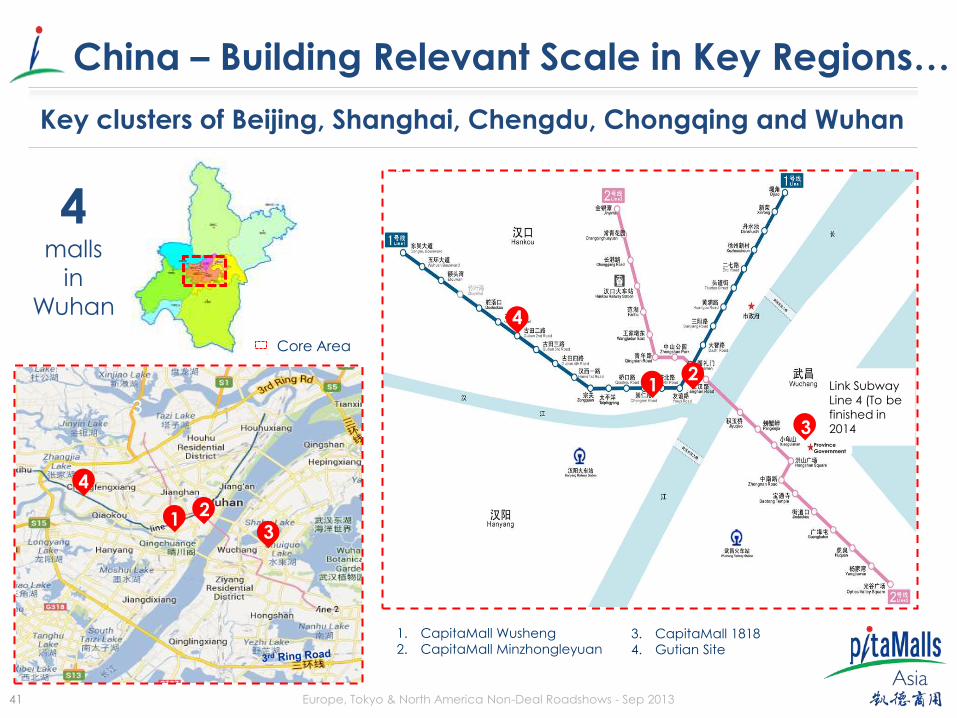
China – Building Relevant Scale in Key Regions…
Key clusters of Beijing, Shanghai, Chengdu, Chongqing and Wuhan
4
malls
in
Wuhan
1 2
3
3
4
1
4
2
3
1. CapitaMall Wusheng
2. CapitaMall Minzhongleyuan 3. CapitaMall 1818
4. Gutian Site
Core Area
Link Subway
Line 4 (To be
finished in
2014 Province
Government
42 Europe, Tokyo & North America Non-Deal Roadshows - Sep 2013
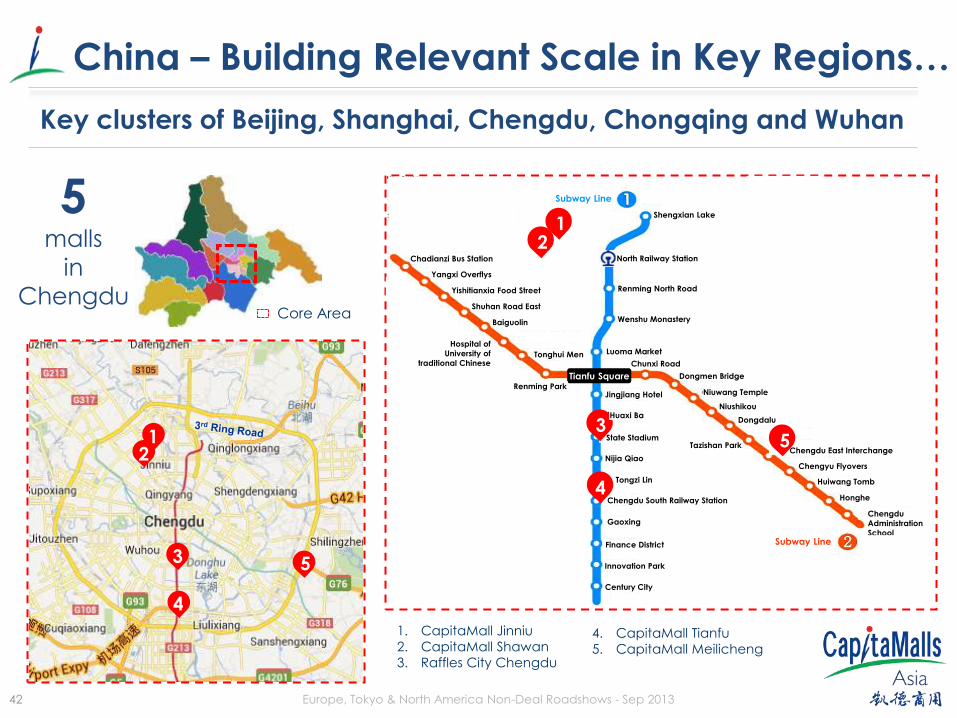
China – Building Relevant Scale in Key Regions…
Key clusters of Beijing, Shanghai, Chengdu, Chongqing and Wuhan
5
malls
in
Chengdu
Core Area
3
4
2
5
1 2
Core Area
1. CapitaMall Jinniu
2. CapitaMall Shawan
3. Raffles City Chengdu
4. CapitaMall Tianfu
5. CapitaMall Meilicheng
State Stadium 3
Chengdu South Railway Station
Chengdu East Interchange
Tianfu Square
Huaxi Ba
Jingjiang Hotel
Nijia Qiao
Tongzi Lin
4
Gaoxing
Finance District
Innovation Park
Century City
Chunxi Road
Dongmen Bridge
Niuwang Temple
Niushikou
Dongdalu
Tazishan Park 5 Chengyu Flyovers
Huiwang Tomb
Honghe
Chengdu
Administration
School
Luoma Market
Wenshu Monastery
Renming North Road
North Railway Station
Shengxian Lake
Chadianzi Bus Station
Yangxi Overflys
Yishitianxia Food Street
Shuhan Road East
Baiguolin
Hospital of
University of
traditional Chinese Tonghui Men
Renming Park
Subway Line
Subway Line
1
43 Europe, Tokyo & North America Non-Deal Roadshows - Sep 2013
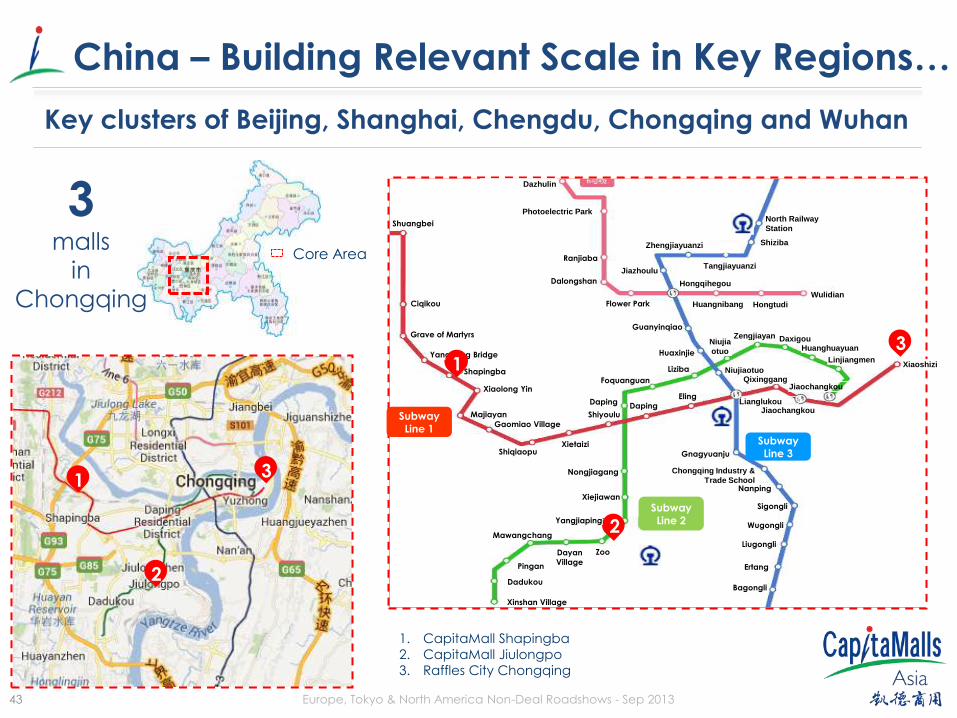
China – Building Relevant Scale in Key Regions…
Key clusters of Beijing, Shanghai, Chengdu, Chongqing and Wuhan
3 1
2
3 1
2
Core Area
3
malls
in
Chongqing
1. CapitaMall Shapingba
2. CapitaMall Jiulongpo
3. Raffles City Chongqing
Shuangbei
Ciqikou
Grave of Martyrs
Shapingba
Yanggong Bridge
Xiaolong Yin
Majiayan
Shiqiaopu
Gaomiao Village
Xietaizi
Nongjiagang
Xiejiawan
Yangjiaping
Subway Line 2
Zoo Dayan
Village
Mawangchang
Pingan
Dadukou
Xinshan Village
Bagongli
Ertang
Liugongli
Wugongli
Sigongli
Nanping
Chongqing Industry &
Trade School
Gnagyuanju
Shiyoulu
Daping Daping
Foquanguan
Eling
Liziba
Huaxinjie
Guanyinqiao
Flower Park
Dalongshan
Ranjiaba
Photoelectric Park
Dazhulin
Jiazhoulu
Zhengjiayuanzi
Tangjiayuanzi
Hongqihegou
Huangnibang Hongtudi
Wulidian
Shiziba
North Railway
Station
Niujia
otuo
Niujiaotuo
Zengjiayan Daxigou Huanghuayuan
Linjiangmen Xiaoshizi
Qixinggang
Jiaochangkou
Jiaochangkou
Lianglukou
Subway Line 3
Subway Line 1
1
44 Europe, Tokyo & North America Non-Deal Roadshows - Sep 2013
Moving Forward
JCube, Singapore
45 Europe, Tokyo & North America Non-Deal Roadshows - Sep 2013
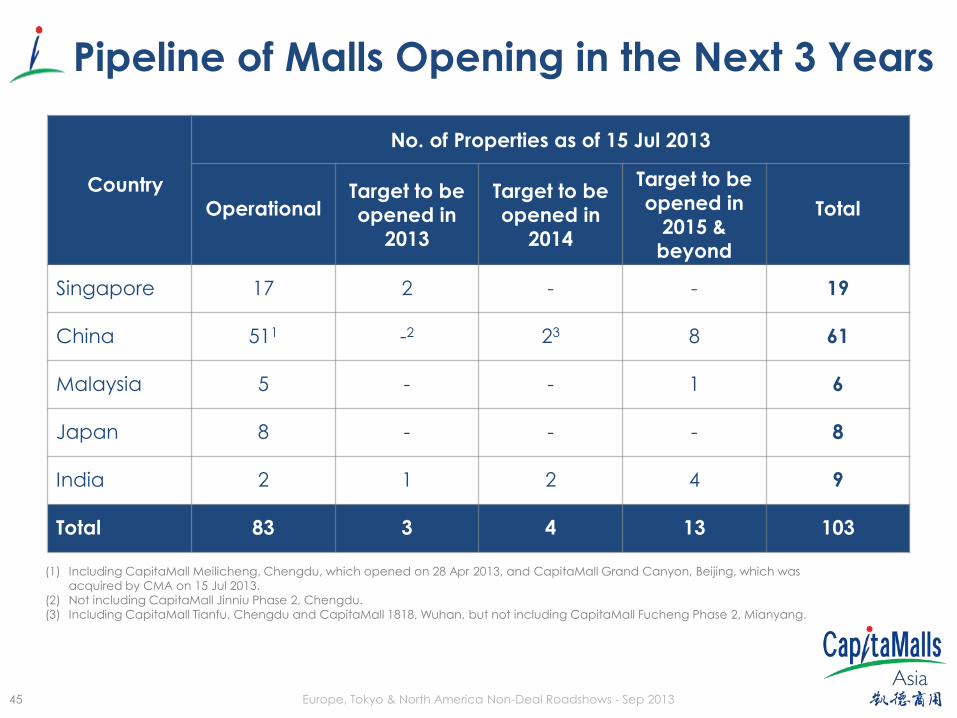
Pipeline of Malls Opening in the Next 3 Years
Country
No. of Properties as of 15 Jul 2013
Operational Target to be
opened in
2013
Target to be
opened in
2014
Target to be
opened in
2015 &
beyond
Total
Singapore 17 2 - - 19
China 511 -2 23 8 61
Malaysia 5 - - 1 6
Japan 8 - - - 8
India 2 1 2 4 9
Total 83 3 4 13 103
(1) Including CapitaMall Meilicheng, Chengdu, which opened on 28 Apr 2013, and CapitaMall Grand Canyon, Beijing, which was
acquired by CMA on 15 Jul 2013.
(2) Not including CapitaMall Jinniu Phase 2, Chengdu.
(3) Including CapitaMall Tianfu, Chengdu and CapitaMall 1818, Wuhan, but not including CapitaMall Fucheng Phase 2, Mianyang.
46 Europe, Tokyo & North America Non-Deal Roadshows - Sep 2013
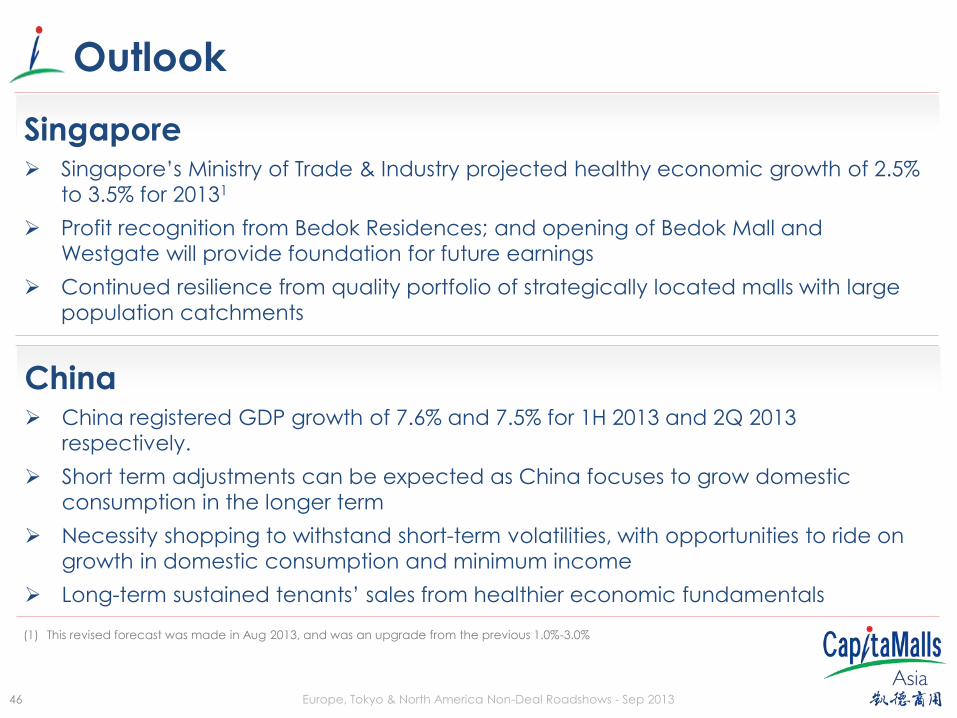
Outlook
Singapore Singapore’s Ministry of Trade & Industry projected healthy economic growth of 2.5%
to 3.5% for 20131
Profit recognition from Bedok Residences; and opening of Bedok Mall and
Westgate will provide foundation for future earnings
Continued resilience from quality portfolio of strategically located malls with large
population catchments
China China registered GDP growth of 7.6% and 7.5% for 1H 2013 and 2Q 2013
respectively.
Short term adjustments can be expected as China focuses to grow domestic
consumption in the longer term
Necessity shopping to withstand short-term volatilities, with opportunities to ride on
growth in domestic consumption and minimum income
Long-term sustained tenants’ sales from healthier economic fundamentals
(1) This revised forecast was made in Aug 2013, and was an upgrade from the previous 1.0%-3.0%

47
Thank You
Thank You
For enquiries from analysts & investors,
please contact
For enquiries from Hong Kong/China analysts,
please contact:
Teng Li Yeng
Investor Relations
Tel: (65) 6826 5357
Email: [email protected]
Maggie Huang
Investor Relations
Tel: (86) 10-5879 9018
Email: [email protected]
48 Europe, Tokyo & North America Non-Deal Roadshows - Sep 2013
Financial Results of CMT, CRCT & CMMT
● 2Q 2013 financial results
– 19 July 2013
● http://capitamall.listedc
ompany.com/financial_r
esults.html
• 2Q 2013 financial results
– 18 July 2013
• http://www.capitaretail
china.com/ir_financial_r
esult.html
• 2Q 2013 financial results
– 19 July 2013
• http://capitamallsmalay
sia.com/financials.html
49 Europe, Tokyo & North America Non-Deal Roadshows - Sep 2013
Appendix
Nanjing Impressions,
CapitaMall Crystal, Beijing, China
50 Europe, Tokyo & North America Non-Deal Roadshows - Sep 2013
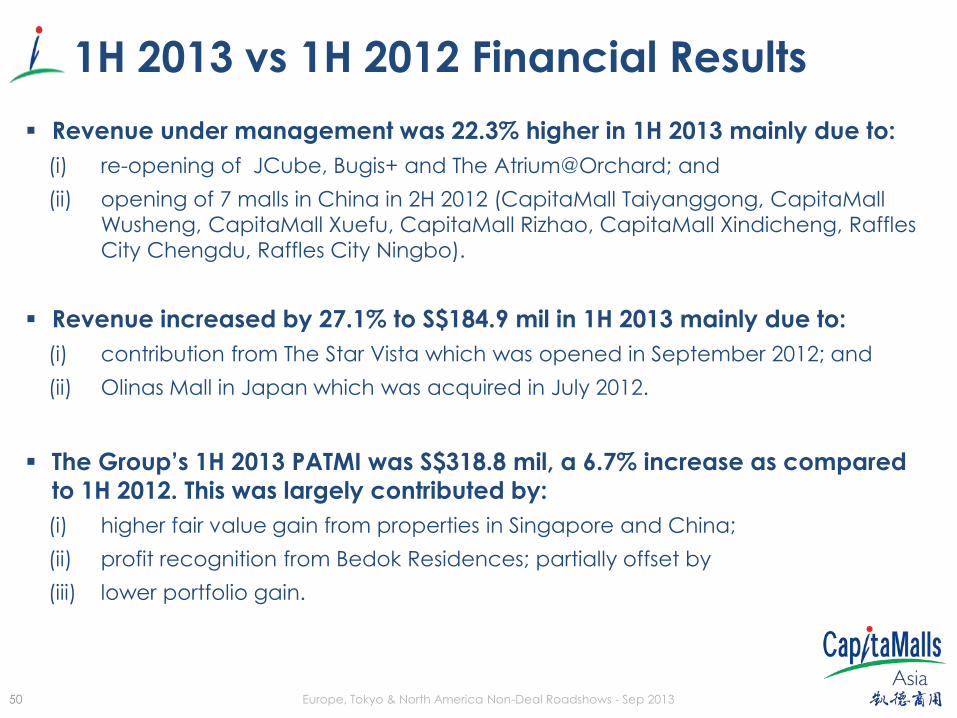
Revenue under management was 22.3% higher in 1H 2013 mainly due to:
(i) re-opening of JCube, Bugis+ and The Atrium@Orchard; and
(ii) opening of 7 malls in China in 2H 2012 (CapitaMall Taiyanggong, CapitaMall
Wusheng, CapitaMall Xuefu, CapitaMall Rizhao, CapitaMall Xindicheng, Raffles
City Chengdu, Raffles City Ningbo).
Revenue increased by 27.1% to S$184.9 mil in 1H 2013 mainly due to:
(i) contribution from The Star Vista which was opened in September 2012; and
(ii) Olinas Mall in Japan which was acquired in July 2012.
The Group’s 1H 2013 PATMI was S$318.8 mil, a 6.7% increase as compared
to 1H 2012. This was largely contributed by:
(i) higher fair value gain from properties in Singapore and China;
(ii) profit recognition from Bedok Residences; partially offset by
(iii) lower portfolio gain.
1H 2013 vs 1H 2012 Financial Results
51 Europe, Tokyo & North America Non-Deal Roadshows - Sep 2013
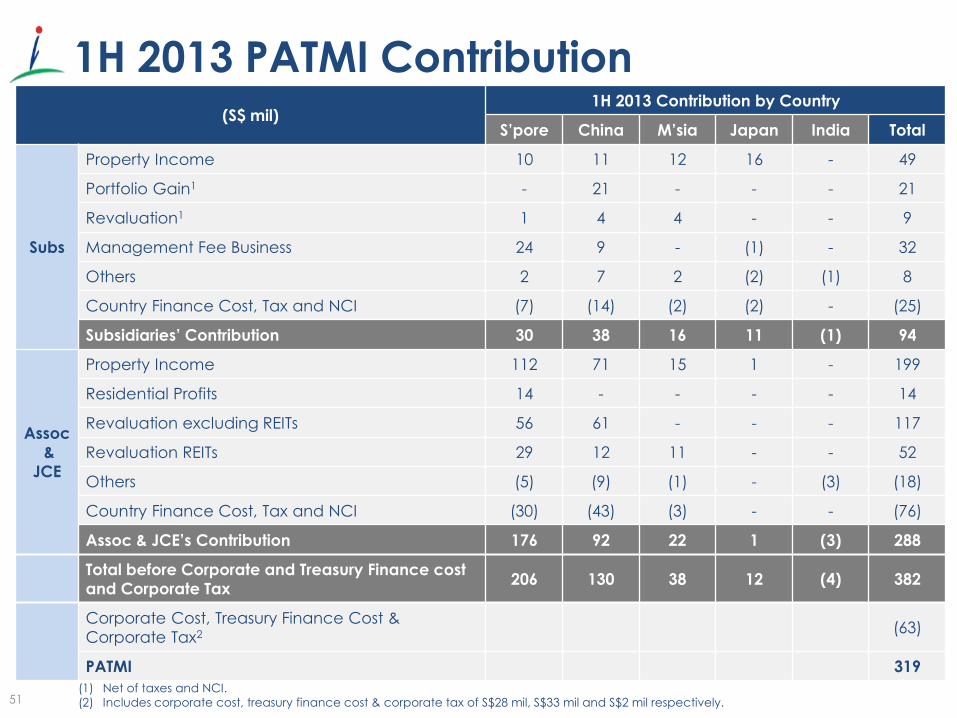
1H 2013 PATMI Contribution (S$ mil)
1H 2013 Contribution by Country
S’pore China M’sia Japan India Total
Subs
Property Income 10 11 12 16 - 49
Portfolio Gain1 - 21 - - - 21
Revaluation1 1 4 4 - - 9
Management Fee Business 24 9 - (1) - 32
Others 2 7 2 (2) (1) 8
Country Finance Cost, Tax and NCI (7) (14) (2) (2) - (25)
Subsidiaries’ Contribution 30 38 16 11 (1) 94
Assoc
&
JCE
Property Income 112 71 15 1 - 199
Residential Profits 14 - - - - 14
Revaluation excluding REITs 56 61 - - - 117
Revaluation REITs 29 12 11 - - 52
Others (5) (9) (1) - (3) (18)
Country Finance Cost, Tax and NCI (30) (43) (3) - - (76)
Assoc & JCE’s Contribution 176 92 22 1 (3) 288
Total before Corporate and Treasury Finance cost
and Corporate Tax 206 130 38 12 (4) 382
Corporate Cost, Treasury Finance Cost &
Corporate Tax2 (63)
PATMI 319
(1) Net of taxes and NCI.
(2) Includes corporate cost, treasury finance cost & corporate tax of S$28 mil, S$33 mil and S$2 mil respectively.
52 Europe, Tokyo & North America Non-Deal Roadshows - Sep 2013
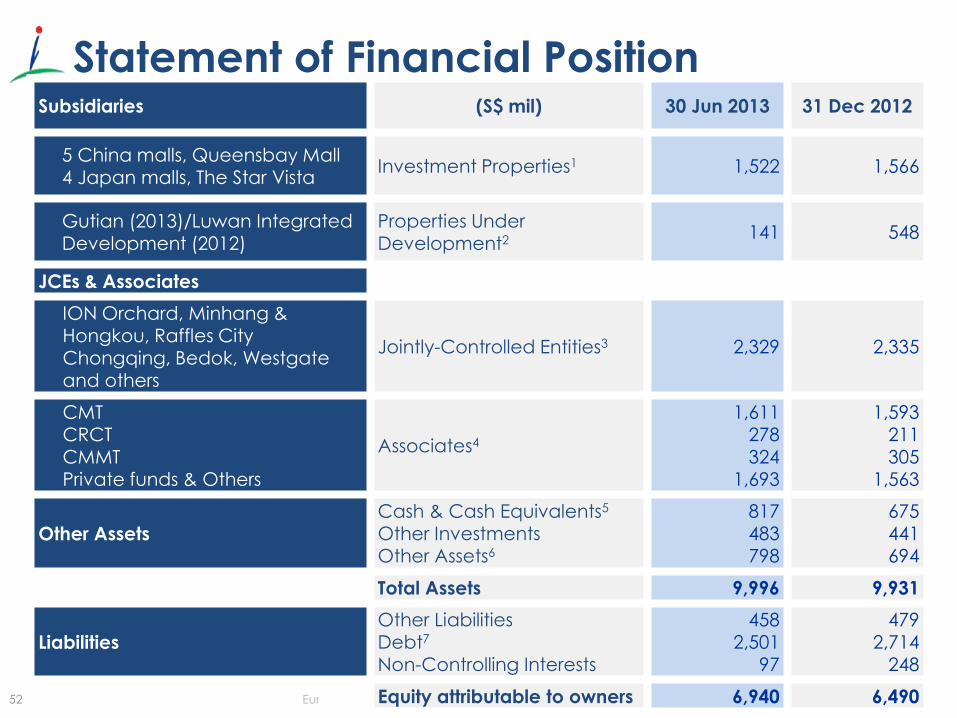
Subsidiaries (S$ mil) 30 Jun 2013 31 Dec 2012
5 China malls, Queensbay Mall 4 Japan malls, The Star Vista
Investment Properties1 1,522 1,566
Gutian (2013)/Luwan Integrated Development (2012)
Properties Under Development2
141 548
JCEs & Associates
ION Orchard, Minhang & Hongkou, Raffles City Chongqing, Bedok, Westgate and others
Jointly-Controlled Entities3 2,329 2,335
CMT CRCT
CMMT Private funds & Others
Associates4
1,611 278
324 1,693
1,593 211
305 1,563
Other Assets
Cash & Cash Equivalents5
Other Investments Other Assets6
817 483 798
675 441 694
Total Assets 9,996 9,931
Liabilities
Other Liabilities Debt7
Non-Controlling Interests
458 2,501
97
479 2,714
248
Equity attributable to owners 6,940 6,490
Statement of Financial Position
53 Europe, Tokyo & North America Non-Deal Roadshows - Sep 2013
Notes to Statement of Financial Position
1. The decrease was mainly due to depreciation of Japanese Yen against
Singapore Dollar for the four malls in Japan.
2. The decrease was mainly due to the transfer of an asset to CMCDF III, but
partially offset by an addition of a development project in China.
3. The decrease was mainly due to the partial repayment of long-term loans by the
jointly-controlled entities but was partially offset by share of profits for 1H 2013.
4. The increase was mainly due to injection of assets to CMCDF III and the share of
profits for 1H 2013.
5. The increase was mainly due to the partial repayment of loans by the jointly-
controlled entities and the China funds.
6. The increase was mainly due to sales consideration receivable for the injection
of an asset to CMCDF III but partially offset by partial repayment of short-term
loans by the China funds. The consideration was received subsequent to 30 Jun
2013.
7. The decrease was mainly due to the repayment of bank loans.
54 Europe, Tokyo & North America Non-Deal Roadshows - Sep 2013
18%
59% 6%
8%
9% 14%
71%
6%
2% 7%
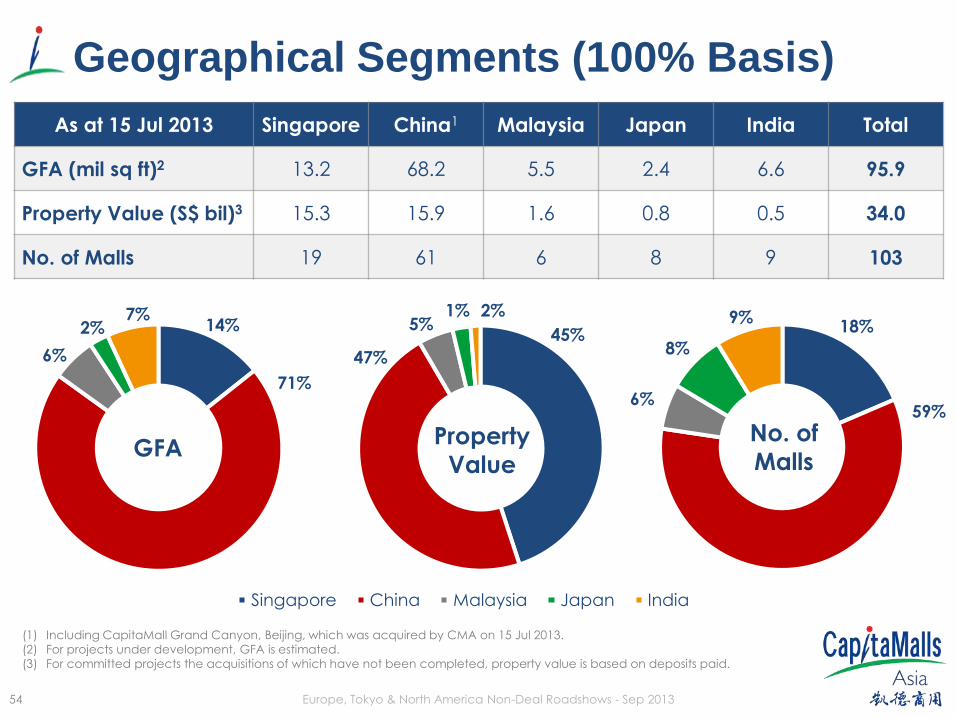
Geographical Segments (100% Basis)
(1) Including CapitaMall Grand Canyon, Beijing, which was acquired by CMA on 15 Jul 2013.
(2) For projects under development, GFA is estimated.
(3) For committed projects the acquisitions of which have not been completed, property value is based on deposits paid.
As at 15 Jul 2013 Singapore China1 Malaysia Japan India Total
GFA (mil sq ft)2 13.2 68.2 5.5 2.4 6.6 95.9
Property Value (S$ bil)3 15.3 15.9 1.6 0.8 0.5 34.0
No. of Malls 19 61 6 8 9 103
GFA Property
Value
No. of
Malls
45%
47%
5% 2% 1%
Singapore China Malaysia Japan India
55 Europe, Tokyo & North America Non-Deal Roadshows - Sep 2013
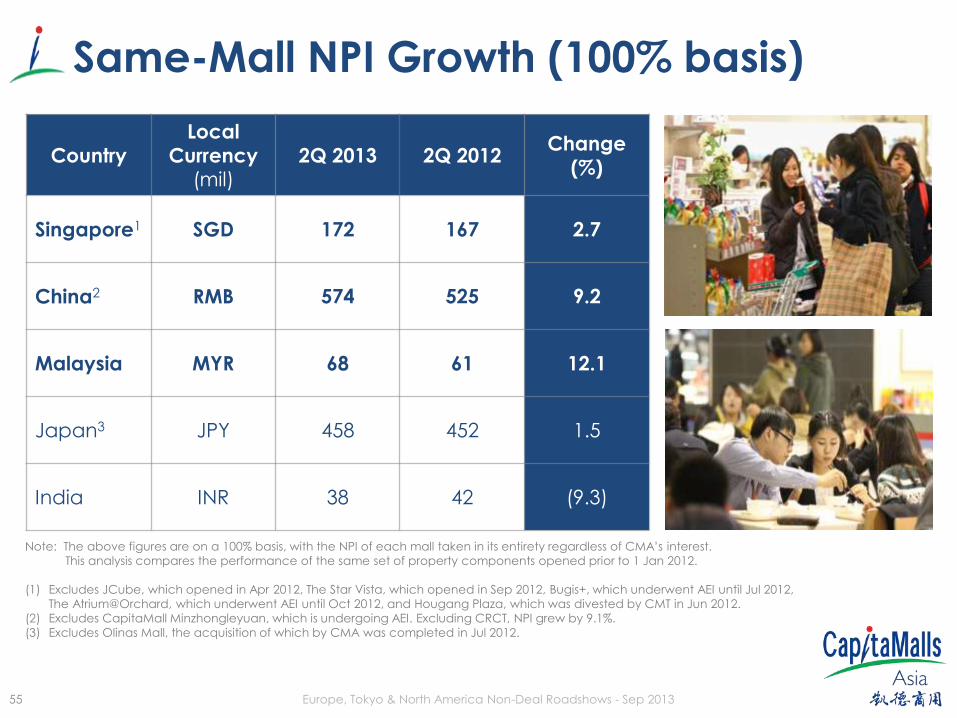
Same-Mall NPI Growth (100% basis)
Country
Local
Currency (mil)
2Q 2013 2Q 2012 Change
(%)
Singapore1 SGD 172 167 2.7
China2 RMB 574 525 9.2
Malaysia MYR 68 61 12.1
Japan3 JPY 458 452 1.5
India INR 38 42 (9.3)
Note: The above figures are on a 100% basis, with the NPI of each mall taken in its entirety regardless of CMA’s interest.
This analysis compares the performance of the same set of property components opened prior to 1 Jan 2012.
(1) Excludes JCube, which opened in Apr 2012, The Star Vista, which opened in Sep 2012, Bugis+, which underwent AEI until Jul 2012,
The Atrium@Orchard, which underwent AEI until Oct 2012, and Hougang Plaza, which was divested by CMT in Jun 2012.
(2) Excludes CapitaMall Minzhongleyuan, which is undergoing AEI. Excluding CRCT, NPI grew by 9.1%. (3) Excludes Olinas Mall, the acquisition of which by CMA was completed in Jul 2012.
56 Europe, Tokyo & North America Non-Deal Roadshows - Sep 2013
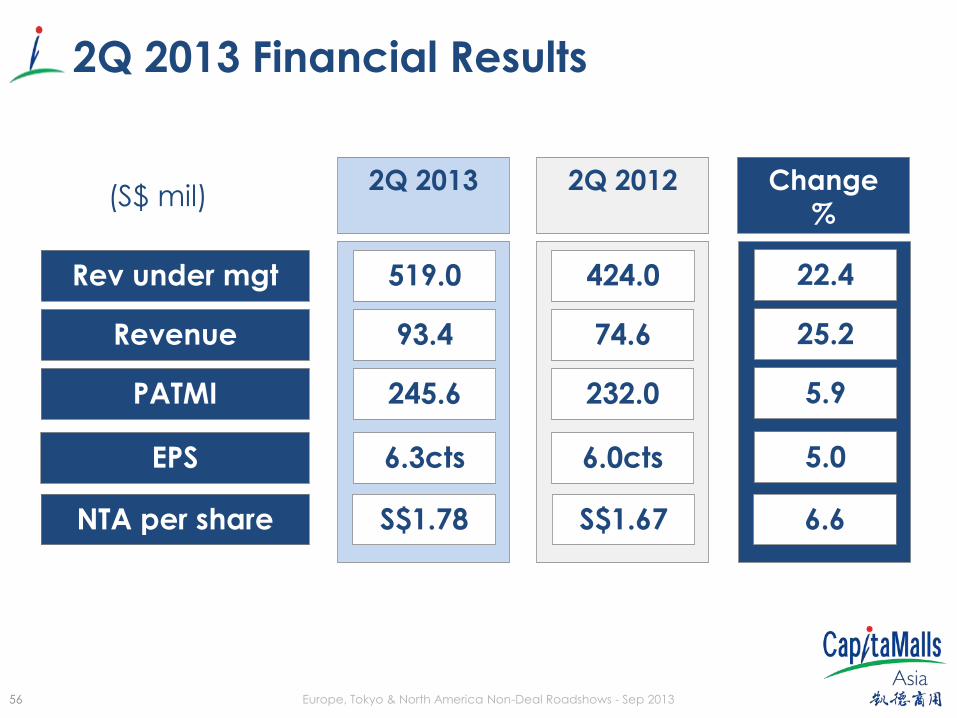
2Q 2013 Financial Results
(S$ mil)
25.2
5.9
74.6
232.0
93.4
245.6 PATMI
Revenue
22.4 424.0 519.0 Rev under mgt
5.0 6.0cts 6.3cts
2Q 2013 2Q 2012
Change
%
EPS
6.6 S$1.67 S$1.78 NTA per share

57 Europe, Tokyo & North America Non-Deal Roadshows - Sep 2013
2Q 2013 Financial Results – PATMI Analysis
(S$ mil)
(84.2)
68.9
88.6
105.4
14.0*
178.0 Revaluation
Portfolio Gain
41.1 38.0 53.6 Operating PATMI
5.9 232.0 245.6
2Q 2013 2Q 2012
Change
%
Total PATMI
Note* : Included portfolio gain on completion of transfer of assets to CapitaMalls China Development Fund III (S$13.5 mil) and gain from
warehousing (S$0.5 mil) in 2Q 2013.
58 Europe, Tokyo & North America Non-Deal Roadshows - Sep 2013
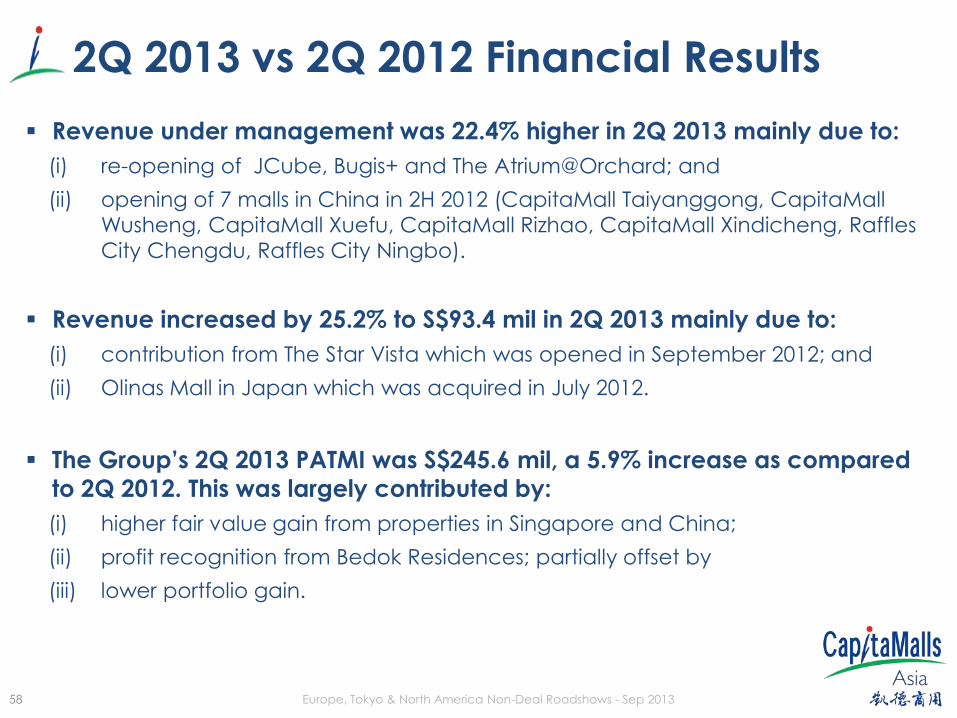
Revenue under management was 22.4% higher in 2Q 2013 mainly due to:
(i) re-opening of JCube, Bugis+ and The Atrium@Orchard; and
(ii) opening of 7 malls in China in 2H 2012 (CapitaMall Taiyanggong, CapitaMall
Wusheng, CapitaMall Xuefu, CapitaMall Rizhao, CapitaMall Xindicheng, Raffles
City Chengdu, Raffles City Ningbo).
Revenue increased by 25.2% to S$93.4 mil in 2Q 2013 mainly due to:
(i) contribution from The Star Vista which was opened in September 2012; and
(ii) Olinas Mall in Japan which was acquired in July 2012.
The Group’s 2Q 2013 PATMI was S$245.6 mil, a 5.9% increase as compared
to 2Q 2012. This was largely contributed by:
(i) higher fair value gain from properties in Singapore and China;
(ii) profit recognition from Bedok Residences; partially offset by
(iii) lower portfolio gain.
2Q 2013 vs 2Q 2012 Financial Results
59 Europe, Tokyo & North America Non-Deal Roadshows - Sep 2013
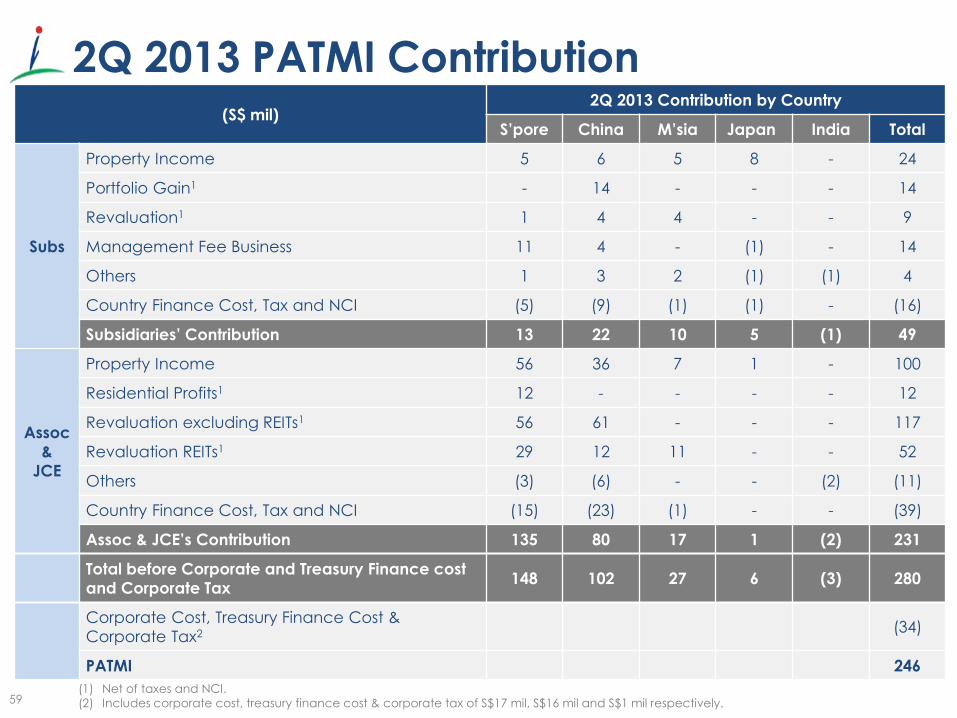
2Q 2013 PATMI Contribution (S$ mil)
2Q 2013 Contribution by Country
S’pore China M’sia Japan India Total
Subs
Property Income 5 6 5 8 - 24
Portfolio Gain1 - 14 - - - 14
Revaluation1 1 4 4 - - 9
Management Fee Business 11 4 - (1) - 14
Others 1 3 2 (1) (1) 4
Country Finance Cost, Tax and NCI (5) (9) (1) (1) - (16)
Subsidiaries’ Contribution 13 22 10 5 (1) 49
Assoc
&
JCE
Property Income 56 36 7 1 - 100
Residential Profits1 12 - - - - 12
Revaluation excluding REITs1 56 61 - - - 117
Revaluation REITs1 29 12 11 - - 52
Others (3) (6) - - (2) (11)
Country Finance Cost, Tax and NCI (15) (23) (1) - - (39)
Assoc & JCE’s Contribution 135 80 17 1 (2) 231
Total before Corporate and Treasury Finance cost
and Corporate Tax 148 102 27 6 (3) 280
Corporate Cost, Treasury Finance Cost &
Corporate Tax2 (34)
PATMI 246
(1) Net of taxes and NCI.
(2) Includes corporate cost, treasury finance cost & corporate tax of S$17 mil, S$16 mil and S$1 mil respectively.
60 Europe, Tokyo & North America Non-Deal Roadshows - Sep 2013
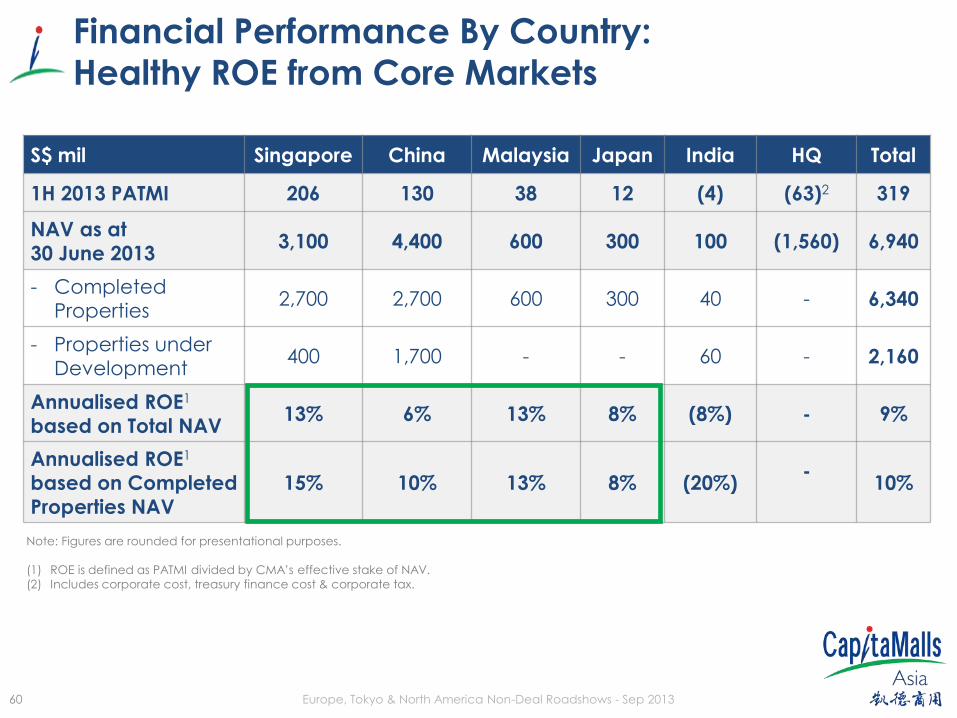
Financial Performance By Country: Healthy ROE from Core Markets
S$ mil Singapore China Malaysia Japan India HQ Total
1H 2013 PATMI 206 130 38 12 (4) (63)2 319
NAV as at
30 June 2013 3,100 4,400 600 300 100 (1,560) 6,940
- Completed
Properties 2,700 2,700 600 300 40 - 6,340
- Properties under
Development 400 1,700 - - 60 - 2,160
Annualised ROE1
based on Total NAV 13% 6% 13% 8% (8%) - 9%
Annualised ROE1
based on Completed
Properties NAV
15% 10% 13% 8% (20%) -
10%
Note: Figures are rounded for presentational purposes.
(1) ROE is defined as PATMI divided by CMA’s effective stake of NAV.
(2) Includes corporate cost, treasury finance cost & corporate tax.
61 Europe, Tokyo & North America Non-Deal Roadshows - Sep 2013
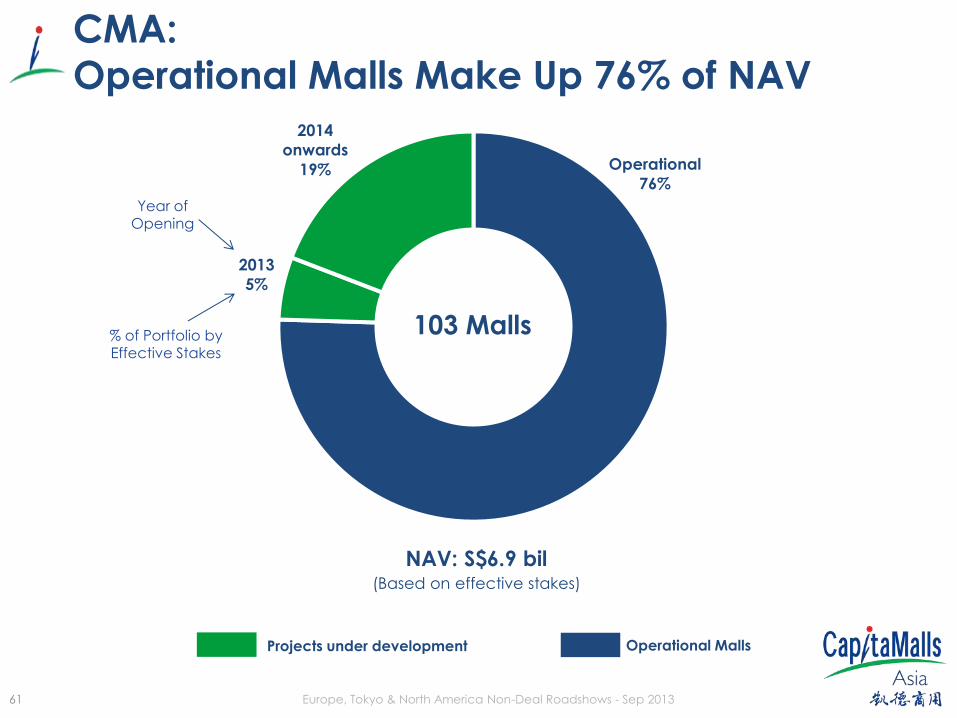
CMA:
Operational Malls Make Up 76% of NAV
Operational
76%
2013
5%
2014
onwards
19%
NAV: S$6.9 bil (Based on effective stakes)
% of Portfolio by Effective Stakes
Year of Opening
Projects under development Operational Malls
103 Malls
62 Europe, Tokyo & North America Non-Deal Roadshows - Sep 2013
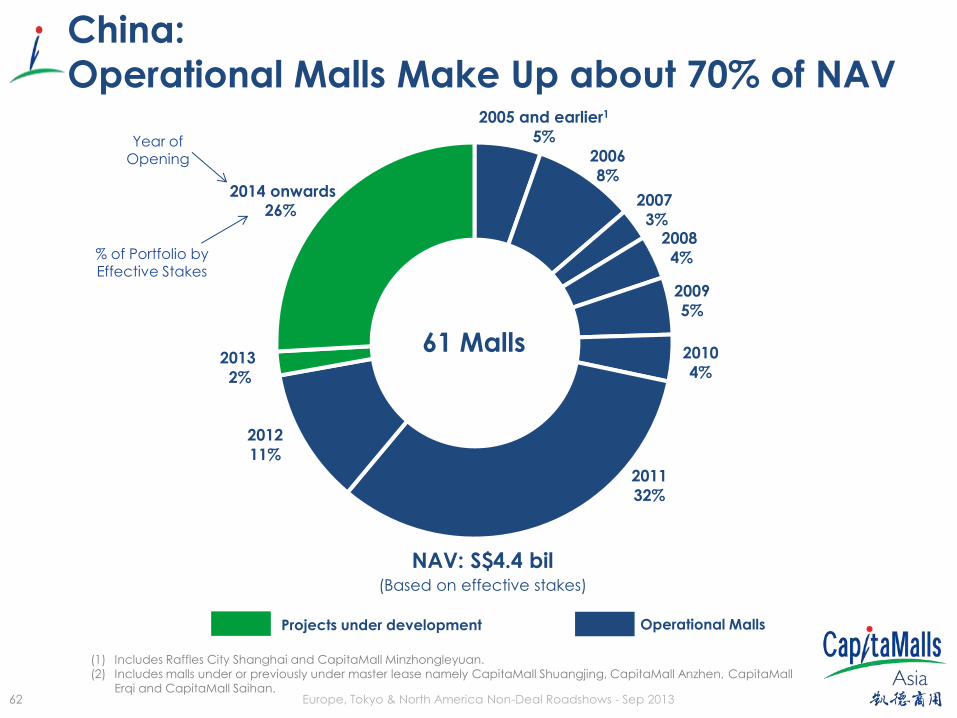
China:
Operational Malls Make Up about 70% of NAV
(1) Includes Raffles City Shanghai and CapitaMall Minzhongleyuan.
(2) Includes malls under or previously under master lease namely CapitaMall Shuangjing, CapitaMall Anzhen, CapitaMall
Erqi and CapitaMall Saihan.
2005 and earlier1
5%
2006
8%
2007
3% 2008
4%
2009
5%
2010
4%
2011
32%
2012
11%
2013
2%
2014 onwards
26%
NAV: S$4.4 bil (Based on effective stakes)
Year of
Opening
% of Portfolio by Effective Stakes
Projects under development Operational Malls
61 Malls
63 Europe, Tokyo & North America Non-Deal Roadshows - Sep 2013
(1.9%)
3.6%
5.1% 6.1% 6.4%
7.8%
8.8% 9.3%
10.1%
6.3%
300
700
1,100
1,500
1,900
2,300
2,700
3,100
3,500
3,900
4,300
-2.0%
-1.0%
0.0%
1.0%
2.0%
3.0%
4.0%
5.0%
6.0%
7.0%
8.0%
9.0%
10.0%
11.0%
2005 2006 2007 2008 2009 2010 2011 2012 1H12 1H13
Note: Please refer to our ‘Property Details Spreadsheet’ for the details of our China malls. http://capitamallsasia.com/corporate/portfolio.aspx.
(1)Excludes Raffles City Shanghai
(2)Excludes malls under or previously under master lease namely CapitaMall Shuangjing, CapitaMall Anzhen, CapitaMall Erqi and CapitaMall Saihan
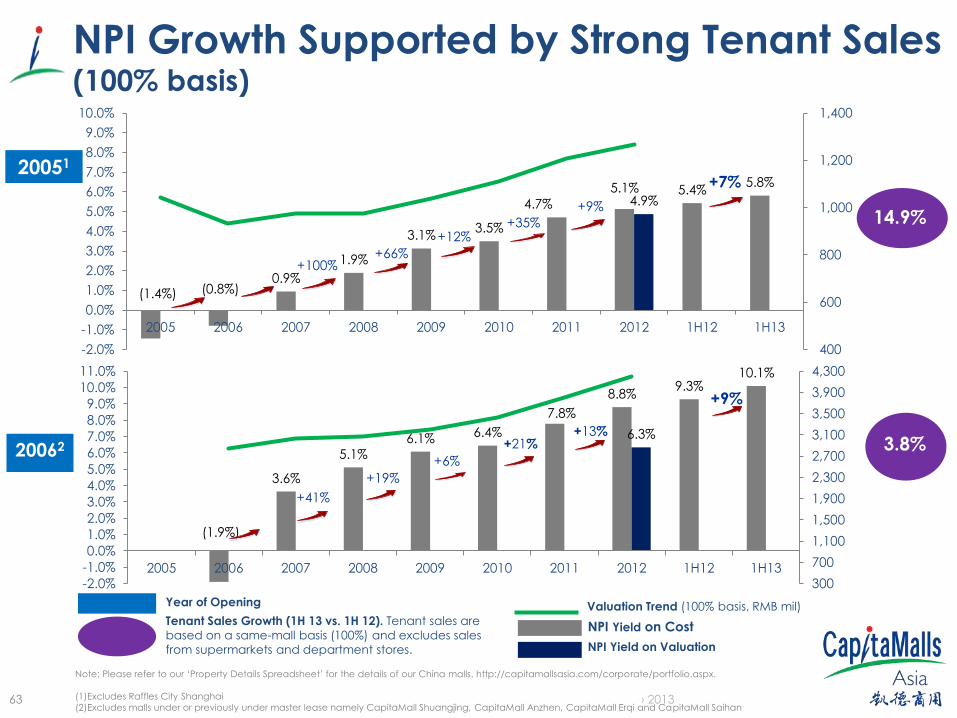
NPI Growth Supported by Strong Tenant Sales (100% basis)
NPI Yield on Cost
NPI Yield on Valuation
Tenant Sales Growth (1H 13 vs. 1H 12). Tenant sales are
based on a same-mall basis (100%) and excludes sales
from supermarkets and department stores.
20062
14.9%
3.8%
+41%
+19%
+6%
+13%
Year of Opening Valuation Trend (100% basis, RMB mil)
+9%
+21%
(1.4%) (0.8%) 0.9%
1.9%
3.1% 3.5%
4.7%
5.1% 5.4% 5.8%
4.9%
400
600
800
1,000
1,200
1,400
-2.0%
-1.0%
0.0%
1.0%
2.0%
3.0%
4.0%
5.0%
6.0%
7.0%
8.0%
9.0%
10.0%
2005 2006 2007 2008 2009 2010 2011 2012 1H12 1H13
20051
14.9%
+100% +66%
+12% +35%
+7%
+9%
64 Europe, Tokyo & North America Non-Deal Roadshows - Sep 2013
(0.6%)
2.7% 3.1%
4.7%
6.7% 7.2%
7.8%
6.0%
2,200
2,400
2,600
2,800
3,000
3,200
3,400
-2.0%
-1.0%
0.0%
1.0%
2.0%
3.0%
4.0%
5.0%
6.0%
7.0%
8.0%
9.0%
10.0%
11.0%
2005 2006 2007 2008 2009 2010 2011 2012 1H12 1H13
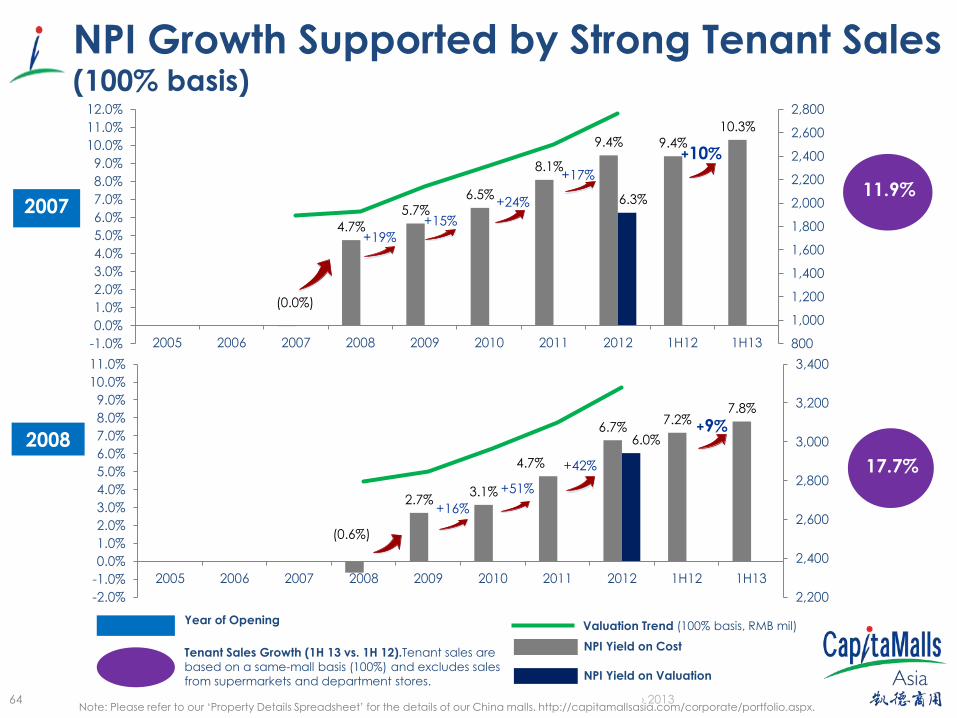
NPI Growth Supported by Strong Tenant Sales (100% basis)
Year of Opening
NPI Yield on Cost
NPI Yield on Valuation
2007
Tenant Sales Growth (1H 13 vs. 1H 12).Tenant sales are
based on a same-mall basis (100%) and excludes sales
from supermarkets and department stores.
Valuation Trend (100% basis, RMB mil)
Note: Please refer to our ‘Property Details Spreadsheet’ for the details of our China malls. http://capitamallsasia.com/corporate/portfolio.aspx.
2008
11.9%
17.7%
+16%
+51%
+9%
+42%
(0.0%)
4.7%
5.7% 6.5%
8.1%
9.4% 9.4%
10.3%
6.3%
800
1,000
1,200
1,400
1,600
1,800
2,000
2,200
2,400
2,600
2,800
-1.0%
0.0%
1.0%
2.0%
3.0%
4.0%
5.0%
6.0%
7.0%
8.0%
9.0%
10.0%
11.0%
12.0%
2005 2006 2007 2008 2009 2010 2011 2012 1H12 1H13
+19%
+15%
+24%
+10%
+17%
65 Europe, Tokyo & North America Non-Deal Roadshows - Sep 2013
1.9%
3.4% 3.5%
4.4%
3.0%
2,500
2,550
2,600
2,650
2,700
2,750
2,800
2,850
2,900
-1.0%
0.0%
1.0%
2.0%
3.0%
4.0%
5.0%
6.0%
7.0%
8.0%
9.0%
10.0%
2005 2006 2007 2008 2009 2010 2011 2012 1H12 1H13
(0.7%)
3.7%
5.8%
6.8% 6.9%
8.1%
5.0%
3,500
3,750
4,000
4,250
4,500
4,750
5,000
5,250
5,500
-1.0%
0.0%
1.0%
2.0%
3.0%
4.0%
5.0%
6.0%
7.0%
8.0%
9.0%
10.0%
2005 2006 2007 2008 2009 2010 2011 2012 1H12 1H13
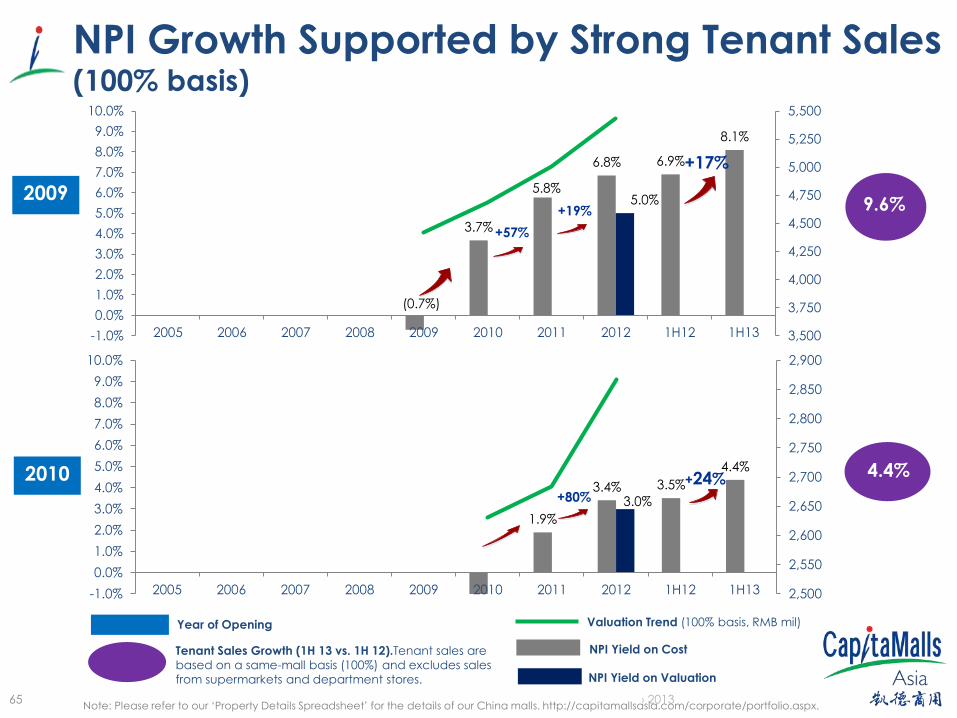
NPI Growth Supported by Strong Tenant Sales (100% basis)
Year of Opening
NPI Yield on Cost
NPI Yield on Valuation
2009
2010
9.6%
+17%
Valuation Trend (100% basis, RMB mil)
Tenant Sales Growth (1H 13 vs. 1H 12).Tenant sales are
based on a same-mall basis (100%) and excludes sales
from supermarkets and department stores.
Note: Please refer to our ‘Property Details Spreadsheet’ for the details of our China malls. http://capitamallsasia.com/corporate/portfolio.aspx.
+24% 4.4%
+19%
+57%
+80%
66 Europe, Tokyo & North America Non-Deal Roadshows - Sep 2013
(0.1%)
3.9% 4.1% 4.6%
3.6%
7,000
7,500
8,000
8,500
9,000
9,500
10,000
10,500
11,000
-1.0%
0.0%
1.0%
2.0%
3.0%
4.0%
5.0%
6.0%
7.0%
8.0%
9.0%
10.0%
2005 2006 2007 2008 2009 2010 2011 2012 1H12 1H13
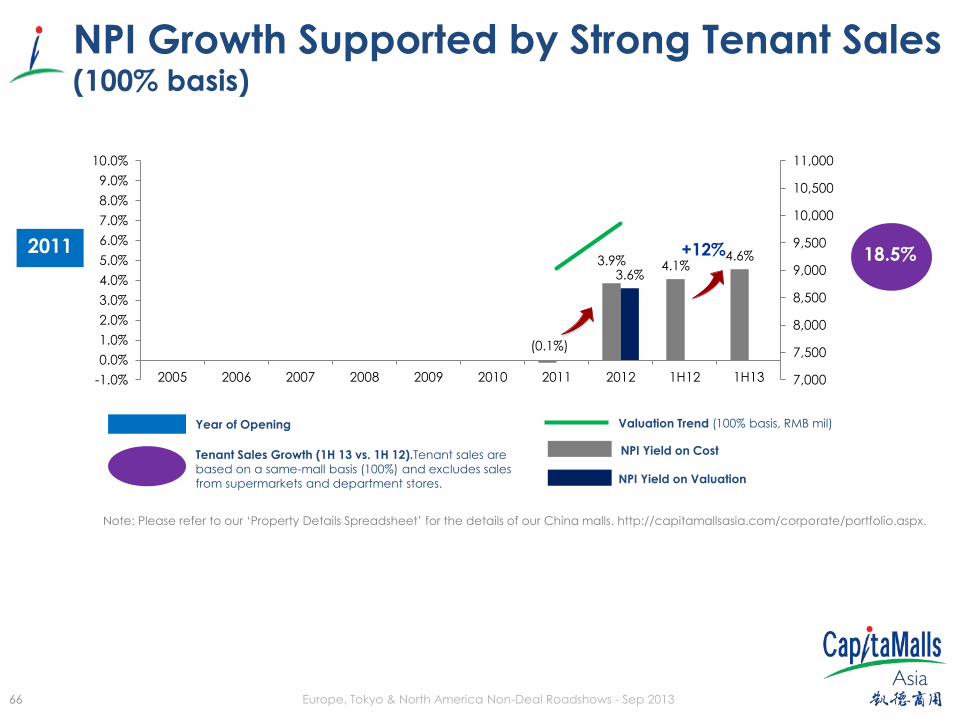
NPI Growth Supported by Strong Tenant Sales (100% basis)
Year of Opening
NPI Yield on Cost
NPI Yield on Valuation
2011 18.5% +12%
Valuation Trend (100% basis, RMB mil)
Tenant Sales Growth (1H 13 vs. 1H 12).Tenant sales are
based on a same-mall basis (100%) and excludes sales
from supermarkets and department stores.
Note: Please refer to our ‘Property Details Spreadsheet’ for the details of our China malls. http://capitamallsasia.com/corporate/portfolio.aspx.
67 Europe, Tokyo & North America Non-Deal Roadshows - Sep 2013
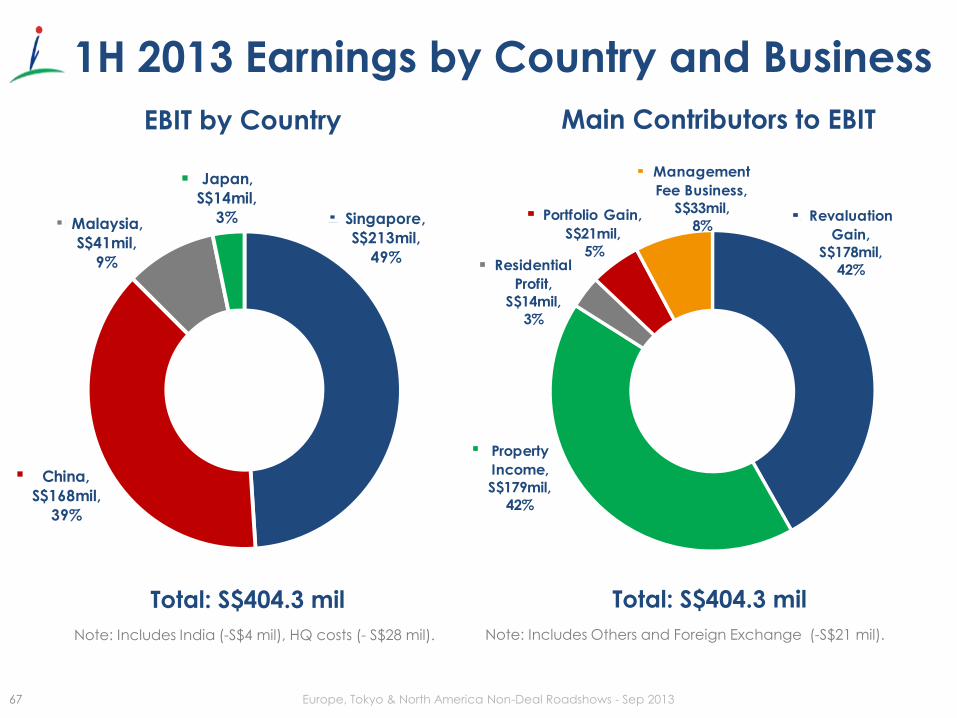
Revaluation
Gain,
S$178mil,
42%
Property
Income,
S$179mil,
42%
Residential
Profit,
S$14mil,
3%
Portfolio Gain,
S$21mil,
5%
Management
Fee Business,
S$33mil,
8%Singapore,
S$213mil,
49%
China,
S$168mil,
39%
Malaysia,
S$41mil,
9%
Japan,
S$14mil,
3%
1H 2013 Earnings by Country and Business
EBIT by Country Main Contributors to EBIT
Total: S$404.3 mil Total: S$404.3 mil
Note: Includes India (-S$4 mil), HQ costs (- S$28 mil). Note: Includes Others and Foreign Exchange (-S$21 mil).
68 Europe, Tokyo & North America Non-Deal Roadshows - Sep 2013
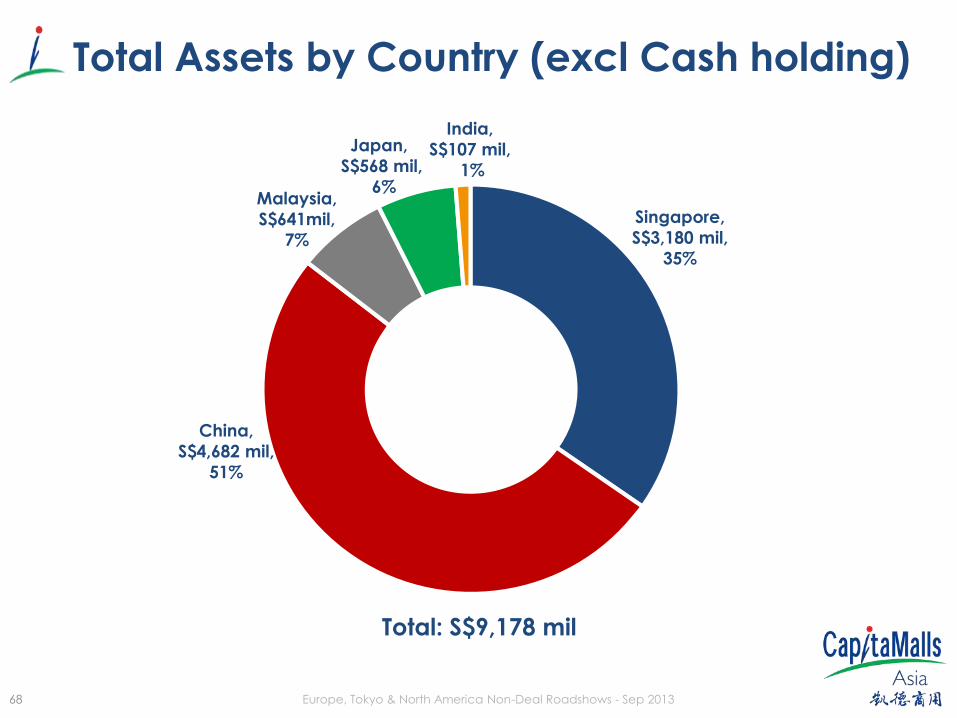
Total Assets by Country (excl Cash holding)
Total: S$9,178 mil
Singapore,
S$3,180 mil,
35%
China,
S$4,682 mil,
51%
Malaysia,
S$641mil,
7%
Japan,
S$568 mil,
6%
India,
S$107 mil,
1%
69 Europe, Tokyo & North America Non-Deal Roadshows - Sep 2013
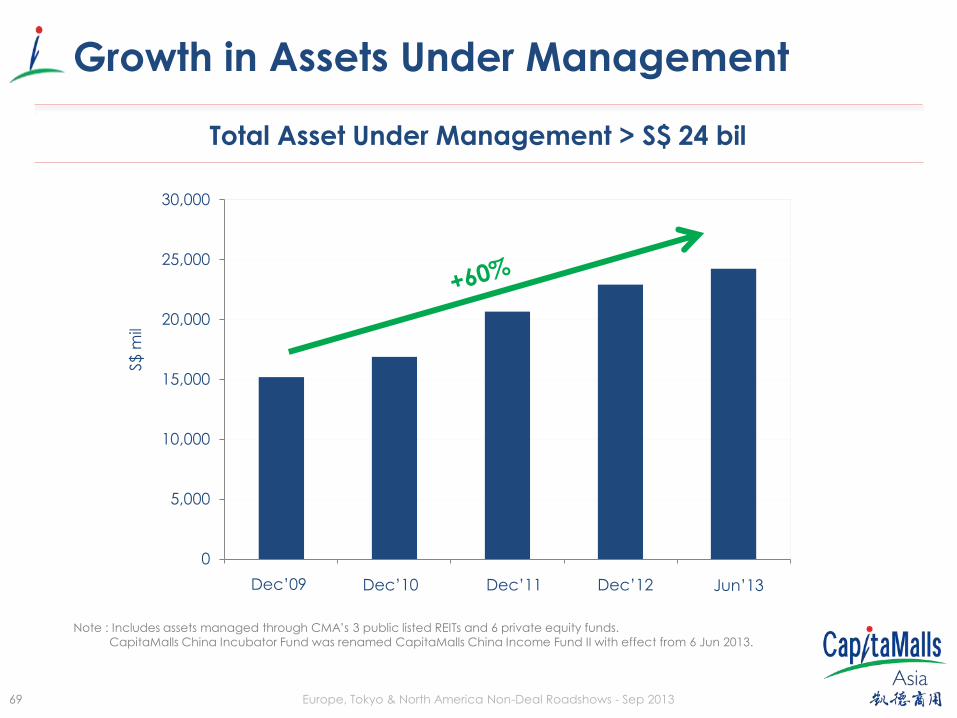
Growth in Assets Under Management
Total Asset Under Management > S$ 24 bil
0
5,000
10,000
15,000
20,000
25,000
30,000
一月-00 一月-00 一月-00 一月-00 一月-00 Dec’09 Dec’10 Dec’11 Dec’12 Jun’13
Note : Includes assets managed through CMA’s 3 public listed REITs and 6 private equity funds.
CapitaMalls China Incubator Fund was renamed CapitaMalls China Income Fund II with effect from 6 Jun 2013.
S$
mil
70 Europe, Tokyo & North America Non-Deal Roadshows - Sep 2013
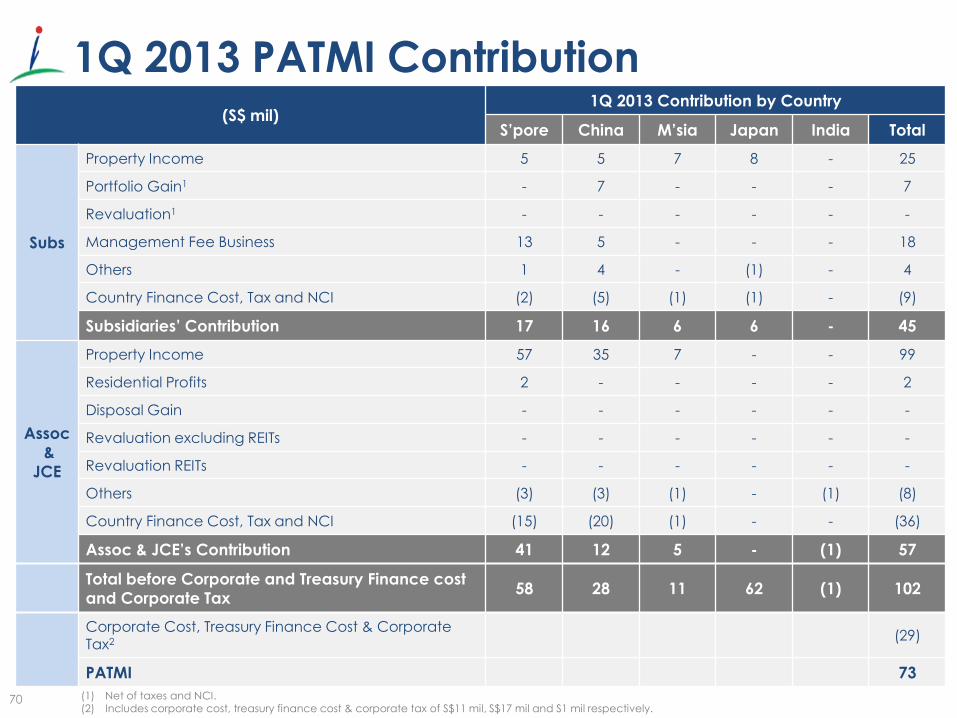
1Q 2013 PATMI Contribution (S$ mil)
1Q 2013 Contribution by Country
S’pore China M’sia Japan India Total
Subs
Property Income 5 5 7 8 - 25
Portfolio Gain1 - 7 - - - 7
Revaluation1 - - - - - -
Management Fee Business 13 5 - - - 18
Others 1 4 - (1) - 4
Country Finance Cost, Tax and NCI (2) (5) (1) (1) - (9)
Subsidiaries’ Contribution 17 16 6 6 - 45
Assoc
&
JCE
Property Income 57 35 7 - - 99
Residential Profits 2 - - - - 2
Disposal Gain - - - - - -
Revaluation excluding REITs - - - - - -
Revaluation REITs - - - - - -
Others (3) (3) (1) - (1) (8)
Country Finance Cost, Tax and NCI (15) (20) (1) - - (36)
Assoc & JCE’s Contribution 41 12 5 - (1) 57
Total before Corporate and Treasury Finance cost
and Corporate Tax 58 28 11 62 (1) 102
Corporate Cost, Treasury Finance Cost & Corporate Tax2
(29)
PATMI 73
(1) Net of taxes and NCI. (2) Includes corporate cost, treasury finance cost & corporate tax of S$11 mil, S$17 mil and S1 mil respectively.
71 Europe, Tokyo & North America Non-Deal Roadshows - Sep 2013
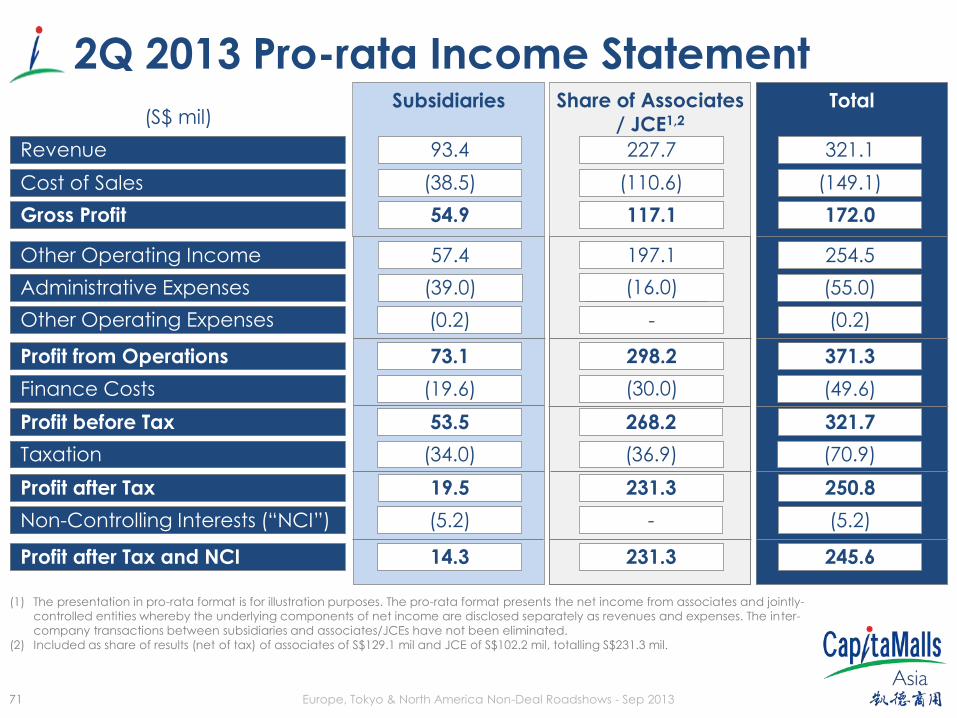
Total Share of Associates
/ JCE1,2 Subsidiaries
2Q 2013 Pro-rata Income Statement
(S$ mil)
254.5 197.1 57.4
Revenue
Other Operating Income
Gross Profit
Cost of Sales
371.3 298.2 73.1
(55.0) (14.2)
Profit from Operations
93.4 227.7 321.1
Administrative Expenses
(0.2) - (0.2) Other Operating Expenses
Finance Costs (19.6) (30.0) (49.6)
(38.5)
54.9
(110.6)
117.1
(149.1)
172.0
(39.0)
Profit before Tax
Taxation
Profit after Tax
Non-Controlling Interests (“NCI”)
Profit after Tax and NCI
53.5
(34.0)
19.5
(5.2)
14.3
268.2
(36.9)
231.3
-
231.3
321.7
(70.9)
250.8
(5.2)
245.6
(1) The presentation in pro-rata format is for illustration purposes. The pro-rata format presents the net income from associates and jointly-
controlled entities whereby the underlying components of net income are disclosed separately as revenues and expenses. The inter-
company transactions between subsidiaries and associates/JCEs have not been eliminated.
(2) Included as share of results (net of tax) of associates of S$129.1 mil and JCE of S$102.2 mil, totalling S$231.3 mil.
(16.0)
72 Europe, Tokyo & North America Non-Deal Roadshows - Sep 2013
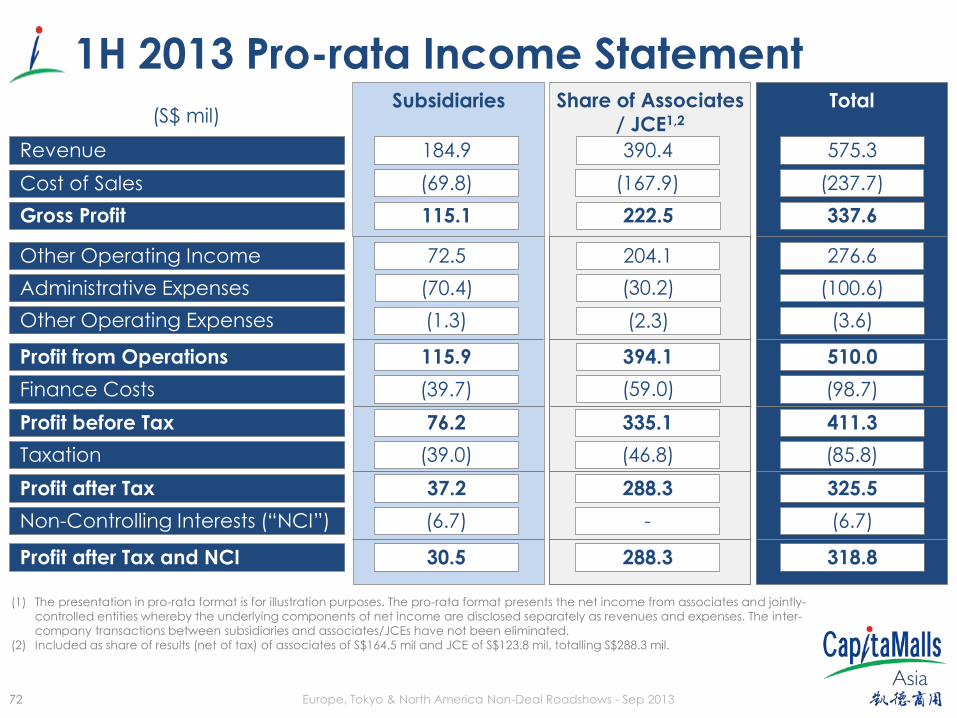
1H 2013 Pro-rata Income Statement
(S$ mil)
276.6 204.1 72.5
Revenue
Other Operating Income
Gross Profit
Cost of Sales
510.0 394.1 115.9
(100.6)
Profit from Operations
Subsidiaries
184.9
Share of Associates
/ JCE1,2
390.4
Total
575.3
Administrative Expenses
(3.6) (2.3) (1.3) Other Operating Expenses
Finance Costs (39.7) (59.0) (98.7)
(69.8)
115.1
(167.9)
222.5
(237.7)
337.6
(70.4)
Profit before Tax
Taxation
Profit after Tax
Non-Controlling Interests (“NCI”)
Profit after Tax and NCI
76.2
(39.0)
37.2
(6.7)
30.5
335.1
(46.8)
288.3
-
288.3
411.3
(85.8)
325.5
(6.7)
318.8
(1) The presentation in pro-rata format is for illustration purposes. The pro-rata format presents the net income from associates and jointly-
controlled entities whereby the underlying components of net income are disclosed separately as revenues and expenses. The inter-company transactions between subsidiaries and associates/JCEs have not been eliminated.
(2) Included as share of results (net of tax) of associates of S$164.5 mil and JCE of S$123.8 mil, totalling S$288.3 mil.
(30.2)
73 Europe, Tokyo & North America Non-Deal Roadshows - Sep 2013
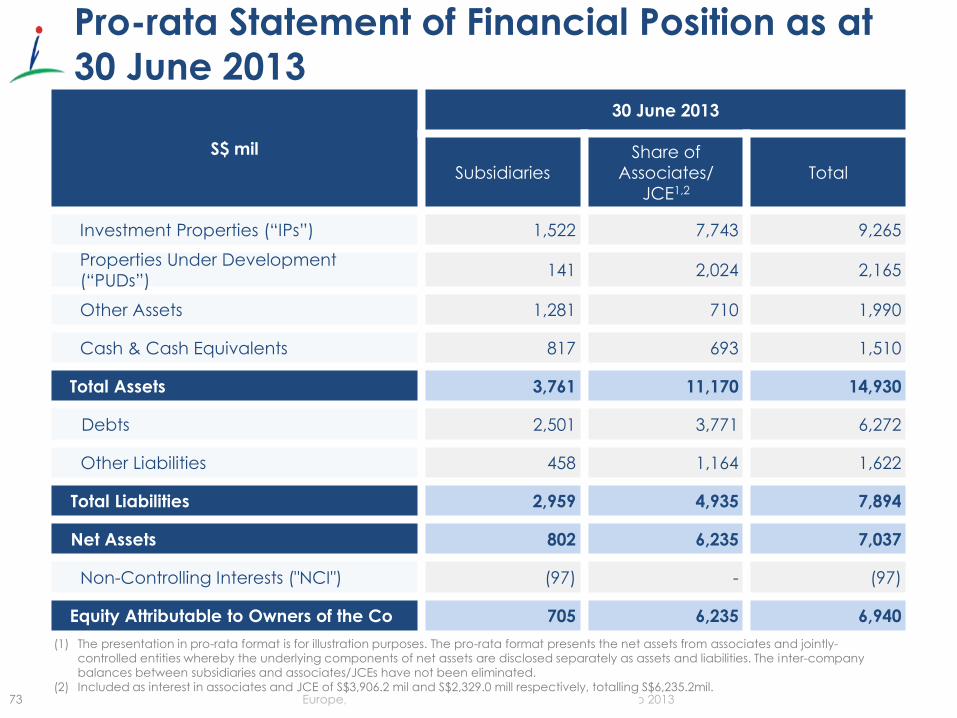
Pro-rata Statement of Financial Position as at
30 June 2013
S$ mil
30 June 2013
Subsidiaries
Share of
Associates/
JCE1,2
Total
Investment Properties (“IPs”) 1,522 7,743 9,265
Properties Under Development
(“PUDs”) 141 2,024 2,165
Other Assets 1,281 710 1,990
Cash & Cash Equivalents 817 693 1,510
Total Assets 3,761 11,170 14,930
Debts 2,501 3,771 6,272
Other Liabilities 458 1,164 1,622
Total Liabilities 2,959 4,935 7,894
Net Assets 802 6,235 7,037
Non-Controlling Interests ("NCI") (97) - (97)
Equity Attributable to Owners of the Co 705 6,235 6,940
(1) The presentation in pro-rata format is for illustration purposes. The pro-rata format presents the net assets from associates and jointly-
controlled entities whereby the underlying components of net assets are disclosed separately as assets and liabilities. The inter-company
balances between subsidiaries and associates/JCEs have not been eliminated.
(2) Included as interest in associates and JCE of S$3,906.2 mil and S$2,329.0 mill respectively, totalling S$6,235.2mil.
74
Thank You
Thank You
For enquiries from analysts & investors,
please contact
For enquiries from Hong Kong/China analysts,
please contact:
Teng Li Yeng
Investor Relations
Tel: (65) 6826 5357
Email: [email protected]
Maggie Huang
Investor Relations
Tel: (86) 10-5879 9018
Email: [email protected]