Embed Size (px)
Citation preview
CAPP SCOTIABANK INVESTMENT SYMPOSIUM
TORONTO| APRIL 12 - 13, 2016
Paul Myers - President & Chief Executive Officer
Rob Froese - Chief Financial Officer

Canbriam Energy | Corporate presentation 2
Forward looking information
Certain statements included in this presentation constitute forward‐looking statements or forward‐looking information under securities legislation. Such forward‐looking
statements or information are provided for the purpose of providing information about management's current expectations and plans relating to the future. Readers are
cautioned that reliance on such information may not be appropriate for other purposes, such as making investment decisions. Forward‐looking statements or information
typically contain words such as "anticipate", "believe", "expect", "plan", "intend", "estimate", "propose", "project" or similar words suggesting future outcomes or
statements regarding an outlook. Forward‐looking statements or information concerning Canbriam in this presentation may include, but are not limited to, statements or
information with respect to: future production levels and the expected timing for the achievement thereof; business strategy and objectives; expected resource potential and
future reserves; development and exploration plans and the timing and results thereof; the development of and access to pipelines; the potential future development of LNG
export facilities and Canbriam's ability to supply such projects.
Forward‐looking statements or information are based on a number of factors and assumptions which have been used to develop such statements and information but which may
prove to be incorrect. Canbriam believes that the expectations reflected in such forward‐looking statements or information are reasonable; however, undue reliance should not be
placed on forward‐looking statements because Canbriam can give no assurance that such expectations will prove to be correct. In addition to other factors and assumptions
which may be identified in this presentation, assumptions have been made regarding, among other things: the impact of increasing competition; the timely receipt of any required
regulatory approvals; the ability of Canbriam to obtain qualified staff, equipment and services in a timely and cost efficient manner; the ability of Canbriam to obtain financing on
acceptable terms; field production rates and decline rates; the ability to replace and expand reserves through acquisition, development or exploration; the timing and costs of
operating Canbriam’s business; the ability of Canbriam to secure adequate product transportation, including access to pipelines and potential LNG export facilities; future oil and
natural gas prices; currency, exchange and interest rates; the regulatory framework regarding royalties, taxes and environmental matters; and the ability of Canbriam to
successfully market its oil and natural gas products. Readers are cautioned that the foregoing list is not exhaustive of all factors and assumptions which have been used.
Forward‐looking statements or information are based on current expectations, estimates and projections that involve a number of risks and uncertainties which could cause
actual results to differ materially from those anticipated by Canbriam and described in the forward‐looking statements or information. These risks and uncertainties may cause
actual results to differ materially from the forward‐looking statements or information. The material risk factors affecting Canbriam include, without limitation, the accuracy of
reserves and resources estimates; reliance on key personnel; general economic conditions; volatility in global market prices for oil and natural gas; competition; liabilities and
risks, including environmental liability and risks, inherent in oil and gas operations; the availability of capital; alternatives to and changing demand for petroleum products;
changes in legislation and the regulatory environment, including uncertainties with respect to environmental legislation; title defects which may adversely affect Canbriam; the
availability of drilling and related equipment in the particular areas where such activities will be conducted; constraints related to product transportation; relationships with First
Nations in areas in which Canbriam operates; Canbriam's dependence on third parties; and other known or unknown factors.
The forward‐looking statements or information contained in this presentation are made as of the date hereof and Canbriam undertakes no obligation to update publicly or revise
any forward‐looking statements or information, whether as a result of new information, future events or otherwise unless required by applicable securities laws. The
forward‐looking statements or information contained in this presentation are expressly qualified by this cautionary statement.

Canbriam Energy | Corporate presentation 3
Investing in Canbriam Energy A fully integrated, BC Montney natural gas growth company with differentiated resource quality
Prolific BC Montney asset
Large, low risk, high return drilling inventory
Integrated development strategy
Low cost structure supports profitable
growth
Experienced management with
strong sponsorship

Fort St. John
Edmonton
Calgary Vancouver
Montney trend
Canbriam Energy | Corporate presentation 4
Canbriam Energy A fully integrated, BC Montney natural gas growth company with differentiated resource quality
Private company focused in the Altares region
of the prolific Montney formation in northeast
BC
Current production ~27,000 boe/d
Q4 2015 production 22,920 boe/d
(15% liquids)
100% owned & operated infrastructure;
production capacity currently 40,000 boe/d
2016 capital program between $100 - $110
million
Deep inventory of ~960 net over-pressured,
liquids-rich locations with stable, low-decline
production base
361 MMboe gross 2P reserves (pre-tax PV10 of
$2.3 billion)(1)
Backed by top-tier sponsors Warburg Pincus,
ARC Financial, OTPP, GE Asset Management &
BlackRock 2 miles
North Altares
South Altares
Dehy & compression
Facility 10 mmcf/d
b-24-H Refrig Facility
50 mmcf/d
Altares Processing Facility
(b-72-A Refrig Facility
160 mmcf/d phases 1 & 2)
Spectra T
North
65-70% working interest
100% working interest
Non-Montney lands
Natural gas processing plant
Spectra T North
(1) Based on McDaniel & Associates Consultants Ltd. (“McDaniel & Associates”) reserves report as of December 31, 2015.

Canbriam Energy | Corporate presentation 5
The BC Montney has significant offset well density & peer activity Canbriam’s Altares is located in the northern extension of the prolific BC Montney
Fort St. John
Edmonton
Calgary Vancouver
Montney trend Petronas/Progress -Town
Canbriam - Altares
ARC - Dawson
Shell - Groundbirch
ECA - Swan
30 km Canbriam Energy
Shell
Progress/Petronas
ARC Resources
Encana
Murphy
CNRL
Painted Pony
Suncor
Black Swan
Brokers
Montney Wells
Crew
Pengrowth
BC deep drilling royalty credit
boundary
Spectra T North Pipeline
Unconventional Gas Resources

Canbriam Energy | Corporate presentation 6
Differentiated resource quality in the BC Montney Four key attributes that differentiate the Altares Montney
1. Over pressured reservoir
Up to 2 times over pressured within Main
Fault Block
2. Subsurface compartmentalization
Leads to distinct high pressure regions with
consistent well results
3. Significant thickness
Four commercial intervals
Average thickness is ~1,100 feet
~500 feet of high quality Upper Montney
4. Strong liquids component
2016E liquids yield: ~30 barrels per MMcf

63
109 65
311
414
962
660
1622
Proved developed Proved undeveloped Probable Additional Upper
Montney locations
Additional Lower
Montney locations
Total derisked
development
locations
Additional locations Total locations(1)
Canbriam Energy | Corporate presentation 7
Drilling inventory supports low-risk production growth Represents ~37 years of well inventory at current pace of development
Reserve bookings:
7 years of inventory at ~3 rig pace
+20 years of upside
drilling inventory
Source: Company data and McDaniel & Associates reserve report as of 12/31/15.
(1) Represent additional locations primarily located in South Altares, which require a higher natural gas price (NYMEX $4.80 - $5.00/MMbtu) to be economic with today’s
technology. We currently have no near term plans to drill in South Altares.
Liquids rich development locations:
~30 years of inventory at ~3 rig pace

0
5
10
15
20
25
30
35
40
45
MB
oe/
d
Production history (MBoe/d)
Natural gas (inlet separator)
Total liquids
Nameplate capacity (Boe/d)
Canbriam Energy | Corporate presentation 8
Stable production history with strong liquids content Canbriam’s production growth reflects addition of phases 1 & 2 of the Altares Processing Facility in 2015
Natural gas
Liquids
May 2012: Commissioned 50 MMcf/d b-24-H facility
Oct 2015: Phase 2 of Altares Processing Facility (80 MMcf/d)
Feb 2015: Phase 1 of Altares Processing Facility (80 MMcf/d )
0
2,000
4,000
6,000
8,000
10,000
12,000
14,000
16,000
18,000
20,000
22,000
24,000
26,000
28,000
30,000
0.0
1.0
2.0
3.0
4.0
5.0
6.0
7.0
8.0
9.0
10.0
11.0
12.0
13.0
14.0
15.0
Sh
ut-
in c
asi
ng
pre
ssu
re (k
Pa
)
Ga
s R
ate
(M
Mcf
/d
)
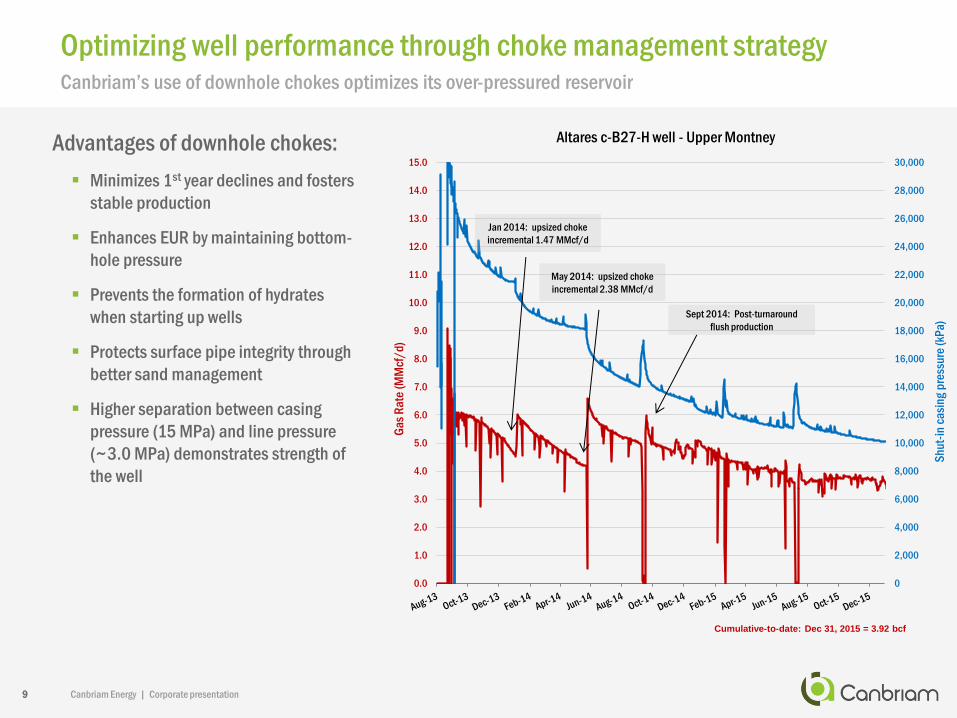
Altares c-B27-H well - Upper Montney
Jan 2014: upsized choke
incremental 1.47 MMcf/d
May 2014: upsized choke
incremental 2.38 MMcf/d
Sept 2014: Post-turnaround
flush production
Canbriam Energy | Corporate presentation 9
Optimizing well performance through choke management strategy Canbriam’s use of downhole chokes optimizes its over-pressured reservoir
Cumulative-to-date: Dec 31, 2015 = 3.92 bcf
Advantages of downhole chokes:
Minimizes 1st year declines and fosters
stable production
Enhances EUR by maintaining bottom-
hole pressure
Prevents the formation of hydrates
when starting up wells
Protects surface pipe integrity through
better sand management
Higher separation between casing
pressure (15 MPa) and line pressure
(~3.0 MPa) demonstrates strength of
the well

Canbriam Energy | Corporate presentation 10
12-month rate vs. cumulative production Canbriam’s Altares wells among highest deliverability in Northern BC Montney extension
Northern BC Montney extension
585 wells included in analysis with at least 12
months of production
Wells sorted based on rate in 12th month of
production rate (as a direct correlation to EUR)
Canbriam Altares development wells (Main Fault
Block) highlight benefits over-pressured nature
of reservoir & use of downhole chokes
Canbriam type curve
(Upper Montney)
Canbriam type curve
(Lower Montney)
0
1,000
2,000
3,000
4,000
5,000
6,000
7,000
8,000
9,000
10,000
0 500 1,000 1,500 2,000 2,500 3,000
Ra
te a
fte
r 1
2 M
on
ths
(mcf
/d
)
12 Month Cumulative Production (mmcf)
12 month cumulative production vs. rate
(as of December 2015)
Northern Montney wells
Canbriam (Altares Development Wells)
Source: Frac Dataset as of December 2015
Northern BC Montney extension

Canbriam Energy | Corporate presentation 11
Improving decline rates through choke management Maintenance capital requirement is $50-$60 million annually for 25,000 boe/d of production
0
5,000
10,000
15,000
20,000
Apr-13 Jul-13 Oct-13 Jan-14 Apr-14 Jul-14 Oct-14 Jan-15 Apr-15 Jul-15
bo
e/d
On production date
Production by well vintage
2015H1
2014
2013
2012
2009+2011
Exploratory
24% corporate
decline rate

Canbriam Energy | Corporate presentation 12
Infrastructure strategy supports large scale development Canbriam owns & operates all processing infrastructure
100% owned & operated infrastructure:
Altares Processing Facility consists of:
b-72-A gas processing & c-62-A water treatment & recycling hub
Natural gas processing facilities:
b-24-H: 50 MMcf/d shallow cut refrigeration facility online
b-72-A: 160 MMcf/d online; scalable to 400 MMcf/d nameplate
South Altares: 10 MMcf/d dehy & compression facility online
0
50
100
150
200
250
300
350
400
450
2013 2014 2015 2016
MM
cf/
d
Natural gas processing expansion
Potential future
expansion of
b-72-A to 400
MMcf/d
b-24-H: 50 MMcf/d current capacity
b-72-A phase 1: 80 MMcf/d online Feb 2015
b-72-A phase 2: 80 MMcf/d online Q3 2015
Phase 3: 120 MMcf/d
long lead items ordered
North Altares facilities
Canbriam Energy | Corporate presentation 13
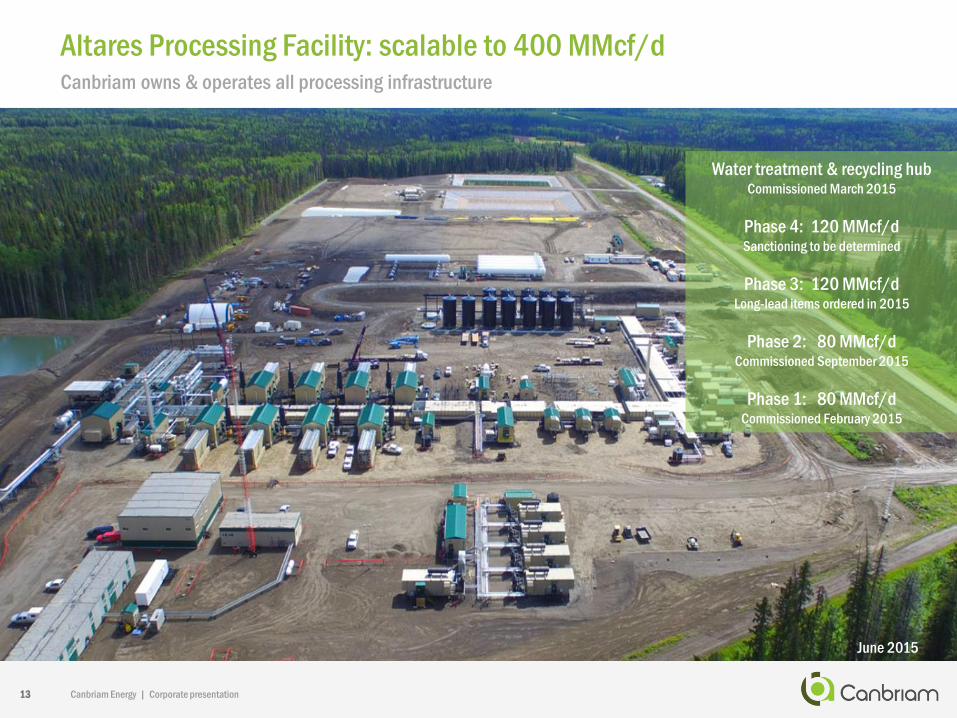
Altares Processing Facility: scalable to 400 MMcf/d Canbriam owns & operates all processing infrastructure
June 2015
Water treatment & recycling hub Commissioned March 2015
Phase 4: 120 MMcf/d Sanctioning to be determined
Phase 3: 120 MMcf/d Long-lead items ordered in 2015
Phase 2: 80 MMcf/d Commissioned September 2015
Phase 1: 80 MMcf/d Commissioned February 2015

Canbriam Energy | Corporate presentation 14
Marketing plan supports long term development Canbriam benefits from competitive royalties, supportive stakeholders and easily accessible infrastructure
Sufficient takeaway capacity:
Spectra T North: 209 MMcf/d firm capacity in early 2016
Actively mitigating unused firm capacity
Variable term, scalable with production growth
Future transportation options:
Spectra T North additional firm capacity
TCPL North Montney Mainline project
Liquids transportation currently by truck
Liquids pipeline take away solution in place for late 2017
Canbriam roads
Fort St. John
Station 2 – Spectra
Spectra T North
Gas transmission
Mile post 73 NGL
terminal
Taylor
condensate
terminal
Williston Lake
Liquids
transportation
NGLs
Canbriam water
pipeline
0
50
100
150
200
250
300
Jan-14 Jan-15 Jan-16 Jan-17 Jan-18
MMcf/d Canbriam’s firm transportation capacity
Current contracted firm capacity
Future potential firm
capacity

15
Improving cost structure to sustain profitability Canbriam’s low cost structure & robust hedge positions drive solid margins despite low commodity prices
$9.88
$3.62 $3.74 $2.31
$1.08 $0.95 $0.71 $0.45
$2.76
$3.23 $3.48 $4.17
$4.29 $2.82 $2.73 $2.15
$1.88
$2.04 $2.02 $1.93
$2.08 $2.53 $2.06
$2.17
$3.53
$4.28 $4.25 $4.72
$3.45
$2.27 $2.20
$1.44
$0.75
$0.63 $0.89
$4.89
$6.25
$5.00 $7.73
$5.40
$44.58
$39.24
$32.89
$26.65
$17.36 $18.75
$15.79
$11.74
$41.76
$36.48
$31.25
$36.45
$22.82 $23.80
$22.28
$18.34
$0
$5
$10
$15
$20
$25
$30
$35
$40
$45
$50
Q1 2014 Q2 2014 Q3 2014 Q4 2014 Q1 2015 Q2 2015 Q3 2015 Q4 2015
$/
bo
e
Canbriam cost structure vs. price realizations (2014 – 2015)
Royalties Operating Transportation G&A Interest Revenue Realized price (inc. hedging)
Canbriam Energy | Corporate presentation
Canbriam Energy | Corporate presentation 16
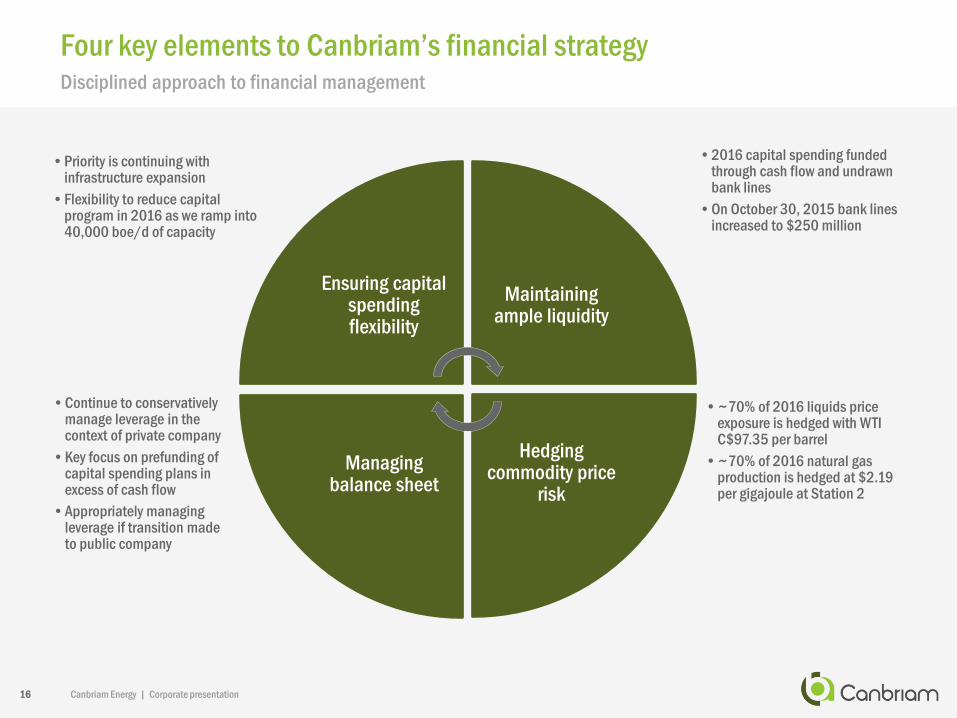
Four key elements to Canbriam’s financial strategy Disciplined approach to financial management
•~70% of 2016 liquids price exposure is hedged with WTI C$97.35 per barrel
•~70% of 2016 natural gas production is hedged at $2.19 per gigajoule at Station 2
•Continue to conservatively manage leverage in the context of private company
•Key focus on prefunding of capital spending plans in excess of cash flow
•Appropriately managing leverage if transition made to public company
•2016 capital spending funded through cash flow and undrawn bank lines
•On October 30, 2015 bank lines increased to $250 million
•Priority is continuing with infrastructure expansion
•Flexibility to reduce capital program in 2016 as we ramp into 40,000 boe/d of capacity
Ensuring capital spending flexibility
Maintaining ample liquidity
Hedging commodity price
risk
Managing balance sheet

Canbriam Energy | Corporate presentation 17
Hedge positions & composition of total liquids production Actively hedging commodity price risk through disciplined risk management
$97.35
$79.40
$0
$40
$80
$120
0
500
1,000
1,500
2,000
2,500
3,000
2016 2017
Liquids hedges (at March 14, 2016)
Volume hedged (bbls/d) WTI weighted average price (C$/bbl)
Q4 2015 2015 2014
Production Production (%) Revenue (%) Pricing
(% Edm Par) Production Production (%) Revenue (%)
Pricing
(% Edm Par) Production Production (%) Revenue (%)
Pricing
(% Edm Par)
Natural gas (MMcf/d) 117.1 85% 58% - 90.1 84% 64% - 46.9 81% 63% -
Condensate (bbl/d) 1,722 8% 30% 87% 1,341 7% 26% 93% 814 8% 23% 103%
Natural gas liquids(1) (bbl/d) 1,682 7% 12% 38% 1,543 9% 10% 31% 1,004 10% 14% 52%
Total (boe/d) 22,920 100% 100% 17,898 100% 100% 9,628 100% 100%
(1) Natural gas liquids include Pentanes plus production.
$2.19
$2.68
$2.47
0
20
40
60
80
100
120
2016 2017 2018
Natural gas hedges (at March 14, 2016)
Station 2 weighted average price (C$/Gj)

Canbriam Energy | Corporate presentation 18
Investing in Canbriam Energy A fully integrated, natural gas growth company with differentiated resource quality
• Prolific EUR/well with ~1,100’ of Montney vertical thickness on ~62,000 (50% liquids rich) net acres
• 199.3 MMboe of gross 1P Reserves (pre-tax PV10 of $1,319 million)(1)
• 361.3 MMboe of gross 2P Reserves (pre-tax PV10 of $2,322 million)(1)
• 100% working interest and operatorship in core lands
Prolific Montney resource
• 962 net locations in the Altares development area representing ~37 years of drilling inventory at a 3-rig pace
• Over pressured reservoir (up to 2x) and use of down-hole chokes limits declines and facilitates rapid growth
• High EURs in the primary Altares development area, with liquid yields between 30 - 40 bbls/MMcf
• Expected IRRs in the main fault block range from ~60% (Upper Montney, 2/3rd of inventory) to ~20% (Lower Montney)(2)
Large, low risk, high return drilling inventory
• Canbriam’s success tied to early quality differentiation within Altares region
• Processing facilities are 100% owned & operated; scalable infrastructure supports efficient development
• Team approach fosters culture of collaboration, safety & high performance
• Prudent approach to financial management supports solid financial position
Integrated development strategy
• Profitable in current Station 2 pricing environment of ~$1.75 per Gj
• 100%-owned gathering and processing facilities support controlled development pace
• Long term access to water: 20 year permit to withdraw 10,000 m3 per day from Williston Lake
• Favorable regulatory regime, scalable firm marketing arrangements & close proximity to gas sales pipeline
Low cost structure supports profitable growth
• Management team averages 25+ years of industry experience with prominent E&P companies
• Team was built specifically to be able to find and develop differentiated areas within unconventional fairways
• Experienced E&P sponsors including Warburg Pincus, ARC, OTPP, GE and BlackRock
Experienced management with strong sponsorship
(1) Based on McDaniel & Associates reserves report as of December 31, 2015.
(2) Pricing assumptions: US$2.50/MMbtu NYMEX; US$45.00/bbl WTI; 0.73 US$/C$ exchange rate.

©Copyright 2015 Canbriam Energy Inc. All rights reserved.
Canbriam Energy Inc.
3500, 450 1st Street SW
Calgary, AB Canada T2P 5H1
Tel: 403.269.2874
www.canbriam.com
Paul Myers
President & Chief Executive Officer
403.718.8550
Rob Froese
Chief Financial Officer
403.718.3601
Bill Stait
Director, Investor Relations
403.718.8564