Embed Size (px)
Citation preview

---------------------------Capstone Project
-------------Highway Crash
Prediction---------------------------
Alfredo Escriba
Project Presentation
March 33th 2017
Crash RiskMediumHigh
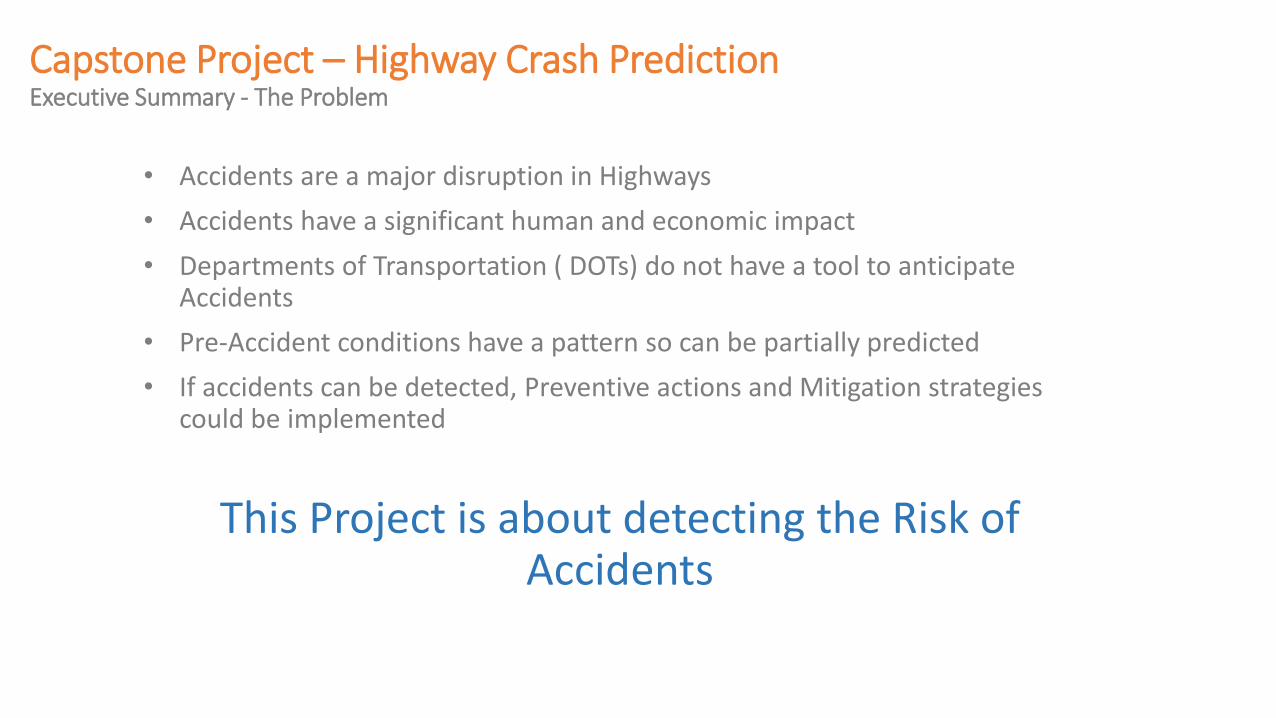
Capstone Project – Highway Crash PredictionExecutive Summary - The Problem
• Accidents are a major disruption in Highways
• Accidents have a significant human and economic impact
• Departments of Transportation ( DOTs) do not have a tool to anticipate Accidents
• Pre-Accident conditions have a pattern so can be partially predicted
• If accidents can be detected, Preventive actions and Mitigation strategies could be implemented
This Project is about detecting the Risk of Accidents

Capstone Project – Highway Crash PredictionExecutive Summary – Previous research & Focus
• Previous papers have reached up to 60% accident prediction• Very controlled and favorable data sets
• Not reality of a Traffic Operations Center ( TOC )
• Never got implemented at TOC
• Project has been done • With real traffic data “as is”
• With a focus on usability at Traffic Operations Center ( TOC )
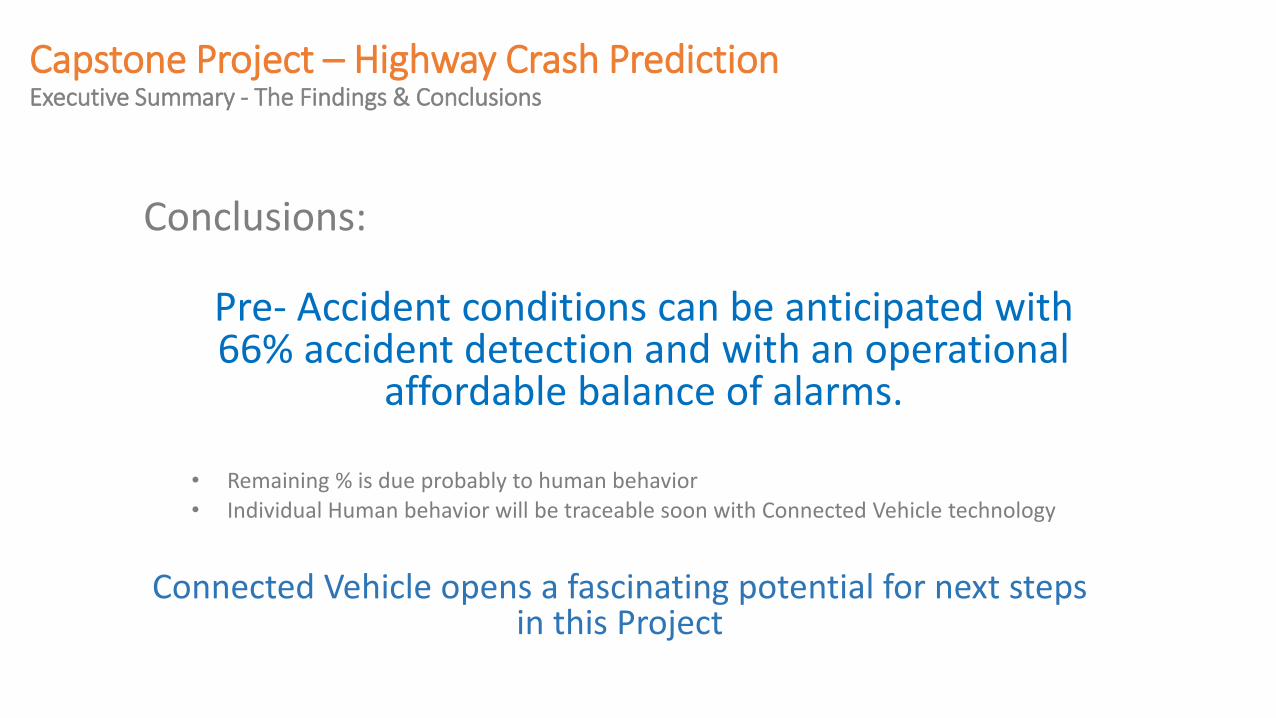
Capstone Project – Highway Crash PredictionExecutive Summary - The Findings & Conclusions
Conclusions:
Pre- Accident conditions can be anticipated with 66% accident detection and with an operational
affordable balance of alarms.
• Remaining % is due probably to human behavior• Individual Human behavior will be traceable soon with Connected Vehicle technology
Connected Vehicle opens a fascinating potential for next steps in this Project

Capstone Project – Highway Crash PredictionExecutive Summary – The project
• What• A Heat Map of Risk of Accident
• Where• 16 Miles of highway
• 18 to 46 different segments of study
• Both directions
• When • Data available for 2012 to 2015
• 1,209 crashes
Accident Density
# Vehicles
Vehicles per Hour
Speed
Occupancy
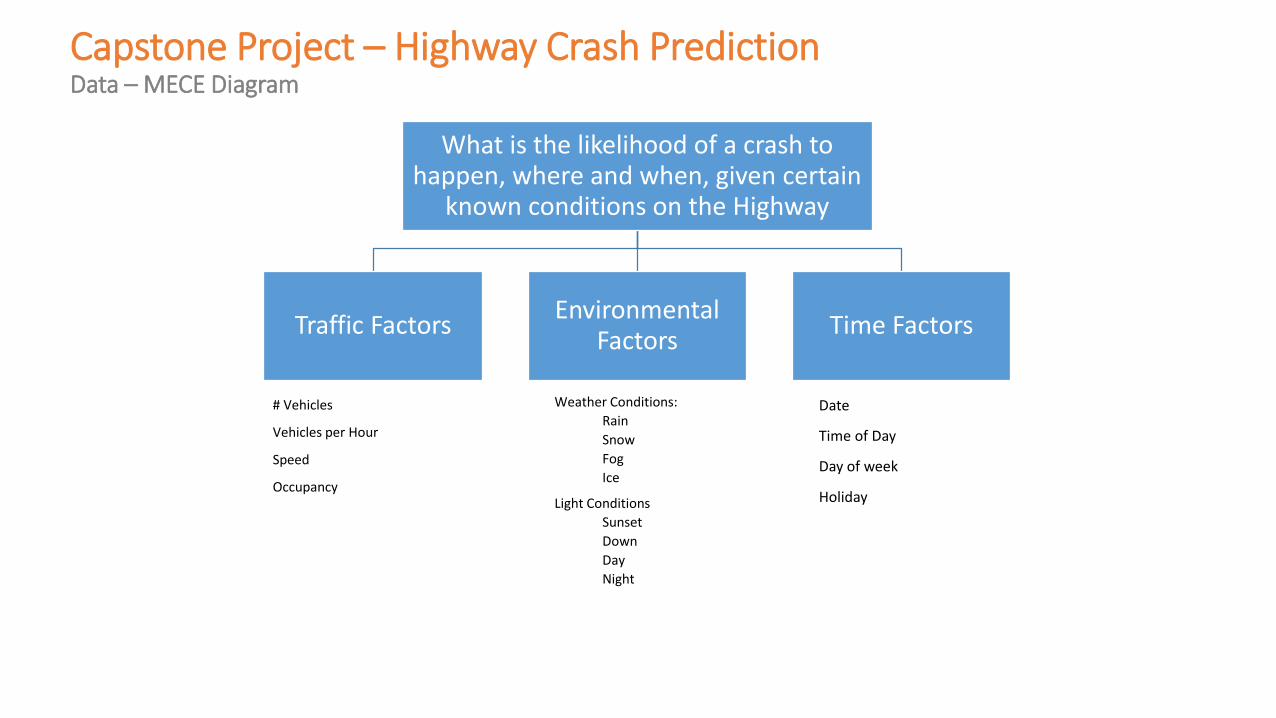
What is the likelihood of a crash to happen, where and when, given certain
known conditions on the Highway
Traffic FactorsEnvironmental
FactorsTime Factors
Weather Conditions:
Rain
Snow
Fog
Ice
Light Conditions
Sunset
Down
Day
Night
Date
Time of Day
Day of week
Holiday
Capstone Project – Highway Crash PredictionData – MECE Diagram
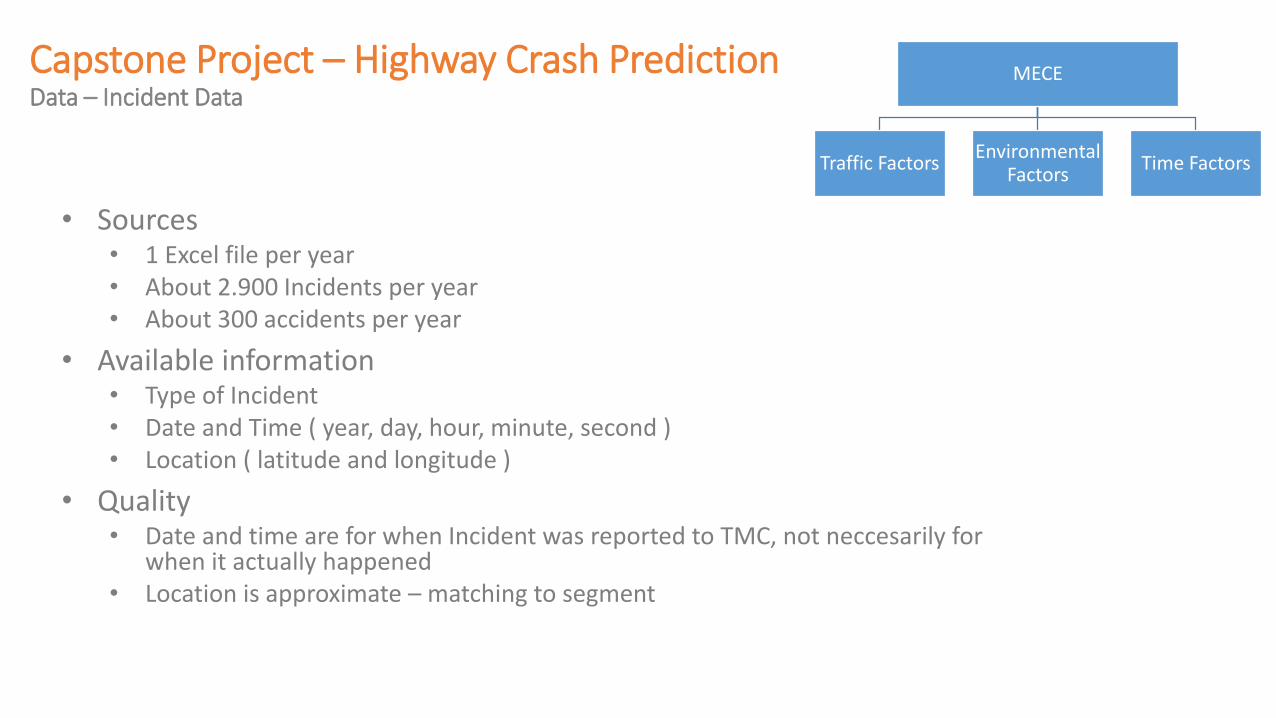
Capstone Project – Highway Crash PredictionData – Incident Data
• Sources• 1 Excel file per year• About 2.900 Incidents per year• About 300 accidents per year
• Available information• Type of Incident• Date and Time ( year, day, hour, minute, second )• Location ( latitude and longitude )
• Quality• Date and time are for when Incident was reported to TMC, not neccesarily for
when it actually happened• Location is approximate – matching to segment
MECE
Traffic FactorsEnvironmental
FactorsTime Factors
Capstone Project – Highway Crash PredictionData – Traffic Data
• Sources:• Detector Data – Advanced Transportation Management System• Probe Data
• Detector Data – 3.3 Mill observations / 18 files• Traditional traffic detector devices • 2012 to 2015• 5 minute interval x 18 segments• Speed, Count, Occupancy• Available per Lane• Good quality when it exists
• Probe Data – 12.8 Mill observations / 1 file• GPS probed data• 2012 to 2014• 5 minute interval x 46 segments• Only Speed• Consistent availability from 2012 to 2014. Good quality ( “it is commercialized”)
MECE
Traffic FactorsEnvironmental
FactorsTime Factors

Capstone Project – Highway Crash PredictionData – Other Data
• Weather Data• Sources:
• National Weather Service
• 1 file per month x 48 months
• Available in 1 hour intervals
• Hourly Precipitation, Rain, Fog, Snow and Ice
• Light conditions• Built based on sunset and down along the year
• Type of Day• Built based on calendar
MECE
Traffic FactorsEnvironmental
FactorsTime Factors
Capstone Project – Highway Crash PredictionData – Working with the data
• Main challenges• New to data management – “SAS intensive learning”
• Cleansing data, merging files
• Cleansing data is Time consuming
• Work with uncomplete data sets ( missing dates, missing records )
• Lessons learned• Structure properly data coding – macros / functions / coding in general
• Structure properly data integrity review process
MECE
Traffic FactorsEnvironmental
FactorsTime Factors
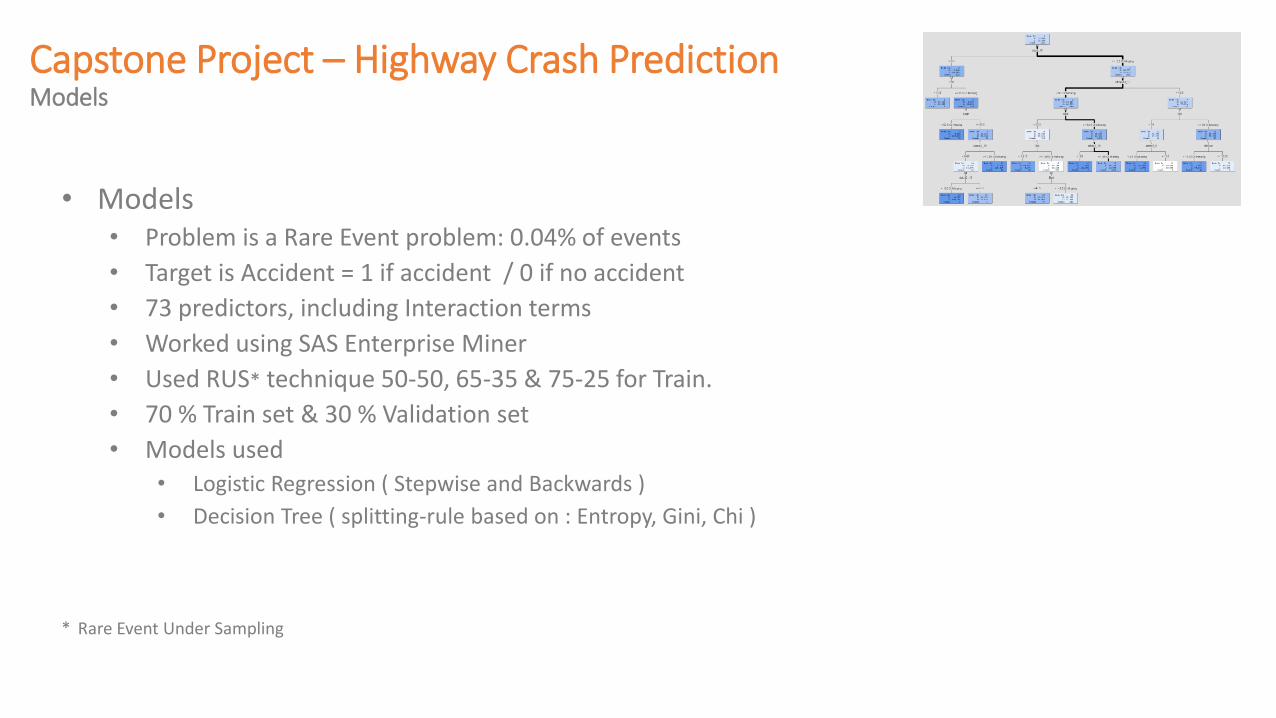
Capstone Project – Highway Crash PredictionModels
• Models• Problem is a Rare Event problem: 0.04% of events
• Target is Accident = 1 if accident / 0 if no accident
• 73 predictors, including Interaction terms
• Worked using SAS Enterprise Miner
• Used RUS* technique 50-50, 65-35 & 75-25 for Train.
• 70 % Train set & 30 % Validation set
• Models used• Logistic Regression ( Stepwise and Backwards )
• Decision Tree ( splitting-rule based on : Entropy, Gini, Chi )
* Rare Event Under Sampling
Capstone Project – Highway Crash PredictionModels
• Models
Next pages show illustration of the results of different models run and what it would look like in the TOC
06 January 2014 – 4 accidents
A busy day in the TOC …
Capstone Project – Highway Crash PredictionModels
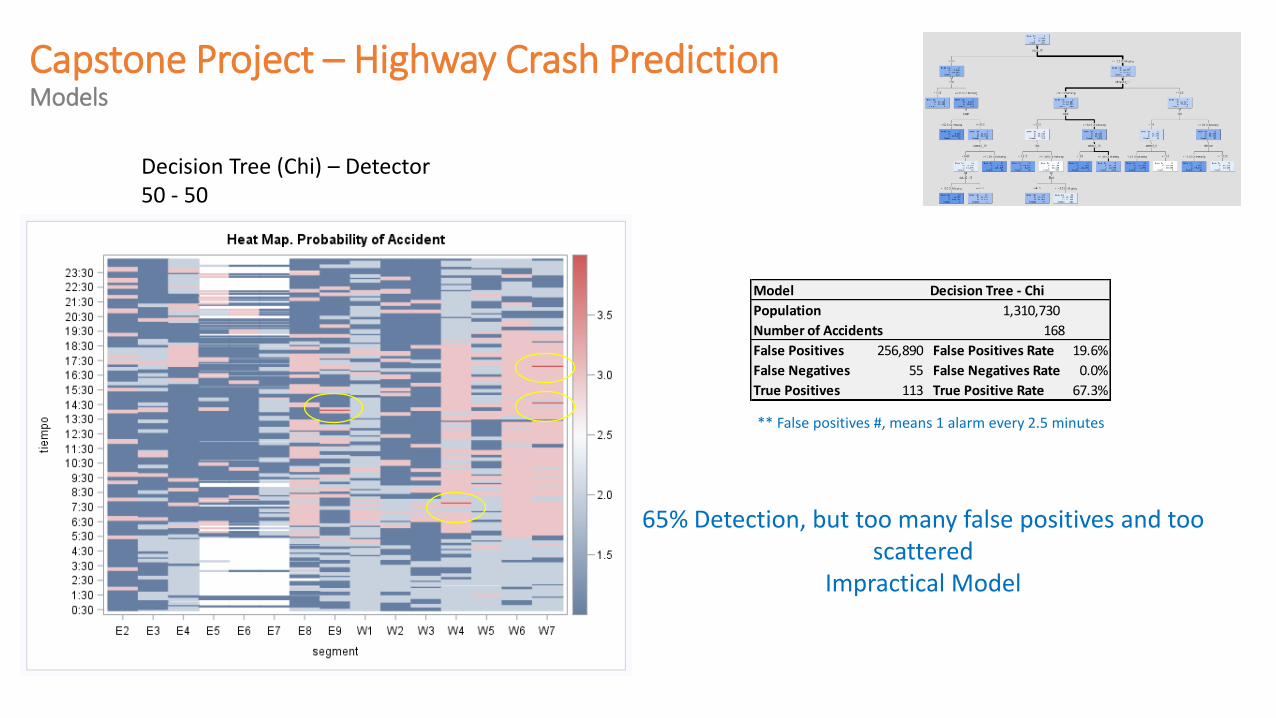
Decision Tree (Chi) – Detector50 - 50
65% Detection, but too many false positives and too scattered
Impractical Model
Model Decision Tree - Chi
Population 1,310,730
Number of Accidents 168
False Positives 256,890 False Positives Rate 19.6%
False Negatives 55 False Negatives Rate 0.0%
True Positives 113 True Positive Rate 67.3%
** False positives #, means 1 alarm every 2.5 minutes

Capstone Project – Highway Crash PredictionModels
Decision Tree Entropy – Probe65 - 35
54% Detection, but still more than $300 K false positivesImpractical Model
Model Decision Tree - Enthropy
Population 3,840,683
Number of Accidents 197
False Positives 323,082 False Positives Rate 8.4%
False Negatives 90 False Negatives Rate 0.0%
True Positives 107 True Positive Rate 54.3%
** False positives #, means 1 alarm every 2 minutes

Capstone Project – Highway Crash PredictionModels
Decision Tree ( Chi ) – Detector65 - 35
59% Detection and affordable 11% of False alarms
Model Decision Tree - Chi
Population 1,310,730
Number of Accidents 168
False Positives 151,383 False Positives Rate 11.5%
False Negatives 69 False Negatives Rate 0.0%
True Positives 99 True Positive Rate 58.9%
** False positives #, means 1 alarm every 4 minutes

Detection but 24% of alarms ( 2 alarms every 5 minutes )
Capstone Project – Highway Crash PredictionModels
73%
Using High and Medium Risk (50%)
Thresholds
Decision Tree ( Chi ) – Detector65 - 35
Model Decision Tree - Chi
Population 1,310,730
Number of Accidents 168
False Positives 151,383 False Positives Rate 11.5%
False Negatives 69 False Negatives Rate 0.0%
True Positives 99 True Positive Rate 58.9%
No Accident Accident Total %
High Risk 424,863 245 425,108 10%
Medium Risk 597,391 155 597,546 14%
Low Risk 3,346,684 147 3,346,831 77%
Total 4,368,938 547 4,369,485
Accidents Anticipated 400 73%
Accidents Not Anticipated 147 27%
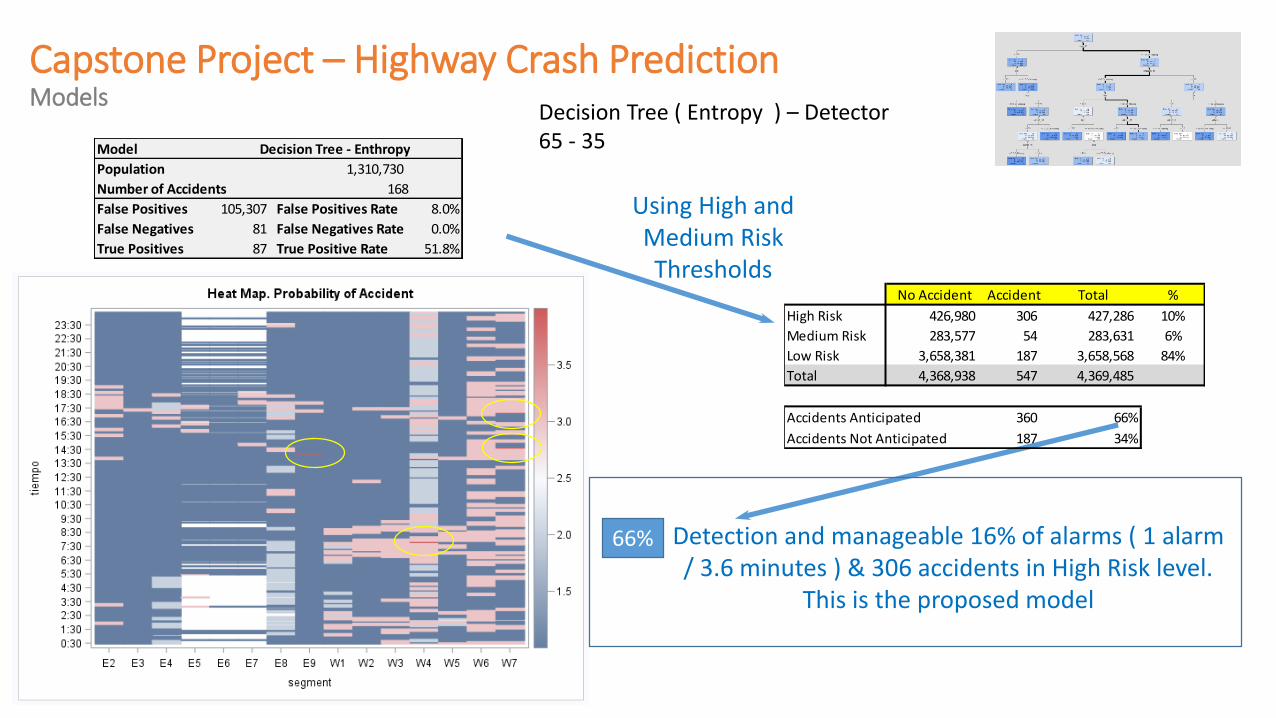
Capstone Project – Highway Crash PredictionModels
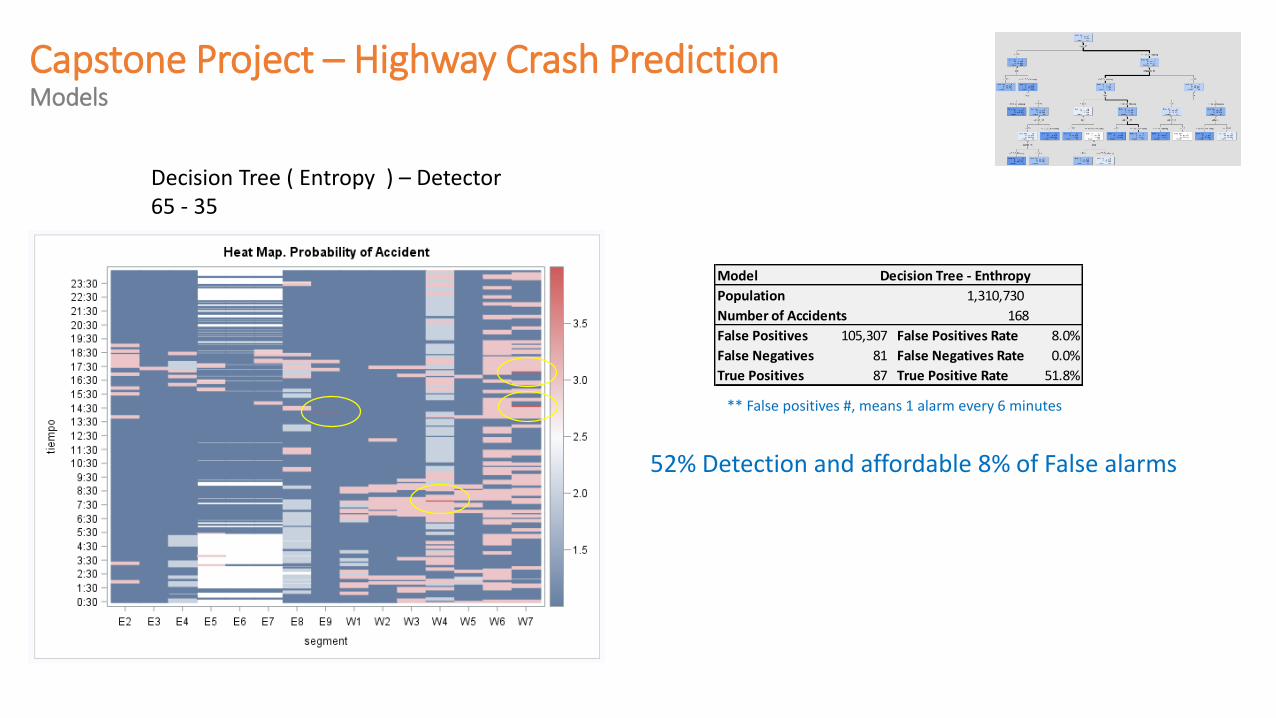
Decision Tree ( Entropy ) – Detector65 - 35
52% Detection and affordable 8% of False alarms
Model Decision Tree - Enthropy
Population 1,310,730
Number of Accidents 168
False Positives 105,307 False Positives Rate 8.0%
False Negatives 81 False Negatives Rate 0.0%
True Positives 87 True Positive Rate 51.8%
** False positives #, means 1 alarm every 6 minutes
Capstone Project – Highway Crash PredictionModels
66% Detection and manageable 16% of alarms ( 1 alarm / 3.6 minutes ) & 306 accidents in High Risk level.
This is the proposed model
Using High and Medium Risk Thresholds
Decision Tree ( Entropy ) – Detector65 - 35Model Decision Tree - Enthropy
Population 1,310,730
Number of Accidents 168
False Positives 105,307 False Positives Rate 8.0%
False Negatives 81 False Negatives Rate 0.0%
True Positives 87 True Positive Rate 51.8%
No Accident Accident Total %
High Risk 426,980 306 427,286 10%
Medium Risk 283,577 54 283,631 6%
Low Risk 3,658,381 187 3,658,568 84%
Total 4,368,938 547 4,369,485
Accidents Anticipated 360 66%
Accidents Not Anticipated 187 34%
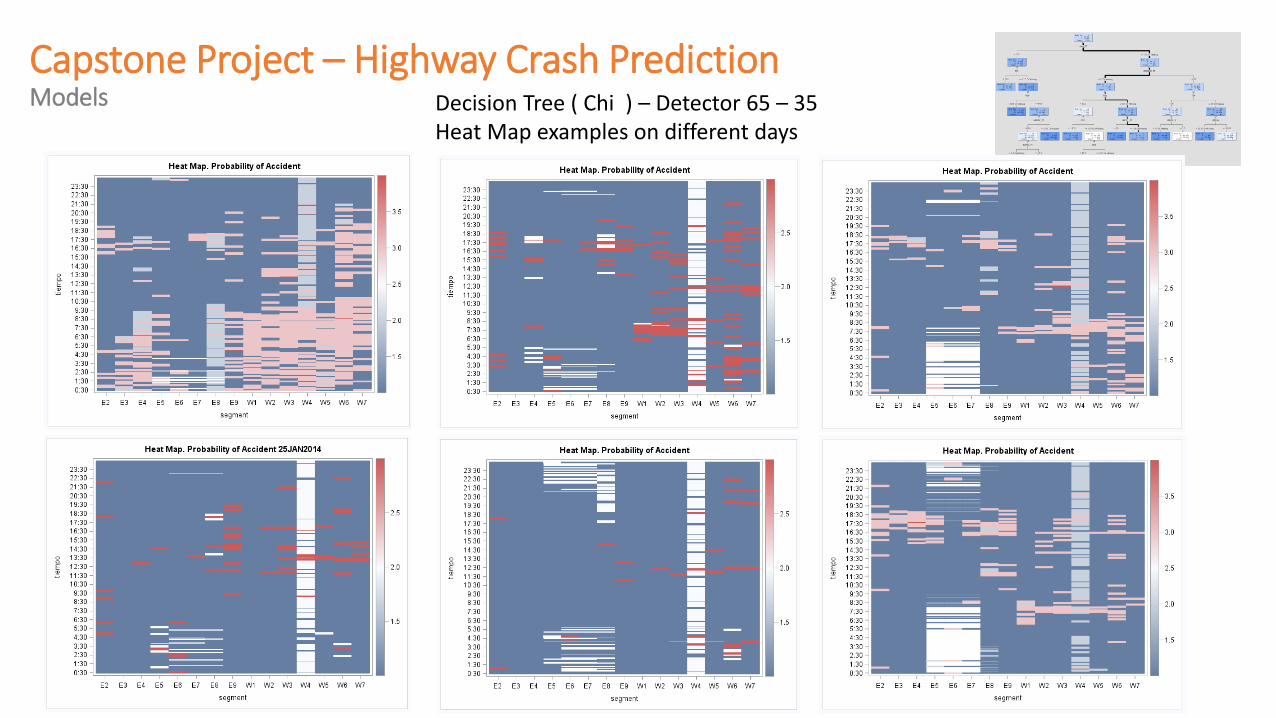
Capstone Project – Highway Crash PredictionModels Decision Tree ( Chi ) – Detector 65 – 35
Heat Map examples on different days
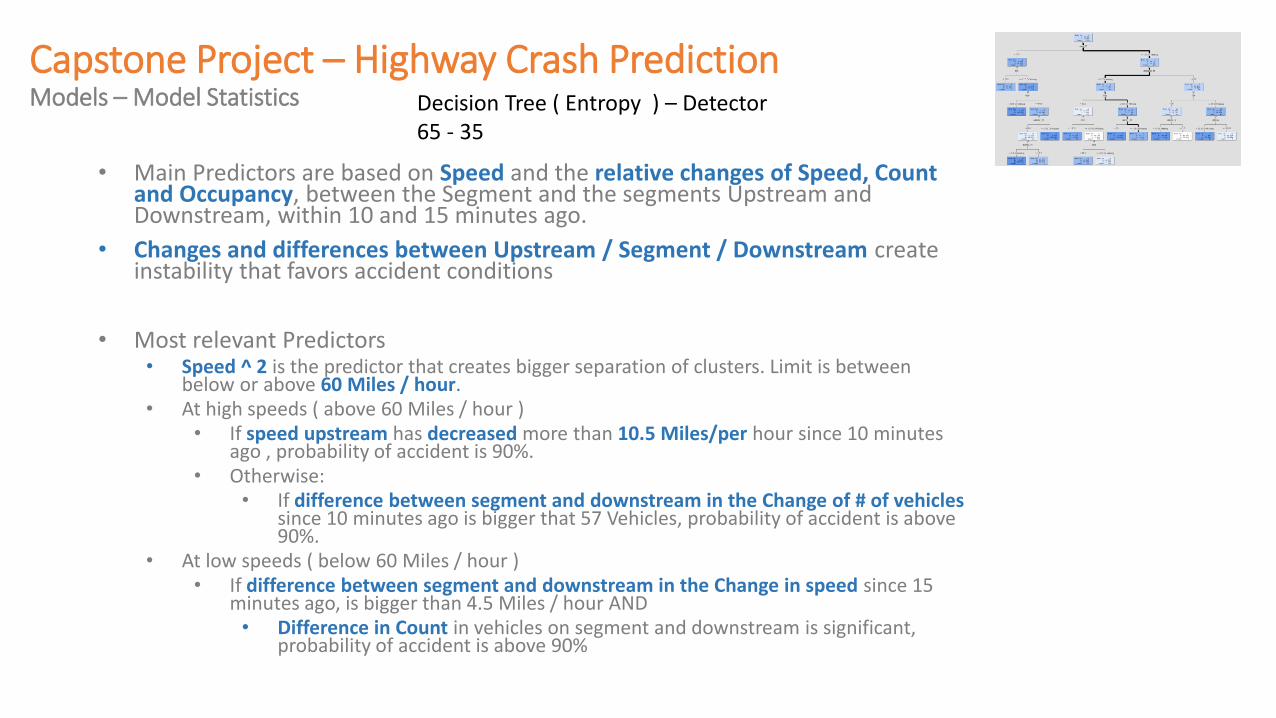
Capstone Project – Highway Crash PredictionModels – Model Statistics
• Main Predictors are based on Speed and the relative changes of Speed, Count and Occupancy, between the Segment and the segments Upstream and Downstream, within 10 and 15 minutes ago.
• Changes and differences between Upstream / Segment / Downstream create instability that favors accident conditions
• Most relevant Predictors• Speed ^ 2 is the predictor that creates bigger separation of clusters. Limit is between
below or above 60 Miles / hour.• At high speeds ( above 60 Miles / hour )
• If speed upstream has decreased more than 10.5 Miles/per hour since 10 minutes ago , probability of accident is 90%.
• Otherwise:• If difference between segment and downstream in the Change of # of vehicles
since 10 minutes ago is bigger that 57 Vehicles, probability of accident is above 90%.
• At low speeds ( below 60 Miles / hour )• If difference between segment and downstream in the Change in speed since 15
minutes ago, is bigger than 4.5 Miles / hour AND• Difference in Count in vehicles on segment and downstream is significant,
probability of accident is above 90%
Decision Tree ( Entropy ) – Detector65 - 35
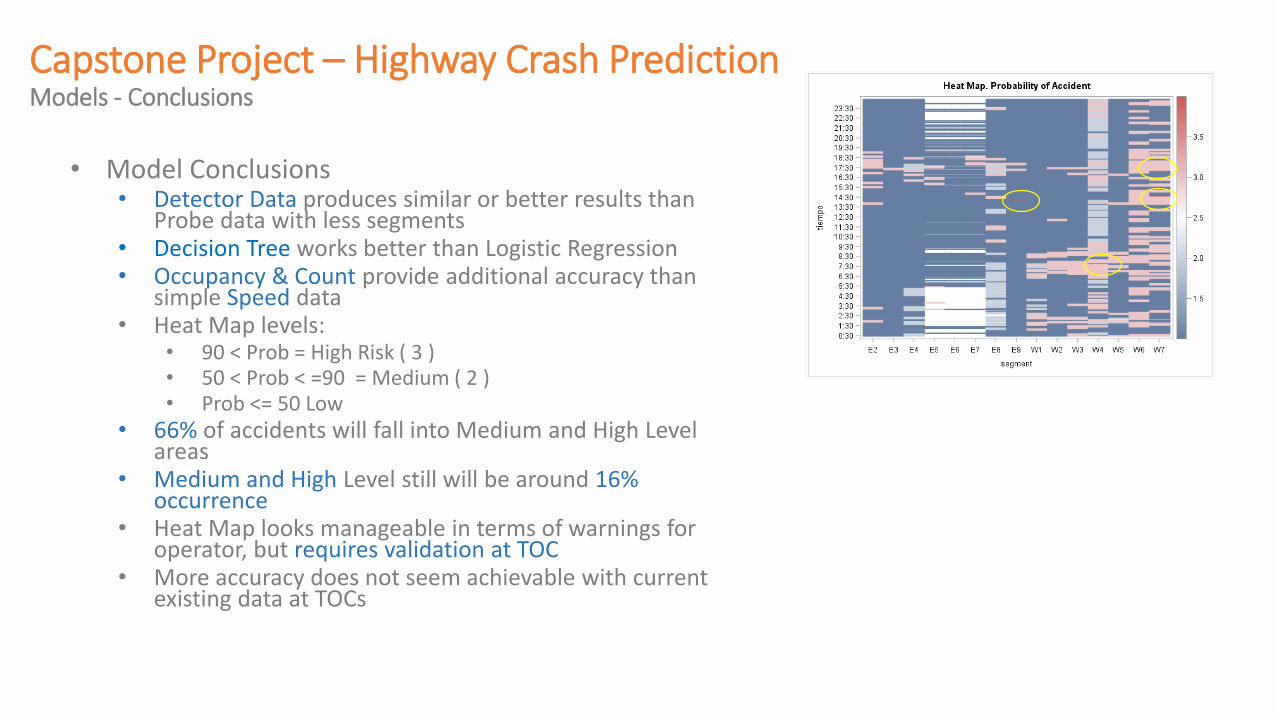
Capstone Project – Highway Crash PredictionModels - Conclusions
• Model Conclusions• Detector Data produces similar or better results than
Probe data with less segments• Decision Tree works better than Logistic Regression• Occupancy & Count provide additional accuracy than
simple Speed data • Heat Map levels:
• 90 < Prob = High Risk ( 3 )• 50 < Prob < =90 = Medium ( 2 )• Prob <= 50 Low
• 66% of accidents will fall into Medium and High Level areas
• Medium and High Level still will be around 16% occurrence
• Heat Map looks manageable in terms of warnings for operator, but requires validation at TOC
• More accuracy does not seem achievable with current existing data at TOCs
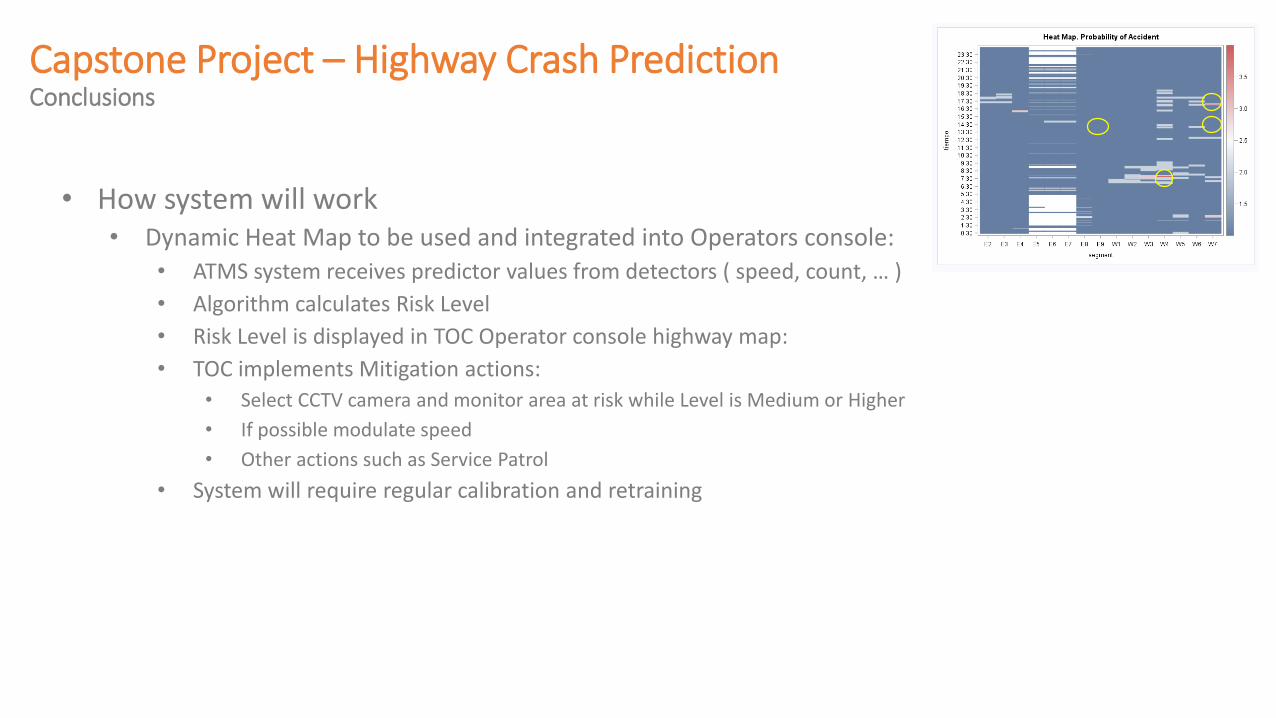
Capstone Project – Highway Crash PredictionConclusions
• How system will work• Dynamic Heat Map to be used and integrated into Operators console:
• ATMS system receives predictor values from detectors ( speed, count, … )
• Algorithm calculates Risk Level
• Risk Level is displayed in TOC Operator console highway map:
• TOC implements Mitigation actions:
• Select CCTV camera and monitor area at risk while Level is Medium or Higher
• If possible modulate speed
• Other actions such as Service Patrol
• System will require regular calibration and retraining
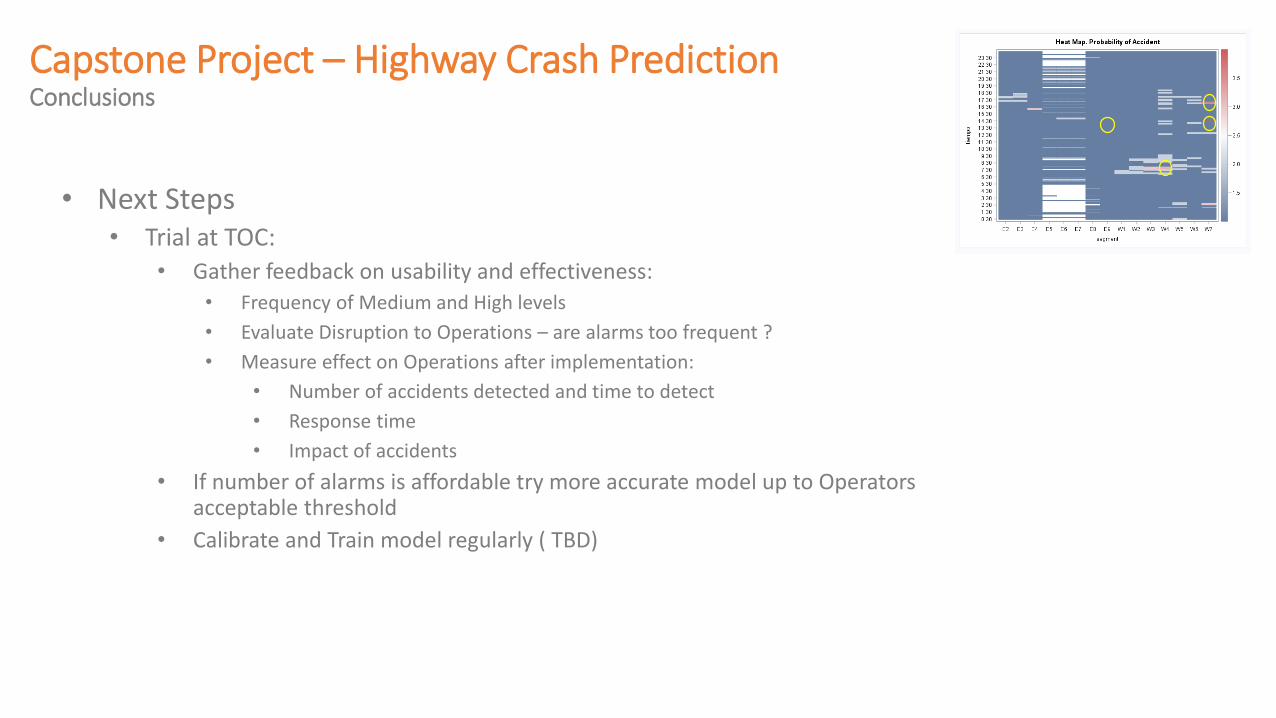
Capstone Project – Highway Crash PredictionConclusions
• Next Steps• Trial at TOC:
• Gather feedback on usability and effectiveness:
• Frequency of Medium and High levels
• Evaluate Disruption to Operations – are alarms too frequent ?
• Measure effect on Operations after implementation:
• Number of accidents detected and time to detect
• Response time
• Impact of accidents
• If number of alarms is affordable try more accurate model up to Operators acceptable threshold
• Calibrate and Train model regularly ( TBD)
Capstone Project – Highway Crash PredictionImpact
• Challenges & Insights• Working alone & not a Data guy & not a programmer• Data preparation and cleansing• Co-existence with day to day business• Traffic conditions + Human behavior have a big % of Accidents cause .
• Real Impact at work • TBD once trials have occurred at TOC.
• Estimated value• TBD : )
• Impact of the Program• Tremendous !!
• Professional development• Now I know what this is about. I have touched it !• 100% of the 78 Smart City proposals included a mention to Data Analytics

---------------------------Capstone Project
-------------Highway Crash
Prediction---------------------------
Appendix
Crash RiskMediumHigh
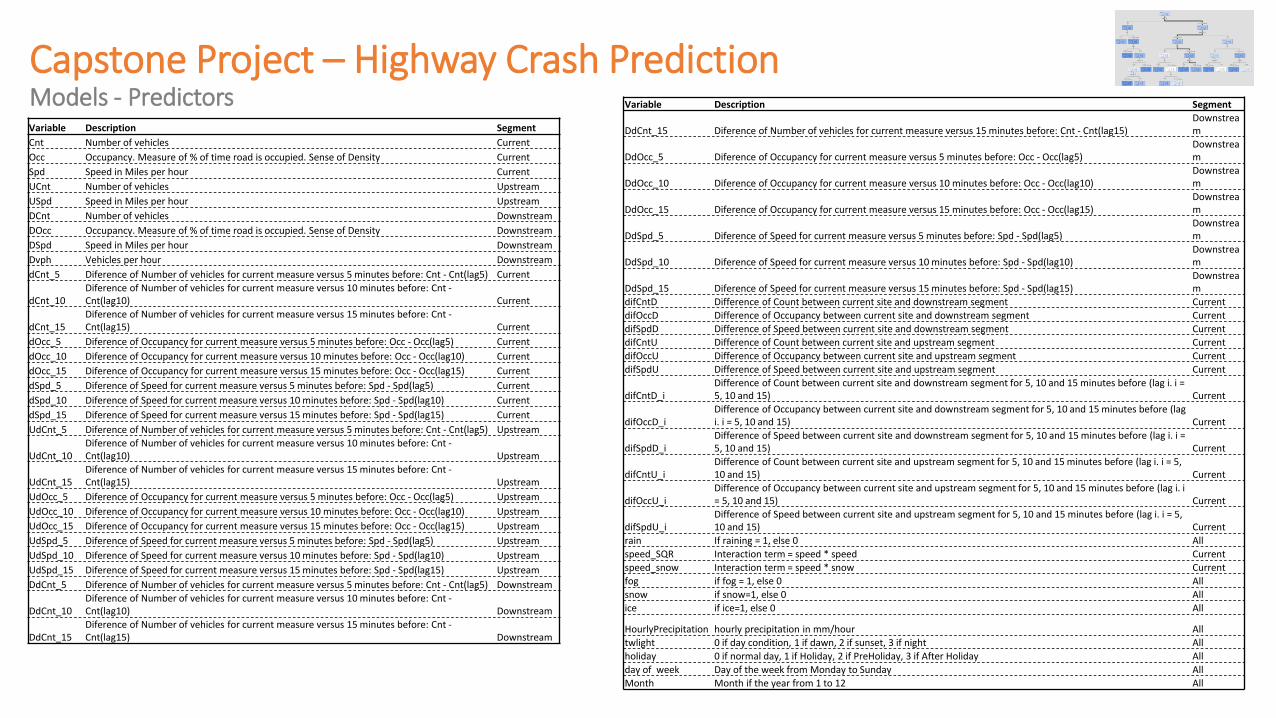
Capstone Project – Highway Crash PredictionModels - PredictorsVariable Description Segment
Cnt Number of vehicles Current
Occ Occupancy. Measure of % of time road is occupied. Sense of Density Current
Spd Speed in Miles per hour Current
UCnt Number of vehicles Upstream
USpd Speed in Miles per hour Upstream
DCnt Number of vehicles Downstream
DOcc Occupancy. Measure of % of time road is occupied. Sense of Density Downstream
DSpd Speed in Miles per hour Downstream
Dvph Vehicles per hour Downstream
dCnt_5 Diference of Number of vehicles for current measure versus 5 minutes before: Cnt - Cnt(lag5) Current
dCnt_10Diference of Number of vehicles for current measure versus 10 minutes before: Cnt -Cnt(lag10) Current
dCnt_15Diference of Number of vehicles for current measure versus 15 minutes before: Cnt -Cnt(lag15) Current
dOcc_5 Diference of Occupancy for current measure versus 5 minutes before: Occ - Occ(lag5) Current
dOcc_10 Diference of Occupancy for current measure versus 10 minutes before: Occ - Occ(lag10) Current
dOcc_15 Diference of Occupancy for current measure versus 15 minutes before: Occ - Occ(lag15) Current
dSpd_5 Diference of Speed for current measure versus 5 minutes before: Spd - Spd(lag5) Current
dSpd_10 Diference of Speed for current measure versus 10 minutes before: Spd - Spd(lag10) Current
dSpd_15 Diference of Speed for current measure versus 15 minutes before: Spd - Spd(lag15) Current
UdCnt_5 Diference of Number of vehicles for current measure versus 5 minutes before: Cnt - Cnt(lag5) Upstream
UdCnt_10Diference of Number of vehicles for current measure versus 10 minutes before: Cnt -Cnt(lag10) Upstream
UdCnt_15Diference of Number of vehicles for current measure versus 15 minutes before: Cnt -Cnt(lag15) Upstream
UdOcc_5 Diference of Occupancy for current measure versus 5 minutes before: Occ - Occ(lag5) Upstream
UdOcc_10 Diference of Occupancy for current measure versus 10 minutes before: Occ - Occ(lag10) Upstream
UdOcc_15 Diference of Occupancy for current measure versus 15 minutes before: Occ - Occ(lag15) Upstream
UdSpd_5 Diference of Speed for current measure versus 5 minutes before: Spd - Spd(lag5) Upstream
UdSpd_10 Diference of Speed for current measure versus 10 minutes before: Spd - Spd(lag10) Upstream
UdSpd_15 Diference of Speed for current measure versus 15 minutes before: Spd - Spd(lag15) Upstream
DdCnt_5 Diference of Number of vehicles for current measure versus 5 minutes before: Cnt - Cnt(lag5) Downstream
DdCnt_10Diference of Number of vehicles for current measure versus 10 minutes before: Cnt -Cnt(lag10) Downstream
DdCnt_15Diference of Number of vehicles for current measure versus 15 minutes before: Cnt -Cnt(lag15) Downstream
Variable Description Segment
DdCnt_15 Diference of Number of vehicles for current measure versus 15 minutes before: Cnt - Cnt(lag15)Downstream
DdOcc_5 Diference of Occupancy for current measure versus 5 minutes before: Occ - Occ(lag5)Downstream
DdOcc_10 Diference of Occupancy for current measure versus 10 minutes before: Occ - Occ(lag10)Downstream
DdOcc_15 Diference of Occupancy for current measure versus 15 minutes before: Occ - Occ(lag15)Downstream
DdSpd_5 Diference of Speed for current measure versus 5 minutes before: Spd - Spd(lag5)Downstream
DdSpd_10 Diference of Speed for current measure versus 10 minutes before: Spd - Spd(lag10)Downstream
DdSpd_15 Diference of Speed for current measure versus 15 minutes before: Spd - Spd(lag15)Downstream
difCntD Difference of Count between current site and downstream segment Current
difOccD Difference of Occupancy between current site and downstream segment Current
difSpdD Difference of Speed between current site and downstream segment Current
difCntU Difference of Count between current site and upstream segment Current
difOccU Difference of Occupancy between current site and upstream segment Current
difSpdU Difference of Speed between current site and upstream segment Current
difCntD_iDifference of Count between current site and downstream segment for 5, 10 and 15 minutes before (lag i. i = 5, 10 and 15) Current
difOccD_iDifference of Occupancy between current site and downstream segment for 5, 10 and 15 minutes before (lag i. i = 5, 10 and 15) Current
difSpdD_iDifference of Speed between current site and downstream segment for 5, 10 and 15 minutes before (lag i. i = 5, 10 and 15) Current
difCntU_iDifference of Count between current site and upstream segment for 5, 10 and 15 minutes before (lag i. i = 5, 10 and 15) Current
difOccU_iDifference of Occupancy between current site and upstream segment for 5, 10 and 15 minutes before (lag i. i = 5, 10 and 15) Current
difSpdU_iDifference of Speed between current site and upstream segment for 5, 10 and 15 minutes before (lag i. i = 5, 10 and 15) Current
rain If raining = 1, else 0 All
speed_SQR Interaction term = speed * speed Current
speed_snow Interaction term = speed * snow Current
fog if fog = 1, else 0 All
snow if snow=1, else 0 All
ice if ice=1, else 0 All
HourlyPrecipitation hourly precipitation in mm/hour All
twlight 0 if day condition, 1 if dawn, 2 if sunset, 3 if night All
holiday 0 if normal day, 1 if Holiday, 2 if PreHoliday, 3 if After Holiday All
day of week Day of the week from Monday to Sunday All
Month Month if the year from 1 to 12 All

Capstone Project – Highway Crash PredictionModels – Predictors. Multicolinearity
• High Correlations between Lane data and Segment data. Lane data was dropped
• Almost Perfect Correlation between Vehicles per hour and Count. VPH was dropped
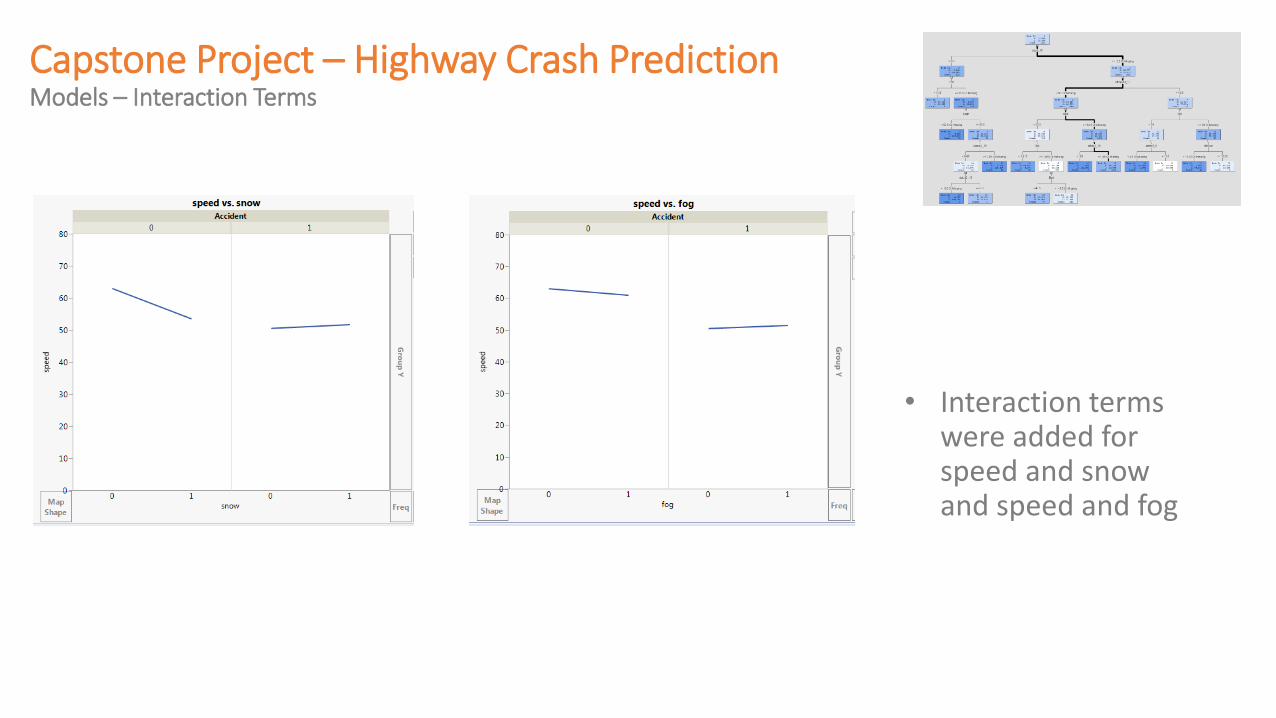
Capstone Project – Highway Crash PredictionModels – Interaction Terms
• Interaction terms were added for speed and snow and speed and fog

Capstone Project – Highway Crash PredictionModels – Quadratic terms
Variance change vs Event
• Quadratic terms were added for Speed on segment, Upstream and Downstream

Capstone Project – Highway Crash PredictionData – Speed profiles
40
45
50
55
60
65
70
12
:05
AM
12
:30
AM
12
:55
AM
1:2
0 A
M
1:4
5 A
M
2:1
0 A
M
2:3
5 A
M
3:0
0 A
M
3:2
5 A
M
3:5
0 A
M
4:1
5 A
M
4:4
0 A
M
5:0
5 A
M
5:3
0 A
M
5:5
5 A
M
6:2
0 A
M
6:4
5 A
M
7:1
0 A
M
7:3
5 A
M
8:0
0 A
M
8:2
5 A
M
8:5
0 A
M
9:1
5 A
M
9:4
0 A
M
10
:05
AM
10
:30
AM
10
:55
AM
11
:20
AM
11
:45
AM
12
:10
PM
12
:35
PM
1:0
0 P
M
1:2
5 P
M
1:5
0 P
M
2:1
5 P
M
2:4
0 P
M
3:0
5 P
M
3:3
0 P
M
3:5
5 P
M
4:2
0 P
M
4:4
5 P
M
5:1
0 P
M
5:3
5 P
M
6:0
0 P
M
6:2
5 P
M
6:5
0 P
M
7:1
5 P
M
7:4
0 P
M
8:0
5 P
M
8:3
0 P
M
8:5
5 P
M
9:2
0 P
M
9:4
5 P
M
10
:10
PM
10
:35
PM
11
:00
PM
11
:25
PM
11
:50
PM
Speed vs Hour by Day of the Week
Sunday Monday Tuesday Wednesday Thursday Friday Saturday Avg

Capstone Project – Highway Crash PredictionData – Speed profiles
40
45
50
55
60
65
70
12
:05
AM
12
:30
AM
12
:55
AM
1:2
0 A
M
1:4
5 A
M
2:1
0 A
M
2:3
5 A
M
3:0
0 A
M
3:2
5 A
M
3:5
0 A
M
4:1
5 A
M
4:4
0 A
M
5:0
5 A
M
5:3
0 A
M
5:5
5 A
M
6:2
0 A
M
6:4
5 A
M
7:1
0 A
M
7:3
5 A
M
8:0
0 A
M
8:2
5 A
M
8:5
0 A
M
9:1
5 A
M
9:4
0 A
M
10
:05
AM
10
:30
AM
10
:55
AM
11
:20
AM
11
:45
AM
12
:10
PM
12
:35
PM
1:0
0 P
M
1:2
5 P
M
1:5
0 P
M
2:1
5 P
M
2:4
0 P
M
3:0
5 P
M
3:3
0 P
M
3:5
5 P
M
4:2
0 P
M
4:4
5 P
M
5:1
0 P
M
5:3
5 P
M
6:0
0 P
M
6:2
5 P
M
6:5
0 P
M
7:1
5 P
M
7:4
0 P
M
8:0
5 P
M
8:3
0 P
M
8:5
5 P
M
9:2
0 P
M
9:4
5 P
M
10
:10
PM
10
:35
PM
11
:00
PM
11
:25
PM
11
:50
PM
Speed vs Hour by Type of Day
N H PH AH Avg
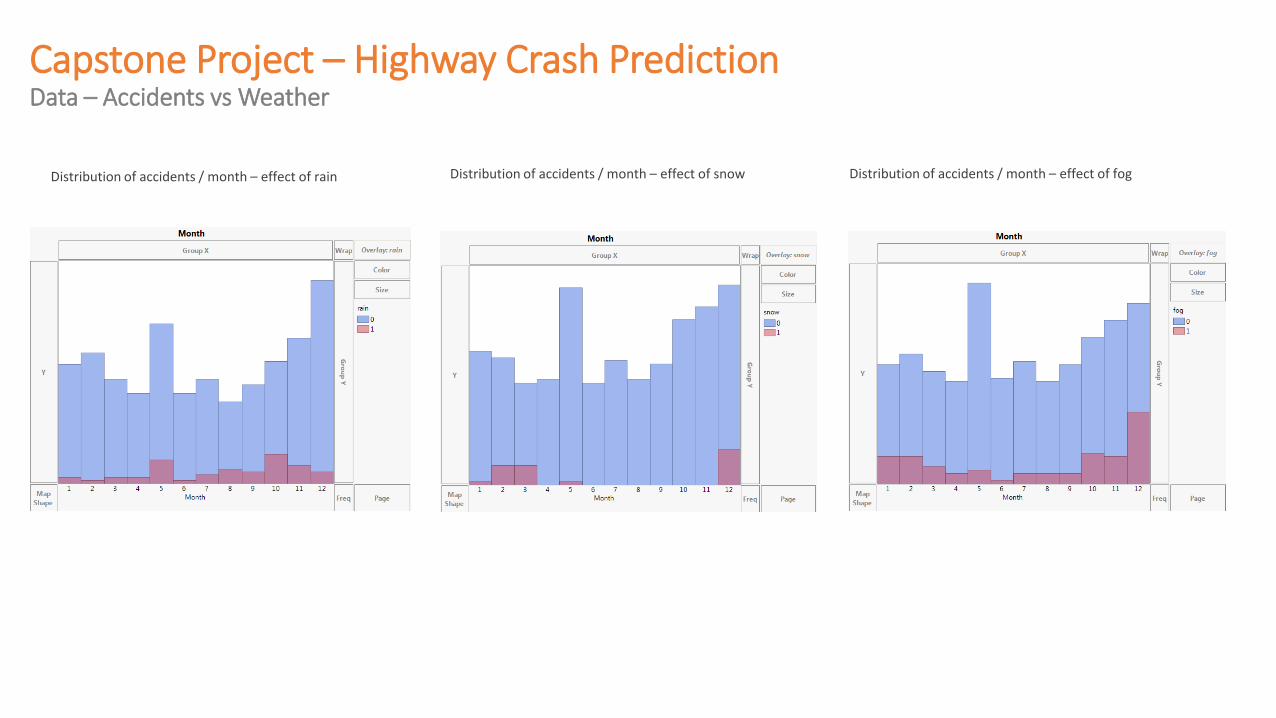
Capstone Project – Highway Crash PredictionData – Accidents vs Weather
Distribution of accidents / month – effect of rain Distribution of accidents / month – effect of snow Distribution of accidents / month – effect of fog
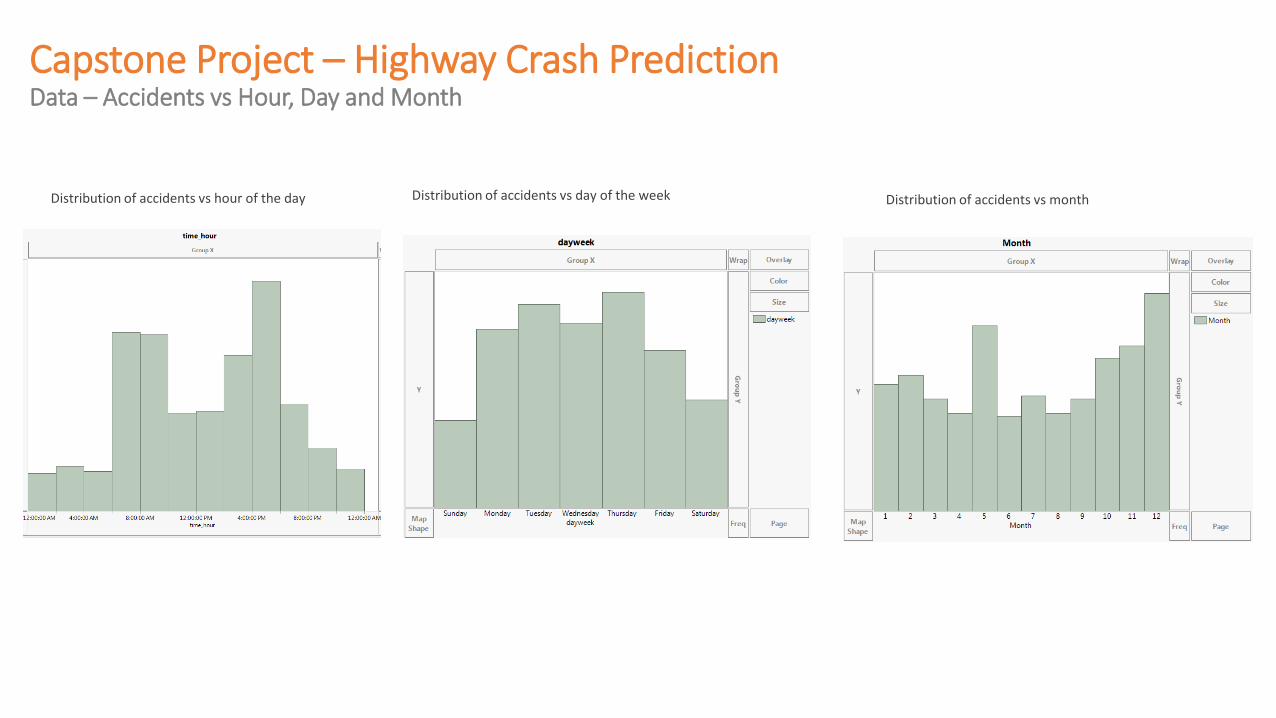
Capstone Project – Highway Crash PredictionData – Accidents vs Hour, Day and Month
Distribution of accidents vs hour of the day Distribution of accidents vs monthDistribution of accidents vs day of the week
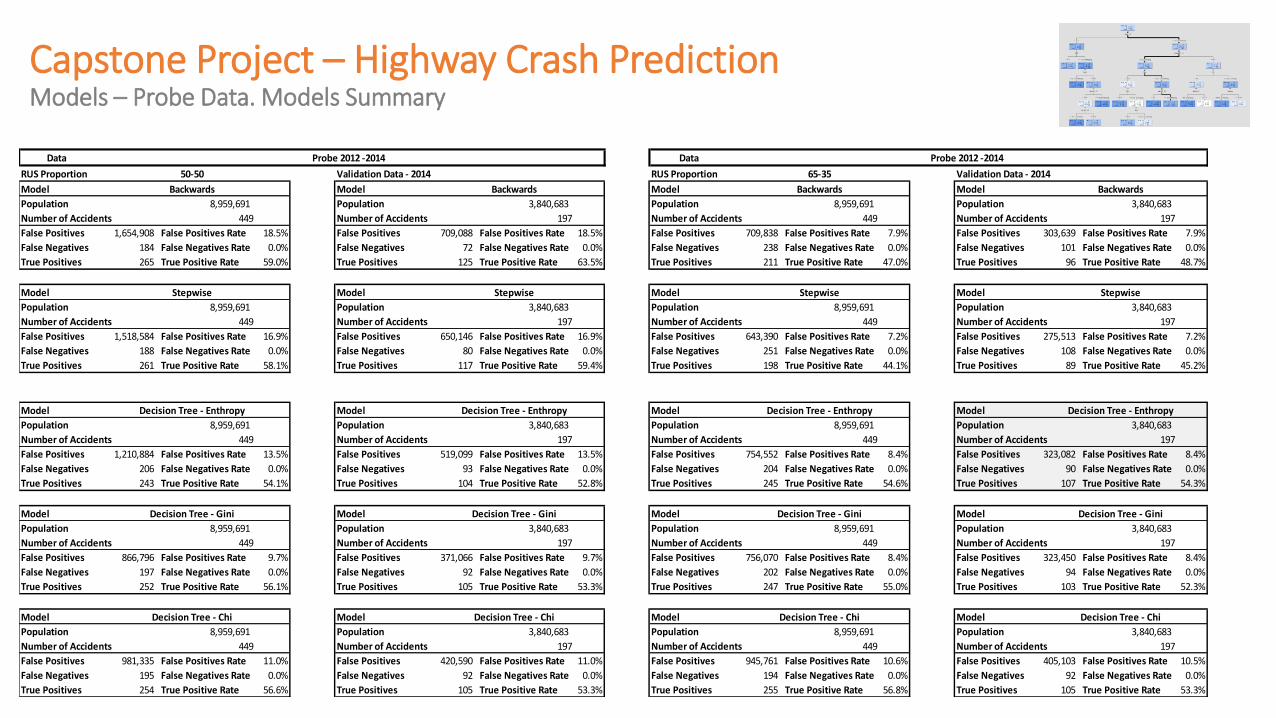
Capstone Project – Highway Crash PredictionModels – Probe Data. Models Summary
Data Probe 2012 -2014 Data Probe 2012 -2014
RUS Proportion 50-50 Validation Data - 2014 RUS Proportion 65-35 Validation Data - 2014
Model Backwards Model Backwards Model Backwards Model Backwards
Population 8,959,691 Population 3,840,683 Population 8,959,691 Population 3,840,683
Number of Accidents 449 Number of Accidents 197 Number of Accidents 449 Number of Accidents 197
False Positives 1,654,908 False Positives Rate 18.5% False Positives 709,088 False Positives Rate 18.5% False Positives 709,838 False Positives Rate 7.9% False Positives 303,639 False Positives Rate 7.9%
False Negatives 184 False Negatives Rate 0.0% False Negatives 72 False Negatives Rate 0.0% False Negatives 238 False Negatives Rate 0.0% False Negatives 101 False Negatives Rate 0.0%
True Positives 265 True Positive Rate 59.0% True Positives 125 True Positive Rate 63.5% True Positives 211 True Positive Rate 47.0% True Positives 96 True Positive Rate 48.7%
Model Stepwise Model Stepwise Model Stepwise Model Stepwise
Population 8,959,691 Population 3,840,683 Population 8,959,691 Population 3,840,683
Number of Accidents 449 Number of Accidents 197 Number of Accidents 449 Number of Accidents 197
False Positives 1,518,584 False Positives Rate 16.9% False Positives 650,146 False Positives Rate 16.9% False Positives 643,390 False Positives Rate 7.2% False Positives 275,513 False Positives Rate 7.2%
False Negatives 188 False Negatives Rate 0.0% False Negatives 80 False Negatives Rate 0.0% False Negatives 251 False Negatives Rate 0.0% False Negatives 108 False Negatives Rate 0.0%
True Positives 261 True Positive Rate 58.1% True Positives 117 True Positive Rate 59.4% True Positives 198 True Positive Rate 44.1% True Positives 89 True Positive Rate 45.2%
Model Decision Tree - Enthropy Model Decision Tree - Enthropy Model Decision Tree - Enthropy Model Decision Tree - Enthropy
Population 8,959,691 Population 3,840,683 Population 8,959,691 Population 3,840,683
Number of Accidents 449 Number of Accidents 197 Number of Accidents 449 Number of Accidents 197
False Positives 1,210,884 False Positives Rate 13.5% False Positives 519,099 False Positives Rate 13.5% False Positives 754,552 False Positives Rate 8.4% False Positives 323,082 False Positives Rate 8.4%
False Negatives 206 False Negatives Rate 0.0% False Negatives 93 False Negatives Rate 0.0% False Negatives 204 False Negatives Rate 0.0% False Negatives 90 False Negatives Rate 0.0%
True Positives 243 True Positive Rate 54.1% True Positives 104 True Positive Rate 52.8% True Positives 245 True Positive Rate 54.6% True Positives 107 True Positive Rate 54.3%
Model Decision Tree - Gini Model Decision Tree - Gini Model Decision Tree - Gini Model Decision Tree - Gini
Population 8,959,691 Population 3,840,683 Population 8,959,691 Population 3,840,683
Number of Accidents 449 Number of Accidents 197 Number of Accidents 449 Number of Accidents 197
False Positives 866,796 False Positives Rate 9.7% False Positives 371,066 False Positives Rate 9.7% False Positives 756,070 False Positives Rate 8.4% False Positives 323,450 False Positives Rate 8.4%
False Negatives 197 False Negatives Rate 0.0% False Negatives 92 False Negatives Rate 0.0% False Negatives 202 False Negatives Rate 0.0% False Negatives 94 False Negatives Rate 0.0%
True Positives 252 True Positive Rate 56.1% True Positives 105 True Positive Rate 53.3% True Positives 247 True Positive Rate 55.0% True Positives 103 True Positive Rate 52.3%
Model Decision Tree - Chi Model Decision Tree - Chi Model Decision Tree - Chi Model Decision Tree - Chi
Population 8,959,691 Population 3,840,683 Population 8,959,691 Population 3,840,683
Number of Accidents 449 Number of Accidents 197 Number of Accidents 449 Number of Accidents 197
False Positives 981,335 False Positives Rate 11.0% False Positives 420,590 False Positives Rate 11.0% False Positives 945,761 False Positives Rate 10.6% False Positives 405,103 False Positives Rate 10.5%
False Negatives 195 False Negatives Rate 0.0% False Negatives 92 False Negatives Rate 0.0% False Negatives 194 False Negatives Rate 0.0% False Negatives 92 False Negatives Rate 0.0%
True Positives 254 True Positive Rate 56.6% True Positives 105 True Positive Rate 53.3% True Positives 255 True Positive Rate 56.8% True Positives 105 True Positive Rate 53.3%
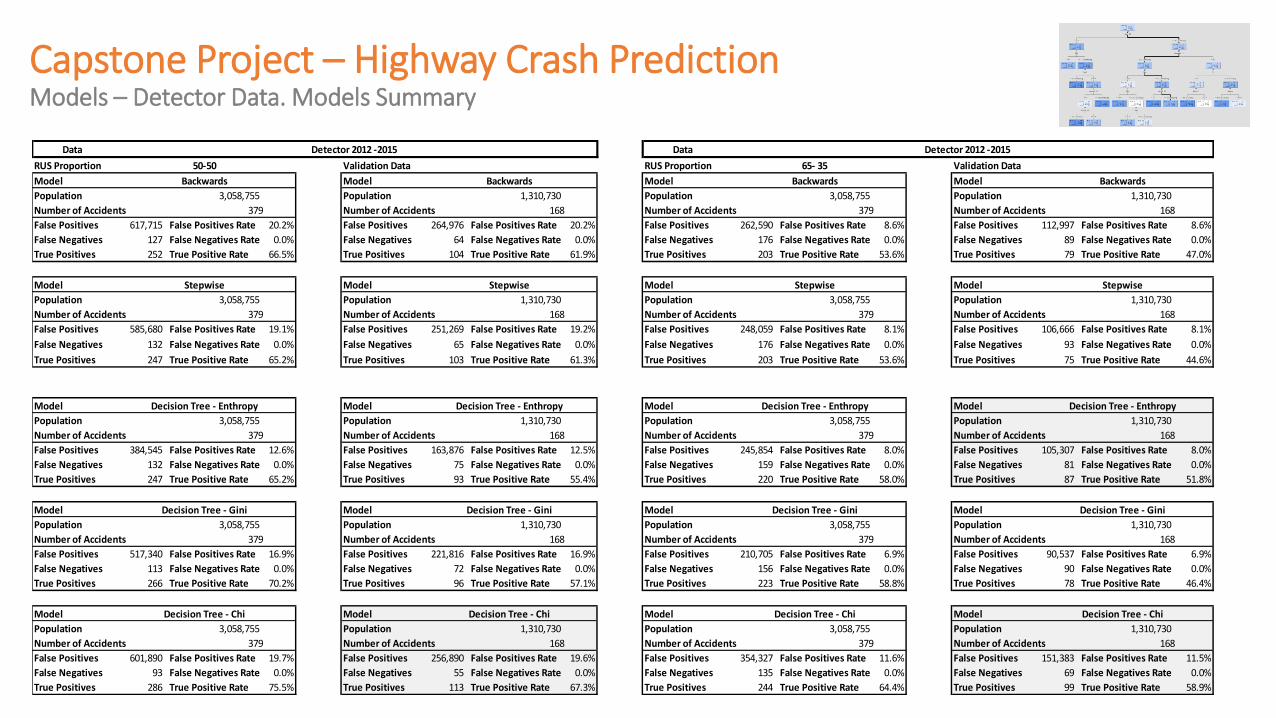
Capstone Project – Highway Crash PredictionModels – Detector Data. Models Summary
Data Detector 2012 -2015 Data Detector 2012 -2015
RUS Proportion 50-50 Validation Data RUS Proportion 65- 35 Validation Data
Model Backwards Model Backwards Model Backwards Model Backwards
Population 3,058,755 Population 1,310,730 Population 3,058,755 Population 1,310,730
Number of Accidents 379 Number of Accidents 168 Number of Accidents 379 Number of Accidents 168
False Positives 617,715 False Positives Rate 20.2% False Positives 264,976 False Positives Rate 20.2% False Positives 262,590 False Positives Rate 8.6% False Positives 112,997 False Positives Rate 8.6%
False Negatives 127 False Negatives Rate 0.0% False Negatives 64 False Negatives Rate 0.0% False Negatives 176 False Negatives Rate 0.0% False Negatives 89 False Negatives Rate 0.0%
True Positives 252 True Positive Rate 66.5% True Positives 104 True Positive Rate 61.9% True Positives 203 True Positive Rate 53.6% True Positives 79 True Positive Rate 47.0%
Model Stepwise Model Stepwise Model Stepwise Model Stepwise
Population 3,058,755 Population 1,310,730 Population 3,058,755 Population 1,310,730
Number of Accidents 379 Number of Accidents 168 Number of Accidents 379 Number of Accidents 168
False Positives 585,680 False Positives Rate 19.1% False Positives 251,269 False Positives Rate 19.2% False Positives 248,059 False Positives Rate 8.1% False Positives 106,666 False Positives Rate 8.1%
False Negatives 132 False Negatives Rate 0.0% False Negatives 65 False Negatives Rate 0.0% False Negatives 176 False Negatives Rate 0.0% False Negatives 93 False Negatives Rate 0.0%
True Positives 247 True Positive Rate 65.2% True Positives 103 True Positive Rate 61.3% True Positives 203 True Positive Rate 53.6% True Positives 75 True Positive Rate 44.6%
Model Decision Tree - Enthropy Model Decision Tree - Enthropy Model Decision Tree - Enthropy Model Decision Tree - Enthropy
Population 3,058,755 Population 1,310,730 Population 3,058,755 Population 1,310,730
Number of Accidents 379 Number of Accidents 168 Number of Accidents 379 Number of Accidents 168
False Positives 384,545 False Positives Rate 12.6% False Positives 163,876 False Positives Rate 12.5% False Positives 245,854 False Positives Rate 8.0% False Positives 105,307 False Positives Rate 8.0%
False Negatives 132 False Negatives Rate 0.0% False Negatives 75 False Negatives Rate 0.0% False Negatives 159 False Negatives Rate 0.0% False Negatives 81 False Negatives Rate 0.0%
True Positives 247 True Positive Rate 65.2% True Positives 93 True Positive Rate 55.4% True Positives 220 True Positive Rate 58.0% True Positives 87 True Positive Rate 51.8%
Model Decision Tree - Gini Model Decision Tree - Gini Model Decision Tree - Gini Model Decision Tree - Gini
Population 3,058,755 Population 1,310,730 Population 3,058,755 Population 1,310,730
Number of Accidents 379 Number of Accidents 168 Number of Accidents 379 Number of Accidents 168
False Positives 517,340 False Positives Rate 16.9% False Positives 221,816 False Positives Rate 16.9% False Positives 210,705 False Positives Rate 6.9% False Positives 90,537 False Positives Rate 6.9%
False Negatives 113 False Negatives Rate 0.0% False Negatives 72 False Negatives Rate 0.0% False Negatives 156 False Negatives Rate 0.0% False Negatives 90 False Negatives Rate 0.0%
True Positives 266 True Positive Rate 70.2% True Positives 96 True Positive Rate 57.1% True Positives 223 True Positive Rate 58.8% True Positives 78 True Positive Rate 46.4%
Model Decision Tree - Chi Model Decision Tree - Chi Model Decision Tree - Chi Model Decision Tree - Chi
Population 3,058,755 Population 1,310,730 Population 3,058,755 Population 1,310,730
Number of Accidents 379 Number of Accidents 168 Number of Accidents 379 Number of Accidents 168
False Positives 601,890 False Positives Rate 19.7% False Positives 256,890 False Positives Rate 19.6% False Positives 354,327 False Positives Rate 11.6% False Positives 151,383 False Positives Rate 11.5%
False Negatives 93 False Negatives Rate 0.0% False Negatives 55 False Negatives Rate 0.0% False Negatives 135 False Negatives Rate 0.0% False Negatives 69 False Negatives Rate 0.0%
True Positives 286 True Positive Rate 75.5% True Positives 113 True Positive Rate 67.3% True Positives 244 True Positive Rate 64.4% True Positives 99 True Positive Rate 58.9%

Capstone Project – Highway Crash PredictionModels – Model Statistics Logistic Regression ( Stepwise ) – Detector
65 - 35

Capstone Project – Highway Crash PredictionModels
SAS Enterprise Miner:Model selection diagram for Probe Data with 50-50 RUS proportion