Embed Size (px)
Citation preview
CapSys: A Tool for Macroscopic Capacity Planning of IBM Mainframe Systems
Tilev, Milen; Müller-Clostermann, Bruno
In: ICB Research Reports - Forschungsberichte des ICB / 2008
This text is provided by DuEPublico, the central repository of the University Duisburg-Essen.
This version of the e-publication may differ from a potential published print or online version.
DOI: https://doi.org/10.17185/duepublico/47110
URN: urn:nbn:de:hbz:464-20180920-074911-4
Link: https://duepublico.uni-duisburg-essen.de/servlets/DocumentServlet?id=47110
License:As long as not stated otherwise within the content, all rights are reserved by the authors / publishers of the work. Usageonly with permission, except applicable rules of german copyright law.
Source: ICB-Research Report No. 26, September 2008
ICB-RESEARCH REPORT
ICBInstitut für Informatik undWirtschaftsinformatik
UNIVERSITÄT
D U I S B U GRE S S E N
ICB-Research Report No. 26
September 2008
CapSys: A Tool for Macroscopic Capacity Planning of IBM Mainframe Systems
Milen Tilev
Bruno Müller-Clostermann

Die Forschungsberichte des Insti tuts für Informatik und Wirtschaftsinfor ‐matik dienen der Darstellung vorläu ‐f iger Ergebnisse, die i . d. R. noch für spätere Veröffentlichungen überarbei‐tet werden. Die Autoren sind deshalb für kritische Hinweise dankbar.
All rights reserved. No part of this report may be reproduced by any means, or translated.
Contact :
Insti tut für Informatik und
Wirtschaftsinformatik ( ICB)
Universi tät Duisburg‐Essen
Universi tätsstr . 9
45141 Essen
Tel. : 0201‐183‐4041
Fax: 0201‐183‐4011 Email : icb@uni‐duisburg‐essen.de
Authors’ Address:
Milen Tilev Bruno Müller‐Clostermann
Insti tut für Informatik und
Wirtschaftsinformatik ( ICB)
Universi tät Duisburg‐Essen
Universi tätsstr . 9
D ‐45141 Essen
[email protected]‐due.de
[email protected]‐due.de
The ICB Research Reports comprise preliminary results which will usually be revised for subsequent publica‐t ions. Critical comments would be appreciated by the authors.
Alle Rechte vorbehalten. Insbesondere die der Übersetzung, des Nachdruk‐kes, des Vortrags, der Entnahme von Abbildungen und Tabellen – auch bei nur auszugsweiser Verwertung.
ISSN 1860‐2770 (Print)ISSN 1866‐5101 (Online)
ICB Research Reports
Edited by:
Prof. Dr. Heimo Adelsberger
Prof. Dr. Peter Chamoni
Prof. Dr. Frank Dorloff
Prof. Dr. Klaus Echtle
Prof. Dr. Stefan Eicker
Prof. Dr. Ulrich Frank
Prof. Dr. Michael Goedicke
Prof. Dr. Tobias Kollmann
Prof. Dr. Bruno Müller ‐Clostermann
Prof. Dr. Klaus Pohl
Prof. Dr. Erwin P. Rathgeb
Prof. Dr. Albrecht Schmidt
Prof. Dr. Rainer Unland
Prof. Dr. Stephan Zelewski

i
Abstract
Capacity planning for large‐scale systems like mainframe installations is typically based on
rather coarse historical workload data. Hence, it is advisable to employ techniques and tools
that use the same “macroscopic” (high‐level) view of the overall system. We follow the clas‐
sic approach known from performance modelling to compose a model essentially out of two
parts, the system model (or machine) and the workload model. The system model is an ag‐
gregated mainframe system model that is focussed primarily on processing resources that
are given by processors of different types (i.e. general all purpose processors and processors
dedicated to Java, Linux, Database and others) and their processing capacity given by scaling
tables. The workload model follows the structuring given by logical partitions and is built
from historical utilization data that are permanently collected during normal operation.
Based on this framework it is possible to define and improve the allocation of logical parti‐
tions to processors or processor pools. Employing the CapSys tool the designer can interac‐
tively vary the configuration of processor pools as well as the shape and intensity of the
workloads to be allocated. In this report we describe background, architecture and function‐
ality of the CapSys tool.
Keywords: Capacity Planning, Mainframes, Performance, Workload Management
i i
Contents
1 INTRODUCTION ..................................................................................................................................... 1
2 MAINFRAME TERMINOLOGY............................................................................................................ 2
3 SYSTEM MODEL AND WORKLOAD MODEL................................................................................. 4
4 TOOL ARCHITECTURE.......................................................................................................................... 8
5 VISUAL WORKFLOW APPROACH..................................................................................................... 8
6 WORKLOAD CONDITIONING AND ANALYSIS......................................................................... 11
7 RELATED WORK.................................................................................................................................... 13
8 CONCLUSIONS...................................................................................................................................... 16
9 REFERENCES........................................................................................................................................... 17
i i i
Table of figures
FIGURE 1: A MAINFRAME SERVER BUILT UP OF FOUR PROCESSOR POOLS.............................................................. 5
FIGURE 2: RELATION BETWEEN LPARS, WORKLOADS AND PROCESSOR POOLS ................................................... 6
FIGURE 3: REQUESTED VERSUS INSTALLED CAPACITY OVER 4 WEEKS................................................................... 7
FIGURE 4: ARCHITECTURE OF THE CAPSYS APPLICATION..................................................................................... 8
FIGURE 5: CAPSYS 2.0 MAIN WINDOW................................................................................................................... 9
FIGURE 6: CONFIGURATION OF A CEC MODEL AND PROCESSOR POOLS ............................................................ 10
FIGURE 7: CONFIGURATION OF THE ANALYSIS TIME PERIOD .............................................................................. 11
FIGURE 8: A FILTER EXAMPLE............................................................................................................................... 12
FIGURE 9: OVERVIEW OF IBM´S ZPCR TOOL....................................................................................................... 14
FIGURE 10: TIME DEPENDENT UTILIZATION FOR AN IFL‐PROCESSOR................................................................. 15
iv
Terms and abbreviations
Contention IBM term for percentage of waiting units (cf. velocity)
CEC Central Electronic Complex
COD Capacity On Demand
CP Central Processor
ICF Internal Coupling Facility
IFA Integrated Facility for Application
IFL Integrated Facility for Linux
IRD Intelligent Resource Director
LPAR Logical Partition
LSPR Large Systems Performance Reference
MIPS Million Instructions Per Second
MSU Million Service Units
PU Processing Unit
RMF Resource Measurement Facility (Monitoring Software)
SAP System Assist Processor
SRM System Resource Manager
Sysplex A logical set of LPARs communicating via ICFs
QOS Quality of Service
Velocity IBM term for contention, also named “Excecution Velocity”
WLM Workload Manager
zAAP z Application Assist Processor (used for Java Workload)
zIIP z Integrated Information Processor
zPCR IBM’s Processor Capacity Reference Tool for System z
z/OS, z/VM, z/VSE Mainframe operating systems
CapSys: A Tool for Macroscopic Capacity Planning
1
1 Introduction
Capacity planning for mainframe systems is traditionally a complex and time consuming
task. The main contributing factors are the vast majority of workloads and the multitude of
possible resource configurations, especially in the context of virtualization. The available
support for managing such complex scenarios also comprises tools that employ performance
models for quantitative system evaluation. Such models are either based on discrete event
simulation or they use queueing networks that can be solved by analytical algorithms like
MVA (Mean Value Analysis) or variations thereof (e.g. Bard‐Schweitzer approximation).
These techniques assume that planners have knowledge of performance parameters like ar‐
rival rates of transactions, customer populations, service demands at resources per transac‐
tion, etc. For large mainframe shops providing computing services to a large number of cus‐
tomers it is, however, often not possible to determine such parameters either due to security
and confidentiality restrictions or simply because of the enormous system overhead in terms
of processing power and data storage the required measurements would turn out. Likewise,
although mainframe workloads are usually said to be rather homogeneous and rarely chang‐
ing over time, often there are considerable differences depending on time of day or day of
week. For instance, it is a common practice to run online transaction activities during busi‐
ness hours whereas reporting, data consolidation, backup or batch jobs are done at night.
This results in different workload profiles for the respective time periods, which cannot be
represented meaningfully by average values.
Since customer contracts in the mainframe world are often based on provision of fixed
amounts of computing capacity expressed in MIPS (see chapter 2), for quality of service
(QoS) and accounting purposes, installations usually measure and report periodically the
amounts of consumed MIPS per customer system. Hence, these data are stored and are
available for capacity planning activities, too. By summing up the resource consumptions in
MIPS of all workloads, one obtains an estimate of the total resource utilization. Although
rather coarse, this methodology gains practically useful results and reduces planning time
and costs significantly.
Here we introduce a mainframe capacity planning technique and the associated tool CapSys
that follow the aforementioned approach. The main goal of CapSys is to reduce time, costs
and human effort during the planning process while still delivering the basis for reliable and
practically feasible decisions with respect to risks and costs.
M. Tilev, B. Müller‐Clostermann
2
The rest of the report is organized as follows: In chapter 2 some concepts and notions from
the mainframe world are shortly summarized. Then, in chapter 3, the underlying system
model as used by CapSys is described. We provide a brief overview of the tool’s architecture
in chapter 4. The workflow approach of CapSys and available techniques for workload
analysis, conditioning and risk and cost estimation are described in chapters 5 and 6, respec‐
tively. In chapter 7 we overview some related tools for mainframe capacity management and
finally conclude our work with the conclusions in chapter 8.
2 Mainframe Terminology
Firstly, we introduce established terms from the mainframe world and provide some defini‐
tions, which reflect our view of the problem domain. One basic notion that is tightly coupled
with the mainframe platform is virtualization, which has been introduced in the early seven‐
ties of the last century. Virtualization allows a single physical server to collocate multiple
distinguished operating environments at the same time yielding better overall resource utili‐
zation and lower hardware costs. For additional information on most of the terms below, see
[IBM07a].
CEC (Central Electronic Complex, also CPC – Central Processing Complex): This is actually
just a synonym for a mainframe machine. CEC is the usual denomination for the hardware
comprising a server.
LPAR (Logical Partition): A virtualized environment abstracting from all physical hardware
devices of a mainframe server like processors, memory, storage, IO, etc. A LPAR accommo‐
dates a distinguished operating system instance and any applications installed within it. A
LPAR can comprise various types of workloads (see chapter 3) capable of running on different
specialty engines (e.g. zAAP and zIIP processors). Depending on its configuration a single CEC
can provide computing services simultaneously to many LPARs, currently up to some doz‐
ens.
Sysplex: A logical set of LPARs capable of communicating with each other and fulfilling
given tasks in collaboration. In order to exchange data and messages within the sysplex, the
LPARs utilize special coupling facilities (called ICF).
IRD Cluster (Intelligent Resource Director): Another type of logical LPAR set allowing bal‐
anced resource sharing by multiple LPARs on the same CEC. IRD clusters take advantage of
the z/OS WorkLoad Manager (WLM) capable of dynamically (re‐)assigning CPU and IO re‐
sources to different LPARs depending on their current needs and the overall QoS policies.
CapSys: A Tool for Macroscopic Capacity Planning
3
LPAR Group: A set of LPARs, which can be assigned a common capacity limit with respect
to consumption of processing time. Each individual LPAR, however, can request processing
power up to the specified limit. LPAR groups are e.g. suitable in cases where a customer
maintains more than one LPAR but orders a certain capacity for all his systems as a whole.
Engine Type: Modern IBM mainframes (zSeries, System z9 and above) can contain several
different types of processing units (PUs = processors). Each of these types provides generally
a monetary advantage in conjunction with a given specific type of workload running on it.
Physically, the processors of the various types are identical – the only difference is the mi‐
crocode they are equipped with. Currently, IBM offers the following engine types:
• CP (Central Processor): General purpose processor capable of running every type of work‐
load. In order to avoid the high license costs for software products running on them, the
common application of CPs is the execution of proprietary software products or operating
systems like z/OS, z/VSE, etc.
• ICF (Internal Coupling Facility): A special type of processing unit specifically tailored for
interconnecting several LPARs within a Sysplex.
• IFL (Integrated Facility for Linux): A processor type suitable for running LPARs containing
zLinux operating systems at low cost.
• zAAP (z Application Assist Processor, also called IFA – Integrated Facility for Applica‐
tions): A zAAP is used for offloading Java workloads from the general purpose PUs and
thus reducing the resulting license costs for Java applications. LPARs, which utilize
zAAPs, need also at least one CP in order to execute the operating system and any other
non‐Java code.
• zIIP (z Integrated Information Processor): Another specialty engine used for offloading
database related workloads (especially IBM DB2) from the CPs. As with zAAP, LPARs
need additionally at least one CP for running the remaining operating system’s and other
programs’ code.
Processor Pool: A group of physical processors of a certain type. A processor pool can be
either shared, which means it offers computing capacity for multiple workloads simultane‐
ously, or dedicated, thus allowing only a single workload to run on it.
MIPS (Million Instructions Per Second): Probably the most common though unfortunately
inaccurate performance and capacity measure for mainframes. It is typically used in cus‐
tomer contracts when defining the amount of computing services to be provided. Each PU is
said to offer a model‐specific MIPS value and groups of several PUs provide also a certain
M. Tilev, B. Müller‐Clostermann
4
amount of MIPS. Different organizations (IBM included) deliver MIPS tables indicating ap‐
proximately the amount of MIPS depending on type and number of PUs. Although actually
a throughput measure, MIPS are commonly used to express system utilization in terms of
MIPS a certain workload consumes per time interval related to the amount of MIPS the sys‐
tem provides.
MSU (Million Service Units): Contemporarily, this is not a real performance measure any‐
more. In the past, MSUs were related to the instruction capacity of a certain mainframe
model. However, nowadays it is rather used as a high‐level financial rating for a specific
hardware configuration on the one hand and for the resource consumption of an installed
software instance on the other hand. Thus, MSUs have a direct impact on hardware and
software licensing and all related costs.
3 System Model and Workload Model
We follow the classic approach known from performance modelling to compose a model out
of two parts, the system model (or machine) and the workload model. The system model is
an aggregated mainframe system model reflecting a subset of the virtualization capabilities
of the contemporary mainframe platform. This model concentrates primarily on processing
resources and omits memory‐ and IO‐related aspects. The components are mainframe servers
(CECs), processing units (PUs), processor pools, and logical partitions (LPARs). LPARs are
closely related to the workload model to be described later.
Mainframe servers are top‐level elements characterized by manufacturer models, which de‐
termine the number of general purpose PUs a CEC contains. Additionally to those general
purpose PUs, a server can also contain other types of PUs up to a certain limit.
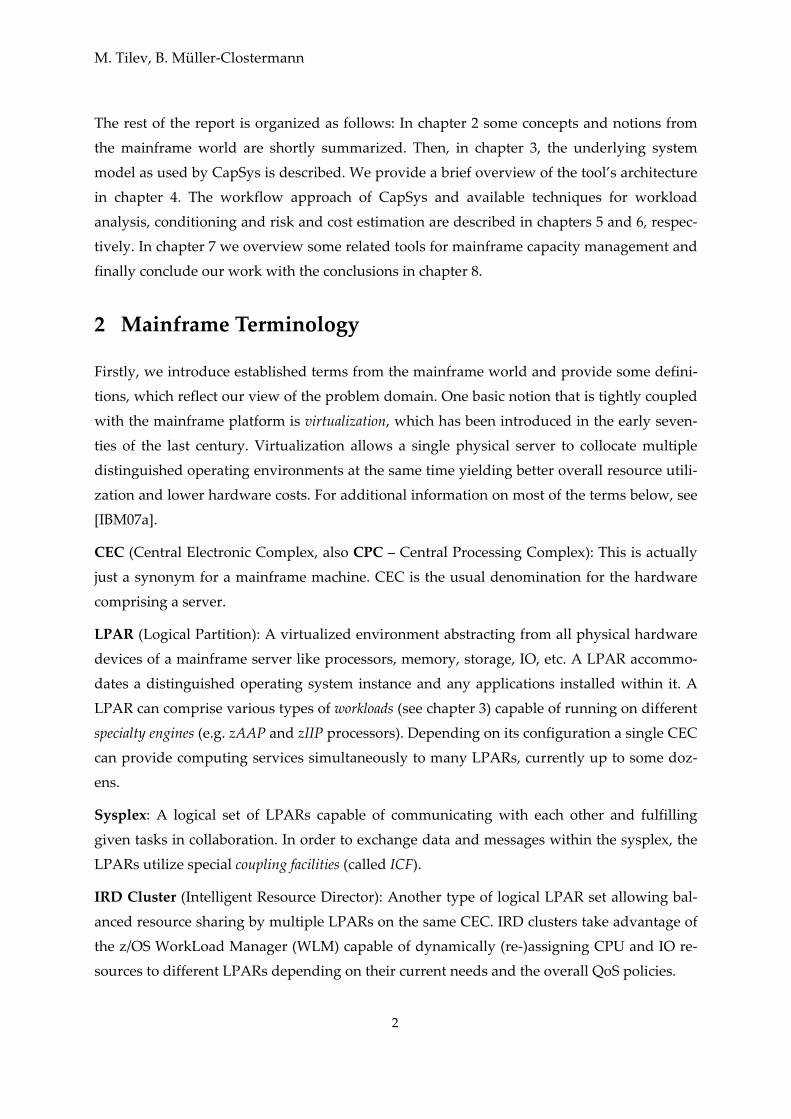
On the next layer of our system model a CEC is divided into a set of processor pools. Each
pool is made up of a number of either shared or dedicated PUs of the same type. Hereby, the
restriction applies that a CEC cannot contain more than one shared pool of a certain type.
There are no restrictions on the number of processor pools within a CEC; however, due to
the limited number of PUs, in practice a server usually has less than ten pools. Each proces‐
sor pool is said to deliver a certain processing capacity in MIPS (the installed capacity) result‐
ing from the number and type of PUs it contains as well as from the manufacturer model of
the CEC. Fig. 1 shows an example for a server configuration.
CapSys: A Tool for Macroscopic Capacity Planning
5
Figure 1: A mainframe server built up of four processor pools
LPARs are assigned to CECs as result of capacity planning decision processes. Several
LPARs can be grouped together to build a sysplex or an IRD cluster. LPARs belonging to
such a grouping are naturally to be allocated on the same CEC. However, to fulfill required
business objectives it may be necessary to split or disassemble some of those predefined
groups in order to achieve the desired goals. Therefore, our framework currently doesn’t
conduct restrictions of having all LPARs of a certain sysplex or IRD cluster on the same ma‐
chine. However, it does track memberships of LPARs within such groups and allows related
capacity planning tasks to be carried out (e.g. easily finding and assigning all LPARs within
a sysplex to the same CEC).
LPARs themselves comprise one or more workloads. Throughout this report we use the term
workload in a slightly different way as in the common system modeling terminology. There‐
fore, we provide a definition for it in the current context and integrate it with our system
model: A workload represents a time series of utilization data measured in MIPS caused by a
LPAR on a specific type of processor pool. The type of a workload corresponds to the type of
PUs within the assigned processor pool.
Thus, in our framework the workload models are external representations of an LPAR’s per‐
formance related behavior and do not describe the work to be carried out (described e.g. by
an arrival process or number of transactions or customers within the system).
A LPAR can have at most one workload of a given type. However, it can contain certain legal
combinations of differently typed workloads. For a better understanding of those valid com‐
Server (model 2094‐707, 7 CPs, 2 zAAP, 3 IFL)
Processor Pool (5 CP, shared)
Processor Pool (2 zAAP, shared)
Processor Pool (3 IFL, shared)
Processor Pool (2 CP, dedicated)
M. Tilev, B. Müller‐Clostermann
6
binations, we further divide the types of workloads (and thus the types of PUs and processor
pools) into two categories:
• Main Types: general purpose (CP), Linux (IFL) and coupling facility (ICF)
• Supplementary Types: Java (zAAP) and DB2 (zIIP).
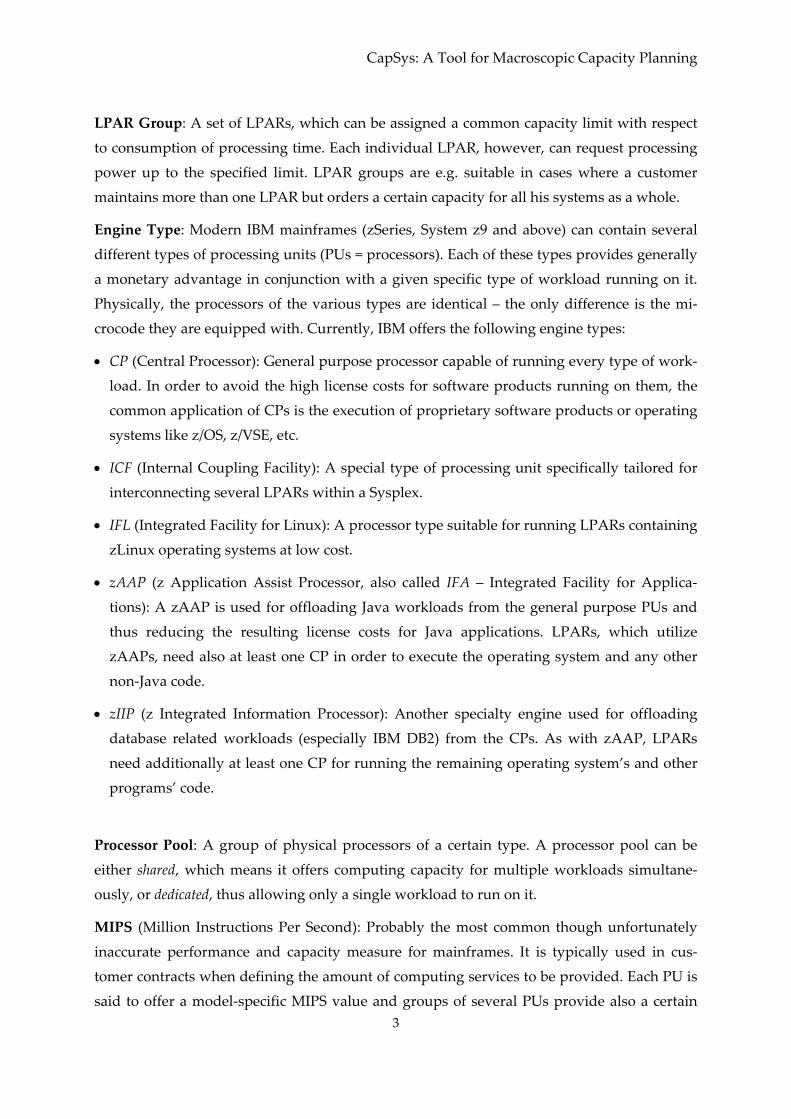
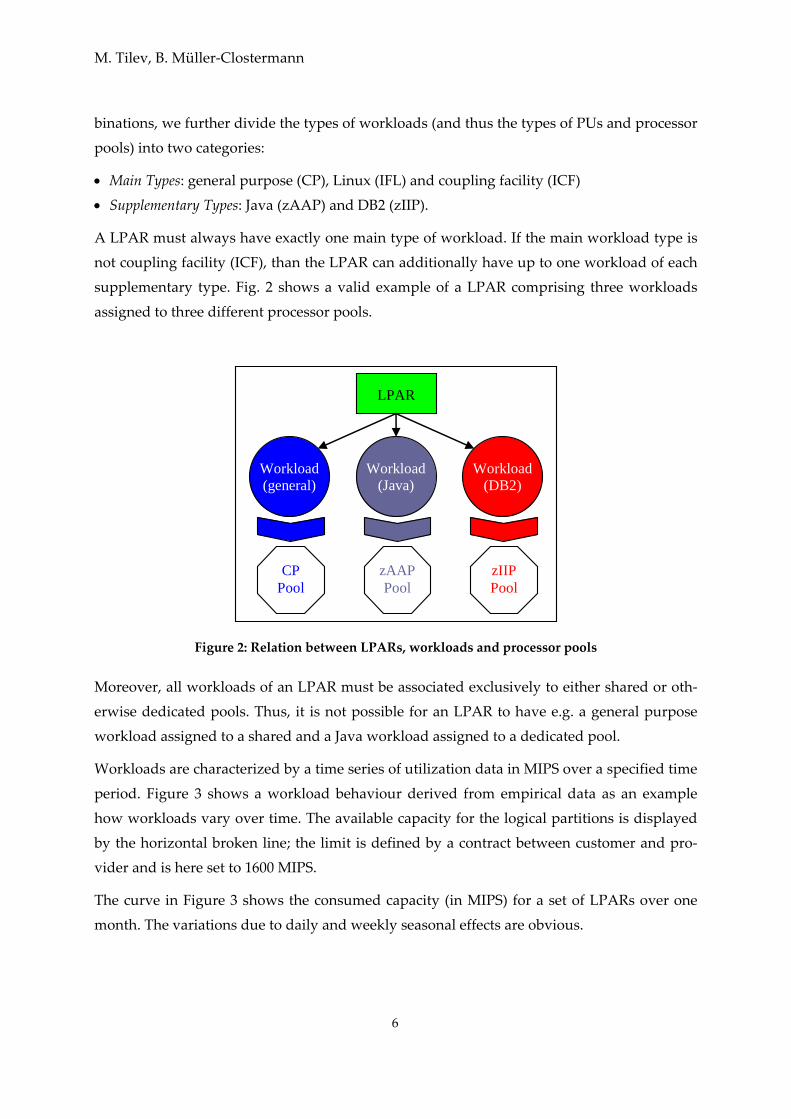
A LPAR must always have exactly one main type of workload. If the main workload type is
not coupling facility (ICF), than the LPAR can additionally have up to one workload of each
supplementary type. Fig. 2 shows a valid example of a LPAR comprising three workloads
assigned to three different processor pools.
LPAR
Workload (general)
Workload (Java)
Workload (DB2)
CP Pool
zAAP Pool
zIIP Pool
Figure 2: Relation between LPARs, workloads and processor pools
Moreover, all workloads of an LPAR must be associated exclusively to either shared or oth‐
erwise dedicated pools. Thus, it is not possible for an LPAR to have e.g. a general purpose
workload assigned to a shared and a Java workload assigned to a dedicated pool.
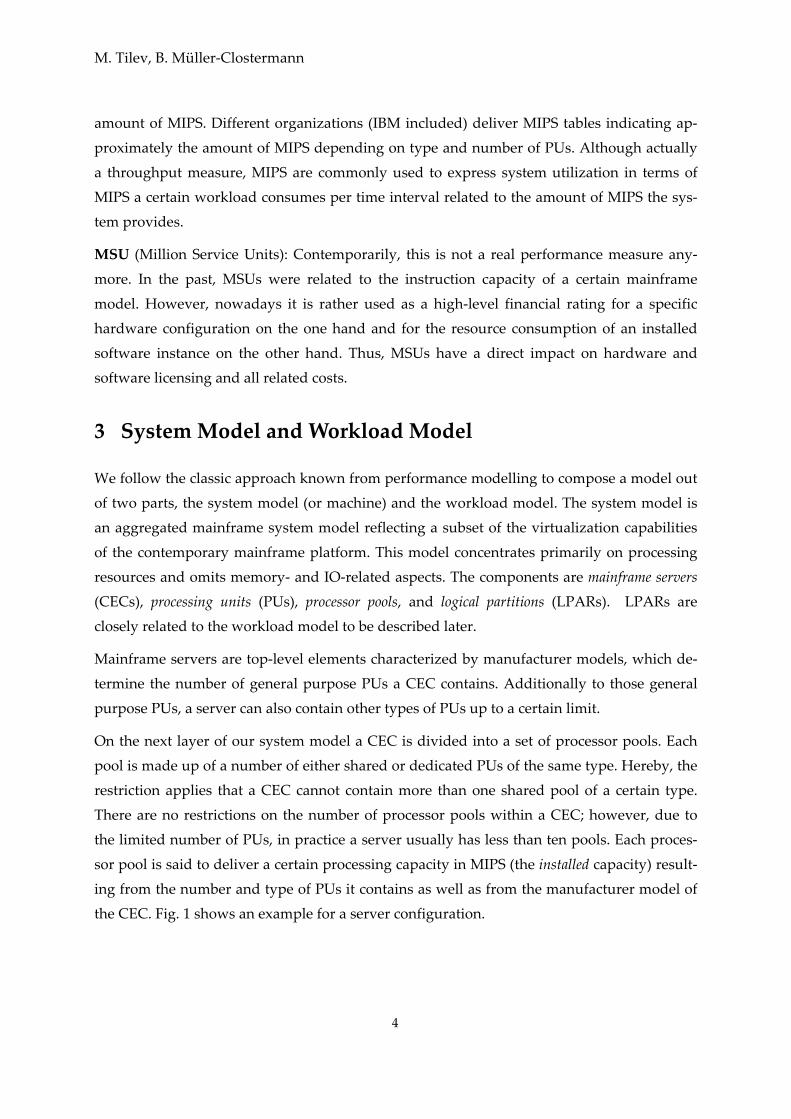
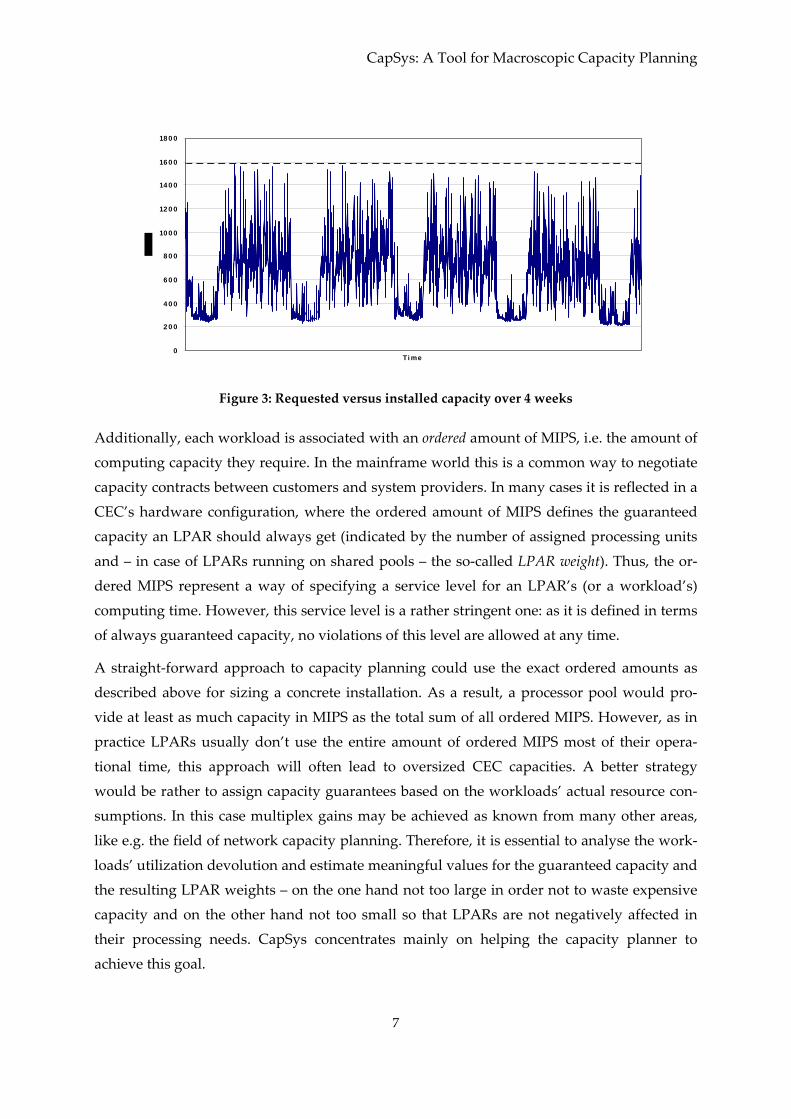
Workloads are characterized by a time series of utilization data in MIPS over a specified time
period. Figure 3 shows a workload behaviour derived from empirical data as an example
how workloads vary over time. The available capacity for the logical partitions is displayed
by the horizontal broken line; the limit is defined by a contract between customer and pro‐
vider and is here set to 1600 MIPS.
The curve in Figure 3 shows the consumed capacity (in MIPS) for a set of LPARs over one
month. The variations due to daily and weekly seasonal effects are obvious.
CapSys: A Tool for Macroscopic Capacity Planning
7
0
2 0 0
4 0 0
6 0 0
8 0 0
10 0 0
12 0 0
14 0 0
16 0 0
18 0 0
Ti me
Figure 3: Requested versus installed capacity over 4 weeks
Additionally, each workload is associated with an ordered amount of MIPS, i.e. the amount of
computing capacity they require. In the mainframe world this is a common way to negotiate
capacity contracts between customers and system providers. In many cases it is reflected in a
CEC’s hardware configuration, where the ordered amount of MIPS defines the guaranteed
capacity an LPAR should always get (indicated by the number of assigned processing units
and – in case of LPARs running on shared pools – the so‐called LPAR weight). Thus, the or‐
dered MIPS represent a way of specifying a service level for an LPAR’s (or a workload’s)
computing time. However, this service level is a rather stringent one: as it is defined in terms
of always guaranteed capacity, no violations of this level are allowed at any time.
A straight‐forward approach to capacity planning could use the exact ordered amounts as
described above for sizing a concrete installation. As a result, a processor pool would pro‐
vide at least as much capacity in MIPS as the total sum of all ordered MIPS. However, as in
practice LPARs usually don’t use the entire amount of ordered MIPS most of their opera‐
tional time, this approach will often lead to oversized CEC capacities. A better strategy
would be rather to assign capacity guarantees based on the workloads’ actual resource con‐
sumptions. In this case multiplex gains may be achieved as known from many other areas,
like e.g. the field of network capacity planning. Therefore, it is essential to analyse the work‐
loads’ utilization devolution and estimate meaningful values for the guaranteed capacity and
the resulting LPAR weights – on the one hand not too large in order not to waste expensive
capacity and on the other hand not too small so that LPARs are not negatively affected in
their processing needs. CapSys concentrates mainly on helping the capacity planner to
achieve this goal.
M. Tilev, B. Müller‐Clostermann
8
4 Tool Architecture
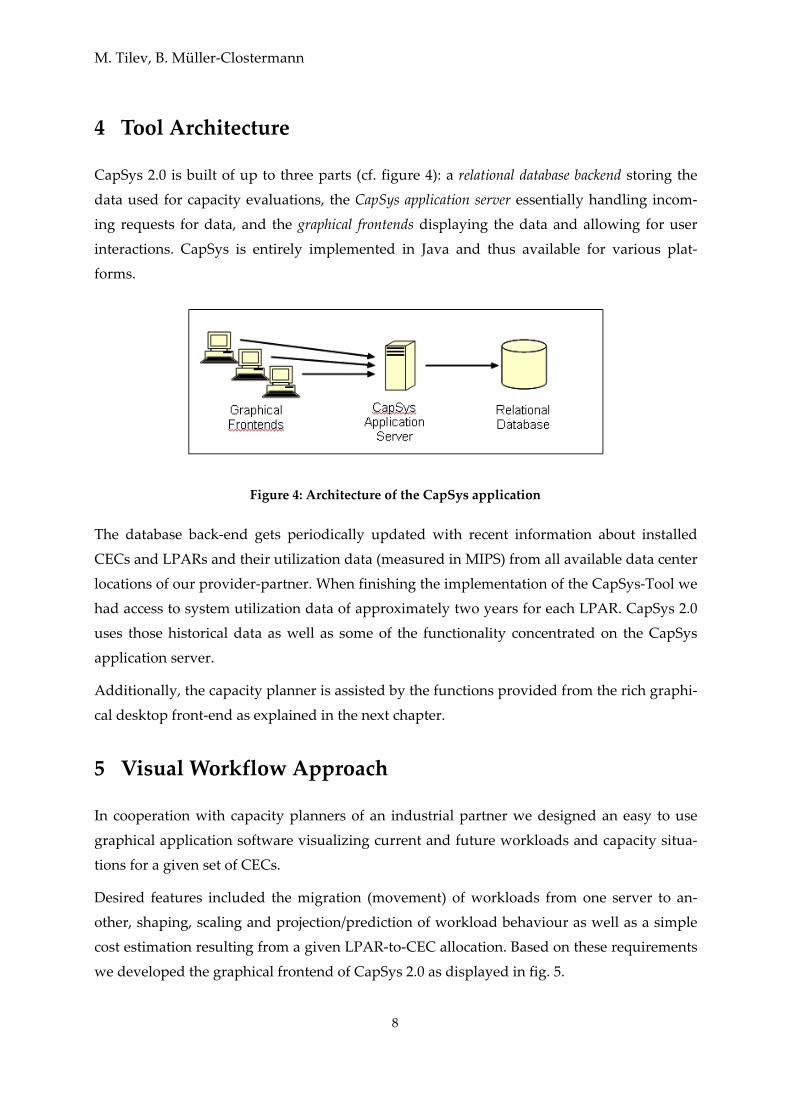
CapSys 2.0 is built of up to three parts (cf. figure 4): a relational database backend storing the
data used for capacity evaluations, the CapSys application server essentially handling incom‐
ing requests for data, and the graphical frontends displaying the data and allowing for user
interactions. CapSys is entirely implemented in Java and thus available for various plat‐
forms.
Figure 4: Architecture of the CapSys application
The database back‐end gets periodically updated with recent information about installed
CECs and LPARs and their utilization data (measured in MIPS) from all available data center
locations of our provider‐partner. When finishing the implementation of the CapSys‐Tool we
had access to system utilization data of approximately two years for each LPAR. CapSys 2.0
uses those historical data as well as some of the functionality concentrated on the CapSys
application server.
Additionally, the capacity planner is assisted by the functions provided from the rich graphi‐
cal desktop front‐end as explained in the next chapter.
5 Visual Workflow Approach
In cooperation with capacity planners of an industrial partner we designed an easy to use
graphical application software visualizing current and future workloads and capacity situa‐
tions for a given set of CECs.
Desired features included the migration (movement) of workloads from one server to an‐
other, shaping, scaling and projection/prediction of workload behaviour as well as a simple
cost estimation resulting from a given LPAR‐to‐CEC allocation. Based on these requirements
we developed the graphical frontend of CapSys 2.0 as displayed in fig. 5.
CapSys: A Tool for Macroscopic Capacity Planning
9
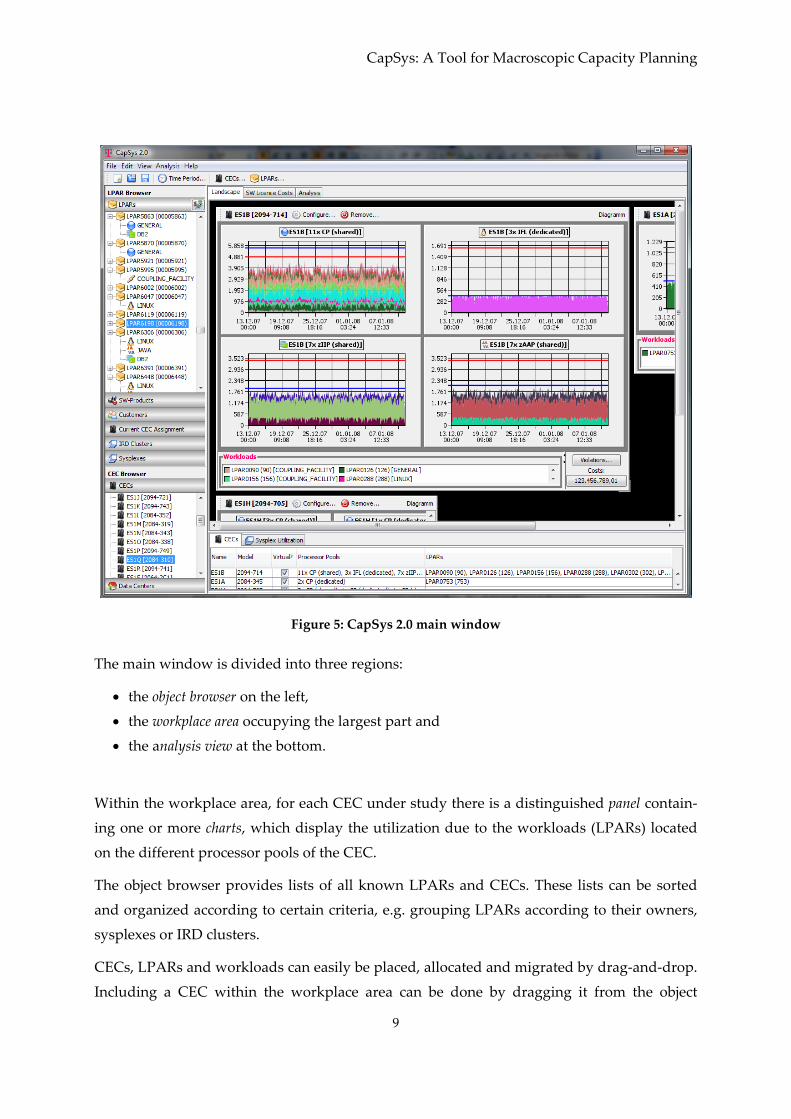
Figure 5: CapSys 2.0 main window
The main window is divided into three regions:
• the object browser on the left,
• the workplace area occupying the largest part and
• the analysis view at the bottom.
Within the workplace area, for each CEC under study there is a distinguished panel contain‐
ing one or more charts, which display the utilization due to the workloads (LPARs) located
on the different processor pools of the CEC.
The object browser provides lists of all known LPARs and CECs. These lists can be sorted
and organized according to certain criteria, e.g. grouping LPARs according to their owners,
sysplexes or IRD clusters.
CECs, LPARs and workloads can easily be placed, allocated and migrated by drag‐and‐drop.
Including a CEC within the workplace area can be done by dragging it from the object
M. Tilev, B. Müller‐Clostermann
10
browser and moving an LPAR from one CEC to another (a very typical function) is accom‐
plished by simply dragging it from its current chart to the desired one. Thereby, CapSys
takes care of keeping the model consistent, such that e.g. all workloads belonging to a certain
LPAR are always migrated together.
For better orientation, within each processor pool the levels of installed capacity and the sum
of the ordered amounts of all workloads currently allocated to that pool are displayed by
horizontal boundary lines.
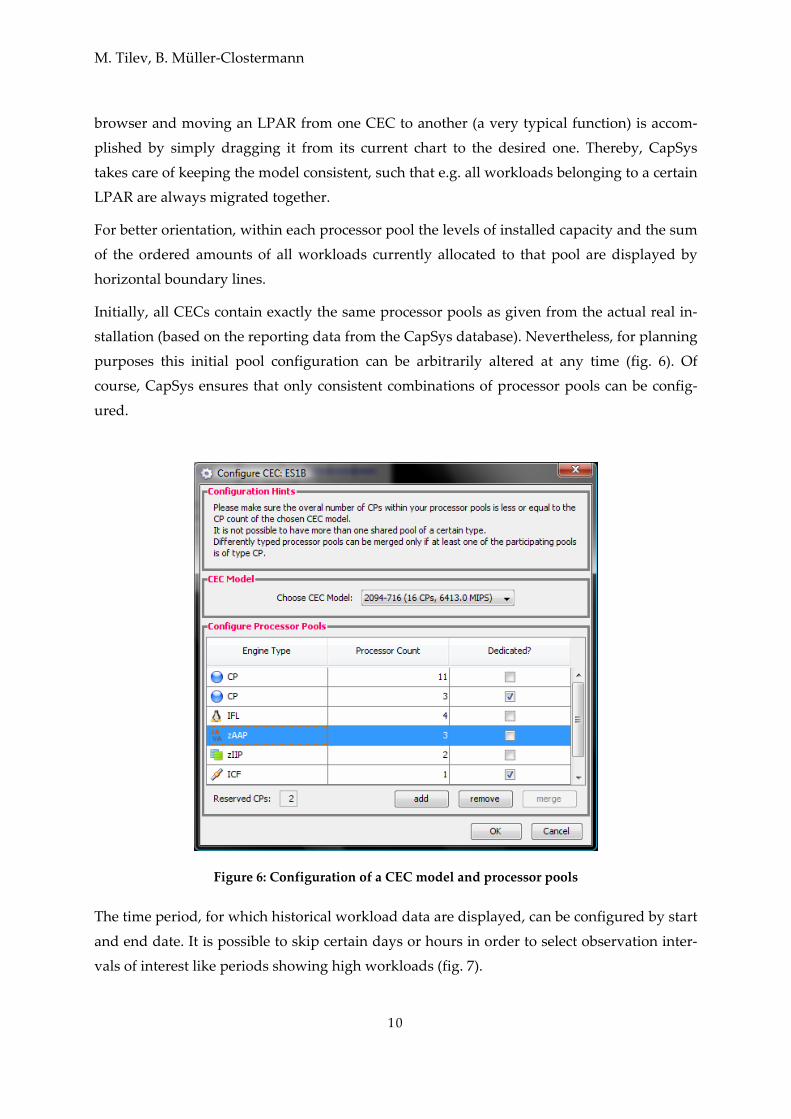
Initially, all CECs contain exactly the same processor pools as given from the actual real in‐
stallation (based on the reporting data from the CapSys database). Nevertheless, for planning
purposes this initial pool configuration can be arbitrarily altered at any time (fig. 6). Of
course, CapSys ensures that only consistent combinations of processor pools can be config‐
ured.
Figure 6: Configuration of a CEC model and processor pools
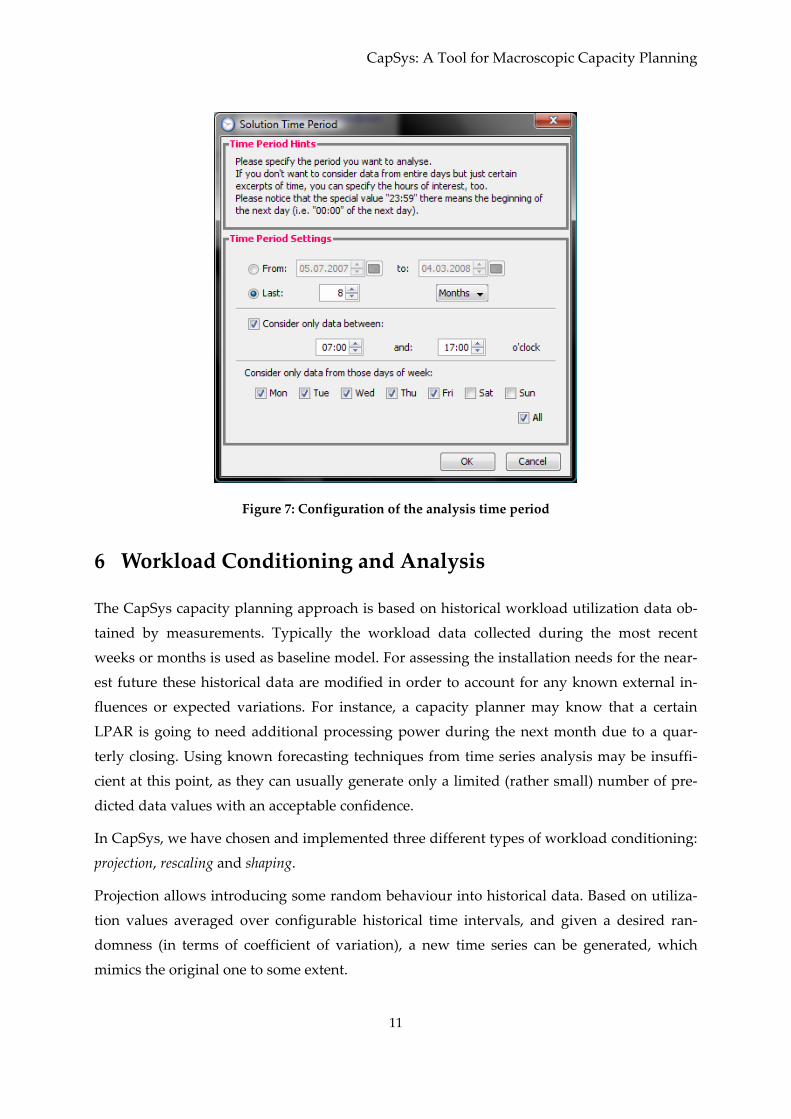
The time period, for which historical workload data are displayed, can be configured by start
and end date. It is possible to skip certain days or hours in order to select observation inter‐
vals of interest like periods showing high workloads (fig. 7).
CapSys: A Tool for Macroscopic Capacity Planning
11
Figure 7: Configuration of the analysis time period
6 Workload Conditioning and Analysis
The CapSys capacity planning approach is based on historical workload utilization data ob‐
tained by measurements. Typically the workload data collected during the most recent
weeks or months is used as baseline model. For assessing the installation needs for the near‐
est future these historical data are modified in order to account for any known external in‐
fluences or expected variations. For instance, a capacity planner may know that a certain
LPAR is going to need additional processing power during the next month due to a quar‐
terly closing. Using known forecasting techniques from time series analysis may be insuffi‐
cient at this point, as they can usually generate only a limited (rather small) number of pre‐
dicted data values with an acceptable confidence.
In CapSys, we have chosen and implemented three different types of workload conditioning:
projection, rescaling and shaping.
Projection allows introducing some random behaviour into historical data. Based on utiliza‐
tion values averaged over configurable historical time intervals, and given a desired ran‐
domness (in terms of coefficient of variation), a new time series can be generated, which
mimics the original one to some extent.
M. Tilev, B. Müller‐Clostermann
12
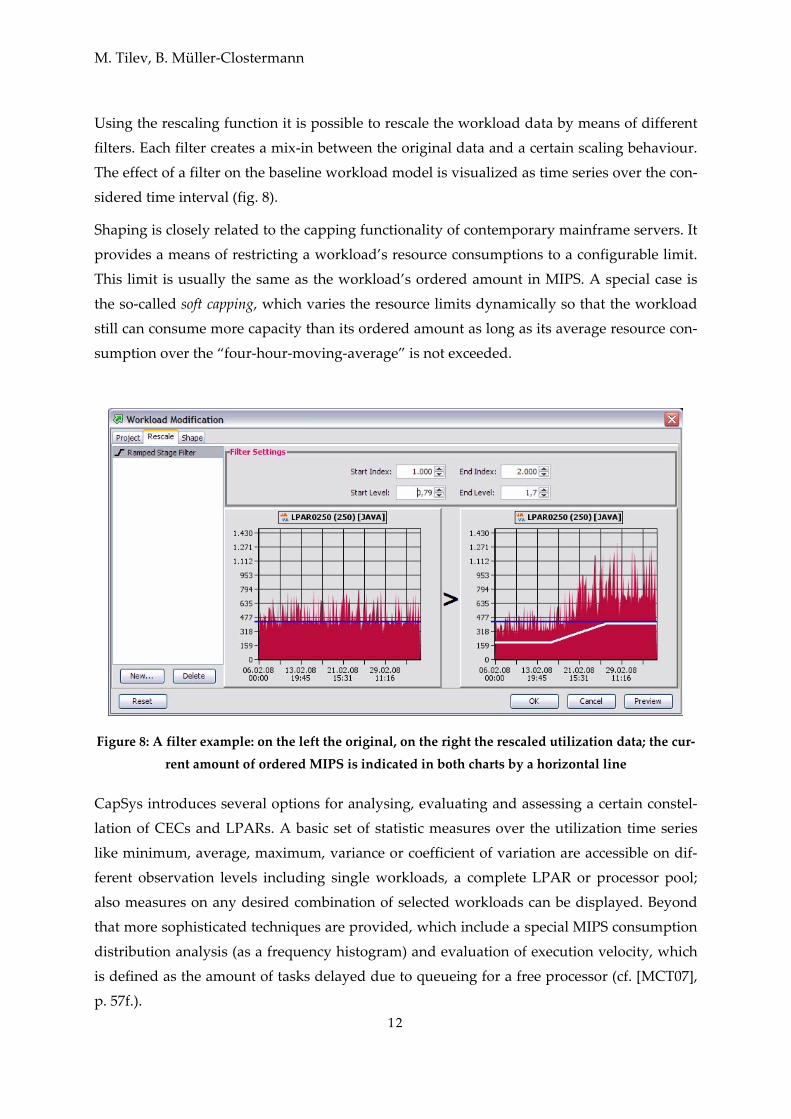
Using the rescaling function it is possible to rescale the workload data by means of different
filters. Each filter creates a mix‐in between the original data and a certain scaling behaviour.
The effect of a filter on the baseline workload model is visualized as time series over the con‐
sidered time interval (fig. 8).
Shaping is closely related to the capping functionality of contemporary mainframe servers. It
provides a means of restricting a workload’s resource consumptions to a configurable limit.
This limit is usually the same as the workload’s ordered amount in MIPS. A special case is
the so‐called soft capping, which varies the resource limits dynamically so that the workload
still can consume more capacity than its ordered amount as long as its average resource con‐
sumption over the “four‐hour‐moving‐average” is not exceeded.
Figure 8: A filter example: on the left the original, on the right the rescaled utilization data; the cur‐
rent amount of ordered MIPS is indicated in both charts by a horizontal line
CapSys introduces several options for analysing, evaluating and assessing a certain constel‐
lation of CECs and LPARs. A basic set of statistic measures over the utilization time series
like minimum, average, maximum, variance or coefficient of variation are accessible on dif‐
ferent observation levels including single workloads, a complete LPAR or processor pool;
also measures on any desired combination of selected workloads can be displayed. Beyond
that more sophisticated techniques are provided, which include a special MIPS consumption
distribution analysis (as a frequency histogram) and evaluation of execution velocity, which
is defined as the amount of tasks delayed due to queueing for a free processor (cf. [MCT07],
p. 57f.).
CapSys: A Tool for Macroscopic Capacity Planning
13
In some situations ‐ depending on the planner’s attitude towards risks ‐ it may be acceptable
that at some (few) points in time the resulting total utilization of a processor pool will exceed
the installed capacity. Since short‐time resource bottlenecks can often be handled success‐
fully by the Workload Manager [IBM07b], mainframes usually perform very well even under
high service demands. In order to consider the resulting risks, a capacity violation analysis
can be carried out, which identifies and quantifies any capacity insufficiencies.
Eventually all capacity‐related considerations and the necessary implementations are related
to economic decisions. Factors that contribute to the overall cost include costs for hardware,
software licences and migration (caused by the movement of LPARs and other required com‐
ponents between different servers). Many of those themselves can be split into further com‐
ponents (e.g. migration costs consist usually of rather high human resource costs, infrastruc‐
ture costs, possibly transportation costs for utilized hardware, etc.). For estimating the total
costs of a planned constellation we currently take into account solely hardware costs for
processing units as well as migration costs per LPAR. The complexity of various cost models
in this context is summarized in [Pila 2008].
7 Related Work
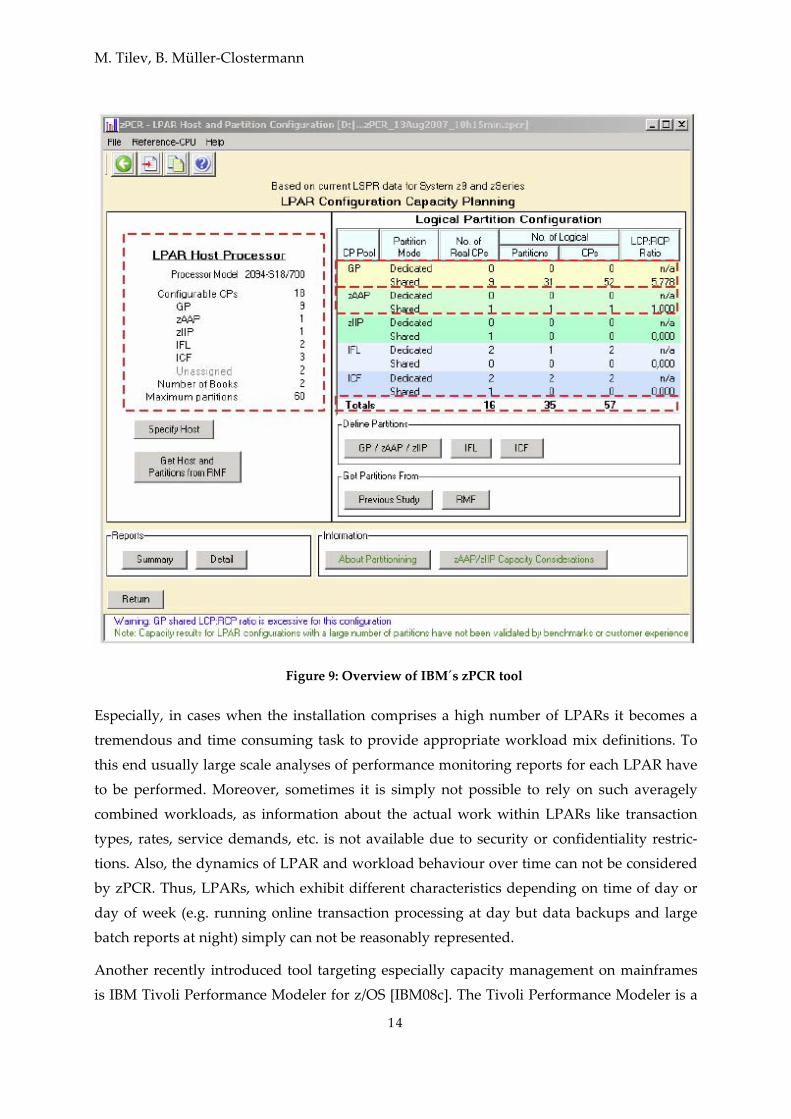
IBM offers several useful tools specifically tailored for mainframe capacity planning. As the
most important example we briefly sketch the freely available zPCR [IBM08a] – IBM’s Proc‐
essor Capacity Reference, which makes intensive use of the so‐called Large Systems Per‐
formance Reference (LSPR, [IBM08b]). LSPR comprises a set of tables obtained from bench‐
marks relating the performance of different workload types running on various server mod‐
els. The results of those benchmarks represent so‐called workload primitives, which – when
combined with each other – enable definition of custom workload types within zPCR. Using
zPCR one can explore the resulting required capacity on a host system after a hardware up‐
grade given a certain set of LPARs with a defined workload mix. Similarly, it is possible to
rate the impact of reconfiguration activities (e.g. changing the types of workload running
within LPARs, altering LPAR weights, adding/removing LPARs and processors, etc.) on ca‐
pacity as experienced by the LPARs. For an overview of the zPCR main window see fig. 9.
However, the drawback of this technique follows from the initial assumption that an installa‐
tion’s workloads can be sufficiently described by combination of predefined workload primi‐
tives.
M. Tilev, B. Müller‐Clostermann
14
Figure 9: Overview of IBM´s zPCR tool
Especially, in cases when the installation comprises a high number of LPARs it becomes a
tremendous and time consuming task to provide appropriate workload mix definitions. To
this end usually large scale analyses of performance monitoring reports for each LPAR have
to be performed. Moreover, sometimes it is simply not possible to rely on such averagely
combined workloads, as information about the actual work within LPARs like transaction
types, rates, service demands, etc. is not available due to security or confidentiality restric‐
tions. Also, the dynamics of LPAR and workload behaviour over time can not be considered
by zPCR. Thus, LPARs, which exhibit different characteristics depending on time of day or
day of week (e.g. running online transaction processing at day but data backups and large
batch reports at night) simply can not be reasonably represented.
Another recently introduced tool targeting especially capacity management on mainframes
is IBM Tivoli Performance Modeler for z/OS [IBM08c]. The Tivoli Performance Modeler is a
CapSys: A Tool for Macroscopic Capacity Planning
15
simulation‐based modelling framework for Windows, which allows detailed manual defini‐
tion of typical z/OS workloads as well as automatic import of relevant modelling information
from monitoring tools like RMF or BMC CMF. With Tivoli Performance Modeler it is possi‐
ble to study the impact of adding zAAPs to an existing environment and rate the potential
amount of Java‐eligible workloads within an LPAR. Of course, all this functionality relies on
availability of precise workload and system descriptions in terms of transaction rates or
counts and service demands for processing, IO as well as memory usage. Modelling of main‐
frame operating systems other than z/OS and its derivates, e.g. z/Linux, z/VSE, z/VM, is not
supported.
Other companies also provide established capacity planning solutions for the mainframe.
BMC Performance Assurance Suite for Mainframes [BMC08] includes a comprehensive set of
integrated tools for analysis, prediction and reporting of mainframe application perform‐
ance. Again, for achieving accurate planning results sufficient information about workload
characteristics of all modelled applications is indispensable.
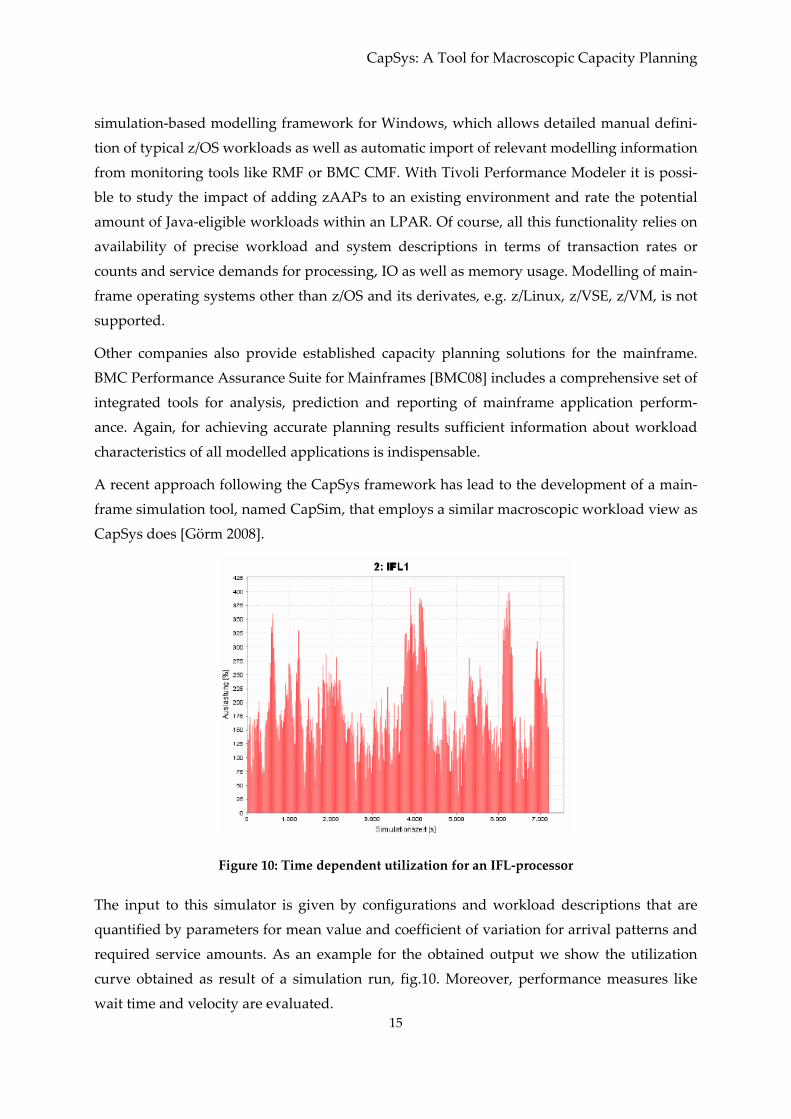
A recent approach following the CapSys framework has lead to the development of a main‐
frame simulation tool, named CapSim, that employs a similar macroscopic workload view as
CapSys does [Görm 2008].
Figure 10: Time dependent utilization for an IFL‐processor
The input to this simulator is given by configurations and workload descriptions that are
quantified by parameters for mean value and coefficient of variation for arrival patterns and
required service amounts. As an example for the obtained output we show the utilization
curve obtained as result of a simulation run, fig.10. Moreover, performance measures like
wait time and velocity are evaluated.
M. Tilev, B. Müller‐Clostermann
16
8 Conclusions
We introduced the CapSys tool supporting capacity planning of mainframe systems, which
implements a rather different approach than other tools in this area do. Because of the high
complexity and other environmental restrictions like security, confidentiality or resource
limitations, sometimes it is not possible to carry out deep analyses of available workloads
and their resource consumptions. As a result, traditional performance modelling based on
simulation or queueing networks can not be applied due to missing or insufficient workload
descriptions and/or system descriptions. The here presented macroscopic technique relies on
historical utilization measurements and considers LPARs and workloads as black boxes with
unknown internal performance behaviour. CapSys includes options for workload condition‐
ing and risk analysis as well as estimation of resulting costs. The practical applications have
been encouraging and have lead to significant savings in time and money.
CapSys has been developed in cooperation and with support from T‐Systems Enterprise Ser‐
vices GmbH (Mainframe Systems Department), Germany.
CapSys: A Tool for Macroscopic Capacity Planning
17
9 References
[BMC08] BMC Software, Inc.: BMC Performance Assurance Suite for Mainframes Homepage; http://www.bmc.com/products/proddocview/0,2832,19052_19429_28287_8580,00.html, last visited: September 11, 2008
[Görm08] Görmann, S.: Simulation von Mainframe‐Workloads zur Ermittlung von Performanz‐Indikatoren. Diploma Thesis (in German), University of Duis‐burg‐Essen, Institut für Informatik und Wirtschaftsinformatik, 2008
[IBM07a] IBM: System z9 Processor Resource/Systems Manager Planning Guide; Third Edition, Document Number SB10‐7041‐02, April 2007, © IBM Corp.
[IBM07b] Cassier, P., Defendi, A., Fischer, D., Hutchinson, J., Maneville, A., Membrini, G., Ong, C., Rowley, A.: System Programmerʹs Guide to: Workload Manager, Forth Edition, SG24‐6472‐03, February 2007, © IBM Corp.
[IBM08a] IBM Corp., zPCR Homepage: http://www‐03.ibm.com/support/techdocs/atsmastr.nsf/WebIndex/PRS1381, last visited: September 11, 2008
[IBM08b] Large System Performance Reference: Twelfth Edition, Document Number SC28‐1187‐12, February 2008, © IBM Corp.; available at http://www‐03.ibm.com/servers/eserver/zseries/lspr/, last visited: September 11, 2008
[IBM08c] IBM Tivoli Performance Modeler for z/OS Homepage, IBM Corp.; http://www‐306.ibm.com/software/tivoli/products/perf‐model‐zos/, last vis‐ited: September 11, 2008
[JAIN91] Jain, R.: The Art of Computer Performance Analysis, Wiley, 1991
[MEAD04] Menascé, D. A., Almeida, V. A., Dowdy, L.: Performance by Design ‐ Com‐puterCapacity Planning by Example. Prentice Hall, 2004
[MCT07] Müller‐Clostermann, B., Tilev, M.: Macroscopic Workload Management and Mainframe Capacity Planning, in: Wolfinger, B., Heidtmann, K. (eds.); Pro‐ceedings of 4. GI/ITG‐Workshop “Leistungs‐, Zuverlässigkeits‐ und Verläss‐lichkeitsbewertung von Kommunikationsnetzen und verteilten Systemen” (MMBnet 2007), September 2007, Universität Hamburg, Department Informa‐tik (Bericht FBI‐HH‐B‐281/07)
[Pila08] Pilarski, S.: Java Workload auf Mainframe Systemen ‐ Monitoring, Analyse und Performance Management (in German), Master Thesis, University of Duisburg‐Essen, Institut für Informatik und Wirtschaftsinformatik, 2008

Previously published ICB ‐ Research Reports
2008
No 25 (August 2008) Eicker, Stefan; Spies, Thorsten; Tschersich, Markus: “Einsatz von Multi‐Touch beim Soft‐waredesign am Beispiel der CRC Card‐Methode”
No 24 (August 2008) Frank, Ulrich: “The MEMO Meta Modelling Language (MML) and Language Architecture – Revised Version”
No 23 (January 2008) Sprenger, Jonas; Jung, Jürgen: “Enterprise Modelling in the Context of Manufacturing – Outline of an Approach Supporting Production Planning”
No 22 (January 2008) Heymans, Patrick; Kang, Kyo‐Chul; Metzger, Andreas, Pohl, Klaus (Eds.): “Second Interna‐tional Workshop on Variability Modelling of Software‐intensive Systemsʺ
2007
No 21 (September 2007) Eicker, Stefan; Annett Nagel; Peter M. Schuler: “Flexibilität im Geschäftsprozess‐management‐Kreislaufʺ
No 20 (August 2007) Blau, Holger; Eicker, Stefan; Spies, Thorsten: “Reifegradüberwachung von Softwareʺ
No 19 (June 2007) Schauer, Carola: “Relevance and Success of IS Teaching and Research: An Analysis of the ‚Relevance Debate’
No 18 (May 2007) Schauer, Carola: “Rekonstruktion der historischen Entwicklung der Wirtschaftsinformatik: Schritte der Institutionalisierung, Diskussion zum Status, Rahmenempfehlungen für die Leh‐re”
No 17 (May 2007) Schauer, Carola; Schmeing, Tobias: “Development of IS Teaching in North‐America: An Analysis of Model Curricula”
No 16 (May 2007) Müller‐Clostermann, Bruno; Tilev, Milen: “Using G/G/m‐Models for Multi‐Server and Mainframe Capacity Planning”
No 15 (April 2007) Heise, David; Schauer, Carola; Strecker, Stefan: “Informationsquellen für IT‐Professionals – Analyse und Bewertung der Fachpresse aus Sicht der Wirtschaftsinformatik”
Previously published ICB ‐ Research Reports
No 14 (March 2007) Eicker, Stefan; Hegmanns, Christian; Malich, Stefan: “Auswahl von Bewertungsmethoden für Softwarearchitekturen”
No 13 (February 2007) Eicker, Stefan; Spies, Thorsten; Kahl, Christian: “Softwarevisualisierung im Kontext service‐orientierter Architekturen”
No 12 (February 2007) Brenner, Freimut: “Cumulative Measures of Absorbing Joint Markov Chains and an Applica‐tion to Markovian Process Algebras”
No 11 (February 2007) Kirchner, Lutz: “Entwurf einer Modellierungssprache zur Unterstützung der Aufgaben des IT‐Managements – Grundlagen, Anforderungen und Metamodell”
No 10 (February 2007) Schauer, Carola; Strecker, Stefan: “Vergleichende Literaturstudie aktueller einführender Lehr‐bücher der Wirtschaftsinformatik: Bezugsrahmen und Auswertung”
No 9 (February 2007) Strecker, Stefan; Kuckertz, Andreas; Pawlowski, Jan M.: “Überlegungen zur Qualifizierung des wissenschaftlichen Nachwuchses: Ein Diskussionsbeitrag zur (kumulativen) Habilitation”
No 8 (February 2007) Frank, Ulrich; Strecker, Stefan; Koch, Stefan: “Open Model ‐ Ein Vorschlag für ein For‐schungsprogramm der Wirtschaftsinformatik (Langfassung)”
2006
No 7 (December 2006) Frank, Ulrich: “Towards a Pluralistic Conception of Research Methods in Information Sys‐tems Research”
No 6 (April 2006) Frank, Ulrich: “Evaluation von Forschung und Lehre an Universitäten – Ein Diskussionsbei‐trag”
No 5 (April 2006) Jung, Jürgen: “Supply Chains in the Context of Resource Modelling”
No 4 (February 2006) Lange, Carola: “Development and status of the Information Systems / Wirtschaftsinformatik discipline: An interpretive evaluation of interviews with renowned researchers, Part III – Re‐sults Wirtschaftsinformatik Discipline”
2005
No 3 (December 2005) Lange, Carola: “Development and status of the Information Systems / Wirtschaftsinformatik discipline: An interpretive evaluation of interviews with renowned researchers, Part II – Re‐sults Information Systems Discipline”
No 2 (December 2005) Lange, Carola: “Development and status of the Information Systems / Wirtschaftsinformatik discipline: An interpretive evaluation of interviews with renowned researchers, Part I – Re‐search Objectives and Method”
No 1 (August 2005) Lange, Carola: „Ein Bezugsrahmen zur Beschreibung von Forschungsgegenständen und ‐methoden in Wirtschaftsinformatik und Information Systems“


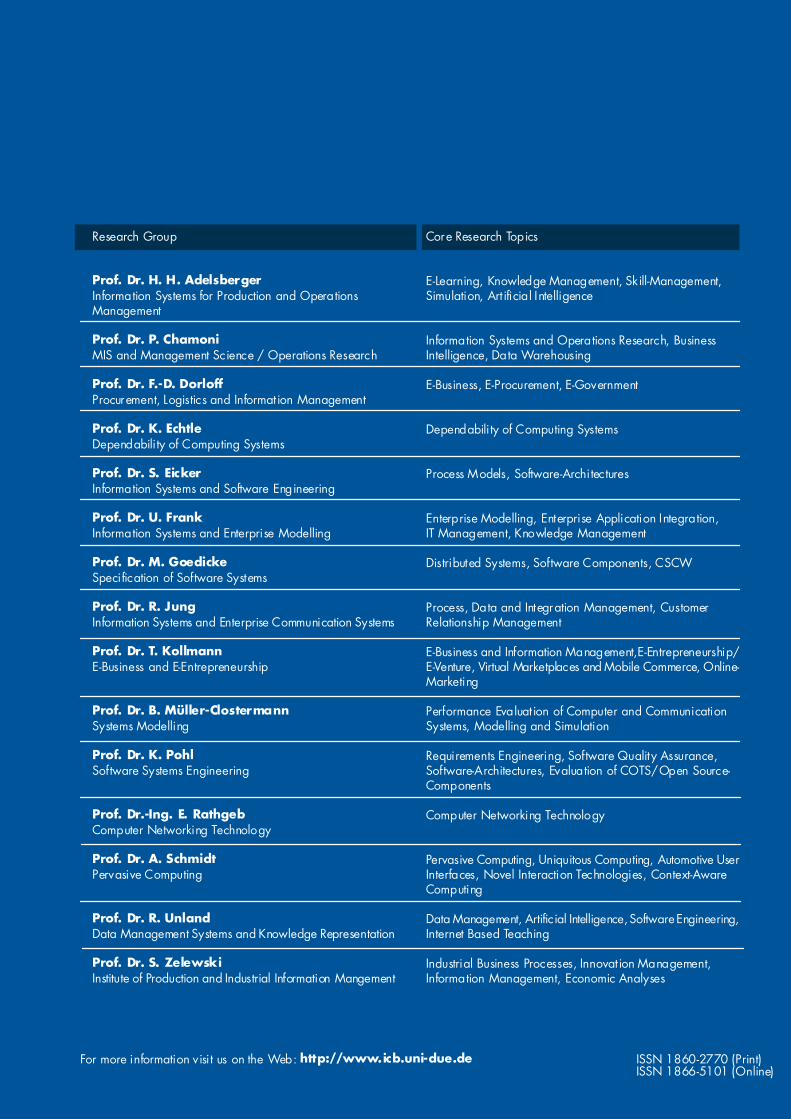
The Institute for Computer Science and Business Information Systems (ICB), located at the Essen Campus, is dedicated to researchand teaching in Applied Computer Science, Information Systems as well as Information Management. The ICB research groupscover a wide range of exper tise:
For more information visit us on the Web: http://www.icb.uni-due.de ISSN 1860-2770 (Print)ISSN 1866-5101 (Online)
Research Group
Prof. Dr. H. H. AdelsbergerInformation Systems for Production and OperationsManagement
Prof. Dr. P. ChamoniMIS and Management Science / Operations Research
Prof. Dr. F.-D. DorloffProcurement, Logistics and Information Management
Prof. Dr. K. EchtleDependability of Computing Systems
Prof. Dr. S. EickerInformation Systems and Software Engineering
Prof. Dr. U. FrankInformation Systems and Enterprise Modelling
Prof. Dr. M. GoedickeSpecification of Software Systems
Prof. Dr. R. JungInformation Systems and Enterprise Communication Systems
Prof. Dr. T. KollmannE-Business and E-Entrepreneurship
Prof. Dr. B. Müller-ClostermannSystems Modelling
Prof. Dr. K. PohlSoftware Systems Engineering
Prof. Dr.-Ing. E. RathgebComputer Networking Technology
Prof. Dr. A. SchmidtPervasive Computing
Prof. Dr. R. UnlandData Management Systems and Knowledge Representation
Prof. Dr. S. ZelewskiInstitute of Production and Industrial Information Mangement
Core Research Topics
E-Learning, Knowledge Management, Skill-Management,Simulation, Art ificial Intelligence
Information Systems and Operations Research, BusinessIntelligence, Data Warehousing
E-Business, E-Procurement, E-Government
Dependability of Computing Systems
Process Models, Software-Architectures
Enterprise Modelling, Enterprise Application Integration,IT Management, Knowledge Management
Distributed Systems, Software Components, CSCW
Process, Data and Integration Management, CustomerRelationship Management
E-Business and Information Management,E-Entrepreneurship/E-Venture, Virtual Marketplaces and Mobile Commerce, Online-Marketing
Performance Evaluat ion of Computer and CommunicationSystems, Modelling and Simulation
Requirements Engineering, Software Quality Assurance,Software-Architectures, Evaluation of COTS/Open Source-Components
Computer Networking Technology
Pervasive Computing, Uniquitous Computing, Automotive UserInterfaces, Novel Interaction Technologies, Context-AwareComputing
Data Management, Artificial Intelligence, Software Engineering,Internet Based Teaching
Industrial Business Processes, Innovation Management,Information Management, Economic Analyses