Embed Size (px)
Citation preview
Capture, Storage and Use of CO2 (CCUS)
Reservoir data – Stenlille area (Part of Work package 6)
Lars Kristensen
DANMARKS OG GRØNLANDS GEOLOGISKE UNDERSØGELSE RAPPORT 2020/28
GEOLOGICAL SURVEY OF DENMARK AND GREENLANDDANISH MINISTRY OF CLIMATE, ENERGY AND UTILITIES
Capture, Storage and Use of CO2 (CCUS)Reservoir data – Stenlille area
(Part of Work package 6)
Lars Kristensen
DANMARKS OG GRØNLANDS GEOLOGISKE UNDERSØGELSE RAPPORT 2020/28
GEOLOGICAL SURVEY OF DENMARK AND GREENLANDDANISH MINISTRY OF CLIMATE, ENERGY AND UTILITIES
G E U S 3
Contents
Preface 4
Dansk sammendrag 5
Summary 6
Introduction 7
Database 8
Results 9
Formation tops and reservoir subdivision ............................................................................. 10
Reservoir parameters............................................................................................................. 11
Porosity-permeability relationships ....................................................................................... 11
The DONG Zonation and corresponding reservoir parameters ............................................. 14
A 2-layer model and corresponding reservoir parameters ................................................... 15
Future work 17
References 18
Tables for documentation 19
Table 1: List of well tops (picks) in the Stenlille wells ............................................................ 20
Table 2: Reservoir parameters for the Gassum Formation using the DONG zonation.......... 25
Table 3: Generalized reservoir parameters for the Gassum Formation zones ...................... 45
Table 4: Reservoir parameters for the Gassum Formation using a 2-layer model ................ 46
G E U S 4
Preface
Late 2019, GEUS was asked to lead research initiatives in 2020 related to technical barriers for
Carbon Capture, Storage and Usage (CCUS) in Denmark and to contribute to establishment of a
technical basis for opportunities for CCUS in Denmark. The task encompasses (1) the technical
potential for the development of cost-effective CO2 capture technologies, (2) the potentials for
both temporary and permanent storage of CO2 in the Danish subsurface, (3) mapping of
transport options between point sources and usage locations or storage sites, and (4) the CO2
usage potentials, including business case for converting CO2 to synthetic fuel production (PtX).
The overall aim of the research is to contribute to the establishment of a Danish CCUS research
centre and the basis for 1-2 large-scale demonstration plants in Denmark.
The present report forms part of Work package 6 and focuses on evaluation of reservoir data
and reservoir subdivision. A comprehensive dataset exists from the Stenlille area, and this da-
taset has been used to predict and extrapolate reservoir parameters to the Havnsø structure.
The overall objective is to examine the possibilities of CO2 storage in sandstone reservoirs like
the Stenlille Gassum Formation. Hence, the existing log and core analysis data acquired in the
Stenlille wells have been evaluated, addressing the clay content, porosity, and permeability.
G E U S 5
Dansk sammendrag
GEUS har udført en petrofysisk evaluering af loggene fra Stenlille boringerne. Evalueringen er
foretaget med henblik på at bestemme den bjergartsmæssige sammensætning af Gassum og
Fjerritslev formationerne. Desuden har formålet været at vurdere ler-indholdet og porøsiteten
i de sandstenslag, der udgør potentielle lagerzoner (reservoir-zoner). Herudover er variationer i
permeabiliteten estimeret ud fra målinger på kernemateriale. Stenlille reservoiret anses for at
være sammenligneligt med reservoiret i Havnsø strukturen, og Stenlille data kan derfor bruges
som forlæg for vurderingen af reservoiregenskaberne ved Havnsø. Baseret på den nuværende
geologiske viden forventes Gassum Formationen ved Havnsø i nogle intervaller at have lidt færre
og tyndere sandstenslag, og desuden forventes det, at sandstenene har lidt lavere porøsiteter
end ved Stenlille. Dermed forventes formationens Net-gross forhold også at være lidt lavere ved
Havnsø. Net-gross forholdet angiver den forventede andel af sand med gode reservoiregenska-
ber set i forhold til den samlede tykkelse af formationen, se herunder:
Formations- tykkelse (m)
Net/gross Gennemsnits- porøsitet (%)
Stenlille, log tolkning 150 0,69 24
Havnsø, prognose 200 0,67 22
Til trods for de lidt lavere Net/gross- og porøsitetsværdier ved Havnsø er tallene positive med
hensyn til Gassum Formationens egnethed som reservoir til at lagre CO2. De prognosticerede
reservoirparametre peger på, at sandstenlagene i Havnsø strukturen med stor sandsynlighed vil
være egnede for CO2 lagring. Det skal dog bemærkes, at usikkerheden på den forventede for-
mationstykkelse ved Havnsø er relativ stor på grund af ringe kvalitet af de eksisterende seismiske
data (cf. Gregersen et al., 2020). Denne usikkerhed vil kunne reduceres ved indsamling af nye
seismiske data af høj kvalitet (3D data).

G E U S 6
Summary
A petrophysical evaluation of the Stenlille wells is presented, based on log and core data – and
it includes a lithological interpretation along with determination of reservoir parameters. It is
assumed that the geological development of the Havnsø structure, including the depositional
pattern of the Gassum Formation, share similarities with the development of the Stenlille struc-
ture and the Gassum Formation. Accordingly, the reservoir zonation of the Gassum Formation
at Stenlille may to a large extend also apply to Havnsø and presumably, the Stenlille reservoir
parameters can be credibly extrapolated to the Havnsø area. The seismic interpretation indicate
that the Gassum Formation is found at similar depths at Stenlille and Havnsø, but the position
in the sedimentary basin is somewhat different, as the Havnsø structure may be located in a
more distal position in the basin compared to Stenlille. This difference means that the number
of sandstone beds, their individual thicknesses as well as their porosities and permeabilities may
be slightly lower at Havnsø in some intervals. With respect to generalized reservoir parameters
for the Gassum Formation Zones, reference is made to Table 3. The data analysis points to the
following overall reservoir parameters:
Gross thickness
(m)
Net/gross Avg. Porosity
(%)
Stenlille, log evaluation 150 0.69 24
Havnsø, prognosis 200 0.67 22
The Stenlille structure has proven suitable for gas storage, and the prognosed reservoir param-
eters for the Havnsø structure (as listed above) suggest that the Gassum Formation sandstone
reservoir at Havnsø is suitable for CO2 storage. However, the prognosed Gross thickness at
Havnsø is associated with considerable uncertainty due to rather low quality of the existing seis-
mic data (Gregersen et al., 2020). Acquisition of new 3D seismic data covering the Havnsø struc-
ture is required to reduce this uncertainty.
G E U S 7
Introduction
The present study focuses on evaluation of reservoir data and reservoir subdivision. The objec-
tive is to examine the possibilities of CO2 storage in sandstone reservoirs similar to the Stenlille
Gassum Formation reservoir. A comprehensive dataset exists from the Stenlille area, and this
dataset has been used to predict and extrapolate reservoir parameters to the Havnsø structure.
Hence, the existing data acquired in the Gassum Formation in the Stenlille wells have been eval-
uated, addressing e.g. the porosity and clay content – and in addition, a permeability estimate
is derived. The permeability is based on porosities interpreted from wireline log data combined
with information from porosity-permeability relations. The permeability has not been logged in
any Stenlille well, meaning that an artificial permeability log must be generated prior to address-
ing the reservoir properties. The interpretation of the clay content (shale volume) is based on
the gamma ray log, and the porosity is calculated from the neutron-density logs combined with
the shale volume estimate.
G E U S 8
Database
The ‘Stenlille database’ consists of cuttings descriptions, cores, core analysis data, wireline logs
along with well completions reports and information from well test reports.
The locations of the Stenlille wells are shown in Figure 1 along with a top Gassum Formation
depth structure map. The Stenlille structure, with a total of 20 wells, have 6 deviated wells out
of the 19 reaching into the reservoir in the Gassum Formation. One well (Stenlille-3) has TD
above the reservoir and is used for monitoring purposes in a sandstone layer in the overlying
seal formation of the Fjerritslev Formation. The Stenlille-19 well has TD as deep as 2570 m and
apart from the Fjerritslev and Gassum formations, this well also tests the underlying Bunter
Sandstone Formation.
The Gassum Formation has been logged in most Stenlille wells, whereas the Fjerritslev For-
mation only has been logged in a limited number of wells.
The Gassum Formation is partly cored in the Stenlille-1, -2, -4, -5, -6, -10, -12, -13, -14, -15, -17
and -19 wells. The Stenlille-19 well penetrates the deep-lying Bunter Sandstone Formation as
stated above, and parts of the Bunter Sandstone Formation are cored in this well.
G E U S 9
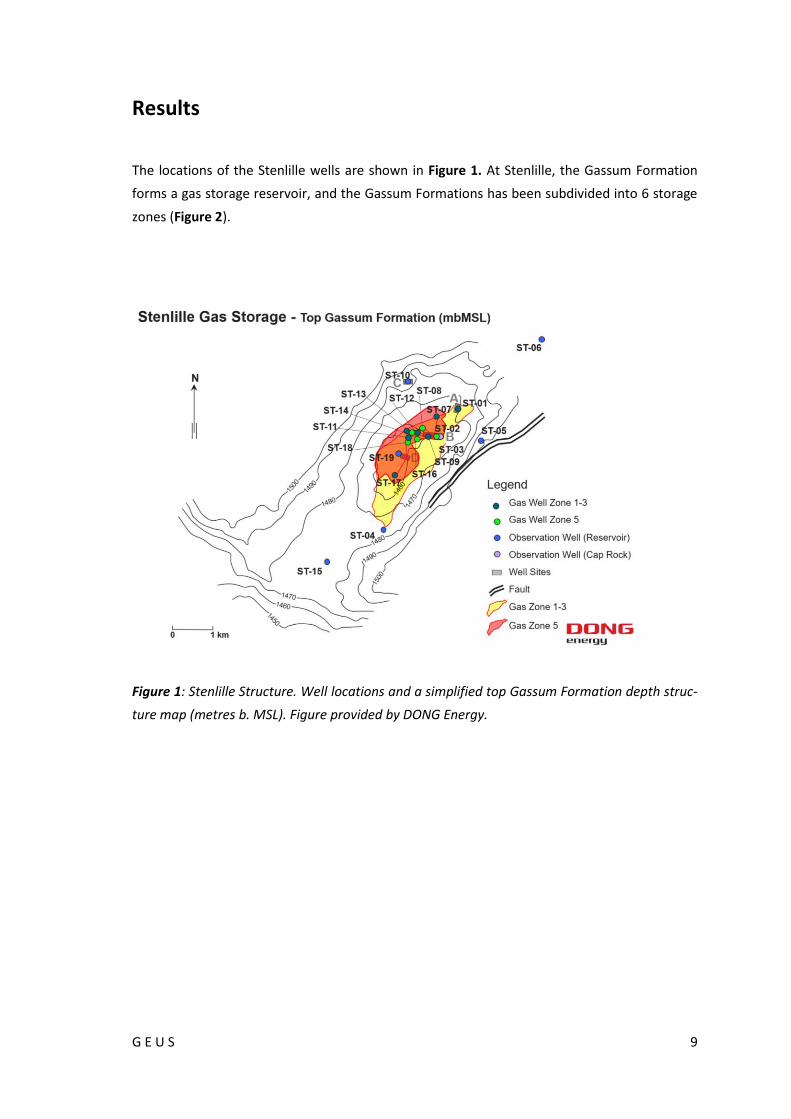
Results
The locations of the Stenlille wells are shown in Figure 1. At Stenlille, the Gassum Formation
forms a gas storage reservoir, and the Gassum Formations has been subdivided into 6 storage
zones (Figure 2).
Figure 1: Stenlille Structure. Well locations and a simplified top Gassum Formation depth struc-
ture map (metres b. MSL). Figure provided by DONG Energy.
G E U S 10
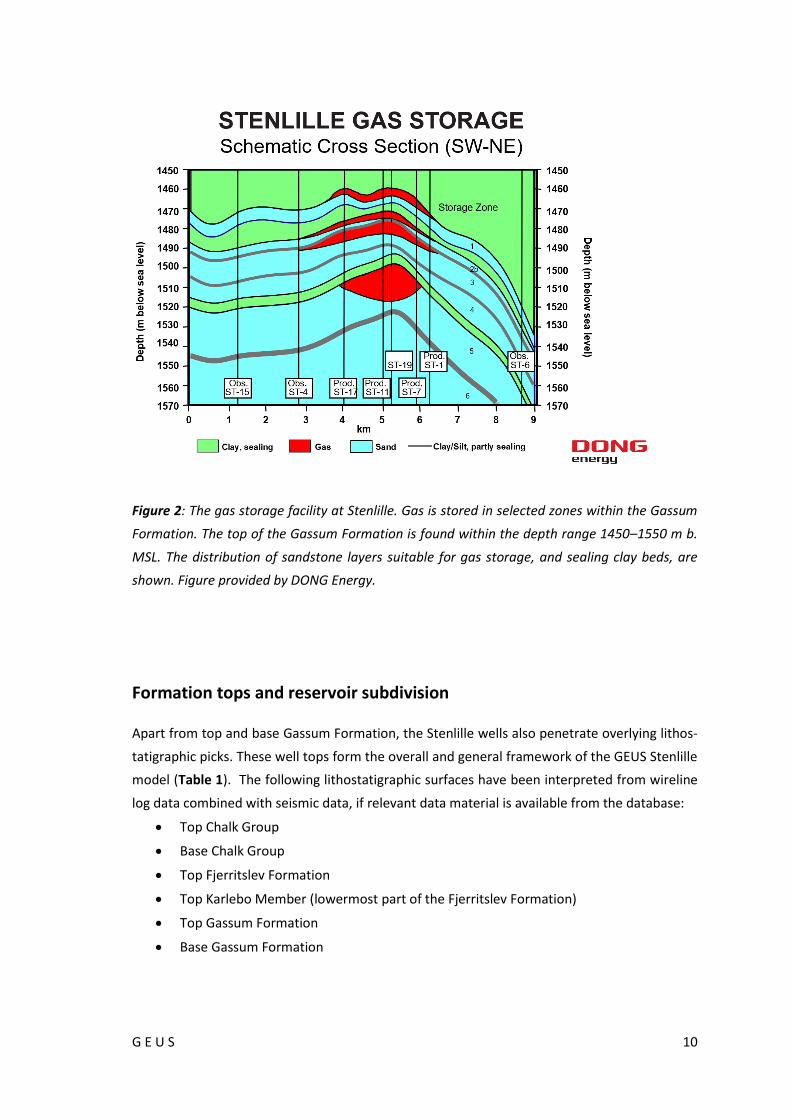
Figure 2: The gas storage facility at Stenlille. Gas is stored in selected zones within the Gassum
Formation. The top of the Gassum Formation is found within the depth range 1450–1550 m b.
MSL. The distribution of sandstone layers suitable for gas storage, and sealing clay beds, are
shown. Figure provided by DONG Energy.
Formation tops and reservoir subdivision
Apart from top and base Gassum Formation, the Stenlille wells also penetrate overlying lithos-
tatigraphic picks. These well tops form the overall and general framework of the GEUS Stenlille
model (Table 1). The following lithostatigraphic surfaces have been interpreted from wireline
log data combined with seismic data, if relevant data material is available from the database:
• Top Chalk Group
• Base Chalk Group
• Top Fjerritslev Formation
• Top Karlebo Member (lowermost part of the Fjerritslev Formation)
• Top Gassum Formation
• Base Gassum Formation
G E U S 11
DONG Energy suggests subdividing the reservoir section (Gassum Formation) into 6 major Stor-
age Zones, some of them also including sub-zones of clayey non-reservoir intervals (cf. Figure
2). The DONG zonation is based primarily on differences in log motifs:
• Zone 1
• Zone 2; further subdivided into 2a and 2b.
• Zone 3
• Zone 4
• Zone 5; further subdivided into 5_clay, 5_sand.
• Zone 6; further subdivided into 6_clay, 6_sand and 6_base.
Each storage zone is assigned reservoir parameters, including net sand thicknesses along
with zonal averages for porosity, shale volume, and permeability (Table 2). The porosity,
shale volume and permeability values result from a petrophysical evaluation carried out by
GEUS using primarily log and core data. Prior to calculating reservoir parameters, cut-offs
were applied to disregard clayey parts. Thus, the calculated values presume minimum 15%
porosity and maximum 30% shale.
Reservoir parameters
The shale volume and porosity are interpreted from wire-line log data, whereas the permeability
is estimated from the log-derived porosity combined with core analysis data.
Porosity-permeability relationships
The core porosity and core permeability data provide reasonable porosity-permeability relations
that can be used for estimating the permeability when the porosity is known. The porosity-per-
meability relations that has been established for the Gassum Formation in the Stenlille area is
illustrated in Figure 3. The conventional core analysis data point to the presence of more rela-
tionships as the depositional environment varies throughout late Triassic–early Jurassic times,
and hence the grain size and clay content of the Gassum Formation sandstones vary with depth.
Accordingly, two distinct poro-perm models are suggested: one relation for the Upper sand-
stone layers (corresponding to Zones 1–5), and one relation for the Lower sandstone layers (i.e.
Zone 6 incl. sub-zones).
G E U S 12
Figure 3: Porosity-permeability relationships for the Gassum Formation sandstones. Based on
conventional core analysis data from cored Stenlille wells. The black line represents the upper
part of the Gassum Formation, the red line represents the lower part of the Gassum Formation.
Permeability values are gas permeabilities measured in a core laboratory (GEUS, COREX etc.).
The data points in orange and the orange trend line refer to the General GEUS Poro-Perm Model
representing the Gassum Formation outside the Stenlille area (included for comparison).
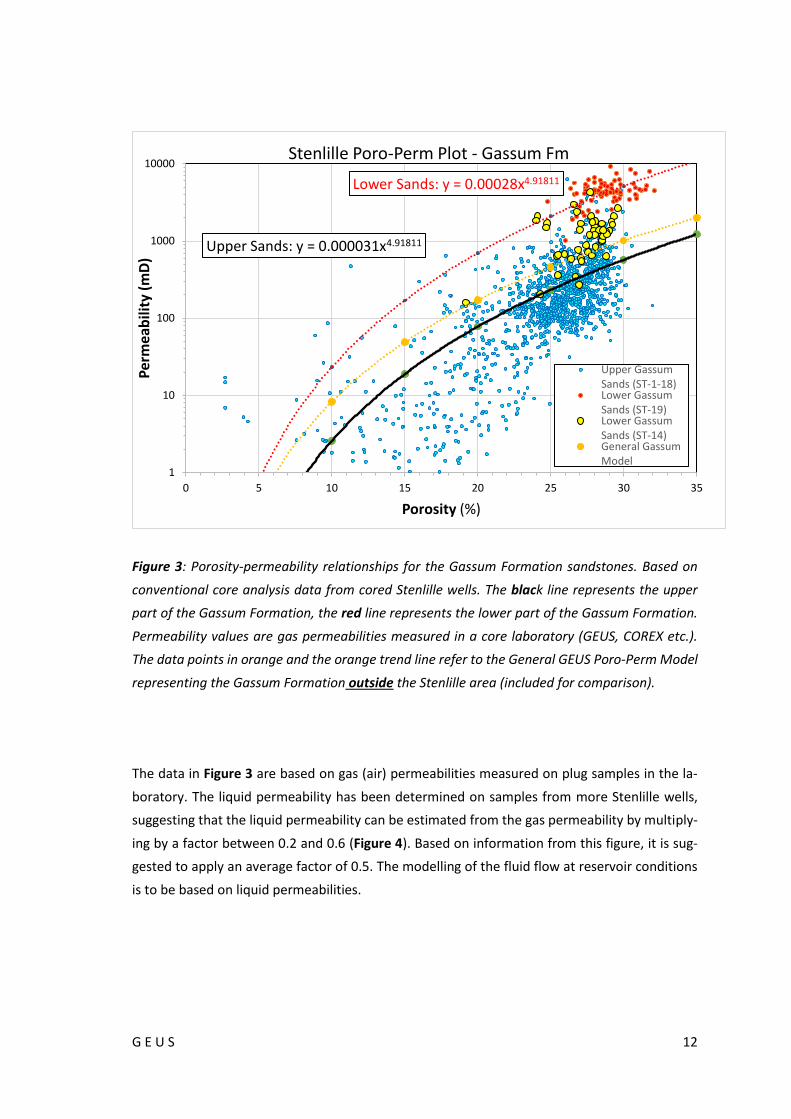
The data in Figure 3 are based on gas (air) permeabilities measured on plug samples in the la-
boratory. The liquid permeability has been determined on samples from more Stenlille wells,
suggesting that the liquid permeability can be estimated from the gas permeability by multiply-
ing by a factor between 0.2 and 0.6 (Figure 4). Based on information from this figure, it is sug-
gested to apply an average factor of 0.5. The modelling of the fluid flow at reservoir conditions
is to be based on liquid permeabilities.
Upper Sands: y = 0.000031x4.91811
Lower Sands: y = 0.00028x4.91811
1
10
100
1000
10000
0 5 10 15 20 25 30 35
Per
mea
bili
ty (
mD
)
Porosity (%)
Stenlille Poro-Perm Plot - Gassum Fm
Upper GassumSands (ST-1-18)Lower GassumSands (ST-19)Lower GassumSands (ST-14)General GassumModel
G E U S 13
Figure 4: Relationship between gas permeability and liquid permeability. Based on core analysis
data from the Stenlille-2, -4, -5 and 6 wells.
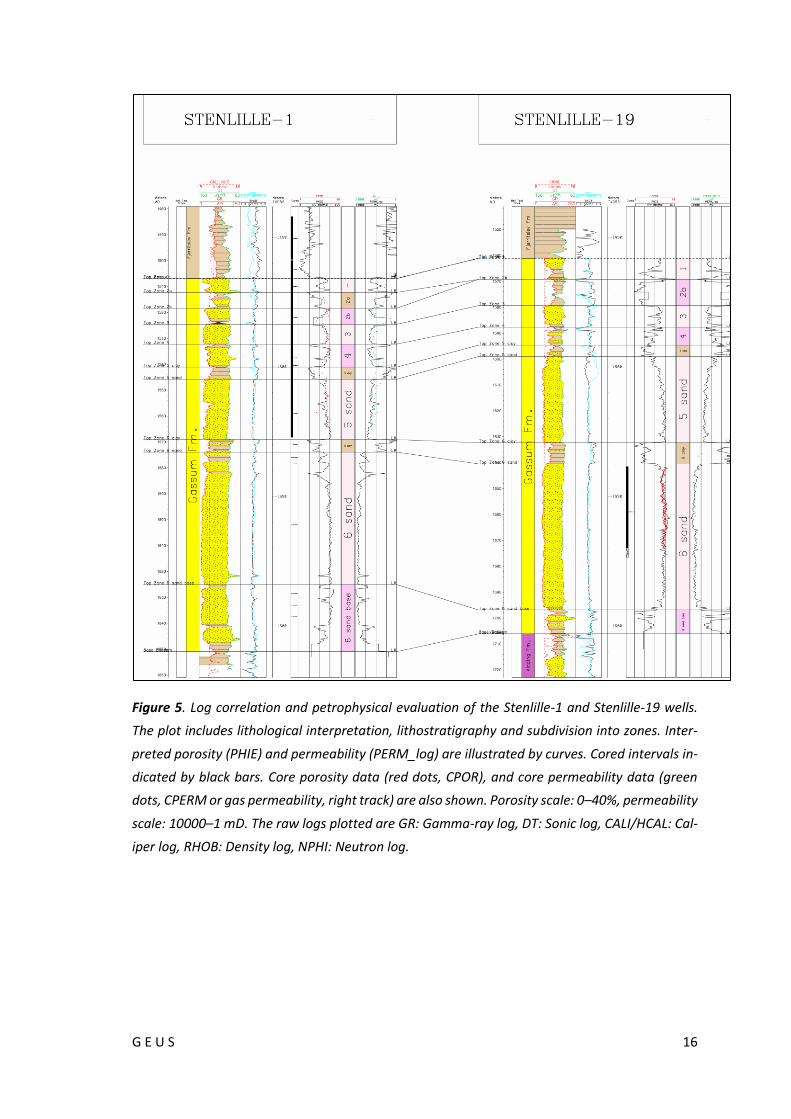
Examples of petrophysical evaluation result displays (CPI plots) are presented in Figure 5. Each
plot includes a lithological interpretation of the Gassum Formation along with interpreted po-
rosities and permeabilities. Furthermore, the reservoir zonation and a number of raw logs
(gamma-ray, sonic, neutron-density and caliper) are plotted as well.
G E U S 14
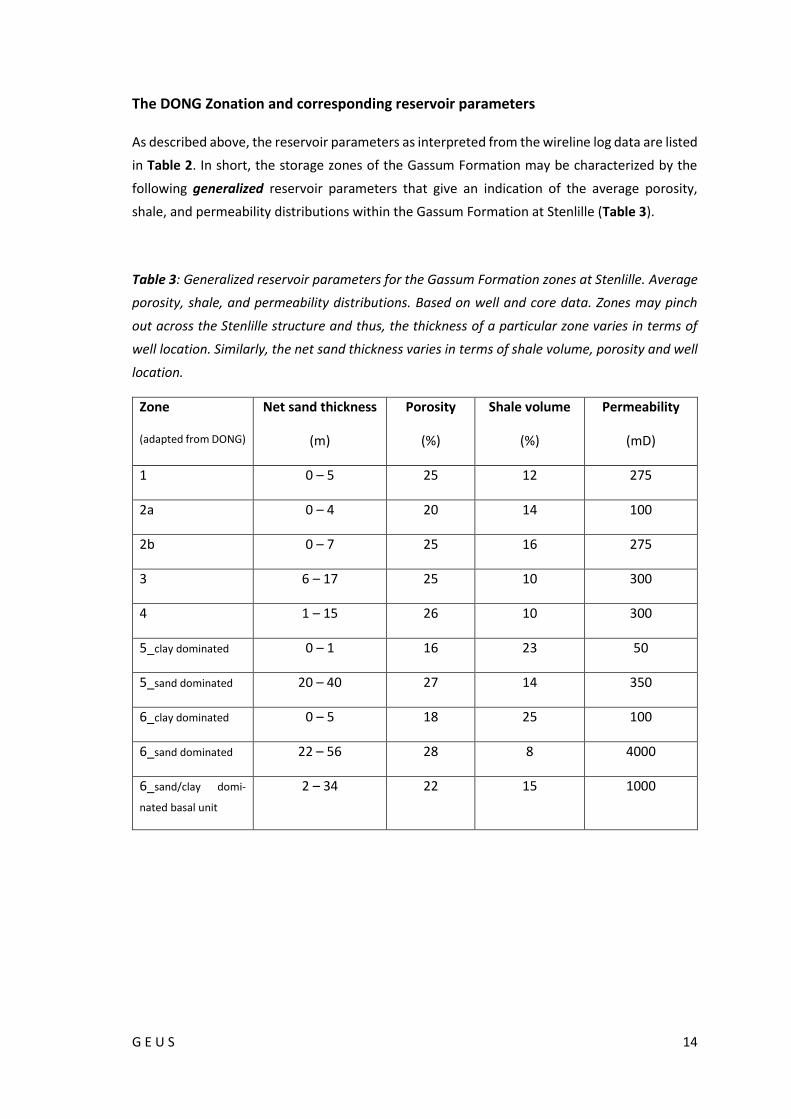
The DONG Zonation and corresponding reservoir parameters
As described above, the reservoir parameters as interpreted from the wireline log data are listed
in Table 2. In short, the storage zones of the Gassum Formation may be characterized by the
following generalized reservoir parameters that give an indication of the average porosity,
shale, and permeability distributions within the Gassum Formation at Stenlille (Table 3).
Table 3: Generalized reservoir parameters for the Gassum Formation zones at Stenlille. Average
porosity, shale, and permeability distributions. Based on well and core data. Zones may pinch
out across the Stenlille structure and thus, the thickness of a particular zone varies in terms of
well location. Similarly, the net sand thickness varies in terms of shale volume, porosity and well
location.
Zone
(adapted from DONG)
Net sand thickness
(m)
Porosity
(%)
Shale volume
(%)
Permeability
(mD)
1 0 – 5 25 12 275
2a 0 – 4 20 14 100
2b 0 – 7 25 16 275
3 6 – 17 25 10 300
4 1 – 15 26 10 300
5_clay dominated 0 – 1 16 23 50
5_sand dominated 20 – 40 27 14 350
6_clay dominated 0 – 5 18 25 100
6_sand dominated 22 – 56 28 8 4000
6_sand/clay domi-
nated basal unit
2 – 34 22 15 1000
G E U S 15
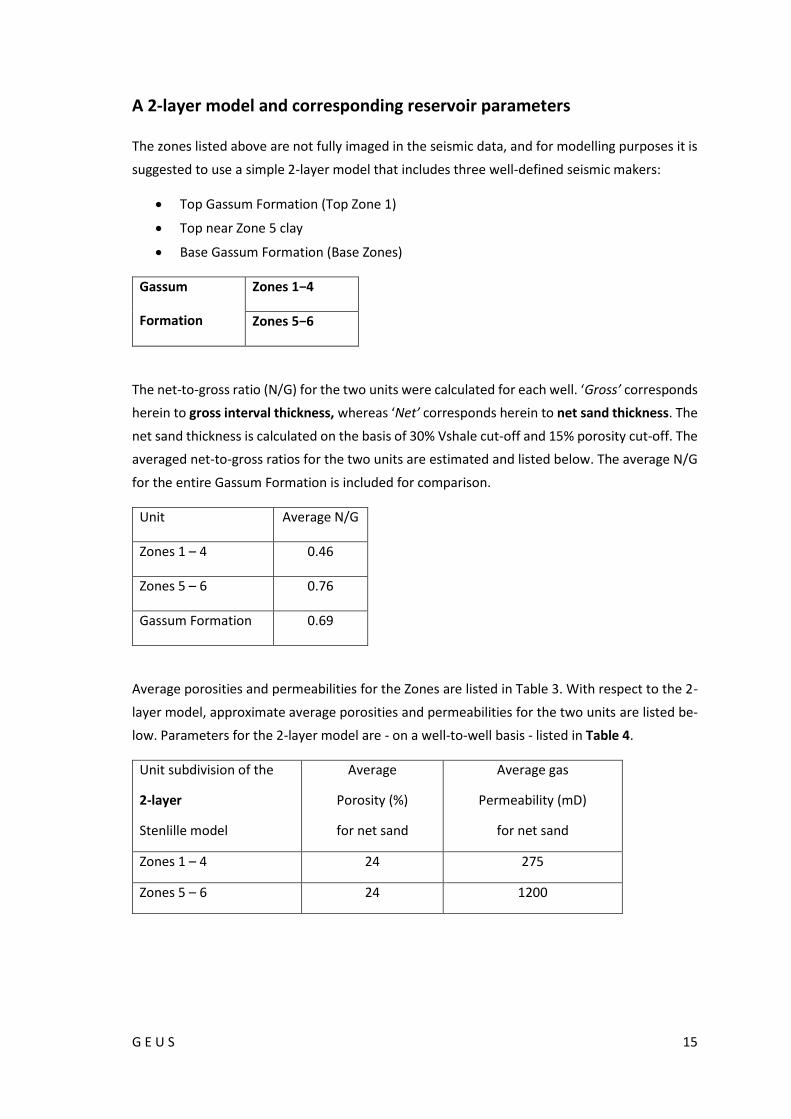
A 2-layer model and corresponding reservoir parameters
The zones listed above are not fully imaged in the seismic data, and for modelling purposes it is
suggested to use a simple 2-layer model that includes three well-defined seismic makers:
• Top Gassum Formation (Top Zone 1)
• Top near Zone 5 clay
• Base Gassum Formation (Base Zones)
Gassum
Formation
Zones 1−4
Zones 5−6
The net-to-gross ratio (N/G) for the two units were calculated for each well. ‘Gross’ corresponds
herein to gross interval thickness, whereas ‘Net’ corresponds herein to net sand thickness. The
net sand thickness is calculated on the basis of 30% Vshale cut-off and 15% porosity cut-off. The
averaged net-to-gross ratios for the two units are estimated and listed below. The average N/G
for the entire Gassum Formation is included for comparison.
Unit Average N/G
Zones 1 – 4 0.46
Zones 5 – 6 0.76
Gassum Formation 0.69
Average porosities and permeabilities for the Zones are listed in Table 3. With respect to the 2-
layer model, approximate average porosities and permeabilities for the two units are listed be-
low. Parameters for the 2-layer model are - on a well-to-well basis - listed in Table 4.
Unit subdivision of the
2-layer
Stenlille model
Average
Porosity (%)
for net sand
Average gas
Permeability (mD)
for net sand
Zones 1 – 4 24 275
Zones 5 – 6 24 1200
G E U S 16
Figure 5. Log correlation and petrophysical evaluation of the Stenlille-1 and Stenlille-19 wells.
The plot includes lithological interpretation, lithostratigraphy and subdivision into zones. Inter-
preted porosity (PHIE) and permeability (PERM_log) are illustrated by curves. Cored intervals in-
dicated by black bars. Core porosity data (red dots, CPOR), and core permeability data (green
dots, CPERM or gas permeability, right track) are also shown. Porosity scale: 0–40%, permeability
scale: 10000–1 mD. The raw logs plotted are GR: Gamma-ray log, DT: Sonic log, CALI/HCAL: Cal-
iper log, RHOB: Density log, NPHI: Neutron log.
G E U S 17
Future work
Throughout the Gassum and Fjerritslev formations, the current lithological interpretation pre-
sumes either a sandstone or a clay lithology. This interpretation is based on raw gamma-ray logs
combined with neutron-density log responses, and the present evaluation meets the need for a
standard petrophysical assessment of lithology and porosity. The current lithological interpreta-
tion is, however, very sensitive to the precision of the sand/shale baseline used for lithology
determination. It is suggested, therefore, to carry out a more detailed Stenlille field study based
on normalized gamma-ray logs to ensure that the variation in shale volume is consistently and
accurately determined throughout the field/structure. The latter includes an adjustment of the
sand/shale baseline. The distribution of sandstone and shale directly influences the variation in
the net-to-gross ratio in the wells. Furthermore, the well data form the basis of determining a
field scale net-to-gross ratio that may be used as a template for Havnsø structure evaluation.
A comprehensive core description study has been carried out as part of Workpage 6 in the CCUS
project (Hovikoski & Pedersen 2020). The lithological interpretation of the Gassum and Fjer-
ritslev formations presented herein may be improved by combining the core descriptions and
the current (standard) petrophysical and lithological evaluation.
The present study – forming part of Workpage 6 in the CCUS project – focuses on evaluating
Stenlille reservoir data. A more comprehensive integration with interpreted geological models
and seismic data in the Stenlille–Havnsø area (Gregersen et al. 2020, Hovikoski & Pedersen 2020
and Vosgerau et al. 2020) may further improve the prognosticating of the sandstone-claystone
distribution and reservoir properties of sandstones within the Gassum Formation in the Havnsø
structure.

G E U S 18
References
Gregersen, U., Vosgerau, H. Laghari, S., Bredesen, K., Rasmussen, R. & Mathiesen, A. 2020: Cap-
ture, Storage and Use of CO2 (CCUS). Seismic interpretation of existing 2D and 3D seismic data
around the Havnsø structure (Part of Work package 5 in the CCUS project). Danmark og Grøn-
lands Geologiske Undersøgelse Rapport 2020/33, 60 pp.
Hovikoski, J. & Pedersen, G. 2020: Capture, Storage and Use of CO2 (CCUS). Sedimentological
description of cores from wells in the Stenlille area, with interpretations of depositional envi-
ronments. (Part of Work package 6 in the CCUS project). Danmark og Grønlands Geologiske Un-
dersøgelse Rapport 2020/42, 26pp.
Vosgerau, H., Gregersen, U. & Laghari, S., 2020: Capture, Storage and Use of CO2 (CCUS). Seismic
interpretation of existing 3D seismic data around the Stenlille structure within the framework of
sequence stratigraphy and with focus on the Gassum Formation. (Part of Work package 6 in the
CCUS project). Danmark og Grønlands Geologiske Undersøgelse Rapport 2020/34, 54pp.
G E U S 19
Tables for documentation
G E U S 20
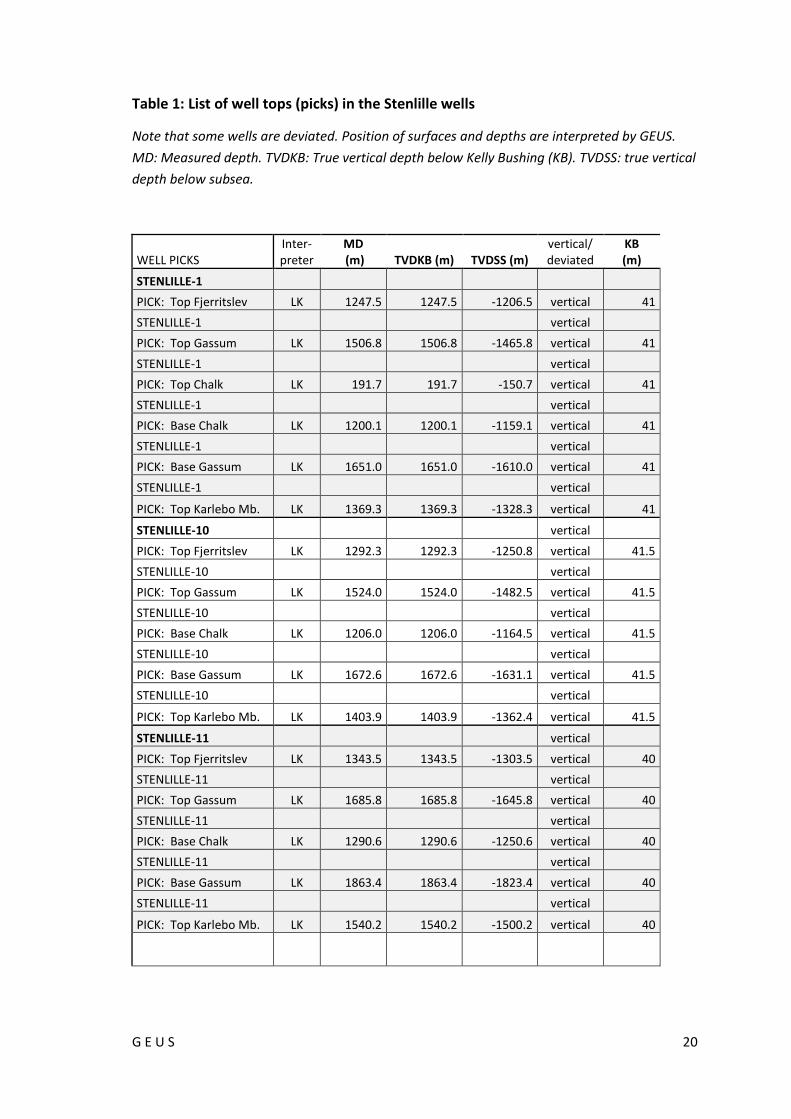
Table 1: List of well tops (picks) in the Stenlille wells
Note that some wells are deviated. Position of surfaces and depths are interpreted by GEUS.
MD: Measured depth. TVDKB: True vertical depth below Kelly Bushing (KB). TVDSS: true vertical
depth below subsea.
WELL PICKS Inter-preter
MD (m) TVDKB (m) TVDSS (m)
vertical/ deviated
KB (m)
STENLILLE-1
PICK: Top Fjerritslev LK 1247.5 1247.5 -1206.5 vertical 41
STENLILLE-1 vertical
PICK: Top Gassum LK 1506.8 1506.8 -1465.8 vertical 41
STENLILLE-1 vertical
PICK: Top Chalk LK 191.7 191.7 -150.7 vertical 41
STENLILLE-1 vertical
PICK: Base Chalk LK 1200.1 1200.1 -1159.1 vertical 41
STENLILLE-1 vertical
PICK: Base Gassum LK 1651.0 1651.0 -1610.0 vertical 41
STENLILLE-1 vertical
PICK: Top Karlebo Mb. LK 1369.3 1369.3 -1328.3 vertical 41
STENLILLE-10 vertical
PICK: Top Fjerritslev LK 1292.3 1292.3 -1250.8 vertical 41.5
STENLILLE-10 vertical
PICK: Top Gassum LK 1524.0 1524.0 -1482.5 vertical 41.5
STENLILLE-10 vertical
PICK: Base Chalk LK 1206.0 1206.0 -1164.5 vertical 41.5
STENLILLE-10 vertical
PICK: Base Gassum LK 1672.6 1672.6 -1631.1 vertical 41.5
STENLILLE-10 vertical
PICK: Top Karlebo Mb. LK 1403.9 1403.9 -1362.4 vertical 41.5
STENLILLE-11 vertical
PICK: Top Fjerritslev LK 1343.5 1343.5 -1303.5 vertical 40
STENLILLE-11 vertical
PICK: Top Gassum LK 1685.8 1685.8 -1645.8 vertical 40
STENLILLE-11 vertical
PICK: Base Chalk LK 1290.6 1290.6 -1250.6 vertical 40
STENLILLE-11 vertical
PICK: Base Gassum LK 1863.4 1863.4 -1823.4 vertical 40
STENLILLE-11 vertical
PICK: Top Karlebo Mb. LK 1540.2 1540.2 -1500.2 vertical 40
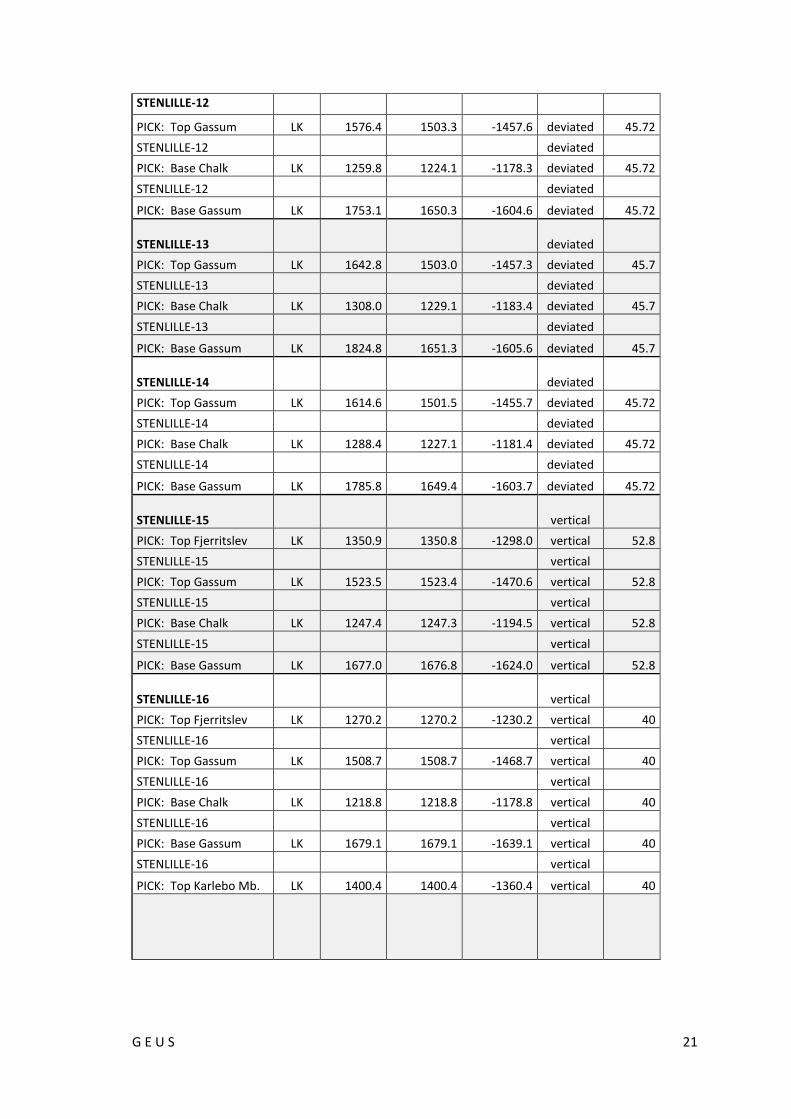
G E U S 21
STENLILLE-12
PICK: Top Gassum LK 1576.4 1503.3 -1457.6 deviated 45.72
STENLILLE-12 deviated
PICK: Base Chalk LK 1259.8 1224.1 -1178.3 deviated 45.72
STENLILLE-12 deviated
PICK: Base Gassum LK 1753.1 1650.3 -1604.6 deviated 45.72
STENLILLE-13 deviated
PICK: Top Gassum LK 1642.8 1503.0 -1457.3 deviated 45.7
STENLILLE-13 deviated
PICK: Base Chalk LK 1308.0 1229.1 -1183.4 deviated 45.7
STENLILLE-13 deviated
PICK: Base Gassum LK 1824.8 1651.3 -1605.6 deviated 45.7
STENLILLE-14 deviated
PICK: Top Gassum LK 1614.6 1501.5 -1455.7 deviated 45.72
STENLILLE-14 deviated
PICK: Base Chalk LK 1288.4 1227.1 -1181.4 deviated 45.72
STENLILLE-14 deviated
PICK: Base Gassum LK 1785.8 1649.4 -1603.7 deviated 45.72
STENLILLE-15 vertical
PICK: Top Fjerritslev LK 1350.9 1350.8 -1298.0 vertical 52.8
STENLILLE-15 vertical
PICK: Top Gassum LK 1523.5 1523.4 -1470.6 vertical 52.8
STENLILLE-15 vertical
PICK: Base Chalk LK 1247.4 1247.3 -1194.5 vertical 52.8
STENLILLE-15 vertical
PICK: Base Gassum LK 1677.0 1676.8 -1624.0 vertical 52.8
STENLILLE-16 vertical
PICK: Top Fjerritslev LK 1270.2 1270.2 -1230.2 vertical 40
STENLILLE-16 vertical
PICK: Top Gassum LK 1508.7 1508.7 -1468.7 vertical 40
STENLILLE-16 vertical
PICK: Base Chalk LK 1218.8 1218.8 -1178.8 vertical 40
STENLILLE-16 vertical
PICK: Base Gassum LK 1679.1 1679.1 -1639.1 vertical 40
STENLILLE-16 vertical
PICK: Top Karlebo Mb. LK 1400.4 1400.4 -1360.4 vertical 40

G E U S 22
STENLILLE-17
PICK: Top Gassum LK 1605.9 1502.9 -1455.3 deviated 47.55
STENLILLE-17 deviated
PICK: Base Chalk LK 1290.6 1195.8 -1148.2 deviated 47.55
STENLILLE-17 deviated
PICK: Base Gassum LK 1755.9 1649.7 -1602.1 deviated 47.55
STENLILLE-18
PICK: Top Fjerritslev LK 1288.0 1233.2 -1185.6 deviated 47.6
STENLILLE-18 deviated
PICK: Top Gassum LK 1564.1 1502.4 -1454.8 deviated 47.6
STENLILLE-18 deviated
PICK: Base Chalk LK 1247.5 1194.4 -1146.8 deviated 47.6
STENLILLE-18 deviated
PICK: Base Gassum LK 1713.8 1650.1 -1602.5 deviated 47.6
STENLILLE-18 deviated
PICK: Top Karlebo Mb. LK 1437.9 1378.5 -1330.9 deviated 47.6
STENLILLE-19 deviated
PICK: Top Fjerritslev LK 1275.6 1227.3 -1178.0 deviated 49.3
STENLILLE-19 deviated
PICK: Top Gassum LK 1561.1 1507.4 -1458.1 deviated 49.3
STENLILLE-19 deviated
PICK: Top Chalk LK 200.7 200.7 -151.4 deviated 49.3
STENLILLE-19 deviated
PICK: Base Chalk LK 1234.0 1188.4 -1139.1 deviated 49.3
STENLILLE-19 deviated
PICK: Base Gassum LK 1706.1 1652.3 -1603.0 deviated 49.3
STENLILLE-19 deviated
PICK: Top Karlebo Mb. LK 1471.9 1418.3 -1369.0 deviated 49.3
STENLILLE-2 vertical
PICK: Top Fjerritslev LK 1239.0 1239.0 -1191.3 vertical 47.7
STENLILLE-2 vertical
PICK: Top Gassum LK 1511.7 1511.7 -1464.0 vertical 47.7
STENLILLE-2 vertical
PICK: Top Chalk LK 204.3 204.3 -156.6 vertical 47.7
STENLILLE-2 vertical
PICK: Base Chalk LK 1197.8 1197.8 -1150.1 vertical 47.7
STENLILLE-2 vertical
PICK: Base Gassum LK 1652.8 1652.8 -1605.1 vertical 47.7
STENLILLE-2 vertical
PICK: Top Karlebo Mb. LK 1379.9 1379.9 -1332.2 vertical 47.7
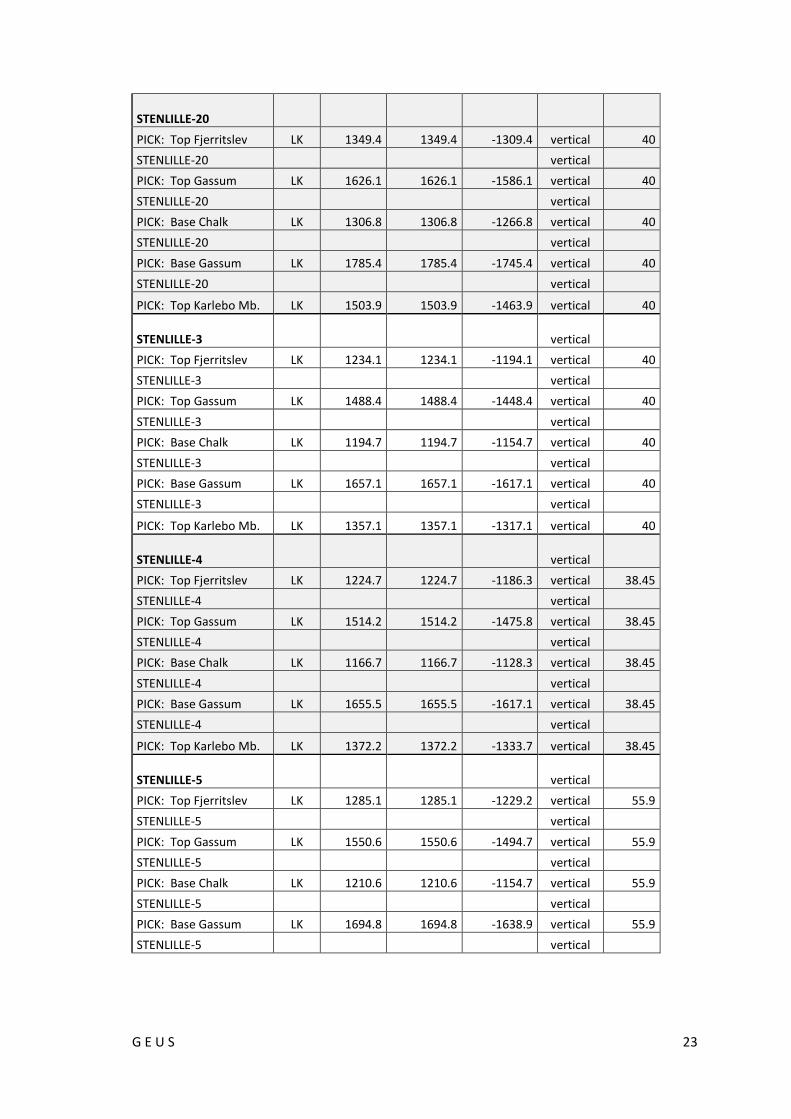
G E U S 23
STENLILLE-20
PICK: Top Fjerritslev LK 1349.4 1349.4 -1309.4 vertical 40
STENLILLE-20 vertical
PICK: Top Gassum LK 1626.1 1626.1 -1586.1 vertical 40
STENLILLE-20 vertical
PICK: Base Chalk LK 1306.8 1306.8 -1266.8 vertical 40
STENLILLE-20 vertical
PICK: Base Gassum LK 1785.4 1785.4 -1745.4 vertical 40
STENLILLE-20 vertical
PICK: Top Karlebo Mb. LK 1503.9 1503.9 -1463.9 vertical 40
STENLILLE-3 vertical
PICK: Top Fjerritslev LK 1234.1 1234.1 -1194.1 vertical 40
STENLILLE-3 vertical
PICK: Top Gassum LK 1488.4 1488.4 -1448.4 vertical 40
STENLILLE-3 vertical
PICK: Base Chalk LK 1194.7 1194.7 -1154.7 vertical 40
STENLILLE-3 vertical
PICK: Base Gassum LK 1657.1 1657.1 -1617.1 vertical 40
STENLILLE-3 vertical
PICK: Top Karlebo Mb. LK 1357.1 1357.1 -1317.1 vertical 40
STENLILLE-4 vertical
PICK: Top Fjerritslev LK 1224.7 1224.7 -1186.3 vertical 38.45
STENLILLE-4 vertical
PICK: Top Gassum LK 1514.2 1514.2 -1475.8 vertical 38.45
STENLILLE-4 vertical
PICK: Base Chalk LK 1166.7 1166.7 -1128.3 vertical 38.45
STENLILLE-4 vertical
PICK: Base Gassum LK 1655.5 1655.5 -1617.1 vertical 38.45
STENLILLE-4 vertical
PICK: Top Karlebo Mb. LK 1372.2 1372.2 -1333.7 vertical 38.45
STENLILLE-5 vertical
PICK: Top Fjerritslev LK 1285.1 1285.1 -1229.2 vertical 55.9
STENLILLE-5 vertical
PICK: Top Gassum LK 1550.6 1550.6 -1494.7 vertical 55.9
STENLILLE-5 vertical
PICK: Base Chalk LK 1210.6 1210.6 -1154.7 vertical 55.9
STENLILLE-5 vertical
PICK: Base Gassum LK 1694.8 1694.8 -1638.9 vertical 55.9
STENLILLE-5 vertical
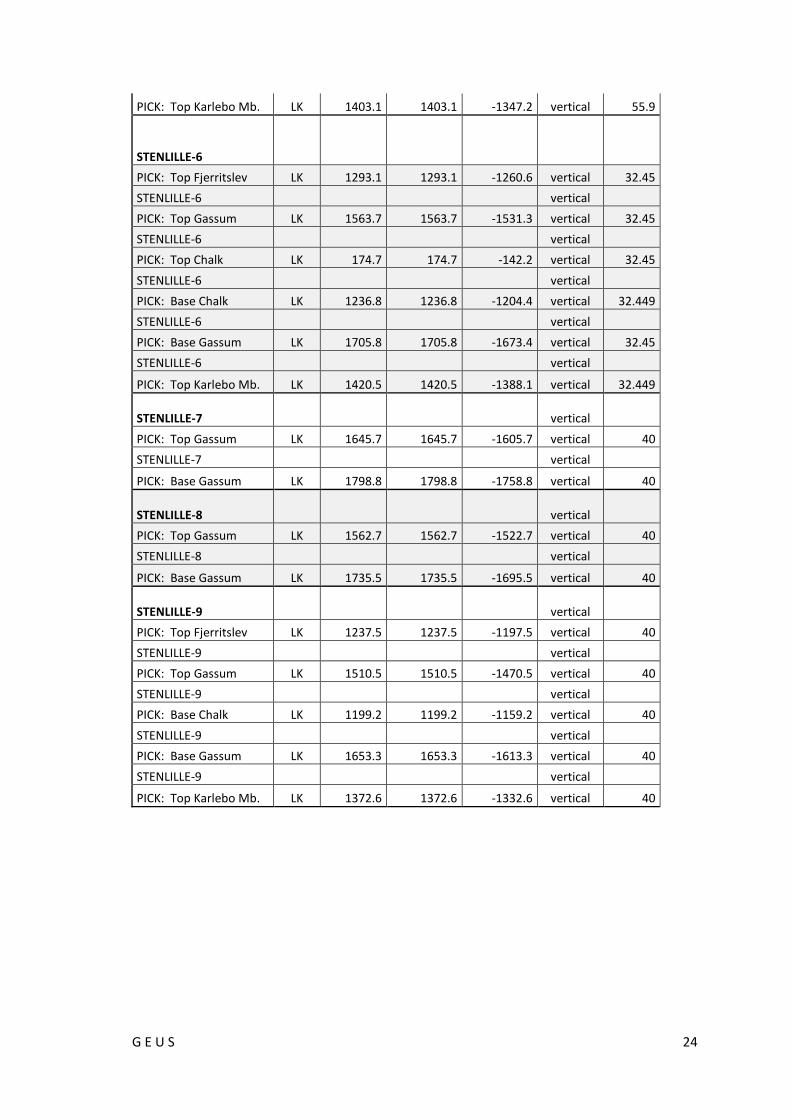
G E U S 24
PICK: Top Karlebo Mb. LK 1403.1 1403.1 -1347.2 vertical 55.9
STENLILLE-6
PICK: Top Fjerritslev LK 1293.1 1293.1 -1260.6 vertical 32.45
STENLILLE-6 vertical
PICK: Top Gassum LK 1563.7 1563.7 -1531.3 vertical 32.45
STENLILLE-6 vertical
PICK: Top Chalk LK 174.7 174.7 -142.2 vertical 32.45
STENLILLE-6 vertical
PICK: Base Chalk LK 1236.8 1236.8 -1204.4 vertical 32.449
STENLILLE-6 vertical
PICK: Base Gassum LK 1705.8 1705.8 -1673.4 vertical 32.45
STENLILLE-6 vertical
PICK: Top Karlebo Mb. LK 1420.5 1420.5 -1388.1 vertical 32.449
STENLILLE-7 vertical
PICK: Top Gassum LK 1645.7 1645.7 -1605.7 vertical 40
STENLILLE-7 vertical
PICK: Base Gassum LK 1798.8 1798.8 -1758.8 vertical 40
STENLILLE-8 vertical
PICK: Top Gassum LK 1562.7 1562.7 -1522.7 vertical 40
STENLILLE-8 vertical
PICK: Base Gassum LK 1735.5 1735.5 -1695.5 vertical 40
STENLILLE-9 vertical
PICK: Top Fjerritslev LK 1237.5 1237.5 -1197.5 vertical 40
STENLILLE-9 vertical
PICK: Top Gassum LK 1510.5 1510.5 -1470.5 vertical 40
STENLILLE-9 vertical
PICK: Base Chalk LK 1199.2 1199.2 -1159.2 vertical 40
STENLILLE-9 vertical
PICK: Base Gassum LK 1653.3 1653.3 -1613.3 vertical 40
STENLILLE-9 vertical
PICK: Top Karlebo Mb. LK 1372.6 1372.6 -1332.6 vertical 40
G E U S 25
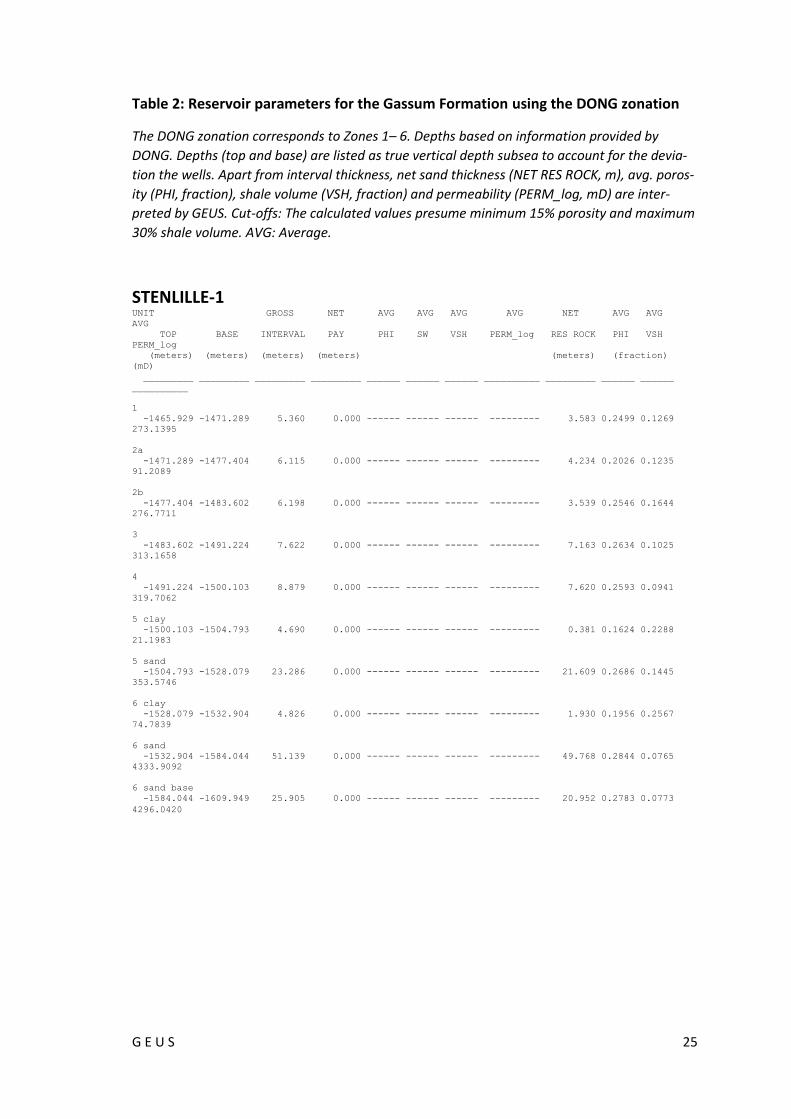
Table 2: Reservoir parameters for the Gassum Formation using the DONG zonation
The DONG zonation corresponds to Zones 1– 6. Depths based on information provided by
DONG. Depths (top and base) are listed as true vertical depth subsea to account for the devia-
tion the wells. Apart from interval thickness, net sand thickness (NET RES ROCK, m), avg. poros-
ity (PHI, fraction), shale volume (VSH, fraction) and permeability (PERM_log, mD) are inter-
preted by GEUS. Cut-offs: The calculated values presume minimum 15% porosity and maximum
30% shale volume. AVG: Average.
STENLILLE-1 UNIT GROSS NET AVG AVG AVG AVG NET AVG AVG
AVG
TOP BASE INTERVAL PAY PHI SW VSH PERM_log RES ROCK PHI VSH
PERM_log
(meters) (meters) (meters) (meters) (meters) (fraction)
(mD)
_________ _________ _________ _________ ______ ______ ______ __________ _________ ______ ______
__________
1
-1465.929 -1471.289 5.360 0.000 ------ ------ ------ --------- 3.583 0.2499 0.1269
273.1395
2a
-1471.289 -1477.404 6.115 0.000 ------ ------ ------ --------- 4.234 0.2026 0.1235
91.2089
2b
-1477.404 -1483.602 6.198 0.000 ------ ------ ------ --------- 3.539 0.2546 0.1644
276.7711
3
-1483.602 -1491.224 7.622 0.000 ------ ------ ------ --------- 7.163 0.2634 0.1025
313.1658
4
-1491.224 -1500.103 8.879 0.000 ------ ------ ------ --------- 7.620 0.2593 0.0941
319.7062
5 clay
-1500.103 -1504.793 4.690 0.000 ------ ------ ------ --------- 0.381 0.1624 0.2288
21.1983
5 sand
-1504.793 -1528.079 23.286 0.000 ------ ------ ------ --------- 21.609 0.2686 0.1445
353.5746
6 clay
-1528.079 -1532.904 4.826 0.000 ------ ------ ------ --------- 1.930 0.1956 0.2567
74.7839
6 sand
-1532.904 -1584.044 51.139 0.000 ------ ------ ------ --------- 49.768 0.2844 0.0765
4333.9092
6 sand base
-1584.044 -1609.949 25.905 0.000 ------ ------ ------ --------- 20.952 0.2783 0.0773
4296.0420

G E U S 26
STENLILLE-10 UNIT GROSS NET AVG AVG AVG AVG NET AVG AVG
AVG
TOP BASE INTERVAL PAY PHI SW VSH PERM_log RES ROCK PHI VSH
PERM_log
(meters) (meters) (meters) (meters) (meters)
_________ _________ _________ _________ ______ ______ ______ __________ _________ ______ ______
__________
1 <1>
-1482.324 -1489.056 6.732 0.000 ------ ------ ------ --------- 1.981 0.2101 0.2560
103.5041
2a <1>
-1489.056 -1493.825 4.769 0.000 ------ ------ ------ --------- 0.000 ------ ------ --
-------
2b <1>
-1493.825 -1498.734 4.909 0.000 ------ ------ ------ --------- 1.375 0.1826 0.2582
50.7920
3 <1>
-1498.734 -1511.497 12.763 0.000 ------ ------ ------ --------- 12.646 0.2211 0.1234
132.4823
4 <1>
-1511.497 -1518.510 7.013 0.000 ------ ------ ------ --------- 2.896 0.2114 0.2206
112.1943
5 clay <1>
-1518.510 -1527.206 8.696 0.000 ------ ------ ------ --------- 1.195 0.1651 0.2210
28.2093
5 sand <1>
-1527.206 -1562.387 35.182 0.000 ------ ------ ------ --------- 34.924 0.2402 0.0888
199.7960
6 clay <1>
-1562.387 -1564.574 2.187 0.000 ------ ------ ------ --------- 0.007 0.1555 0.2575 --
-------
6 sand <1>
-1564.574 -1615.218 50.644 0.000 ------ ------ ------ --------- 50.339 0.2500 0.1005
2264.4409
6 sand base <1>
-1615.218 -1631.127 15.909 0.000 ------ ------ ------ --------- 8.176 0.2180 0.1606
1179.2166
G E U S 27
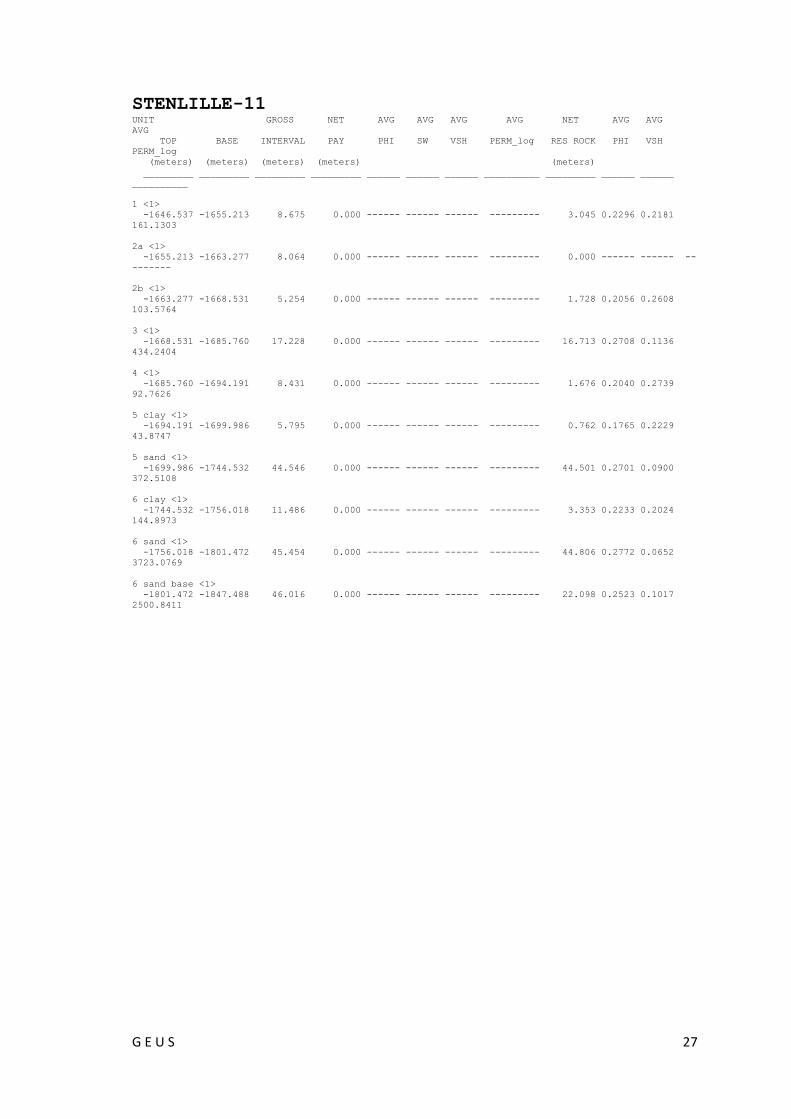
STENLILLE-11 UNIT GROSS NET AVG AVG AVG AVG NET AVG AVG
AVG
TOP BASE INTERVAL PAY PHI SW VSH PERM_log RES ROCK PHI VSH
PERM_log
(meters) (meters) (meters) (meters) (meters)
_________ _________ _________ _________ ______ ______ ______ __________ _________ ______ ______
__________
1 <1>
-1646.537 -1655.213 8.675 0.000 ------ ------ ------ --------- 3.045 0.2296 0.2181
161.1303
2a <1>
-1655.213 -1663.277 8.064 0.000 ------ ------ ------ --------- 0.000 ------ ------ --
-------
2b <1>
-1663.277 -1668.531 5.254 0.000 ------ ------ ------ --------- 1.728 0.2056 0.2608
103.5764
3 <1>
-1668.531 -1685.760 17.228 0.000 ------ ------ ------ --------- 16.713 0.2708 0.1136
434.2404
4 <1>
-1685.760 -1694.191 8.431 0.000 ------ ------ ------ --------- 1.676 0.2040 0.2739
92.7626
5 clay <1>
-1694.191 -1699.986 5.795 0.000 ------ ------ ------ --------- 0.762 0.1765 0.2229
43.8747
5 sand <1>
-1699.986 -1744.532 44.546 0.000 ------ ------ ------ --------- 44.501 0.2701 0.0900
372.5108
6 clay <1>
-1744.532 -1756.018 11.486 0.000 ------ ------ ------ --------- 3.353 0.2233 0.2024
144.8973
6 sand <1>
-1756.018 -1801.472 45.454 0.000 ------ ------ ------ --------- 44.806 0.2772 0.0652
3723.0769
6 sand base <1>
-1801.472 -1847.488 46.016 0.000 ------ ------ ------ --------- 22.098 0.2523 0.1017
2500.8411
G E U S 28
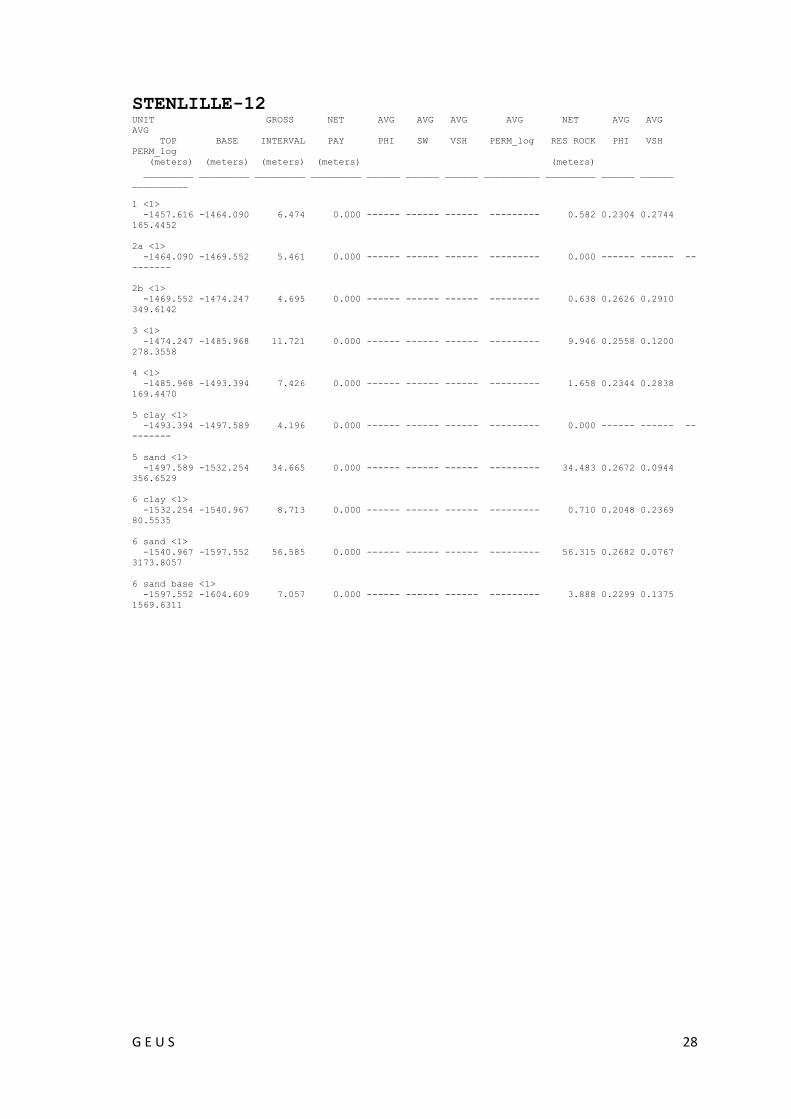
STENLILLE-12 UNIT GROSS NET AVG AVG AVG AVG NET AVG AVG
AVG
TOP BASE INTERVAL PAY PHI SW VSH PERM_log RES ROCK PHI VSH
PERM_log
(meters) (meters) (meters) (meters) (meters)
_________ _________ _________ _________ ______ ______ ______ __________ _________ ______ ______
__________
1 <1>
-1457.616 -1464.090 6.474 0.000 ------ ------ ------ --------- 0.582 0.2304 0.2744
165.4452
2a <1>
-1464.090 -1469.552 5.461 0.000 ------ ------ ------ --------- 0.000 ------ ------ --
-------
2b <1>
-1469.552 -1474.247 4.695 0.000 ------ ------ ------ --------- 0.638 0.2626 0.2910
349.6142
3 <1>
-1474.247 -1485.968 11.721 0.000 ------ ------ ------ --------- 9.946 0.2558 0.1200
278.3558
4 <1>
-1485.968 -1493.394 7.426 0.000 ------ ------ ------ --------- 1.658 0.2344 0.2838
169.4470
5 clay <1>
-1493.394 -1497.589 4.196 0.000 ------ ------ ------ --------- 0.000 ------ ------ --
-------
5 sand <1>
-1497.589 -1532.254 34.665 0.000 ------ ------ ------ --------- 34.483 0.2672 0.0944
356.6529
6 clay <1>
-1532.254 -1540.967 8.713 0.000 ------ ------ ------ --------- 0.710 0.2048 0.2369
80.5535
6 sand <1>
-1540.967 -1597.552 56.585 0.000 ------ ------ ------ --------- 56.315 0.2682 0.0767
3173.8057
6 sand base <1>
-1597.552 -1604.609 7.057 0.000 ------ ------ ------ --------- 3.888 0.2299 0.1375
1569.6311
G E U S 29
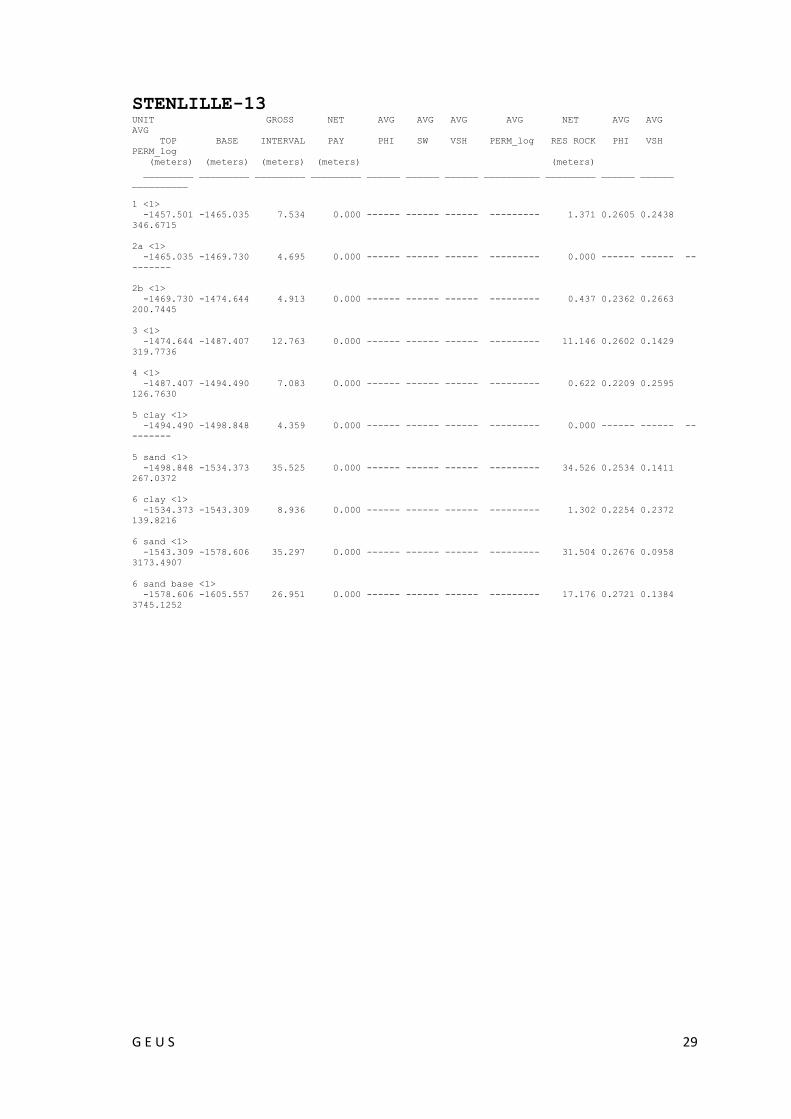
STENLILLE-13 UNIT GROSS NET AVG AVG AVG AVG NET AVG AVG
AVG
TOP BASE INTERVAL PAY PHI SW VSH PERM_log RES ROCK PHI VSH
PERM_log
(meters) (meters) (meters) (meters) (meters)
_________ _________ _________ _________ ______ ______ ______ __________ _________ ______ ______
__________
1 <1>
-1457.501 -1465.035 7.534 0.000 ------ ------ ------ --------- 1.371 0.2605 0.2438
346.6715
2a <1>
-1465.035 -1469.730 4.695 0.000 ------ ------ ------ --------- 0.000 ------ ------ --
-------
2b <1>
-1469.730 -1474.644 4.913 0.000 ------ ------ ------ --------- 0.437 0.2362 0.2663
200.7445
3 <1>
-1474.644 -1487.407 12.763 0.000 ------ ------ ------ --------- 11.146 0.2602 0.1429
319.7736
4 <1>
-1487.407 -1494.490 7.083 0.000 ------ ------ ------ --------- 0.622 0.2209 0.2595
126.7630
5 clay <1>
-1494.490 -1498.848 4.359 0.000 ------ ------ ------ --------- 0.000 ------ ------ --
-------
5 sand <1>
-1498.848 -1534.373 35.525 0.000 ------ ------ ------ --------- 34.526 0.2534 0.1411
267.0372
6 clay <1>
-1534.373 -1543.309 8.936 0.000 ------ ------ ------ --------- 1.302 0.2254 0.2372
139.8216
6 sand <1>
-1543.309 -1578.606 35.297 0.000 ------ ------ ------ --------- 31.504 0.2676 0.0958
3173.4907
6 sand base <1>
-1578.606 -1605.557 26.951 0.000 ------ ------ ------ --------- 17.176 0.2721 0.1384
3745.1252

G E U S 30
STENLILLE-14 UNIT GROSS NET AVG AVG AVG AVG NET AVG AVG
AVG
TOP BASE INTERVAL PAY PHI SW VSH PERM_log RES ROCK PHI VSH
PERM_log
(meters) (meters) (meters) (meters) (meters)
_________ _________ _________ _________ ______ ______ ______ __________ _________ ______ ______
__________
1 <1>
-1455.717 -1463.132 7.416 0.000 ------ ------ ------ --------- 3.420 0.2384 0.2143
205.4295
2a <1>
-1463.132 -1468.032 4.900 0.000 ------ ------ ------ --------- 0.000 ------ ------ --
-------
2b <1>
-1468.032 -1473.727 5.694 0.000 ------ ------ ------ --------- 3.140 0.2214 0.2119
190.2681
3 <1>
-1473.727 -1485.380 11.653 0.000 ------ ------ ------ --------- 10.803 0.2606 0.0548
306.1109
4 <1>
-1485.380 -1492.531 7.151 0.000 ------ ------ ------ --------- 3.946 0.2142 0.2049
125.3320
5 clay <1>
-1492.531 -1497.298 4.767 0.000 ------ ------ ------ --------- 0.800 0.1775 0.2238
44.7349
5 sand <1>
-1497.298 -1532.523 35.225 0.000 ------ ------ ------ --------- 35.224 0.2621 0.0261
315.2384
6 clay <1>
-1532.523 -1541.263 8.740 0.000 ------ ------ ------ --------- 1.637 0.1886 0.2178
59.8811
6 sand <1>
-1541.263 -1577.406 36.142 0.000 ------ ------ ------ --------- 36.143 0.2631 0.0090
2810.7393
6 sand base <1>
-1577.406 -1603.807 26.401 0.000 ------ ------ ------ --------- 22.420 0.2586 0.0445
2797.1807
G E U S 31
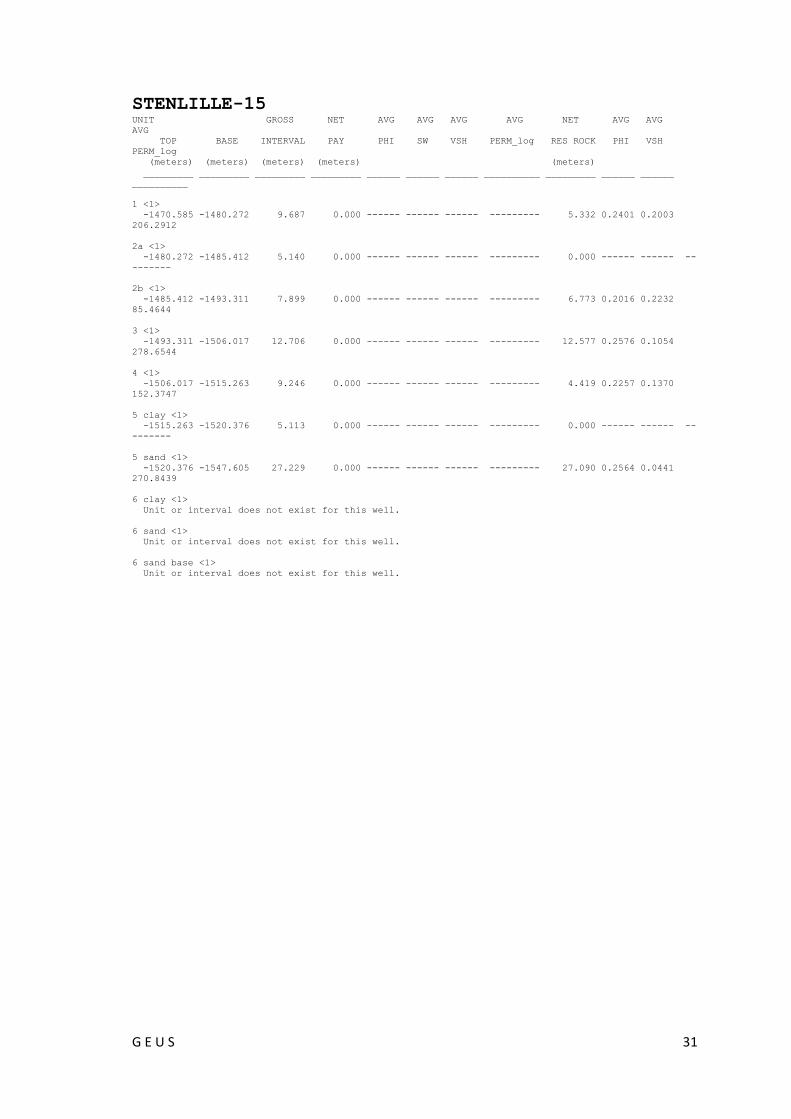
STENLILLE-15 UNIT GROSS NET AVG AVG AVG AVG NET AVG AVG
AVG
TOP BASE INTERVAL PAY PHI SW VSH PERM_log RES ROCK PHI VSH
PERM_log
(meters) (meters) (meters) (meters) (meters)
_________ _________ _________ _________ ______ ______ ______ __________ _________ ______ ______
__________
1 <1>
-1470.585 -1480.272 9.687 0.000 ------ ------ ------ --------- 5.332 0.2401 0.2003
206.2912
2a <1>
-1480.272 -1485.412 5.140 0.000 ------ ------ ------ --------- 0.000 ------ ------ --
-------
2b <1>
-1485.412 -1493.311 7.899 0.000 ------ ------ ------ --------- 6.773 0.2016 0.2232
85.4644
3 <1>
-1493.311 -1506.017 12.706 0.000 ------ ------ ------ --------- 12.577 0.2576 0.1054
278.6544
4 <1>
-1506.017 -1515.263 9.246 0.000 ------ ------ ------ --------- 4.419 0.2257 0.1370
152.3747
5 clay <1>
-1515.263 -1520.376 5.113 0.000 ------ ------ ------ --------- 0.000 ------ ------ --
-------
5 sand <1>
-1520.376 -1547.605 27.229 0.000 ------ ------ ------ --------- 27.090 0.2564 0.0441
270.8439
6 clay <1>
Unit or interval does not exist for this well.
6 sand <1>
Unit or interval does not exist for this well.
6 sand base <1>
Unit or interval does not exist for this well.
G E U S 32
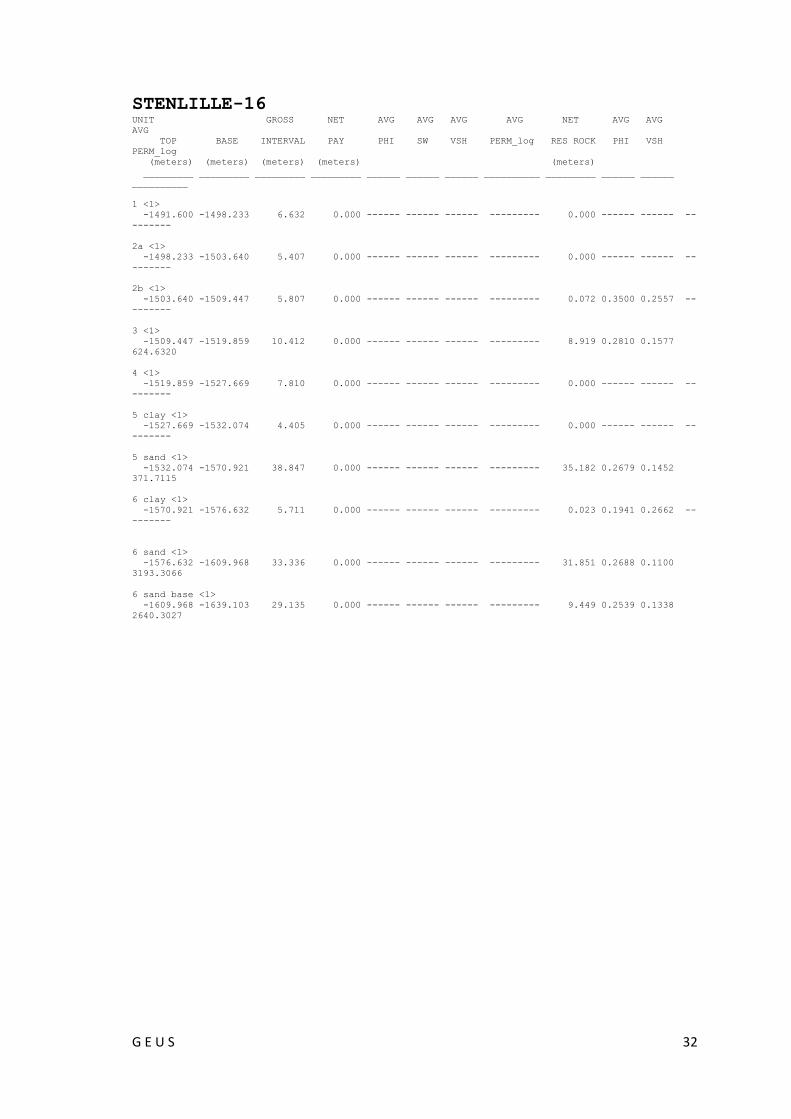
STENLILLE-16 UNIT GROSS NET AVG AVG AVG AVG NET AVG AVG
AVG
TOP BASE INTERVAL PAY PHI SW VSH PERM_log RES ROCK PHI VSH
PERM_log
(meters) (meters) (meters) (meters) (meters)
_________ _________ _________ _________ ______ ______ ______ __________ _________ ______ ______
__________
1 <1>
-1491.600 -1498.233 6.632 0.000 ------ ------ ------ --------- 0.000 ------ ------ --
-------
2a <1>
-1498.233 -1503.640 5.407 0.000 ------ ------ ------ --------- 0.000 ------ ------ --
-------
2b <1>
-1503.640 -1509.447 5.807 0.000 ------ ------ ------ --------- 0.072 0.3500 0.2557 --
-------
3 <1>
-1509.447 -1519.859 10.412 0.000 ------ ------ ------ --------- 8.919 0.2810 0.1577
624.6320
4 <1>
-1519.859 -1527.669 7.810 0.000 ------ ------ ------ --------- 0.000 ------ ------ --
-------
5 clay <1>
-1527.669 -1532.074 4.405 0.000 ------ ------ ------ --------- 0.000 ------ ------ --
-------
5 sand <1>
-1532.074 -1570.921 38.847 0.000 ------ ------ ------ --------- 35.182 0.2679 0.1452
371.7115
6 clay <1>
-1570.921 -1576.632 5.711 0.000 ------ ------ ------ --------- 0.023 0.1941 0.2662 --
-------
6 sand <1>
-1576.632 -1609.968 33.336 0.000 ------ ------ ------ --------- 31.851 0.2688 0.1100
3193.3066
6 sand base <1>
-1609.968 -1639.103 29.135 0.000 ------ ------ ------ --------- 9.449 0.2539 0.1338
2640.3027
G E U S 33
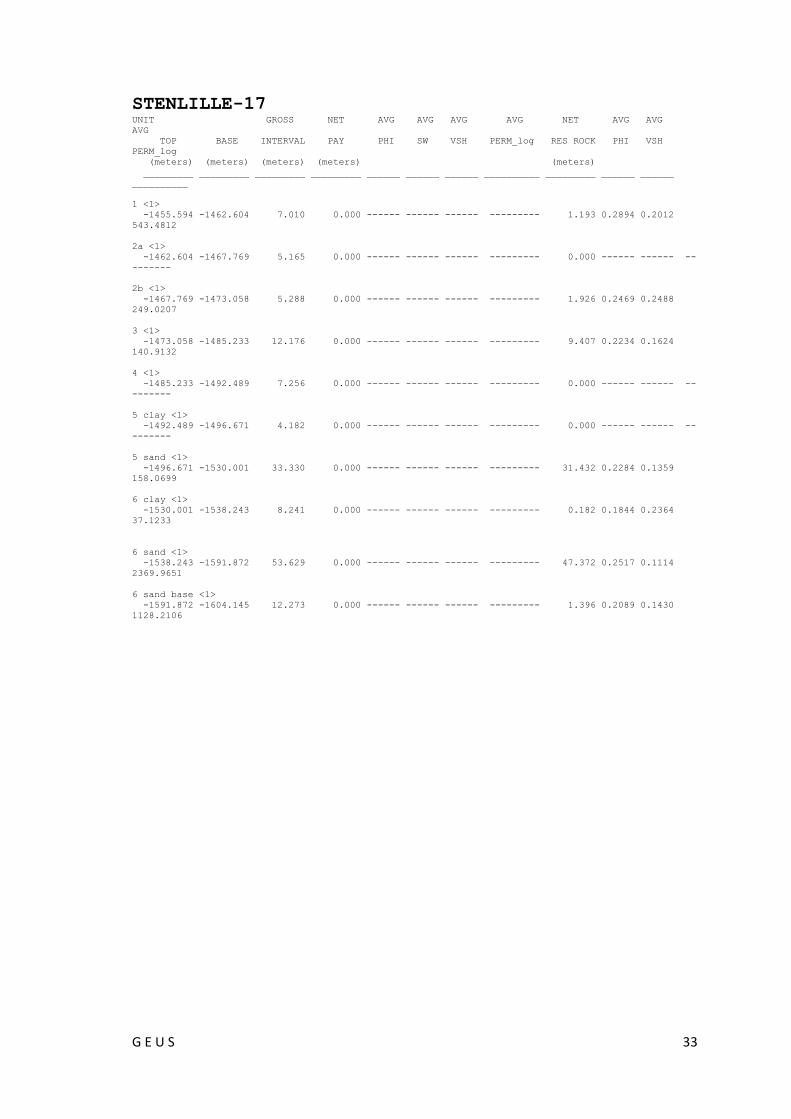
STENLILLE-17 UNIT GROSS NET AVG AVG AVG AVG NET AVG AVG
AVG
TOP BASE INTERVAL PAY PHI SW VSH PERM_log RES ROCK PHI VSH
PERM_log
(meters) (meters) (meters) (meters) (meters)
_________ _________ _________ _________ ______ ______ ______ __________ _________ ______ ______
__________
1 <1>
-1455.594 -1462.604 7.010 0.000 ------ ------ ------ --------- 1.193 0.2894 0.2012
543.4812
2a <1>
-1462.604 -1467.769 5.165 0.000 ------ ------ ------ --------- 0.000 ------ ------ --
-------
2b <1>
-1467.769 -1473.058 5.288 0.000 ------ ------ ------ --------- 1.926 0.2469 0.2488
249.0207
3 <1>
-1473.058 -1485.233 12.176 0.000 ------ ------ ------ --------- 9.407 0.2234 0.1624
140.9132
4 <1>
-1485.233 -1492.489 7.256 0.000 ------ ------ ------ --------- 0.000 ------ ------ --
-------
5 clay <1>
-1492.489 -1496.671 4.182 0.000 ------ ------ ------ --------- 0.000 ------ ------ --
-------
5 sand <1>
-1496.671 -1530.001 33.330 0.000 ------ ------ ------ --------- 31.432 0.2284 0.1359
158.0699
6 clay <1>
-1530.001 -1538.243 8.241 0.000 ------ ------ ------ --------- 0.182 0.1844 0.2364
37.1233
6 sand <1>
-1538.243 -1591.872 53.629 0.000 ------ ------ ------ --------- 47.372 0.2517 0.1114
2369.9651
6 sand base <1>
-1591.872 -1604.145 12.273 0.000 ------ ------ ------ --------- 1.396 0.2089 0.1430
1128.2106
G E U S 34
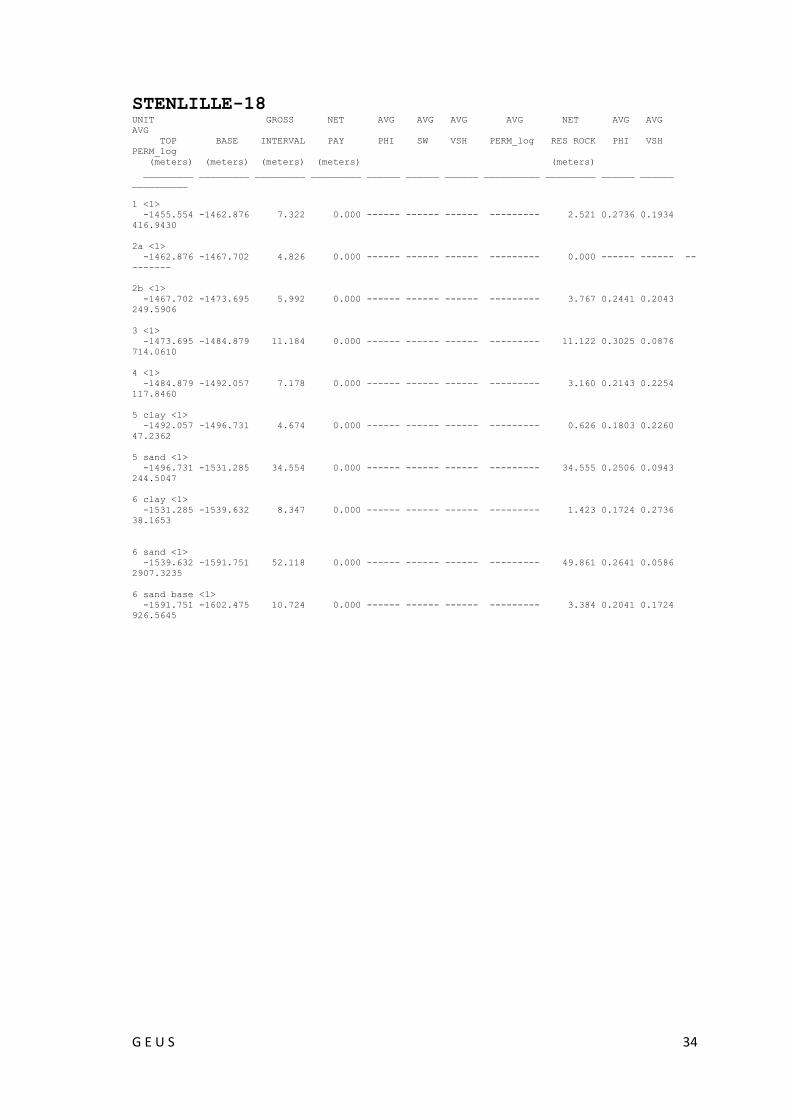
STENLILLE-18 UNIT GROSS NET AVG AVG AVG AVG NET AVG AVG
AVG
TOP BASE INTERVAL PAY PHI SW VSH PERM_log RES ROCK PHI VSH
PERM_log
(meters) (meters) (meters) (meters) (meters)
_________ _________ _________ _________ ______ ______ ______ __________ _________ ______ ______
__________
1 <1>
-1455.554 -1462.876 7.322 0.000 ------ ------ ------ --------- 2.521 0.2736 0.1934
416.9430
2a <1>
-1462.876 -1467.702 4.826 0.000 ------ ------ ------ --------- 0.000 ------ ------ --
-------
2b <1>
-1467.702 -1473.695 5.992 0.000 ------ ------ ------ --------- 3.767 0.2441 0.2043
249.5906
3 <1>
-1473.695 -1484.879 11.184 0.000 ------ ------ ------ --------- 11.122 0.3025 0.0876
714.0610
4 <1>
-1484.879 -1492.057 7.178 0.000 ------ ------ ------ --------- 3.160 0.2143 0.2254
117.8460
5 clay <1>
-1492.057 -1496.731 4.674 0.000 ------ ------ ------ --------- 0.626 0.1803 0.2260
47.2362
5 sand <1>
-1496.731 -1531.285 34.554 0.000 ------ ------ ------ --------- 34.555 0.2506 0.0943
244.5047
6 clay <1>
-1531.285 -1539.632 8.347 0.000 ------ ------ ------ --------- 1.423 0.1724 0.2736
38.1653
6 sand <1>
-1539.632 -1591.751 52.118 0.000 ------ ------ ------ --------- 49.861 0.2641 0.0586
2907.3235
6 sand base <1>
-1591.751 -1602.475 10.724 0.000 ------ ------ ------ --------- 3.384 0.2041 0.1724
926.5645
G E U S 35
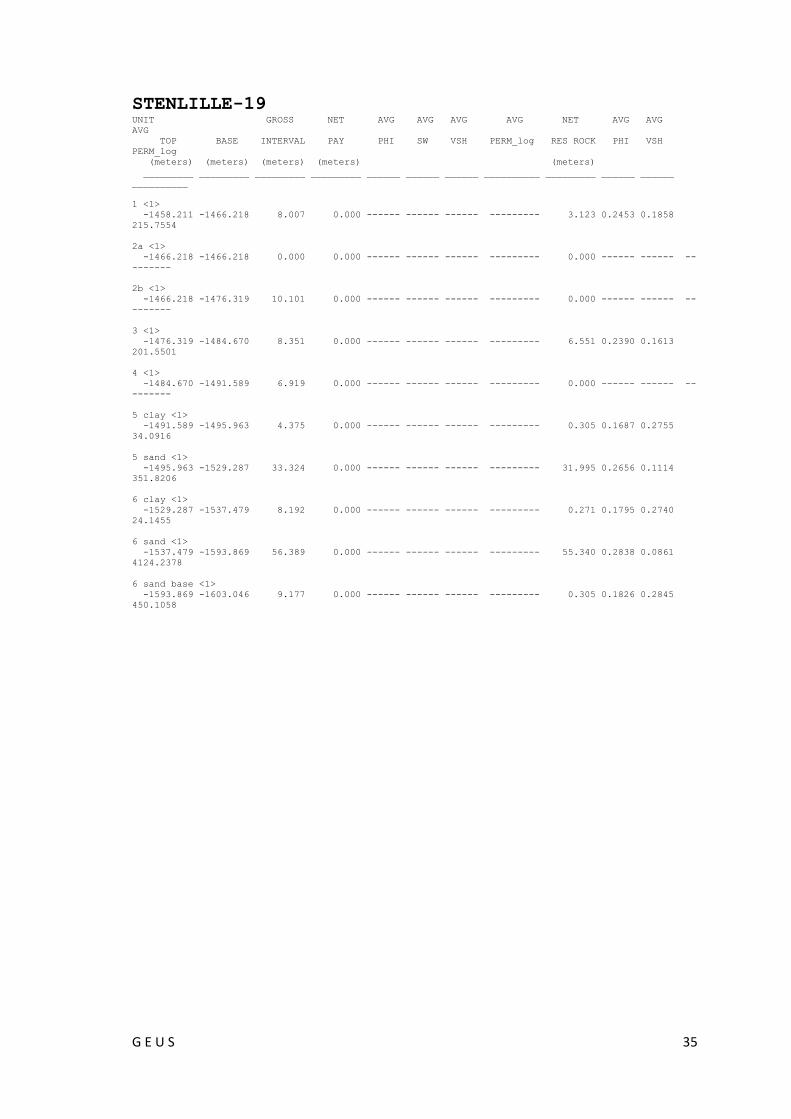
STENLILLE-19 UNIT GROSS NET AVG AVG AVG AVG NET AVG AVG
AVG
TOP BASE INTERVAL PAY PHI SW VSH PERM_log RES ROCK PHI VSH
PERM_log
(meters) (meters) (meters) (meters) (meters)
_________ _________ _________ _________ ______ ______ ______ __________ _________ ______ ______
__________
1 <1>
-1458.211 -1466.218 8.007 0.000 ------ ------ ------ --------- 3.123 0.2453 0.1858
215.7554
2a <1>
-1466.218 -1466.218 0.000 0.000 ------ ------ ------ --------- 0.000 ------ ------ --
-------
2b <1>
-1466.218 -1476.319 10.101 0.000 ------ ------ ------ --------- 0.000 ------ ------ --
-------
3 <1>
-1476.319 -1484.670 8.351 0.000 ------ ------ ------ --------- 6.551 0.2390 0.1613
201.5501
4 <1>
-1484.670 -1491.589 6.919 0.000 ------ ------ ------ --------- 0.000 ------ ------ --
-------
5 clay <1>
-1491.589 -1495.963 4.375 0.000 ------ ------ ------ --------- 0.305 0.1687 0.2755
34.0916
5 sand <1>
-1495.963 -1529.287 33.324 0.000 ------ ------ ------ --------- 31.995 0.2656 0.1114
351.8206
6 clay <1>
-1529.287 -1537.479 8.192 0.000 ------ ------ ------ --------- 0.271 0.1795 0.2740
24.1455
6 sand <1>
-1537.479 -1593.869 56.389 0.000 ------ ------ ------ --------- 55.340 0.2838 0.0861
4124.2378
6 sand base <1>
-1593.869 -1603.046 9.177 0.000 ------ ------ ------ --------- 0.305 0.1826 0.2845
450.1058
G E U S 36
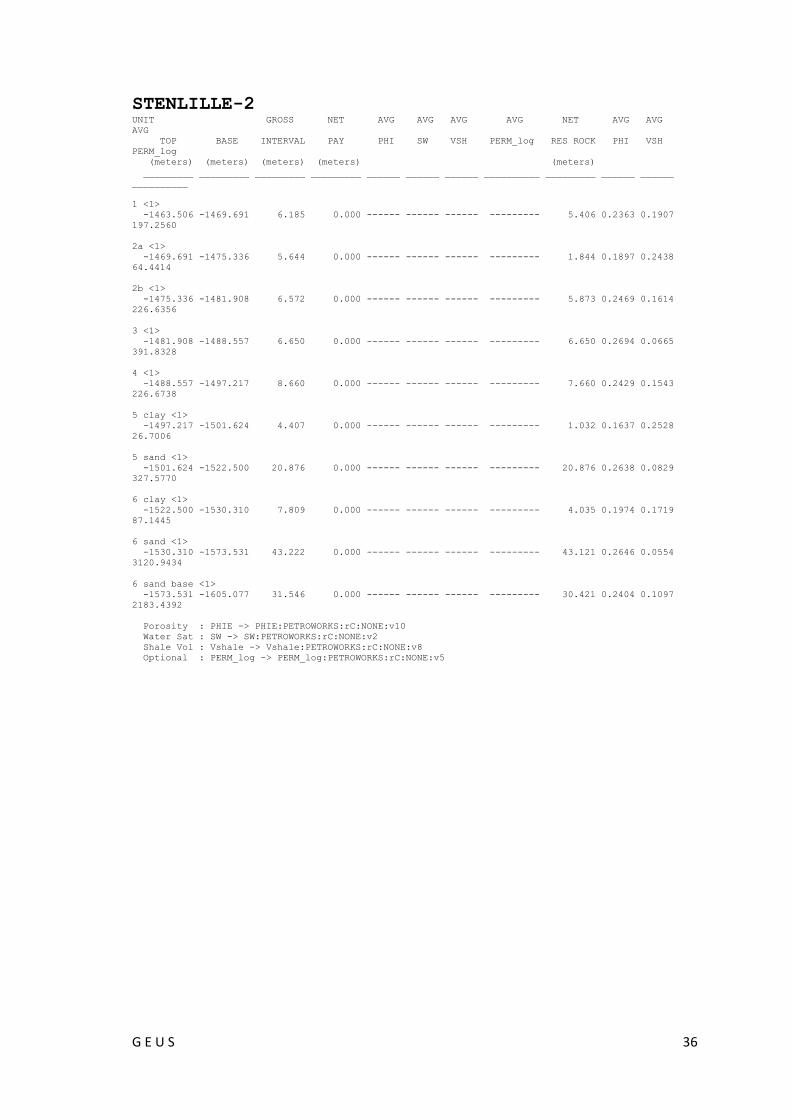
STENLILLE-2 UNIT GROSS NET AVG AVG AVG AVG NET AVG AVG
AVG
TOP BASE INTERVAL PAY PHI SW VSH PERM_log RES ROCK PHI VSH
PERM_log
(meters) (meters) (meters) (meters) (meters)
_________ _________ _________ _________ ______ ______ ______ __________ _________ ______ ______
__________
1 <1>
-1463.506 -1469.691 6.185 0.000 ------ ------ ------ --------- 5.406 0.2363 0.1907
197.2560
2a <1>
-1469.691 -1475.336 5.644 0.000 ------ ------ ------ --------- 1.844 0.1897 0.2438
64.4414
2b <1>
-1475.336 -1481.908 6.572 0.000 ------ ------ ------ --------- 5.873 0.2469 0.1614
226.6356
3 <1>
-1481.908 -1488.557 6.650 0.000 ------ ------ ------ --------- 6.650 0.2694 0.0665
391.8328
4 <1>
-1488.557 -1497.217 8.660 0.000 ------ ------ ------ --------- 7.660 0.2429 0.1543
226.6738
5 clay <1>
-1497.217 -1501.624 4.407 0.000 ------ ------ ------ --------- 1.032 0.1637 0.2528
26.7006
5 sand <1>
-1501.624 -1522.500 20.876 0.000 ------ ------ ------ --------- 20.876 0.2638 0.0829
327.5770
6 clay <1>
-1522.500 -1530.310 7.809 0.000 ------ ------ ------ --------- 4.035 0.1974 0.1719
87.1445
6 sand <1>
-1530.310 -1573.531 43.222 0.000 ------ ------ ------ --------- 43.121 0.2646 0.0554
3120.9434
6 sand base <1>
-1573.531 -1605.077 31.546 0.000 ------ ------ ------ --------- 30.421 0.2404 0.1097
2183.4392
Porosity : PHIE -> PHIE:PETROWORKS:rC:NONE:v10
Water Sat : SW -> SW:PETROWORKS:rC:NONE:v2
Shale Vol : Vshale -> Vshale:PETROWORKS:rC:NONE:v8
Optional : PERM_log -> PERM_log:PETROWORKS:rC:NONE:v5
G E U S 37
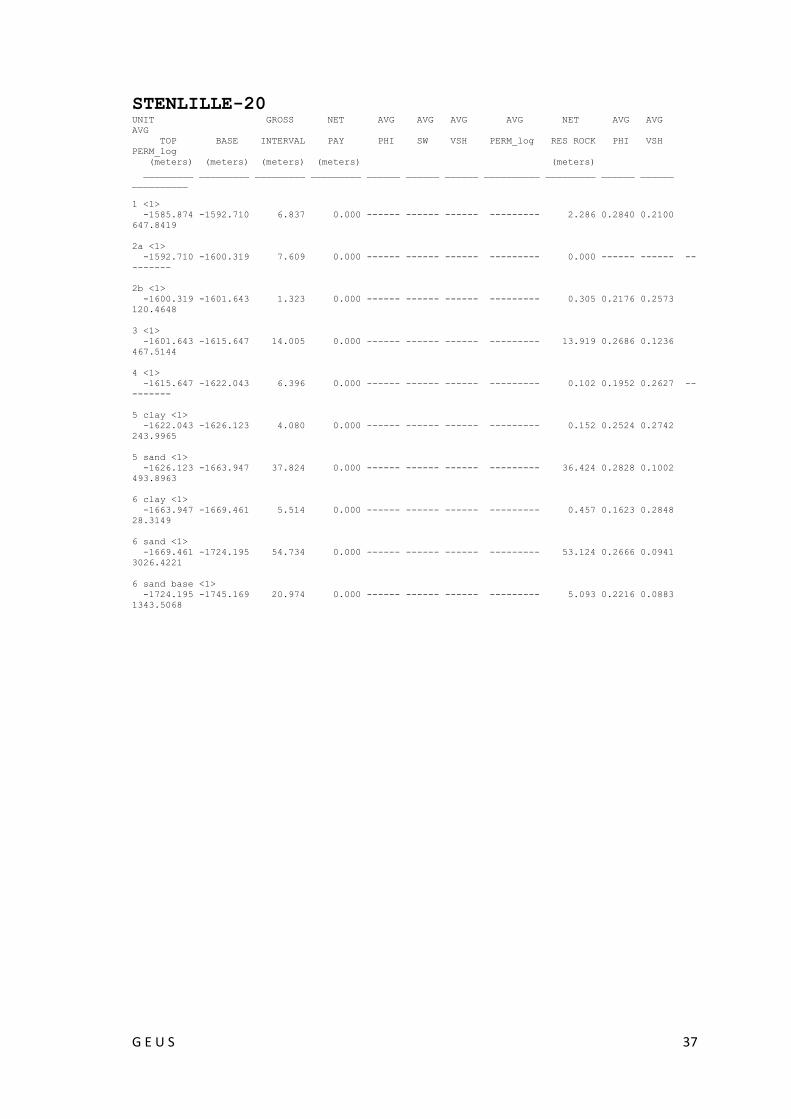
STENLILLE-20 UNIT GROSS NET AVG AVG AVG AVG NET AVG AVG
AVG
TOP BASE INTERVAL PAY PHI SW VSH PERM_log RES ROCK PHI VSH
PERM_log
(meters) (meters) (meters) (meters) (meters)
_________ _________ _________ _________ ______ ______ ______ __________ _________ ______ ______
__________
1 <1>
-1585.874 -1592.710 6.837 0.000 ------ ------ ------ --------- 2.286 0.2840 0.2100
647.8419
2a <1>
-1592.710 -1600.319 7.609 0.000 ------ ------ ------ --------- 0.000 ------ ------ --
-------
2b <1>
-1600.319 -1601.643 1.323 0.000 ------ ------ ------ --------- 0.305 0.2176 0.2573
120.4648
3 <1>
-1601.643 -1615.647 14.005 0.000 ------ ------ ------ --------- 13.919 0.2686 0.1236
467.5144
4 <1>
-1615.647 -1622.043 6.396 0.000 ------ ------ ------ --------- 0.102 0.1952 0.2627 --
-------
5 clay <1>
-1622.043 -1626.123 4.080 0.000 ------ ------ ------ --------- 0.152 0.2524 0.2742
243.9965
5 sand <1>
-1626.123 -1663.947 37.824 0.000 ------ ------ ------ --------- 36.424 0.2828 0.1002
493.8963
6 clay <1>
-1663.947 -1669.461 5.514 0.000 ------ ------ ------ --------- 0.457 0.1623 0.2848
28.3149
6 sand <1>
-1669.461 -1724.195 54.734 0.000 ------ ------ ------ --------- 53.124 0.2666 0.0941
3026.4221
6 sand base <1>
-1724.195 -1745.169 20.974 0.000 ------ ------ ------ --------- 5.093 0.2216 0.0883
1343.5068
G E U S 38
STENLILLE-3 UNIT GROSS NET AVG AVG AVG AVG NET AVG AVG
AVG
TOP BASE INTERVAL PAY PHI SW VSH PERM_log RES ROCK PHI VSH
PERM_log
(meters) (meters) (meters) (meters) (meters)
_________ _________ _________ _________ ______ ______ ______ __________ _________ ______ ______
__________
No Zones defined

G E U S 39
STENLILLE-4 UNIT GROSS NET AVG AVG AVG AVG NET AVG AVG
AVG
TOP BASE INTERVAL PAY PHI SW VSH PERM_log RES ROCK PHI VSH
PERM_log
(meters) (meters) (meters) (meters) (meters)
_________ _________ _________ _________ ______ ______ ______ __________ _________ ______ ______
__________
1 <1>
-1476.133 -1482.661 6.527 0.000 ------ ------ ------ --------- 1.829 0.2433 0.2449
208.8256
2a <1>
-1482.661 -1488.022 5.362 0.000 ------ ------ ------ --------- 0.000 ------ ------ --
-------
2b <1>
-1488.022 -1493.229 5.207 0.000 ------ ------ ------ --------- 3.048 0.2200 0.1895
135.6613
3 <1>
-1493.229 -1505.973 12.744 0.000 ------ ------ ------ --------- 12.574 0.2529 0.1256
261.3950
4 <1>
-1505.973 -1513.044 7.071 0.000 ------ ------ ------ --------- 2.666 0.2292 0.2583
159.8594
5 clay <1>
-1513.044 -1518.872 5.828 0.000 ------ ------ ------ --------- 0.000 ------ ------ --
-------
5 sand <1>
-1518.872 -1545.604 26.731 0.000 ------ ------ ------ --------- 24.621 0.2719 0.0809
367.9083
6 clay <1>
-1545.604 -1552.442 6.838 0.000 ------ ------ ------ --------- 0.437 0.1960 0.2229
64.0836
6 sand <1>
-1552.442 -1605.749 53.307 0.000 ------ ------ ------ --------- 50.380 0.2697 0.1111
3390.2488
6 sand base <1>
-1605.749 -1617.095 11.345 0.000 ------ ------ ------ --------- 2.896 0.2106 0.2096
987.3021

G E U S 40
STENLILLE-5 UNIT GROSS NET AVG AVG AVG AVG NET AVG AVG
AVG
TOP BASE INTERVAL PAY PHI SW VSH PERM_log RES ROCK PHI VSH
PERM_log
(meters) (meters) (meters) (meters) (meters)
_________ _________ _________ _________ ______ ______ ______ __________ _________ ______ ______
__________
1 <1>
-1495.105 -1500.433 5.328 0.000 ------ ------ ------ --------- 2.438 0.2338 0.2210
184.3900
2a <1>
-1500.433 -1508.285 7.852 0.000 ------ ------ ------ --------- 0.333 0.1717 0.2674
36.0450
2b <1>
-1508.285 -1513.753 5.468 0.000 ------ ------ ------ --------- 0.896 0.2735 0.2237
836.3172
3 <1>
-1513.753 -1519.502 5.749 0.000 ------ ------ ------ --------- 2.581 0.2567 0.1058
256.8015
4 <1>
-1519.502 -1533.856 14.355 0.000 ------ ------ ------ --------- 2.743 0.2436 0.1946
226.0464
5 clay <1>
-1533.856 -1540.903 7.046 0.000 ------ ------ ------ --------- 0.000 ------ ------ --
-------
5 sand <1>
-1540.903 -1575.305 34.403 0.000 ------ ------ ------ --------- 24.071 0.2631 0.1418
322.2812
6 clay <1>
-1575.305 -1580.283 4.977 0.000 ------ ------ ------ --------- 4.063 0.2355 0.2167
180.3302
6 sand <1>
-1580.283 -1602.085 21.803 0.000 ------ ------ ------ --------- 21.548 0.2677 0.0265
3114.8650
6 sand base <1>
-1602.085 -1638.860 36.775 0.000 ------ ------ ------ --------- 11.582 0.2389 0.1097
2046.2917
G E U S 41
STENLILLE-6 UNIT GROSS NET AVG AVG AVG AVG NET AVG AVG
AVG
TOP BASE INTERVAL PAY PHI SW VSH PERM_log RES ROCK PHI VSH
PERM_log
(meters) (meters) (meters) (meters) (meters)
_________ _________ _________ _________ ______ ______ ______ __________ _________ ______ ______
__________
1 <1>
-1531.196 -1531.250 0.054 0.000 ------ ------ ------ --------- 0.000 ------ ------ --
-------
2a <1>
-1531.196 -1538.261 7.065 0.000 ------ ------ ------ --------- 1.525 0.2206 0.1619
134.8891
2b <1>
-1538.261 -1543.166 4.905 0.000 ------ ------ ------ --------- 4.752 0.2241 0.1321
148.4678
3 <1>
-1543.166 -1553.531 10.366 0.000 ------ ------ ------ --------- 10.366 0.2491 0.0441
243.1441
4 <1>
-1553.531 -1571.547 18.015 0.000 ------ ------ ------ --------- 14.752 0.2144 0.1111
132.1908
5 clay <1>
-1571.547 -1574.660 3.113 0.000 ------ ------ ------ --------- 0.000 ------ ------ --
-------
5 sand <1>
-1574.660 -1603.820 29.160 0.000 ------ ------ ------ --------- 26.697 0.2630 0.0612
350.6345
6 clay <1>
-1603.820 -1608.827 5.008 0.000 ------ ------ ------ --------- 4.703 0.2078 0.0450
110.5722
6 sand <1>
-1608.827 -1638.770 29.942 0.000 ------ ------ ------ --------- 29.790 0.2665 0.0345
3081.1221
6 sand base <1>
-1638.770 -1673.305 34.535 0.000 ------ ------ ------ --------- 17.449 0.1887 0.2080
586.8921

G E U S 42
STENLILLE-7 UNIT GROSS NET AVG AVG AVG AVG NET AVG AVG
AVG
TOP BASE INTERVAL PAY PHI SW VSH PERM_log RES ROCK PHI VSH
PERM_log
(meters) (meters) (meters) (meters) (meters)
_________ _________ _________ _________ ______ ______ ______ __________ _________ ______ ______
__________
1 <1>
-1608.206 -1616.234 8.028 0.000 ------ ------ ------ --------- 0.000 ------ ------ --
-------
2a <1>
-1616.234 -1622.796 6.562 0.000 ------ ------ ------ --------- 0.000 ------ ------ --
-------
2b <1>
-1622.796 -1632.465 9.670 0.000 ------ ------ ------ --------- 1.067 0.2098 0.2539
99.4317
3 <1>
-1632.465 -1636.782 4.317 0.000 ------ ------ ------ --------- 0.152 0.1644 0.2937
29.5882
4 <1>
-1636.782 -1642.999 6.216 0.000 ------ ------ ------ --------- 0.915 0.1756 0.2610
43.1373
5 clay <1>
-1642.999 -1651.459 8.461 0.000 ------ ------ ------ --------- 0.000 ------ ------ --
-------
5 sand <1>
-1651.459 -1684.440 32.981 0.000 ------ ------ ------ --------- 20.422 0.2386 0.1961
210.0761
6 clay <1>
-1684.440 -1705.334 20.894 0.000 ------ ------ ------ --------- 3.657 0.2328 0.1439
179.1731
6 sand <1>
-1705.334 -1738.508 33.174 0.000 ------ ------ ------ --------- 32.537 0.2714 0.0765
3264.6833
6 sand base <1>
Unit or interval does not exist for this well.
G E U S 43
STENLILLE-8 UNIT GROSS NET AVG AVG AVG AVG NET AVG AVG
AVG
TOP BASE INTERVAL PAY PHI SW VSH PERM_log RES ROCK PHI VSH
PERM_log
(meters) (meters) (meters) (meters) (meters)
_________ _________ _________ _________ ______ ______ ______ __________ _________ ______ ______
__________
1 <1>
-1522.908 -1529.800 6.892 0.000 ------ ------ ------ --------- 0.000 ------ ------ --
-------
2a <1>
-1529.800 -1535.798 5.997 0.000 ------ ------ ------ --------- 0.000 ------ ------ --
-------
2b <1>
-1535.798 -1542.959 7.161 0.000 ------ ------ ------ --------- 1.123 0.1945 0.2781
57.5208
3 <1>
-1542.959 -1551.910 8.951 0.000 ------ ------ ------ --------- 6.954 0.2498 0.1343
303.7094
4 <1>
-1551.910 -1561.040 9.130 0.000 ------ ------ ------ --------- 2.743 0.2035 0.2627
85.4911
5 clay <1>
-1561.040 -1565.605 4.565 0.000 ------ ------ ------ --------- 0.000 ------ ------ --
-------
5 sand <1>
-1565.605 -1608.302 42.697 0.000 ------ ------ ------ --------- 40.081 0.2425 0.1149
224.5754
6 clay <1>
-1608.302 -1618.059 9.757 0.000 ------ ------ ------ --------- 4.900 0.2043 0.1972
91.2877
6 sand <1>
-1618.059 -1654.759 36.699 0.000 ------ ------ ------ --------- 36.700 0.2687 0.0551
3126.2231
6 sand base <1>
-1654.759 -1694.930 40.171 0.000 ------ ------ ------ --------- 34.380 0.1982 0.0743
2380.1987

G E U S 44
STENLILLE-9 UNIT GROSS NET AVG AVG AVG AVG NET AVG AVG
AVG
TOP BASE INTERVAL PAY PHI SW VSH PERM_log RES ROCK PHI VSH
PERM_log
(meters) (meters) (meters) (meters) (meters)
_________ _________ _________ _________ ______ ______ ______ __________ _________ ______ ______
__________
1 <1>
-1470.668 -1476.593 5.925 0.000 ------ ------ ------ --------- 0.152 0.1637 0.2977
29.0256
2a <1>
-1476.593 -1482.003 5.410 0.000 ------ ------ ------ --------- 0.000 ------ ------ --
-------
2b <1>
-1482.003 -1487.413 5.410 0.000 ------ ------ ------ --------- 1.356 0.2523 0.2208
294.5245
3 <1>
-1487.413 -1498.040 10.627 0.000 ------ ------ ------ --------- 8.855 0.2490 0.0654
273.6619
4 <1>
-1498.040 -1505.640 7.600 0.000 ------ ------ ------ --------- 1.981 0.1808 0.2621
50.7602
5 clay <1>
-1505.640 -1510.535 4.895 0.000 ------ ------ ------ --------- 0.000 ------ ------ --
-------
5 sand <1>
-1510.535 -1544.540 34.006 0.000 ------ ------ ------ --------- 29.565 0.2445 0.1199
236.7739
6 clay <1>
-1544.540 -1551.432 6.891 0.000 ------ ------ ------ --------- 0.147 0.1537 0.2062 --
-------
6 sand <1>
-1551.432 -1586.725 35.294 0.000 ------ ------ ------ --------- 35.057 0.2733 0.0366
3517.7966
6 sand base <1>
-1586.725 -1613.063 26.338 0.000 ------ ------ ------ --------- 13.868 0.2410 0.0990
2214.8315
G E U S 45
Table 3: Generalized reservoir parameters for the Gassum Formation zones
Average porosity, shale, and permeability distributions. Based on well and core data. Zones may
pinch out across the Stenlille structure and thus, the thickness of a particular zone varies in terms
of well location. Similarly, the net sand thickness varies in terms of shale volume, porosity and
well location.
Zone
(adapted from DONG)
Net sand thickness
(m)
Porosity
(%)
Shale volume
(%)
Permeability
(mD)
1 0 – 5 25 12 275
2a 0 – 4 20 14 100
2b 0 – 7 25 16 275
3 6 – 17 25 10 300
4 1 – 15 26 10 300
5_clay dominated 0 – 1 16 23 50
5_sand dominated 20 – 40 27 14 350
6_clay dominated 0 – 5 18 25 100
6_sand dominated 22 – 56 28 8 4000
6_sand/clay domi-
nated basal unit
2 – 34 22 15 1000
G E U S 46
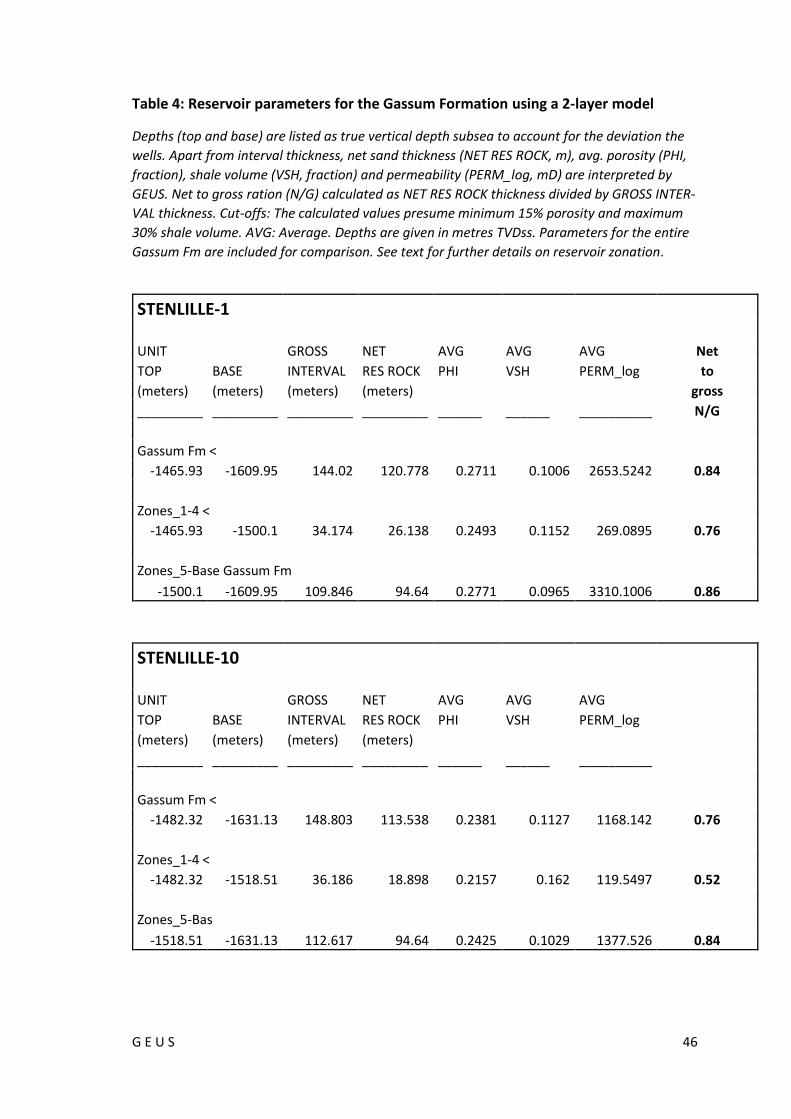
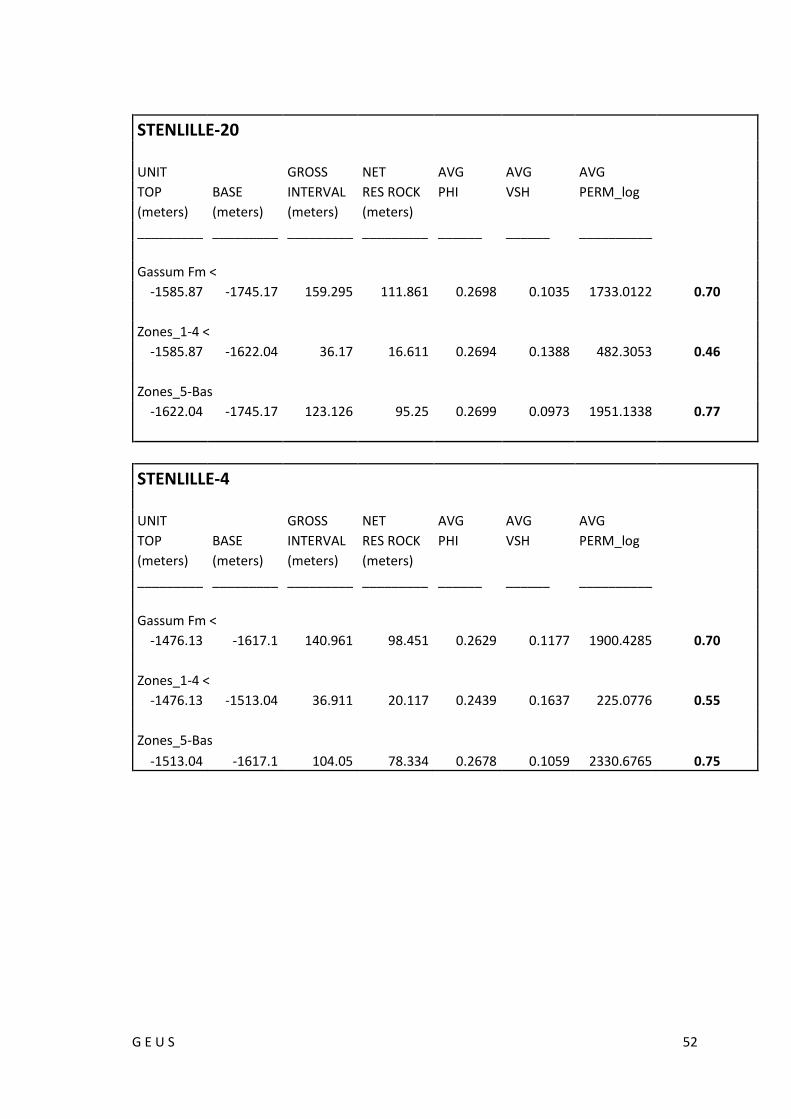
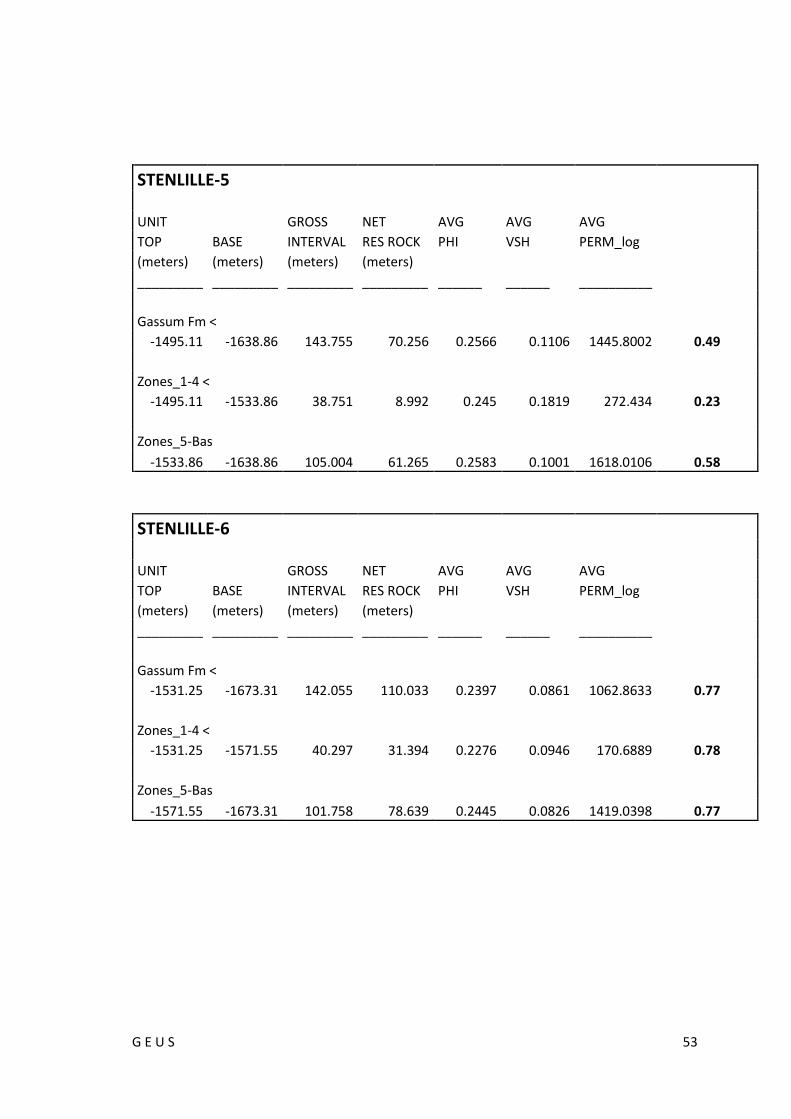
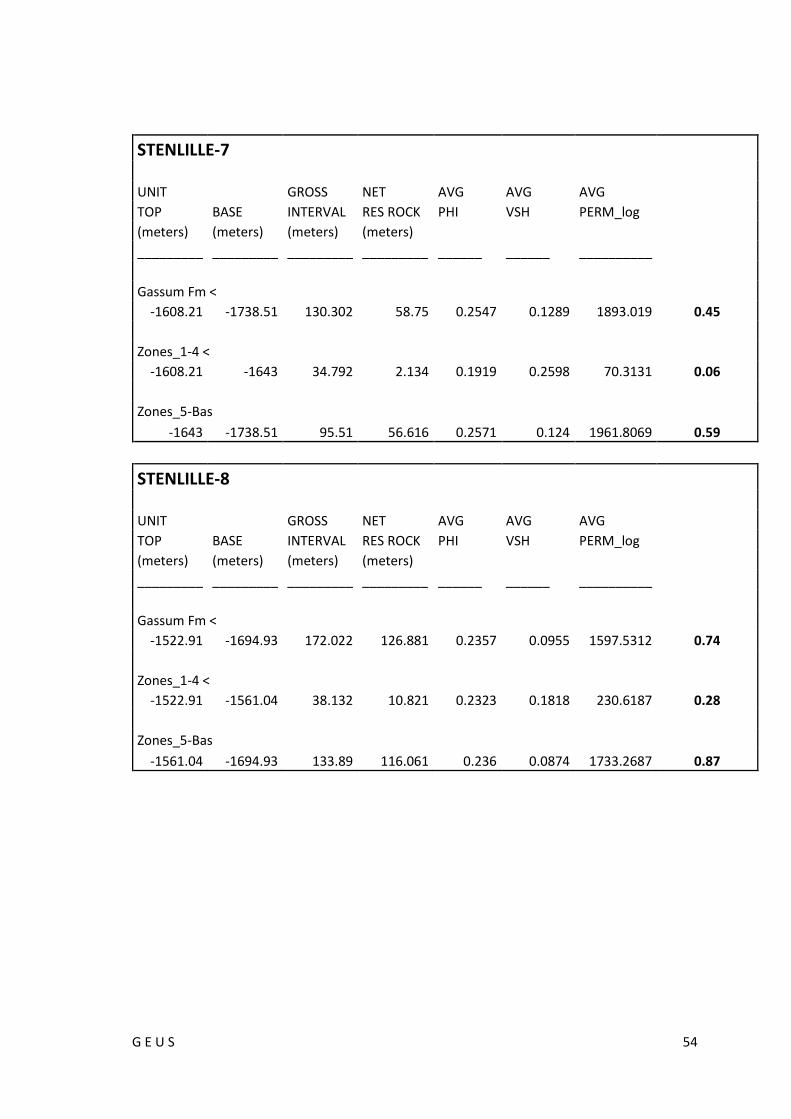
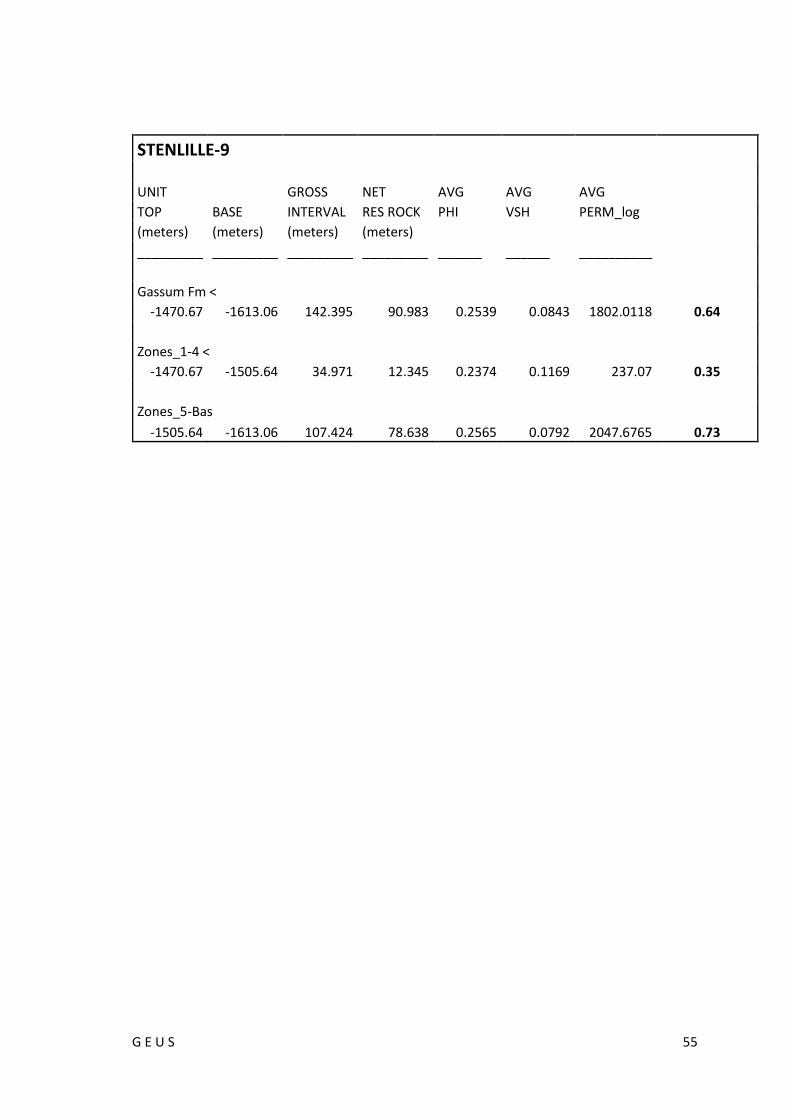
Table 4: Reservoir parameters for the Gassum Formation using a 2-layer model
Depths (top and base) are listed as true vertical depth subsea to account for the deviation the
wells. Apart from interval thickness, net sand thickness (NET RES ROCK, m), avg. porosity (PHI,
fraction), shale volume (VSH, fraction) and permeability (PERM_log, mD) are interpreted by
GEUS. Net to gross ration (N/G) calculated as NET RES ROCK thickness divided by GROSS INTER-
VAL thickness. Cut-offs: The calculated values presume minimum 15% porosity and maximum
30% shale volume. AVG: Average. Depths are given in metres TVDss. Parameters for the entire
Gassum Fm are included for comparison. See text for further details on reservoir zonation.
STENLILLE-1
UNIT GROSS NET AVG AVG AVG Net
TOP BASE INTERVAL RES ROCK PHI VSH PERM_log to
(meters) (meters) (meters) (meters) gross
_________ _________ _________ _________ ______ ______ __________ N/G
Gassum Fm <
-1465.93 -1609.95 144.02 120.778 0.2711 0.1006 2653.5242 0.84
Zones_1-4 <
-1465.93 -1500.1 34.174 26.138 0.2493 0.1152 269.0895 0.76
Zones_5-Base Gassum Fm
-1500.1 -1609.95 109.846 94.64 0.2771 0.0965 3310.1006 0.86
STENLILLE-10
UNIT GROSS NET AVG AVG AVG
TOP BASE INTERVAL RES ROCK PHI VSH PERM_log
(meters) (meters) (meters) (meters)
_________ _________ _________ _________ ______ ______ __________
Gassum Fm <
-1482.32 -1631.13 148.803 113.538 0.2381 0.1127 1168.142 0.76
Zones_1-4 <
-1482.32 -1518.51 36.186 18.898 0.2157 0.162 119.5497 0.52
Zones_5-Bas
-1518.51 -1631.13 112.617 94.64 0.2425 0.1029 1377.526 0.84
G E U S 47
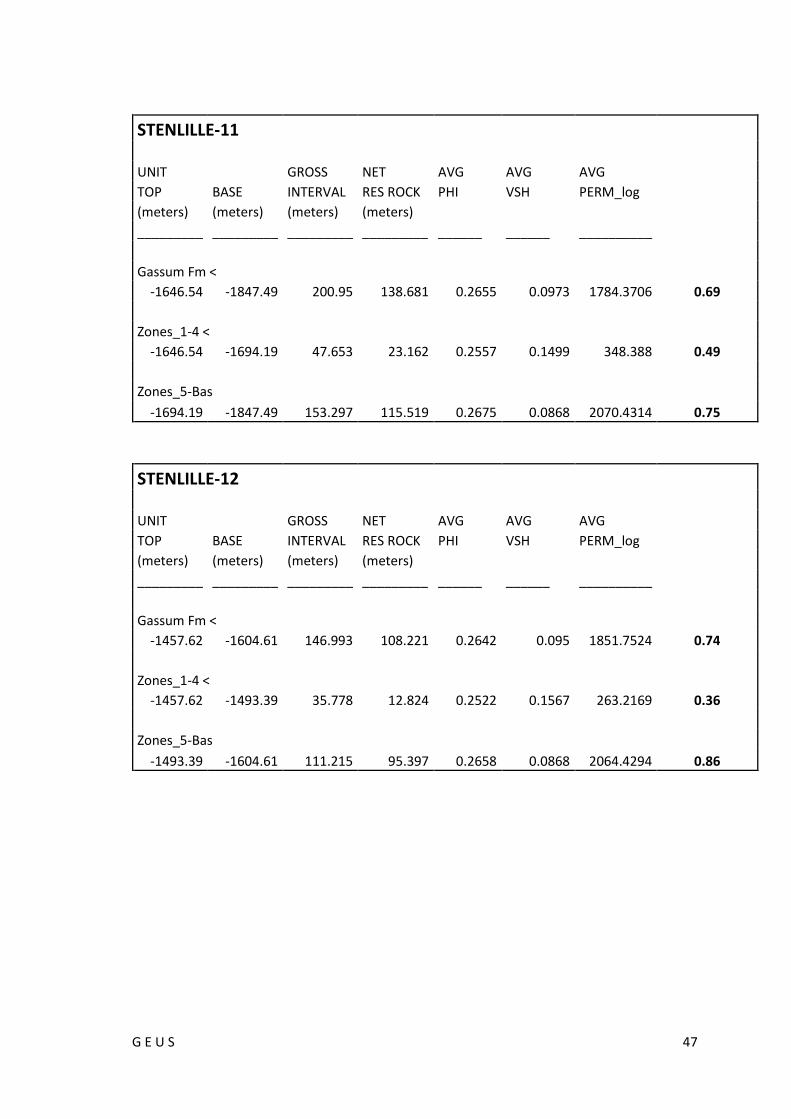
STENLILLE-11
UNIT GROSS NET AVG AVG AVG
TOP BASE INTERVAL RES ROCK PHI VSH PERM_log
(meters) (meters) (meters) (meters)
_________ _________ _________ _________ ______ ______ __________
Gassum Fm <
-1646.54 -1847.49 200.95 138.681 0.2655 0.0973 1784.3706 0.69
Zones_1-4 <
-1646.54 -1694.19 47.653 23.162 0.2557 0.1499 348.388 0.49
Zones_5-Bas
-1694.19 -1847.49 153.297 115.519 0.2675 0.0868 2070.4314 0.75
STENLILLE-12
UNIT GROSS NET AVG AVG AVG
TOP BASE INTERVAL RES ROCK PHI VSH PERM_log
(meters) (meters) (meters) (meters)
_________ _________ _________ _________ ______ ______ __________
Gassum Fm <
-1457.62 -1604.61 146.993 108.221 0.2642 0.095 1851.7524 0.74
Zones_1-4 <
-1457.62 -1493.39 35.778 12.824 0.2522 0.1567 263.2169 0.36
Zones_5-Bas
-1493.39 -1604.61 111.215 95.397 0.2658 0.0868 2064.4294 0.86

G E U S 48
STENLILLE-13
UNIT GROSS NET AVG AVG AVG
TOP BASE INTERVAL RES ROCK PHI VSH PERM_log
(meters) (meters) (meters) (meters)
_________ _________ _________ _________ ______ ______ __________
Gassum Fm <
-1457.5 -1605.56 148.056 98.083 0.2614 0.1303 1813.6049 0.66
Zones_1-4 <
-1457.5 -1494.49 36.989 13.576 0.2576 0.1624 308.2115 0.37
Zones_5-Bas
-1494.49 -1605.56 111.067 84.507 0.262 0.1252 2055.45 0.76
STENLILLE-14
UNIT GROSS NET AVG AVG AVG
TOP BASE INTERVAL RES ROCK PHI VSH PERM_log
(meters) (meters) (meters) (meters)
_________ _________ _________ _________ ______ ______ __________
Gassum Fm <
-1455.72 -1603.81 148.09 117.534 0.2566 0.0474 1532.3032 0.79
Zones_1-4 <
-1455.72 -1492.53 36.814 21.309 0.2426 0.1313 238.5034 0.58
Zones_5-Bas
-1492.53 -1603.81 111.276 96.225 0.2597 0.0288 1818.8114 0.86
G E U S 49
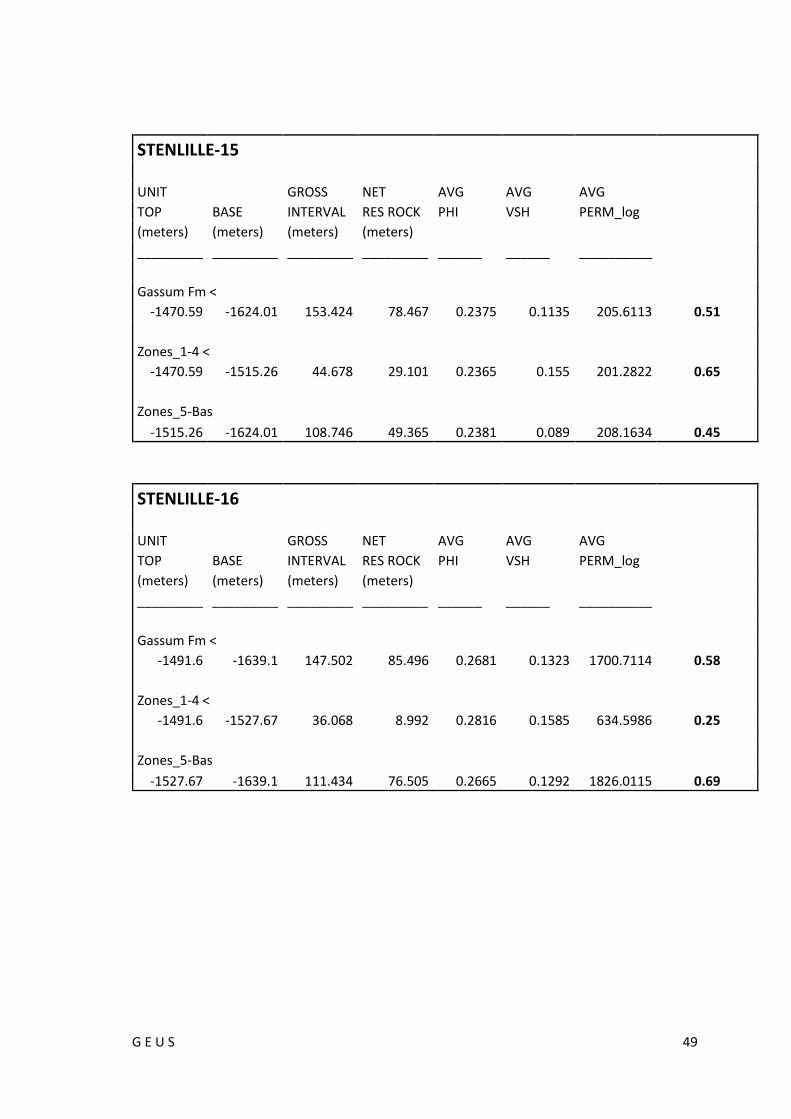
STENLILLE-15
UNIT GROSS NET AVG AVG AVG
TOP BASE INTERVAL RES ROCK PHI VSH PERM_log
(meters) (meters) (meters) (meters)
_________ _________ _________ _________ ______ ______ __________
Gassum Fm <
-1470.59 -1624.01 153.424 78.467 0.2375 0.1135 205.6113 0.51
Zones_1-4 <
-1470.59 -1515.26 44.678 29.101 0.2365 0.155 201.2822 0.65
Zones_5-Bas
-1515.26 -1624.01 108.746 49.365 0.2381 0.089 208.1634 0.45
STENLILLE-16
UNIT GROSS NET AVG AVG AVG
TOP BASE INTERVAL RES ROCK PHI VSH PERM_log
(meters) (meters) (meters) (meters)
_________ _________ _________ _________ ______ ______ __________
Gassum Fm <
-1491.6 -1639.1 147.502 85.496 0.2681 0.1323 1700.7114 0.58
Zones_1-4 <
-1491.6 -1527.67 36.068 8.992 0.2816 0.1585 634.5986 0.25
Zones_5-Bas
-1527.67 -1639.1 111.434 76.505 0.2665 0.1292 1826.0115 0.69

G E U S 50
STENLILLE-17
UNIT GROSS NET AVG AVG AVG
TOP BASE INTERVAL RES ROCK PHI VSH PERM_log
(meters) (meters) (meters) (meters)
_________ _________ _________ _________ ______ ______ __________
Gassum Fm <
-1455.59 -1604.15 148.552 92.908 0.2406 0.1296 1302.387 0.63
Zones_1-4 <
-1455.59 -1492.49 36.896 12.526 0.2333 0.1794 193.4447 0.34
Zones_5-Bas
-1492.49 -1604.15 111.656 80.383 0.2417 0.1218 1475.1899 0.72
STENLILLE-18
UNIT GROSS NET AVG AVG AVG
TOP BASE INTERVAL RES ROCK PHI VSH PERM_log
(meters) (meters) (meters) (meters)
_________ _________ _________ _________ ______ ______ __________
Gassum Fm <
-1455.55 -1602.48 146.921 110.419 0.2584 0.0927 1507.3516 0.75
Zones_1-4 <
-1455.55 -1492.06 36.502 20.571 0.2747 0.1431 497.4367 0.56
Zones_5-Bas
-1492.06 -1602.48 110.418 89.849 0.2546 0.0812 1737.2192 0.81
G E U S 51
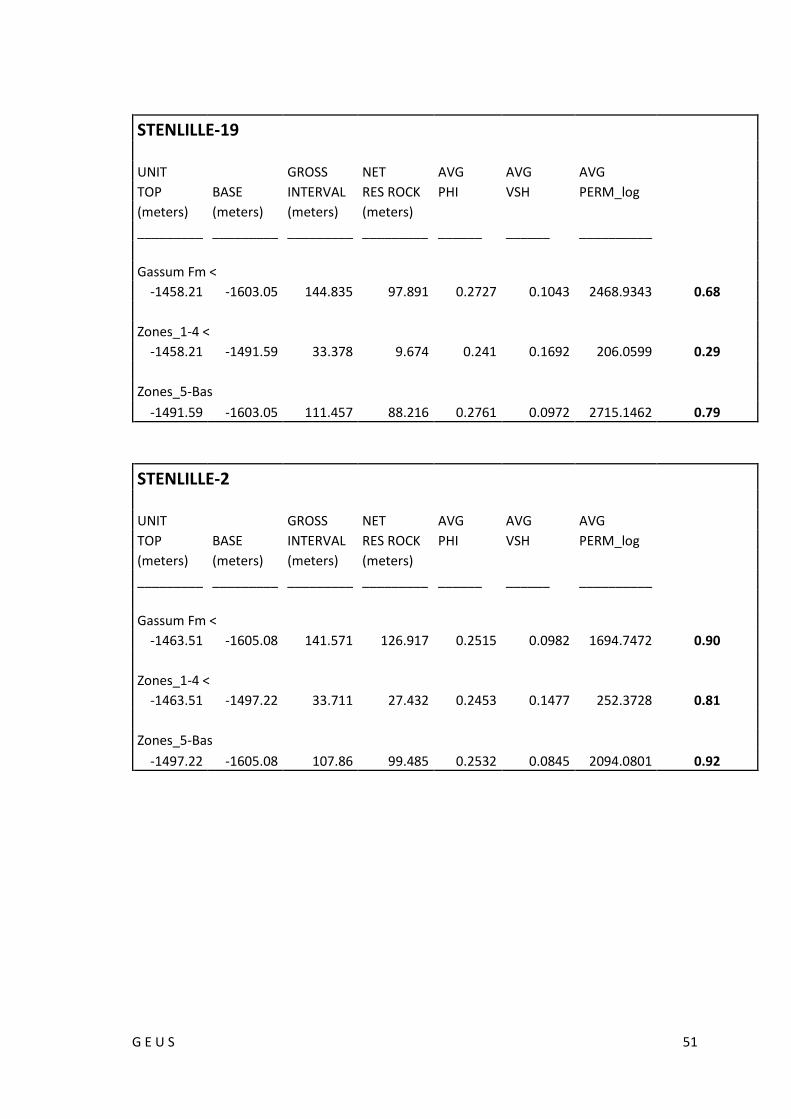
STENLILLE-19
UNIT GROSS NET AVG AVG AVG
TOP BASE INTERVAL RES ROCK PHI VSH PERM_log
(meters) (meters) (meters) (meters)
_________ _________ _________ _________ ______ ______ __________
Gassum Fm <
-1458.21 -1603.05 144.835 97.891 0.2727 0.1043 2468.9343 0.68
Zones_1-4 <
-1458.21 -1491.59 33.378 9.674 0.241 0.1692 206.0599 0.29
Zones_5-Bas
-1491.59 -1603.05 111.457 88.216 0.2761 0.0972 2715.1462 0.79
STENLILLE-2
UNIT GROSS NET AVG AVG AVG
TOP BASE INTERVAL RES ROCK PHI VSH PERM_log
(meters) (meters) (meters) (meters)
_________ _________ _________ _________ ______ ______ __________
Gassum Fm <
-1463.51 -1605.08 141.571 126.917 0.2515 0.0982 1694.7472 0.90
Zones_1-4 <
-1463.51 -1497.22 33.711 27.432 0.2453 0.1477 252.3728 0.81
Zones_5-Bas
-1497.22 -1605.08 107.86 99.485 0.2532 0.0845 2094.0801 0.92
G E U S 52
STENLILLE-20
UNIT GROSS NET AVG AVG AVG
TOP BASE INTERVAL RES ROCK PHI VSH PERM_log
(meters) (meters) (meters) (meters)
_________ _________ _________ _________ ______ ______ __________
Gassum Fm <
-1585.87 -1745.17 159.295 111.861 0.2698 0.1035 1733.0122 0.70
Zones_1-4 <
-1585.87 -1622.04 36.17 16.611 0.2694 0.1388 482.3053 0.46
Zones_5-Bas
-1622.04 -1745.17 123.126 95.25 0.2699 0.0973 1951.1338 0.77
STENLILLE-4
UNIT GROSS NET AVG AVG AVG
TOP BASE INTERVAL RES ROCK PHI VSH PERM_log
(meters) (meters) (meters) (meters)
_________ _________ _________ _________ ______ ______ __________
Gassum Fm <
-1476.13 -1617.1 140.961 98.451 0.2629 0.1177 1900.4285 0.70
Zones_1-4 <
-1476.13 -1513.04 36.911 20.117 0.2439 0.1637 225.0776 0.55
Zones_5-Bas
-1513.04 -1617.1 104.05 78.334 0.2678 0.1059 2330.6765 0.75
G E U S 53
STENLILLE-5
UNIT GROSS NET AVG AVG AVG
TOP BASE INTERVAL RES ROCK PHI VSH PERM_log
(meters) (meters) (meters) (meters)
_________ _________ _________ _________ ______ ______ __________
Gassum Fm <
-1495.11 -1638.86 143.755 70.256 0.2566 0.1106 1445.8002 0.49
Zones_1-4 <
-1495.11 -1533.86 38.751 8.992 0.245 0.1819 272.434 0.23
Zones_5-Bas
-1533.86 -1638.86 105.004 61.265 0.2583 0.1001 1618.0106 0.58
STENLILLE-6
UNIT GROSS NET AVG AVG AVG
TOP BASE INTERVAL RES ROCK PHI VSH PERM_log
(meters) (meters) (meters) (meters)
_________ _________ _________ _________ ______ ______ __________
Gassum Fm <
-1531.25 -1673.31 142.055 110.033 0.2397 0.0861 1062.8633 0.77
Zones_1-4 <
-1531.25 -1571.55 40.297 31.394 0.2276 0.0946 170.6889 0.78
Zones_5-Bas
-1571.55 -1673.31 101.758 78.639 0.2445 0.0826 1419.0398 0.77
G E U S 54
STENLILLE-7
UNIT GROSS NET AVG AVG AVG
TOP BASE INTERVAL RES ROCK PHI VSH PERM_log
(meters) (meters) (meters) (meters)
_________ _________ _________ _________ ______ ______ __________
Gassum Fm <
-1608.21 -1738.51 130.302 58.75 0.2547 0.1289 1893.019 0.45
Zones_1-4 <
-1608.21 -1643 34.792 2.134 0.1919 0.2598 70.3131 0.06
Zones_5-Bas
-1643 -1738.51 95.51 56.616 0.2571 0.124 1961.8069 0.59
STENLILLE-8
UNIT GROSS NET AVG AVG AVG
TOP BASE INTERVAL RES ROCK PHI VSH PERM_log
(meters) (meters) (meters) (meters)
_________ _________ _________ _________ ______ ______ __________
Gassum Fm <
-1522.91 -1694.93 172.022 126.881 0.2357 0.0955 1597.5312 0.74
Zones_1-4 <
-1522.91 -1561.04 38.132 10.821 0.2323 0.1818 230.6187 0.28
Zones_5-Bas
-1561.04 -1694.93 133.89 116.061 0.236 0.0874 1733.2687 0.87
G E U S 55
STENLILLE-9
UNIT GROSS NET AVG AVG AVG
TOP BASE INTERVAL RES ROCK PHI VSH PERM_log
(meters) (meters) (meters) (meters)
_________ _________ _________ _________ ______ ______ __________
Gassum Fm <
-1470.67 -1613.06 142.395 90.983 0.2539 0.0843 1802.0118 0.64
Zones_1-4 <
-1470.67 -1505.64 34.971 12.345 0.2374 0.1169 237.07 0.35
Zones_5-Bas
-1505.64 -1613.06 107.424 78.638 0.2565 0.0792 2047.6765 0.73
Geological survey of Denmark and Greenland (GEUS)
Denmark
GEUS is a research and advisory institution in the Danish Ministry of Climate, Energy and Utilities