Embed Size (px)
Citation preview
Draft
CARBOHYDRATE SUPPLEMENTATION ATTENUATES
DECREMENT OF PERFORMANCE IN OVERTRAINED RATS
Journal: Applied Physiology, Nutrition, and Metabolism
Manuscript ID apnm-2015-0393.R1
Manuscript Type: Article
Date Submitted by the Author: 04-Sep-2015
Complete List of Authors: Oliveira Coutinho de, Caio; Federal University of Paraíba, Nutrition Departament Barbosa, Carlos; Federal University of Paraíba, Nutrition Department Massa, Nayara; Federal University of Paraíba, Nutrition Department Pereira, Reabias; Federal University of Paraíba, Physical Education Department Félix, Gustavo; Federal University of Paraíba, Physical Education Department Aquino, Jailane; University Federal of Paraíba, Nutrition Departament Oliveira, Edilamar; University of São Paulo, Biodynamic of the Movement of the Human Body Department Silva, Alexandre; University Federal of Paraíba, Department of Physical Education
Keyword: Carbohydrate, exercise < exercise, performance < performance, Overtraining, Akt-1
https://mc06.manuscriptcentral.com/apnm-pubs
Applied Physiology, Nutrition, and Metabolism

Draft
1
CARBOHYDRATE SUPPLEMENTATION ATTENUATES DECREMENT OF 1
PERFORMANCE IN OVERTRAINED RATS 2
3
Caio Victor Coutinho de Oliveira, Carlos Vinícius Barbosa, Nayara Moreira Massa, Reabias 4
de Andrade Pereira, Gustavo da Silva Félix, Jailane de Souza Aquino, Edilamar Menezes de 5
Oliveira, Alexandre Sérgio Silva. 6
7
C.V. Oliveira; C.V. Barbosa; N.M. Massa; J.S. Aquino. Nutrition Department, Federal 8
University of Paraíba, ZIP CODE 58051-900, João Pessoa, Paraíba, Brazil. E-mail: 9
[email protected]; [email protected]; [email protected]; 10
12
R.A. Pereira; G.S. Félix. Physical Education Department, Federal University of Paraíba, 13
ZIP CODE 58051-900, João Pessoa, Paraíba, Brazil. E-mail: [email protected]; 14
16
E.M. Oliveira. Biodynamic of the Movement of the Human Body Department, University of 17
São Paulo, ZIP CODE 05508900 São Paulo, São Paulo, Brazil. E-mail: [email protected]. 18
19
Corresponding Author: A.S. Silva. Physical Education Department, Federal University of 20
Paraíba, João Pessoa, Paraíba, Brazil. R. Silvino Lopes, 410 / 804, Tambaú – João 21
Pessoa/Paraíba, Brazil. ZIP CODE: 58.039-190. E-mail: 22
[email protected]. Phone: 55 83 8875-4675 23
24
25
Page 1 of 31
https://mc06.manuscriptcentral.com/apnm-pubs
Applied Physiology, Nutrition, and Metabolism

Draft
2
Abstract 26
Although carbohydrate ingestion at the end of single exercises is recognized to delays fatigue 27
and accelerates recovery, if chronic ingestion can prevent overtraining during periods of 28
intense training is something not yet elucidated. The present study aimed to determine 29
whether carbohydrate supplementation minimize overtraining in Wistar rats. The animals 30
underwent 11 weeks of training (running) on a treadmill, and the last 3 weeks were designed 31
to induce overtraining. One group was supplemented with carbohydrates (EX-CHO; n=13), 32
one group had no supplementation (EX; n=10), and another group remained inactive (C; 33
n=9). Performance tests (Pr) were given before training (Pr1) and at the 8th (Pr2) and 11th 34
training week (Pr3). Food intake, body weight, testosterone, cortisol, malondialdehyde, 35
creatine kinase (CK) and activities of PI3-K, Akt-1, mTOR and GSK-3 enzymes were 36
measured. In the EX group, there was a significant 32.6% performance decrease at Pr3 37
compared to Pr2. Additionally, at protocol completion, the EX-CHO group had a greater 38
gastrocnemius weight than the C group (p=0.02), which did not occur in the EX group. 39
Training caused anorexia, decreased testosterone (p=0.001) and increased malondialdehyde 40
(p=0.009) in both exercise groups compared to C, without an influence of carbohydrate 41
supplementation on these variables (p>0.05). The activity of Akt-1 was higher in the EX-42
CHO group but not the EX group compared to the C group (p=0.013). Carbohydrate 43
supplementation promoted an attenuation in the performance decrement and maintained 44
gastrocnemius muscle mass in animals that had undergone overtraining protocols, which was 45
accompanied by increased activity of the Akt-1 molecular indicator. 46
Keywords: Carbohydrate, Exercise, Performance, Overtraining, Akt-1, Rats. 47
48
Page 2 of 31
https://mc06.manuscriptcentral.com/apnm-pubs
Applied Physiology, Nutrition, and Metabolism
Draft
3
1 Introduction 49
50
Overtraining syndrome (OTS) is a phenomenon that has increased in prevalence 51
among high-performance athletes (Smith 2000). It is estimated that 37% of elite athletes from 52
various sports have suffered from OTS symptoms at some point in their careers (Kenttä et al. 53
2001), specifically, 65% of distance runners (Morgan et al. 1987), 50% of semi-professional 54
soccer players and 21% of swimmers on the Australian national team (Smith 2000). 55
OTS results from an imbalance between excess training and inadequate recovery 56
(Armstrong and VanHeest 2002). Nutrition participates in the etiology of OTS, as nutrients 57
strongly influence the recovery time between exercise sessions (Kreider 2010) and provide 58
energy to muscles during subsequent training sessions. In this sense, the use of nutritional 59
resources to accelerate post workout recovery has grown considerably (Mitchell 2013). 60
Among various nutritional resources, carbohydrates are recognized as a very 61
important effective ergogenic aid. Supplementation has been shown to be effective in 62
delaying fatigue in prolonged exercise (Borges et al. 2012), increasing the rate of glycogen 63
resynthesis (Van Loon et al. 2000), accelerating the recovery of physical capacity (De Sousa, 64
et al. 2010) and elevating insulinemia during exercise (McAnulty et al. 2007). As 65
carbohydrates are capable of accelerating post-exercise recovery, this phenomenon supports 66
the hypothesis that carbohydrate supplementation can minimize or prevent the development 67
of OT over a season of intense training. However, most studies that have provided support for 68
this hypothesis have done so only after one or few sessions (De Sousa et al. 2010; Karelis et 69
al. 2010) and it is not wise to extrapolate the ergogenic effect of carbohydrates to a whole 70
training season. 71
The only investigations that have tested the chronic effects of carbohydrates on the 72
prevention of OT were conducted with cyclists (Halson et al. 2004) and runners (Achten et al 73
Page 3 of 31
https://mc06.manuscriptcentral.com/apnm-pubs
Applied Physiology, Nutrition, and Metabolism
Draft
4
2004). However, these interventions lasted less than 11 days and had short recovery intervals. 74
Thus, we believe that this short intervention precludes the prevention premise within a more 75
chronic context, as OT is most often experienced. 76
Thus, this study was conducted to assess the influence of carbohydrate 77
supplementation on the prevention or minimization of overtraining in an experimental animal 78
model of intense physical training with short recovery intervals. The aim of this study was to 79
assess whether carbohydrate supplementation can prevent or minimize OT in adult male 80
Wistar rats by observing a performance test, which is the main indicator OT (Smith 2000). In 81
addition, we aimed to assess whether changes in enzymatic OT markers, hormonal OT 82
markers, oxidative stress and the activity of enzymes involved in the muscular 83
anabolism/catabolism process are involved in the possible protective effects of carbohydrates 84
in OT. 85
86
2 Materials and Methods 87
88
Animals: A total of 32 Wistar male rats (Rattus norvegicus albinus) were used; they were 12 89
weeks old and procured from the “Professor Dr. Thomas Georgel” vivarium at the 90
Biotechnology Center (CBiotec), Federal University of Paraíba (UFPB). The rats were 91
divided into three groups: Sedentary control (C: n = 9); exercise group without 92
supplementation (EX: n = 10) and exercise group supplemented with carbohydrates (EX-93
CHO: n = 13). Animals were kept under standard lighting conditions (light/dark cycle, 12/12 94
hours); the environment was kept at 22 ± 1° C and 65% humidity, and they were housed in 95
groups of five. They received fresh water and food daily ad libitum. The procedures were in 96
accordance with the laboratory animals’ handling and care principles recommended by the 97
Brazilian College of Animal Experimentation (COBEA). The research project was approved 98
Page 4 of 31
https://mc06.manuscriptcentral.com/apnm-pubs
Applied Physiology, Nutrition, and Metabolism

Draft
5
by the Ethics Committee on Animal Use (CEUA) – UFPB under the protocol number 99
1303/12. 100
101
Adaptation to training and gavage: Rats underwent two weeks of adaptation to the gavage 102
procedure and treadmill running. They were subjected to running 10 minutes per day at a 103
speed of 12 m/min five consecutive days per week. Using a scale described by Lira et al. 104
(2010) the animals were ranked on a daily basis according to the behavior during the 105
treadmill session: 1) refuses to run; 2) below average runner (runs and stops; runs in the 106
wrong direction); 3) average runner; 4) above average runner (runs constantly, occasionally 107
running below the treadmill speed); and 5) good runner (runs consistently at the treadmill 108
speed). Animals that had an average of 3 or more (n = 32) were included in the study. After 109
the exercise, they underwent a process of gavage with water. 110
111
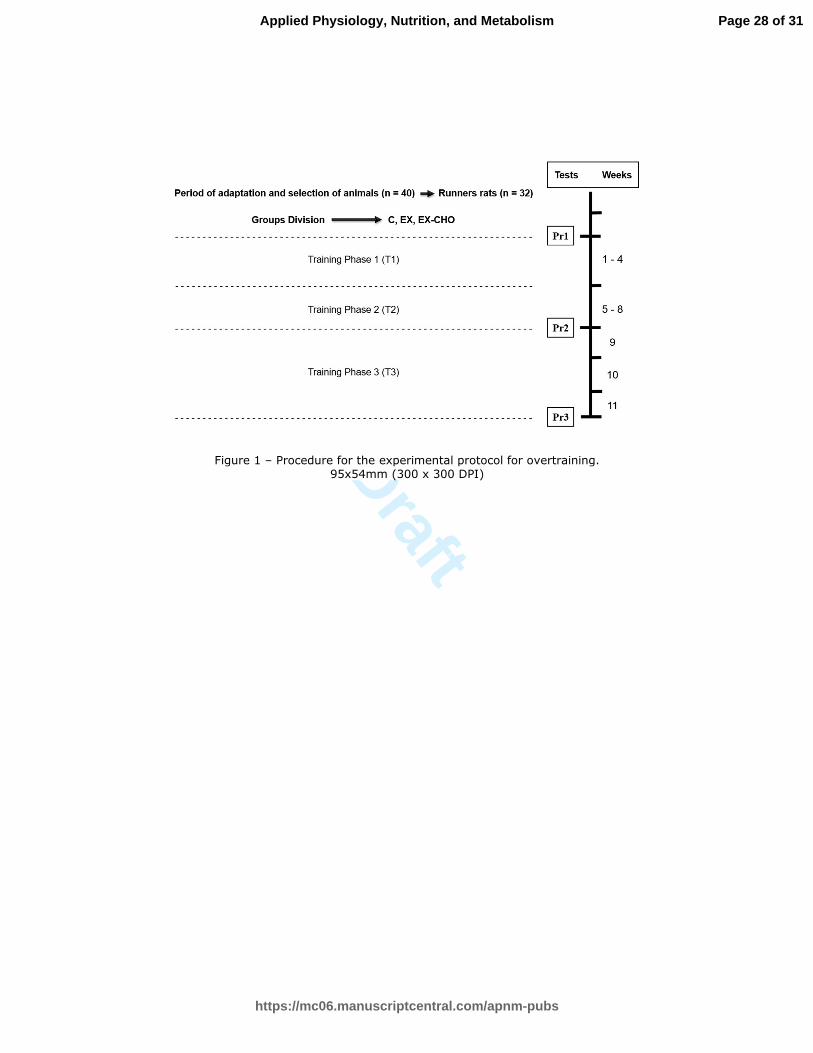
Training protocol: The training protocol started the very next week after adaptation. It was 112
performed according to the previously characterized procedure to induce overtraining in 113
Wistar rats by Hohl et al. (2009). The first stage (T1) consisted of four weeks of running at 114
speeds varying from 15 to 25 m/min and lasting 25 to 60 minutes five consecutive days per 115
week. In the second phase (T2), which was four weeks long, we kept the same running speed 116
and session’s duration that were achieved at the end of T1, also five consecutive days per 117
week. Stages T1 and T2 were performed between 01:00PM and 05:00PM. The third and final 118
training stage (T3) lasted three weeks and was characterized by an increased frequency of 119
training to up to four sessions per day. As the number of daily sessions increased, the 120
recovery time between sessions was reduced from 4 hours to 3 hours and then to 2 hours. The 121
last session of the day always ended at 05:00PM. 122
Page 5 of 31
https://mc06.manuscriptcentral.com/apnm-pubs
Applied Physiology, Nutrition, and Metabolism
Draft
6
Performance Tests (Pr): Performance tests were performed 48 hours after the adaptation 123
period, during the 8th week of training and during the 11th week of training (always between 124
01:00PM and 05:00PM). After the performance test, the rats were allowed 48 hours of rest in 125
order to recover before the next week of training. Tests started with animals running on a 126
treadmill without an incline and an initial speed of 12 m/min for five minutes. Then, the 127
speed was increased 2 m/min every 3 minutes until exhaustion, which was defined when the 128
animals could not maintain the speed despite being encouraged three times by researchers. 129
Performance was quantified with an equation described by Hohl et al. (2009). By considering 130
all the forces proportional to body weight and all the speeds proportional to the running 131
speed, mechanical energy becomes proportional to mass × speed. This assumption allows one 132
to measure the rat’s performance with a quantity that is proportional to the mechanical work, 133
i.e., force × duration, as shown in the equation below. 134
135
�� = ∑��� = ∑���� = ∑�� = �
136
where Pr = rat’s performance in kilograms – meters (Kg.m); Pri = rat’s performance in each 137
stage, m = body mass index; Vi = stage speed; Ti = running time in each stage; Di = distance 138
achieved in the stage; and D = total distance covered on the test. 139
The procedures performed throughout the experimental protocol for induction of overtraining 140
are described in figure 1. 141
142
143
Insert Figure 1 144
145
Page 6 of 31
https://mc06.manuscriptcentral.com/apnm-pubs
Applied Physiology, Nutrition, and Metabolism

Draft
7
Supplementation Protocol: Solutions with 30% carbohydrate in the form of dextrose were 146
administered to the animals by gavage before and immediately after each exercise session 147
during the 9th week and on the 1st and 3rd exercise session of each one of the 10th and 11th 148
weeks. The dose was 1.0 mL per 100 g body weight, as described by Morifuji et al. (2010) 149
and Morifuji et al. (2011). 150
151
Animals Sacrifice: Exactly 36 hours after the last performance test and after a 12-hour fast, 152
the animals were intraperitoneally anesthetized with ketamine (75 mg/kg) and xylazine (20 153
mg/kg). Subsequently, they were sacrificed by exsanguination according to the Brazilian 154
College of Animal Experimentation (COBEA) ethical principles. 155
156
Biochemical analyses: Blood was collected by cardiac puncture and placed in test tubes with 157
and without EDTA. Then, the samples were centrifuged at 3,000 rpm for 15 minutes and 158
stored at -80° C until analysis. Biochemical assays were performed on serum creatine kinase 159
(CK) using a commercial kit (Labtest, Minas Gerais, Brazil) and on testosterone and cortisol 160
by chemiluminescence using an automatic biochemical analyzer Elecsys 2010 (Roche). With 161
plasma samples, malondialdehyde (MDA) was determined. 162
163
Protein activity of GSK-3, PI3-K, Akt-1 and mTOR: The gastrocnemius muscle was 164
homogenized in hypotonic lysis buffer containing 50 mM potassium phosphate (pH 7.0), 0.3 165
M sucrose, 0.5 mM DTT, 1 mM EDTA (pH 8.0), 0.3 mM PMSF, 10 mM NaF, and a cocktail 166
of protease and phosphatase inhibitors (1:100). The homogenate was centrifuged at 12,000 167
rpm for 10 minutes at 4° C, transferred to 1.5 ml tubes and stored at -80° C. The protein 168
concentration was determined using the Bradford method (1976) (Bradfort 1976). 169
170
Page 7 of 31
https://mc06.manuscriptcentral.com/apnm-pubs
Applied Physiology, Nutrition, and Metabolism
Draft
8
Aliquots (30 mg) of the homogenate were diluted in sample buffer (Tris-HCl, 240 171
mM (pH 6.8), 0.8% SDS, 200 mM β-mercaptoethanol, 40% glycerol and 0.02% 172
bromophenol blue). The analysis of protein levels was performed with western blotting using 173
polyacrylamide gel electrophoresis (SDS-PAGE 6-12%, depending on the protein molecular 174
weight) (Towbin 1992). Subsequently, proteins were transferred to a nitrocellulose membrane 175
(Amersham Biosciences, Piscataway, NJ, USA) and incubated with casein and PI3K 176
p110alpha primary antibodies (rabbit polyclonal, 1:1000, Santa Cruz, CA, USA), Akt1 177
(rabbit polyclonal, 1:1000, Santa Cruz, CA, USA), p-Akt1 (Ser473) (rabbit polyclonal, 178
1:1000, Santa Cruz, CA, USA), mTOR (rabbit polyclonal, 1:1000, Cell Signaling Tech., MA, 179
USA), p-mTOR (Ser2448) (rabbit polyclonal, 1:1000, Cell Signaling Tech., MA, USA), 180
GS3Kb (rabbit polyclonal, 1:1000, Cell Signaling Tech., MA, USA), and p-GS3Kb (Ser9) 181
(rabbit polyclonal, 1:1000, Cell Signaling Tech., MA, USA). Unbound antibody was 182
removed by washing, and the membrane was exposed to the secondary antibody (conjugated 183
to horseradish peroxidase (HRP)), which was directed to species-specific portions of the 184
primary antibody. Then, they were washed 3 times for 10 min each in TBS-T and incubated 185
for 2 hours with the secondary antibodies (all anti-rabbit, Amersham Biosciences, NJ, USA) 186
conjugated to peroxidase. Subsequently, the complex was detected by 187
electrochemiluminescence (ECL). The protein concentration was normalized to that of 188
glyceraldehyde 3-phosphate dehydrogenase (GAPDH). The images were visualized using the 189
Chemi-doc Gel Quantification System (Bio-Rad, Hercules, CA, USA). Protein concentrations 190
were quantified from the blots using ImageJ software (Image J based on NIH image). The 191
ratio of phosphorylated protein/total protein (P/T) was calculated in order to measure changes 192
in the proteins’ activity. 193
194
Page 8 of 31
https://mc06.manuscriptcentral.com/apnm-pubs
Applied Physiology, Nutrition, and Metabolism
Draft
9
Statistical Analyses: Data are presented as the mean and standard deviation. The Shapiro-195
Wilk and Levene tests were initially performed in order to verify normality and compare 196
differences between the variables' standard deviations. We used analysis of variance (two-197
way or one-way ANOVA, as appropriate) with Tukey’s post hoc test or, for a non-parametric 198
analysis, the Kruskal-Wallis or Friedman test with Dunn’s post hoc test. We adopted a 199
confidence level of 5% (p<0.05) to determine statistical significance for all tests. These 200
procedures were performed using InStat 3.0.1 software (Graph Pad InStat, San Diego, CA, 201
USA). 202
203
3 Results 204
205
Performance: Results of the three performance tests (Pr) conducted over 11 weeks of 206
training are shown in Figure 2. Prior to training (Pr1), animals in the three groups exhibited 207
similar performance. At the end of the eighth week of training, in (Pr2), the two exercise 208
groups showed significantly better performance compared to the beginning of the training 209
and in relation to the C group (p<0.01), but with no differences between them. The increase 210
in daily training sessions between weeks 9 and 12 resulted in a significant 32.6% decrease in 211
performance in the EX group (616.86±215.46 Kg.m to 415.35±103.08 Kg.m, p<0.01). 212
Meanwhile, the performance of rats in the EX-CHO group decreased, but not to a significant 213
degree (24.1%; 687.80±233.17 Kg.m to 521.95±145.81 Kg.m). However, the final 214
performance of the rats in the EX and EX-CHO groups did not differ significantly, despite a 215
trend towards higher performance in the EX-CHO group (p=0.063). 216
217
Insert Figure 2 218
219
Page 9 of 31
https://mc06.manuscriptcentral.com/apnm-pubs
Applied Physiology, Nutrition, and Metabolism
Draft
10
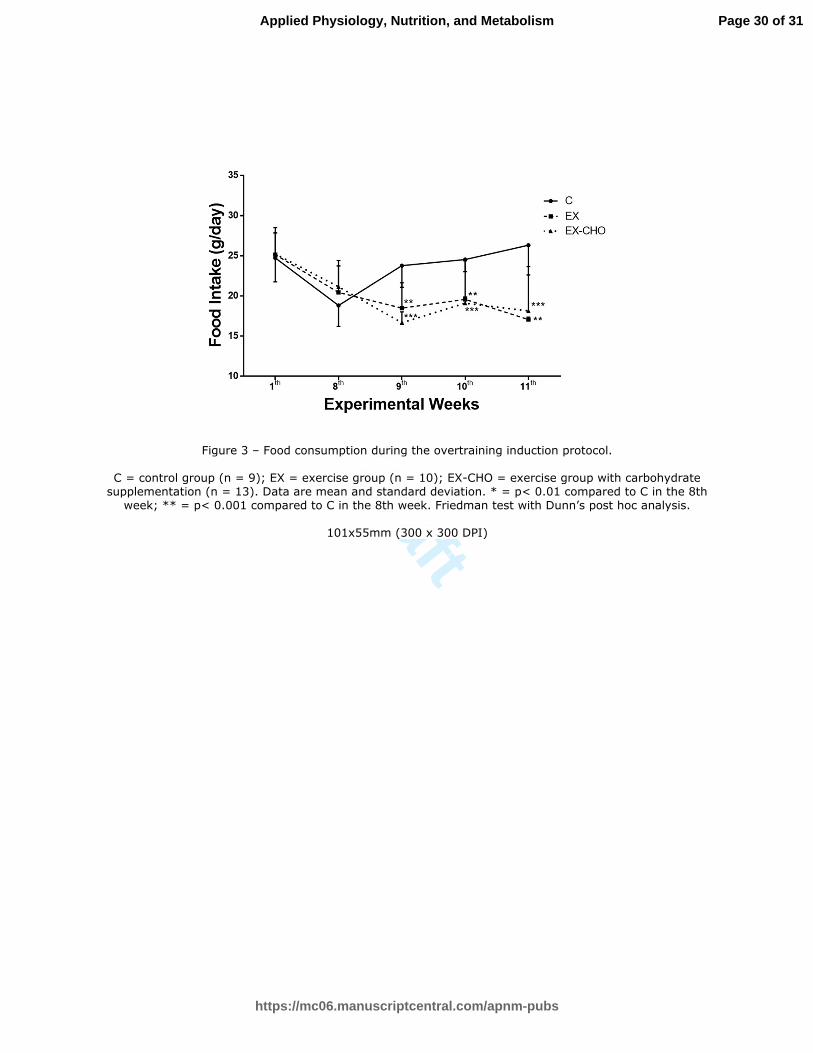
Food Consumption: The three groups maintained similar food consumption during the first 220
eight weeks of training (Figure 3). While the animals that remained sedentary consumed the 221
same amount of food between the 8th and 11th weeks, the increased training load during this 222
period was accompanied by a drastic reduction of food intake in both the EX (p<0.01) and 223
EX-CHO groups (p<0.001) as early as the 9th week of the training protocol. Specifically, the 224
rats in the EX and EX-CHO groups consumed less in the 9th
week compared to the 8th week 225
and compared to the C group. This anorexic behavior persisted until the 11th week in both 226
groups. The reduction in food consumption both for the EX and CHO-EX groups was of the 227
same magnitude throughout the entire overtraining period. 228
229
230
Insert Figure 3 231
232
233
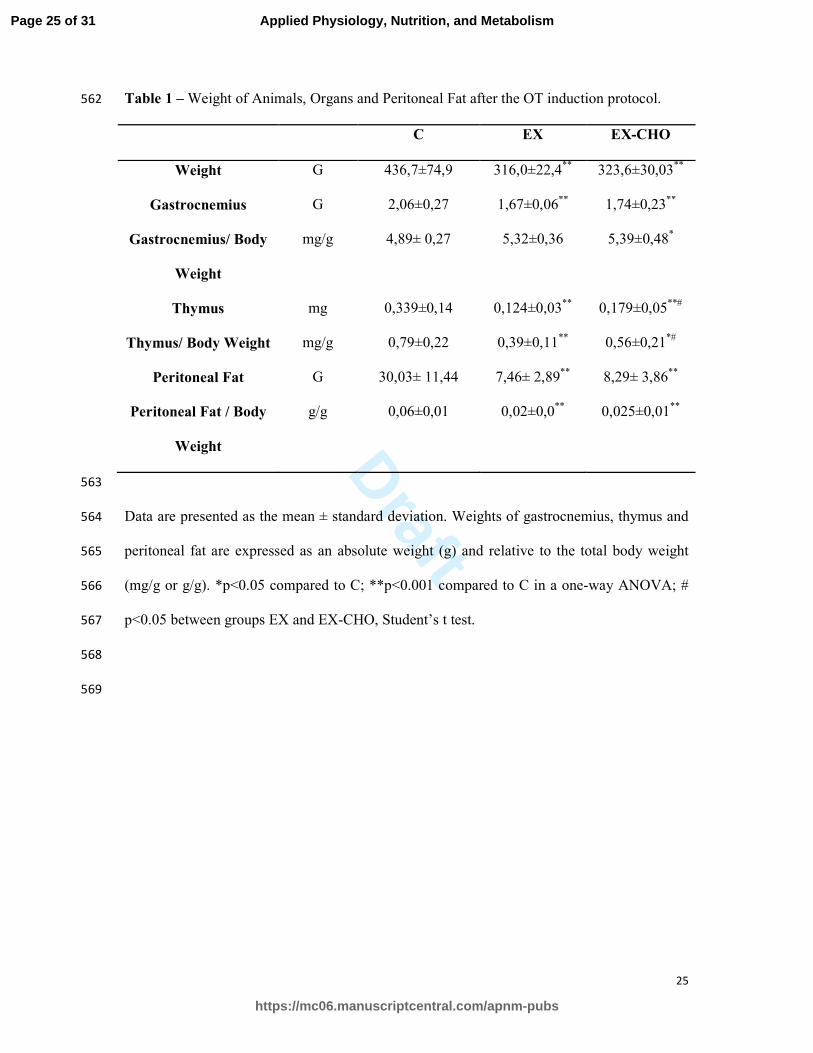
Mass of Animals, Organs and Peritoneal Fat: The rats in all three groups maintained a 234
similar body weight until the 8th
week (data not shown). Then, the animals that underwent the 235
overtraining protocol achieved a lower body weight compared to the C group (p<0.001). The 236
rats in the exercise groups also exhibited a lower amount of absolute peritoneal fat and 237
peritoneal fat corrected for body weight (p<0.001). There were no differences between the 238
EX and EX-CHO groups. (Table 1), although EX-CHO teham completed the protocol with 239
body weight 2% higher than EX group. 240
241
Insert Table 1 242
243
Page 10 of 31
https://mc06.manuscriptcentral.com/apnm-pubs
Applied Physiology, Nutrition, and Metabolism

Draft
11
Trained animals presented a reduction in gastrocnemius weight compared to the C 244
group (p<0,001) with no differences between groups (p>0,05). However, when the 245
gastrocnemius weight was corrected for body weight, an inverse behavior was observed so 246
that the weight of this muscle in the EX-CHO group was significantly higher than in the C 247
group (p <0.05). The normalized gastrocnemius muscle mass of the rats in the EX group was 248
not significantly different than that of the C group. 249
The animals in the three groups presented exactly the same thymus weight in the 8th 250
week. At the end of the experimental protocol, the trained animals presented a significantly 251
lower thymus weight in relation to the C group. When comparing only the trained animals, it 252
was noted that carbohydrate supplementation exerted a protection against the reduction of 253
thymus weight. Indeed, the animals in the EX-CHO group presented a significantly greater 254
thymus weight in relation to animals in the EX group. This same behavior was reproduced in 255
the analysis of thymus weight corrected for body weight. 256
257
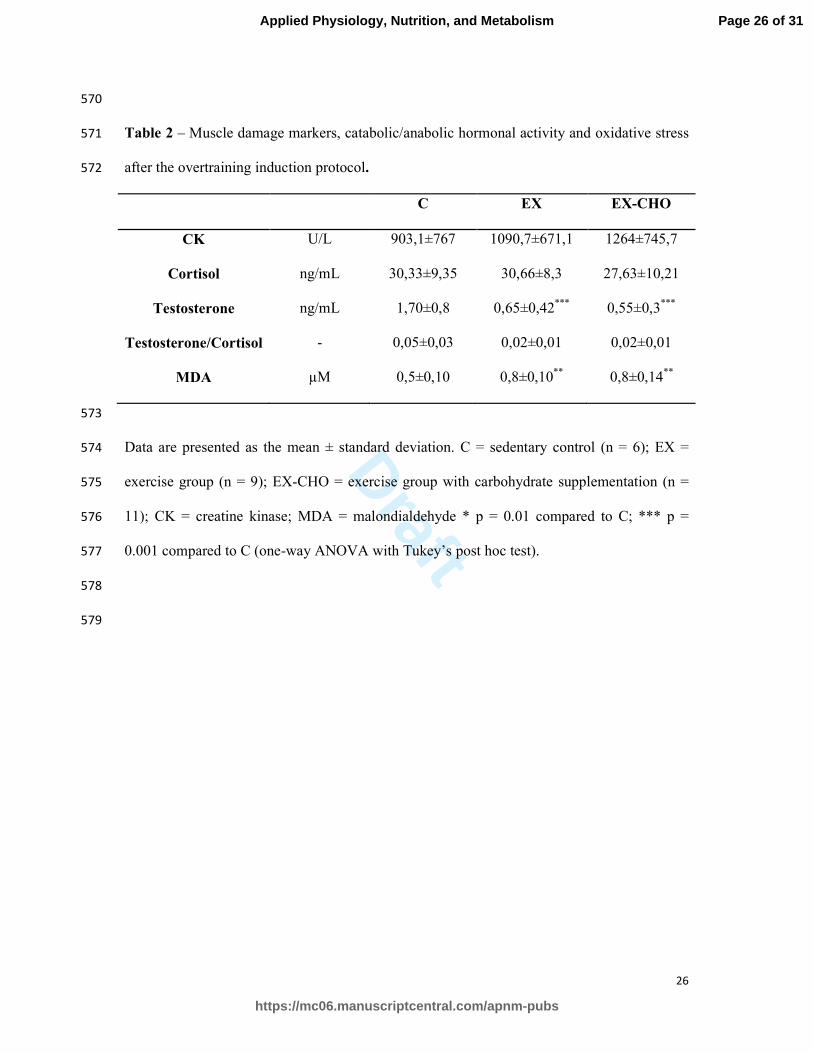
Biochemical analyses: Parameters related to hormones, muscle damage and oxidative stress 258
at the end of the experimental protocol are described in Table 2. Concentrations of creatine 259
kinase (CK) and cortisol levels were not statistically different between groups. However, EX-260
CHO group presented cortisol concentration 9,9% lower compared to EX. Meanwhile, the 261
groups that were exposed to training showed increased oxidative stress and reduced serum 262
testosterone concentrations compared to the C group. The carbohydrate supplementation 263
resulted in no difference in these variables, as the rats in the EX and EX-CHO groups 264
completed the experiment with similar results. 265
266
Insert Table 2 267
268
Page 11 of 31
https://mc06.manuscriptcentral.com/apnm-pubs
Applied Physiology, Nutrition, and Metabolism
Draft
12
Molecular Aspects: Analyses of the activities of muscle proteins related to glycogen 269
synthesis and protein synthesis are shown in Figure 4. Training led to an increase in GS3Kb 270
activity compared to the C group (p<0.01), but no differences were noted between the EX 271
and EX-CHO groups, although EX-CHO has finished protocol with values 8% lower than 272
EX. Similarly, PI3K was more active in the EX and EX-CHO groups (p<0.001) compared to 273
the C group. EX-CHO showed PI3k levels 18% greater than EX group but without statistical 274
difference noted between these two groups. Meanwhile, Akt-1 presented significantly higher 275
activity in the EX-CHO group compared to the C group (p <0.05); however, Akt-1 activity 276
was not greater in the EX group compared to the C group. Contrasting with these results, 277
mTOR activity showed no differences between groups. 278
279
280
Insert Figure 4 281
282
283
4 Discussion 284
285
The main finding of this study is that carbohydrate supplementation promoted a 286
discrete attenuation OT in rats by minimizing the deterioration in a physical performance test, 287
which is the main initicator of overtraining (Smith 2000). This phenomenon was 288
accompanied by an attenuation in the reduction of food consumption, thymus weight and loss 289
of gastrocnemius muscle mass which are also indicators of OT, in addition to increased 290
activity of Akt-1. However, the carbohydrates had no influence on several other markers of 291
OT: biochemical markers, hormone activity, oxidative stress, body composition and the 292
activity of other enzymes involved in protein synthesis (besides Akt-1). 293
Page 12 of 31
https://mc06.manuscriptcentral.com/apnm-pubs
Applied Physiology, Nutrition, and Metabolism

Draft
13
The exercise protocol used to induce OT was based on a previously validated protocol 294
for Wistar rats (Lira et al. 2010). The performance reduction in the performance test 295
confirmed OT occurrence, and this phenomenon was accompanied with deleterious 296
alterations in classical markers of overtraining: a reduction in food consumption, a reduction 297
in serum testosterone levels and an increase in MDA concentration (Meeusen et al. 2013). In 298
addition to the negative alterations in these markers, the present study also demonstrated 299
thymus atrophy, an indicator of compromised immune activity (Woods et al. 2003) and, in 300
particular, compromised immunity due to stress induced by physical exercise in rats (Sapin et 301
al. 2005; Rogero et al. 2005). 302
In addition to delaying fatigue by mechanisms involved in glucose metabolism 303
(Mitchell 2013; Coletta et al. 2013; Toone and Betts 2010) carbohydrates prevents exercise-304
induced immunosuppression (Walsh et al. 2011), reduces pro-oxidant activity (McAnulty et 305
al. 2007), provides a less catabolic hormonal profile during and after the workout (Gleeson 306
2006) and promotes a greater rate of glycogen resynthesis after training sessions (Alghannam 307
2011). Although these effects may directly contribute to prevention of OT, the studies that 308
presented these effects were acute in character, i.e., measurements occurred during a single 309
exercise session or in protocols with two daily exercise sessions. These data do not allow 310
extrapolation to a possible prevention OT over a season of several weeks or months of 311
training, as is the reality for athletes. These phenomena can only be demonstrated with a 312
chronic training and supplementation protocol. 313
Longer studies have been conducted (Halson et al. 2004; Achten et al. 2004). 314
However, data are insufficient to answer whether carbohydrate supplementation can prevent 315
or minimize OT either because the study was too short (less than 11 days) or because only 316
mood-related variables were evaluated, although an attenuation in the performance decrease 317
has been observed. 318
Page 13 of 31
https://mc06.manuscriptcentral.com/apnm-pubs
Applied Physiology, Nutrition, and Metabolism

Draft
14
Attenuation in the performance decrement as indicator of overtraining prevention 319
during performance test by carbohydrate supplementation in rats corroborates studies’ results 320
with humans (Halson et al. 2004; Achten et al. 2004). In these studies, runners and cyclists 321
who consumed supplemental carbohydrates experienced an attenuation in performance 322
decrease after a strenuous physical training period. However, the protocols lasted only eight 323
or eleven days. 324
Anorexia is consensually associated with OT. It is an indicator of hypothalamic 325
dysfunction induced by overproduction of cytokines, a phenomenon often observed in the 326
presence of overtraining (Smith 2004). We were not able to quantify the levels of any 327
cytokines, but the observation that supplementation induced a milder anorexic profile is of 328
practical importance, as it alleviates the complications associated with OT-induced anorexia. 329
Xiao et al. (2012) and Dong et al. (2011) observed inhibition of the growth of the 330
gastrocnemius muscle using the same protocol for OT induction as our study. Similarly, we 331
found that carbohydrate supplementation was able to mitigate this muscle’s loss of mass. This 332
protective function of carbohydrates can be attributed to increased glycogen storage due to 333
more food consumption in rats supplemented with carbohydrates. Indeed, muscle glycogen is 334
essential to prevent catabolism from hard physical training (Yan et al. 1992). However, GS 335
enzyme activity was not affected by carbohydrates, despite the observation by Morifuji et al. 336
(2011) who demonstrated that carbohydrate supplementation is associated with higher GS 337
activity and higher glycogen stores. On the other hand, the activity of Akt-1, one of the key 338
enzymes involved in muscle protein synthesis, was increased in supplemented animals, 339
indicating maintenance of anabolic and anti-catabolic activity. 340
It was expected that the increase in Akt-1 activity was accompanied with a 341
concomitant increase in mTOR enzyme activity, but this did not happen in animals treated 342
with carbohydrates. This result may be due to two reasons: 1) mTOR activation can occur 343
Page 14 of 31
https://mc06.manuscriptcentral.com/apnm-pubs
Applied Physiology, Nutrition, and Metabolism

Draft
15
through an independent pathway through Akt-1, due to the contractile stimulus of exercise 344
(Parkington et al. 2003) and 2) mTOR activation appears to be greater in fiber type IIa, 345
(Deldicque et al. 2005) while the gastrocnemius muscle presents a mixed composition (Song 346
et al. 1963). The activity of FOXO, the primary regulator of muscle catabolism, was not 347
assessed in this study but may lend more insight into the relationship between carbohydrate 348
supplementation and catabolic/anabolic pathways. 349
The weight of the lymphoid organs have been used as an indicator of the impact of 350
exercise on the immune system (Woods et al. 2003). Ideally, the lymphoid organs react 351
positively to an exercise stimulus, resulting in an improvement in the immune system (Terra 352
et al. 2012). However, in response to chronic and exhausting protocols, these positive effects 353
are minimized (Alghannam 2011). The hindered strengthening of the immune system was 354
confirmed in an experiment in which a 16-week training protocol resulted in thymic atrophy 355
(Woods et al. 2003), suggesting apoptosis from chronic stress. Our data from the two groups 356
of animals subjected to OT also show thymic atrophy. Fortunately, carbohydrate 357
supplementation was able to mitigate this deleterious effect, indicating an ergogenic action of 358
carbohydrates in attenuating the decrease in immunocompetence. The observation of this 359
interesting phenomenon guides prospects for future studies. For example, our data suggest a 360
hypothesis that immune mediators are preserved in response to carbohydrate supplementation 361
in the presence of chronic stress induced by intense and voluminous physical training. 362
Indeed, there is evidence that carbohydrate supplementation preserves immunocompetence in 363
response to single sessions of intense exercise (Gleeson 2006; McAnulty et al. 2007). 364
It is well established that increased oxidative stress, systemic inflammation and 365
cortisol production as well as reduced plasma concentrations of testosterone are found in the 366
OT state (Hohl et al. 2009; Meeusen et al. 2013). Our data regarding pro-oxidant activity of 367
malondialdehyde and testosterone confirm these previous findings. However, carbohydrate 368
Page 15 of 31
https://mc06.manuscriptcentral.com/apnm-pubs
Applied Physiology, Nutrition, and Metabolism
Draft
16
supplementation was not able to prevent these deleterious effects of OT. Antioxidant activity 369
has been reported for carbohydrates in some studies (Nieman at al. 2005; Scharhag et al. 370
2006). However, all these studies used acute strenuous exercise protocols. Thus, their results 371
can only be cautiously extrapolated to chronic situations. It seems that the large magnitude of 372
oxidative stress caused by strenuous consecutive training that leads to OT surpasses the 373
antioxidant capacity previously reported for post-workout carbohydrates. 374
Taken together, the data from this study demonstrated that carbohydrate 375
supplementation promotes a slight attenuation in the decrease of performance which is the 376
most direct indicate OT, a phenomenon that is accompanied by attenuation of some, but not 377
all others physiological indicators of OT. Although there were no statistical differences 378
found, the EX-CHO group completed the protocol with activity PI3k 18% higher than the EX 379
group as well as cortisol 9.9% lower, activity GS3 8% more body weight and 2% above the 380
EX group. Accordingly, these variables should not be discarded in future studies. Added to 381
the markers that statistically minimizing OT promoted by carbohydrate (lower decline in 382
physical performance, smaller reduction in food consumption, less loss of lower thymus 383
weight muscle loss), can express more evidently the protection of carbohydrates in 384
minimizing or preventing OT. These data encourage the implementation of studies with 385
athletes undergoing exhaustive training and competition sessions that characterize modern 386
sports competitions. 387
A limitation of the study is the fact that adopted training protocol was the only 388
validated to induce OT in rats. This protocol provides a training frequency that usually is not 389
seen in humans. However, to meet the objectives of the study, we would have to adopt a 390
protocol which will surely promote OT. Therefore, in this study it was found that if the 391
carbohydrates minimizes the OT, so that could not be observed if the carbohydrate prevents 392
the OT. 393
Page 16 of 31
https://mc06.manuscriptcentral.com/apnm-pubs
Applied Physiology, Nutrition, and Metabolism
Draft
17
Considering this study’s limitations, we recommend extensions of this study that 394
include measurement of the contents of muscle and liver glycogen, the activity of the muscle 395
catabolic enzyme FOXO, and immunological agents responsive to physical training in 396
animals and, when possible, humans. We also recommend that this study be replicated with 397
more similar training loads to athletes. These data will help elucidate how carbohydrates can 398
prevent or minimize the development of OT syndrome. 399
400
Acknowledgments: 401
Funding sources: National Research Council (CNPq), Federal Government, Brazil. 402
Conflict of Interest: none 403
404
Page 17 of 31
https://mc06.manuscriptcentral.com/apnm-pubs
Applied Physiology, Nutrition, and Metabolism
Draft
18
5 References 405
406
407
Achten, J., Halson, S.L., Moseley, L., Rayson, M.P., Casey, A., and Jeukendrup, A.E. 2004. 408
Higher dietary carbohydrate content during intensified running training results in better 409
maintenance of performance and mood state. J Appl Physiol. 96(4): 1331–40. doi: 410
10.1152/japplphysiol.00973.2003 411
412
Alghannam, A.F. 2011. Carbohydrate – protein ingestion improves subsequent running 413
capacity towards the end of a football-specific intermittent exercise. Appl Physiol Nutr 414
Metab. 757(36): 748–57. doi: 10.1139/h11-097 415
416
Armstrong, L., and VanHeest, J. 2002. The unknown mechanism of the overtraining 417
syndrome: clues from depression and psychoneuroimmunology. Sport Med. 32(3): 185–209. 418
doi: 10.2165/00007256-200232030-00003 419
420
Borges, G.F., Teixeira, A.M., and Ferreira, J.P. 2012. Meta-análise do efeito no sistema 421
imunitário da suplementação de hidratos de carbono no exercício físico Meta-analysis of the 422
effect on immune system of carbohydrate. Motricidade. 8(2): 83–97. doi: 423
10.6063/motricidade.8(2).717 424
425
Bradfort, M. 1976. A rapid and sensitive method for the quantitation of microgram quantities 426
of protein utilizing the principle of protein-dye binding. Anal Biochem. 72(1-2): 248–54. 427
doi:10.1016/0003-2697(76)90527-3 428
429
Page 18 of 31
https://mc06.manuscriptcentral.com/apnm-pubs
Applied Physiology, Nutrition, and Metabolism

Draft
19
Coletta, A., Thompson, D.L., and Raynor, H.A. 2013. The influence of commercially-430
available carbohydrate and carbohydrate-protein supplements on endurance running 431
performance in recreational athletes during a field trial. J Int Soc Sports Nutr. 10(17): 1-7. 432
doi: 10.1186/1550-2783-10-17 433
434
De Sousa, M.V., Madsen, K., Simões, H.G., Pereira, R.M.R., Negrão, C.E., Mendonça, R.Z., 435
et al. 2010. Effects of carbohydrate supplementation on competitive runners undergoing 436
overload training followed by a session of intermittent exercise. Eur J Appl Physiol. 109(3): 437
507–16. doi: 10.1007/s00421-010-1388-8 438
439
Deldicque, L., Theisen, D., and Francaux, M. 2005. Regulation of mTOR by amino acids and 440
resistance exercise in skeletal muscle. Eur J Appl Physiol. 94(1-2): 1–10. doi: 441
10.1007/s00421-004-1255-6 442
443
Dong, J., Chen, P., Wang, R., Yu, D., Zhang, Y., and Xiao, W. 2011. NADPH oxidase: a 444
target for the modulation of the excessive oxidase damage induced by overtraining in rat 445
neutrophils. Int J Biol Sci. 7(6): 881–91. doi: 10.7150/ijbs.7.881 446
447
Gleeson, M. 2006. Can Nutrition Limit Exercise Induced Immunodepression? Nutr Rev. 448
64(3): 119-131. doi: 10.1111/j.1753-4887.2006.tb00195.x 449
450
Halson, S.L., Lancaster, G.I., Achten, J., Gleeson, M., and Jeukendrup, A.E. 2004. Effects of 451
carbohydrate supplementation on performance and carbohydrate oxidation after intensified 452
cycling training. J Appl Physiol. 97(4): 1245–53. doi: 10.1152/japplphysiol.01368.2003 453
454
Page 19 of 31
https://mc06.manuscriptcentral.com/apnm-pubs
Applied Physiology, Nutrition, and Metabolism
Draft
20
Hohl, R., Ferraresso, R.L.P., De Oliveira, R.B., Lucco, R., Brenzikofer, R., Macedo, D.V. 455
Development and characterization of an overtraining animal model. Med Sci Sports Exerc. 456
2009;41(5):1155–63. doi: 0195-9131/09/4105-1155/0 457
458
Karelis, A.D., Smith, J.W., Passe, D.H., and Péronnet, F. 2010. Carbohydrate Administration 459
and Exercise Performance: what are the potential mechanisms involved? Sport Med. 40(9): 460
747–63. doi: 10.2165/11533080-000000000-00000 461
462
Kenttä, G., Hassmén, P., and Raglin, J.S. 2001. Training practices and overtraining syndrome 463
in Swedish age-group athletes. Int J Sports Med. 22(6): 460–5. doi: 10.1055/s-2001-16250 464
465
Kreider, R.B., Wilborn, C.D., Taylor, L., Campbell, B., Almada, A.L., Collins, R., et al. 466
2010. ISSN exercise & sport nutrition review: research & recommendations. J Int Soc Sports 467
Nutr. 7(7): 1-43. doi: 10.1186/1550-2783-7-7 468
469
Lira, F.S., Rosa, J.C., Pimentel, G.D., Tarini, V.A.F., Arida, R.M., Faloppa, F., et al. 2010. 470
Inflammation and adipose tissue: effects of progressive load training in rats. Lipids Health 471
Dis. 9:109. doi: 10.1186/1476-511X-9-109 472
473
McAnulty, S.R., McAnulty, L.S., Morrow, J.D., Nieman, D.C., Owens, J.T., and Carper, 474
C.M. 2007. Influence of carbohydrate, intense exercise, and rest intervals on hormonal and 475
oxidative changes. Int J Sport Nutr Exerc Metab. 17(5): 478–90. 476
477
Meeusen, R., Duclos, M., Foster, C., Fry, A., Gleeson, M., Nieman, D., et al. 2013. 478
Prevention, diagnosis, and treatment of the overtraining syndrome: joint consensus statement 479
Page 20 of 31
https://mc06.manuscriptcentral.com/apnm-pubs
Applied Physiology, Nutrition, and Metabolism
Draft
21
of the European College of Sport Science and the American College of Sports Medicine. Med 480
Sci Sports Exerc. 45(1): 186–205. doi: 0195-9131/13/4501-0186/0 481
482
Mitchell, J.B. 2013. Ingestion of carbohydrate during recovery in exercising people. Curr 483
Opin Clin Nutr Metab Care. 16(4): 461-5. doi: 10.1097/MCO.0b013e328361c526. 484
485
Morgan, W.P., O’Connor, P.J., Sparling, P.B., Pate, R.R., et al. 1987. Psychological 486
characterization of the elite female distance runner. Int J Sport Med. 8(2): 124–31. doi: 487
10.1055/s-2008-1025717 488
489
Morifuji, M., Kanda, A., Koga, J., Kawanaka, K., and Higuchi, M. 2010. Post-exercise 490
carbohydrate plus whey protein hydrolysates supplementation increases skeletal muscle 491
glycogen level in rats. Amino Acids. 38(4): 1109–15. doi: 10.1007/s00726-009-0321-0 492
493
Morifuji, M., Kanda, A., Koga, J., Kawanaka, K., and Higuchi, M. 2011. Preexercise 494
ingestion of carbohydrate plus whey protein hydrolysates attenuates skeletal muscle glycogen 495
depletion during exercise in rats. Nutrition. 27(7-8): 833–7. doi: 496
http://dx.doi.org/10.1016/j.nut.2010.08.021 497
498
Nieman, D.C., Davis, J.M., Henson, D.A., Gross, S.J., Dumke, C.L., Utter, A.C., et al. 2005. 499
Muscle Cytokine mRNA Changes after 2.5 h of Cycling: Influence of Carbohydrate. Med Sci 500
Sport Exerc. 37(8): 1283–90. doi: 0195-9131/05/3708-1283/0 501
502
Parkington, J.D., Siebert, A.P., LeBrasseur, N.K., and Fielding, R.A. 2003. Differential 503
activation of mTOR signaling by contractile activity in skeletal muscle. Am J Physiol Regul 504
Page 21 of 31
https://mc06.manuscriptcentral.com/apnm-pubs
Applied Physiology, Nutrition, and Metabolism
Draft
22
Integr Comp Physiol. 285(5): 1086–90. doi: 10.1152/ajpregu.00324.2003 505
506
Rogero, M.M., Mendes, R.R., and Tirapegui, J. 2005. Aspectos Neuroendócrinos e 507
Nutricionais em Atletas Com Overtraining. Arq Bras Endocrinol Metabol. 49(3): 359-368. 508
doi: http://dx.doi.org/10.1590/S0004-27302005000300006 509
510
Sapin, M.R., and Tkachuk, M.G. 2005. Thymus recovery after intensive physical exercise 511
under conditions of immunocorrection and without it. Bull Exp Biol Med. 140(5): 568–70. 512
doi: 10.1007/s10517-006-0026-2 513
514
Scharhag, J.Z.R.G.E.N., Meyer, T., Auracher, M., Gabriel, H.H., and Kindermann, W. 2006. 515
Effects of graded carbohydrate supplementation on the immune response in cycling. Med Sci 516
Sports Exerc. 38(2): 286–92. doi: 10.1249/01.mss.0000191437.69493.d4 517
518
Smith, L. 2000. Cytokine hypothesis of overtraining: a physiological adaptation to excessive 519
stress. Med Sci Sports Exerc. 32(2): 317-331. doi: 0195-9131/00/3202-0317/0 520
521
Smith, L.L. 2004. Tissue trauma: the underlying cause of overtraining syndrome? J strenght 522
Cond Res. 18(1): 185–93. doi: http://dx.doi.org/10.1519/00124278-200402000-00028 523
524
Song, S., Shimada, N., and Anderson, P. 1963. Ortogonal diameters in the analysis of muscle 525
fiber size and form. Nature. 200: 1220–1. doi:10.1038/2001220a0 526
527
Page 22 of 31
https://mc06.manuscriptcentral.com/apnm-pubs
Applied Physiology, Nutrition, and Metabolism
Draft
23
Terra, R., Silva, S.A.G., Pinto, V.S., and Dutra, P.M.L. 2012. Effect of exercise on the 528
immune system: response, adaptation and cell signaling. Rev Bras Med do Esp. 18(3): 208–529
214. doi: http://dx.doi.org/10.1590/S1517-86922012000300015 530
531
Toone, R.J., Betts, J.A. 2010. Isocaloric carbohydrate versus carbohydrate-protein ingestion 532
and cycling time-trial performance. Int J Sport Nutr Exerc Metab. 20(1): 34–43. 533
534
Towbin, H., Staehelin, T., Gordon, J. 1979. Electrophoretic transfer of proteins from 535
polyacrylamide gels to nitrocellulose sheets: procedure and some applications. 536
Biotechnology. 24(9): 145–9. doi: 10.1073/pnas.76.9.4350 537
538
Van Loon, L.J., Saris, W.H., Kruijshoop, M., and Wagenmakers, A.J. 2000. Maximizing 539
postexercise muscle glycogen synthesis: carbohydrate supplementation and the application of 540
amino acid or protein hydrolysate mixtures. Am J Clin Nutr. 72(1): 106–11. 541
542
Walsh, M., Cartwright, L., Corish, C., et al. 2011. The body composition, nutritional 543
knowledge, attitudes, behaviors, and future education needs of senior schoolboy rugby 544
players in Ireland. Int J Sport Nutr Exerc Metab. 21(5): 365–76. 545
546
Woods, J.A., Ceddia, M.A., Zack, M.D., Lowder, T.W., and Lu, Q. 2003. Exercise training 547
increases the näive to memory T cell ratio in old mice. Brain Behav Immun. 17(5): 384–92. 548
doi: 10.1016/S0889-1591(03)00030-8 549
550
Xiao, W., Chen, P., and Dong, J. 2012. Effects of Overtraining on Skeletal Muscle Growth 551
and Gene Expression. Int J Sport Med. 33(10): 846–53. doi: 10.1055/s-0032-1311585 552
Page 23 of 31
https://mc06.manuscriptcentral.com/apnm-pubs
Applied Physiology, Nutrition, and Metabolism
Draft
24
553
Yan, Z., Spencer, M., and Katz, A. 1992. Effect of low glycogen on glycogen synthase in 554
human muscle during and after exercise. Acta Physiol Scand. 145: 345–52. doi: 555
10.1111/j.1748-1716.1992.tb09374.x 556
557
Zivković, I.P., Rakin, A.K., Petrović-Djergović, D.M., Kosec, D.J., and Mićić, M.V. 2005. 558
Exposure to forced swim stress alters morphofunctional characteristics of the rat thymus. J 559
Neuroimmunol. 160(1-2): 77–86. doi: http://dx.doi.org/10.1016/j.jneuroim.2004.11.002 560
561
Page 24 of 31
https://mc06.manuscriptcentral.com/apnm-pubs
Applied Physiology, Nutrition, and Metabolism
Draft
25
Table 1 – Weight of Animals, Organs and Peritoneal Fat after the OT induction protocol. 562
C EX EX-CHO
Weight G 436,7±74,9 316,0±22,4** 323,6±30,03**
Gastrocnemius G 2,06±0,27 1,67±0,06** 1,74±0,23**
Gastrocnemius/ Body
Weight
mg/g 4,89± 0,27 5,32±0,36 5,39±0,48*
Thymus mg 0,339±0,14 0,124±0,03** 0,179±0,05**#
Thymus/ Body Weight mg/g 0,79±0,22 0,39±0,11** 0,56±0,21*#
Peritoneal Fat G 30,03± 11,44 7,46± 2,89** 8,29± 3,86**
Peritoneal Fat / Body
Weight
g/g 0,06±0,01 0,02±0,0**
0,025±0,01**
563
Data are presented as the mean ± standard deviation. Weights of gastrocnemius, thymus and 564
peritoneal fat are expressed as an absolute weight (g) and relative to the total body weight 565
(mg/g or g/g). *p<0.05 compared to C; **p<0.001 compared to C in a one-way ANOVA; # 566
p<0.05 between groups EX and EX-CHO, Student’s t test. 567
568
569
Page 25 of 31
https://mc06.manuscriptcentral.com/apnm-pubs
Applied Physiology, Nutrition, and Metabolism
Draft
26
570
Table 2 – Muscle damage markers, catabolic/anabolic hormonal activity and oxidative stress 571
after the overtraining induction protocol. 572
C EX EX-CHO
CK U/L 903,1±767 1090,7±671,1 1264±745,7
Cortisol ng/mL 30,33±9,35 30,66±8,3 27,63±10,21
Testosterone ng/mL 1,70±0,8 0,65±0,42*** 0,55±0,3***
Testosterone/Cortisol - 0,05±0,03 0,02±0,01 0,02±0,01
MDA µM 0,5±0,10 0,8±0,10** 0,8±0,14**
573
Data are presented as the mean ± standard deviation. C = sedentary control (n = 6); EX = 574
exercise group (n = 9); EX-CHO = exercise group with carbohydrate supplementation (n = 575
11); CK = creatine kinase; MDA = malondialdehyde * p = 0.01 compared to C; *** p = 576
0.001 compared to C (one-way ANOVA with Tukey’s post hoc test). 577
578
579
Page 26 of 31
https://mc06.manuscriptcentral.com/apnm-pubs
Applied Physiology, Nutrition, and Metabolism

Draft
27
Figure 1 – Procedure for the experimental protocol for overtraining. 580
581
Figure 2 – Results of performance tests conducted along the overtraining induction protocol. 582
583
Pr1, Pr2 and Pr3 = Performance of animals before experimental protocol, at the 9th week and 584
at the 11th
week, respectively. C = control group (n = 9); EX = exercise group (n = 10); EX-585
CHO = exercise group with carbohydrate supplementation (n = 13). Data are mean and 586
standard deviation. * = p<0.05 compared to C in the same Pr; $ = p<0.05 compared to EX in 587
Pr2. Two-way ANOVA with Tukey’s post hoc analysis. 588
589
Figure 3 – Food consumption during the overtraining induction protocol. 590
591
C = control group (n = 9); EX = exercise group (n = 10); EX-CHO = exercise group with 592
carbohydrate supplementation (n = 13). Data are mean and standard deviation. * = p< 0.01 593
compared to C in the 8th week; ** = p< 0.001 compared to C in the 8th week. Friedman test 594
with Dunn’s post hoc analysis. 595
596
Figure 4 – Activity of enzymes associated with glycogen synthesis (GS3Kb, panel A) and 597
protein synthesis in the gastrocnemius muscle (PI3K, mTOR, and Akt 1; panels B, C and D, 598
respectively) after the overtraining induction protocol. 599
600
C = control group (n = 7); EX= exercise group (n = 7); EX-CHO= exercise group with 601
carbohydrate supplementation (n=7). Data are shown as the mean ± standard deviation. 602
*p=0.01 compared to C; **p=0.0001 compared to C, *** p<0.0001 compared to C. One-way 603
ANOVA with Tukey’s post hoc test. 604
Page 27 of 31
https://mc06.manuscriptcentral.com/apnm-pubs
Applied Physiology, Nutrition, and Metabolism
Draft
Figure 1 – Procedure for the experimental protocol for overtraining. 95x54mm (300 x 300 DPI)
Page 28 of 31
https://mc06.manuscriptcentral.com/apnm-pubs
Applied Physiology, Nutrition, and Metabolism

Draft
Figure 2 – Results of performance tests conducted along the overtraining induction protocol.
Pr1, Pr2 and Pr3 = Performance of animals before experimental protocol, at the 9th week and at the 11th week, respectively. C = control group (n = 9); EX = exercise group (n = 10); EX-CHO = exercise group with carbohydrate supplementation (n = 13). Data are mean and standard deviation. * = p<0.05 compared to C
in the same Pr; $ = p<0.05 compared to EX in Pr2. Two-way ANOVA with Tukey’s post hoc analysis. 100x55mm (300 x 300 DPI)
Page 29 of 31
https://mc06.manuscriptcentral.com/apnm-pubs
Applied Physiology, Nutrition, and Metabolism
Draft
Figure 3 – Food consumption during the overtraining induction protocol.
C = control group (n = 9); EX = exercise group (n = 10); EX-CHO = exercise group with carbohydrate
supplementation (n = 13). Data are mean and standard deviation. * = p< 0.01 compared to C in the 8th
week; ** = p< 0.001 compared to C in the 8th week. Friedman test with Dunn’s post hoc analysis.
101x55mm (300 x 300 DPI)
Page 30 of 31
https://mc06.manuscriptcentral.com/apnm-pubs
Applied Physiology, Nutrition, and Metabolism

Draft
Figure 4 – Activity of enzymes associated with glycogen synthesis (GS3Kb, panel A) and protein synthesis in the gastrocnemius muscle (PI3K, mTOR, and Akt 1; panels B, C and D, respectively) after the overtraining
induction protocol.
C = control group (n = 7); EX= exercise group (n = 7); EX-CHO= exercise group with carbohydrate supplementation (n=7). Data are shown as the mean ± standard deviation. *p=0.01 compared to C;
**p=0.0001 compared to C, *** p<0.0001 compared to C. One-way ANOVA with Tukey’s post hoc test.
94x56mm (300 x 300 DPI)
Page 31 of 31
https://mc06.manuscriptcentral.com/apnm-pubs
Applied Physiology, Nutrition, and Metabolism