Embed Size (px)
Citation preview
1
Copyright © 2008 Thomson Delmar Learning
CHAPTER 7
Carbon Dioxide Transport
and Acid-Base Balance
Copyright © 2008
Thomson Delmar Learning
Carbon Dioxide TransportCarbon Dioxide Transport
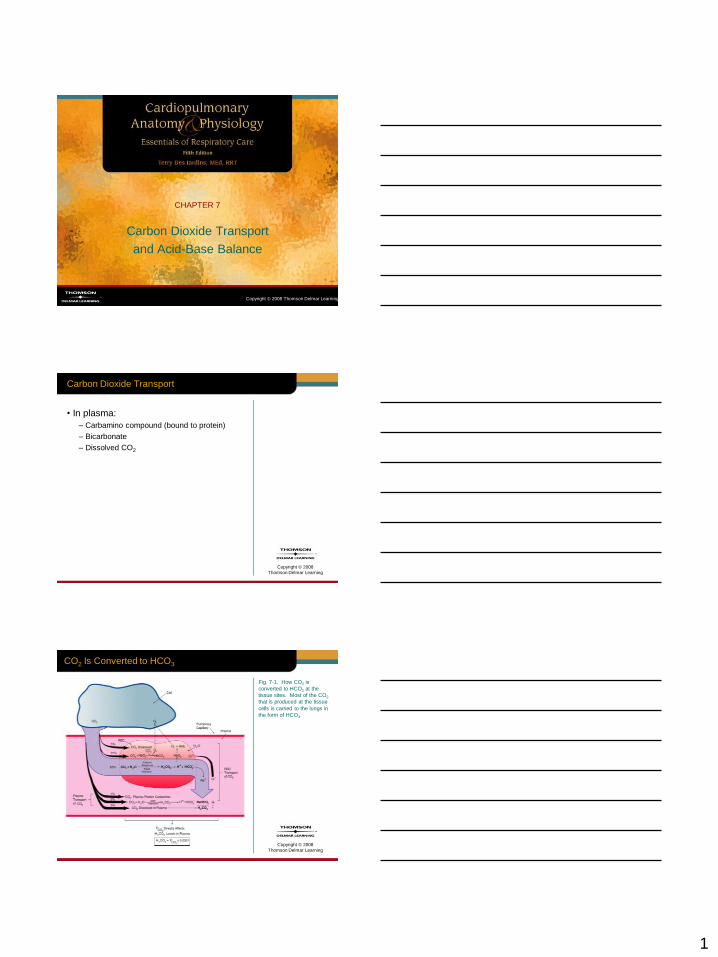
• In plasma:
– Carbamino compound (bound to protein)
– Bicarbonate
– Dissolved CO2
Copyright © 2008
Thomson Delmar Learning
CO2 Is Converted to HCO3
Fig. 7-1. How CO2 is
converted to HCO2 at the
tissue sites. Most of the CO2
that is produced at the tissue
cells is carried to the lungs in
the form of HCO3.

2
Copyright © 2008
Thomson Delmar Learning
Carbon Dioxide Transport
• In red blood cells:
– Dissolved CO2
– Carbamino-Hb
– Bicarbonate
Copyright © 2008
Thomson Delmar Learning
CARBON DIOXIDE
ELIMINATION
AT THE LUNGS
Copyright © 2008
Thomson Delmar Learning
How HCO3 Is Transformed into CO2
Fig. 7-2. How HCO3 is
transformed back into CO2
and eliminated in the alveoli.
3
Copyright © 2008
Thomson Delmar Learning
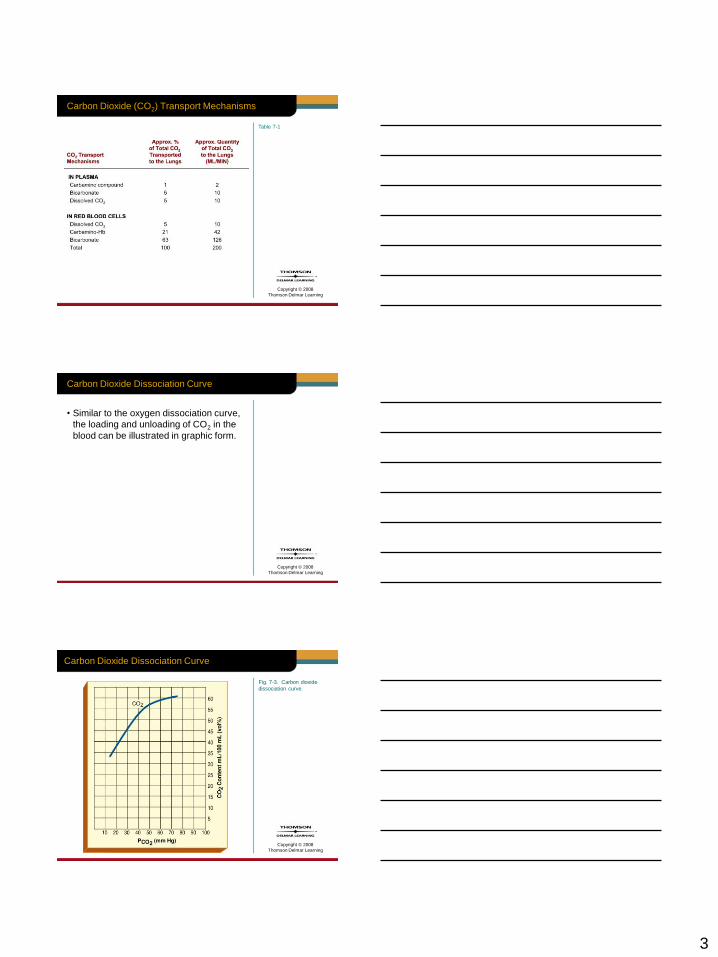
Table 7-1
Carbon Dioxide (CO2) Transport Mechanisms
Copyright © 2008
Thomson Delmar Learning
Carbon Dioxide Dissociation Curve
• Similar to the oxygen dissociation curve,
the loading and unloading of CO2 in the
blood can be illustrated in graphic form.
Copyright © 2008
Thomson Delmar Learning
Carbon Dioxide Dissociation Curve
Fig. 7-3. Carbon dioxide
dissociation curve.
4
Copyright © 2008
Thomson Delmar Learning
Carbon Dioxide Dissociation Curve
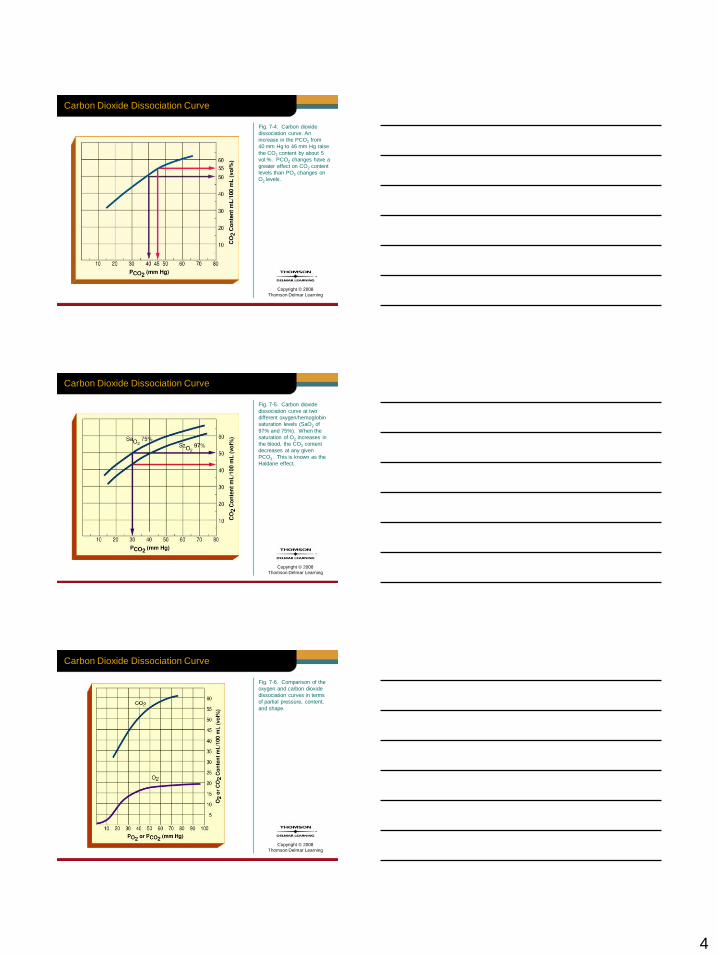
Fig. 7-4. Carbon dioxide
dissociation curve. An
increase in the PCO2 from
40 mm Hg to 46 mm Hg raise
the CO2 content by about 5
vol.%. PCO2 changes have a
greater effect on CO2 content
levels than PO2 changes on
O2 levels.
Copyright © 2008
Thomson Delmar Learning
Carbon Dioxide Dissociation Curve
Fig. 7-5. Carbon dioxide
dissociation curve at two
different oxygen/hemoglobin
saturation levels (SaO2 of
97% and 75%). When the
saturation of O2 increases in
the blood, the CO2 content
decreases at any given
PCO2. This is known as the
Haldane effect.
Copyright © 2008
Thomson Delmar Learning
Carbon Dioxide Dissociation Curve
Fig. 7-6. Comparison of the
oxygen and carbon dioxide
dissociation curves in terms
of partial pressure, content,
and shape.
5
Copyright © 2008
Thomson Delmar Learning
ACID-BASE BALANCE
AND REGULATION
Copyright © 2008
Thomson Delmar Learning
Acid-Base Balance and Regulation
• Nearly all biochemical reactions in the
body are influenced by the acid-base
balance of their fluid environment
• Normal arterial pH range is 7.34 to 7.45
Copyright © 2008
Thomson Delmar Learning
Acid-Base Balance and Regulation
• pH > 7.45 = alkalosis
• pH < 7.35 = acidosis
6
Copyright © 2008
Thomson Delmar Learning
Acid-Base Balance and Regulation
• Most H+ ions in the body originate from:
1. Breakdown of phosphorous-containing
proteins (phosphoric acid)
2. Anaerobic metabolism of glucose (lactic
acid)
3. Metabolism of body fats (fatty and ketone
acids)
4. Transport of CO2 in the blood as HCO3–
liberates H+ ions
Copyright © 2008
Thomson Delmar Learning
H+ and HCO3
• Under normal conditions, both the H+ and
HCO3– ion concentrations in the blood
are regulated by the following three major
systems:
– Chemical buffer system
– Respiratory system
– Renal system
Copyright © 2008
Thomson Delmar Learning
The Chemical Buffer System
• Responds within a fraction of a second
to resist pH changes
– Called the first line of defense
7
Copyright © 2008
Thomson Delmar Learning
The Chemical Buffer System
• System is composed of:
1. Carbonic acid-bicarbonate buffer system
2. Phosphate buffer system
3. Protein buffer system
Copyright © 2008
Thomson Delmar Learning
The Respiratory System
• Acts within one to three minutes by
increasing or decreasing the breathing
depth and rate to offset acidosis or
alkalosis, respectively.
Copyright © 2008
Thomson Delmar Learning
The Renal System
• Body’s most effective acid-base balance
monitor and regulator
• Renal system requires a day or more to
correct abnormal pH concentrations

8
Copyright © 2008
Thomson Delmar Learning
Acid-Base Balance
• Note:
– To fully appreciate acid-base balance, and
how it is normally regulated, a fundamental
understanding of acids and bases, and their
influences on pH, is essential.
Copyright © 2008
Thomson Delmar Learning
THE BASIC PRINCIPLES
OF ACID-BASE
REACTIONS AND pH
Copyright © 2008
Thomson Delmar Learning
Acids and Bases
• Similar to salts, acids and bases are
electrolytes
• Thus, both acids and bases can:
– Ionize and dissociate in water
– Conduct an electrical current

9
Copyright © 2008
Thomson Delmar Learning
Acids
• Acids are sour tasting, can react
(dissolve) with many metals, and can
―burn‖ a hole through clothing
• An acid is a substance that releases
hydrogen ions [H+] in measurable
amounts
Copyright © 2008
Thomson Delmar Learning
Acids
• Because a hydrogen ion is only a
hydrogen nucleus proton, acids are
defined as proton donors.
• Thus, when acids dissolve in a water
solution, they release hydrogen ions
(protons) and anions.
Copyright © 2008
Thomson Delmar Learning
Acids
• Acidity of a solution is directly related
to the concentration of protons.
• Anions have little or no effect on the
acidity.
• Thus, the acidity of a solution reflects
only the free hydrogen ions, not those
bound to anions.
10
Copyright © 2008
Thomson Delmar Learning
Acids
• For example, hydrochloric acid (HCl), the
acid found in the stomach and works to
aid digestion, dissociates into a proton
and a chloride ion:
Copyright © 2008
Thomson Delmar Learning
Acids
• Other acids in the body include acetic
acid (HC2H3O2), often abbreviated as
[HAc], and carbonic acid (H2CO3)
• Molecular formula for common acids
is easy to identify because it begins
with the hydrogen ion
Copyright © 2008
Thomson Delmar Learning
Strong Acids
• Acidity of a solution reflects only the free
hydrogen ions
– Not the hydrogen ions still combined
with anions.
• Thus, strong acids, which dissociate
completely (i.e., they liberate all the H+)
and irreversibly in water, dramatically
change the pH of the solution.

11
Copyright © 2008
Thomson Delmar Learning
Strong Acids
• For example, if 100 hydrochloric (HCl)
acid molecules were placed in 1 mL of
water, the hydrochloric acid would
dissociate into 100 H+ and 100 Cl– ions.
• There would be no undissociated
hydrochloric acid molecules in the
solution.
Copyright © 2008
Thomson Delmar Learning
Weak Acids
• Do not dissociate completely in a solution
and have a much smaller effect on pH
• Although weak acids have a relatively
small effect on changing pH levels, they
have a very important role in resisting
sudden pH changes.
Copyright © 2008
Thomson Delmar Learning
Weak Acids
• Examples of weak acids are carbonic
acid (H2CO3) and acetic acid (HC2H3O2)
• If 100 acetic acid molecules were placed
in 1 mL of water, the following reaction
would occur:
12
Copyright © 2008
Thomson Delmar Learning
• Because undissociated acids do not alter
the pH, the acidic solution will not be as
acidic as the HCl solution discussed
above
• The dissociation of acetic acid can be
written as follows:
Weak Acids
Copyright © 2008
Thomson Delmar Learning
Weak Acids
• Using this equation, it can be seen that:
– When H+ (released by a strong acid) is added
to the acetic acid solution
– Equilibrium moves to the left as some of the
additional H+ bonds with C2H3O2– to form
HC2H3O2
Copyright © 2008
Thomson Delmar Learning
Weak Acids
• On the other hand, when a strong base is
added to the solution (adding additional
OH– and causing the pH to increase), the
equilibrium shifts to the right
• This occurs because the additional OH–
consumes the H+
13
Copyright © 2008
Thomson Delmar Learning
Weak Acids
• Cause more HC2H3O2 molecules to
dissociate and replenish the H+
• Weak acids play a very important role in
the chemical buffer systems of the
human body
Copyright © 2008
Thomson Delmar Learning
Bases
• Bases are proton acceptors
• Bases taste bitter and feel slippery
• A base is a substance that takes up
hydrogen ions [H+] in measurable
amounts
Copyright © 2008
Thomson Delmar Learning
Bases
• Common inorganic bases include the
hydroxides
– Magnesium hydroxide (milk or magnesia) and
sodium hydroxide (lye)
• Similar to acids, when dissolved in water,
hydroxides dissociate into hydroxide ions
(OH–) and cations
14
Copyright © 2008
Thomson Delmar Learning
Bases
• For example, ionization of sodium
hydroxide (NaOH) results in a hydroxide
ion and a sodium ion
• Liberated hydroxide ion then bonds, or
accepts, a proton present in the solution
• Reaction produces water and, at the
same time, decreases the acidity
[H+ concentration] of the solution
Copyright © 2008
Thomson Delmar Learning
Bases
Copyright © 2008
Thomson Delmar Learning
Bases
• Bicarbonate ion (HCO3–) is an important
base in the body and is especially
abundant in the blood

15
Copyright © 2008
Thomson Delmar Learning
Bases
• Ammonia (NH3), a natural waste product
of protein breakdown, is also a base
• Ammonia has a pair of unshared
electrons that strongly attract protons
• When accepting a proton, ammonia
becomes an ammonium ion:
Copyright © 2008
Thomson Delmar Learning
STRONG AND
WEAK BASES
Copyright © 2008
Thomson Delmar Learning
Strong Bases
• Remember, bases are proton acceptors
• Strong bases dissociate easily in water
and quickly tie up H+
– Hydroxides

16
Copyright © 2008
Thomson Delmar Learning
Weak Bases
• In contrast, weak bases:
– Sodium bicarbonate or baking soda
– Dissociate incompletely and reversibly and
are slower to accept protons
• Because sodium bicarbonate accepts a
relatively small amount of protons
– Its released bicarbonate ion is described as
a weak base
Copyright © 2008
Thomson Delmar Learning
pH: Acid-Base Concentration
• As the concentration of hydrogen ions in
a solution increase:
– The more acidic the solution becomes
• As the level of hydroxide ions increases:
– The more basic, or alkaline, the solution
becomes
Copyright © 2008
Thomson Delmar Learning
pH: Acid-Base Concentration
• Clinically, the concentration of hydrogen
ions in the body is measured in units
called pH units
• pH scale runs from 0 to 14 and is
logarithmic
17
Copyright © 2008
Thomson Delmar Learning
pH: Acid-Base Concentration
• Each successive unit change in pH
represents a tenfold change in hydrogen
ion concentration
Copyright © 2008
Thomson Delmar Learning
pH: Acid-Base Concentration
• pH of a solution, therefore, is defined as
the negative logarithm, to the base 10, of
the hydrogen ion concentration [H+] in
moles per liter, or –log H+:
Copyright © 2008
Thomson Delmar Learning
pH: Acid-Base Concentration
• When the pH is 7 (H+ = 10-7 mol/liter)
– Number of hydrogen ions precisely equals
the number of hydroxide ions (OH–)
• And the solution is neutral
– Neither acidic or basic

18
Copyright © 2008
Thomson Delmar Learning
pH: Acid-Base Concentration
• Pure water has a neutral pH of 7, or
10-7 mol/liter (0.0000001 mol/liter) of
hydrogen ions.
• A solution with a pH below 7, is acidic
– There are more hydrogen ions than
hydroxide ions
Copyright © 2008
Thomson Delmar Learning
pH: Acid-Base Concentration
• For example, a solution with a pH of 6
has 10 times more hydrogen ions than a
solution with a pH of 7
Copyright © 2008
Thomson Delmar Learning
pH: Acid-Base Concentration
• A solution with a pH greater than 7, is
alkaline
– Hydroxide ions outnumber the hydrogen ions
• For example, a solution with a pH of 8
has 10 times more hydroxide ions than a
solution with a pH of 7
19
Copyright © 2008
Thomson Delmar Learning
pH: Acid-Base Concentration
• Thus, as the hydrogen ion concentration
increases
– Hydroxide ion concentration falls, and
vice versa.
Copyright © 2008
Thomson Delmar Learning
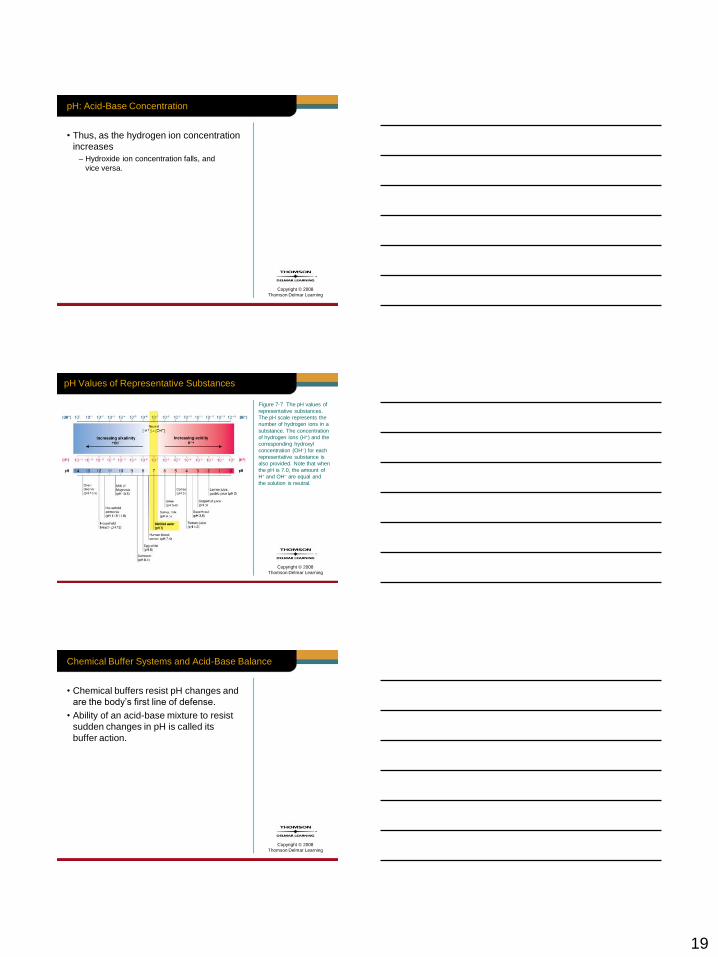
pH Values of Representative Substances
Figure 7-7 The pH values of
representative substances.
The pH scale represents the
number of hydrogen ions in a
substance. The concentration
of hydrogen ions (H+) and the
corresponding hydroxyl
concentration (OH–) for each
representative substance is
also provided. Note that when
the pH is 7.0, the amount of
H+ and OH– are equal and
the solution is neutral.
Copyright © 2008
Thomson Delmar Learning
Chemical Buffer Systems and Acid-Base Balance
• Chemical buffers resist pH changes and
are the body’s first line of defense.
• Ability of an acid-base mixture to resist
sudden changes in pH is called its
buffer action.

20
Copyright © 2008
Thomson Delmar Learning
Chemical Buffer Systems and Acid-Base Balance
• Tissue cells and vital organs of the body
are extremely sensitive to even the
slightest change in the pH environment
Copyright © 2008
Thomson Delmar Learning
Chemical Buffer Systems and Acid-Base Balance
• In high concentrations, both acids and
bases can be extremely damaging to
living cells
– Essentially every biological process within
the body is disrupted
Copyright © 2008
Thomson Delmar Learning
Chemical Buffer Systems and Acid-Base Balance
• Buffers work against sudden and large
changes in the pH of body fluids by
1. Releasing hydrogen ions (acting as acids)
when the pH increases, and
2. Binding hydrogen ions (acting as bases)
when the pH decreases.

21
Copyright © 2008
Thomson Delmar Learning
Chemical Buffer Systems and Acid-Base Balance
• Three major chemical buffer systems in
the body are the:
– Carbonic acid-bicarbonate buffer system
– Phosphate buffer system
– Protein buffer system
Copyright © 2008
Thomson Delmar Learning
Carbonic Acid-Bicarbonate Buffer System and
Acid-Base Balance
• The carbonic acid-bicarbonate buffer
system
– Plays an extremely important role in
maintaining pH homeostasis of the blood.
Copyright © 2008
Thomson Delmar Learning
Carbonic Acid-Bicarbonate Buffer System and
Acid-Base Balance
• Carbonic acid (H2CO3) dissociates
reversibly and releases bicarbonate ions
(HCO3–) and protons (H+) as follows:
Response to an increase in pH
H2CO3 HCO3– + H+
H+ donor Response to a decrease in pH H+ acceptor proton
(weak acid) (weak proton)

22
Copyright © 2008
Thomson Delmar Learning
Carbonic Acid-Bicarbonate Buffer System and
Acid-Base Balance
• Under normal conditions, the ratio
between the HCO3– and H2CO3 in the
blood is 20:1
– See Figure 7-1
Copyright © 2008
Thomson Delmar Learning
Carbonic Acid-Bicarbonate Buffer System and
Acid-Base Balance
• Chemical equilibrium between carbonic
acid (weak acid) and bicarbonate ion
(weak base) works to resist sudden
changes in blood pH.
Copyright © 2008
Thomson Delmar Learning
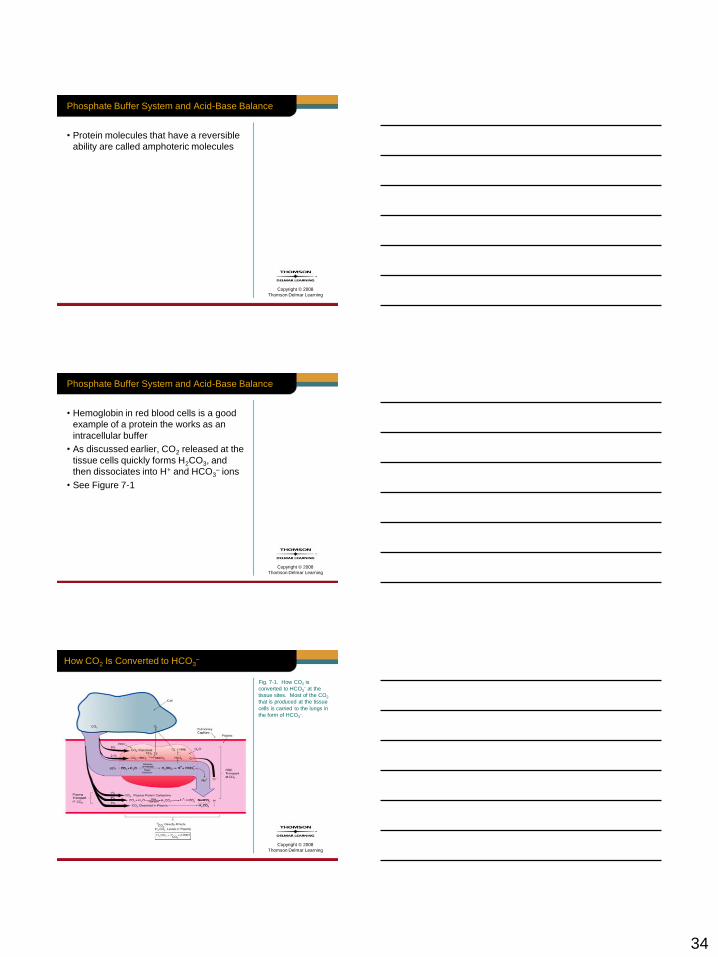
How CO2 Is Converted to HCO3
Fig. 7-1. How CO2 is
converted to HCO3 at the
tissue sites. Most of the CO2
that is produced at the tissue
cells is carried to the lungs in
the form of HCO3–.
23
Copyright © 2008
Thomson Delmar Learning
Carbonic Acid-Bicarbonate Buffer System and
Acid-Base Balance
• For example, when the blood pH
increases (i.e., becomes more alkaline
from the addition of a strong base), the
equilibrium shifts to the right.
• A right shift forces more carbonic acid
to dissociate, which in turn causes the
pH to decrease.
Copyright © 2008
Thomson Delmar Learning
Carbonic Acid-Bicarbonate Buffer System and
Acid-Base Balance
• In contrast, when the blood pH decreases
(i.e., becomes more acidic from the
addition of a strong acid), the equilibrium
moves to the left.
• A left shift forces more bicarbonate to
bind with protons.
Copyright © 2008
Thomson Delmar Learning
Carbonic Acid-Bicarbonate Buffer System and Acid-
Base Balance
• Carbonic acid-bicarbonate buffer system
converts:
1. Strong bases to a weak base (bicarbonate
ion), and
2. Strong acids to a weak acid (carbonic acid)
• Blood pH changes are much less than
they would be if this buffering system did
not exist.

24
Copyright © 2008
Thomson Delmar Learning
The Henderson-Hasselbalch Equation (H-H)
• H-H equation mathematically illustrates
how the pH of a solution is influenced
by the HCO3– to H2CO3 ratio
– The base to acid ratio
Copyright © 2008
Thomson Delmar Learning
The Henderson-Hasselbalch Equation (H-H)
• H-H equation is written as follows:
–
–
• pK is derived from the dissociation
constant of the acid portion of the buffer
combination
• pK is 6:1 and, under normal conditions,
the HCO3– to H2CO3 ratio is 20:1
Copyright © 2008
Thomson Delmar Learning
The Henderson-Hasselbalch Equation (H-H)
• Clinically, the dissolved CO2 (PCO2 x
0.03) can be used for the denominator of
the H-H equations, instead of the H2CO3
• This is possible since the dissolved
carbon dioxide is in equilibrium with, and
directly proportional to, the blood [H2CO3]
25
Copyright © 2008
Thomson Delmar Learning
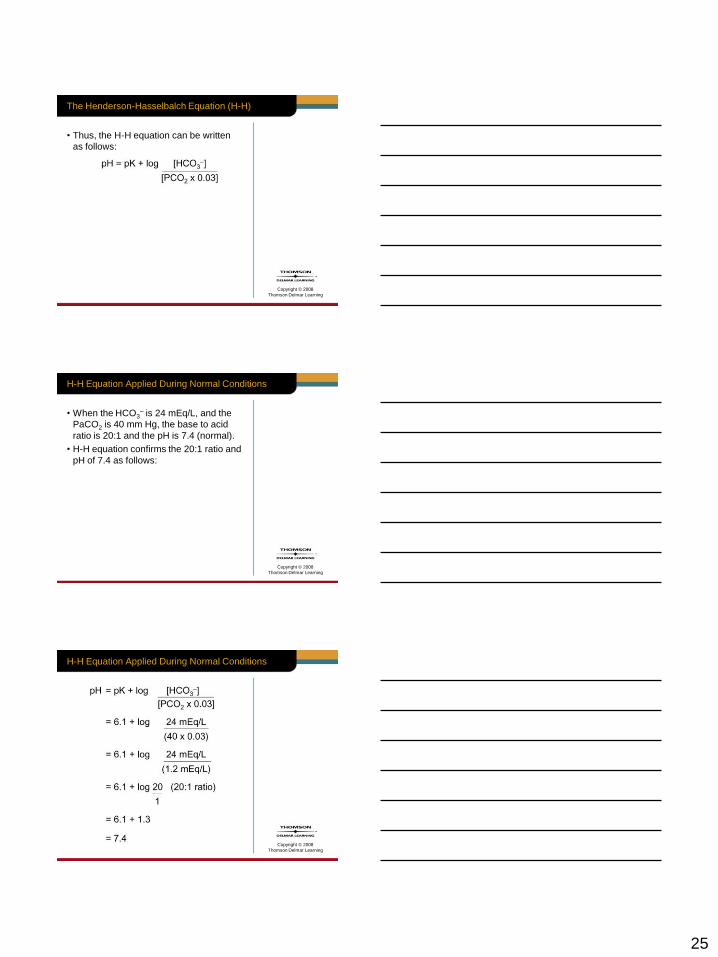
• Thus, the H-H equation can be written
as follows:
The Henderson-Hasselbalch Equation (H-H)
Copyright © 2008
Thomson Delmar Learning
H-H Equation Applied During Normal Conditions
• When the HCO3– is 24 mEq/L, and the
PaCO2 is 40 mm Hg, the base to acid
ratio is 20:1 and the pH is 7.4 (normal).
• H-H equation confirms the 20:1 ratio and
pH of 7.4 as follows:
Copyright © 2008
Thomson Delmar Learning
H-H Equation Applied During Normal Conditions
26
Copyright © 2008
Thomson Delmar Learning
H-H Equation Applied During Abnormal Conditions
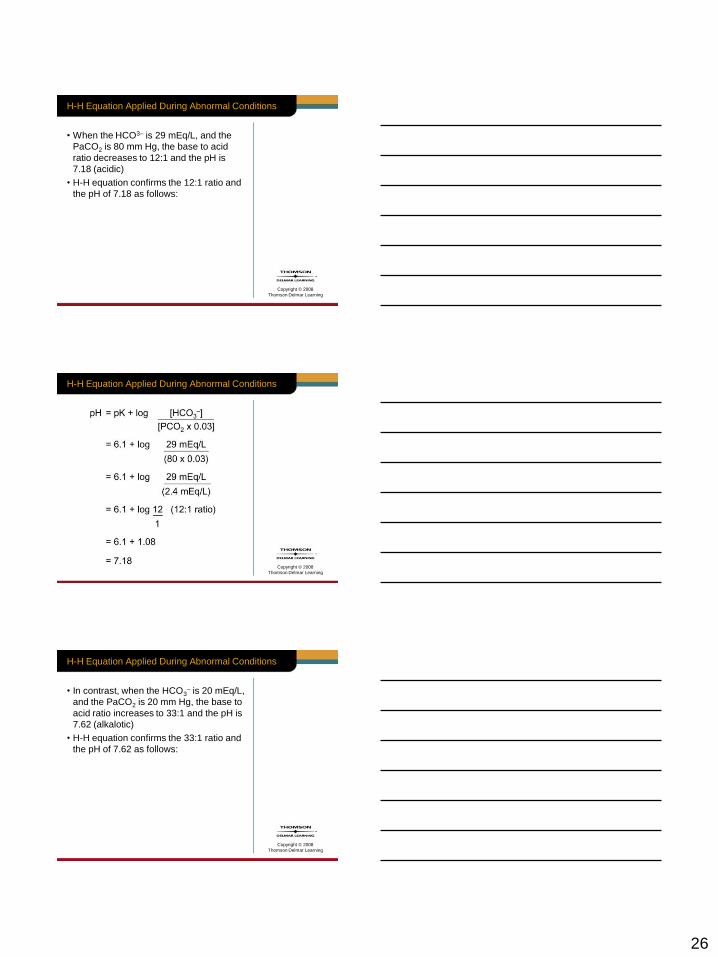
• When the HCO3– is 29 mEq/L, and the
PaCO2 is 80 mm Hg, the base to acid
ratio decreases to 12:1 and the pH is
7.18 (acidic)
• H-H equation confirms the 12:1 ratio and
the pH of 7.18 as follows:
Copyright © 2008
Thomson Delmar Learning
H-H Equation Applied During Abnormal Conditions
Copyright © 2008
Thomson Delmar Learning
H-H Equation Applied During Abnormal Conditions
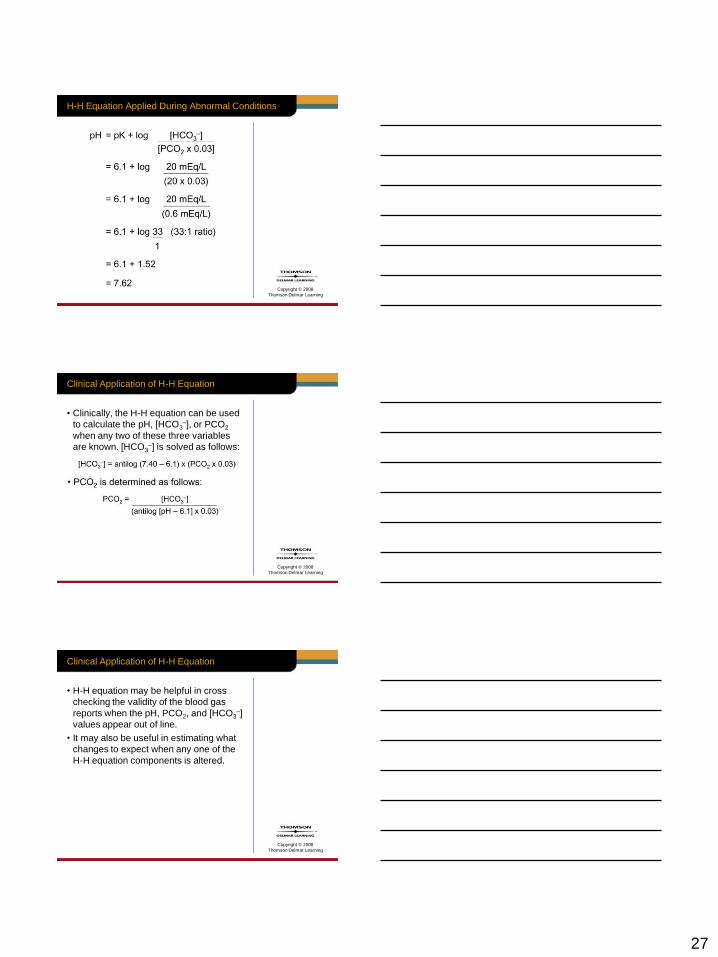
• In contrast, when the HCO3– is 20 mEq/L,
and the PaCO2 is 20 mm Hg, the base to
acid ratio increases to 33:1 and the pH is
7.62 (alkalotic)
• H-H equation confirms the 33:1 ratio and
the pH of 7.62 as follows:
27
Copyright © 2008
Thomson Delmar Learning
H-H Equation Applied During Abnormal Conditions
Copyright © 2008
Thomson Delmar Learning
Clinical Application of H-H Equation
• Clinically, the H-H equation can be used
to calculate the pH, [HCO3–], or PCO2
when any two of these three variables
are known. [HCO3–] is solved as follows:
Copyright © 2008
Thomson Delmar Learning
Clinical Application of H-H Equation
• H-H equation may be helpful in cross
checking the validity of the blood gas
reports when the pH, PCO2, and [HCO3–]
values appear out of line.
• It may also be useful in estimating what
changes to expect when any one of the
H-H equation components is altered.

28
Copyright © 2008
Thomson Delmar Learning
Clinical Application of H-H Equation
• For example, consider the case example
that follows:
Copyright © 2008
Thomson Delmar Learning
Case
• A mechanically ventilated patient has a
pH of 7.54, a PaCO2 of 26 mm Hg, and
a HCO3– of 22 mEq/L.
• The physician asks the respiratory
practitioner to adjust the patient’s
PaCO2 to a level that will decrease
the pH to 7.45.
Copyright © 2008
Thomson Delmar Learning
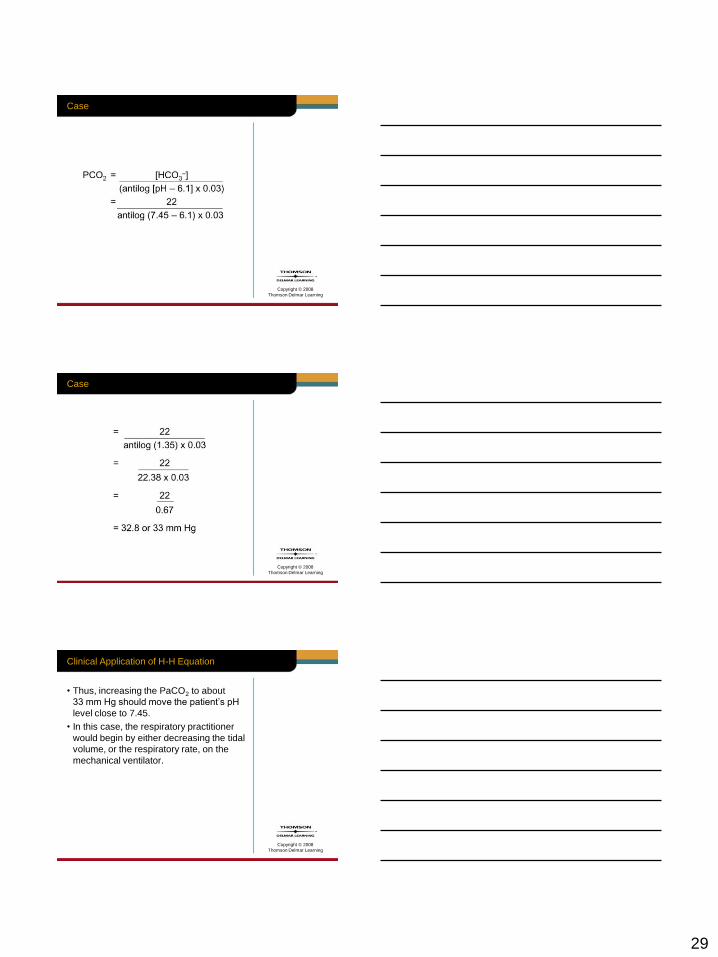
Case
• Using the H-H equation, the PaCO2
change needed to decrease the pH to
7.45 can be estimated as follows:
29
Copyright © 2008
Thomson Delmar Learning
Case
Copyright © 2008
Thomson Delmar Learning
Case
Copyright © 2008
Thomson Delmar Learning
Clinical Application of H-H Equation
• Thus, increasing the PaCO2 to about
33 mm Hg should move the patient’s pH
level close to 7.45.
• In this case, the respiratory practitioner
would begin by either decreasing the tidal
volume, or the respiratory rate, on the
mechanical ventilator.
30
Copyright © 2008
Thomson Delmar Learning
Clinical Application of H-H Equation
• After the ventilator changes are made
– Another arterial blood gas should be obtained
in about 20 minutes
• pH and PaCO2 should be reevaluated
– Followed by appropriate ventilator
adjustments if necessary
Copyright © 2008
Thomson Delmar Learning
Phosphate Buffer System and Acid-Base Balance
• Function of the phosphate buffer system
is almost identical to that of the carbonic
acid-bicarbonate buffer system
Copyright © 2008
Thomson Delmar Learning
Phosphate Buffer System and Acid-Base Balance
• Primary components of the phosphate
buffer system are the:
– Sodium salts of dihydrogen phosphate
(H2PO4–), and
– Monohydrogen phosphate (HPO42–)
31
Copyright © 2008
Thomson Delmar Learning
Phosphate Buffer System and Acid-Base Balance
• NaH2PO4 is a weak acid
• Na2HPO4, which has one less hydrogen
atom, is a weak base
Copyright © 2008
Thomson Delmar Learning
Phosphate Buffer System and Acid-Base Balance
• When H+ ions are released by a strong
acid, the phosphate buffer system works
to inactivate the acidic effects of the H+
as follows:
Copyright © 2008
Thomson Delmar Learning
Phosphate Buffer System and Acid-Base Balance
• On the other hand, strong bases are
converted to weak bases as follows:

32
Copyright © 2008
Thomson Delmar Learning
Phosphate Buffer System and Acid-Base Balance
• Phosphate buffer system is not an
effective buffer for blood plasma
• It is an effective buffer system in urine
and in intracellular fluid where the
phosphate levels are typically greater.
Copyright © 2008
Thomson Delmar Learning
Phosphate Buffer System and Acid-Base Balance
• Body’s most abundant and influential
supply of buffers is the protein buffer
system
• Its buffers are found in the proteins in
the plasma and cells
Copyright © 2008
Thomson Delmar Learning
Phosphate Buffer System and Acid-Base Balance
• In fact, about 75 percent of the buffering
power of body fluids is found in the
intracellular proteins.
33
Copyright © 2008
Thomson Delmar Learning
Phosphate Buffer System and Acid-Base Balance
• Proteins are polymers of amino acids
• Some have exposed groups of atoms
known as organic acid (carboxyl) groups
(—COOH), which dissociate and liberate
H+ in response to a rising pH:
Copyright © 2008
Thomson Delmar Learning
Phosphate Buffer System and Acid-Base Balance
• In contrast, other amino acids consist of
exposed groups that can function as
bases and accept H+.
• For example, an exposed —NH2 group
can bond with hydrogen ions to form —
NH3+:
Copyright © 2008
Thomson Delmar Learning
Phosphate Buffer System and Acid-Base Balance
• Because this reaction ties up free
hydrogen ions, it prevents the solution
from becoming too acidic.
• In addition, a single protein molecule
can function as either an acid or a base
relative to its pH environment.
34
Copyright © 2008
Thomson Delmar Learning
Phosphate Buffer System and Acid-Base Balance
• Protein molecules that have a reversible
ability are called amphoteric molecules
Copyright © 2008
Thomson Delmar Learning
Phosphate Buffer System and Acid-Base Balance
• Hemoglobin in red blood cells is a good
example of a protein the works as an
intracellular buffer
• As discussed earlier, CO2 released at the
tissue cells quickly forms H2CO3, and
then dissociates into H+ and HCO3– ions
• See Figure 7-1
Copyright © 2008
Thomson Delmar Learning
How CO2 Is Converted to HCO3–
Fig. 7-1. How CO2 is
converted to HCO3– at the
tissue sites. Most of the CO2
that is produced at the tissue
cells is carried to the lungs in
the form of HCO3–.

35
Copyright © 2008
Thomson Delmar Learning
Phosphate Buffer System and Acid-Base Balance
• At the same time, the hemoglobin is
unloading oxygen at the tissue sites and
becoming reduced hemoglobin.
• Because reduced hemoglobin carries
a negative charge
– Free H+ ions quickly bond to the hemoglobin
anions
Copyright © 2008
Thomson Delmar Learning
Phosphate Buffer System and Acid-Base Balance
• This action reduces the acidic effects of
the H+ on the pH
• In essence, the H2CO3, which is a weak
acid, is buffered by an even weaker
acid—the hemoglobin protein
Copyright © 2008
Thomson Delmar Learning
The Respiratory System and Acid-Base Balance
• Respiratory system does not respond
as fast as the chemical buffer systems.
• However, it has up to two times the
buffering power of all of the chemical
buffer systems combined.

36
Copyright © 2008
Thomson Delmar Learning
• CO2 produced by the tissue cells enters
the red blood cells and is converted to
HCO3– ions as follows:
The Respiratory System and Acid-Base Balance
Copyright © 2008
Thomson Delmar Learning
The Respiratory System and Acid-Base Balance
• The first set of double arrows illustrates
a reversible equilibrium between the
dissolved carbon dioxide and the water
on the left
– And carbonic acid on the right
Copyright © 2008
Thomson Delmar Learning
The Respiratory System and Acid-Base Balance
• The second set of arrows shows a
reversible equilibrium between carbonic
acid on the left and hydrogen and
bicarbonate ions on the right

37
Copyright © 2008
Thomson Delmar Learning
The Respiratory System and Acid-Base Balance
• Because of this relationship, an increase
in any of these chemicals causes a shift
in the opposite direction
• Note also that the right side of this
equation is the same as that for the
carbonic acid-bicarbonate buffer system
Copyright © 2008
Thomson Delmar Learning
The Respiratory System and Acid-Base Balance
• Under normal conditions, the volume
of CO2 eliminated at the lungs is equal
to the amount of CO2 produced at
the tissues.
Copyright © 2008
Thomson Delmar Learning
The Respiratory System and Acid-Base Balance
• When the CO2 is unloaded at the lungs,
the preceding equation flows to the left,
and causes the H+ generated from the
carbonic acid to transform back to water.
– See Figure 7-2
38
Copyright © 2008
Thomson Delmar Learning
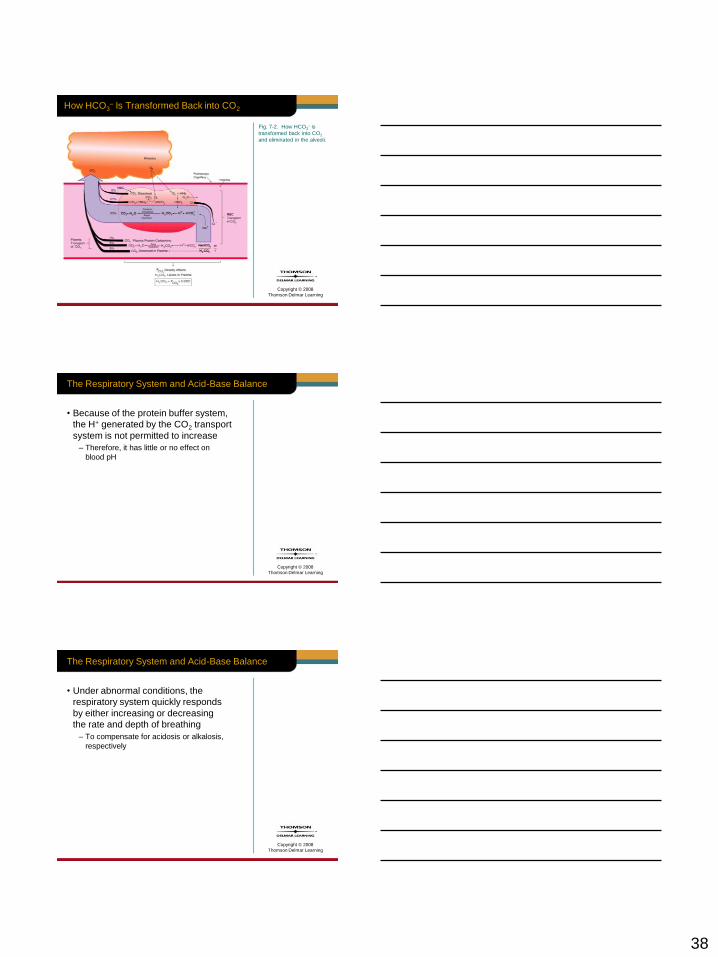
How HCO3– Is Transformed Back into CO2
Fig. 7-2. How HCO3– is
transformed back into CO2
and eliminated in the alveoli.
Copyright © 2008
Thomson Delmar Learning
The Respiratory System and Acid-Base Balance
• Because of the protein buffer system,
the H+ generated by the CO2 transport
system is not permitted to increase
– Therefore, it has little or no effect on
blood pH
Copyright © 2008
Thomson Delmar Learning
The Respiratory System and Acid-Base Balance
• Under abnormal conditions, the
respiratory system quickly responds
by either increasing or decreasing
the rate and depth of breathing
– To compensate for acidosis or alkalosis,
respectively

39
Copyright © 2008
Thomson Delmar Learning
The Respiratory System and Acid-Base Balance
• For example, when the pH declines
(e.g., metabolic acidosis caused by
lactic acids)
– Respiratory system responds by increasing
the breathing depth and rate
Copyright © 2008
Thomson Delmar Learning
The Respiratory System and Acid-Base Balance
• This action causes more CO2 to be
eliminated from the lungs and, therefore,
pushes the preceding reaction to the left
and reduces the H+ concentration.
• This process works to return the acidic
pH back to normal.
Copyright © 2008
Thomson Delmar Learning
The Respiratory System and Acid-Base Balance
• On the other hand, when the pH rises:
– Metabolic alkalosis caused by hypokalemia
– Respiratory system responds by decreasing
the breathing depth and rate

40
Copyright © 2008
Thomson Delmar Learning
The Respiratory System and Acid-Base Balance
• This action causes less CO2 to be
eliminated from the lungs and, thus,
moves the preceding reaction to the right
and increases the H+ concentration.
• This works to pull the alkalotic pH back
to normal.
Copyright © 2008
Thomson Delmar Learning
The Respiratory System and Acid-Base Balance
• Note: When the respiratory system
is impaired for any reason, a serious
acid-base imbalance can develop.
Copyright © 2008
Thomson Delmar Learning
The Respiratory System and Acid-Base Balance
• For example:
– Severe head trauma can cause a dramatic
increase in the depth and rate of breathing
that is completely unrelated to the CO2
concentration.
– When this happens, the volume of CO2
expelled from the lungs will be greater than
amount of CO2 produced at the tissue cells.
41
Copyright © 2008
Thomson Delmar Learning
The Respiratory System and Acid-Base Balance
• In other words, hyperventilation
is present.
• This condition causes the pH to
increase and respiratory alkalosis
is said to exist.
Copyright © 2008
Thomson Delmar Learning
The Respiratory System and Acid-Base Balance
• In contrast:
– The ingestion of barbiturates can cause a
dramatic decrease in the depth and rate of
breathing.
– When this occurs, the volume of CO2
eliminated from the lungs is less than the
amount of CO2 produced at the tissue cells.
Copyright © 2008
Thomson Delmar Learning
The Renal System and Acid-Base Balance
• Even though the chemical buffer systems
can inactivate excess acids and bases
momentarily, they are unable to eliminate
them from the body.

42
Copyright © 2008
Thomson Delmar Learning
The Renal System and Acid-Base Balance
• Similarly, although the respiratory system
can expel the volatile carbonic acid by
eliminating CO2, it cannot expel other
acids generated by cellular metabolism.
Copyright © 2008
Thomson Delmar Learning
The Renal System and Acid-Base Balance
• Only the renal system can rid the body
of acids such as phosphoric acids, uric
acids, lactic acids, and ketone acids
– Also called fixed acids
Copyright © 2008
Thomson Delmar Learning
The Renal System and Acid-Base Balance
• Only the renal system can regulate
alkaline substances in the blood and
restore chemical buffers that are used in
managing H+ levels in extracellular fluids
– Some HCO3–, which helps to adjust H+
concentrations, is lost from the body when
CO2 is expelled from the lungs.
43
Copyright © 2008
Thomson Delmar Learning
The Renal System and Acid-Base Balance
• When the extracellular fluids become
acidic, the renal system retains HCO3–
and excretes H+ ions into the urine
– This causes the blood pH to increase.
Copyright © 2008
Thomson Delmar Learning
The Renal System and Acid-Base Balance
• When the extracellular fluids become
alkaline, the renal system retains H+ and
excretes basic substances primarily
HCO3– into the urine
– This causes the blood pH to decrease
Copyright © 2008
Thomson Delmar Learning
THE ROLE OF THE
PCO2/HCO3–/pH
RELATIONSHIP IN
ACID-BASE BALANCE

44
Copyright © 2008
Thomson Delmar Learning
Acid-Base Balance Disturbances
• Normal bicarbonate (HCO3–) to carbonic
acid (H2CO3) ratio in the blood plasma
is 20:1.
• In other words, for every H2CO3 ion
produced in blood plasma, 20 HCO3–
ions must be formed to maintain a
20:1 ratio (normal pH).
Copyright © 2008
Thomson Delmar Learning
Acid-Base Balance Disturbances
• Or, for every H2CO3 ion loss in the blood
plasma, 20 HCO3– ions must be
eliminated to maintain a normal pH.
• In other words, the H2CO3 ion is 20 times
more powerful than the HCO3– ion in
changing the blood pH.
Copyright © 2008
Thomson Delmar Learning
Acid-Base Balance Disturbances
• Under normal conditions, the 20:1
acid-base balance in the body is
automatically regulated by the:
– Chemical buffer systems
– Respiratory system
– Renal system
45
Copyright © 2008
Thomson Delmar Learning
Acid-Base Balance Disturbances
• However, these normal acid-base
regulating systems have their limits.
• The bottom line is this:
– The body’s normal acid-base watchdog
systems cannot adequately respond to
sudden changes in H+ and HCO3–
concentrations
• Regardless of the cause
Copyright © 2008
Thomson Delmar Learning
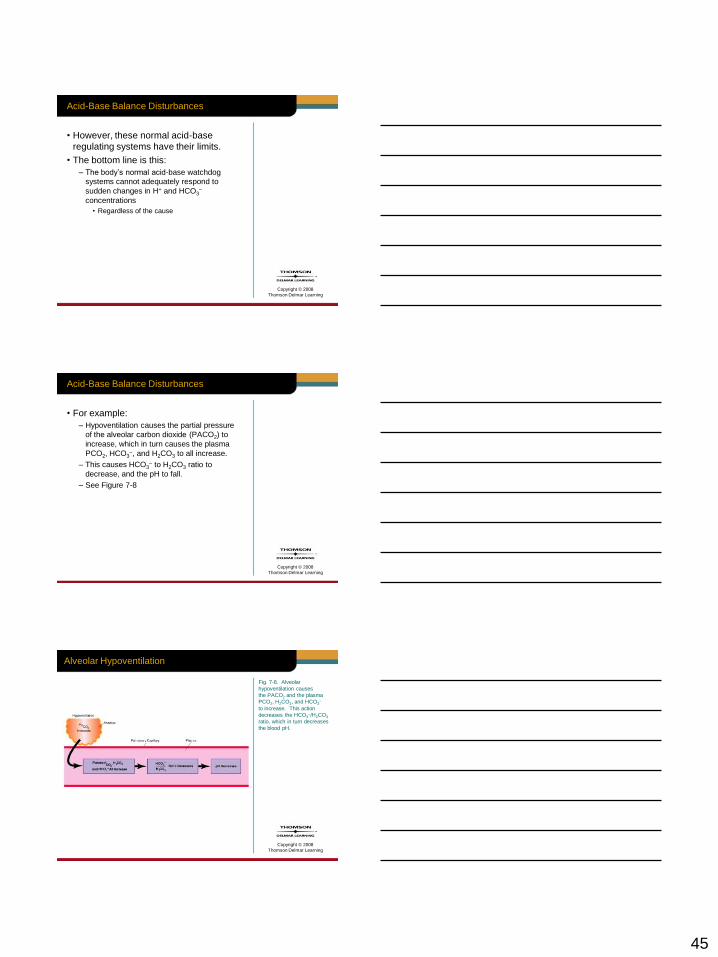
Acid-Base Balance Disturbances
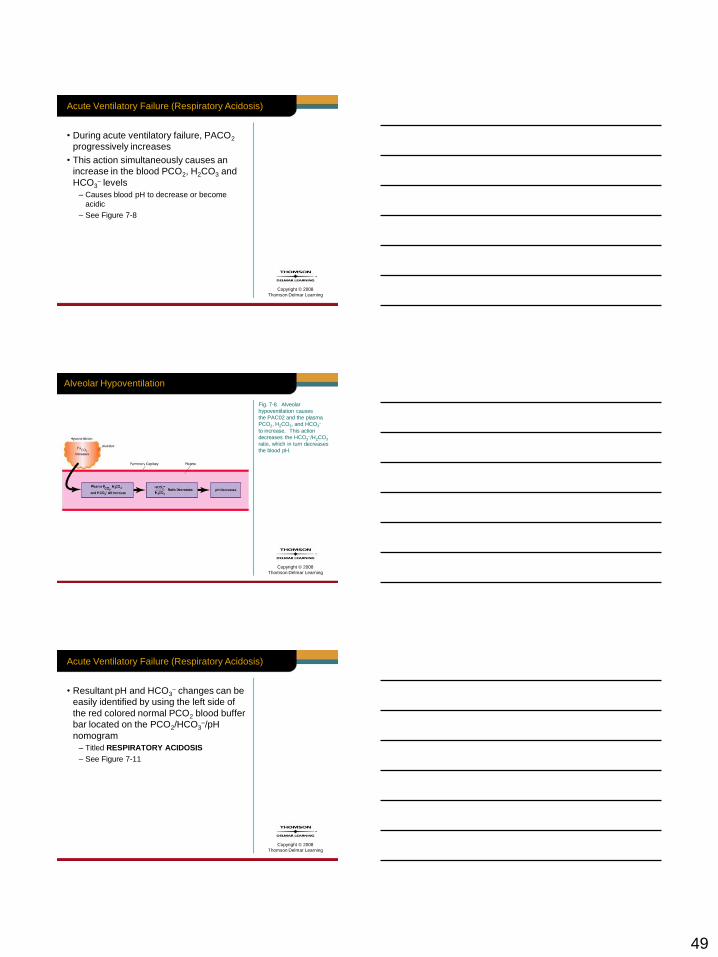
• For example:
– Hypoventilation causes the partial pressure
of the alveolar carbon dioxide (PACO2) to
increase, which in turn causes the plasma
PCO2, HCO3–, and H2CO3 to all increase.
– This causes HCO3– to H2CO3 ratio to
decrease, and the pH to fall.
– See Figure 7-8
Copyright © 2008
Thomson Delmar Learning
Alveolar Hypoventilation
Fig. 7-8. Alveolar
hypoventilation causes
the PACO2 and the plasma
PCO2, H2CO3, and HCO3–
to increase. This action
decreases the HCO3–/H2CO3
ratio, which in turn decreases
the blood pH.
46
Copyright © 2008
Thomson Delmar Learning
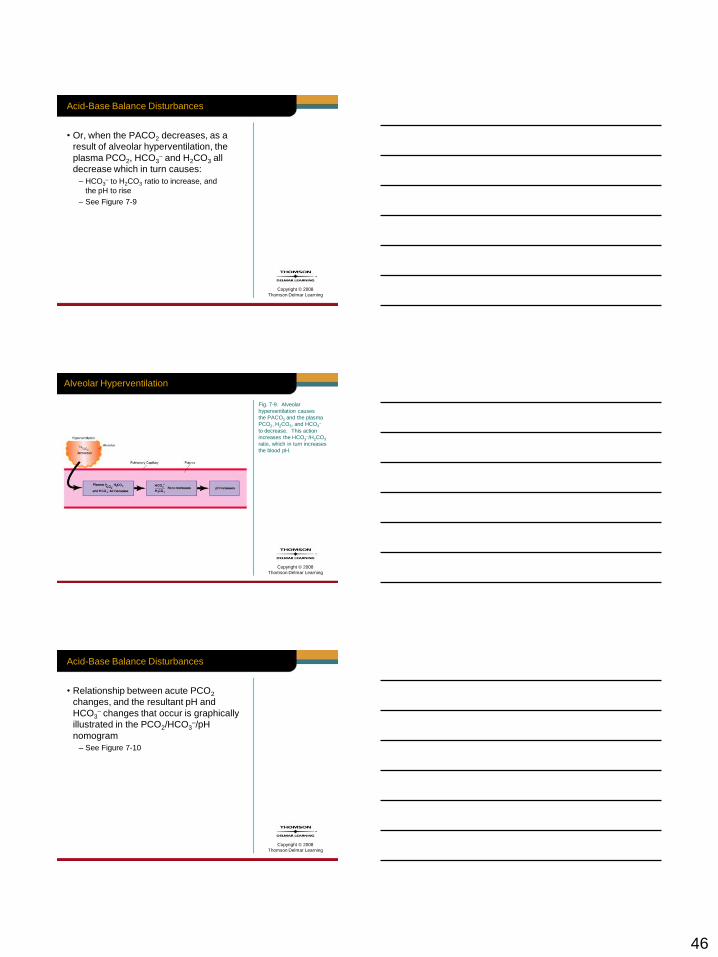
Acid-Base Balance Disturbances
• Or, when the PACO2 decreases, as a
result of alveolar hyperventilation, the
plasma PCO2, HCO3– and H2CO3 all
decrease which in turn causes:
– HCO3– to H2CO3 ratio to increase, and
the pH to rise
– See Figure 7-9
Copyright © 2008
Thomson Delmar Learning
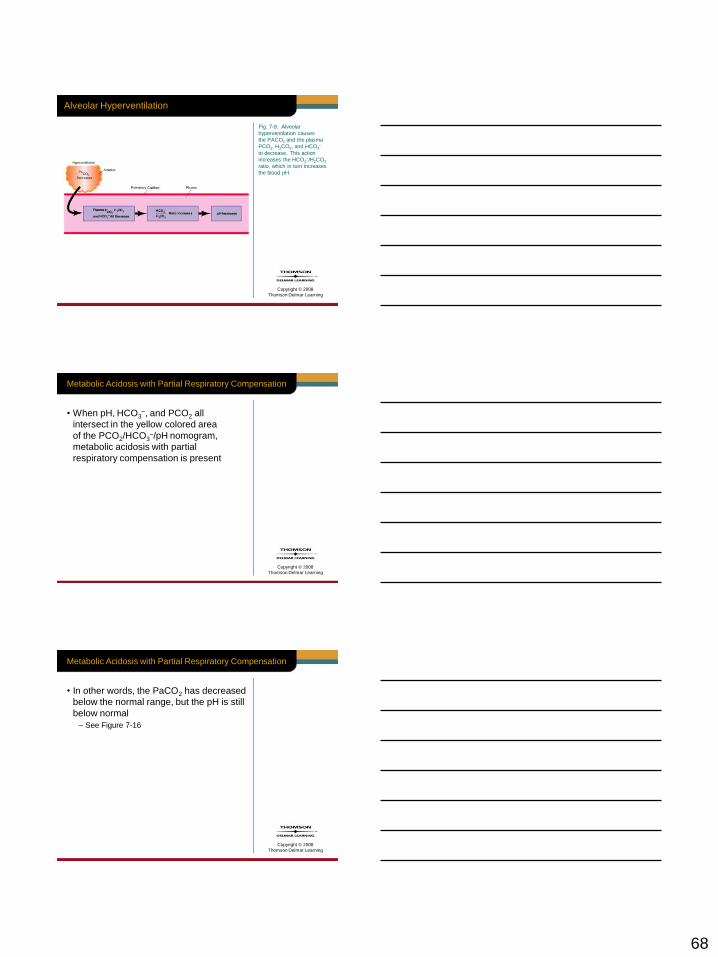
Alveolar Hyperventilation
Fig. 7-9. Alveolar
hyperventilation causes
the PACO2 and the plasma
PCO2, H2CO3, and HCO3–
to decrease. This action
increases the HCO3–/H2CO3
ratio, which in turn increases
the blood pH.
Copyright © 2008
Thomson Delmar Learning
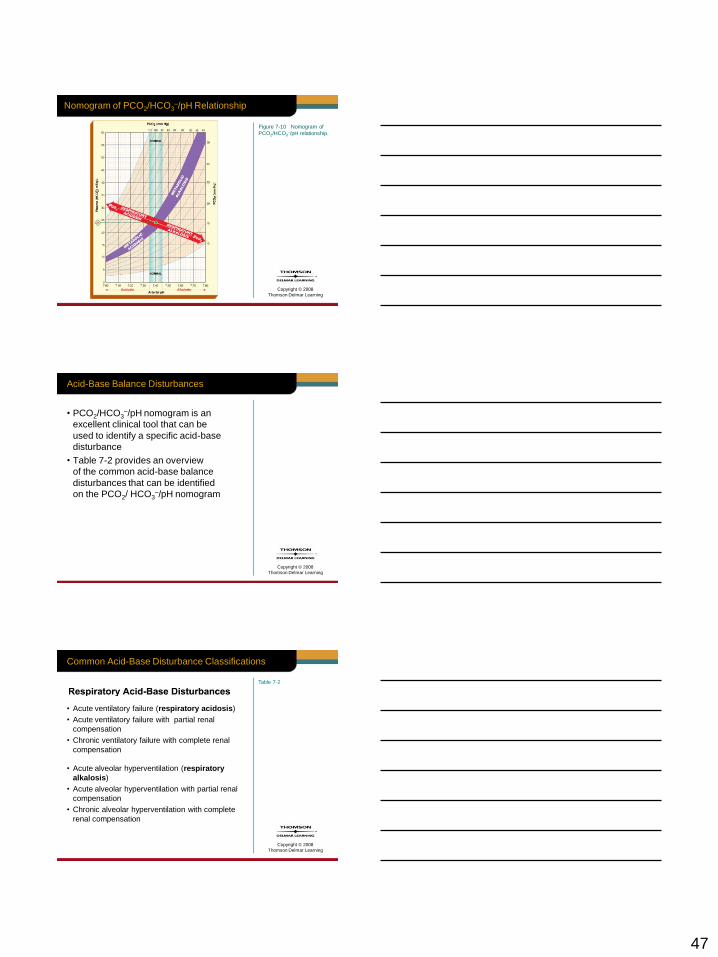
Acid-Base Balance Disturbances
• Relationship between acute PCO2
changes, and the resultant pH and
HCO3– changes that occur is graphically
illustrated in the PCO2/HCO3–/pH
nomogram
– See Figure 7-10
47
Copyright © 2008
Thomson Delmar Learning
Nomogram of PCO2/HCO3–/pH Relationship
Figure 7-10 Nomogram of
PCO2/HCO3–/pH relationship.
Copyright © 2008
Thomson Delmar Learning
Acid-Base Balance Disturbances
• PCO2/HCO3–/pH nomogram is an
excellent clinical tool that can be
used to identify a specific acid-base
disturbance
• Table 7-2 provides an overview
of the common acid-base balance
disturbances that can be identified
on the PCO2/ HCO3–/pH nomogram
Copyright © 2008
Thomson Delmar Learning
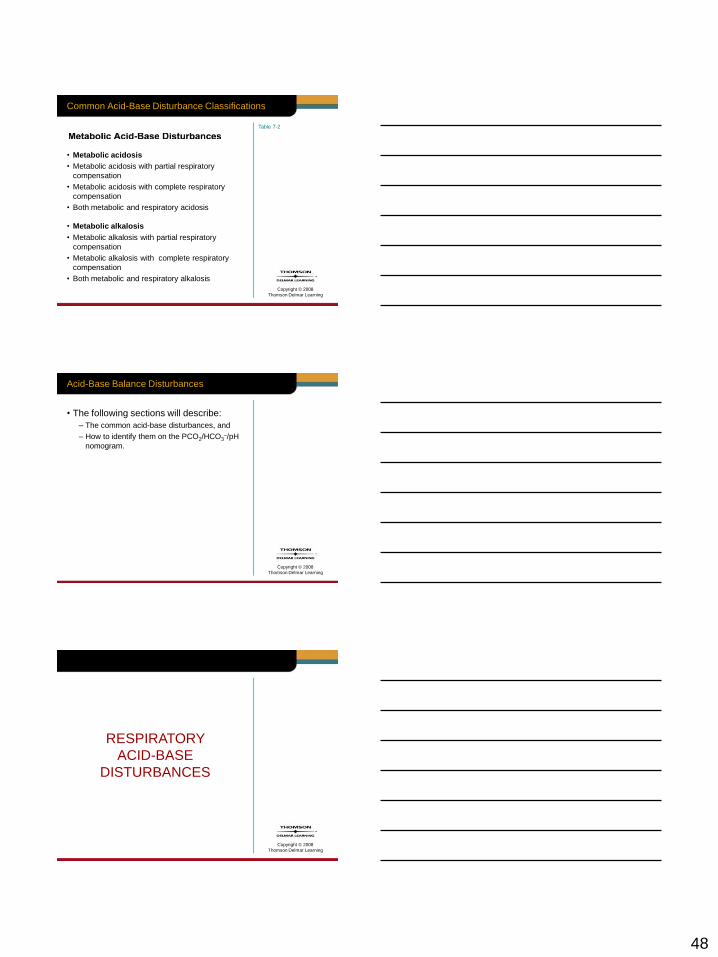
Common Acid-Base Disturbance Classifications
• Acute ventilatory failure (respiratory acidosis)
• Acute ventilatory failure with partial renal
compensation
• Chronic ventilatory failure with complete renal
compensation
• Acute alveolar hyperventilation (respiratory
alkalosis)
• Acute alveolar hyperventilation with partial renal
compensation
• Chronic alveolar hyperventilation with complete
renal compensation
Table 7-2
48
Copyright © 2008
Thomson Delmar Learning
Common Acid-Base Disturbance Classifications
• Metabolic acidosis
• Metabolic acidosis with partial respiratory
compensation
• Metabolic acidosis with complete respiratory
compensation
• Both metabolic and respiratory acidosis
• Metabolic alkalosis
• Metabolic alkalosis with partial respiratory
compensation
• Metabolic alkalosis with complete respiratory
compensation
• Both metabolic and respiratory alkalosis
Table 7-2
Copyright © 2008
Thomson Delmar Learning
Acid-Base Balance Disturbances
• The following sections will describe:
– The common acid-base disturbances, and
– How to identify them on the PCO2/HCO3–/pH
nomogram.
Copyright © 2008
Thomson Delmar Learning
RESPIRATORY
ACID-BASE
DISTURBANCES
49
Copyright © 2008
Thomson Delmar Learning
Acute Ventilatory Failure (Respiratory Acidosis)
• During acute ventilatory failure, PACO2
progressively increases
• This action simultaneously causes an
increase in the blood PCO2, H2CO3 and
HCO3– levels
– Causes blood pH to decrease or become
acidic
– See Figure 7-8
Copyright © 2008
Thomson Delmar Learning
Alveolar Hypoventilation
Fig. 7-8. Alveolar
hypoventilation causes
the PAC02 and the plasma
PCO2, H2CO3, and HCO3–
to increase. This action
decreases the HCO3–/H2CO3
ratio, which in turn decreases
the blood pH.
Copyright © 2008
Thomson Delmar Learning
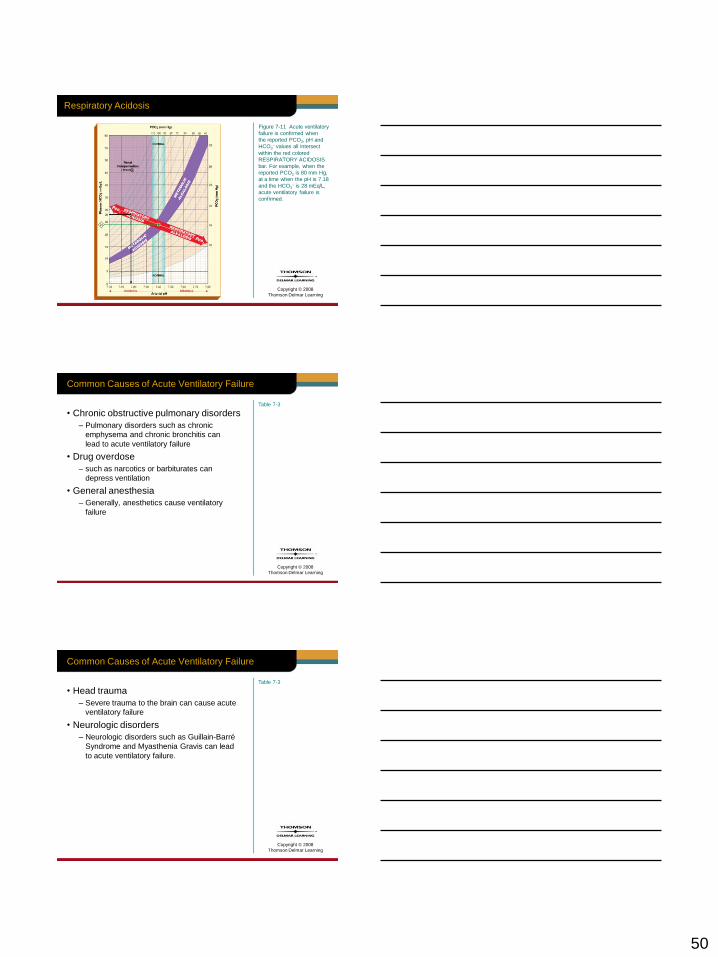
Acute Ventilatory Failure (Respiratory Acidosis)
• Resultant pH and HCO3– changes can be
easily identified by using the left side of
the red colored normal PCO2 blood buffer
bar located on the PCO2/HCO3–/pH
nomogram
– Titled RESPIRATORY ACIDOSIS
– See Figure 7-11
50
Copyright © 2008
Thomson Delmar Learning
Respiratory Acidosis
Figure 7-11 Acute ventilatory
failure is confirmed when
the reported PCO2, pH and
HCO3– values all intersect
within the red colored
RESPIRATORY ACIDOSIS
bar. For example, when the
reported PCO2 is 80 mm Hg,
at a time when the pH is 7.18
and the HCO3– is 28 mEq/L,
acute ventilatory failure is
confirmed.
Copyright © 2008
Thomson Delmar Learning
Table 7-3
Common Causes of Acute Ventilatory Failure
• Chronic obstructive pulmonary disorders
– Pulmonary disorders such as chronic
emphysema and chronic bronchitis can
lead to acute ventilatory failure
• Drug overdose
– such as narcotics or barbiturates can
depress ventilation
• General anesthesia
– Generally, anesthetics cause ventilatory
failure
Copyright © 2008
Thomson Delmar Learning
Common Causes of Acute Ventilatory Failure
• Head trauma
– Severe trauma to the brain can cause acute
ventilatory failure
• Neurologic disorders
– Neurologic disorders such as Guillain-Barré
Syndrome and Myasthenia Gravis can lead
to acute ventilatory failure.
Table 7-3

51
Copyright © 2008
Thomson Delmar Learning
Renal Compensation
• In the patient who hypoventilates for a
long period of time, the kidneys will work
to correct the decreased pH by retaining
HCO3– in the blood.
– Chronic obstructive pulmonary disease
Copyright © 2008
Thomson Delmar Learning
Renal Compensation
• The presence of renal compensation is
verified when the reported PCO2, HCO3–,
and pH values all intersect in the purple
colored area shown in the upper left-hand
corner of the PCO2 /HCO3–/pH
nomogram
– See Figure 7-12
Copyright © 2008
Thomson Delmar Learning
Renal Compensation
Figure 7-12 Acute ventilatory
failure with partial renal
compensation (also called
partially compensated
respiratory acidosis) is
present when the reported pH
and HCO3– are both above
the normal red colored PCO2
blood buffer bar (in the purple
colored area), but the pH is
still less than normal. For
example, when the PCO2 is
80 mm Hg, at a time when
the pH is 7.30 and the HCO3
is 37 mEq/L, ventilatory
failure with partial renal
compensation is confirmed.
52
Copyright © 2008
Thomson Delmar Learning
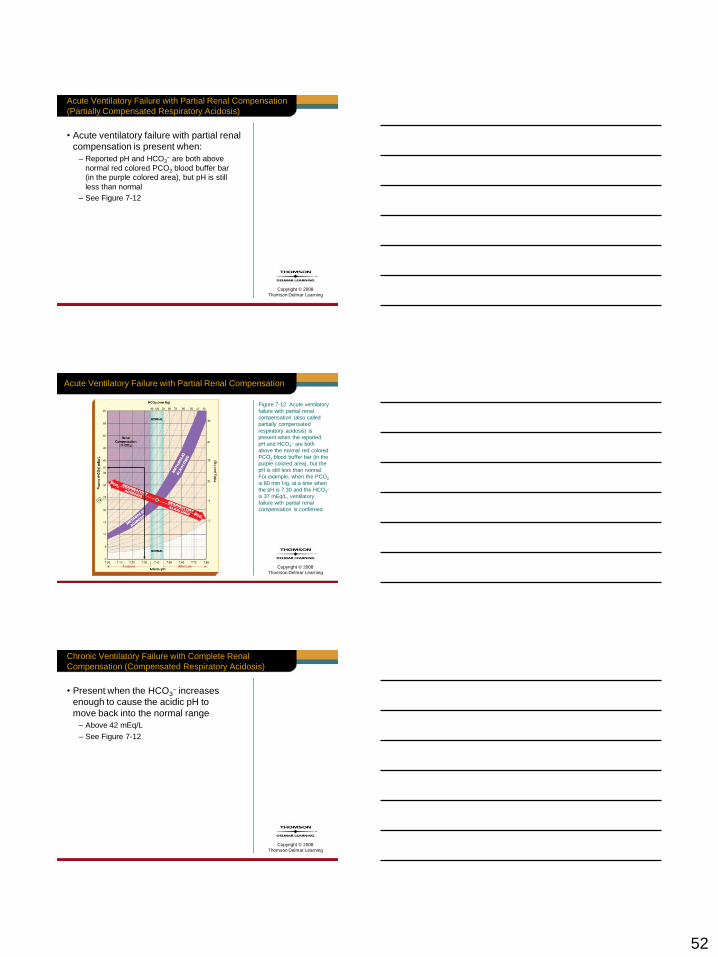
Acute Ventilatory Failure with Partial Renal Compensation
(Partially Compensated Respiratory Acidosis)
• Acute ventilatory failure with partial renal
compensation is present when:
– Reported pH and HCO3– are both above
normal red colored PCO2 blood buffer bar
(in the purple colored area), but pH is still
less than normal
– See Figure 7-12
Copyright © 2008
Thomson Delmar Learning
Acute Ventilatory Failure with Partial Renal Compensation
Figure 7-12 Acute ventilatory
failure with partial renal
compensation (also called
partially compensated
respiratory acidosis) is
present when the reported
pH and HCO3– are both
above the normal red colored
PCO2 blood buffer bar (in the
purple colored area), but the
pH is still less than normal.
For example, when the PCO2
is 80 mm Hg, at a time when
the pH is 7.30 and the HCO3–
is 37 mEq/L, ventilatory
failure with partial renal
compensation is confirmed.
Copyright © 2008
Thomson Delmar Learning
Chronic Ventilatory Failure with Complete Renal
Compensation (Compensated Respiratory Acidosis)
• Present when the HCO3– increases
enough to cause the acidic pH to
move back into the normal range
– Above 42 mEq/L
– See Figure 7-12

53
Copyright © 2008
Thomson Delmar Learning
Acute Ventilatory Failure with Partial Renal Compensation
Figure 7-12 Acute ventilatory
failure with partial renal
compensation (also called
partially compensated
respiratory acidosis) is
present when the reported
pH and HCO3– are both
above the normal red colored
PCO2 blood buffer bar (in the
purple colored area), but the
pH is still less than normal.
For example, when the PCO2
is 80 mm Hg, at a time when
the pH is 7.30 and the HCO3–
is 37 mEq/L, ventilatory
failure with partial renal
compensation is confirmed.
Copyright © 2008
Thomson Delmar Learning
Acute Alveolar Hyperventilation (Respiratory Alkalosis)
• During acute alveolar hyperventilation,
the PACO2 will decrease and allow
more CO2 molecules to leave the
pulmonary blood.
– Hyperventilation due to pain and/or anxiety
Copyright © 2008
Thomson Delmar Learning
Acute Alveolar Hyperventilation (Respiratory Alkalosis)
• This action simultaneously causes a
decrease in the blood PCO2, H2CO3, and
HCO3– levels
– Which, in turn, causes the blood pH
to increase, or become more alkaline
– See Figure 7-9
54
Copyright © 2008
Thomson Delmar Learning
Alveolar Hyperventilation
Fig. 7-9. Alveolar
hyperventilation causes the
PACO2 and the plasma
PCO2, H2CO3, and HCO3– to
decrease. This action
increases the HCO3/ H2CO3
ratio, which in turn increases
the blood pH.
Copyright © 2008
Thomson Delmar Learning
Acute Alveolar Hyperventilation (Respiratory Alkalosis)
• Resultant pH and HCO3– changes
caused by an acute decrease in the
PCO2 level can be identified by using
the right side of the red colored normal
PCO2 blood buffer bar located on the
PCO2/HCO3–/pH nomogram
– Titled RESPIRATORY ALKALOSIS
– See Figure 7-13
Copyright © 2008
Thomson Delmar Learning
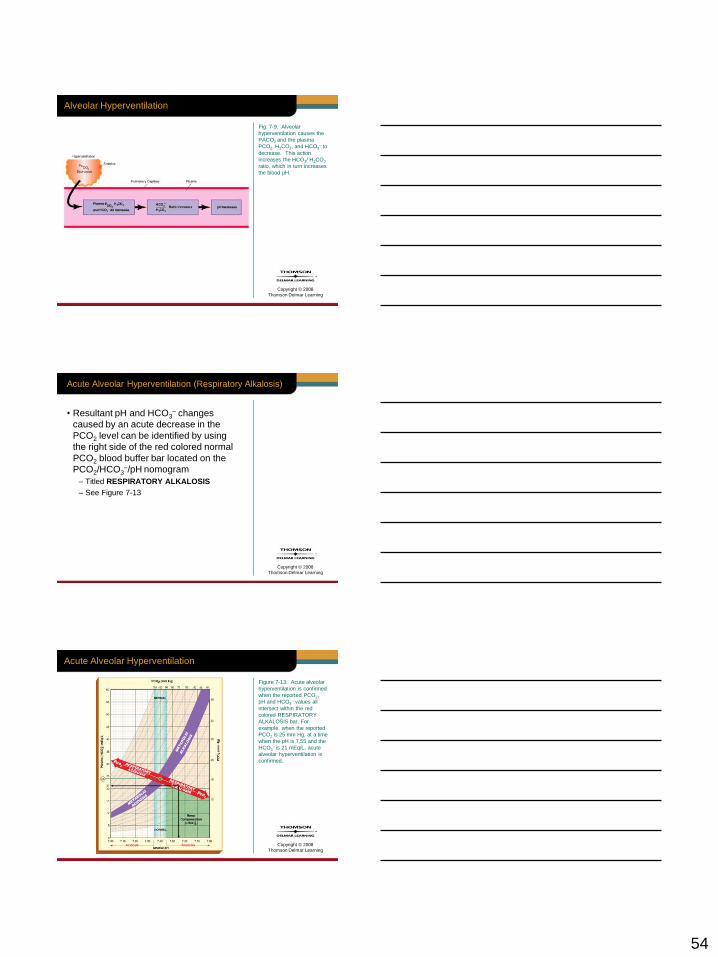
Acute Alveolar Hyperventilation
Figure 7-13. Acute alveolar
hyperventilation is confirmed
when the reported PCO2,
pH and HCO3– values all
intersect within the red
colored RESPIRATORY
ALKALOSIS bar. For
example, when the reported
PCO2 is 25 mm Hg, at a time
when the pH is 7.55 and the
HCO3– is 21 mEq/L, acute
alveolar hyperventilation is
confirmed.
55
Copyright © 2008
Thomson Delmar Learning
Common Causes of Acute Ventilatory Failure
• Hypoxia
– Any cause of hypoxia (e.g., lung disorders,
high altitudes, and heart disease) can cause
acute alveolar hyperventilation.
• Pain, anxiety, and fever
– Relative to the degree of pain, anxiety, and
fever, hyperventilation may be seen.
Table 7-2
Copyright © 2008
Thomson Delmar Learning
Common Causes of Acute Ventilatory Failure
• Brain inflammation
– Relative to the degree of cerebral
inflammation, hyperventilation may be seen.
• Stimulant drugs
– Agents such as amphetamines can cause
alveolar hyperventilation.
Table 7-2
Copyright © 2008
Thomson Delmar Learning
Renal Compensation
• In the patient who hyperventilates for a
long period of time, the kidneys will work
to correct the increased pH by excreting
excess HCO3– in the urine.
– A patient who has been overly mechanically
hyperventilated for more than 24 to 48 hours
56
Copyright © 2008
Thomson Delmar Learning
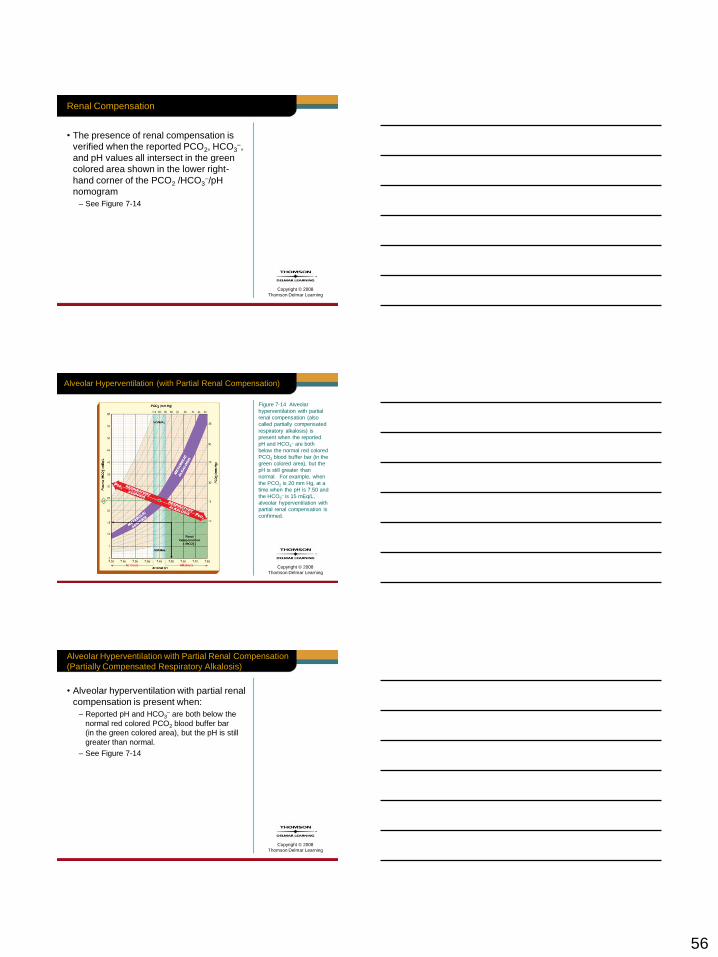
Renal Compensation
• The presence of renal compensation is
verified when the reported PCO2, HCO3–,
and pH values all intersect in the green
colored area shown in the lower right-
hand corner of the PCO2 /HCO3–/pH
nomogram
– See Figure 7-14
Copyright © 2008
Thomson Delmar Learning
Alveolar Hyperventilation (with Partial Renal Compensation)
Figure 7-14 Alveolar
hyperventilation with partial
renal compensation (also
called partially compensated
respiratory alkalosis) is
present when the reported
pH and HCO3– are both
below the normal red colored
PCO2 blood buffer bar (in the
green colored area), but the
pH is still greater than
normal. For example, when
the PCO2 is 20 mm Hg, at a
time when the pH is 7.50 and
the HCO3– is 15 mEq/L,
alveolar hyperventilation with
partial renal compensation is
confirmed.
Copyright © 2008
Thomson Delmar Learning
Alveolar Hyperventilation with Partial Renal Compensation
(Partially Compensated Respiratory Alkalosis)
• Alveolar hyperventilation with partial renal
compensation is present when:
– Reported pH and HCO3– are both below the
normal red colored PCO2 blood buffer bar
(in the green colored area), but the pH is still
greater than normal.
– See Figure 7-14
57
Copyright © 2008
Thomson Delmar Learning
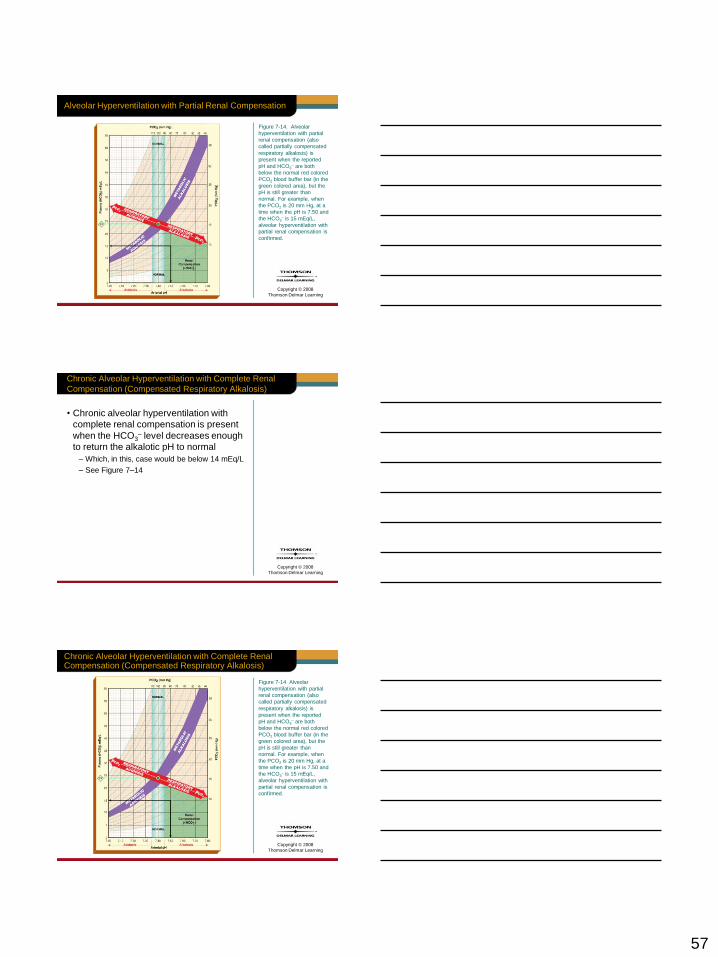
Alveolar Hyperventilation with Partial Renal Compensation
Figure 7-14. Alveolar
hyperventilation with partial
renal compensation (also
called partially compensated
respiratory alkalosis) is
present when the reported
pH and HCO3– are both
below the normal red colored
PCO2 blood buffer bar (in the
green colored area), but the
pH is still greater than
normal. For example, when
the PCO2 is 20 mm Hg, at a
time when the pH is 7.50 and
the HCO3– is 15 mEq/L,
alveolar hyperventilation with
partial renal compensation is
confirmed.
Copyright © 2008
Thomson Delmar Learning
Chronic Alveolar Hyperventilation with Complete Renal
Compensation (Compensated Respiratory Alkalosis)
• Chronic alveolar hyperventilation with
complete renal compensation is present
when the HCO3– level decreases enough
to return the alkalotic pH to normal
– Which, in this, case would be below 14 mEq/L
– See Figure 7–14
Copyright © 2008
Thomson Delmar Learning
Chronic Alveolar Hyperventilation with Complete Renal Compensation (Compensated Respiratory Alkalosis)
Figure 7-14 Alveolar
hyperventilation with partial
renal compensation (also
called partially compensated
respiratory alkalosis) is
present when the reported
pH and HCO3– are both
below the normal red colored
PCO2 blood buffer bar (in the
green colored area), but the
pH is still greater than
normal. For example, when
the PCO2 is 20 mm Hg, at a
time when the pH is 7.50 and
the HCO3– is 15 mEq/L,
alveolar hyperventilation with
partial renal compensation is
confirmed.
58
Copyright © 2008
Thomson Delmar Learning
General Comments
• As a general rule, the kidneys do not
overcompensate for an abnormal pH.
• If the patient’s blood pH becomes
acidic for a long period of time due
to hypoventilation, the kidneys will
not retain enough HCO3– for the pH
to climb higher than 7.40.
Copyright © 2008
Thomson Delmar Learning
General Comments
• The opposite is also true:
– Should the blood pH become alkalotic for
a long period of time due to hyperventilation,
the kidneys will not excrete enough HCO3–
for the pH to fall below 7.40.
Copyright © 2008
Thomson Delmar Learning
General Comments
• However, there is one important
exception to this rule:
– In persons who chronically hypoventilate for a
long period of time, it is not uncommon to find
a pH greater than 7.40 (e.g., 7.43 or 7.44)
– Patients with chronic emphysema or chronic
bronchitis

59
Copyright © 2008
Thomson Delmar Learning
General Comments
• This is due to water and chloride ion
shifts that occur between the intercellular
and extracellular spaces when the renal
system works to compensate for a
decreased blood pH.
• This action causes an overall loss of
blood chloride (hypochloremia)
– Hypochloremia increases the blood pH
Copyright © 2008
Thomson Delmar Learning
To Summarize
• The lungs play an important role in
maintaining the PCO2, HCO3–, and pH
levels on a moment-to-moment basis.
• The kidneys, on the other hand, play an
important role in balancing the HCO3–
and pH levels during long periods of
hyperventilation or hypoventilation.
Copyright © 2008
Thomson Delmar Learning
METABOLIC
ACID-BASE
IMBALANCES

60
Copyright © 2008
Thomson Delmar Learning
Metabolic Acidosis
• The presence of other acids, not related
to an increased PCO2 level, can also be
identified on the PCO2/HCO3–/pH
nomogram.
• Clinically, this condition is called
metabolic acidosis.
Copyright © 2008
Thomson Delmar Learning
Metabolic Acidosis
• Metabolic acidosis is present when the
PCO2 reading is within the normal range
(35 to 45 mm Hg)—but not within the red
colored normal blood buffer line when
compared to the reported HCO3– and
pH levels.
Copyright © 2008
Thomson Delmar Learning
Metabolic Acidosis
• This is because the pH and HCO3–
readings are both lower than expected
for a normal PCO2 level.
61
Copyright © 2008
Thomson Delmar Learning
Metabolic Acidosis
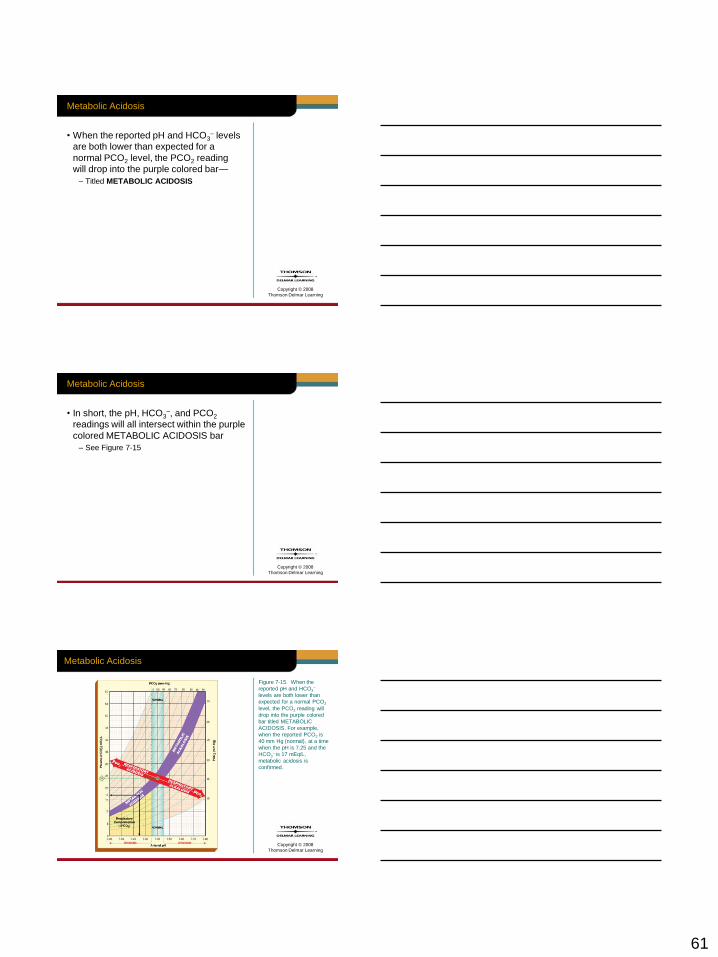
• When the reported pH and HCO3– levels
are both lower than expected for a
normal PCO2 level, the PCO2 reading
will drop into the purple colored bar—
– Titled METABOLIC ACIDOSIS
Copyright © 2008
Thomson Delmar Learning
Metabolic Acidosis
• In short, the pH, HCO3–, and PCO2
readings will all intersect within the purple
colored METABOLIC ACIDOSIS bar
– See Figure 7-15
Copyright © 2008
Thomson Delmar Learning
Metabolic Acidosis
Figure 7-15. When the
reported pH and HCO3–
levels are both lower than
expected for a normal PCO2
level, the PCO2 reading will
drop into the purple colored
bar titled METABOLIC
ACIDOSIS. For example,
when the reported PCO2 is
40 mm Hg (normal), at a time
when the pH is 7.25 and the
HCO3– is 17 mEq/L,
metabolic acidosis is
confirmed.
62
Copyright © 2008
Thomson Delmar Learning
Table 7-4
Common Causes of Metabolic Acidosis
• Lactic acidosis
– Fixed acids
• Ketoacidosis
– Fixed acids
Copyright © 2008
Thomson Delmar Learning
Common Causes of Metabolic Acidosis
• Salicylate intoxication
– Aspirin overdose
– Fixed acids
• Renal failure
• Uncontrolled diarrhea
Table 7-4
Copyright © 2008
Thomson Delmar Learning
Anion Gap
• To determine if a patient’s metabolic
acidosis is caused by either:
1. The accumulation of fixed acids (e.g.,
lactic acids, keto acids, or salicylate
intoxication), or
2. By an excessive loss of HCO3–

63
Copyright © 2008
Thomson Delmar Learning
Anion Gap
• According to the law of electroneutrality:
– The total number of plasma positively charged
ions (cations) must equal the total number of
plasma negatively charged ions (anions) in
the body fluids.
• To determine the anion gap, the most
commonly measured cations are sodium
(Na+) ions.
Copyright © 2008
Thomson Delmar Learning
Anion Gap
• Most commonly measured anions are
the chloride (Cl–) ions and bicarbonate
(HCO3–) ions
• The normal plasma concentration of
these cations and anions are as follows:
Copyright © 2008
Thomson Delmar Learning
Anion Gap
• Mathematically, the anion gap is the
calculated difference between the
Na+ ions and the sum of the HCO3–
and Cl– ions:
64
Copyright © 2008
Thomson Delmar Learning
Anion Gap
• The normal anion gap range (or the
range of the unmeasured ions) is
9 to 14 mEq/L.
• An anion gap greater than 14 mEq/L
represents metabolic acidosis.
Copyright © 2008
Thomson Delmar Learning
Anion Gap
• An elevated anion gap is most
commonly caused by the accumulation
of fixed acids
– Lactic acids
– Keto acids
– Salicylate intoxication
Copyright © 2008
Thomson Delmar Learning
Anion Gap
• This is because the H+ ions that are
generated by the fixed acids chemically
react with—and are buffered by—the
plasma HCO3–
• This action causes:
1. The HCO3– concentration to decrease, and
2. The anion gap to increase
65
Copyright © 2008
Thomson Delmar Learning
Anion Gap
• Clinically, when the patient presents
with both metabolic acidosis and an
increased anion gap, the respiratory
care practitioner must investigate
further to determine the source of
the fixed acids.
– This needs to be done in order to
appropriately treat the patient
Copyright © 2008
Thomson Delmar Learning
Anion Gap
• For example, a metabolic acidosis
caused:
1. By lactic acids justifies the need for
oxygen therapy—to reverse the
accumulation of the lactic acids, or
2. By ketone acids justifies the need for
insulin—to reverse the accumulation
of the ketone acids.
Copyright © 2008
Thomson Delmar Learning
Anion Gap
• Interestingly, metabolic acidosis caused
by an excessive loss of HCO3– does not
cause the anion gap to increase
– Namely, renal disease or severe diarrhea
66
Copyright © 2008
Thomson Delmar Learning
Anion Gap
• This is because as the HCO3–
concentration decreases, the Cl–
concentration routinely increases
to maintain electroneutrality.
• In other words, for each HCO3–
that is lost, a Cl– anion takes
its place:
– Namely, law of electroneutrality
Copyright © 2008
Thomson Delmar Learning
Anion Gap
• This action maintains a normal
anion gap
• Metabolic acidosis caused by a
decreased HCO3– is often called
hyperchloremic metabolic acidosis
Copyright © 2008
Thomson Delmar Learning
To Summarize
• When metabolic acidosis is accompanied
by an increased anion gap, the most
likely cause of the acidosis is fixed acids
– Lactic acids
– Ketoacids
– Salicylate intoxication

67
Copyright © 2008
Thomson Delmar Learning
To Summarize
• Or, when a metabolic acidosis is seen
with a normal anion gap, the most likely
cause of the acidosis is an excessive
lose of HCO3–
– Caused by renal disease or severe diarrhea
Copyright © 2008
Thomson Delmar Learning
Metabolic Acidosis with Respiratory Compensation
• The immediate compensatory response
to metabolic acidosis is an increased
ventilatory rate.
– This action causes the PaCO2 to decline
Copyright © 2008
Thomson Delmar Learning
Metabolic Acidosis with Respiratory Compensation
• As the PCO2 decreases, the H+
concentration decreases
– This action works to offset the
metabolic acidosis
– See Figure 7-9
68
Copyright © 2008
Thomson Delmar Learning
Alveolar Hyperventilation
Fig. 7-9. Alveolar
hyperventilation causes
the PACO2 and the plasma
PCO2, H2CO3, and HCO3–
to decrease. This action
increases the HCO3–/H2CO3
ratio, which in turn increases
the blood pH.
Copyright © 2008
Thomson Delmar Learning
Metabolic Acidosis with Partial Respiratory Compensation
• When pH, HCO3–, and PCO2 all
intersect in the yellow colored area
of the PCO2/HCO3–/pH nomogram,
metabolic acidosis with partial
respiratory compensation is present
Copyright © 2008
Thomson Delmar Learning
Metabolic Acidosis with Partial Respiratory Compensation
• In other words, the PaCO2 has decreased
below the normal range, but the pH is still
below normal
– See Figure 7-16
69
Copyright © 2008
Thomson Delmar Learning
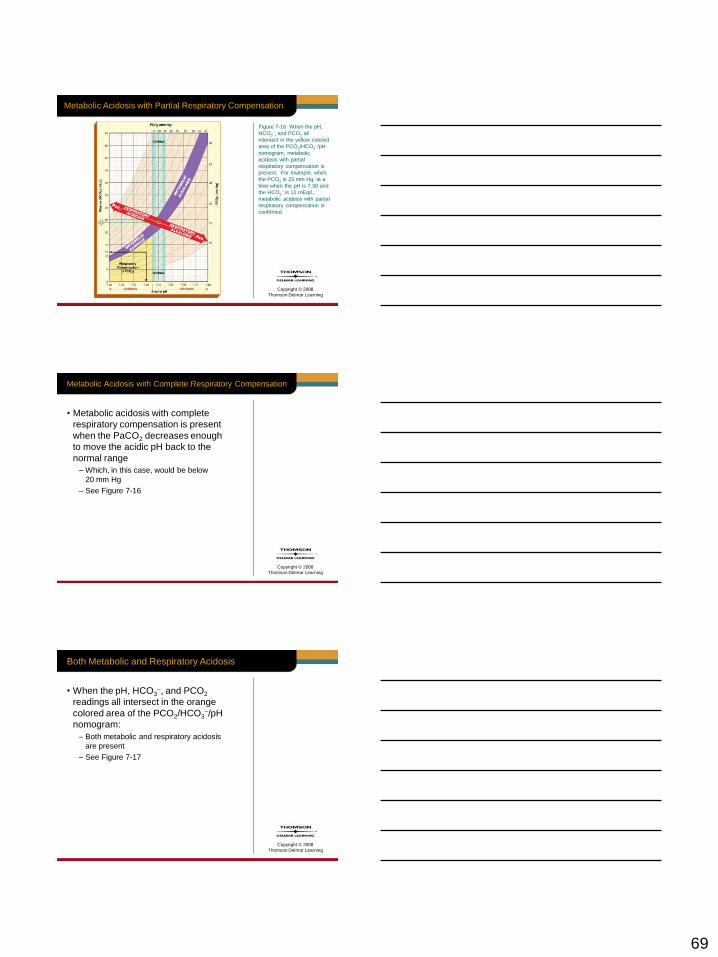
Metabolic Acidosis with Partial Respiratory Compensation
Figure 7-16 When the pH,
HCO3–, and PCO2 all
intersect in the yellow colored
area of the PCO2/HCO3–/pH
nomogram, metabolic
acidosis with partial
respiratory compensation is
present. For example, when
the PCO2 is 25 mm Hg, at a
time when the pH is 7.30 and
the HCO3– is 12 mEq/L,
metabolic acidosis with partial
respiratory compensation is
confirmed.
Copyright © 2008
Thomson Delmar Learning
Metabolic Acidosis with Complete Respiratory Compensation
• Metabolic acidosis with complete
respiratory compensation is present
when the PaCO2 decreases enough
to move the acidic pH back to the
normal range
– Which, in this case, would be below
20 mm Hg
– See Figure 7-16
Copyright © 2008
Thomson Delmar Learning
Both Metabolic and Respiratory Acidosis
• When the pH, HCO3–, and PCO2
readings all intersect in the orange
colored area of the PCO2/HCO3–/pH
nomogram:
– Both metabolic and respiratory acidosis
are present
– See Figure 7-17
70
Copyright © 2008
Thomson Delmar Learning
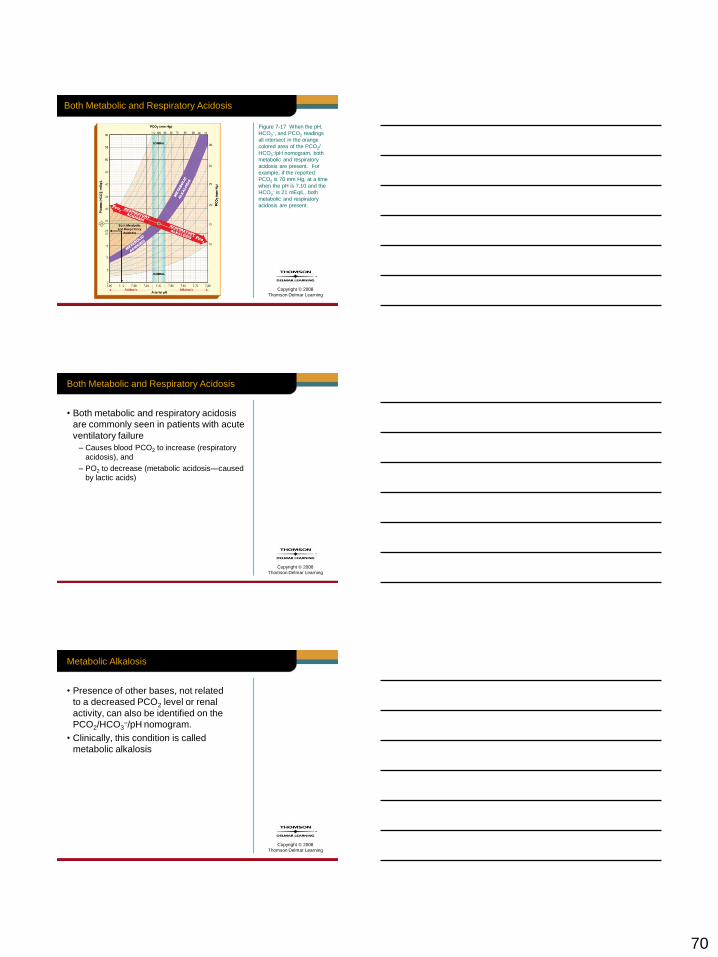
Both Metabolic and Respiratory Acidosis
Figure 7-17 When the pH,
HCO3–, and PCO2 readings
all intersect in the orange
colored area of the PCO2/
HCO3–/pH nomogram, both
metabolic and respiratory
acidosis are present. For
example, if the reported
PCO2 is 70 mm Hg, at a time
when the pH is 7.10 and the
HCO3– is 21 mEq/L, both
metabolic and respiratory
acidosis are present.
Copyright © 2008
Thomson Delmar Learning
Both Metabolic and Respiratory Acidosis
• Both metabolic and respiratory acidosis
are commonly seen in patients with acute
ventilatory failure
– Causes blood PCO2 to increase (respiratory
acidosis), and
– PO2 to decrease (metabolic acidosis—caused
by lactic acids)
Copyright © 2008
Thomson Delmar Learning
Metabolic Alkalosis
• Presence of other bases, not related
to a decreased PCO2 level or renal
activity, can also be identified on the
PCO2/HCO3–/pH nomogram.
• Clinically, this condition is called
metabolic alkalosis
71
Copyright © 2008
Thomson Delmar Learning
Metabolic Alkalosis
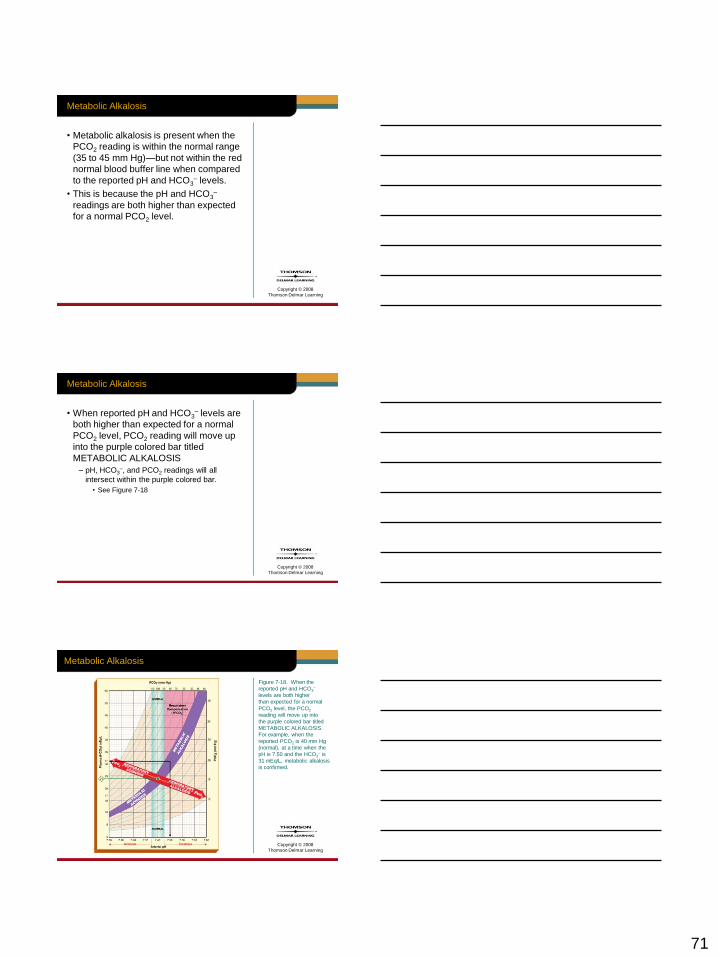
• Metabolic alkalosis is present when the
PCO2 reading is within the normal range
(35 to 45 mm Hg)—but not within the red
normal blood buffer line when compared
to the reported pH and HCO3– levels.
• This is because the pH and HCO3–
readings are both higher than expected
for a normal PCO2 level.
Copyright © 2008
Thomson Delmar Learning
Metabolic Alkalosis
• When reported pH and HCO3– levels are
both higher than expected for a normal
PCO2 level, PCO2 reading will move up
into the purple colored bar titled
METABOLIC ALKALOSIS
– pH, HCO3–, and PCO2 readings will all
intersect within the purple colored bar.
• See Figure 7-18
Copyright © 2008
Thomson Delmar Learning
Metabolic Alkalosis
Figure 7-18. When the
reported pH and HCO3–
levels are both higher
than expected for a normal
PCO2 level, the PCO2
reading will move up into
the purple colored bar titled
METABOLIC ALKALOSIS.
For example, when the
reported PCO2 is 40 mm Hg
(normal), at a time when the
pH is 7.50 and the HCO3– is
31 mEq/L, metabolic alkalosis
is confirmed.
72
Copyright © 2008
Thomson Delmar Learning
Common Causes of Metabolic Alkalosis
• Hypokalemia
• Hypochloremia
• Gastric suctioning or vomiting
• Excessive administration of
corticosteroids
• Excessive administration of sodium
bicarbonate
• Diuretic therapy
• Hypovolemia
Table 7-5
Copyright © 2008
Thomson Delmar Learning
Metabolic Alkalosis with Respiratory Compensation
• The immediate compensatory response
to metabolic alkalosis is a decreased
ventilatory rate.
– This action causes the PaCO2 to rise
Copyright © 2008
Thomson Delmar Learning
Metabolic Alkalosis with Respiratory Compensation
• As the PCO2 increases, the H+
concentration increases
– This action works to offset the metabolic
alkalosis
– See Figure 7-8
73
Copyright © 2008
Thomson Delmar Learning
Metabolic Alkalosis with Respiratory Compensation
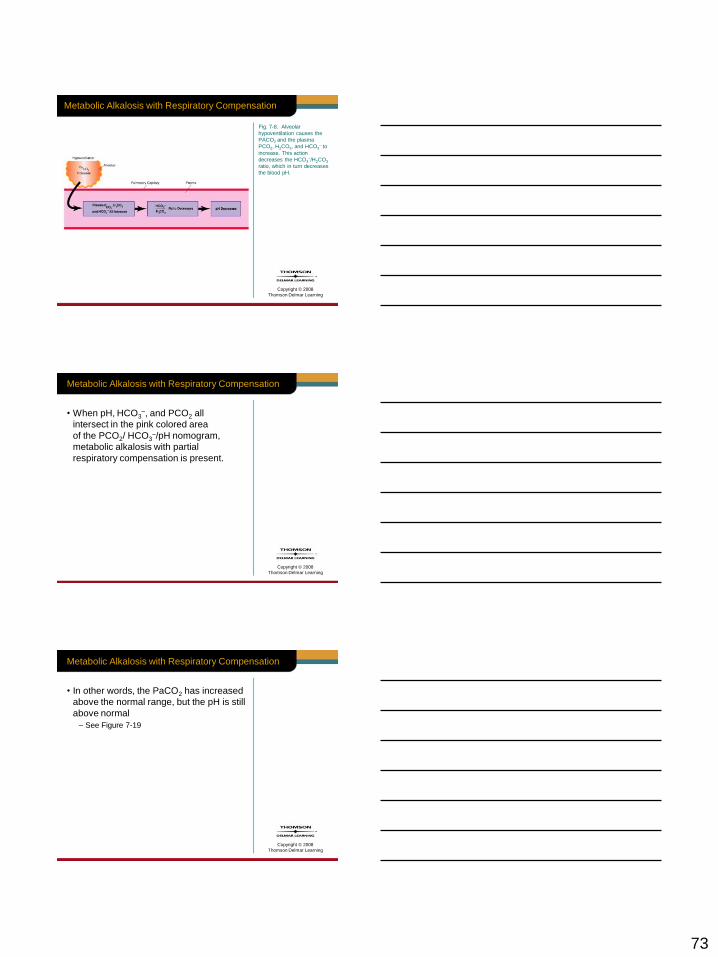
Fig. 7-8. Alveolar
hypoventilation causes the
PACO2 and the plasma
PCO2, H2CO3, and HCO3– to
increase. This action
decreases the HCO3–/H2CO3
ratio, which in turn decreases
the blood pH.
Copyright © 2008
Thomson Delmar Learning
Metabolic Alkalosis with Respiratory Compensation
• When pH, HCO3–, and PCO2 all
intersect in the pink colored area
of the PCO2/ HCO3–/pH nomogram,
metabolic alkalosis with partial
respiratory compensation is present.
Copyright © 2008
Thomson Delmar Learning
Metabolic Alkalosis with Respiratory Compensation
• In other words, the PaCO2 has increased
above the normal range, but the pH is still
above normal
– See Figure 7-19

74
Copyright © 2008
Thomson Delmar Learning
Metabolic Alkalosis with Respiratory Compensation
Figure 7-19. When the
pH, HCO3–, and PCO2 all
intersect in the pink colored
area of the PCO2/HCO3–/pH
nomogram, metabolic
alkalosis with partial
respiratory compensation
is present. For example,
when the PCO2 is 60 mm Hg,
at a time when the pH is 7.50
and the HCO3– is 46 mEq/L,
metabolic alkalosis with
partial respiratory
compensation is present.
Copyright © 2008
Thomson Delmar Learning
Metabolic Alkalosis with Complete Respiratory Compensation
• Metabolic alkalosis with complete
respiratory compensation is present
when the PaCO2 increases enough
to move the alkalotic pH back to the
normal range
– Which, in this case, would be above
65 to 68 mm Hg
– See Figure 7-19
Copyright © 2008
Thomson Delmar Learning
Metabolic Alkalosis with Complete Respiratory Compensation
Figure 7-19 When the
pH, HCO3–, and PCO2 all
intersect in the pink colored
area of the PCO2/HCO3–/pH
nomogram, metabolic
alkalosis with partial
respiratory compensation
is present. For example,
when the PCO2 is 60 mm Hg,
at a time when the pH is 7.50
and the HCO3– is 46 mEq/L,
metabolic alkalosis with
partial respiratory
compensation is present.
75
Copyright © 2008
Thomson Delmar Learning
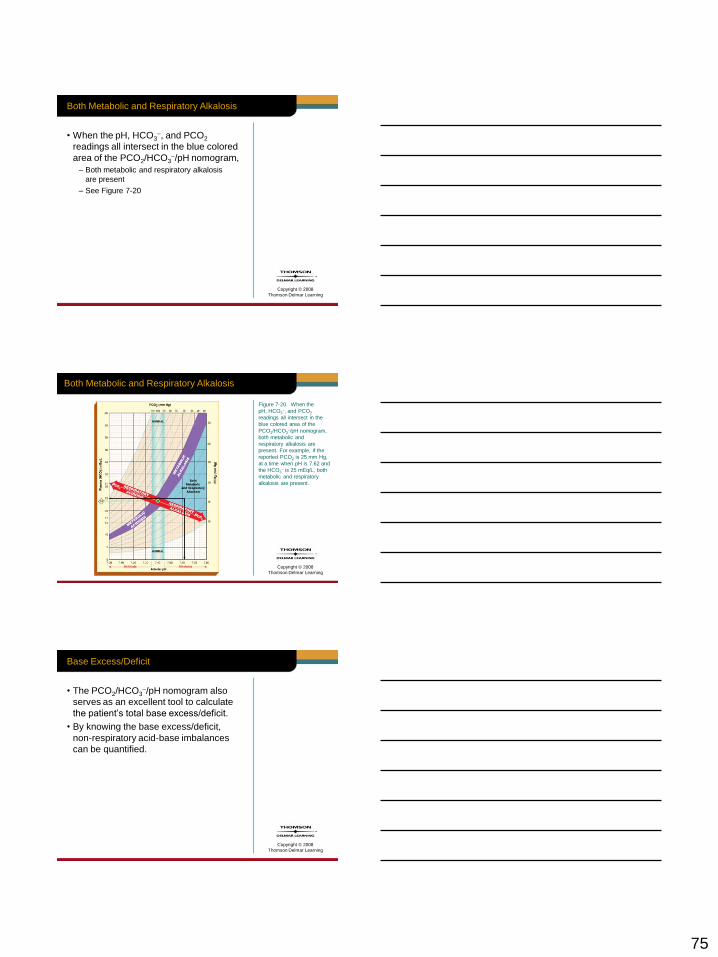
Both Metabolic and Respiratory Alkalosis
• When the pH, HCO3–, and PCO2
readings all intersect in the blue colored
area of the PCO2/HCO3–/pH nomogram,
– Both metabolic and respiratory alkalosis
are present
– See Figure 7-20
Copyright © 2008
Thomson Delmar Learning
Both Metabolic and Respiratory Alkalosis
Figure 7-20. When the
pH, HCO3–, and PCO2
readings all intersect in the
blue colored area of the
PCO2/HCO3–/pH nomogram,
both metabolic and
respiratory alkalosis are
present. For example, if the
reported PCO2 is 25 mm Hg,
at a time when pH is 7.62 and
the HCO3– is 25 mEq/L, both
metabolic and respiratory
alkalosis are present.
Copyright © 2008
Thomson Delmar Learning
Base Excess/Deficit
• The PCO2/HCO3–/pH nomogram also
serves as an excellent tool to calculate
the patient’s total base excess/deficit.
• By knowing the base excess/deficit,
non-respiratory acid-base imbalances
can be quantified.
76
Copyright © 2008
Thomson Delmar Learning
Base Excess/Deficit
• The base excess/deficit is reported in
milliequivalents per liter (mEq/L) of base
above or below the normal buffer line of
the PCO2/HCO3–/pH nomogram
Copyright © 2008
Thomson Delmar Learning
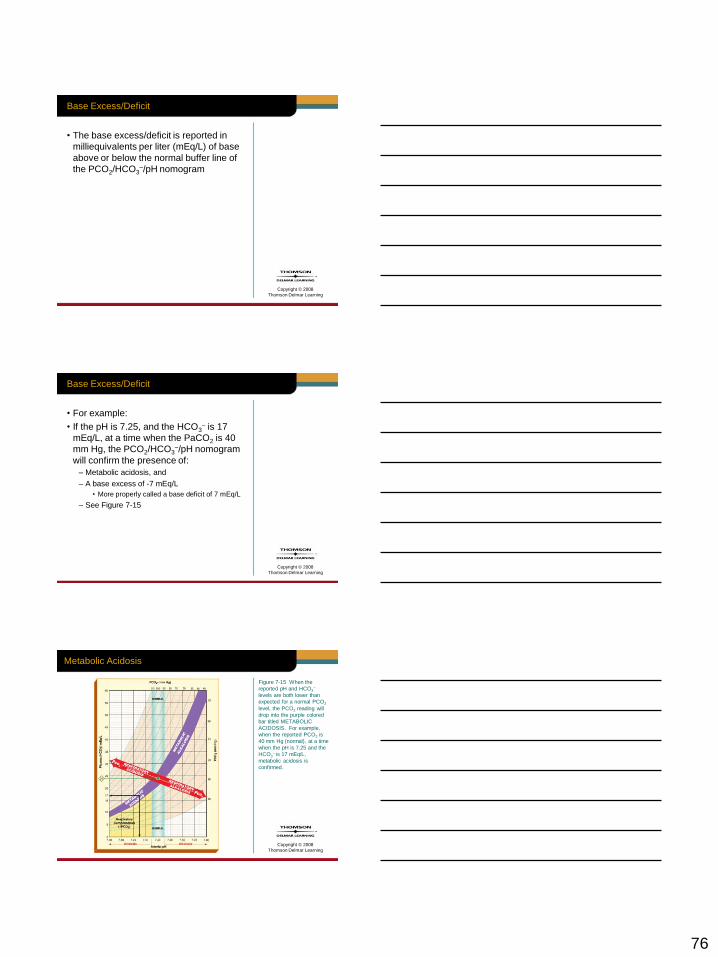
Base Excess/Deficit
• For example:
• If the pH is 7.25, and the HCO3– is 17
mEq/L, at a time when the PaCO2 is 40
mm Hg, the PCO2/HCO3–/pH nomogram
will confirm the presence of:
– Metabolic acidosis, and
– A base excess of -7 mEq/L
• More properly called a base deficit of 7 mEq/L
– See Figure 7-15
Copyright © 2008
Thomson Delmar Learning
Metabolic Acidosis
Figure 7-15 When the
reported pH and HCO3–
levels are both lower than
expected for a normal PCO2
level, the PCO2 reading will
drop into the purple colored
bar titled METABOLIC
ACIDOSIS. For example,
when the reported PCO2 is
40 mm Hg (normal), at a time
when the pH is 7.25 and the
HCO3– is 17 mEq/L,
metabolic acidosis is
confirmed.
77
Copyright © 2008
Thomson Delmar Learning
Base Excess/Deficit
• Metabolic acidosis may be treated by the
careful intravenous infusion of sodium
bicarbonate (NaHCO3)
Copyright © 2008
Thomson Delmar Learning
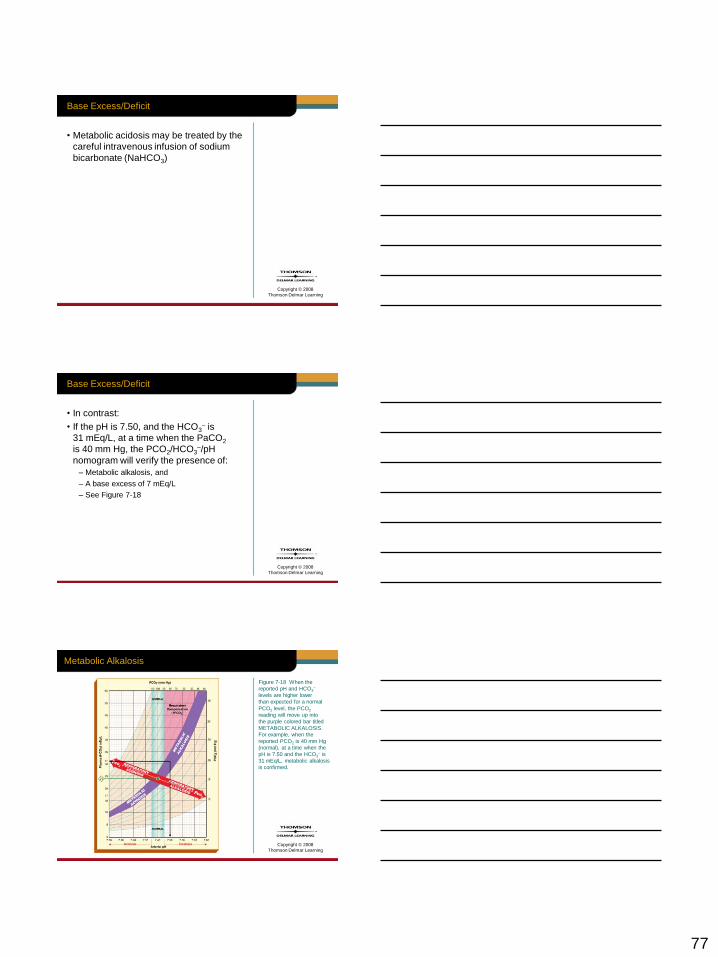
Base Excess/Deficit
• In contrast:
• If the pH is 7.50, and the HCO3– is
31 mEq/L, at a time when the PaCO2
is 40 mm Hg, the PCO2/HCO3–/pH
nomogram will verify the presence of:
– Metabolic alkalosis, and
– A base excess of 7 mEq/L
– See Figure 7-18
Copyright © 2008
Thomson Delmar Learning
Metabolic Alkalosis
Figure 7-18 When the
reported pH and HCO3–
levels are higher lower
than expected for a normal
PCO2 level, the PCO2
reading will move up into
the purple colored bar titled
METABOLIC ALKALOSIS.
For example, when the
reported PCO2 is 40 mm Hg
(normal), at a time when the
pH is 7.50 and the HCO3– is
31 mEq/L, metabolic alkalosis
is confirmed.
78
Copyright © 2008
Thomson Delmar Learning
Base Excess/Deficit
• Metabolic alkalosis is treated by:
– Correcting underlying electrolyte problem
• Namely, hypokalemia or hypochloremia
– Administering ammonium chloride (NH4Cl)
Copyright © 2008
Thomson Delmar Learning
Example of Clinical Use of PCO2/HCO3–/pH Nomogram
• It has been shown that the PCO2/ HCO3–
/pH nomogram is an excellent clinical tool
to confirm the presence of:
– Respiratory acid-base imbalances,
– Metabolic acid-base imbalances, or
– A combination of a respiratory and
metabolic acid-base imbalances
Copyright © 2008
Thomson Delmar Learning
Example of Clinical Use of PCO2/HCO3–/pH Nomogram
• The clinical application cases at the end
of this chapter further demonstrate the
clinical usefulness of the PCO2/HCO3–/pH
nomogram
79
Copyright © 2008
Thomson Delmar Learning
Clinical Application 1 Discussion
• How did this case illustrate …
– How clinical signs and symptoms can
sometimes be very misleading.
– How the PCO2/HCO3/pH nomogram can
be used to determine the cause of certain
findings of arterial blood gas analysis.
Copyright © 2008
Thomson Delmar Learning
Clinical Application 2 Discussion
• How did this case illustrate …
– PCO2/HCO3/pH nomogram can be used to
confirm both a respiratory and metabolic
acidosis.
– PCO2/HCO3/pH nomogram can be used to
prevent the unnecessary administration of
sodium bicarbonate during an emergency
situation.


![PowerPoint Presentationchemsanchez.weebly.com/uploads/5/8/3/5/58356363/day_4_problem… · (a) Calculate the hydroxide ion concentration, [OH–], of a 0.225–molar aqueous solution](https://img.pdfslide.net/doc/110x75/5ebddf246e8c986cf7066e82/powerpoint-pre-a-calculate-the-hydroxide-ion-concentration-oha-of-a-0225amolar.jpg)


![butane.chem.uiuc.edubutane.chem.uiuc.edu/flener/chem102sum06/pictures/chem102he3.pdfAs the hydroxide ion concentration of a solution increases, POH and the [H+] a) increases, decreases](https://img.pdfslide.net/doc/110x75/5e688f821a902f6684374206/as-the-hydroxide-ion-concentration-of-a-solution-increases-poh-and-the-h-a.jpg)


![CO corrosion of mild steel 7 - Ohio University corrosion of mild...order dependence on hydroxide ion concentration [13,15,29,30,32], in accordance with the “consecutive mechanism”](https://img.pdfslide.net/doc/110x75/5e4332ed2a4c2671287656cb/co-corrosion-of-mild-steel-7-ohio-corrosion-of-mild-order-dependence-on-hydroxide.jpg)