Embed Size (px)
Citation preview

Carbon Emission Reduction Carbon Emission Reduction OpportunitiesOpportunities
in California Transportationin California Transportation
CARB ChairCARB Chair’’s Seminars SeminarFeb. 13, 2008Feb. 13, 2008
Zack Subin, PhD CandidateZack Subin, PhD CandidateEnergy & Resources GroupEnergy & Resources Group
UC BerkeleyUC Berkeley

22
BackgroundBackground•• E3 is modeling electricity sector for CPUCE3 is modeling electricity sector for CPUC
–– Wanted to explore possibility of crossWanted to explore possibility of cross--sector sector trading with transportationtrading with transportation
•• My workMy work–– 4 person4 person--months / Masters Projectmonths / Masters Project–– Surprising resultsSurprising results
•• Synthesis of existing dataSynthesis of existing data•• Selection and combination of options into Selection and combination of options into
coherent supply curvescoherent supply curves

33
Goals for TodayGoals for Today•• IntroductionIntroduction
–– AB 32 ContextAB 32 Context–– ApproachApproach
•• Technology OptionsTechnology Options–– Sources, Assumptions, & ResultsSources, Assumptions, & Results
•• Supply Curves: MMT COSupply Curves: MMT CO22 & $ / tonne& $ / tonne•• DiscussionDiscussion
–– What does this mean for AB 32?What does this mean for AB 32?
•• Please hold questions and comments until the Please hold questions and comments until the end of the talk.end of the talk.
50 minute talk
Plenty of question time following the main presentation

44
ContextContext

55
NG0.5%Resid
5.2%
Other Petro0.7%
Elect. System Losses0.2%
Electricity0.1%
EtOH0.3%
Diesel13.9%
Jet Fuel18.5%
Gasoline60.7%
CA Transportation Energy Consumption, 2001
Source: BTS

66
What is a supply curve?What is a supply curve?
-$60
-$40
-$20
$0
$20
$40
$60
$80
$100
$120
0 10 20 30 40 50 60 70
Quantity: MMT CO2
Pric
e: $
/ to
nne
CO
2
Benefits: $1B
Costs: $2B
(Net: $1.4B Costs)Option A
Option B
Option C
Costs: $400M

77
Research GoalsResearch Goals
1)1) Determine technology options with Determine technology options with price & quantity of possible GHG price & quantity of possible GHG reductionsreductions
2)2) Stack from low cost to high cost, Stack from low cost to high cost, eliminate overlap, & combine into eliminate overlap, & combine into supply curvesupply curve
3)3) Assess the potential in the Assess the potential in the transportation sector: are lowtransportation sector: are low--cost cost options available after Pavley & the options available after Pavley & the LCFS?LCFS?

88
MethodsMethods
•• Literature ReviewLiterature Review–– CACA--specific data & forecasts when possiblespecific data & forecasts when possible
•• Spreadsheet ModelSpreadsheet Model–– First examine technologies separately, then First examine technologies separately, then
integrate into supply curvesintegrate into supply curves
•• 2010, 2020, & 20302010, 2020, & 2030•• Baselines: BAU & existing GHG standard Baselines: BAU & existing GHG standard
(Pavley + LCFS)(Pavley + LCFS)

99
Methods, ContMethods, Cont’’dd
•• Direct economic costs (conservative), ignoring:Direct economic costs (conservative), ignoring:–– TaxesTaxes–– Macroeconomic benefitsMacroeconomic benefits–– ExternalitiesExternalities
•• No transaction / No transaction / implementation costsimplementation costs
•• Use underlying dataUse underlying data•• Avoid speculative Avoid speculative
technologiestechnologies
1010
Analytical ChallengesAnalytical Challenges
•• Predictions are uncertainPredictions are uncertain–– Fuel prices (particularly gasoline)Fuel prices (particularly gasoline)–– New technology prices & performanceNew technology prices & performance–– Rate of new technology uptakeRate of new technology uptake
•• Economics sometimes very sensitive to Economics sometimes very sensitive to uncertaintiesuncertainties
•• Integration of separate options into coherent Integration of separate options into coherent supply curvessupply curves

1111
Preview of ResultsPreview of Results2020 Supply Curves
-$250
-$200
-$150
-$100
-$50
$0
$50
$100
$150
$200
$250
0 20 40 60 80 100 120 140 160 180
MMT CO2
$/t C
O2
After Pavley / LCFS BAU

1212
Key SourcesKey Sources
•• K.G. K.G. DuleepDuleep’’ss LDV Analysis for EEA (2006)LDV Analysis for EEA (2006)•• CEC Transportation Forecasts (2007) & CEC Transportation Forecasts (2007) &
Petroleum Reduction Options Study (2005)Petroleum Reduction Options Study (2005)•• LCFS Technical Analysis (2007)LCFS Technical Analysis (2007)•• CARB ZEV Report (2007) CARB ZEV Report (2007) •• IEA Global Biofuels Analysis (2004)IEA Global Biofuels Analysis (2004)•• ANLANL’’ss VISION ModelVISION Model•• Chris Chris SaricksSaricks’’ Truck Efficiency Analysis for Truck Efficiency Analysis for
ANL (2003)ANL (2003)

1313
Technology OptionsTechnology Options
•• LightLight--duty vehicles (LDVs)duty vehicles (LDVs)–– Incremental fuel efficiencyIncremental fuel efficiency–– HybridsHybrids–– PlugPlug--in hybridsin hybrids–– Alternative hydrocarbon fuelsAlternative hydrocarbon fuels
•• Natural GasNatural Gas•• BiofuelBiofuel
•• HeavyHeavy--duty vehicles (HDVs)duty vehicles (HDVs)–– Truck fuel efficiencyTruck fuel efficiency

1414
Other Options (not in this talk)Other Options (not in this talk)•• Transit / freight efficiency improvementsTransit / freight efficiency improvements•• Urban planning, driving discouragement policiesUrban planning, driving discouragement policies•• Not included in analysis:Not included in analysis:
–– Hydrogen carsHydrogen cars–– Advanced biofuelsAdvanced biofuels–– Size & performance reductionsSize & performance reductions–– Pure electric vehiclesPure electric vehicles
Switchgrass

1515
LightLight--Duty Vehicles: Duty Vehicles: Incremental Fuel EfficiencyIncremental Fuel Efficiency

1616
LDV Incremental Fuel EfficiencyLDV Incremental Fuel Efficiency
•• Confirms CARBConfirms CARB’’s 2004 Pavley s 2004 Pavley Analysis on reducing vehicle Analysis on reducing vehicle GHG emissionsGHG emissions
•• Different data setDifferent data set–– K.G. K.G. DuleepDuleep’’ss 2006 analysis at 2006 analysis at
EEAEEA–– CARB used NESCCAF, 2004CARB used NESCCAF, 2004
Fmr. Rep. Fran Pavley

1717
LDV Efficiency, Brief RundownLDV Efficiency, Brief Rundown
•• Excluding taxes is a stricter standardExcluding taxes is a stricter standard•• But gasoline prices have increased and But gasoline prices have increased and
technology price estimates decreasedtechnology price estimates decreased•• Technologies include transmission, valvetrain, Technologies include transmission, valvetrain,
fuel injection, cylinders, electrical system, fuel injection, cylinders, electrical system, aerodynamics, tires, etc.aerodynamics, tires, etc.
•• No change in vehicle performance & interior No change in vehicle performance & interior volumevolume

1818
Example of Example of DuleepDuleep’’ss DataDataFuel Economy Increase Cost Curve
Small Car Domestic Standard (EEA, 2006)
$0$500
$1,000$1,500$2,000$2,500$3,000$3,500$4,000$4,500
0% 20% 40% 60%
Percent MPG Increase
Incr
ease
in R
PE (2
005
$US) EEA Data
PredictedNAS CompactNAS Subcompact
Provided by David Greene, Oak Ridge National Lab

1919
Sources & AssumptionsSources & Assumptions•• CEC 2007 IEPR Transportation Energy CEC 2007 IEPR Transportation Energy
Forecast providesForecast provides–– forecasted gasoline pricesforecasted gasoline prices–– fleet sizes (~30M)fleet sizes (~30M)–– VMT (~13K mi/yr, per vehicle)VMT (~13K mi/yr, per vehicle)–– baseline fuel efficiencies (~21 mpg)baseline fuel efficiencies (~21 mpg)
•• LCFS Technical Analysis provides gasoline LCFS Technical Analysis provides gasoline carbon intensity (including upstream carbon intensity (including upstream emissions)emissions)

2020
Sources & Assumptions, ContSources & Assumptions, Cont’’dd
•• CARBCARB’’s Pavley Analysis provides operating s Pavley Analysis provides operating lifetime (16 yr) and discount rate (5% real)lifetime (16 yr) and discount rate (5% real)
•• Supply curve based on lifetime emissions Supply curve based on lifetime emissions reductions associated with a particular reductions associated with a particular yearyear’’s new saless new sales–– Simplifies fleet analysisSimplifies fleet analysis–– Since we donSince we don’’t know how to change VMT t know how to change VMT
(without a big gasoline tax), vehicle purchase is (without a big gasoline tax), vehicle purchase is the key time for policy interventionthe key time for policy intervention

2121
CEC Gasoline Price Forecasts
$0.00
$0.50
$1.00
$1.50
$2.00
$2.50
$3.00
$3.50
2010 2015 2020 2025 2030
$/ga
l, Pr
e-Ta
x
LowMedHigh

2222
Supply Curve for LDV FE, Long Term (2025)
-$300
-$200
-$100
$0
$100
$200
$300
$400
0 20 40 60 80 100
MMT CO2
$ / M
T C
O2 Pavley Reduction
CEC Base Case Improvement
Long Term (~2025) Supply of Emission Reductions from LDVs, without Hybrids or Alternative Fuels
About $10B Savings

2323
You may be wonderingYou may be wondering……•• If these emission reductions pay for If these emission reductions pay for
themselves, why wonthemselves, why won’’t the free t the free market take care of it?market take care of it?
•• High upHigh up--front capitalfront capital–– Both for consumers & manufacturersBoth for consumers & manufacturers
•• Consumers fail to discount future Consumers fail to discount future fuel savings at market rates.fuel savings at market rates.

2424
HybridHybrid--Electric VehiclesElectric Vehicles

2525
HybridHybrid--Electric Vehicles (HEVs)Electric Vehicles (HEVs)•• Literature suggests $4000 incremental capital Literature suggests $4000 incremental capital
cost for a 40% fuel consumption reductioncost for a 40% fuel consumption reduction•• Possible penetration in 2020: 75% (for supply Possible penetration in 2020: 75% (for supply
curves)curves)
2007 Ford Escape Hybrid

2626
Example of Analysis: 2020 HEVs, Example of Analysis: 2020 HEVs, BAU BaselineBAU Baseline
InputsItem ValueLight Duty Vehicle Fleet Size (millions) 32.0Baseline Fleet Average Fuel Economy (mpg) 21.8Baseline Fleet Annual VMT / vehicle 13,050Gasoline Carbon Intensity (g CO2 / MJ) 92.8Gasoline Energy Intensity (MJ / gal) 121.0Percentage of Fleet with Upgraded Fuel Eff. 100%Upgraded Fuel Consumption Reduction 40.0%Gasoline Price (Excluding Tax, $ / gal) $2.05Capital Increment per Efficient Vehicle $4,000Discount Rate 5.0%Operating Lifetime of Vehicle (yr) 16

2727
2020 HEVs, BAU Baseline2020 HEVs, BAU BaselineOutputsBaselinesBaseline Fleet Specific Fuel Consumption (gal/mi) 0.0460Baseline Fleet VMT (billion miles) 417.6Baseline Fleet Fuel Consumption (billion gallons) 19.2Baseline Fleet CO2 Emissions (MMT) 215.6Baseline Vehicle Emission Intensity (g CO2 / mi) 516New FleetCO2 Reduction for Eff. Vehicle (%) 40.0%New Fleet CO2 Reduction (%) 40.0%New Fleet CO2 Reduction (MMT) 86.2New Fleet Gasoline Consumption (billion gallons) 11.5Avoided Gasoline Consumption (billion gal) 7.7CostsFuel Savings ($M) $15,744.0Annualized Vehicle Capital Costs per Vehicle $351.50Annualized Fleet Vehicle Capital Costs ($M) $11,248.1Net Total Costs ($M) -$4,495.9Abatement Costs in $/tonne CO2 -$52

2828
PlugPlug--In Hybrid Electric In Hybrid Electric VehiclesVehicles

2929
PlugPlug--in Hybrids in Hybrids (PHEVs)(PHEVs)
•• Batteries: primary driverBatteries: primary driver
•• CARBCARB’’s 2007 ZEV Study: extensive battery s 2007 ZEV Study: extensive battery technology analysistechnology analysis–– With confidential company questionnaires, verified by With confidential company questionnaires, verified by
their engineers, etc.their engineers, etc.
•• $300$300--$700 / kWh$700 / kWh–– Need about 7Need about 7--8 kWh for PHEV 208 kWh for PHEV 20

3030
BatteriesBatteries
•• LiLi--ion batteries have many chemistriesion batteries have many chemistries•• Each chemistry has its own advantagesEach chemistry has its own advantages•• A123 (Watertown, MA) makes Li FePOA123 (Watertown, MA) makes Li FePO44
batteriesbatteries–– Safe, durable & powerfulSafe, durable & powerful

3131
Battery Comparison ChartBattery Comparison Chart
Chemistry
EnergyPow
erC
ostLife
Stab. / SafetyD
evelopment
LiCoO2 + x x +Li(Ni-Co-Al)O2 (NCA) +Li(Ni-Co-Mn)O2 (NCM) +LiMnO2 (LMS) + + x*LiFePO4 + x* + +Li-Polymer + + + + + xNiMH x x x + + +
*Potential for improvement

3232
BatteriesBatteries
•• Biggest remaining Biggest remaining challenges:challenges:–– CostCost–– Calendar lifeCalendar life
•• (But PHEV 20 (But PHEV 20 PHEV 16 PHEV 16 isnisn’’t so bad)t so bad)
GM Volt

3333
PHEVs, PHEVs, ConclusionConclusion
•• Advantages of PHEVsAdvantages of PHEVs–– Clean electricity in CAClean electricity in CA
•• Cheap offCheap off--peak nightpeak night--time charging opportunitytime charging opportunity
–– Large electric drivetrain efficiency advantageLarge electric drivetrain efficiency advantage–– When in gasoline mode, still runs like a regular hybridWhen in gasoline mode, still runs like a regular hybrid–– PHEV 20 saves about 50% of COPHEV 20 saves about 50% of CO22 (NGCC electricity)(NGCC electricity)
•• $0.07 / kWh electricity is like $0.54 / gallon gasoline.$0.07 / kWh electricity is like $0.54 / gallon gasoline.•• PHEVs are likely to be economic well before 2020.PHEVs are likely to be economic well before 2020.
LADWP NGCC Plant

3434
Compressed Natural Gas Compressed Natural Gas VehiclesVehicles

3535
Compressed Natural Gas (CNG)Compressed Natural Gas (CNG)•• NG: less carbon per unit energy than gasolineNG: less carbon per unit energy than gasoline
–– About 20About 20--30% reduction in practice (LCFS, 2007)30% reduction in practice (LCFS, 2007)–– Depends upon fugitive methane emissions & Depends upon fugitive methane emissions &
relative drivetrain efficiencyrelative drivetrain efficiency–– Sources disagree somewhatSources disagree somewhat
•• Already used extensively in New DelhiAlready used extensively in New Delhi–– Lower criteria pollutant emissionsLower criteria pollutant emissions

3636
CNG LDVs, ContCNG LDVs, Cont’’dd
•• Need storage tank, moderate engine Need storage tank, moderate engine modification, and fueling infrastructuremodification, and fueling infrastructure–– Distribution infrastructure already existsDistribution infrastructure already exists–– Stations or home refueling < $2000 / vehicleStations or home refueling < $2000 / vehicle
•• Main source: CEC Pet. Red. Opt. Study (2005)Main source: CEC Pet. Red. Opt. Study (2005)•• Suggestion for incremental capital cost:Suggestion for incremental capital cost:
–– $4800 to $6400 initially$4800 to $6400 initially–– $2600 to $5300 after moderate mass production$2600 to $5300 after moderate mass production–– Zero ultimately.Zero ultimately.
•• Assume moderate production by 2020Assume moderate production by 2020

3737
CNG LDVs, ConclusionCNG LDVs, Conclusion•• Like electricity, NG is a cheap vehicle fuelLike electricity, NG is a cheap vehicle fuel•• 1.15 therm (0.115 MMBTU) = 1 gallon gasoline 1.15 therm (0.115 MMBTU) = 1 gallon gasoline
equivalentequivalent•• $8/MMBTU NG = $0.92 gasoline (plus markup)$8/MMBTU NG = $0.92 gasoline (plus markup)•• Solid economics, moderate COSolid economics, moderate CO22 reductionreduction

3838
EthanolEthanol

3939
EthanolEthanol
•• Grain ethanol (e.g. US corn): marginal Grain ethanol (e.g. US corn): marginal at bestat best•• Sugarcane ethanol is superior economically and Sugarcane ethanol is superior economically and
environmentallyenvironmentally•• Cellulosic ethanolCellulosic ethanol
–– Close to commercialization?Close to commercialization?–– Energy crops on dedicated landEnergy crops on dedicated land–– OrOr wastes & wastes & agag residuesresidues
•• Might be eclipsed by butanol, FT diesel, Might be eclipsed by butanol, FT diesel, ““renewablerenewable””gasoline / diesel, algal biodiesel, etc.gasoline / diesel, algal biodiesel, etc.–– EthanolEthanol’’s tendency to mix with water makes it incompatible with s tendency to mix with water makes it incompatible with
existing fuel distribution infrastructure.existing fuel distribution infrastructure.–– Requires lots of energy for distillationRequires lots of energy for distillation

4040
IEA 2004 Biofuels StudyIEA 2004 Biofuels Study

4141
Land Use DebateLand Use Debate•• But more recently, analysts But more recently, analysts
have focused on the land have focused on the land use problem.use problem.
•• Corn, soy, & wheat prices Corn, soy, & wheat prices have nearly doubled in the have nearly doubled in the last year!last year!–– US ethanol policyUS ethanol policy–– Chinese meat consumptionChinese meat consumption
•• Bad for urban poorBad for urban poor•• Increases pressure to cut Increases pressure to cut
down rainforestdown rainforest•• 15 g CO15 g CO22 / MJ penalty for / MJ penalty for
sugarcanesugarcaneClearing in Amazon

4242
Brazilian Sugarcane EthanolBrazilian Sugarcane Ethanol
•• Proxy in the supply curveProxy in the supply curve–– Land use concernsLand use concerns–– Politics: $0.50 / gallon import tariffPolitics: $0.50 / gallon import tariff–– But commercially viable nowBut commercially viable now
•• Ethanol production cost in Brazil as low as $1.08 / Ethanol production cost in Brazil as low as $1.08 / gallon gasoline equivalent.gallon gasoline equivalent.–– Price in 1990 (in 2007$) was $1.89.Price in 1990 (in 2007$) was $1.89.–– Not counting import costsNot counting import costs–– Consumer not likely to see production cost savingsConsumer not likely to see production cost savings

4343
Ethanol EconomicsEthanol Economics•• >10,000 gallons of fuel over vehicle life>10,000 gallons of fuel over vehicle life
–– Fuel price relative to gasoline: main driverFuel price relative to gasoline: main driver
•• $0.10 shift in fuel price = $694 in capital$0.10 shift in fuel price = $694 in capital–– Enough to pay for flex fuel vehicle capital & Enough to pay for flex fuel vehicle capital &
substantial fueling infrastructure.substantial fueling infrastructure.–– CEC: FFV is only $200CEC: FFV is only $200--$400 more$400 more
•• Some advanced biofuels: no need for Some advanced biofuels: no need for anyany infrastructure changeinfrastructure change
$
4444
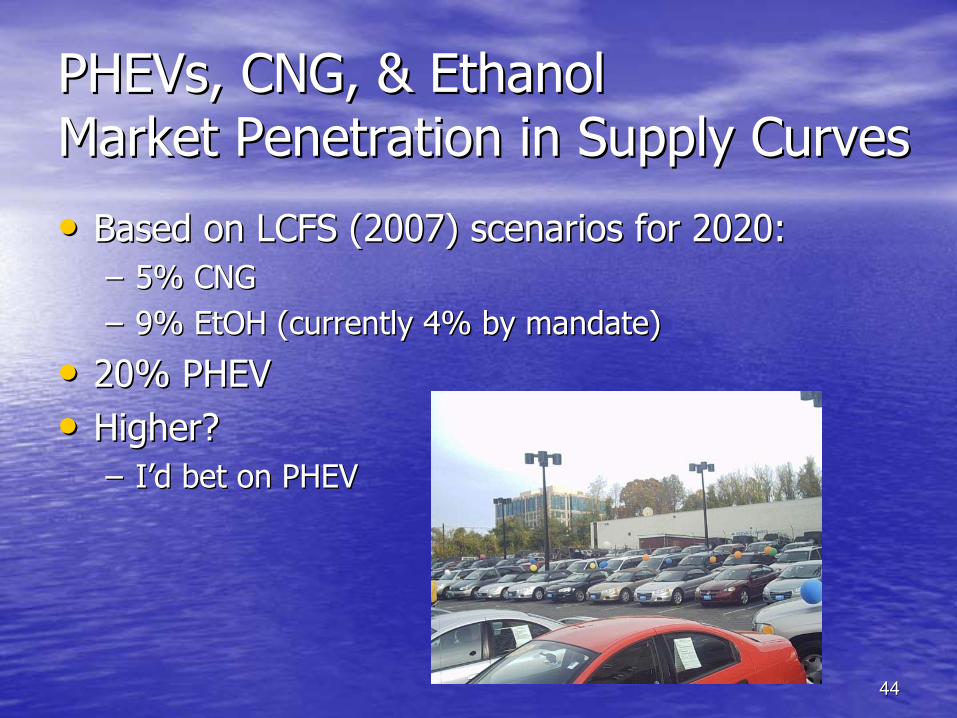
PHEVs, CNG, & EthanolPHEVs, CNG, & EthanolMarket Penetration in Supply CurvesMarket Penetration in Supply Curves
•• Based on LCFS (2007) scenarios for 2020:Based on LCFS (2007) scenarios for 2020:–– 5% CNG5% CNG–– 9% 9% EtOHEtOH (currently 4% by mandate)(currently 4% by mandate)
•• 20% PHEV20% PHEV•• Higher?Higher?
–– II’’d bet on PHEVd bet on PHEV

4545
Truck Truck Fuel Fuel
EfficiencyEfficiency

4646
Truck Fuel Truck Fuel EfficiencyEfficiency
•• Chris Chris SaricksSaricks et al, ANL, 2003et al, ANL, 2003•• Provides incremental capital cost and fuel Provides incremental capital cost and fuel
consumption reductionconsumption reduction–– Dozen technologies Dozen technologies –– 4 classes of truck4 classes of truck–– 3 used here: heavy diesel, medium (73 used here: heavy diesel, medium (7--13 tons) 13 tons)
diesel, & medium gasolinediesel, & medium gasoline
•• For heavy diesel, 41.1% reduction at $21KFor heavy diesel, 41.1% reduction at $21K

4747
Truck Fuel Efficiency, ContTruck Fuel Efficiency, Cont’’dd
•• Additional sources / assumptions:Additional sources / assumptions:–– Fleet data from ANL VISION Model (Scaled to Fleet data from ANL VISION Model (Scaled to
California based on population)California based on population)–– Diesel C Intensity from LCFS Tech. Rep. (2007)Diesel C Intensity from LCFS Tech. Rep. (2007)–– 20 yr Lifetime based on VISION fleet data20 yr Lifetime based on VISION fleet data–– Diesel Price from CEC ForecastDiesel Price from CEC Forecast
•• Population scaling Population scaling overestimateoverestimate–– StateState’’s geography s geography refueling outside of CArefueling outside of CA–– Best if done as regional policyBest if done as regional policy

4848
Supply Supply CurvesCurves
4949
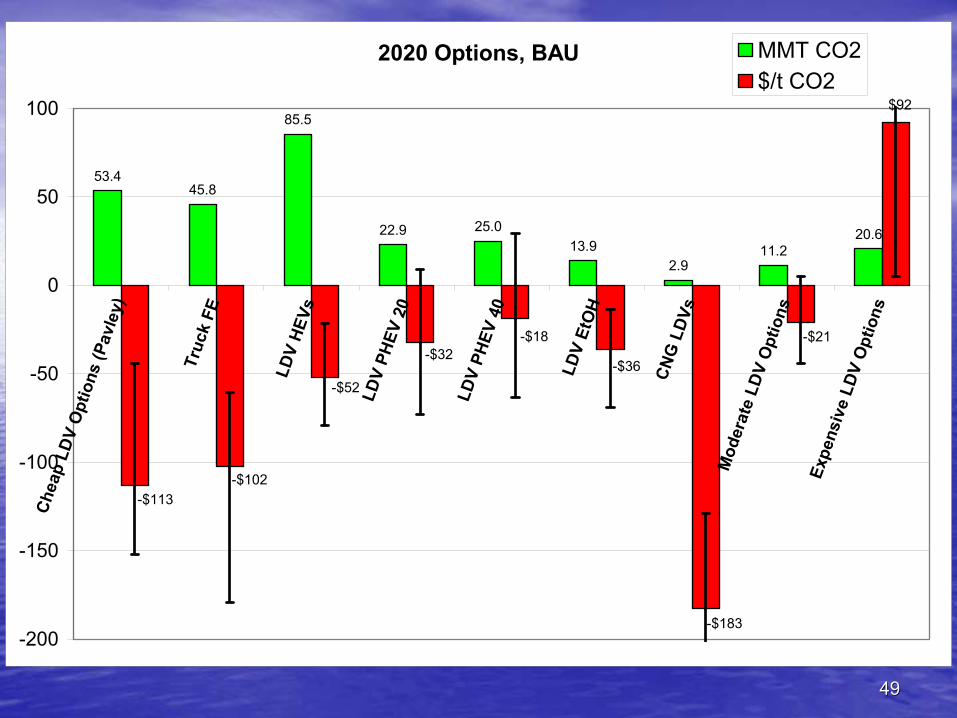
2020 Options, BAU
53.445.8
85.5
22.9 25.013.9
2.911.2
20.6
$92
-$21
-$183
-$36
-$18-$32
-$52
-$102-$113
-200
-150
-100
-50
0
50
100
Chea
p LD
V O
ptio
ns (P
avle
y)
Truc
k FE
LDV
HEVs
LDV
PHEV
20
LDV
PHEV
40
LDV
EtO
H
CNG
LDV
s
Mod
erat
e LD
V O
ptio
ns
Expe
nsiv
e LD
V O
ptio
ns
MMT CO2$/t CO2

5050
2020 Supply Curves
-$250
-$200
-$150
-$100
-$50
$0
$50
$100
$150
$200
$250
0.0 20.0 40.0 60.0 80.0 100.0 120.0 140.0 160.0 180.0
MMT CO2
$/t C
O2
Pavley Trucks
Hybrids
CNG
BAU
Ethanol
2020 Supply Curves
-$250
-$200
-$150
-$100
-$50
$0
$50
$100
$150
$200
$250
0.0 20.0 40.0 60.0 80.0 100.0 120.0 140.0 160.0 180.0
MMT CO2
$/t C
O2
Post Pavley / LCFS
BAU
Trucks
Hybrids
Trucks
Hybrids

5151
2020 Supply Curve (Beyond Pavley / LCFS) Gas Price Sensitivity
-$250
-$200
-$150
-$100
-$50
$0
$50
$100
$150
$200
$250
0.0 20.0 40.0 60.0 80.0 100.0 120.0
MMT CO2
$/t C
O2
Low Gasoline Price
High Gasoline Price

5252
2020 Supply Curve (Beyond Pavley / LCFS), Sensitivity to Tech Development / Market Penetration / Price
-$150
-$100
-$50
$0
$50
$100
$150
$200
$250
0.0 20.0 40.0 60.0 80.0 100.0 120.0 140.0
MMT CO2
$/t C
O2
Poor Tech Dev.
Good Tech Dev.

5353
2020 Supply of GHG Abatement, Beyond Pavley / LCFS
0.0
20.0
40.0
60.0
80.0
100.0
120.0
140.0
Base Low Gas Price High Gas Price Poor Tech Dev Good Tech Dev
MM
T C
O2
$0 to $50< $0

5454
What does this mean?What does this mean?•• Additional transportation policies / Additional transportation policies /
regulations could contribute significantly regulations could contribute significantly to AB 32 goals.to AB 32 goals.
•• Even if Pavley and the LCFS are fully Even if Pavley and the LCFS are fully implemented, significant low cost or implemented, significant low cost or negative cost opportunities remain.negative cost opportunities remain.
•• At the very least, further research should At the very least, further research should be done by the state as part of the AB 32 be done by the state as part of the AB 32 process.process.

5555
Possible Policy Options?Possible Policy Options?•• Pavley 2Pavley 2•• Hybrid mandate / subsidyHybrid mandate / subsidy•• Resurrect the ZEV requirement (& include Resurrect the ZEV requirement (& include
PHEVs)PHEVs)•• Include transport fuels in a cap & tradeInclude transport fuels in a cap & trade
–– Lee Friedman is working on this.Lee Friedman is working on this.•• Feebates (now under discussion)Feebates (now under discussion)•• Low interest loans (to cover extra purchase Low interest loans (to cover extra purchase
cost: $1cost: $1--5K) for efficient / alternative fuel 5K) for efficient / alternative fuel vehicles, to be paid back with fuel savingsvehicles, to be paid back with fuel savings

5656
AcknowledgementsAcknowledgements
•• CPUC & CARB funding for E3 electricity CPUC & CARB funding for E3 electricity sector modelingsector modeling
•• Jim Williams, Jim Williams, RenRen OransOrans, & other E3 Staff, & other E3 Staff•• Prof. Alex Farrell for commentsProf. Alex Farrell for comments•• CARB tuition grant for last fallCARB tuition grant for last fall•• Dr. Robert SawyerDr. Robert Sawyer

5757
Further InfoFurther Info
•• Working Paper available on webWorking Paper available on web•• Energy PolicyEnergy Policy draft in progressdraft in progress•• Contact Contact [email protected]@berkeley.edu