Embed Size (px)
Citation preview
Carbon & Energy Utilization
OCN 621
Lecture Outline1) Materials Balance Approach defined2) Sloppy Feeding3) Egestion: as relates to Assimilation efficiency4) Metabolism: Allometric Equation
1) Temperature dependency2) Activity level3) Specific Dynamic Action4) Excretion
5) Growth
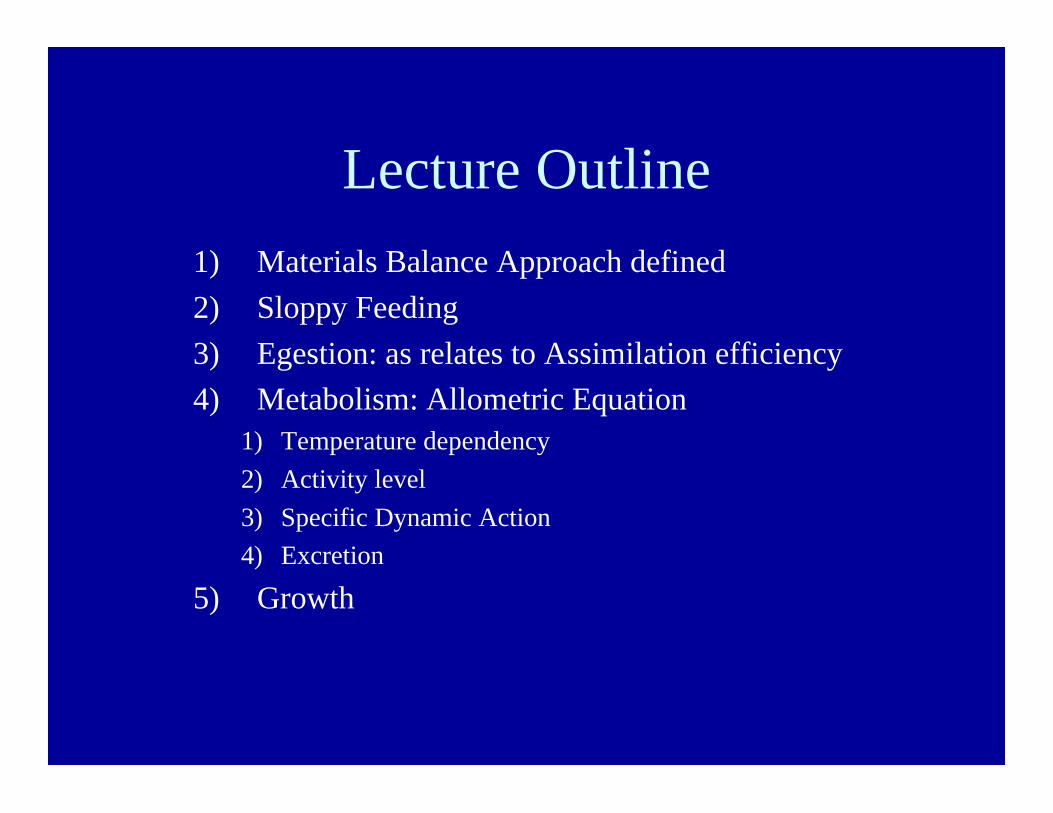
PREDATOR
PREY
SF
E
I A
G + R
M
SF = sloppy feedingI = ingestion = E + AA = assimilation = absorbed across gut wallE = egestion = organic loss to defecation (DOM)M = metabolism = loss as small MW organics (DIM)G = growthR = reproduction
Materials Balance Approach
R = reproduction (metazoans)R = reproduction (metazoans)
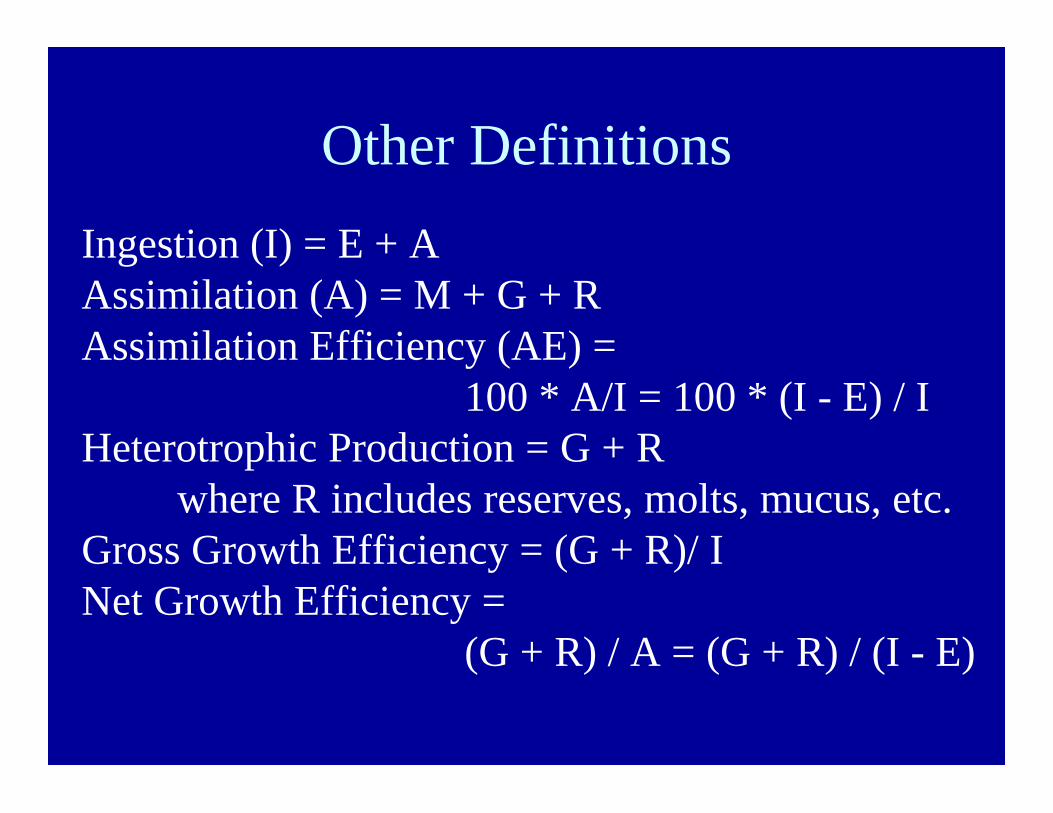
Other DefinitionsIngestion (I) = E + AAssimilation (A) = M + G + RAssimilation Efficiency (AE) =
100 * A/I = 100 * (I - E) / IHeterotrophic Production = G + R
where R includes reserves, molts, mucus, etc.Gross Growth Efficiency = (G + R)/ INet Growth Efficiency =
(G + R) / A = (G + R) / (I - E)
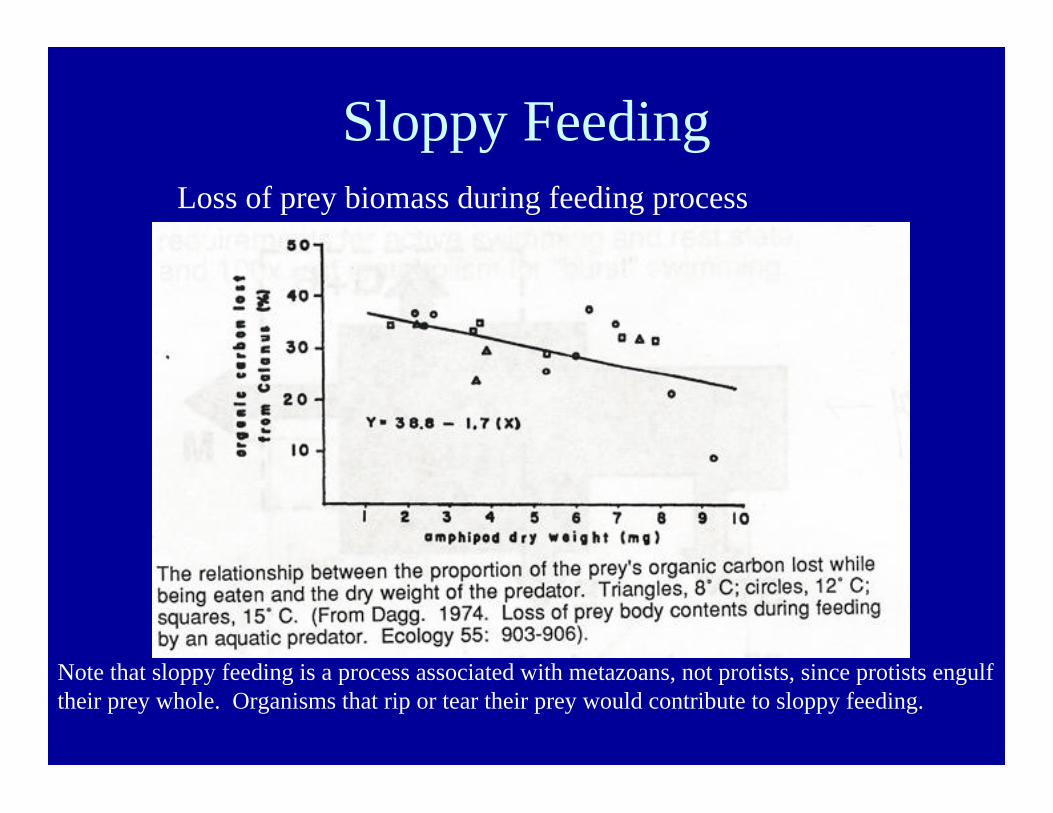
Sloppy FeedingLoss of prey biomass during feeding process
Note that sloppy feeding is a process associated with metazoans, not protists, since protists engulftheir prey whole. Organisms that rip or tear their prey would contribute to sloppy feeding.
Sloppy Feeding, continued
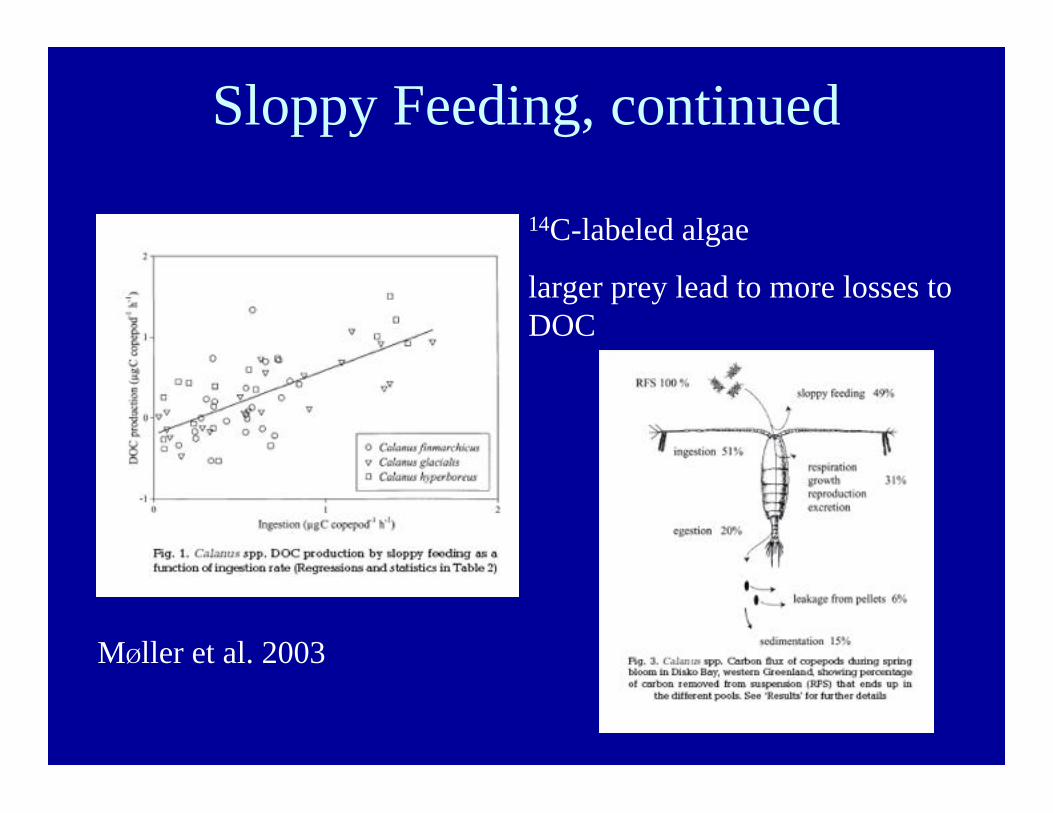
MØller et al. 2003
14C-labeled algae
larger prey lead to more losses toDOC
Egestion
Losses of non-digestable or partially digestedmaterial prior to assimilation
• This material becomes part of the detrituspool in the euphotic zone (DOM), or
• It is lost from euphotic zone as fecaltransport (fecal pellets)
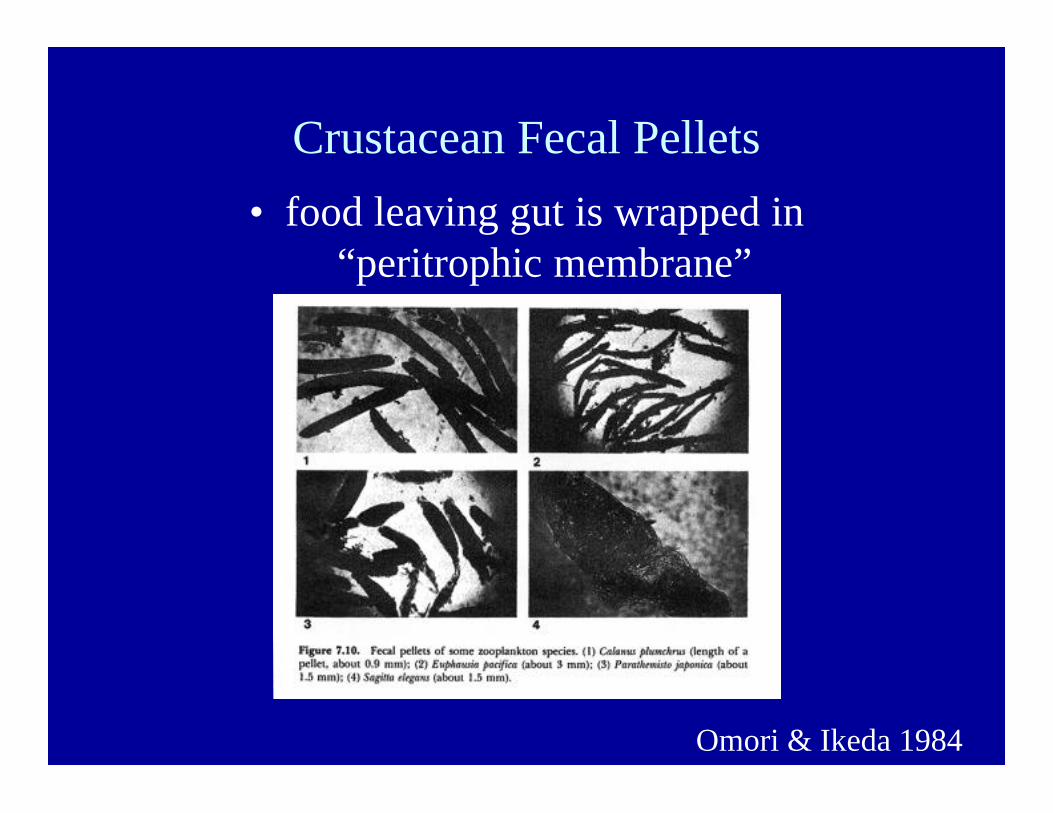
Crustacean Fecal Pellets• food leaving gut is wrapped in
“peritrophic membrane”
Omori & Ikeda 1984
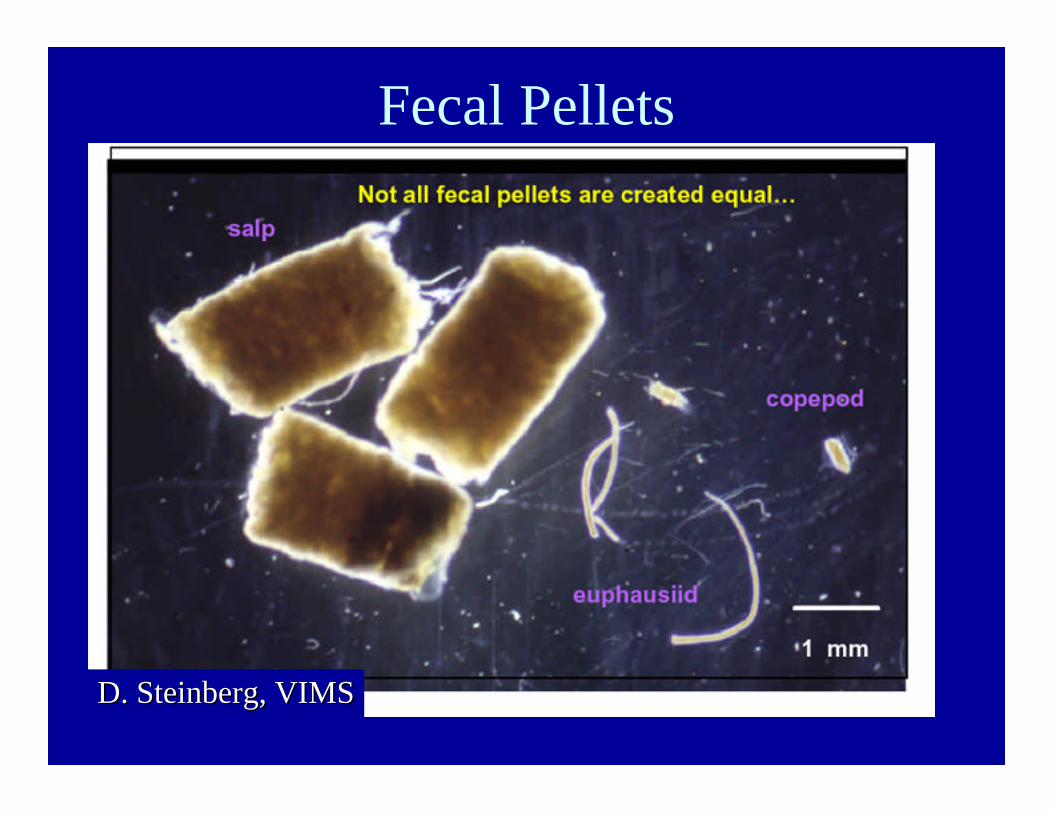
Fecal Pellets
D. Steinberg, VIMSD. Steinberg, VIMS
“Marine snow”• amorphous marine aggregates, 0.5 mm or larger in
diameter• derived from discarded “body” material (apps,
pteropod webs, fecal pellets, senescent diatoms)• combines with other phytoplankton, fecal material,
micro-organisms, inorganic particles• forms larger particles
– food source (copepods, fish, jellies)– carbon flux source (higher density)
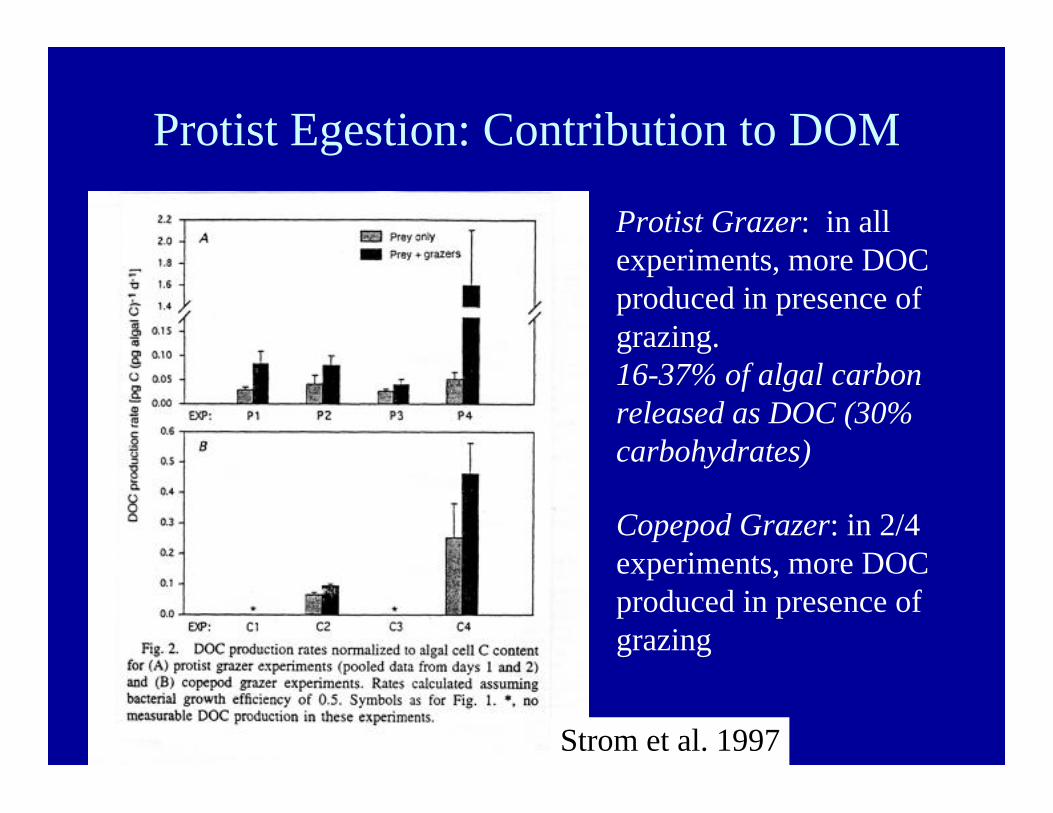
Protist Egestion: Contribution to DOM
Strom et al. 1997
Protist Grazer: in allexperiments, more DOCproduced in presence ofgrazing.16-37% of algal carbonreleased as DOC (30%carbohydrates)
Copepod Grazer: in 2/4experiments, more DOCproduced in presence ofgrazing
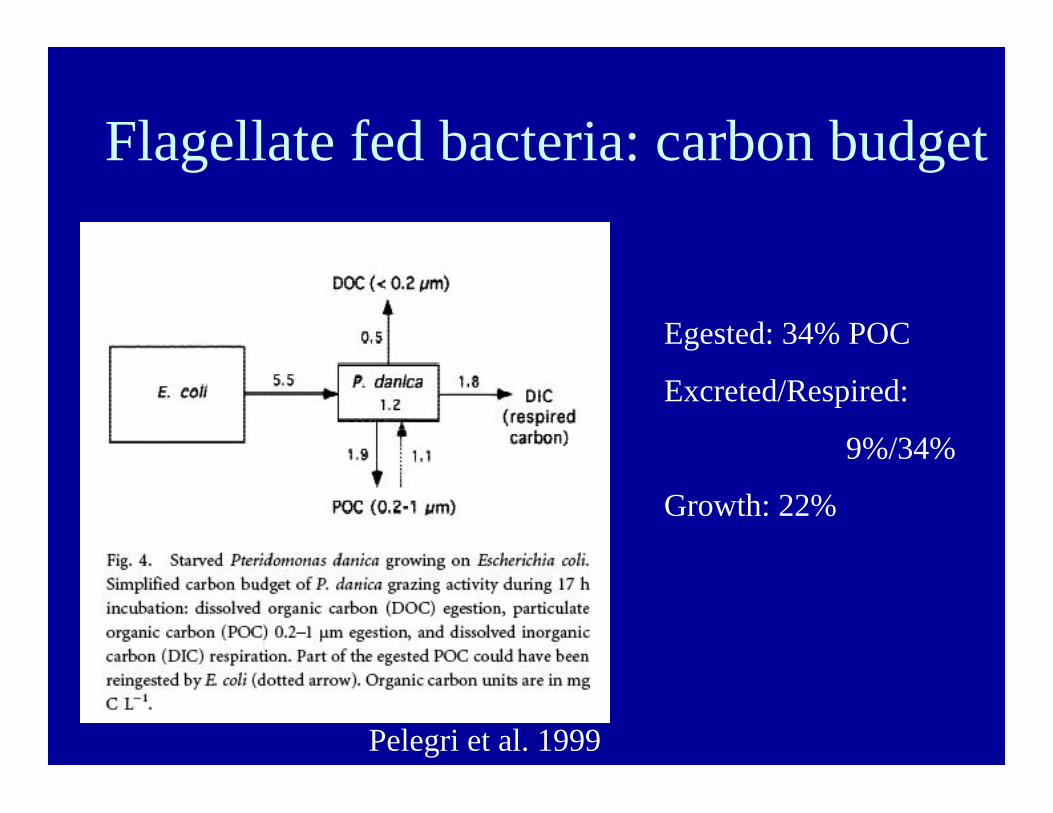
Flagellate fed bacteria: carbon budget
Pelegri et al. 1999
Egested: 34% POC
Excreted/Respired:
9%/34%
Growth: 22%
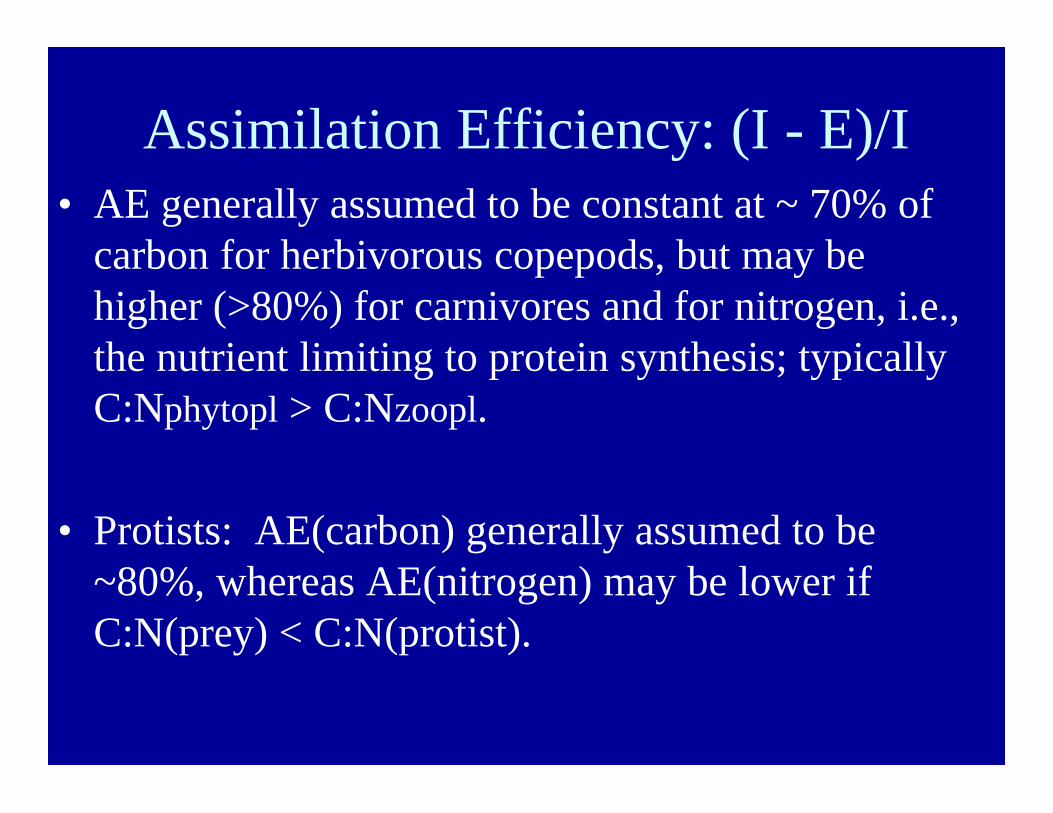
Assimilation Efficiency: (I - E)/I• AE generally assumed to be constant at ~ 70% of
carbon for herbivorous copepods, but may behigher (>80%) for carnivores and for nitrogen, i.e.,the nutrient limiting to protein synthesis; typicallyC:Nphytopl > C:Nzoopl.
• Protists: AE(carbon) generally assumed to be~80%, whereas AE(nitrogen) may be lower ifC:N(prey) < C:N(protist).
MetabolismDefined as: all energy transformations, chemical
reactions and pathways that make possible theproperties of living organisms
Measured as: the Respiration Rate, assumes allorganism’s energy comes from the oxidation of organicto inorganic constituents with release of chemicalenergy.
Products: CO2, H2O, and depending upon substrate: NH4, PO4
Excretion of inorganic nutrients or low MW organics istied to respiration
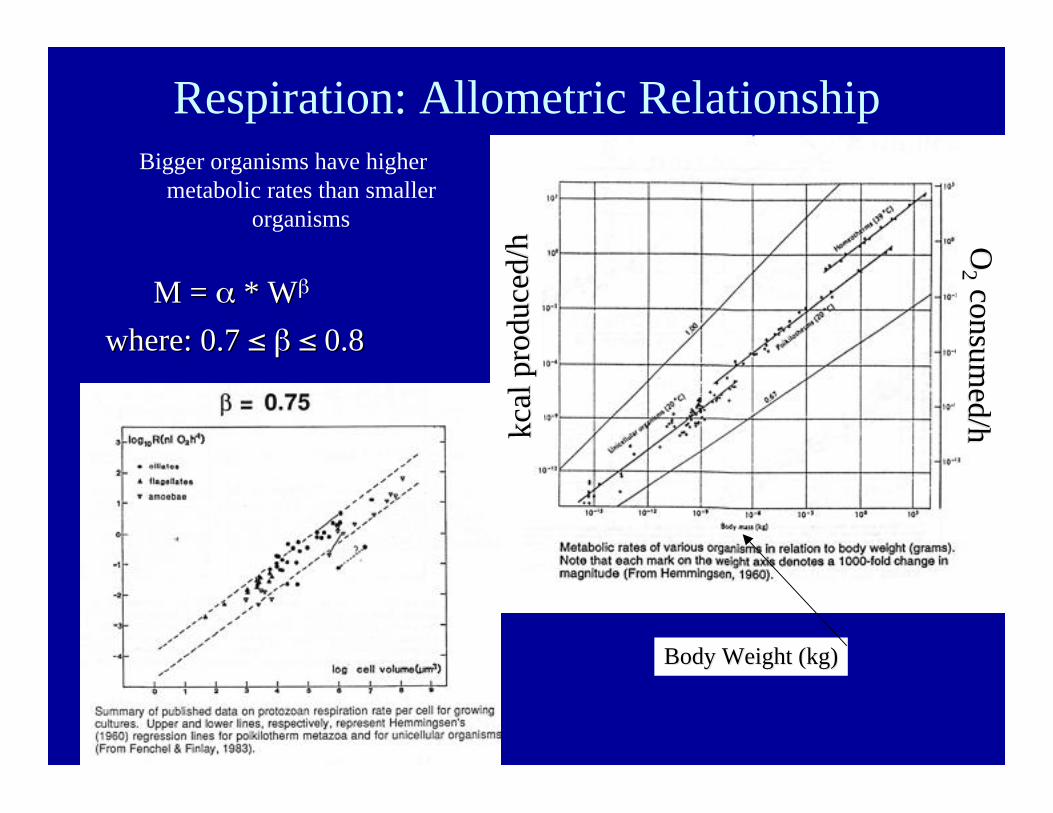
Respiration: Allometric RelationshipBigger organisms have higher
metabolic rates than smallerorganisms
M =M = α α * * WWββ
where: 0.7 where: 0.7 ≤≤ ββ ≤≤ 0.8 0.8
kcal
pro
duce
d/h
kcal
pro
duce
d/h O O
2 2 consumed/h
consumed/h
Body Weight (kg)Body Weight (kg)
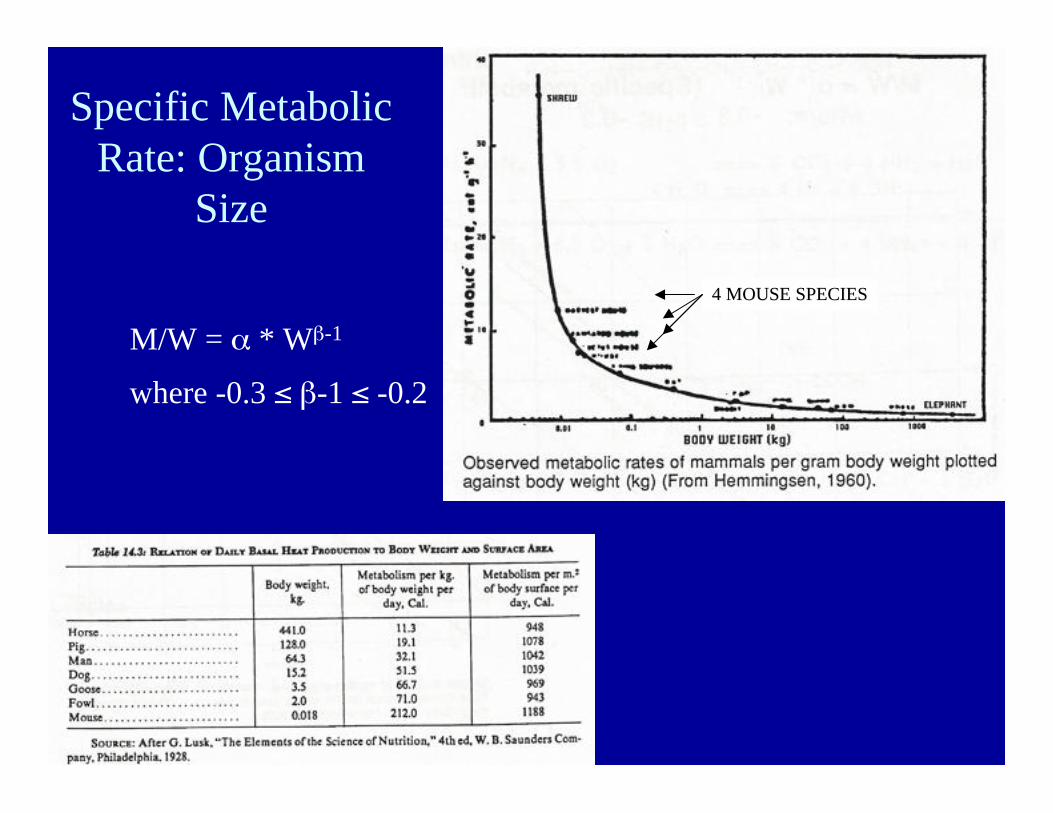
Specific MetabolicRate: Organism
Size
M/W = α * Wβ-1
where -0.3 ≤ β-1 ≤ -0.2
4 MOUSE SPECIES4 MOUSE SPECIES
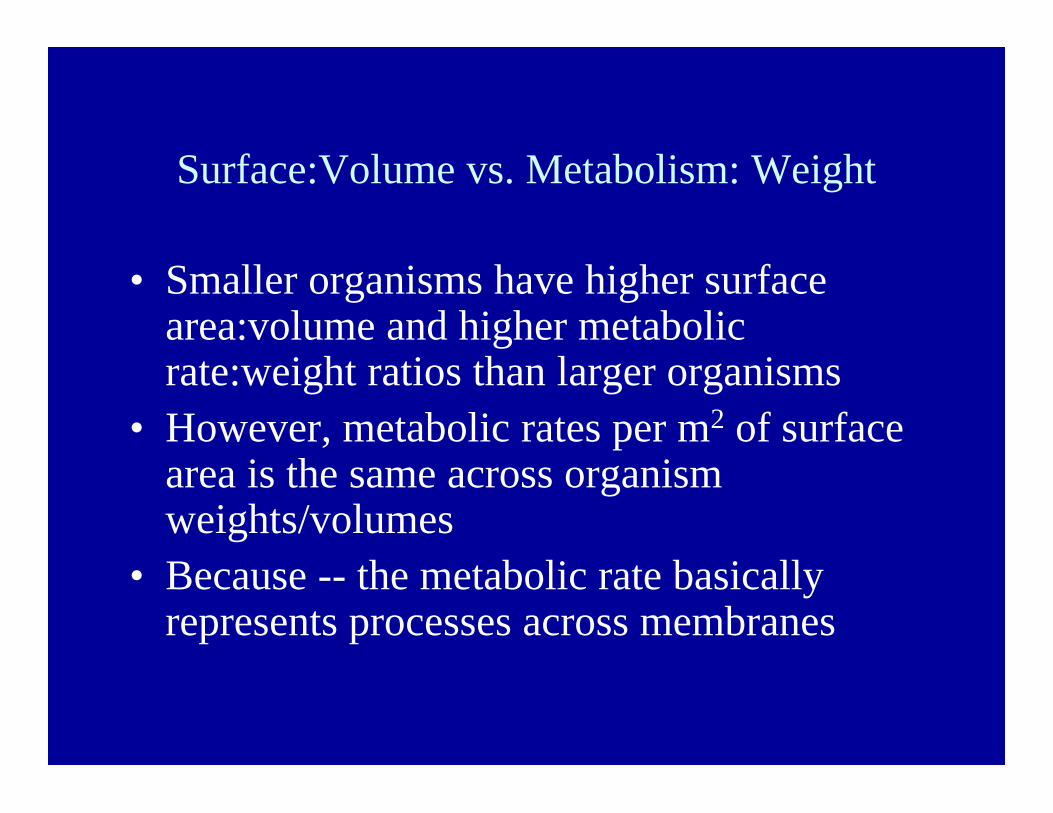
Surface:Volume vs. Metabolism: Weight
• Smaller organisms have higher surfacearea:volume and higher metabolicrate:weight ratios than larger organisms
• However, metabolic rates per m2 of surfacearea is the same across organismweights/volumes
• Because -- the metabolic rate basicallyrepresents processes across membranes
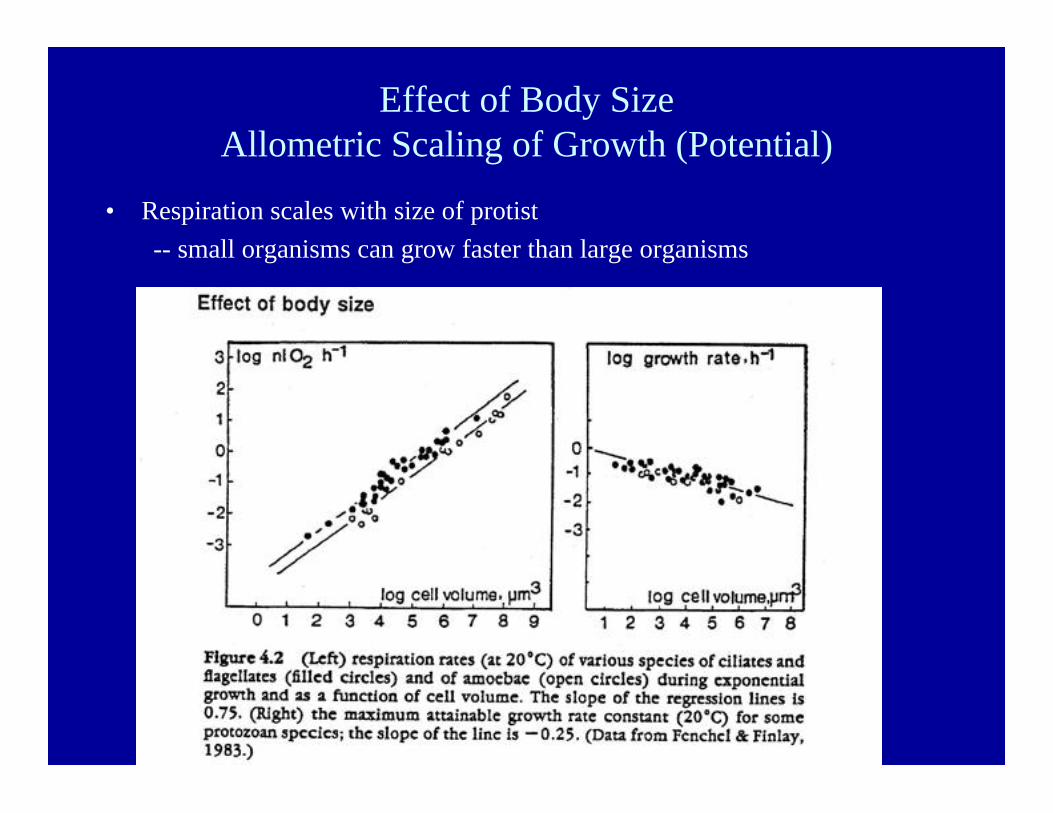
Effect of Body SizeAllometric Scaling of Growth (Potential)
• Respiration scales with size of protist-- small organisms can grow faster than large organisms
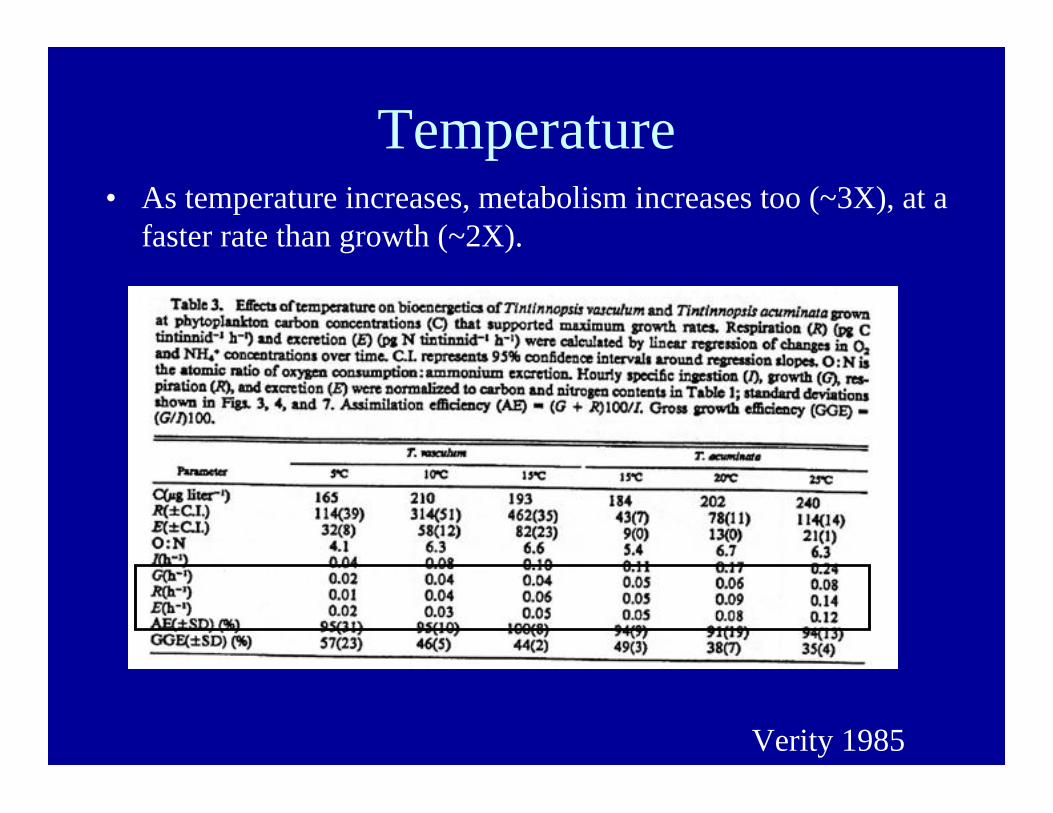
Temperature• As temperature increases, metabolism increases too (~3X), at a
faster rate than growth (~2X).
Verity 1985
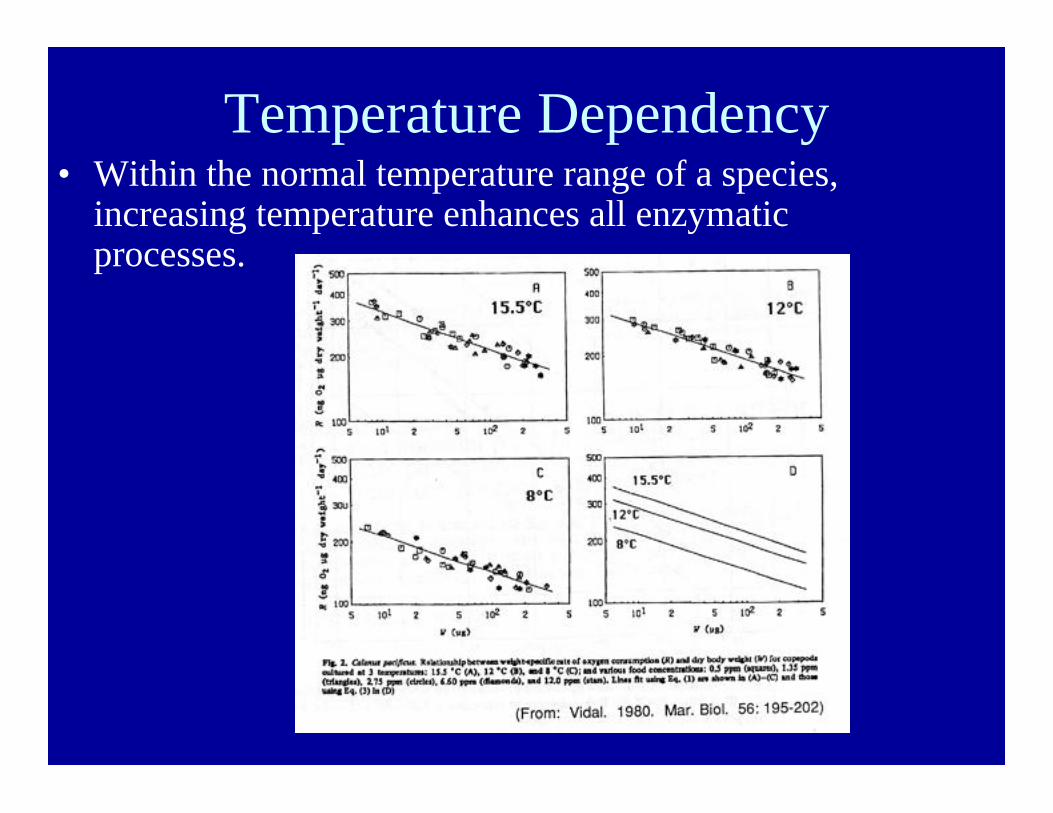
Temperature Dependency• Within the normal temperature range of a species,
increasing temperature enhances all enzymaticprocesses.
Consequences
• Lgr. organisms have higher metabolic demandbecause more chemical rxs need more energy, thusmore evolution of CO2/O2 consumption
• Smlr. organisms have higher S/V ratio, so moresurface reactions available to “capture” nutrientsrelative to somewhat lgr organisms– thus better competitors for dissolved scarce nutrients– can also grow faster because metabolic costs lower with
more of food ration available for growth
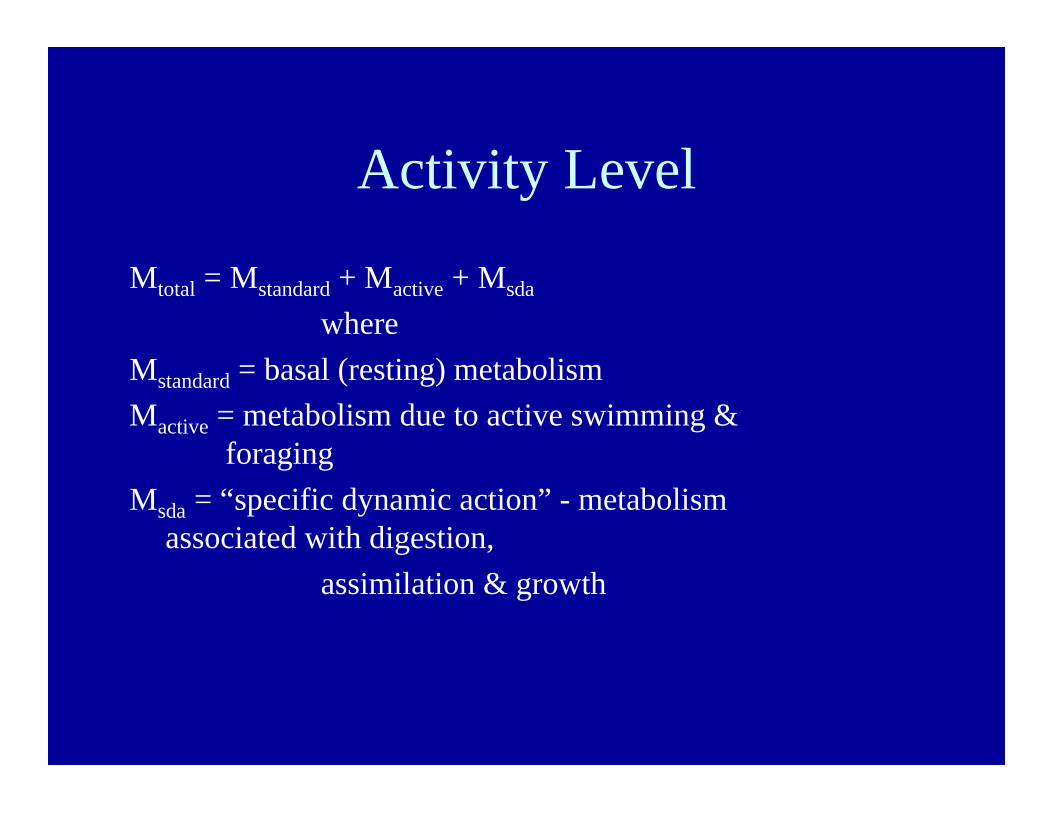
Activity Level
Mtotal = Mstandard + Mactive + Msda
whereMstandard = basal (resting) metabolismMactive = metabolism due to active swimming &
foragingMsda = “specific dynamic action” - metabolism
associated with digestion,assimilation & growth
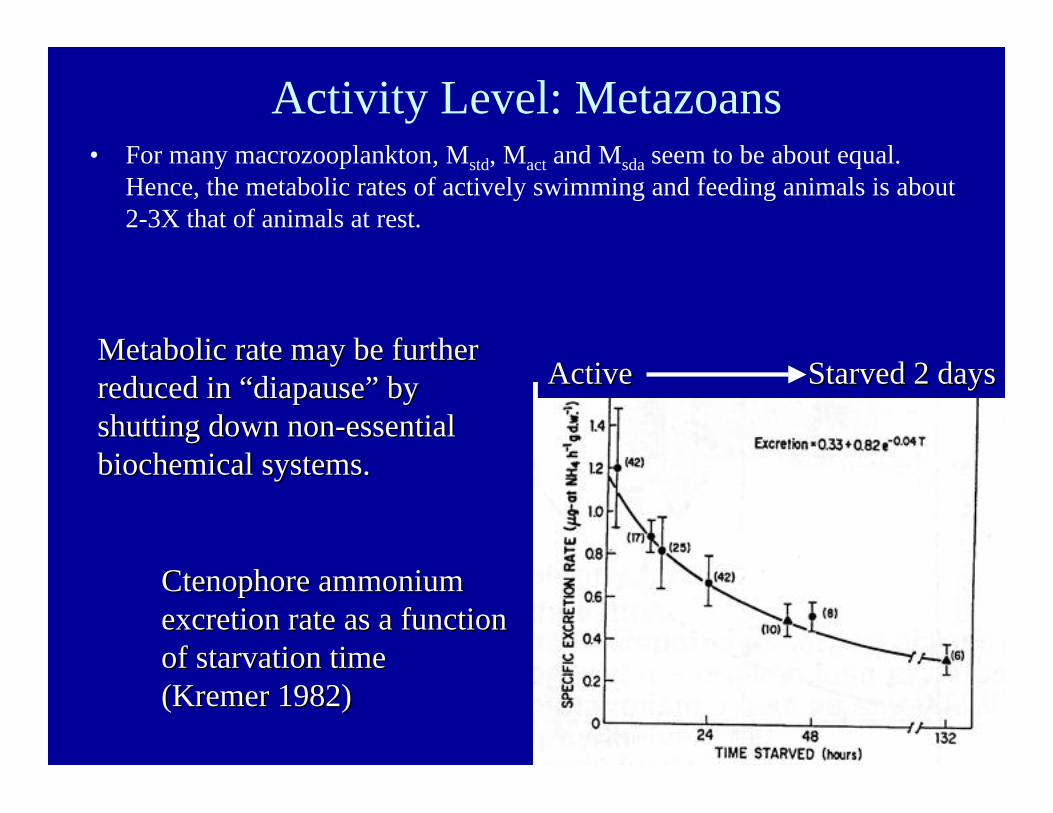
Activity Level: Metazoans• For many macrozooplankton, Mstd, Mact and Msda seem to be about equal.
Hence, the metabolic rates of actively swimming and feeding animals is about2-3X that of animals at rest.
Active Active Starved 2 days Starved 2 days
Ctenophore ammoniumCtenophore ammoniumexcretion rate as a functionexcretion rate as a functionof starvation timeof starvation time(Kremer 1982)(Kremer 1982)
Metabolic rate may be furtherMetabolic rate may be furtherreduced in reduced in ““diapausediapause”” by byshutting down non-essentialshutting down non-essentialbiochemical systems.biochemical systems.
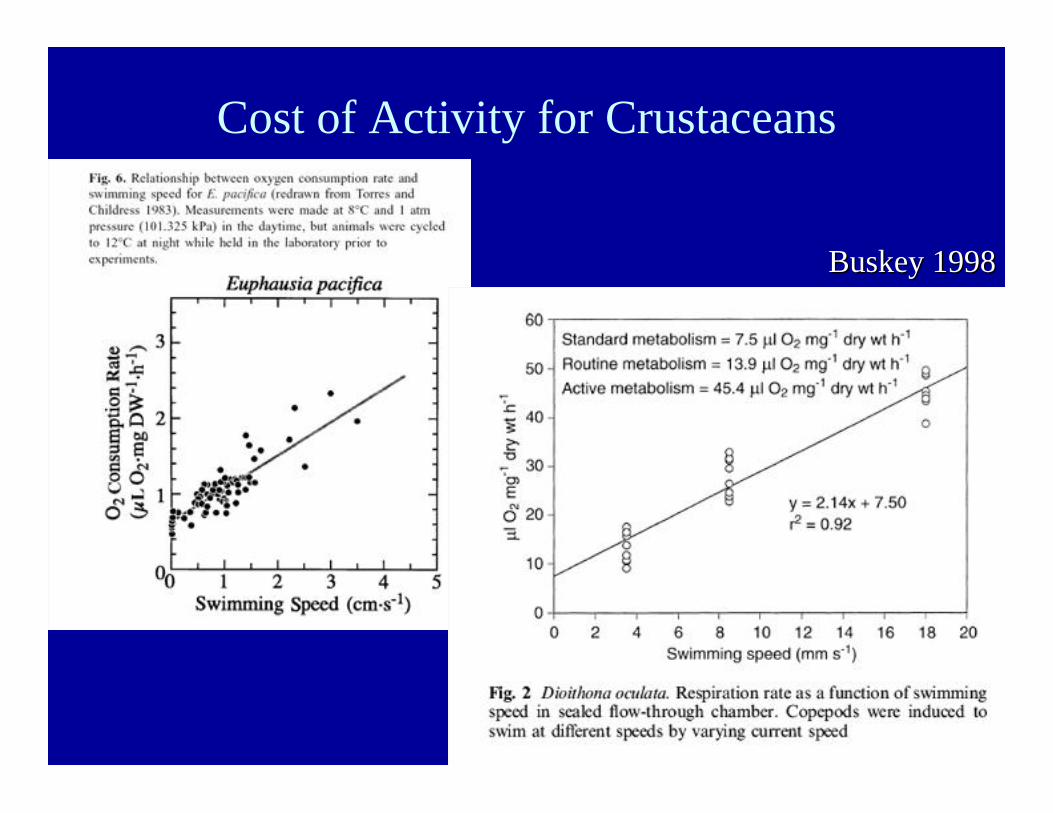
Cost of Activity for Crustaceans
Buskey Buskey 19981998
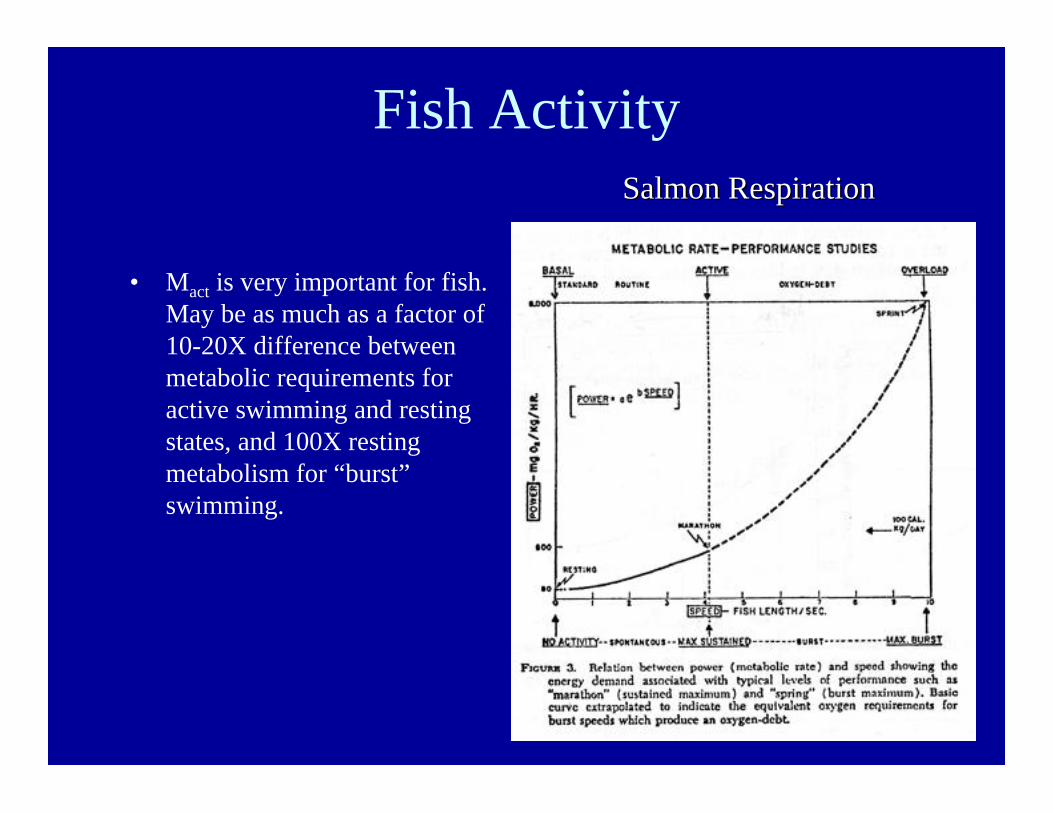
Fish Activity
• Mact is very important for fish.May be as much as a factor of10-20X difference betweenmetabolic requirements foractive swimming and restingstates, and 100X restingmetabolism for “burst”swimming.
Salmon RespirationSalmon Respiration
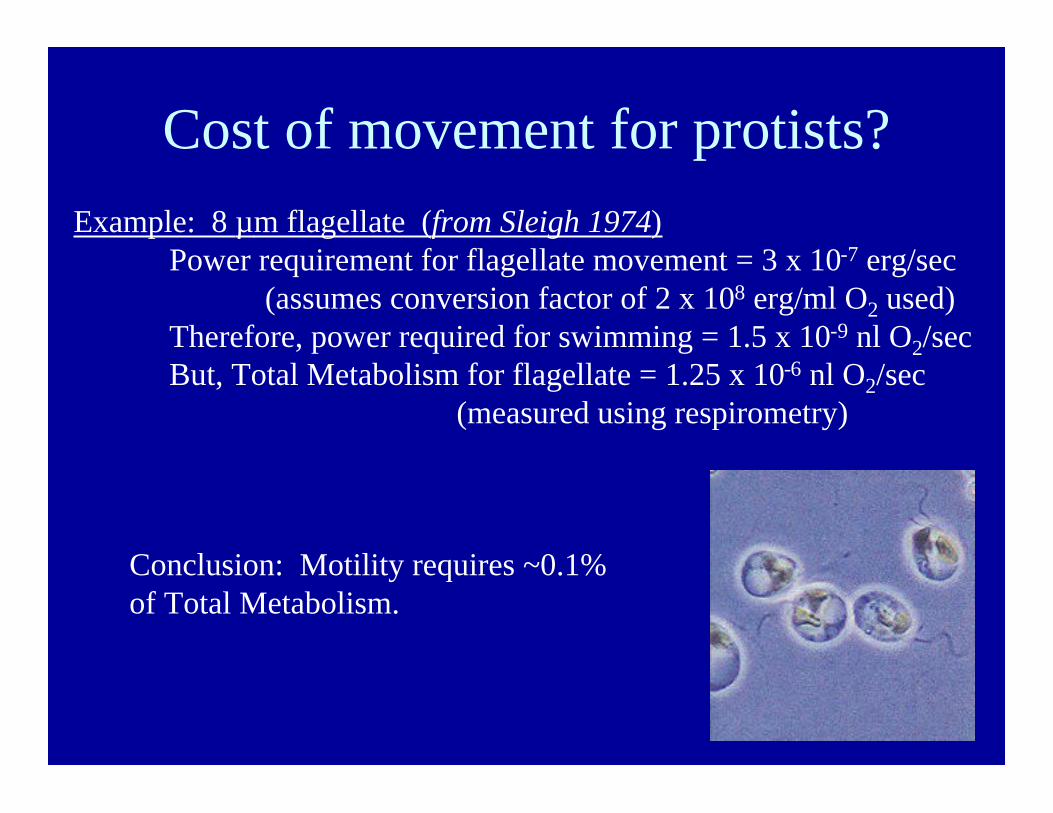
Cost of movement for protists?Example: 8 µm flagellate (from Sleigh 1974)
Power requirement for flagellate movement = 3 x 10⁻⁷ erg/sec(assumes conversion factor of 2 x 10⁸ erg/ml O2 used)
Therefore, power required for swimming = 1.5 x 10⁻⁹ nl O2/secBut, Total Metabolism for flagellate = 1.25 x 10⁻⁶ nl O2/sec
(measured using respirometry)
Conclusion: Motility requires ~0.1%of Total Metabolism.
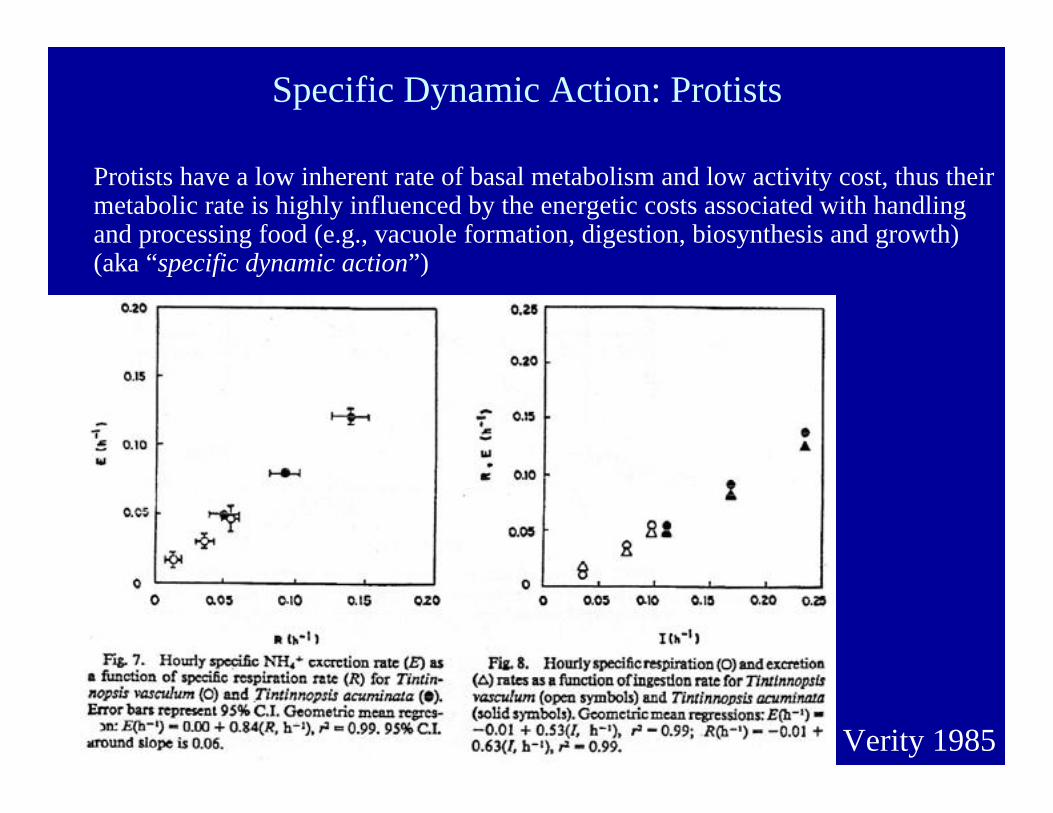
Specific Dynamic Action: Protists
Protists have a low inherent rate of basal metabolism and low activity cost, thus theirmetabolic rate is highly influenced by the energetic costs associated with handlingand processing food (e.g., vacuole formation, digestion, biosynthesis and growth)(aka “specific dynamic action”)
Verity 1985
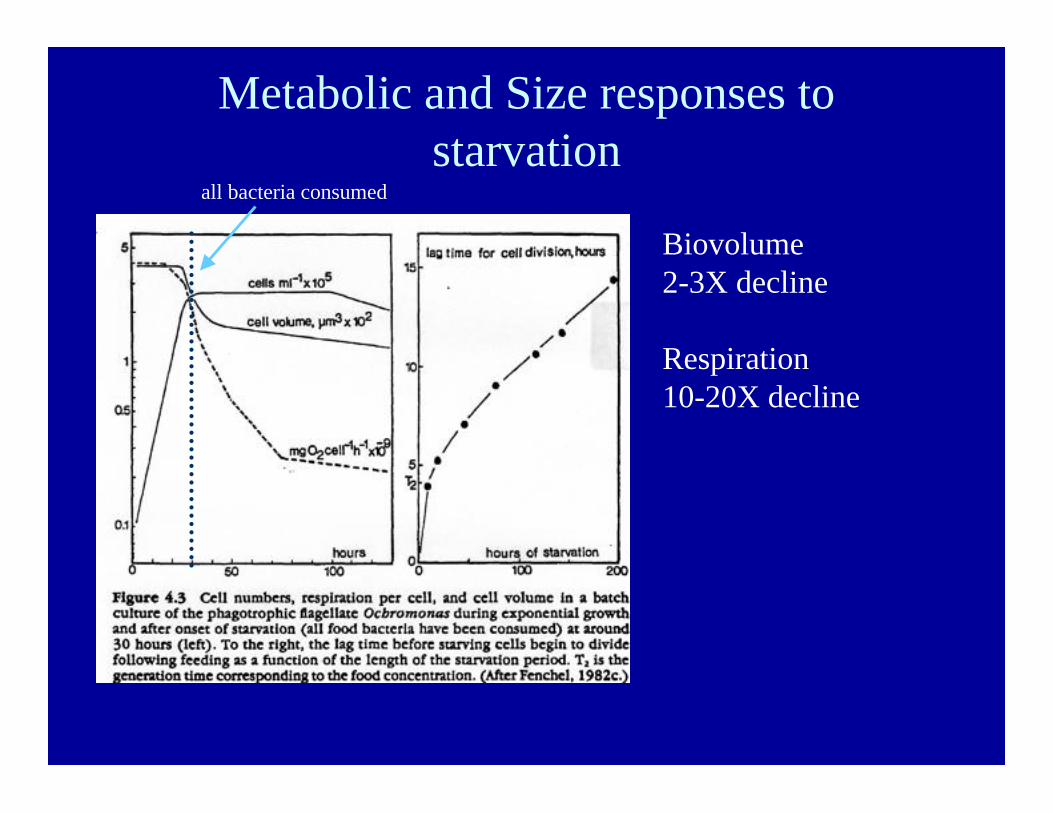
Metabolic and Size responses tostarvation
Biovolume2-3X decline
Respiration10-20X decline
all bacteria consumed
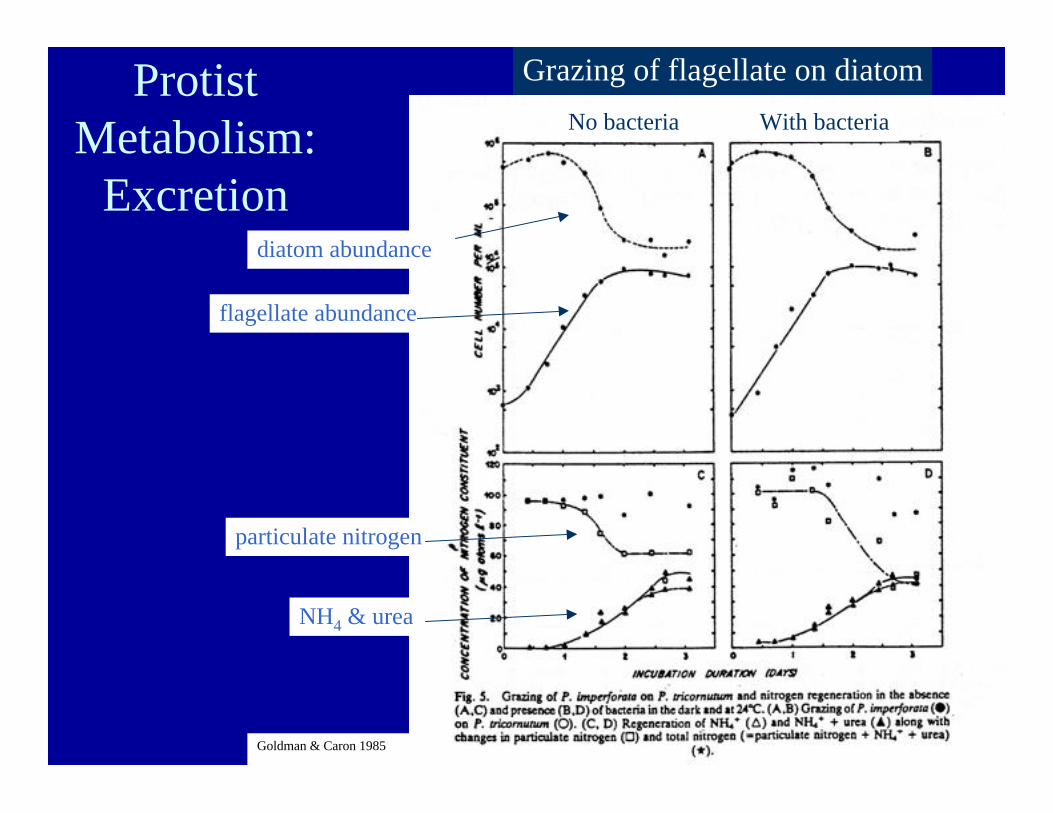
No bacteria With bacteriaProtist
Metabolism:Excretion
Goldman & Caron 1985
Grazing of flagellate on diatom
flagellate abundance
diatom abundance
particulate nitrogen
NH4 & urea
Why “waste” that food?
Concept: Organisms tend to retain the nutrientsthat are limiting to growth and excrete the nutrientsthat are available in excess.
Underlying assumption: Organisms try tomaintain a constant stoichiometry of elements,such as C, N, P, in their own cells throughconserving or excreting/egesting food.
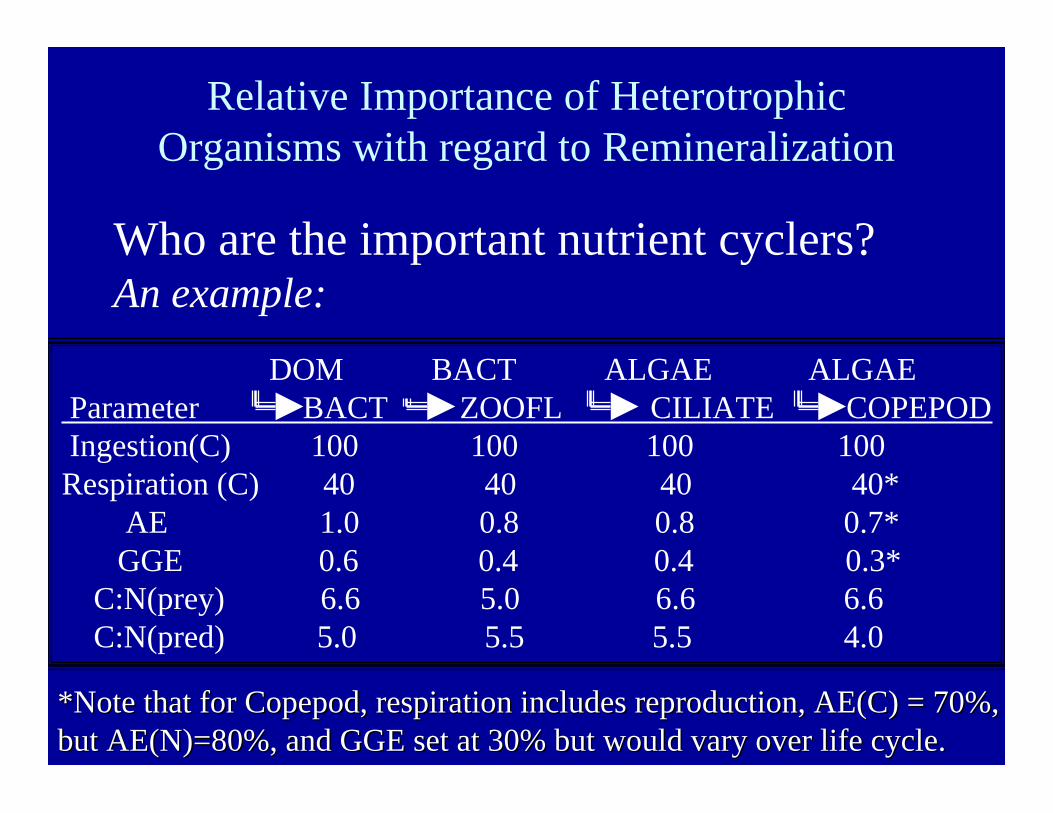
DOM BACT ALGAE ALGAE Parameter BACT ZOOFL CILIATE COPEPOD Ingestion(C) 100 100 100 100Respiration (C) 40 40 40 40* AE 1.0 0.8 0.8 0.7* GGE 0.6 0.4 0.4 0.3* C:N(prey) 6.6 5.0 6.6 6.6 C:N(pred) 5.0 5.5 5.5 4.0
Relative Importance of HeterotrophicOrganisms with regard to Remineralization
Who are the important nutrient cyclers?An example:
*Note that for Copepod, respiration includes reproduction, AE(C) = 70%,*Note that for Copepod, respiration includes reproduction, AE(C) = 70%,but AE(N)=80%, and GGE set at 30% but would vary over life cycle.but AE(N)=80%, and GGE set at 30% but would vary over life cycle.
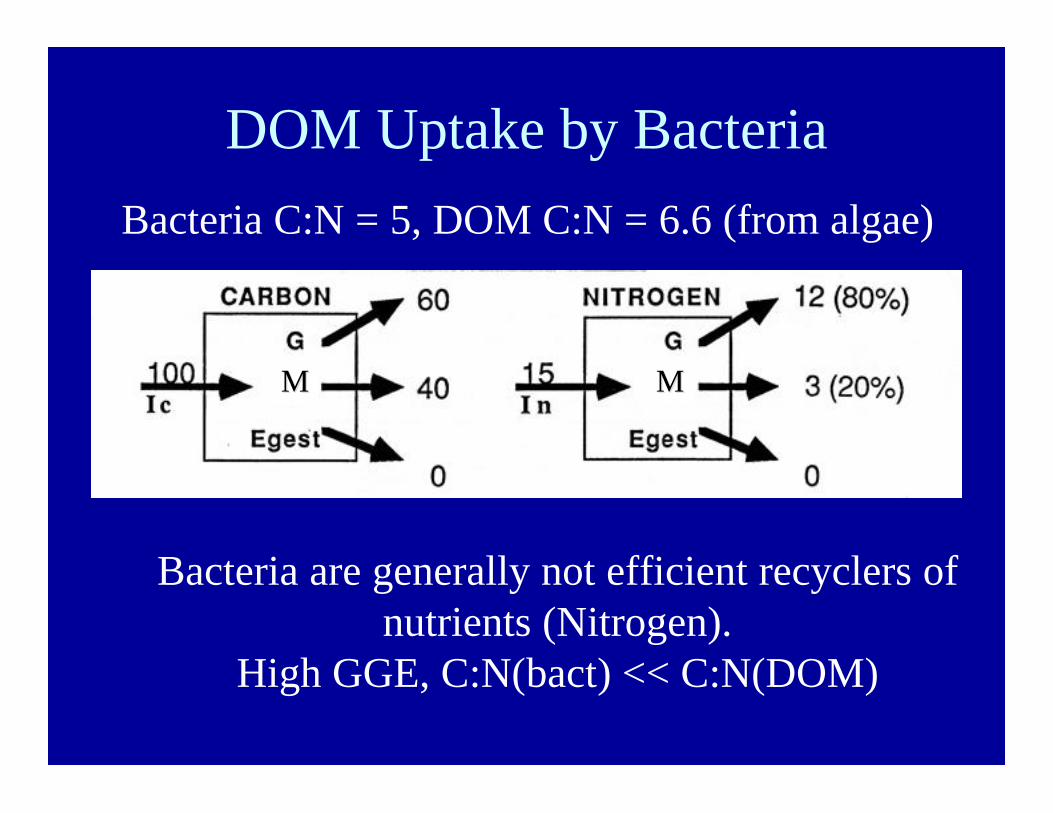
DOM Uptake by Bacteria
Bacteria are generally not efficient recyclers ofnutrients (Nitrogen).
High GGE, C:N(bact) << C:N(DOM)
Bacteria C:N = 5, DOM C:N = 6.6 (from algae)
MM MM
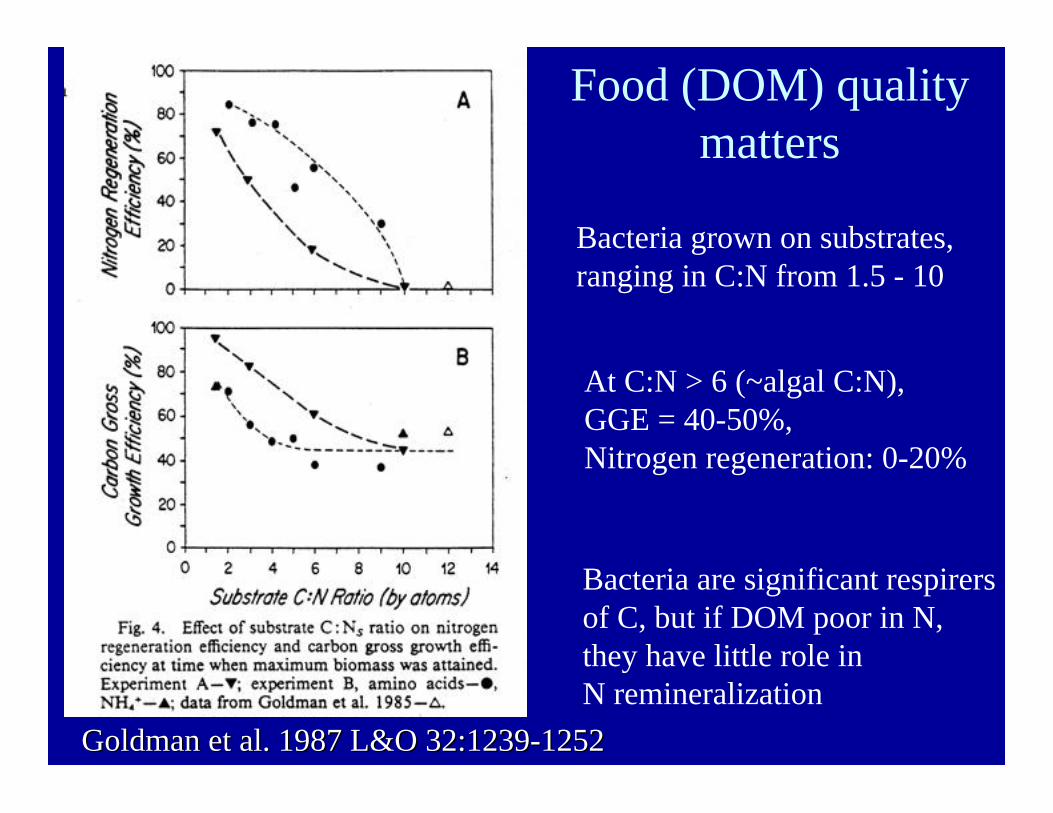
Food (DOM) qualitymatters
Bacteria grown on substrates,ranging in C:N from 1.5 - 10
At C:N > 6 (~algal C:N),GGE = 40-50%, Nitrogen regeneration: 0-20%
Bacteria are significant respirersof C, but if DOM poor in N, they have little role in N remineralization
Goldman et al. 1987 L&O 32:1239-1252Goldman et al. 1987 L&O 32:1239-1252
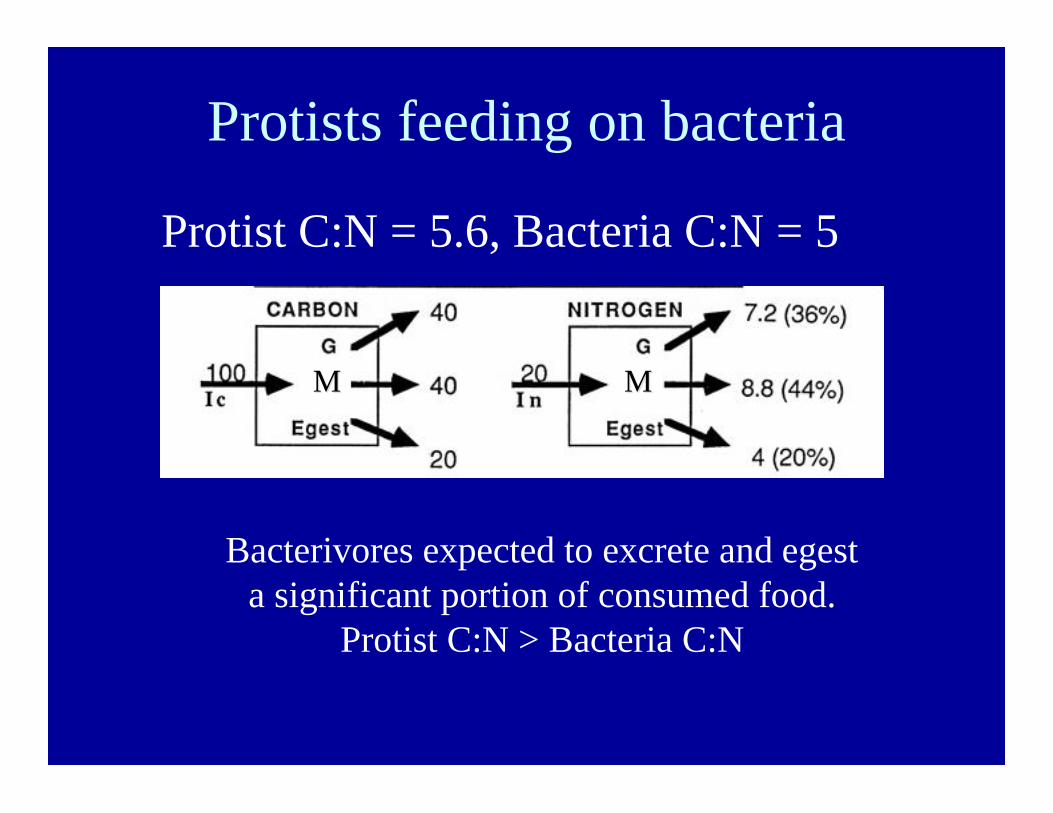
Protists feeding on bacteria
Protist C:N = 5.6, Bacteria C:N = 5
Bacterivores expected to excrete and egesta significant portion of consumed food.
Protist C:N > Bacteria C:N
MM MM
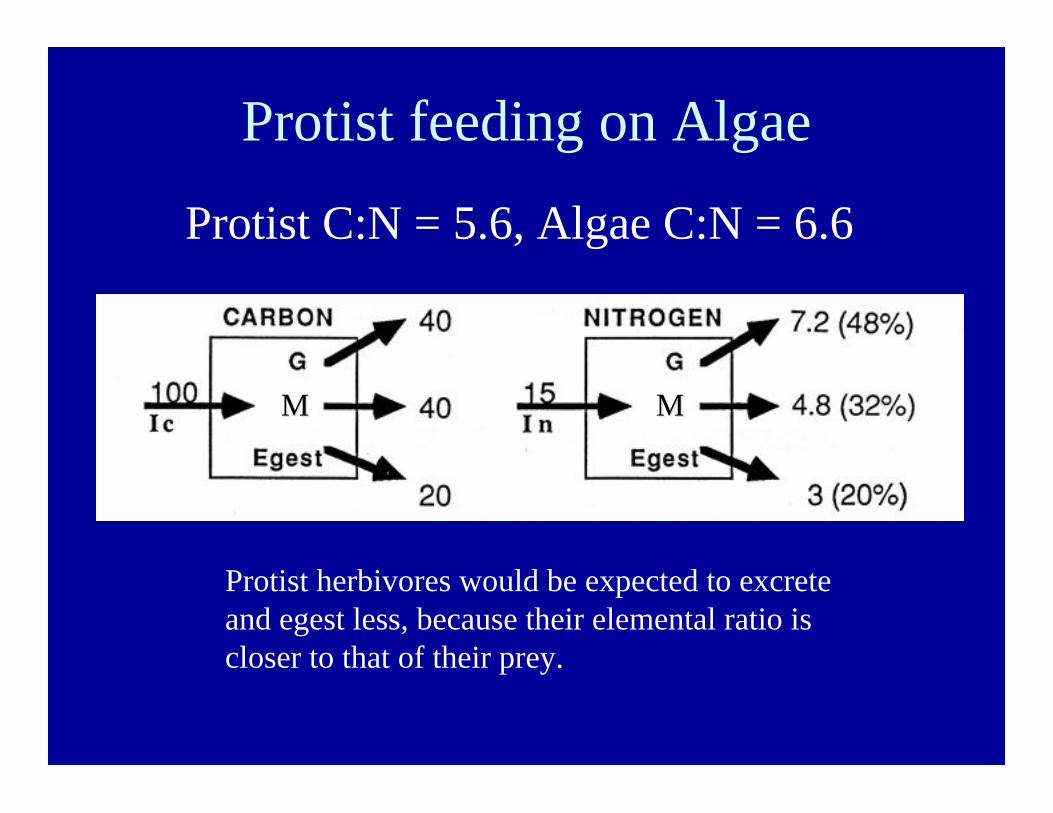
Protist feeding on Algae
Protist C:N = 5.6, Algae C:N = 6.6
Protist herbivores would be expected to excreteand egest less, because their elemental ratio iscloser to that of their prey.
MM MM
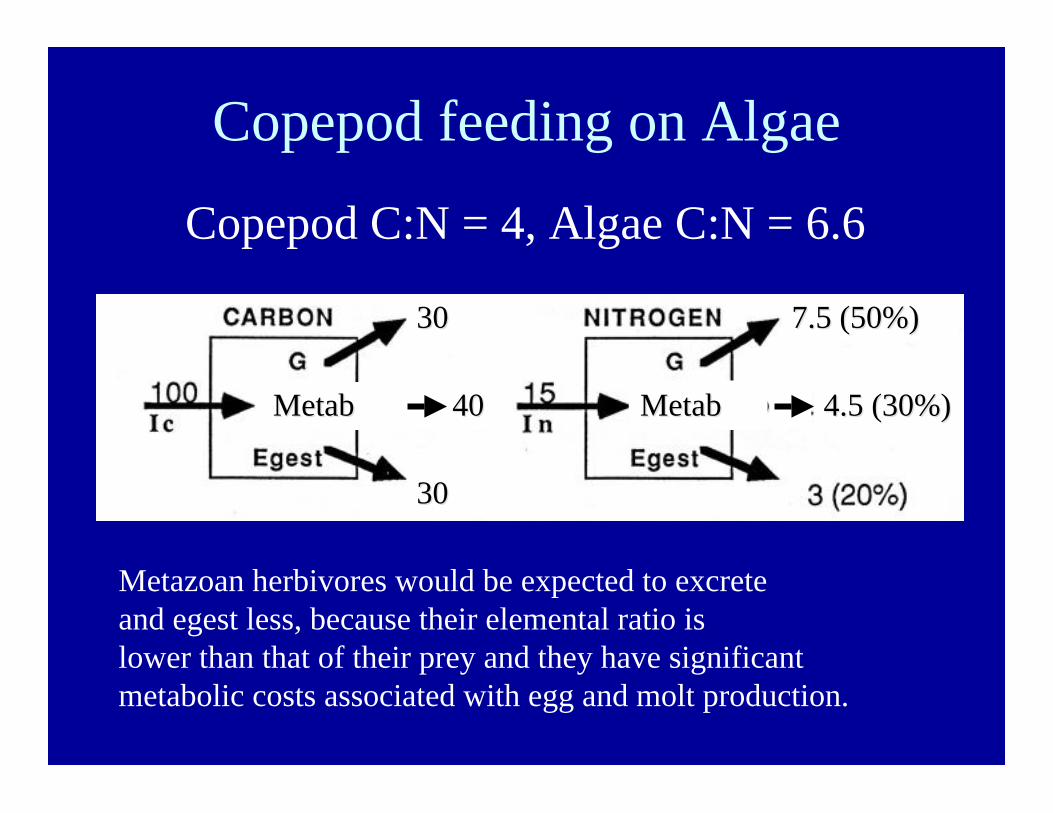
Copepod feeding on Algae
Copepod C:N = 4, Algae C:N = 6.6
Metazoan herbivores would be expected to excreteand egest less, because their elemental ratio islower than that of their prey and they have significantmetabolic costs associated with egg and molt production.
3030
3030
7.5 (50%)7.5 (50%)
4.5 (30%)4.5 (30%)RcRc+Repro 40+Repro 40 En+Repro En+Repro MetabMetab MetabMetab
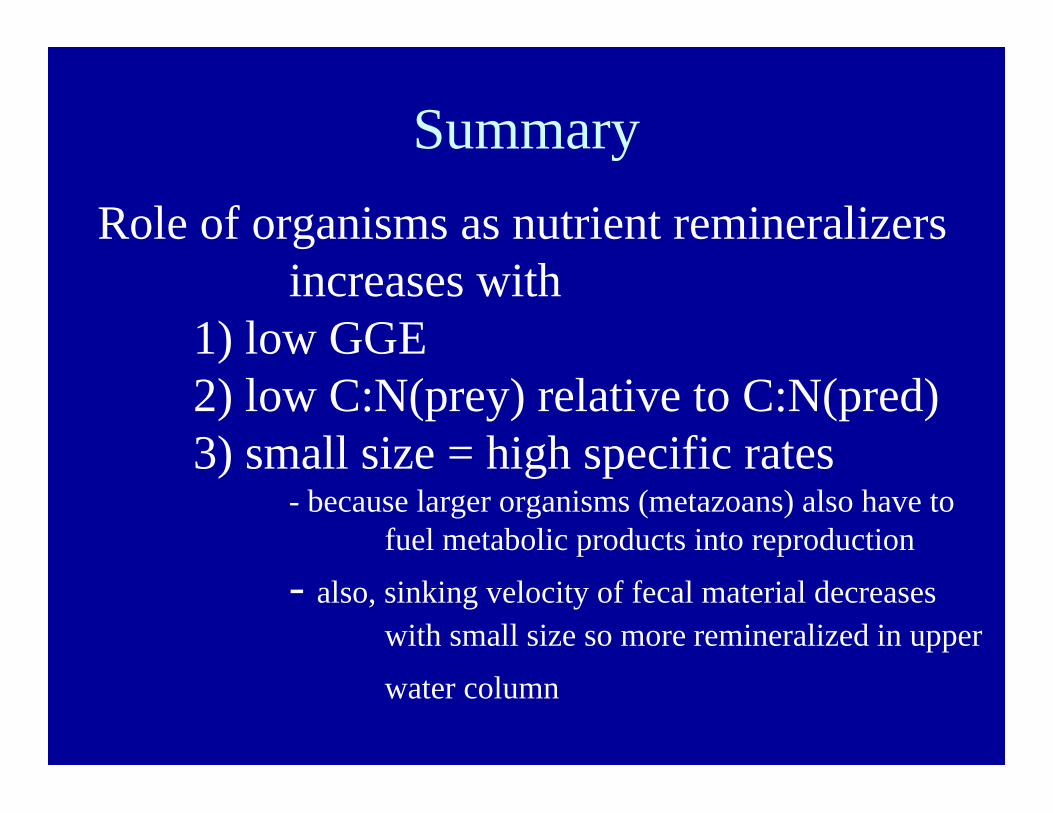
SummaryRole of organisms as nutrient remineralizers
increases with1) low GGE2) low C:N(prey) relative to C:N(pred)3) small size = high specific rates
- because larger organisms (metazoans) also have tofuel metabolic products into reproduction
- also, sinking velocity of fecal material decreases with small size so more remineralized in upperwater column
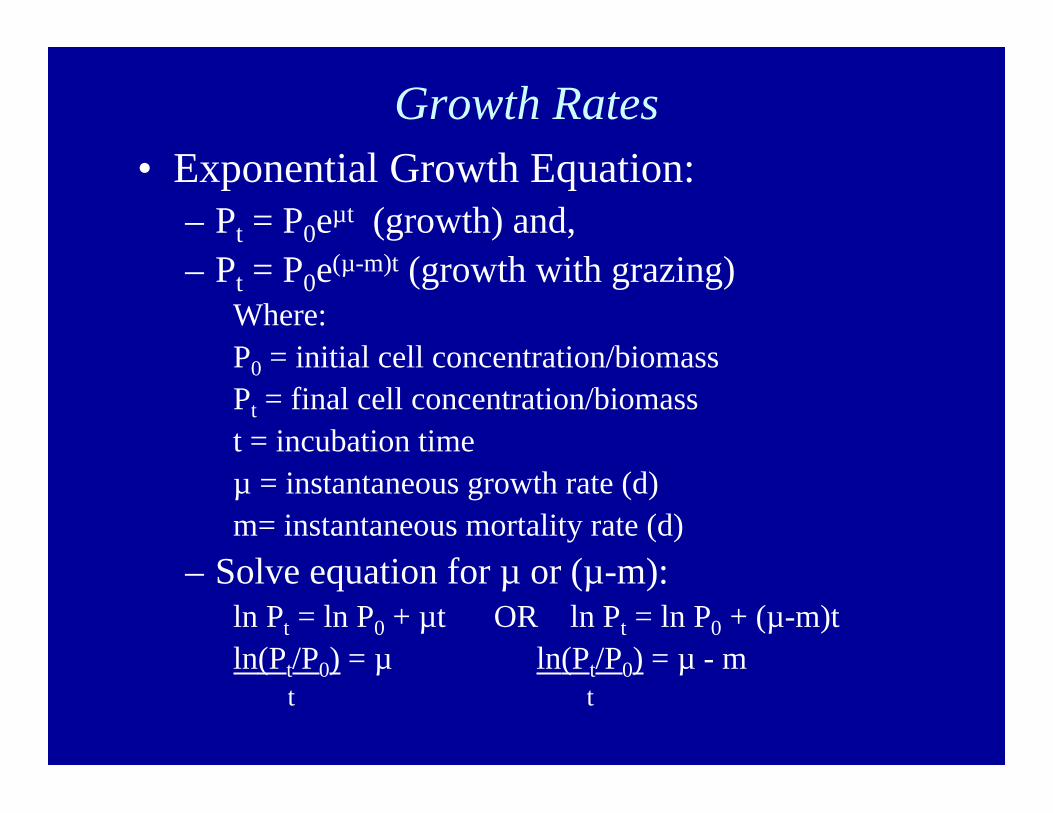
Growth Rates• Exponential Growth Equation:
– Pt = P0eµt (growth) and,– Pt = P0e(µ-m)t (growth with grazing)
Where:P0 = initial cell concentration/biomassPt = final cell concentration/biomasst = incubation timeµ = instantaneous growth rate (d)m= instantaneous mortality rate (d)
– Solve equation for µ or (µ-m):ln Pt = ln P0 + µt OR ln Pt = ln P0 + (µ-m)tln(Pt/P0) = µ ln(Pt/P0) = µ - m
t t
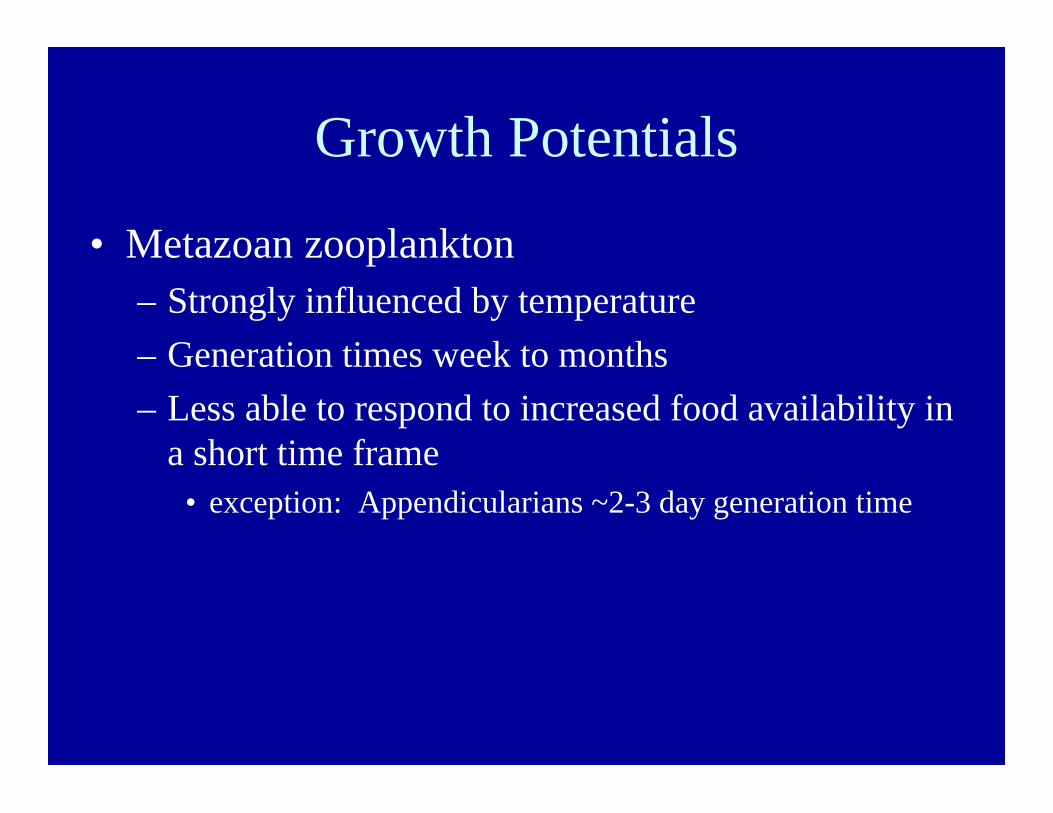
Growth Potentials
• Metazoan zooplankton– Strongly influenced by temperature– Generation times week to months– Less able to respond to increased food availability in
a short time frame• exception: Appendicularians ~2-3 day generation time
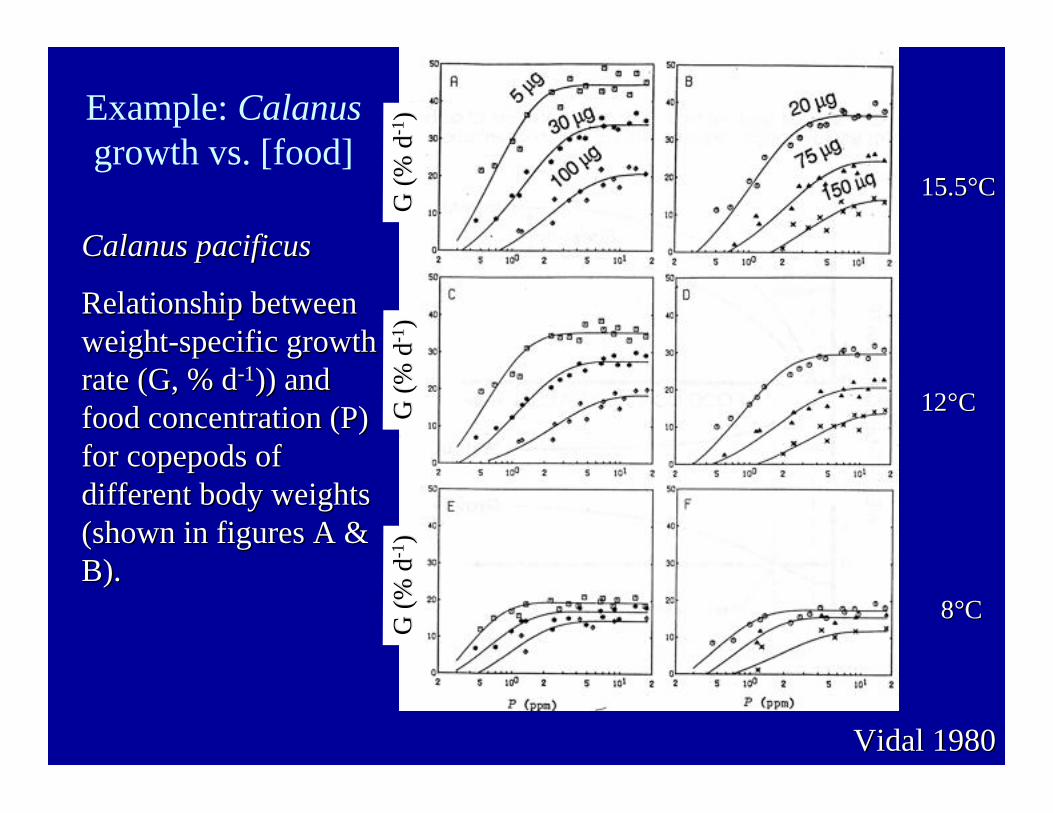
Example: Calanusgrowth vs. [food]
15.515.5°°CC
1212°°CC
88°°CC
Vidal 1980Vidal 1980
Calanus pacificusCalanus pacificus
Relationship betweenRelationship betweenweight-specific growthweight-specific growthrate (G, % drate (G, % d-1-1)) and)) andfood concentration (P)food concentration (P)for copepods offor copepods ofdifferent body weightsdifferent body weights(shown in figures A &(shown in figures A &B).B).
G (%
dG
(% d
-1-1))
G (%
dG
(% d
-1-1))
G (%
dG
(% d
-1-1))
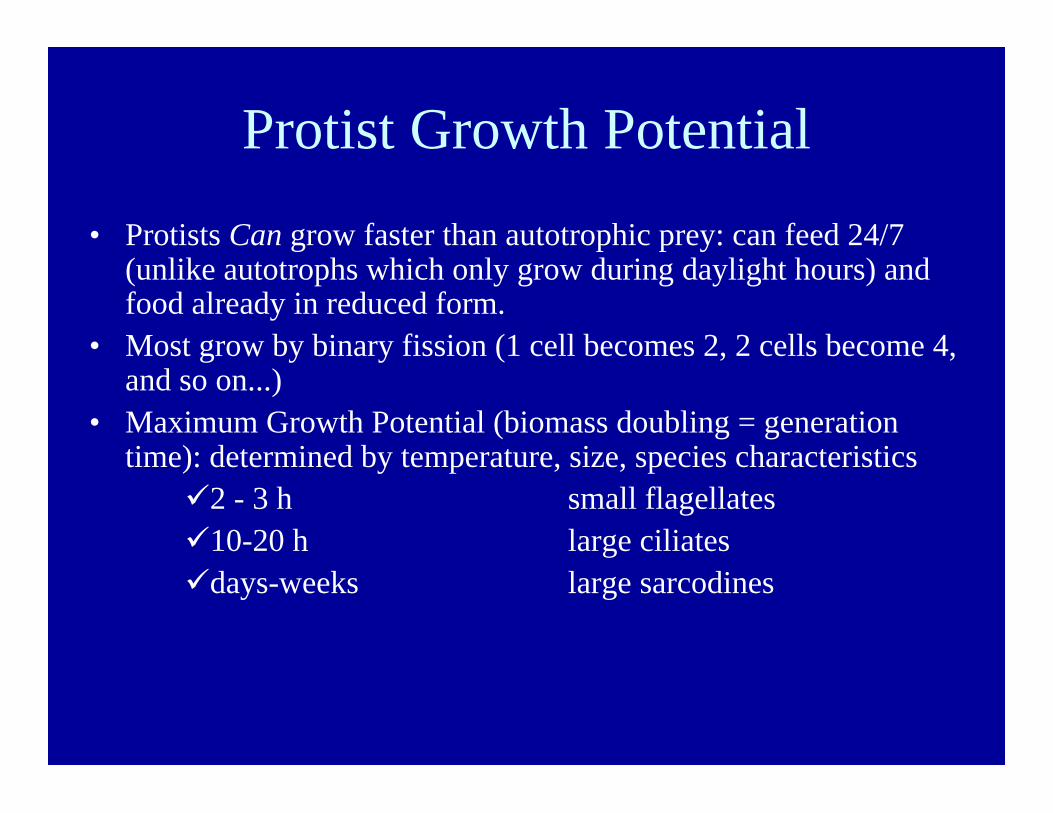
Protist Growth Potential• Protists Can grow faster than autotrophic prey: can feed 24/7
(unlike autotrophs which only grow during daylight hours) andfood already in reduced form.
• Most grow by binary fission (1 cell becomes 2, 2 cells become 4,and so on...)
• Maximum Growth Potential (biomass doubling = generationtime): determined by temperature, size, species characteristics
2 - 3 h small flagellates10-20 h large ciliatesdays-weeks large sarcodines
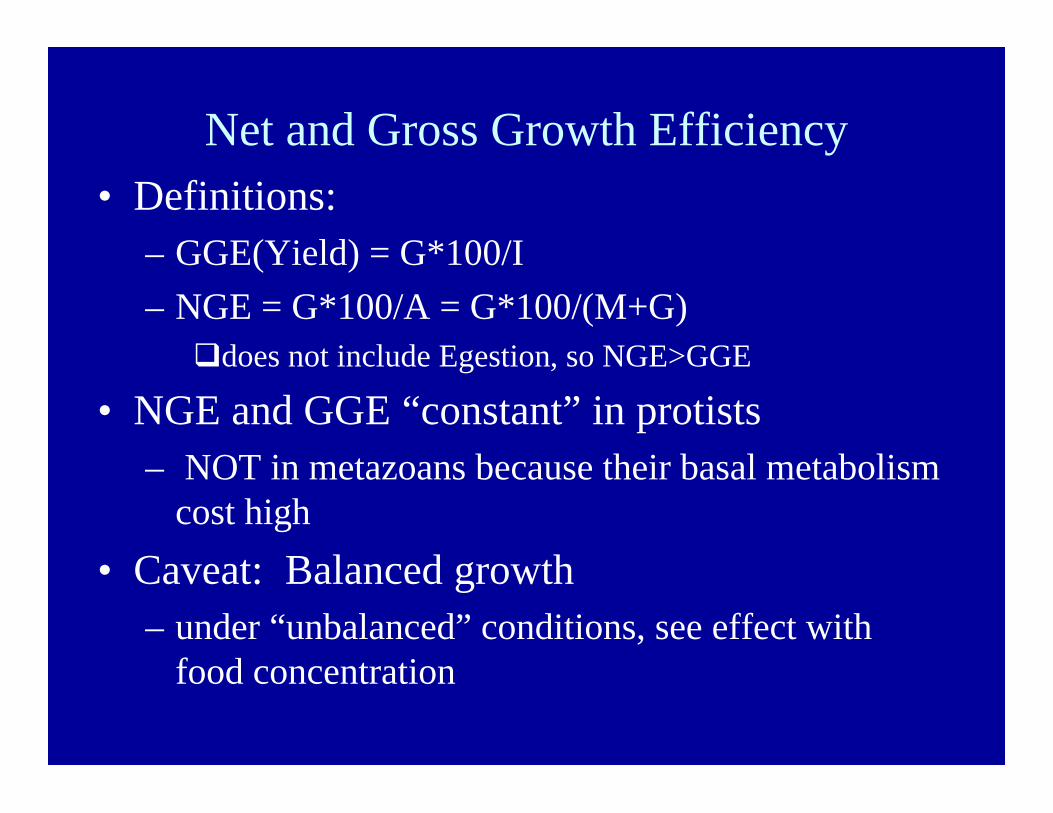
Net and Gross Growth Efficiency• Definitions:
– GGE(Yield) = G*100/I– NGE = G*100/A = G*100/(M+G)
does not include Egestion, so NGE>GGE
• NGE and GGE “constant” in protists– NOT in metazoans because their basal metabolism
cost high• Caveat: Balanced growth
– under “unbalanced” conditions, see effect withfood concentration
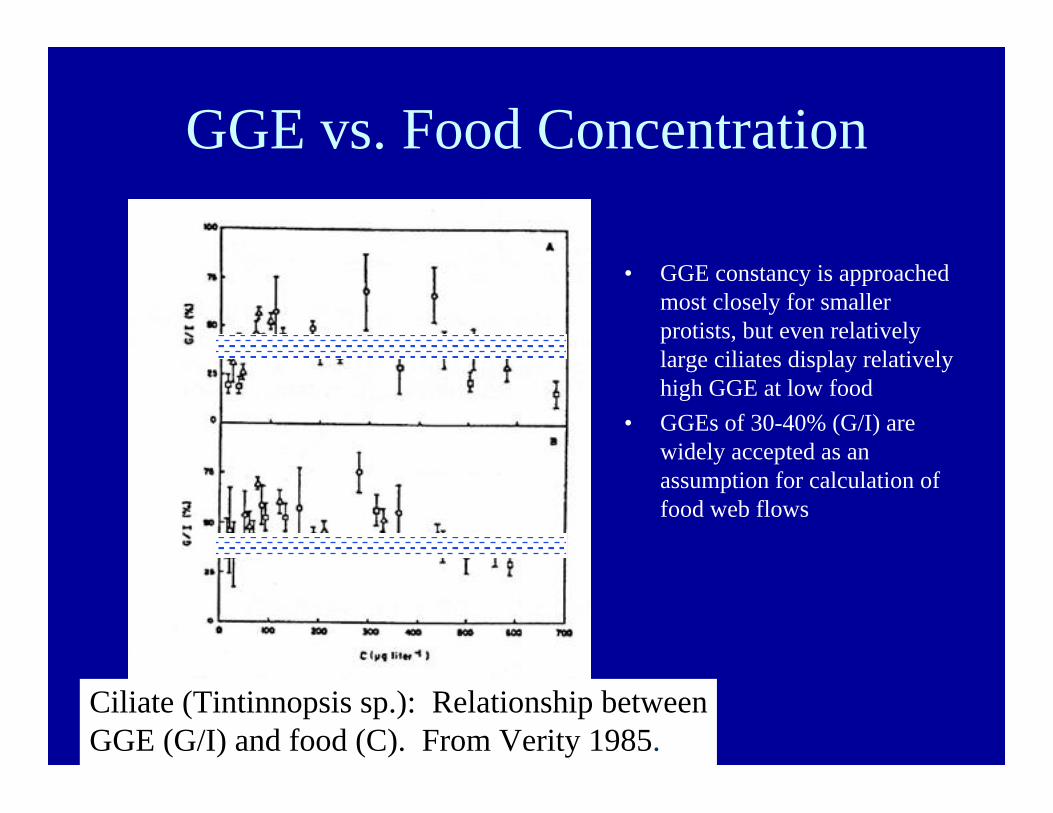
GGE vs. Food Concentration
• GGE constancy is approachedmost closely for smallerprotists, but even relativelylarge ciliates display relativelyhigh GGE at low food
• GGEs of 30-40% (G/I) arewidely accepted as anassumption for calculation offood web flows
Ciliate (Tintinnopsis sp.): Relationship betweenGGE (G/I) and food (C). From Verity 1985.
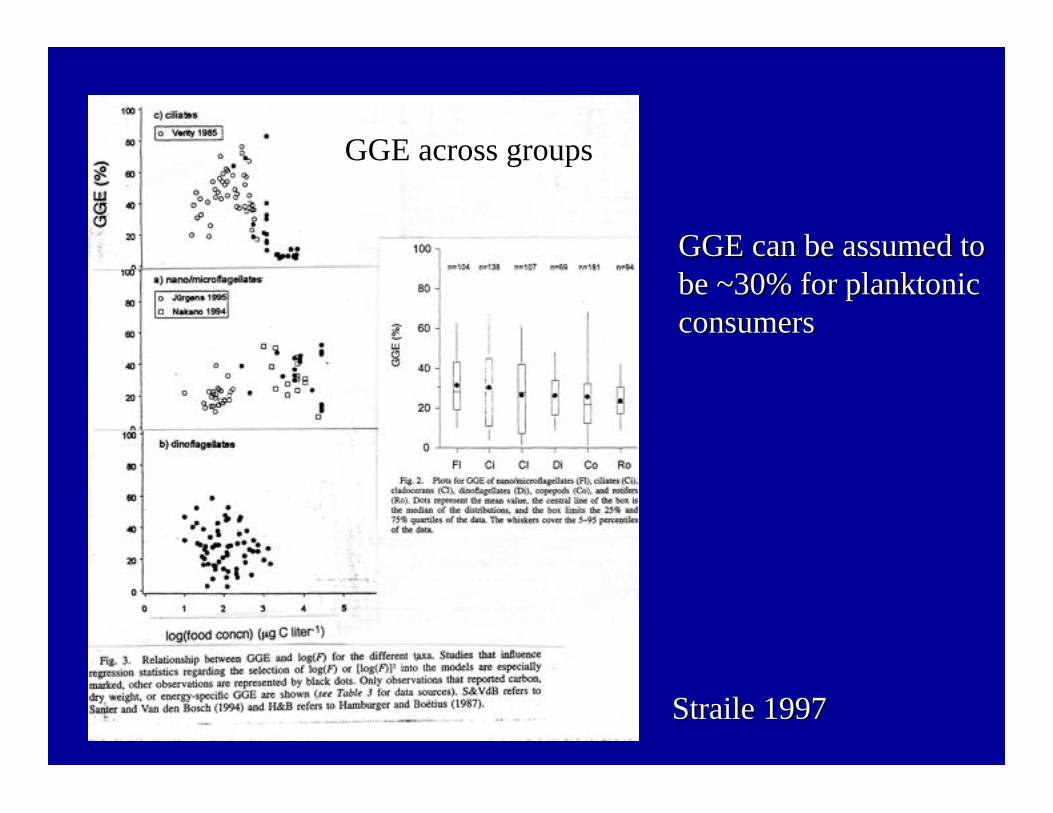
Straile Straile 19971997
GGE across groupsGGE across groups
GGE can be assumed toGGE can be assumed tobe ~30% for be ~30% for planktonicplanktonicconsumersconsumers


![Defecation Reflex [Compatibility Mode]](https://img.pdfslide.net/doc/110x75/5451cb86af795908308b4af3/defecation-reflex-compatibility-mode.jpg)