Embed Size (px)
Citation preview

Carbon Footprint and Project
Register Training
www.keepscotlandbeautiful.org Craig Dun, Chris Asensio, Clare Wharmby

www.keepscotlandbeautiful.org
Agenda
Agenda
Introduction to SSN and housekeeping 10.30 – 10.35
Introduction to workshop, CFPR tool and identification of key organisational needs 10.35 – 10.45
The carbon management information triangle – carbon footprint 10.45 – 11.00
Exercise to enter CFPR footprint data and outputs 11.00 – 11.20
Exercise to identify data patterns in operational footprints (plus coffee break) 11.20 – 11.50
PBCCD Q3a, 3b and 3c 11.50 – 12.00
The carbon management information triangle – carbon reduction projects 12.00 – 1.00
Lunch 1.00 - 1.45
Exercises to enter new projects and amend existing projects 1.45 – 2.15
PBCCD Q3e, 3f and 3h 2.15 – 2.30
The carbon management information triangle – Business as Usual scenario 2.30 – 2.45
Exercise to change the scenario 2.45 – 3.00
PBCCD Q3g and 3i 3:15 – 3.30
Trouble shooting – typical problems and how to solve them 3.30 – 3.50
Summary and wrap up 3.50 – 4.00

www.keepscotlandbeautiful.org
Introduction to this training event
The aim of this interactive workshop will help you better understand how to:
• Calculate your annual carbon footprint
• Collate and manage their carbon project list and forecast savings
• Document estate changes and other impacts on your footprint to create a
Business as Usual forecast
• Track progress towards targets and provide management information to other
parts of the organisation
• Produce accurate and auditable outputs to easily complete annual Public
Bodies Climate Change Duties reporting

www.keepscotlandbeautiful.org
Carbon Register & Project Register (CFPR) tool
• Designed to be easy to use with minimal data entry
• Helps to easily calculate your footprint, create a project register and run a Business As
Usual scenario
• Presents easy to follow charts and figures to help you visualise your bodies emissions
through time
• Full explanatory section at start with notes throughout
• Tool is issued annually with updates to Carbon Emission Factors
Philosophy of the CFPR tool
• Builds on the previous RES tools - same format and style
• More user friendly (in my opinion!)
• Easier and more dynamic to update yearly
• Improvement in the way renewable emission sources and projects are accounted for
• Much better alignment with the public bodies duties reporting form (where possible)
Updates to the new CFPR tool

www.keepscotlandbeautiful.org
Using the post-it notes on the tables, note down your key
organisational need from today:
Exercise 1: Organisational needs

www.keepscotlandbeautiful.org
The Carbon Management Triangle
Carbon footprint
(current and historical)
Carbon Project
Register
Are we going to meet out
carbon reduction target?
Business as Usual
scenario

www.keepscotlandbeautiful.org
Why measure your carbon footprint?
1. Provides a reference point (baseline) for
setting targets
2. Tells you how far you have come (annual
carbon footprint)
3. Tells you when you have met your target
4. Provides a focus for Carbon Management
actions
5. Helps identify where you are likely to get
greatest carbon return on investment
6. Provides an evidence base for business cases
7. Required for PBCCD reporting

www.keepscotlandbeautiful.org
Scope 1 - direct emissions from sources that are owned or
controlled by the organisatione.g. natural gas used for heating and hot water, purchased diesel and petrol, fugitive
emissions from refrigerants
Scope 2 - emissions from the consumption of purchased
electricity, steam generated upstream from the organisationGeneration of electricity or heat and steam
Scope 3 - other indirect emissions that are a consequence of the
operations of an organisation, but are not directly owned or
controlled by the organisatione.g. business travel using public transport or grey fleet, waste disposal, water supply and
treatment and Transmission and Distribution losses for grid electricity
Carbon footprint scopes
www.keepscotlandbeautiful.org
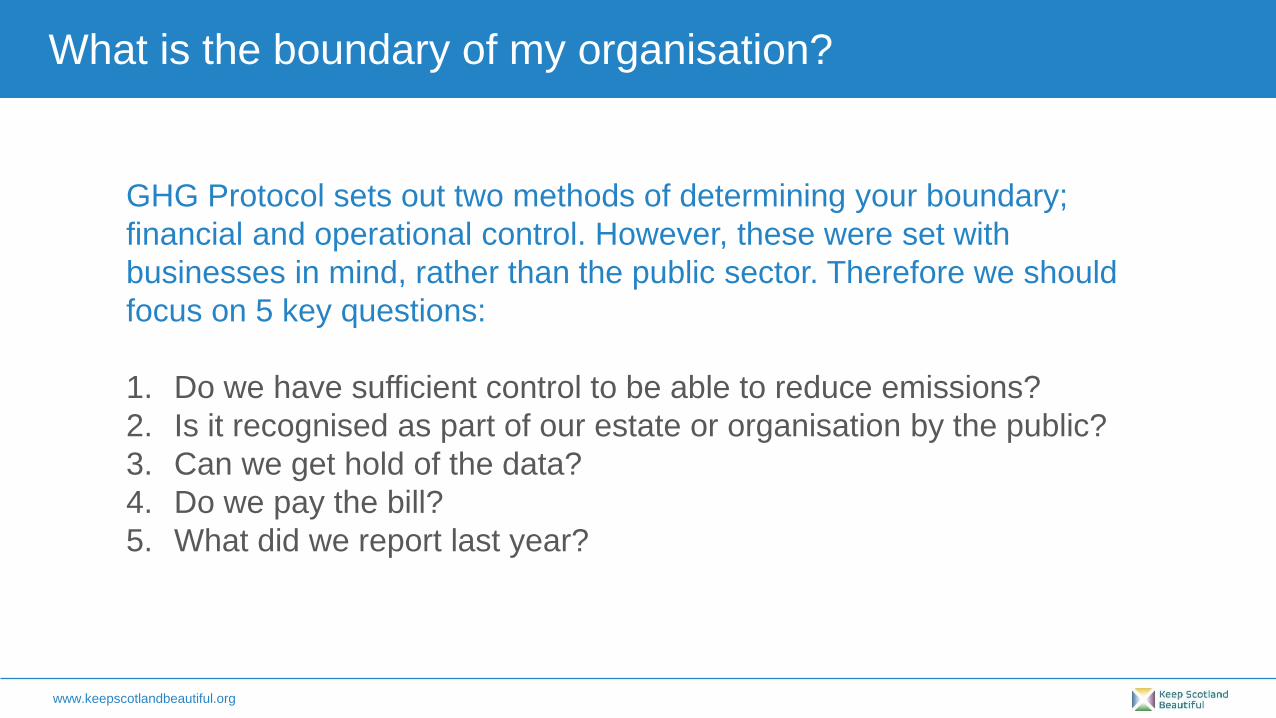
What is the boundary of my organisation?
GHG Protocol sets out two methods of determining your boundary;
financial and operational control. However, these were set with
businesses in mind, rather than the public sector. Therefore we should
focus on 5 key questions:
1. Do we have sufficient control to be able to reduce emissions?
2. Is it recognised as part of our estate or organisation by the public?
3. Can we get hold of the data?
4. Do we pay the bill?
5. What did we report last year?

Direct fuel use
Natural gas (kWh)
Staff commuting
KeyScope 2 Scope 3Scope 1
Waste disposal
Water
Electricity
Generation (kWh)
Business travel
Private car (km)
Emission sources within Carbon Management boundary:Out of
boundary:
Supply (m3)
Landfill (tonnes)Recycling
(tonnes)
Procurement of
goods/services
Treatment (m3)
Commercial
& industrial
Business travel
BusTaxi
Fleet vehicles
Diesel (litres)
Biomass (kWh)
T&D losses (kWh)
3 buildings
Out of scope
CO2 from
biomass
Air (passenger km)
Refrigerants
MixedRail
1. It is useful to also
have an actual asset
list
2. This should list all the
buildings in your
estate included in the
boundary
3. It should also detail
the rationale for
inclusion in the notes
4. For emission sources
that are related to a
building, it should
show whether these
are included
5. For fleet, a summary
of vehicles should be
sufficient
Documentation

www.keepscotlandbeautiful.org
Exercise 2: carbon footprint data entry into the CFPR
Building 1Electricity: 2,000,000 kWh
Gas: 5,000,000 kWhFloor area: 2,000 m2
Building 2Electricity: 3,000,000 kWh
Gas: 500,000 kWhBiomass: 4,500,000 kWh
Floor area: 5,000 m2
Building 3Electricity: 5,000,000 kWh
Gas: 10,000,000 kWhFloor area: 10,000 m2
Category Emission source
Emission type Amount
Water supply Stationary Water - Supply (m3) 100,000
Water treatment Stationary Water - Treatment (m3) 95,000
Waste recycling Waste Paper & Board (Mixed) Recycling (tonnes) 4,500
Waste to landfill Waste Refuse Commercial & Industrial to Landfill (tonnes) 2,000
Fleet Transport Diesel - average biofuel (litres) 70,000
Business travel car Transport Car - Unknown fuel - Average (km) 5,000,000
Business travel flights Transport Short Haul Flights - Average passenger (passenger km) 5,000,000

www.keepscotlandbeautiful.org
Simple graphs and tables – split by source, type and
scope
Outputs of the CFPR for carbon footprint
75%
5%
20%
Carbon Footprint - split by
source (tCO2e)
Stationary
Waste
Transport
-
500
1,000
1,500
2,000
2,500
3,000
3,500
4,000
4,500
Scope 1 Scope 2 Scope 3
tCO
2e
Scope
Carbon Footprint - split by
scope (tCO2e)
21%
7%
2%3%
2%2%
34%
11%
6%
12%
Carbon Footprint - split by emission
type (Cost £)
Grid Electricity (kWh)
Natural Gas (kWh)
Water - Supply (m3)
Water - Treatment (m3)
Diesel - average biofuel (litres)
Biomass - wood chips (kWh)

www.keepscotlandbeautiful.org
Exercise 3a: is the organisation going to meet their target?
1. Work in pairs or small groups
2. You have been provided with historical and current carbon footprint
data for a medium sized public body
3. Answer the questions on the handout based on the data available

www.keepscotlandbeautiful.org
Using the CFPR to complete your PBCCD report – Q3a, 3b, 3c
3a - Emissions from start of the year which the body uses as a baseline (for its carbon
footprint) to the end of the report year.
Use Outputs for Public Bodies Duties reporting – Table a
3b - Breakdown of emission sources
Use Outputs for Public Bodies Duties reporting – Table b
3c - Generation, consumption and export of renewable energy
Use Outputs for Public Bodies Duties reporting – Table c

www.keepscotlandbeautiful.org
The Carbon Management Triangle – Carbon Project Register
Carbon footprint
(current and historical)
Carbon Project
Register
Are we going to meet out
carbon reduction target?
Business as Usual
scenario

www.keepscotlandbeautiful.org
The carbon project register
1. Acts as a project register to store ALL carbon saving project
information
2. Reference list of ‘Live’ and ‘Future’ projects
• Keeps you updated on project progress
• Helps prioritise projects for funding/implementation
• Helps in predicting your progress against your Carbon
Reduction target(s)
3. Reference list of ‘Completed’ projects
• Helps you review project success/barriers
• Supports analysis (bias towards certain projects?)

www.keepscotlandbeautiful.org
The carbon project register
1. Project ID, description, location
2. Year of Implementation
3. Capital (and ongoing maint/op costs)
4. Responsibilities
5. Project Status
6. Confidence
7. Emission Saving details (and any associated emission increases)
Project Information needs to be clear and accurate. This gives
confidence in project analysis, comparisons between projects and
carbon forecasting, helping you make the right decisions.

www.keepscotlandbeautiful.org
The carbon project register
Accurate and timely Project data collection is essential to
keep the Project Register ‘live’ – relevant and providing
confidence.
1. WHO provides the information?
Energy/Water/Waste/Travel/Costing information?
2. WHERE do they provide it to?
3. HOW do they provide it? What format?
4. WHEN do they provide it?

www.keepscotlandbeautiful.org
The carbon project register
1. Who needs to know what?
a) Internal Stakeholders – Staff, Board etc
b) External Stakeholders – General public, funders etc
2. What do they need to know and when?
a) Project Status/Timelines
b) Costs/savings
c) Progress towards Carbon Reduction target(s)
3. Key messages
a) Format (graphs/tables)
b) Journey (come from, going to, distance travelled, on target – are
we nearly there yet!)

www.keepscotlandbeautiful.org
Exercise 4a: entering a new project
Demo on entering a new project – Food & Drink (from Landfill to Composting)
Exercise – enter the following new project – LED lighting upgrade
ProjectDescription
Location Com Year
CapCost
Additional Annual Op/MaintSaving
Project Status
Subject to CRC EES
Type of Saving
Type of Emission
Amount AnnualSavings for…
Lightingupgrade to LED
Building 1 2016/17 50,000 100 In Progress Yes Stationary Grid Elec 130,000 No

www.keepscotlandbeautiful.org
Exercise 4a: entering a new renewables project
Project List (Renewables) slightly different: Inputs/Outputs/Displaced Fuels.
Exercise – enter the following new project – Solar PV
Do Inputs section yourself!
No Export BUT FiT support
ProjectDescription
Location Com Year
CapCost
Additional Annual Op/MaintSaving
Project Status
Subject to CRC EES
Outputconsumed by Org
Incomefrom Financial Support
Savingfrom Displaced fuel
Solar PV Building 2 2017/18 160,000 1,500Full Details
DevYes 110,000 2,200 110,000

www.keepscotlandbeautiful.org
Exercise 4b: updating existing project information
Take some time to have a look through the Project List tabs and then
add/amend the following projects. Note the impact of each.
1. Increase the total number of all LED lamps to be installed by 50%
2. Change food recycling from composting to AD
3. Instead of saving flights through train travel, teleconferencing will be
used instead. How do you reflect this in the tool?
4. The PV project has been abandoned.

www.keepscotlandbeautiful.org
Keeping the project register alive
Top Tips
1. Use filters (esp. Simple Payback and Carbon Cost Effectiveness)
2. Fill in User Notes at end of each row
3. Understand and always update the Project Status
4. Always update the Estimate of Confidence

www.keepscotlandbeautiful.org
Using the CFPR to complete your PBCCD report – Q3e, 3f, 3h
3e - Estimated total annual carbon savings from all projects implemented by the body in the
report year
Use the Project List & Project List (Renewables) tabs and filter for projects completed in the
reporting year by emission source e.g. for reporting year 2017/18, filter for complete projects
by grid electricity in commissioning year 2017/18
3f - Detail the top 10 carbon reduction projects to be carried out by the body in the report year
Use the Project List & Project List (Renewables) tabs and filter for projects completed in the
reporting year and chose the top 10
3h - Anticipated annual carbon savings from all projects implemented by the body in the year
ahead
Use the Project List & Project List (Renewables) tabs and filter for projects scheduled for the
following year by emission source e.g. for reporting year 2017/18, filter for scheduled projects
by grid electricity in commissioning year 2018/19

www.keepscotlandbeautiful.org
The Carbon Management Triangle – BAU
Carbon footprint
(current and historical)
Carbon Project
Register
Are we going to meet out
carbon reduction target?
Business as Usual
scenario

www.keepscotlandbeautiful.org
BAU – other factors that impact on your carbon footprint
Emission factors
Your organisation’s
carbon footprint
Weather e.g. degree days
Staff (or student) numbers
Service provisionEstate
changes
Intensity of use
www.keepscotlandbeautiful.org
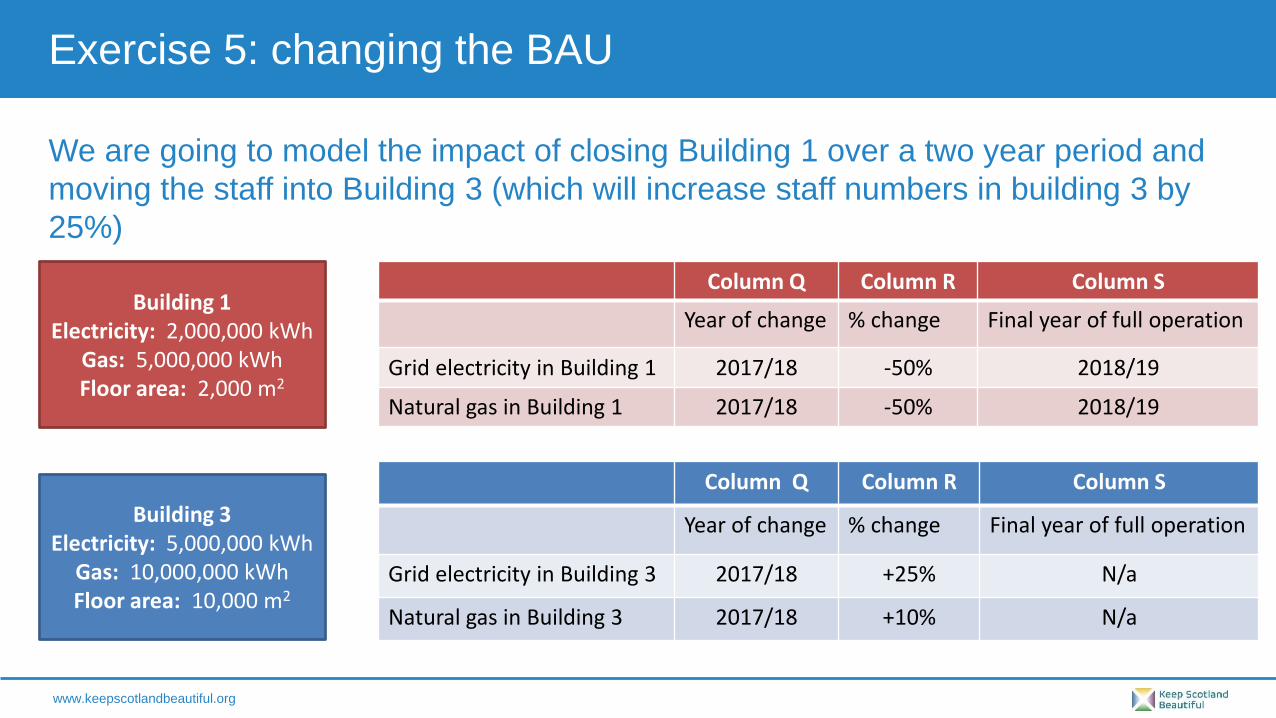
Exercise 5: changing the BAU
Building 1Electricity: 2,000,000 kWh
Gas: 5,000,000 kWhFloor area: 2,000 m2
Column Q Column R Column S
Year of change % change Final year of full operation
Grid electricity in Building 1 2017/18 -50% 2018/19
Natural gas in Building 1 2017/18 -50% 2018/19
We are going to model the impact of closing Building 1 over a two year period and
moving the staff into Building 3 (which will increase staff numbers in building 3 by
25%)
Building 3Electricity: 5,000,000 kWh
Gas: 10,000,000 kWhFloor area: 10,000 m2
Column Q Column R Column S
Year of change % change Final year of full operation
Grid electricity in Building 3 2017/18 +25% N/a
Natural gas in Building 3 2017/18 +10% N/a

www.keepscotlandbeautiful.org
Impact of BAU on future forecast – no change scenario
-
2,000
4,000
6,000
8,000
10,000
12,000
tCO2e BAU Carbon Footprints - split by source (tCO2e)
Transport Waste Stationary
The initial Business
as Usual scenario
shows that there is
no change in the
emissions over time
because all the
future changes
columns are set to
‘N/a’

www.keepscotlandbeautiful.org
-
2,000
4,000
6,000
8,000
10,000
12,000
tCO2eBAU Carbon Footprints - split by source (tCO2e)
Transport Waste Stationary
Impact of BAU on future forecast – closure of Building 1
The impact of
Building 1
closing is to
reduces carbon
footprint in the
future by nearly
20%

www.keepscotlandbeautiful.org
Impact of BAU on future forecast – moving staff to Building 3
The impact of
adding in the
movement of
staff to Building 3
pushes the
footprint back up
but it is still lower
than in the no
change scenario -
2,000
4,000
6,000
8,000
10,000
12,000
tCO2e BAU Carbon Footprints - split by source (tCO2e)
Transport Waste Stationary

www.keepscotlandbeautiful.org
Exercise 3b: is the organisation going to meet their target?
This graph
shows the impact
of BOTH the
carbon reduction
projects AND the
Business As
Usual Scenario
on the future
forecast

www.keepscotlandbeautiful.org
Using the CFPR to complete your PBCCD report – Q3g & 3i
3g - Estimated decrease or increase in the body’s emissions attributed to factors (not reported
anywhere else in this form) in the report year.
This is a chance to explain what has helped/hindered your organisation achieving its target in
the reporting year. For example, if your target translates to a reduction of 2,000 tCO2e and
you implemented 2,500 tCO2e project savings (as reported in Q3e in last year’s report) but
your footprint has only decreased by 1,000 tCO2e, you know that something has added 1,500
tCO2e to your footprint (or your project saving estimates were very far out).
3i - Estimated decrease or increase in the body’s emissions attributed to factors (not reported
elsewhere in this form) in the year ahead.
This is a chance to say what might cause you to miss your target next year. The easiest way
to do this is to run a BAU scenario for your top 10 buildings or emissions sources and see
what is the difference between the reporting year footprint and the next year’s footprint in the
BAU results. This will give you an approximate overall tCO2e increase or decrease to report.

www.keepscotlandbeautiful.org
Trouble shooting the CFPR tool
1. Make sure macros are enabled on your version of Excel
2. Read the ‘Read This First’ tab – IMPORTANT
3. Keep a saved version and manage your version control
4. Keep back up documentation (more notes than you think you
need!)
5. Use it regularly
6. Keep it simple
7. Take care when transposing over data from an old version of the
tool to the new one
8. For renewables emissions sources and projects, review the worked
example within the tool.
9. If you see ‘######’ within cells, the column width is too narrow.
Simply adjust the width
10.Contact SSN with any and all queries – we are here to help you!

www.keepscotlandbeautiful.org
Summary of training
Topics covered;
• How to set your boundary and calculate your carbon footprint
• Creating, maintaining and managing a project register
• Projecting forward your current year footprint to account for savings from projects (and other
fluctuations in emissions) to create a BAU scenario and using this to track against organisational
targets
• Using the CFPR tool to assist with your public bodies duties reporting
Hopefully now you feel more confident with;
• Your ability to calculate your annual carbon footprint
• Your ability collate and manage your carbon project list and forecast savings
• Your ability to document estate changes and other impacts on your footprint to create a BAU
forecast
• Completing your public bodies duties climate change report

www.keepscotlandbeautiful.org
Other available resources
Please refer to our website here for various
resources and other guidance on assisting
with your public bodies duties.
RES’s tool for measuring and monitoring raw materials and
waste can be downloaded from their website. This waste tracking
spreadsheet will help you to collate and analyse your
measurement data. It contains a template that can be edited to
suit your organisation
The Greenhouse Gas Protocol Corporate Standard provides
standards and guidance for bodies preparing a GHG emissions
inventory.
The guide Working 9 to 5 on Climate Change: An office
Guide has been produced by the World Resources Institute and
will be useful for those bodies who operate from a very small
estate (i.e. office based) and are new to Climate Change
reporting.
DEFRA’s Environmental reporting guidelines has been designed
to help bodies in complying with the greenhouse gas (GHG)
reporting regulations and other voluntary reporting requirements.
The guidance is largely transferable with the same principles that
will be useful when completing your climate change report.